Embed Size (px)
Citation preview
Canada Research Published by Raymond James Ltd.
Please read domestic and foreign disclosure/risk information beginning on page 27 and Analyst Certification on page 26. Raymond James Ltd. | 2100 – 925 West Georgia Street | Vancouver BC Canada V6C 3L2
Sleep Country Canada Holdings Inc. August 20, 2015 ZZZ-TSX Company Report - Initiation of Coverage Kenric S. Tyghe MBA | 416.777.7188 | [email protected]
Krisztina Katai (Associate) | 416.777.7060 | [email protected]
Consumer & Retail
(Mattress) Size Matters; (Massive) Sheet Margins
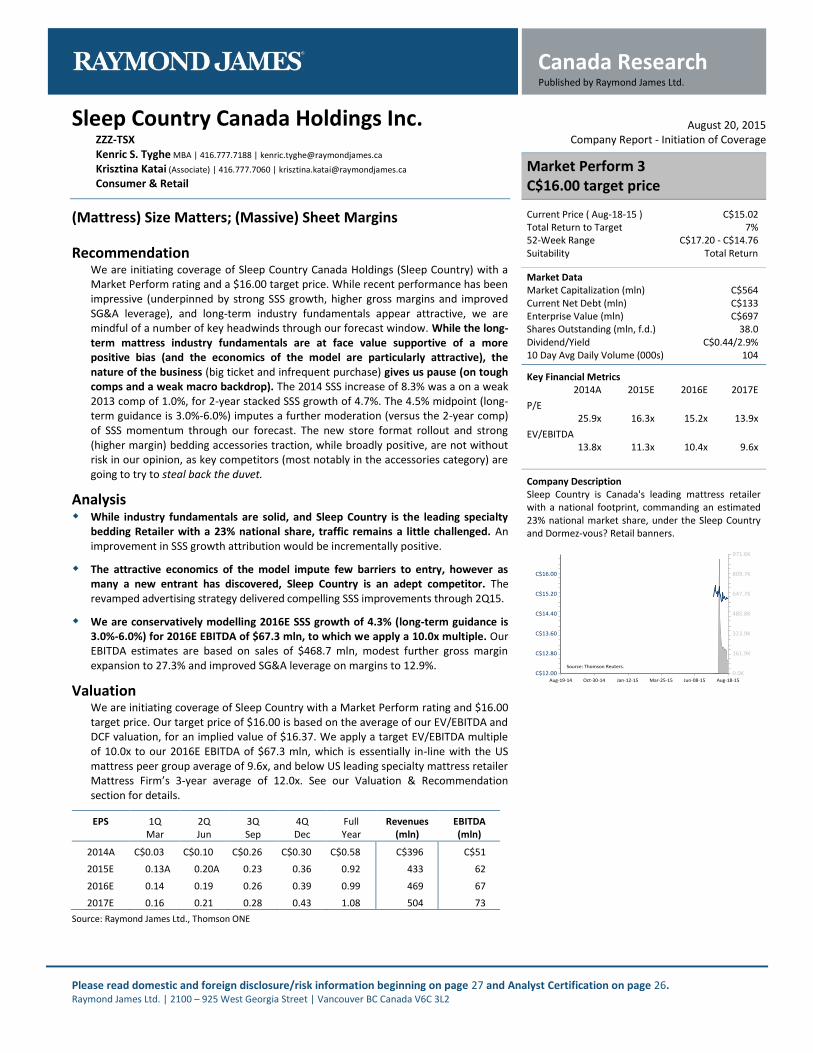
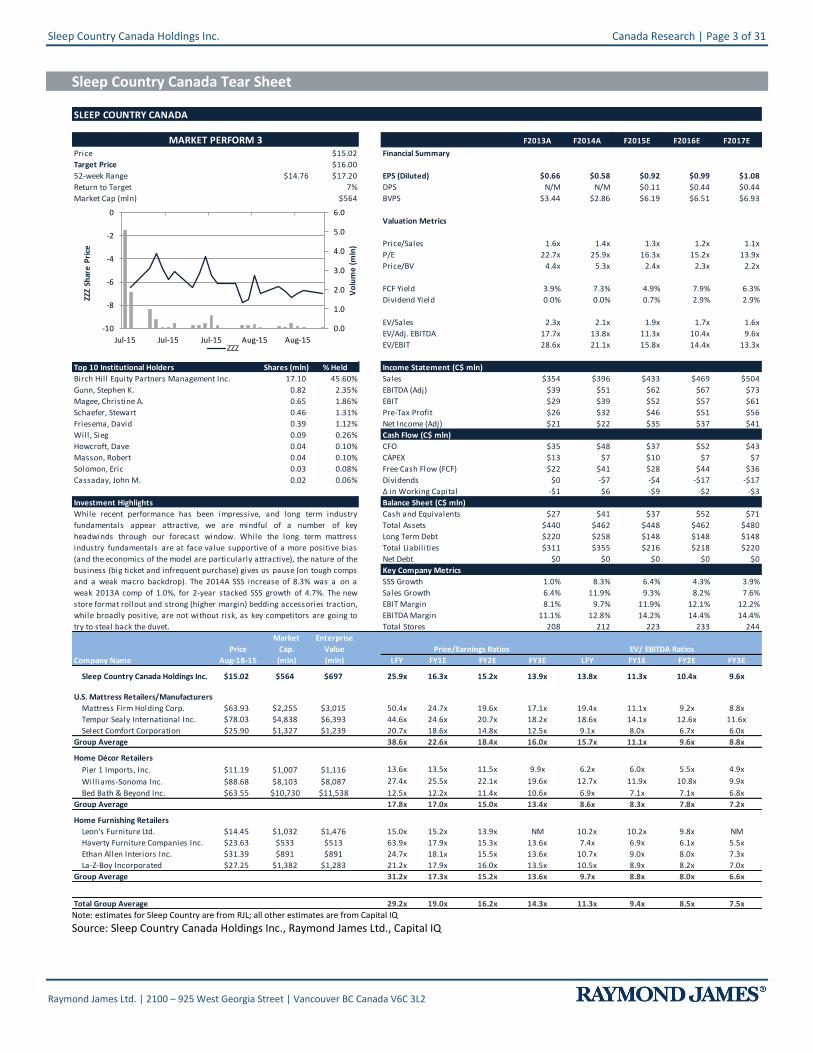
Recommendation We are initiating coverage of Sleep Country Canada Holdings (Sleep Country) with a Market Perform rating and a $16.00 target price. While recent performance has been impressive (underpinned by strong SSS growth, higher gross margins and improved SG&A leverage), and long-term industry fundamentals appear attractive, we are mindful of a number of key headwinds through our forecast window. While the long-term mattress industry fundamentals are at face value supportive of a more positive bias (and the economics of the model are particularly attractive), the nature of the business (big ticket and infrequent purchase) gives us pause (on tough comps and a weak macro backdrop). The 2014 SSS increase of 8.3% was a on a weak 2013 comp of 1.0%, for 2-year stacked SSS growth of 4.7%. The 4.5% midpoint (long-term guidance is 3.0%-6.0%) imputes a further moderation (versus the 2-year comp) of SSS momentum through our forecast. The new store format rollout and strong (higher margin) bedding accessories traction, while broadly positive, are not without risk in our opinion, as key competitors (most notably in the accessories category) are going to try to steal back the duvet.
Analysis While industry fundamentals are solid, and Sleep Country is the leading specialty
bedding Retailer with a 23% national share, traffic remains a little challenged. An improvement in SSS growth attribution would be incrementally positive.
The attractive economics of the model impute few barriers to entry, however as many a new entrant has discovered, Sleep Country is an adept competitor. The revamped advertising strategy delivered compelling SSS improvements through 2Q15.
We are conservatively modelling 2016E SSS growth of 4.3% (long-term guidance is 3.0%-6.0%) for 2016E EBITDA of $67.3 mln, to which we apply a 10.0x multiple. Our EBITDA estimates are based on sales of $468.7 mln, modest further gross margin expansion to 27.3% and improved SG&A leverage on margins to 12.9%.
Valuation
We are initiating coverage of Sleep Country with a Market Perform rating and $16.00 target price. Our target price of $16.00 is based on the average of our EV/EBITDA and DCF valuation, for an implied value of $16.37. We apply a target EV/EBITDA multiple of 10.0x to our 2016E EBITDA of $67.3 mln, which is essentially in-line with the US mattress peer group average of 9.6x, and below US leading specialty mattress retailer Mattress Firm’s 3-year average of 12.0x. See our Valuation & Recommendation section for details.
EPS 1Q 2Q 3Q 4Q Full Revenues EBITDA Mar Jun Sep Dec Year (mln) (mln)
2014A C$0.03 C$0.10 C$0.26 C$0.30 C$0.58 C$396 C$51
2015E 0.13A 0.20A 0.23 0.36 0.92 433 62
2016E 0.14 0.19 0.26 0.39 0.99 469 67
2017E 0.16 0.21 0.28 0.43 1.08 504 73
Source: Raymond James Ltd., Thomson ONE
Market Perform 3 C$16.00 target price
Current Price ( Aug-18-15 ) C$15.02 Total Return to Target 7% 52-Week Range C$17.20 - C$14.76 Suitability Total Return
Market Data Market Capitalization (mln) C$564 Current Net Debt (mln) C$133 Enterprise Value (mln) C$697 Shares Outstanding (mln, f.d.) 38.0 Dividend/Yield C$0.44/2.9% 10 Day Avg Daily Volume (000s) 104
Key Financial Metrics 2014A 2015E 2016E 2017E
P/E 25.9x 16.3x 15.2x 13.9x
EV/EBITDA 13.8x 11.3x 10.4x 9.6x
Company Description Sleep Country is Canada's leading mattress retailer with a national footprint, commanding an estimated 23% national market share, under the Sleep Country and Dormez-vous? Retail banners.
Canada Research | Page 2 of 31 Sleep Country Canada Holdings Inc.
Raymond James Ltd. | 2100 – 925 West Georgia Street | Vancouver BC Canada V6C 3L2
Table of Contents
Sleep Country Canada Tear Sheet........................................................................................................................ 3
Executive Summary ............................................................................................................................................. 4
Company Overview .............................................................................................................................................. 5
Investment Thesis ................................................................................................................................................ 7
Financial Analysis & Outlook................................................................................................................................ 16
Valuation & Recommendation ............................................................................................................................ 18
Appendix A: Financial Statements ....................................................................................................................... 20
Appendix B: Management & Board of Directors ................................................................................................. 23
Risks ..................................................................................................................................................................... 24
Sleep Country Canada Holdings Inc. Canada Research | Page 3 of 31
Raymond James Ltd. | 2100 – 925 West Georgia Street | Vancouver BC Canada V6C 3L2
Sleep Country Canada Tear Sheet
SLEEP COUNTRY CANADA TSX:ZZZ
F2013A F2014A F2015E F2016E F2017E
Price $15.02 Financial Summary 12/31/2011 12/31/2013 12/31/2014 12/31/2015 12/30/2016 12/30/2017
Target Price $16.00
52-week Range $14.76 $17.20 EPS (Diluted) $0.66 $0.58 $0.92 $0.99 $1.08
Return to Target 7% DPS N/M N/M $0.11 $0.44 $0.44
Market Cap (mln) $564 BVPS $3.44 $2.86 $6.19 $6.51 $6.93
Valuation Metrics
Price/Sales 1.6x 1.4x 1.3x 1.2x 1.1x
P/E 22.7x 25.9x 16.3x 15.2x 13.9x
Price/BV 4.4x 5.3x 2.4x 2.3x 2.2x
FCF Yield 3.9% 7.3% 4.9% 7.9% 6.3%
Dividend Yield 0.0% 0.0% 0.7% 2.9% 2.9%
EV/Sales 2.3x 2.1x 1.9x 1.7x 1.6x
EV/Adj. EBITDA 17.7x 13.8x 11.3x 10.4x 9.6x
EV/EBIT 28.6x 21.1x 15.8x 14.4x 13.3x
37.5 37.5 37.5 37.5 37.5
Top 10 Institutional Holders Shares (mln) % Held Income Statement (C$ mln)
Birch Hill Equity Partners Management Inc. 17.10 45.60% Sales $354 $396 $433 $469 $504
Gunn, Stephen K. 0.82 2.35% EBITDA (Adj) $39 $51 $62 $67 $73
Magee, Christine A. 0.65 1.86% EBIT $29 $39 $52 $57 $61
Schaefer, Stewart 0.46 1.31% Pre-Tax Profit $26 $32 $46 $51 $56
Friesema, David 0.39 1.12% Net Income (Adj) $21 $22 $35 $37 $41
Will, Sieg 0.09 0.26% Cash Flow (C$ mln)
Howcroft, Dave 0.04 0.10% CFO $35 $48 $37 $52 $43
Masson, Robert 0.04 0.10% CAPEX $13 $7 $10 $7 $7
Solomon, Eric 0.03 0.08% Free Cash Flow (FCF) $22 $41 $28 $44 $36
Cassaday, John M. 0.02 0.06% Dividends $0 -$7 -$4 -$17 -$17
Δ in Working Capital -$1 $6 -$9 -$2 -$3
Investment Highlights Balance Sheet (C$ mln)
Cash and Equivalents $27 $41 $37 $52 $71
Total Assets $440 $462 $448 $462 $480
Long Term Debt $220 $258 $148 $148 $148
Total Liabilities $311 $355 $216 $218 $220
Net Debt $0 $0 $0 $0 $0
Key Company Metrics
SSS Growth 1.0% 8.3% 6.4% 4.3% 3.9%
Sales Growth 6.4% 11.9% 9.3% 8.2% 7.6%
EBIT Margin 8.1% 9.7% 11.9% 12.1% 12.2%
EBITDA Margin 11.1% 12.8% 14.2% 14.4% 14.4%
Total Stores 208 212 223 233 244
Market
Price Cap.
Company Name Aug-18-15 (mln) LFY FY1E FY2E FY3E LFY FY1E FY2E FY3E1000 1001 1002 1003 1002 1000 1001 1002
Sleep Country Canada Holdings Inc. $15.02 $564 $697 TSX:ZZZ 25.9x 16.3x 15.2x 13.9x 13.8x 11.3x 10.4x 9.6x
U.S. Mattress Retailers/Manufacturers
Mattress Firm Holding Corp. $63.93 $2,255 $3,015 MFRM 50.4x 24.7x 19.6x 17.1x 19.4x 11.1x 9.2x 8.8x
Tempur Sealy International Inc. $78.03 $4,838 $6,393 TPX 44.6x 24.6x 20.7x 18.2x 18.6x 14.1x 12.6x 11.6x
Select Comfort Corporation $25.90 $1,327 $1,239 SCSS 20.7x 18.6x 14.8x 12.5x 9.1x 8.0x 6.7x 6.0x
Group Average 38.6x 22.6x 18.4x 16.0x 15.7x 11.1x 9.6x 8.8x
Home Décor Retailers
Pier 1 Imports, Inc. $11.19 $1,007 $1,116 PIR 13.6x 13.5x 11.5x 9.9x 6.2x 6.0x 5.5x 4.9x
Williams-Sonoma Inc. $88.68 $8,103 $8,087 WSM 27.4x 25.5x 22.1x 19.6x 12.7x 11.9x 10.8x 9.9x
Bed Bath & Beyond Inc. $63.55 $10,730 $11,538 BBBY 12.5x 12.2x 11.4x 10.6x 6.9x 7.1x 7.1x 6.8x
Group Average 17.8x 17.0x 15.0x 13.4x 8.6x 8.3x 7.8x 7.2x
Home Furnishing Retailers
Leon's Furniture Ltd. $14.45 $1,032 $1,476 TSX: LNF 15.0x 15.2x 13.9x NM 10.2x 10.2x 9.8x NM
Haverty Furniture Companies Inc. $23.63 $533 $513 HVT 63.9x 17.9x 15.3x 13.6x 7.4x 6.9x 6.1x 5.5x
Ethan Allen Interiors Inc. $31.39 $891 $891 ETH 24.7x 18.1x 15.5x 13.6x 10.7x 9.0x 8.0x 7.3x
La-Z-Boy Incorporated $27.25 $1,382 $1,283 LZB 21.2x 17.9x 16.0x 13.5x 10.5x 8.9x 8.2x 7.0x
Group Average 31.2x 17.3x 15.2x 13.6x 9.7x 8.8x 8.0x 6.6x
Total Group Average 29.2x 19.0x 16.2x 14.3x 11.3x 9.4x 8.5x 7.5x
Price/Earnings Ratios EV/ EBITDA Ratios
MARKET PERFORM 3
Enterprise
Value
(mln)
While recent performance has been impressive, and long term industry
fundamentals appear attractive, we are mindful of a number of key
headwinds through our forecast window. While the long term mattress
industry fundamentals are at face value supportive of a more positive bias
(and the economics of the model are particularly attractive), the nature of the
business (big ticket and infrequent purchase) gives us pause (on tough comps
and a weak macro backdrop). The 2014A SSS increase of 8.3% was a on a
weak 2013A comp of 1.0%, for 2-year stacked SSS growth of 4.7%. The new
store format rollout and strong (higher margin) bedding accessories traction,
while broadly positive, are not without risk, as key competitors are going to
try to steal back the duvet.
0.0
1.0
2.0
3.0
4.0
5.0
6.0
-10
-8
-6
-4
-2
0
Jul-15 Jul-15 Jul-15 Aug-15 Aug-15
Vo
lum
e (
mln
)
ZZZ
Shar
e P
rice
ZZZ
Note: estimates for Sleep Country are from RJL; all other estimates are from Capital IQ
Source: Sleep Country Canada Holdings Inc., Raymond James Ltd., Capital IQ

Canada Research | Page 4 of 31 Sleep Country Canada Holdings Inc.
Raymond James Ltd. | 2100 – 925 West Georgia Street | Vancouver BC Canada V6C 3L2
Executive Summary
Mattress Retailing’s Attractive Economics
The essentially blind mattress purchase affords retailers both relatively high product gross margins and conversion (shopper to buyer conversion is approximately 59% at Sleep Country). In addition to the attractive gross margins, the just in time relationship with suppliers supports a negative working capital model, which helps fund growth. The reality is that the combination of the simplicity of the business, the ease with which the model can be replicated, and the benefit of the working capital of the model impute few barriers to entry (although size does matter in terms of advertising support and volume rebates from suppliers). However, while tickets to the game are cheap and plentiful, the incumbents are pretty adept players. As such, while the majors on balance do a good job of defending share, they have struggled to increase share (other than through consolidation). In terms of market concentration, the top 3 retailers in Canada command an approximate 55% market share (Sleep Country is the largest with an estimated 23% national market share). In comparison, the top 3 retailers in the US command a 33% share (Mattress Firm is the largest with an estimated 17%).
Momentum to Moderate
The strong (relative to management’s 5-7 year guidance of 3.0%-6.0%) 2014 performance, with SSS growth of 8.3%, is unlikely to see a repeat anytime soon, in our view. Sleep Country’s 2-year stacked SSS growth is 4.7% (1.7% on a stacked 3-year basis). While our 2015 estimates are based on SSS growth of 6.4% (above long-term guidance), our respective 2016 and 2017 estimates of 4.3% and 3.9% are both more consistent with the 2-year stacked performance (and at the lower end of management’s guidance). We believe that our conservative SSS estimates reflect the nature (infrequent) and cost (big ticket) of bedding purchases. Mattress purchases are impacted by the macro backdrop, as consumers can (if necessary) defer the purchase of a replacement mattress (which accounts for approximately 75% of industry volume, with life cycle events largely representing the balance of the market). We are also mindful that competitors will respond to Sleep Country’s revamped advertising strategy (and increased advertising spend), potentially increasing competitive intensity. While the increased advertising spend in market could increase competitive intensity, a mitigating factor is the reality that a number of key competitors have either curtailed (or scaled back) their planned bedding retail expansions.
Macro and Industry Growth
The Canadian market, despite its relative size, concentration and competitive intensity at Retail, exhibits very similar characteristics to the US and, as such (given the granularity of the available US versus Canadian data), we have largely referenced US data for the purposes of this report. While bedding industry units and sales have a strong positive correlation with a number of key economic variables, specifically, GDP, Consumer Confidence, and Housing, the replacement cycle nature of bedding purchases has made the industry generally resistant to deep or protracted declines.
According to the International Sleep Products Association (ISPA), during the past 20 years, bedding dollar sales have only decreased (on a year-over-year basis) in three years (2001, 2008, and 2009), though unit volumes have decreased seven times. In addition to its steady long-term dollar sales growth (with 20-year and 10-year US CAGRs of 6.0% and 4.3%, respectively), mattress (or bedding) retail (as detailed above) boasts attractive economics due to relatively high gross margins, lean inventory and meaningful support from manufacturers (in the form of both volume based rebates and advertising dollars). Average Unit Selling Price (AUSP) dynamics are of particular reference, with increases driven by a number of factors including larger mattress sizes (neither houses nor the inhabitants have been getting any smaller), changing consumer preferences (pillow tops and higher profile beds), and subsequent to the great recession (and the bifurcation of consumer) market share gains by premium-priced specialty sleep (non-innerspring) beds.
Mattress Store Density
Sleep Country’s sales per average store in 2014 were $1.9 mln (versus $2.0 mln in 2009). While sales per store have decreased, despite Sleep Country focusing its store openings on in-fill markets, its store density (162,000 people per store) is relatively low. Management is targeting growth in existing, satellite and new markets. The target growth of 50 to 70 net new stores over the next 5-7 years appears reasonable (perhaps even conservative) against the above backdrop, as it imputes exit density of 140,000 per store (versus US density of 84,000) across all markets. In a mature Retail landscape, the new store growth opportunity is attractive.
Sleep Country Canada Holdings Inc. Canada Research | Page 5 of 31
Raymond James Ltd. | 2100 – 925 West Georgia Street | Vancouver BC Canada V6C 3L2
Company Overview
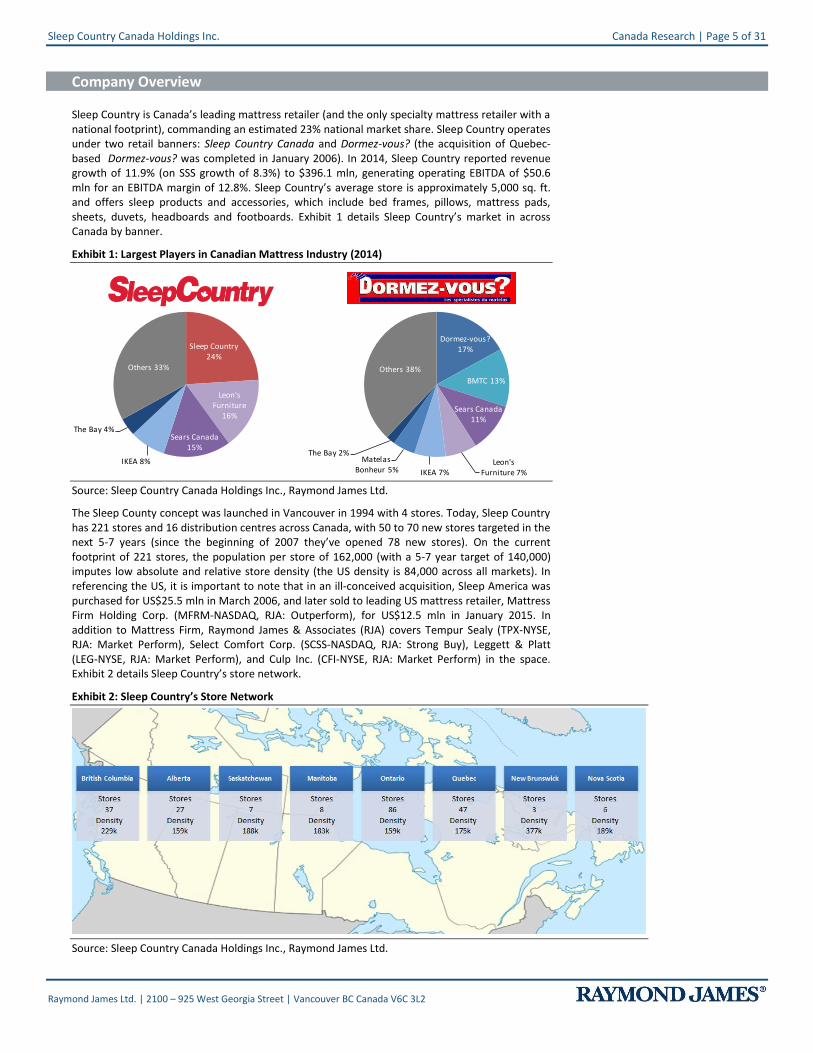
Sleep Country is Canada’s leading mattress retailer (and the only specialty mattress retailer with a national footprint), commanding an estimated 23% national market share. Sleep Country operates under two retail banners: Sleep Country Canada and Dormez-vous? (the acquisition of Quebec-based Dormez-vous? was completed in January 2006). In 2014, Sleep Country reported revenue growth of 11.9% (on SSS growth of 8.3%) to $396.1 mln, generating operating EBITDA of $50.6 mln for an EBITDA margin of 12.8%. Sleep Country’s average store is approximately 5,000 sq. ft. and offers sleep products and accessories, which include bed frames, pillows, mattress pads, sheets, duvets, headboards and footboards. Exhibit 1 details Sleep Country’s market in across Canada by banner.
Exhibit 1: Largest Players in Canadian Mattress Industry (2014)
Sleep Country 24%
Leon's Furniture
16%
Sears Canada 15%
IKEA 8%
The Bay 4%
Others 33%
Dormez-vous? 17%
BMTC 13%
Sears Canada 11%
Leon's Furniture 7%IKEA 7%
Matelas Bonheur 5%
The Bay 2%
Others 38%
Source: Sleep Country Canada Holdings Inc., Raymond James Ltd.
The Sleep County concept was launched in Vancouver in 1994 with 4 stores. Today, Sleep Country has 221 stores and 16 distribution centres across Canada, with 50 to 70 new stores targeted in the next 5-7 years (since the beginning of 2007 they’ve opened 78 new stores). On the current footprint of 221 stores, the population per store of 162,000 (with a 5-7 year target of 140,000) imputes low absolute and relative store density (the US density is 84,000 across all markets). In referencing the US, it is important to note that in an ill-conceived acquisition, Sleep America was purchased for US$25.5 mln in March 2006, and later sold to leading US mattress retailer, Mattress Firm Holding Corp. (MFRM-NASDAQ, RJA: Outperform), for US$12.5 mln in January 2015. In addition to Mattress Firm, Raymond James & Associates (RJA) covers Tempur Sealy (TPX-NYSE, RJA: Market Perform), Select Comfort Corp. (SCSS-NASDAQ, RJA: Strong Buy), Leggett & Platt (LEG-NYSE, RJA: Market Perform), and Culp Inc. (CFI-NYSE, RJA: Market Perform) in the space. Exhibit 2 details Sleep Country’s store network.
Exhibit 2: Sleep Country’s Store Network
Source: Sleep Country Canada Holdings Inc., Raymond James Ltd.
Canada Research | Page 6 of 31 Sleep Country Canada Holdings Inc.
Raymond James Ltd. | 2100 – 925 West Georgia Street | Vancouver BC Canada V6C 3L2
Sleep Country was listed on the TSX (as an income fund) between 2003 and 2008, when it was taken private at $22.00 per unit (a 37.1% premium to the trading price on August 13, 2008) by a group led by Birch Hill Equity Partners for $356.0 mln (which equated to a 8.2x EBITDA multiple). On July 16, 2015, Birch Hill Equity Partners and the co-investors again brought Sleep Country public through an IPO of 47% of the outstanding shares at $17.00 per share, for total gross proceeds of $300.0 mln (and a 11.8x EBITDA multiple). In connection with the offering, Sleep Country Canada Holdings Inc. also completed the acquisition of Sleep Country Canada Inc. and certain of its affiliates for an aggregate purchase price of $461.7 mln. The net proceeds of the offering were used by the company to satisfy a portion of the purchase price (the balance was satisfied by the issuance of shares and acquisition notes to certain of the shareholders of the acquired entities).
Mattresses represented approximately 80% of 2014 revenues, and bedding accessories, which include bedframes, pillows, mattress pad sheets, duvets, and headboards, accounted for 18%. Bedding accessories revenue has more than doubled in the last 8-years, with Sleep Country generating in excess of $73.0 mln in 2014, in what the company believes to be approximately an $830 mln market in Canada. While Sleep Country’s market share is essentially unchanged from when it was taken private in 2008 (an issue which we explore in the Investment Thesis section), the share gains in accessories (which boast a higher gross margin) are an incremental positive.
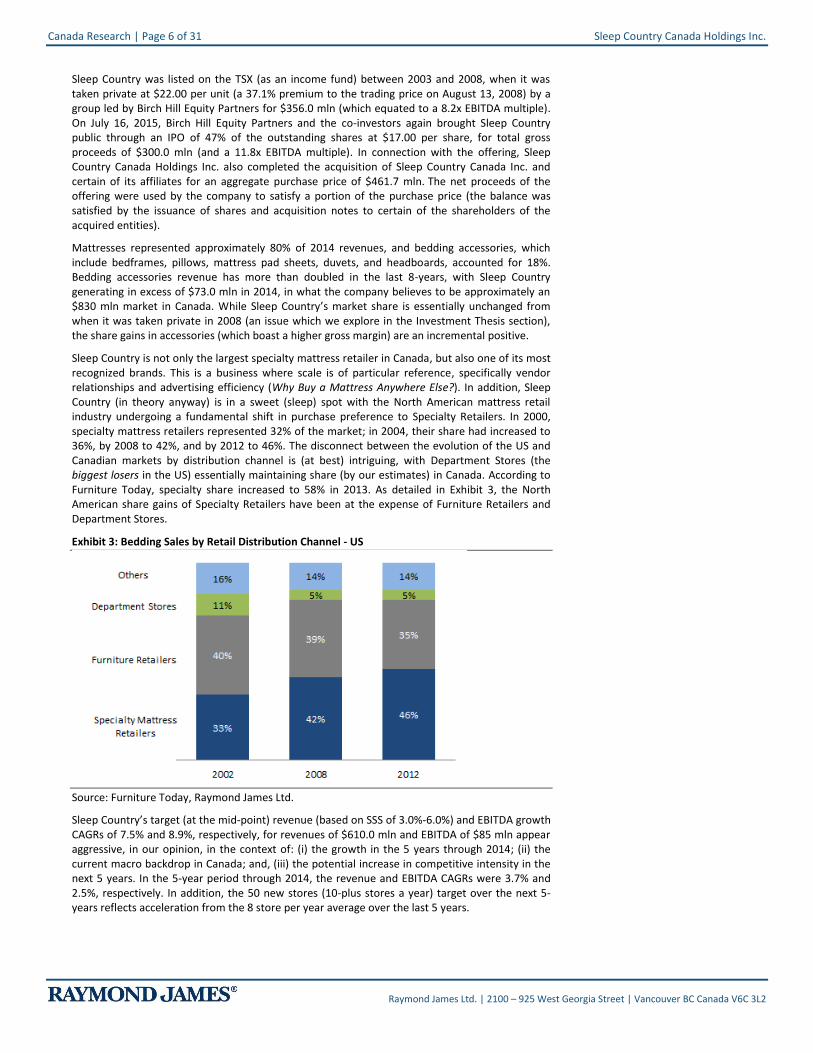
Sleep Country is not only the largest specialty mattress retailer in Canada, but also one of its most recognized brands. This is a business where scale is of particular reference, specifically vendor relationships and advertising efficiency (Why Buy a Mattress Anywhere Else?). In addition, Sleep Country (in theory anyway) is in a sweet (sleep) spot with the North American mattress retail industry undergoing a fundamental shift in purchase preference to Specialty Retailers. In 2000, specialty mattress retailers represented 32% of the market; in 2004, their share had increased to 36%, by 2008 to 42%, and by 2012 to 46%. The disconnect between the evolution of the US and Canadian markets by distribution channel is (at best) intriguing, with Department Stores (the biggest losers in the US) essentially maintaining share (by our estimates) in Canada. According to Furniture Today, specialty share increased to 58% in 2013. As detailed in Exhibit 3, the North American share gains of Specialty Retailers have been at the expense of Furniture Retailers and Department Stores.
Exhibit 3: Bedding Sales by Retail Distribution Channel - US
Source: Furniture Today, Raymond James Ltd.
Sleep Country’s target (at the mid-point) revenue (based on SSS of 3.0%-6.0%) and EBITDA growth CAGRs of 7.5% and 8.9%, respectively, for revenues of $610.0 mln and EBITDA of $85 mln appear aggressive, in our opinion, in the context of: (i) the growth in the 5 years through 2014; (ii) the current macro backdrop in Canada; and, (iii) the potential increase in competitive intensity in the next 5 years. In the 5-year period through 2014, the revenue and EBITDA CAGRs were 3.7% and 2.5%, respectively. In addition, the 50 new stores (10-plus stores a year) target over the next 5-years reflects acceleration from the 8 store per year average over the last 5 years.
Sleep Country Canada Holdings Inc. Canada Research | Page 7 of 31
Raymond James Ltd. | 2100 – 925 West Georgia Street | Vancouver BC Canada V6C 3L2
Investment Thesis
Sizing and Economic Sensitivity
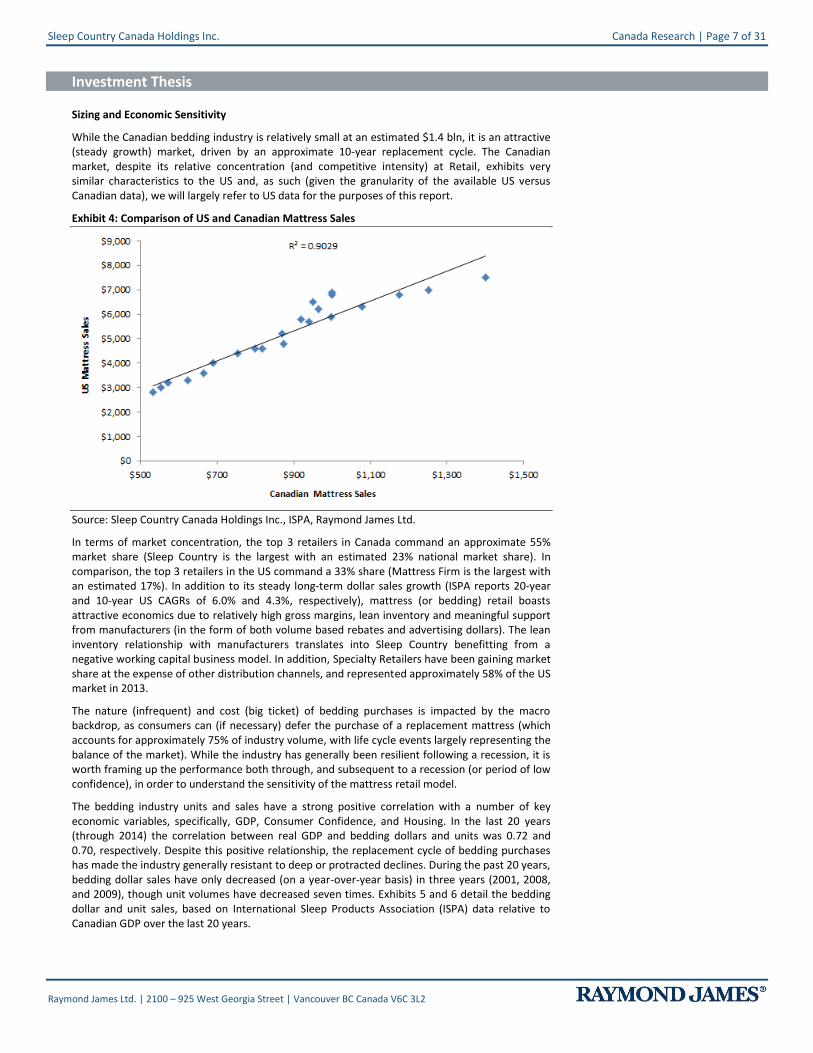
While the Canadian bedding industry is relatively small at an estimated $1.4 bln, it is an attractive (steady growth) market, driven by an approximate 10-year replacement cycle. The Canadian market, despite its relative concentration (and competitive intensity) at Retail, exhibits very similar characteristics to the US and, as such (given the granularity of the available US versus Canadian data), we will largely refer to US data for the purposes of this report.
Exhibit 4: Comparison of US and Canadian Mattress Sales
Source: Sleep Country Canada Holdings Inc., ISPA, Raymond James Ltd.
In terms of market concentration, the top 3 retailers in Canada command an approximate 55% market share (Sleep Country is the largest with an estimated 23% national market share). In comparison, the top 3 retailers in the US command a 33% share (Mattress Firm is the largest with an estimated 17%). In addition to its steady long-term dollar sales growth (ISPA reports 20-year and 10-year US CAGRs of 6.0% and 4.3%, respectively), mattress (or bedding) retail boasts attractive economics due to relatively high gross margins, lean inventory and meaningful support from manufacturers (in the form of both volume based rebates and advertising dollars). The lean inventory relationship with manufacturers translates into Sleep Country benefitting from a negative working capital business model. In addition, Specialty Retailers have been gaining market share at the expense of other distribution channels, and represented approximately 58% of the US market in 2013.
The nature (infrequent) and cost (big ticket) of bedding purchases is impacted by the macro backdrop, as consumers can (if necessary) defer the purchase of a replacement mattress (which accounts for approximately 75% of industry volume, with life cycle events largely representing the balance of the market). While the industry has generally been resilient following a recession, it is worth framing up the performance both through, and subsequent to a recession (or period of low confidence), in order to understand the sensitivity of the mattress retail model.
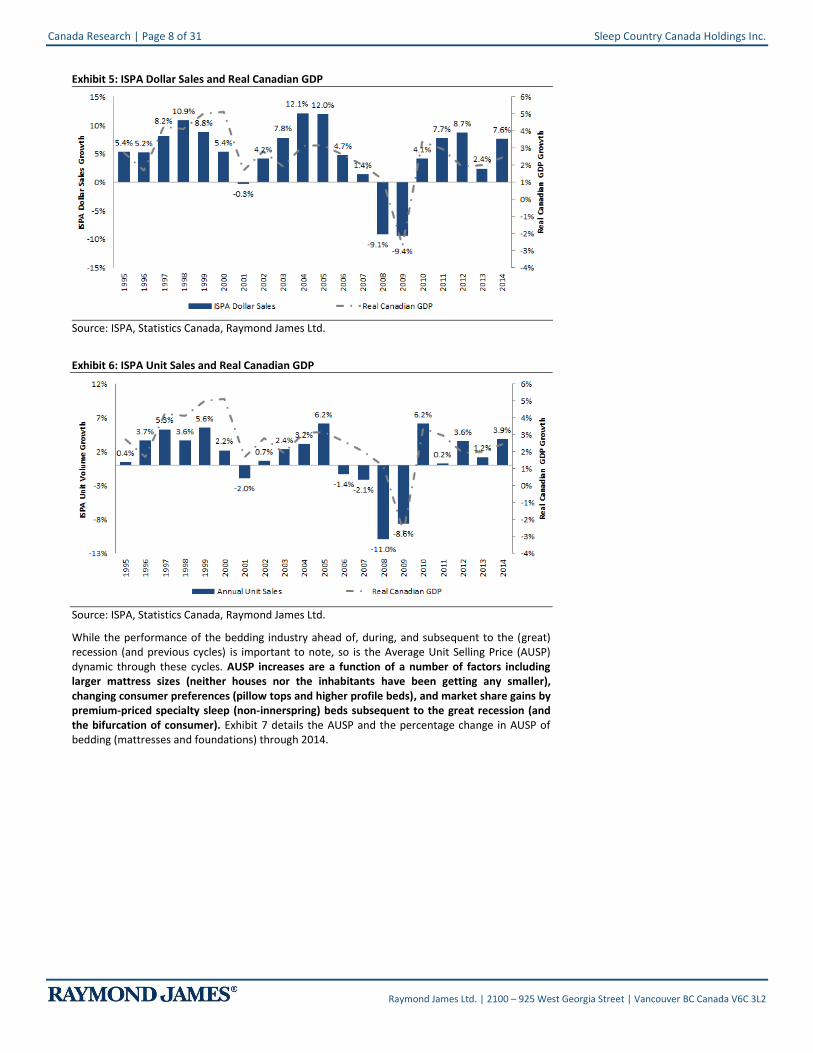
The bedding industry units and sales have a strong positive correlation with a number of key economic variables, specifically, GDP, Consumer Confidence, and Housing. In the last 20 years (through 2014) the correlation between real GDP and bedding dollars and units was 0.72 and 0.70, respectively. Despite this positive relationship, the replacement cycle of bedding purchases has made the industry generally resistant to deep or protracted declines. During the past 20 years, bedding dollar sales have only decreased (on a year-over-year basis) in three years (2001, 2008, and 2009), though unit volumes have decreased seven times. Exhibits 5 and 6 detail the bedding dollar and unit sales, based on International Sleep Products Association (ISPA) data relative to Canadian GDP over the last 20 years.
Canada Research | Page 8 of 31 Sleep Country Canada Holdings Inc.
Raymond James Ltd. | 2100 – 925 West Georgia Street | Vancouver BC Canada V6C 3L2
Exhibit 5: ISPA Dollar Sales and Real Canadian GDP
Source: ISPA, Statistics Canada, Raymond James Ltd.
Exhibit 6: ISPA Unit Sales and Real Canadian GDP
Source: ISPA, Statistics Canada, Raymond James Ltd.
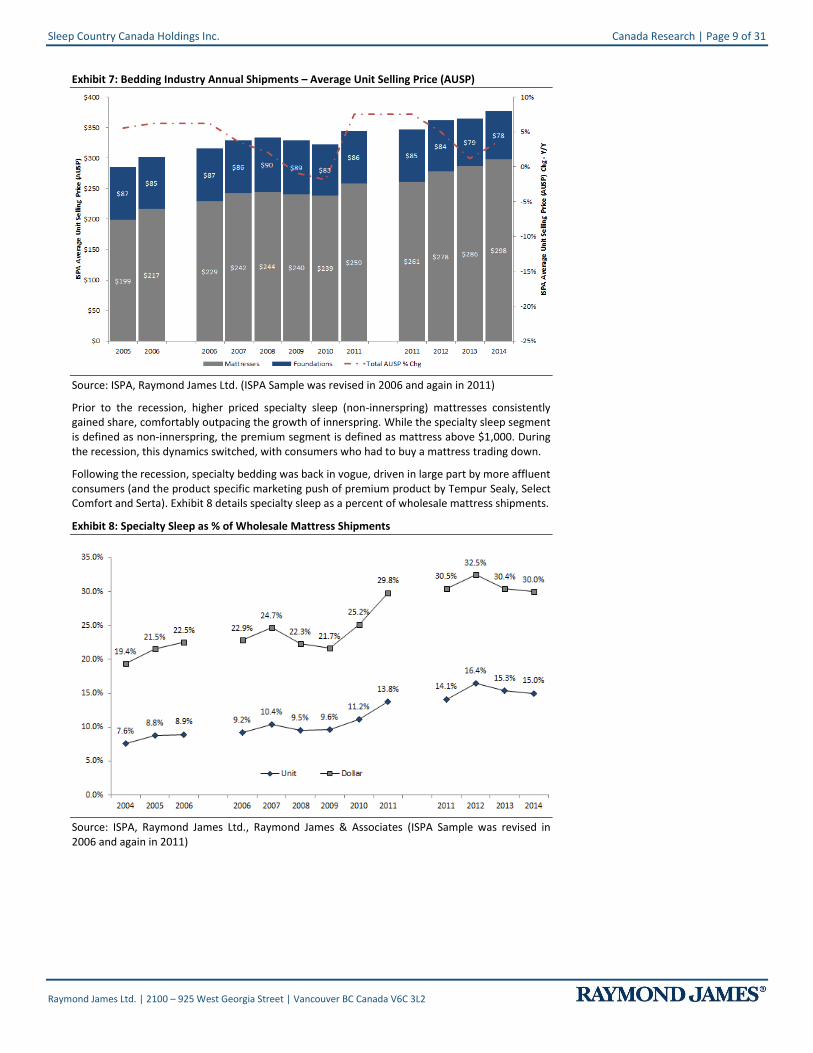
While the performance of the bedding industry ahead of, during, and subsequent to the (great) recession (and previous cycles) is important to note, so is the Average Unit Selling Price (AUSP) dynamic through these cycles. AUSP increases are a function of a number of factors including larger mattress sizes (neither houses nor the inhabitants have been getting any smaller), changing consumer preferences (pillow tops and higher profile beds), and market share gains by premium-priced specialty sleep (non-innerspring) beds subsequent to the great recession (and the bifurcation of consumer). Exhibit 7 details the AUSP and the percentage change in AUSP of bedding (mattresses and foundations) through 2014.
Sleep Country Canada Holdings Inc. Canada Research | Page 9 of 31
Raymond James Ltd. | 2100 – 925 West Georgia Street | Vancouver BC Canada V6C 3L2
Exhibit 7: Bedding Industry Annual Shipments – Average Unit Selling Price (AUSP)
Source: ISPA, Raymond James Ltd. (ISPA Sample was revised in 2006 and again in 2011)
Prior to the recession, higher priced specialty sleep (non-innerspring) mattresses consistently gained share, comfortably outpacing the growth of innerspring. While the specialty sleep segment is defined as non-innerspring, the premium segment is defined as mattress above $1,000. During the recession, this dynamics switched, with consumers who had to buy a mattress trading down.
Following the recession, specialty bedding was back in vogue, driven in large part by more affluent consumers (and the product specific marketing push of premium product by Tempur Sealy, Select Comfort and Serta). Exhibit 8 details specialty sleep as a percent of wholesale mattress shipments.
Exhibit 8: Specialty Sleep as % of Wholesale Mattress Shipments
Source: ISPA, Raymond James Ltd., Raymond James & Associates (ISPA Sample was revised in 2006 and again in 2011)
Canada Research | Page 10 of 31 Sleep Country Canada Holdings Inc.
Raymond James Ltd. | 2100 – 925 West Georgia Street | Vancouver BC Canada V6C 3L2
Competitive Intensity and Economics of the Mattress Retail Model
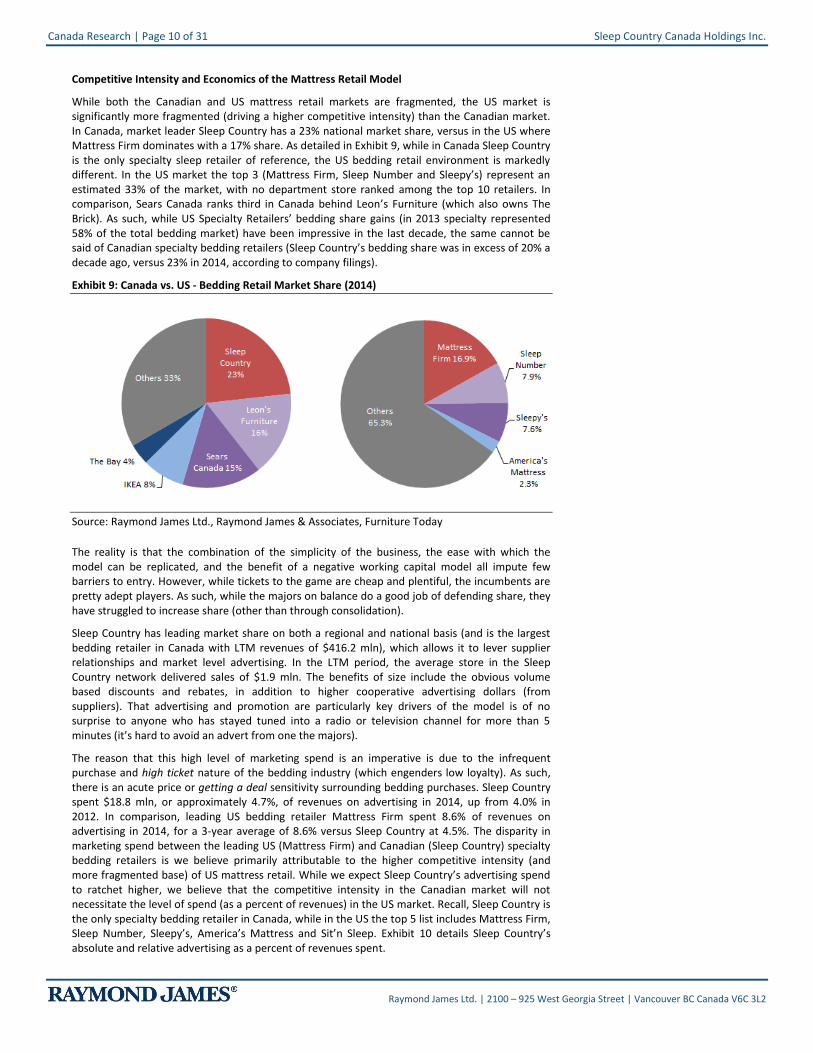
While both the Canadian and US mattress retail markets are fragmented, the US market is significantly more fragmented (driving a higher competitive intensity) than the Canadian market. In Canada, market leader Sleep Country has a 23% national market share, versus in the US where Mattress Firm dominates with a 17% share. As detailed in Exhibit 9, while in Canada Sleep Country is the only specialty sleep retailer of reference, the US bedding retail environment is markedly different. In the US market the top 3 (Mattress Firm, Sleep Number and Sleepy’s) represent an estimated 33% of the market, with no department store ranked among the top 10 retailers. In comparison, Sears Canada ranks third in Canada behind Leon’s Furniture (which also owns The Brick). As such, while US Specialty Retailers’ bedding share gains (in 2013 specialty represented 58% of the total bedding market) have been impressive in the last decade, the same cannot be said of Canadian specialty bedding retailers (Sleep Country’s bedding share was in excess of 20% a decade ago, versus 23% in 2014, according to company filings).
Exhibit 9: Canada vs. US - Bedding Retail Market Share (2014)
Source: Raymond James Ltd., Raymond James & Associates, Furniture Today
The reality is that the combination of the simplicity of the business, the ease with which the model can be replicated, and the benefit of a negative working capital model all impute few barriers to entry. However, while tickets to the game are cheap and plentiful, the incumbents are pretty adept players. As such, while the majors on balance do a good job of defending share, they have struggled to increase share (other than through consolidation).
Sleep Country has leading market share on both a regional and national basis (and is the largest bedding retailer in Canada with LTM revenues of $416.2 mln), which allows it to lever supplier relationships and market level advertising. In the LTM period, the average store in the Sleep Country network delivered sales of $1.9 mln. The benefits of size include the obvious volume based discounts and rebates, in addition to higher cooperative advertising dollars (from suppliers). That advertising and promotion are particularly key drivers of the model is of no surprise to anyone who has stayed tuned into a radio or television channel for more than 5 minutes (it’s hard to avoid an advert from one the majors).
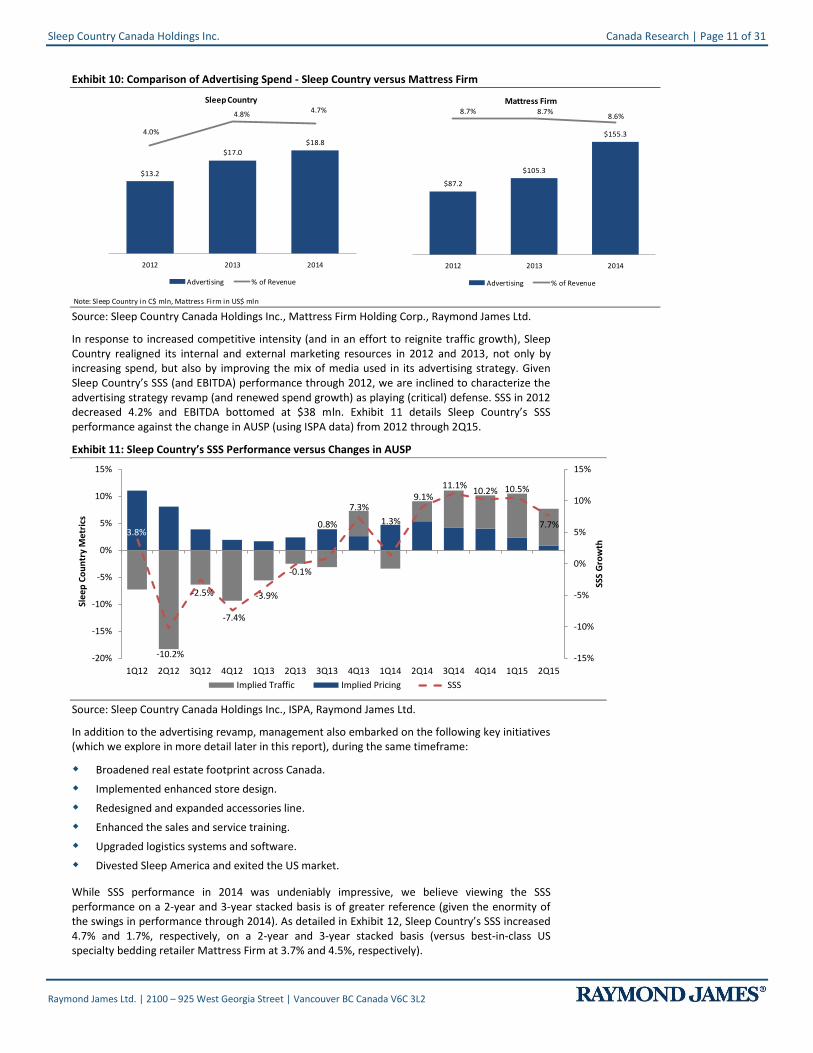
The reason that this high level of marketing spend is an imperative is due to the infrequent purchase and high ticket nature of the bedding industry (which engenders low loyalty). As such, there is an acute price or getting a deal sensitivity surrounding bedding purchases. Sleep Country spent $18.8 mln, or approximately 4.7%, of revenues on advertising in 2014, up from 4.0% in 2012. In comparison, leading US bedding retailer Mattress Firm spent 8.6% of revenues on advertising in 2014, for a 3-year average of 8.6% versus Sleep Country at 4.5%. The disparity in marketing spend between the leading US (Mattress Firm) and Canadian (Sleep Country) specialty bedding retailers is we believe primarily attributable to the higher competitive intensity (and more fragmented base) of US mattress retail. While we expect Sleep Country’s advertising spend to ratchet higher, we believe that the competitive intensity in the Canadian market will not necessitate the level of spend (as a percent of revenues) in the US market. Recall, Sleep Country is the only specialty bedding retailer in Canada, while in the US the top 5 list includes Mattress Firm, Sleep Number, Sleepy’s, America’s Mattress and Sit’n Sleep. Exhibit 10 details Sleep Country’s absolute and relative advertising as a percent of revenues spent.
Sleep Country Canada Holdings Inc. Canada Research | Page 11 of 31
Raymond James Ltd. | 2100 – 925 West Georgia Street | Vancouver BC Canada V6C 3L2
Exhibit 10: Comparison of Advertising Spend - Sleep Country versus Mattress Firm
Note: Sleep Country in C$ mln, Mattress Firm in US$ mln
$13.2
$17.0
$18.8
4.0%
4.8%4.7%
0.0%
1.0%
2.0%
3.0%
4.0%
5.0%
$0.0
$5.0
$10.0
$15.0
$20.0
$25.0
2012 2013 2014
Sleep Country
Advertising % of Revenue
$87.2
$105.3
$155.3
8.7% 8.7%8.6%
7.0%
7.2%
7.4%
7.6%
7.8%
8.0%
8.2%
8.4%
8.6%
-$10.0
$10.0
$30.0
$50.0
$70.0
$90.0
$110.0
$130.0
$150.0
$170.0
$190.0
2012 2013 2014
Mattress Firm
Advertising % of Revenue
Source: Sleep Country Canada Holdings Inc., Mattress Firm Holding Corp., Raymond James Ltd.
In response to increased competitive intensity (and in an effort to reignite traffic growth), Sleep Country realigned its internal and external marketing resources in 2012 and 2013, not only by increasing spend, but also by improving the mix of media used in its advertising strategy. Given Sleep Country’s SSS (and EBITDA) performance through 2012, we are inclined to characterize the advertising strategy revamp (and renewed spend growth) as playing (critical) defense. SSS in 2012 decreased 4.2% and EBITDA bottomed at $38 mln. Exhibit 11 details Sleep Country’s SSS performance against the change in AUSP (using ISPA data) from 2012 through 2Q15.
Exhibit 11: Sleep Country’s SSS Performance versus Changes in AUSP
3.8%
-10.2%
-2.5%
-7.4%
-3.9%
-0.1%
0.8%
7.3%
1.3%
9.1%11.1%
10.2% 10.5%
7.7%
-15%
-10%
-5%
0%
5%
10%
15%
-20%
-15%
-10%
-5%
0%
5%
10%
15%
1Q12 2Q12 3Q12 4Q12 1Q13 2Q13 3Q13 4Q13 1Q14 2Q14 3Q14 4Q14 1Q15 2Q15
SSS
Gro
wth
Sle
ep
Co
un
try
Me
tric
s
Implied Traffic Implied Pricing SSS
Source: Sleep Country Canada Holdings Inc., ISPA, Raymond James Ltd.
In addition to the advertising revamp, management also embarked on the following key initiatives (which we explore in more detail later in this report), during the same timeframe:
Broadened real estate footprint across Canada.
Implemented enhanced store design.
Redesigned and expanded accessories line.
Enhanced the sales and service training.
Upgraded logistics systems and software.
Divested Sleep America and exited the US market.
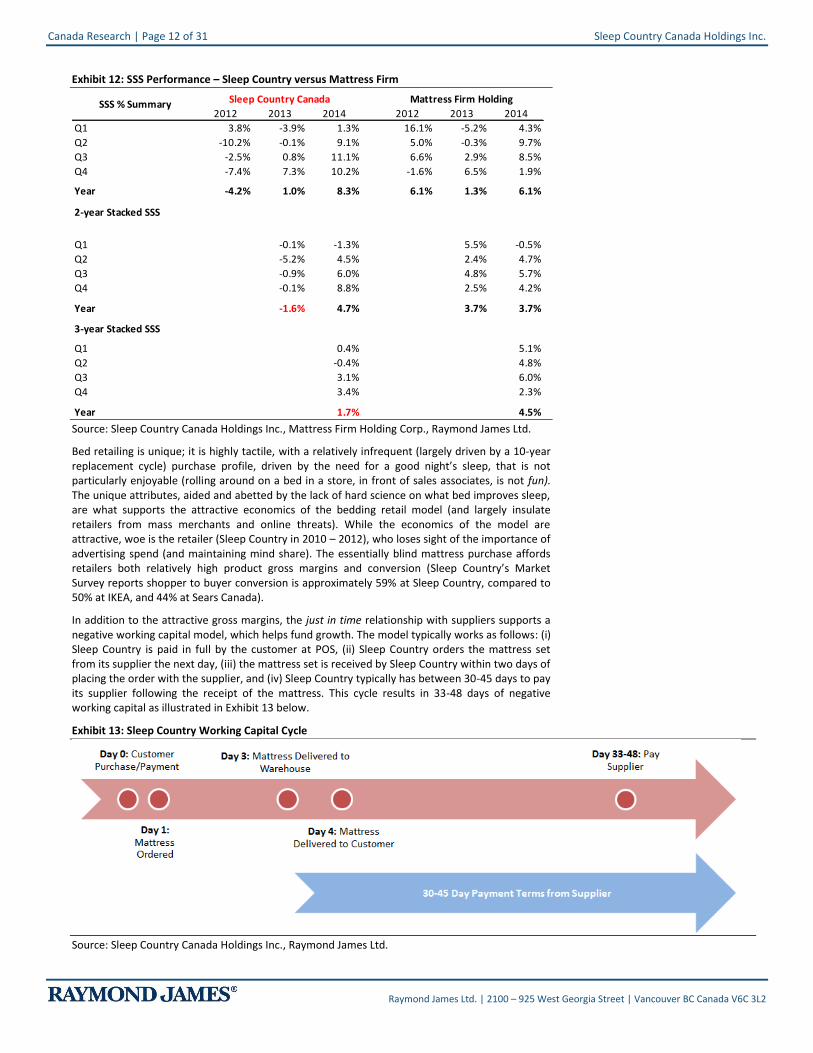
While SSS performance in 2014 was undeniably impressive, we believe viewing the SSS performance on a 2-year and 3-year stacked basis is of greater reference (given the enormity of the swings in performance through 2014). As detailed in Exhibit 12, Sleep Country’s SSS increased 4.7% and 1.7%, respectively, on a 2-year and 3-year stacked basis (versus best-in-class US specialty bedding retailer Mattress Firm at 3.7% and 4.5%, respectively).
Canada Research | Page 12 of 31 Sleep Country Canada Holdings Inc.
Raymond James Ltd. | 2100 – 925 West Georgia Street | Vancouver BC Canada V6C 3L2
Exhibit 12: SSS Performance – Sleep Country versus Mattress Firm
2012 2013 2014 2012 2013 2014
Q1 3.8% -3.9% 1.3% 16.1% -5.2% 4.3%
Q2 -10.2% -0.1% 9.1% 5.0% -0.3% 9.7%
Q3 -2.5% 0.8% 11.1% 6.6% 2.9% 8.5%
Q4 -7.4% 7.3% 10.2% -1.6% 6.5% 1.9%
Year -4.2% 1.0% 8.3% 6.1% 1.3% 6.1%
2-year Stacked SSS
Q1 -0.1% -1.3% 5.5% -0.5%
Q2 -5.2% 4.5% 2.4% 4.7%
Q3 -0.9% 6.0% 4.8% 5.7%
Q4 -0.1% 8.8% 2.5% 4.2%
Year -1.6% 4.7% 3.7% 3.7%
3-year Stacked SSS
Q1 0.4% 5.1%
Q2 -0.4% 4.8%
Q3 3.1% 6.0%
Q4 3.4% 2.3%
Year 1.7% 4.5%
Sleep Country Canada Mattress Firm HoldingSSS % Summary
Source: Sleep Country Canada Holdings Inc., Mattress Firm Holding Corp., Raymond James Ltd.
Bed retailing is unique; it is highly tactile, with a relatively infrequent (largely driven by a 10-year replacement cycle) purchase profile, driven by the need for a good night’s sleep, that is not particularly enjoyable (rolling around on a bed in a store, in front of sales associates, is not fun). The unique attributes, aided and abetted by the lack of hard science on what bed improves sleep, are what supports the attractive economics of the bedding retail model (and largely insulate retailers from mass merchants and online threats). While the economics of the model are attractive, woe is the retailer (Sleep Country in 2010 – 2012), who loses sight of the importance of advertising spend (and maintaining mind share). The essentially blind mattress purchase affords retailers both relatively high product gross margins and conversion (Sleep Country’s Market Survey reports shopper to buyer conversion is approximately 59% at Sleep Country, compared to 50% at IKEA, and 44% at Sears Canada).
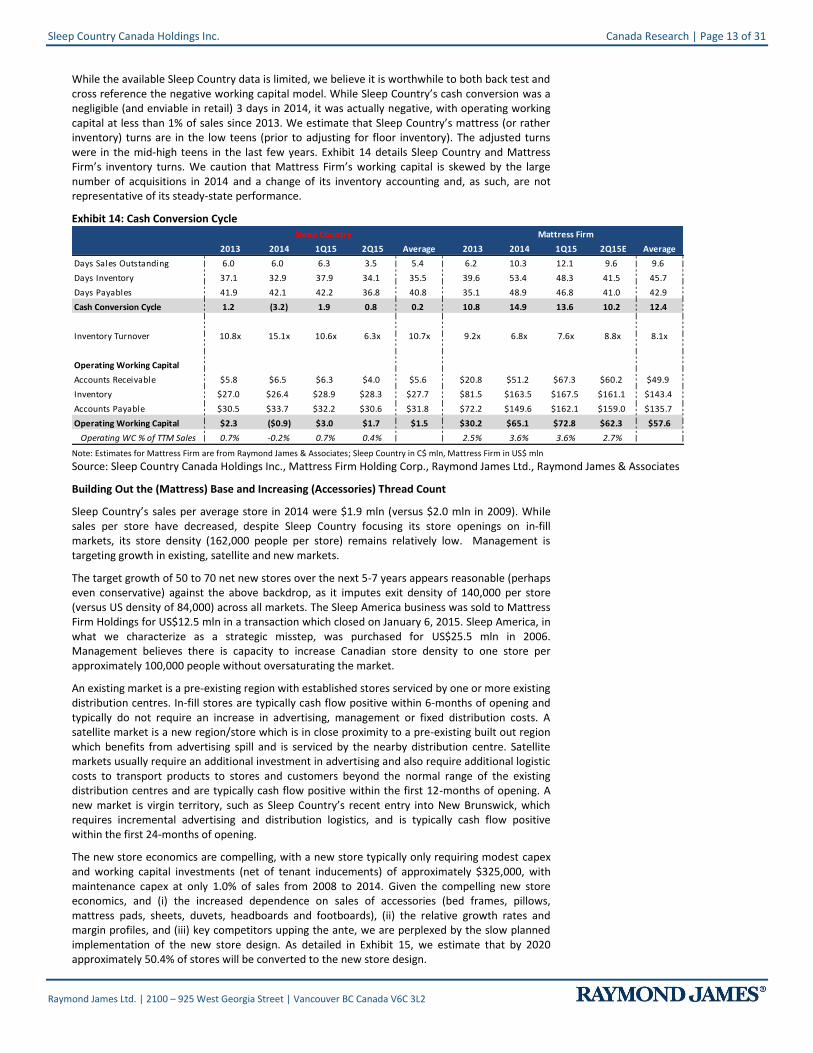
In addition to the attractive gross margins, the just in time relationship with suppliers supports a negative working capital model, which helps fund growth. The model typically works as follows: (i) Sleep Country is paid in full by the customer at POS, (ii) Sleep Country orders the mattress set from its supplier the next day, (iii) the mattress set is received by Sleep Country within two days of placing the order with the supplier, and (iv) Sleep Country typically has between 30-45 days to pay its supplier following the receipt of the mattress. This cycle results in 33-48 days of negative working capital as illustrated in Exhibit 13 below.
Exhibit 13: Sleep Country Working Capital Cycle
Source: Sleep Country Canada Holdings Inc., Raymond James Ltd.
Sleep Country Canada Holdings Inc. Canada Research | Page 13 of 31
Raymond James Ltd. | 2100 – 925 West Georgia Street | Vancouver BC Canada V6C 3L2
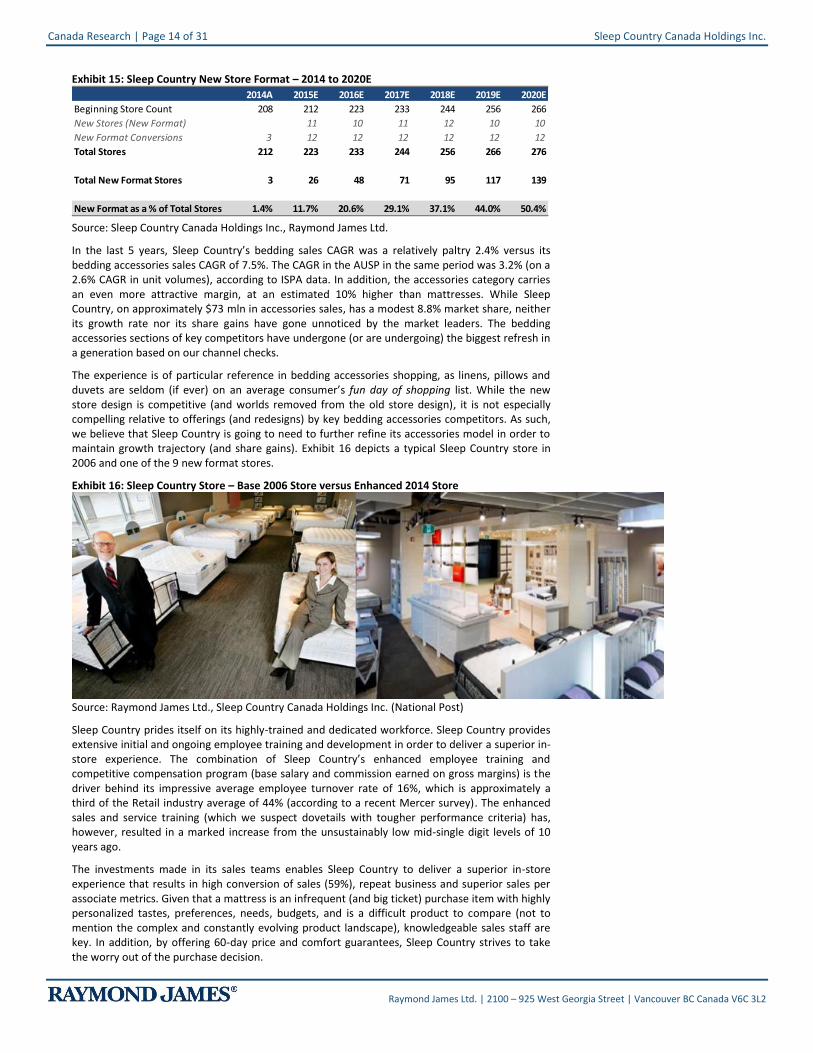
While the available Sleep Country data is limited, we believe it is worthwhile to both back test and cross reference the negative working capital model. While Sleep Country’s cash conversion was a negligible (and enviable in retail) 3 days in 2014, it was actually negative, with operating working capital at less than 1% of sales since 2013. We estimate that Sleep Country’s mattress (or rather inventory) turns are in the low teens (prior to adjusting for floor inventory). The adjusted turns were in the mid-high teens in the last few years. Exhibit 14 details Sleep Country and Mattress Firm’s inventory turns. We caution that Mattress Firm’s working capital is skewed by the large number of acquisitions in 2014 and a change of its inventory accounting and, as such, are not representative of its steady-state performance.
Exhibit 14: Cash Conversion Cycle
2013 2014 1Q15 2Q15 Average 2013 2014 1Q15 2Q15E Average
Days Sales Outstanding 6.0 6.0 6.3 3.5 5.4 6.2 10.3 12.1 9.6 9.6
Days Inventory 37.1 32.9 37.9 34.1 35.5 39.6 53.4 48.3 41.5 45.7
Days Payables 41.9 42.1 42.2 36.8 40.8 35.1 48.9 46.8 41.0 42.9
Cash Conversion Cycle 1.2 (3.2) 1.9 0.8 0.2 10.8 14.9 13.6 10.2 12.4
Inventory Turnover 10.8x 15.1x 10.6x 6.3x 10.7x 9.2x 6.8x 7.6x 8.8x 8.1x
Operating Working Capital
Accounts Receivable $5.8 $6.5 $6.3 $4.0 $5.6 $20.8 $51.2 $67.3 $60.2 $49.9
Inventory $27.0 $26.4 $28.9 $28.3 $27.7 $81.5 $163.5 $167.5 $161.1 $143.4
Accounts Payable $30.5 $33.7 $32.2 $30.6 $31.8 $72.2 $149.6 $162.1 $159.0 $135.7
Operating Working Capital $2.3 ($0.9) $3.0 $1.7 $1.5 $30.2 $65.1 $72.8 $62.3 $57.6
Operating WC % of TTM Sales 0.7% -0.2% 0.7% 0.4% 2.5% 3.6% 3.6% 2.7%
Note: Sleep Country in C$ mln, Mattress Firm in US$ mln
Sleep Country Mattress Firm
Note: Estimates for Mattress Firm are from Raymond James & Associates; Sleep Country in C$ mln, Mattress Firm in US$ mln
Source: Sleep Country Canada Holdings Inc., Mattress Firm Holding Corp., Raymond James Ltd., Raymond James & Associates
Building Out the (Mattress) Base and Increasing (Accessories) Thread Count
Sleep Country’s sales per average store in 2014 were $1.9 mln (versus $2.0 mln in 2009). While sales per store have decreased, despite Sleep Country focusing its store openings on in-fill markets, its store density (162,000 people per store) remains relatively low. Management is targeting growth in existing, satellite and new markets.
The target growth of 50 to 70 net new stores over the next 5-7 years appears reasonable (perhaps even conservative) against the above backdrop, as it imputes exit density of 140,000 per store (versus US density of 84,000) across all markets. The Sleep America business was sold to Mattress Firm Holdings for US$12.5 mln in a transaction which closed on January 6, 2015. Sleep America, in what we characterize as a strategic misstep, was purchased for US$25.5 mln in 2006. Management believes there is capacity to increase Canadian store density to one store per approximately 100,000 people without oversaturating the market.
An existing market is a pre-existing region with established stores serviced by one or more existing distribution centres. In-fill stores are typically cash flow positive within 6-months of opening and typically do not require an increase in advertising, management or fixed distribution costs. A satellite market is a new region/store which is in close proximity to a pre-existing built out region which benefits from advertising spill and is serviced by the nearby distribution centre. Satellite markets usually require an additional investment in advertising and also require additional logistic costs to transport products to stores and customers beyond the normal range of the existing distribution centres and are typically cash flow positive within the first 12-months of opening. A new market is virgin territory, such as Sleep Country’s recent entry into New Brunswick, which requires incremental advertising and distribution logistics, and is typically cash flow positive within the first 24-months of opening.
The new store economics are compelling, with a new store typically only requiring modest capex and working capital investments (net of tenant inducements) of approximately $325,000, with maintenance capex at only 1.0% of sales from 2008 to 2014. Given the compelling new store economics, and (i) the increased dependence on sales of accessories (bed frames, pillows, mattress pads, sheets, duvets, headboards and footboards), (ii) the relative growth rates and margin profiles, and (iii) key competitors upping the ante, we are perplexed by the slow planned implementation of the new store design. As detailed in Exhibit 15, we estimate that by 2020 approximately 50.4% of stores will be converted to the new store design.
Canada Research | Page 14 of 31 Sleep Country Canada Holdings Inc.
Raymond James Ltd. | 2100 – 925 West Georgia Street | Vancouver BC Canada V6C 3L2
Exhibit 15: Sleep Country New Store Format – 2014 to 2020E
2014A 2015E 2016E 2017E 2018E 2019E 2020E
Beginning Store Count 208 212 223 233 244 256 266
New Stores (New Format) 11 10 11 12 10 10
New Format Conversions 3 12 12 12 12 12 12
Total Stores 212 223 233 244 256 266 276
Total New Format Stores 3 26 48 71 95 117 139
New Format as a % of Total Stores 1.4% 11.7% 20.6% 29.1% 37.1% 44.0% 50.4%
Source: Sleep Country Canada Holdings Inc., Raymond James Ltd.
In the last 5 years, Sleep Country’s bedding sales CAGR was a relatively paltry 2.4% versus its bedding accessories sales CAGR of 7.5%. The CAGR in the AUSP in the same period was 3.2% (on a 2.6% CAGR in unit volumes), according to ISPA data. In addition, the accessories category carries an even more attractive margin, at an estimated 10% higher than mattresses. While Sleep Country, on approximately $73 mln in accessories sales, has a modest 8.8% market share, neither its growth rate nor its share gains have gone unnoticed by the market leaders. The bedding accessories sections of key competitors have undergone (or are undergoing) the biggest refresh in a generation based on our channel checks.
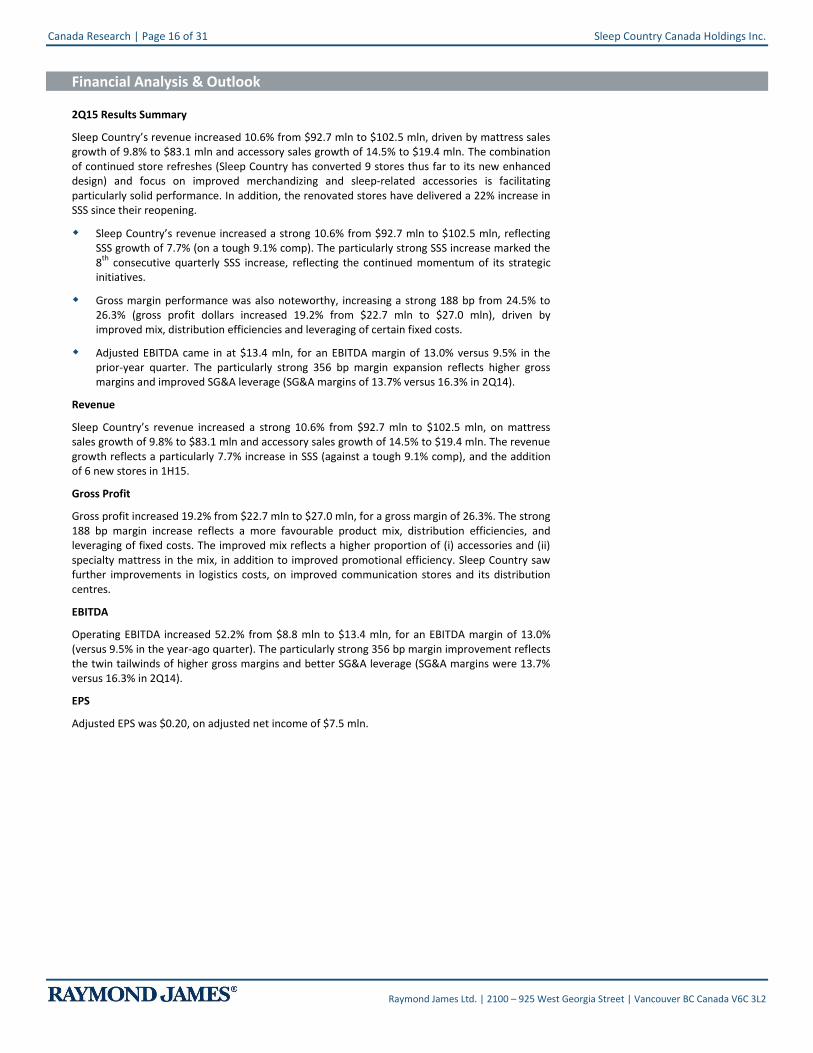
The experience is of particular reference in bedding accessories shopping, as linens, pillows and duvets are seldom (if ever) on an average consumer’s fun day of shopping list. While the new store design is competitive (and worlds removed from the old store design), it is not especially compelling relative to offerings (and redesigns) by key bedding accessories competitors. As such, we believe that Sleep Country is going to need to further refine its accessories model in order to maintain growth trajectory (and share gains). Exhibit 16 depicts a typical Sleep Country store in 2006 and one of the 9 new format stores.
Exhibit 16: Sleep Country Store – Base 2006 Store versus Enhanced 2014 Store
Source: Raymond James Ltd., Sleep Country Canada Holdings Inc. (National Post)
Sleep Country prides itself on its highly-trained and dedicated workforce. Sleep Country provides extensive initial and ongoing employee training and development in order to deliver a superior in-store experience. The combination of Sleep Country’s enhanced employee training and competitive compensation program (base salary and commission earned on gross margins) is the driver behind its impressive average employee turnover rate of 16%, which is approximately a third of the Retail industry average of 44% (according to a recent Mercer survey). The enhanced sales and service training (which we suspect dovetails with tougher performance criteria) has, however, resulted in a marked increase from the unsustainably low mid-single digit levels of 10 years ago.
The investments made in its sales teams enables Sleep Country to deliver a superior in-store experience that results in high conversion of sales (59%), repeat business and superior sales per associate metrics. Given that a mattress is an infrequent (and big ticket) purchase item with highly personalized tastes, preferences, needs, budgets, and is a difficult product to compare (not to mention the complex and constantly evolving product landscape), knowledgeable sales staff are key. In addition, by offering 60-day price and comfort guarantees, Sleep Country strives to take the worry out of the purchase decision.

Sleep Country Canada Holdings Inc. Canada Research | Page 15 of 31
Raymond James Ltd. | 2100 – 925 West Georgia Street | Vancouver BC Canada V6C 3L2
While the conventional wisdom posits that Bricks have (and will continue) to dominate Clicks in mattress retailing, with limited traction gained from online sales given the challenges in gaining an understanding of the differences, falling asleep at your mouse doesn’t result in a good night’s sleep (or growing share). While the Canadian mattress retail market is at a lower risk from online cannibalization and showrooming than other retail categories, Sleep Country can ill afford to become complacent about the threat.
Given that Sleep Country is the leading specialty bedding retailer in Canada, and has recently revamped its advertising strategy (to bolster its traditional and online marketing strategies the company increased its total expenditures on advertising and improved the mix of media that it deployed in its advertising strategy), we decided it would be instructive to do a little online shopping. The results of this exercise were disappointing. Our search of “mattress” generated some surprising results. While we expected new entrants (and online-only players the likes of Endy Sleep) to rank highly, we did not expect Sleep Country to rank below the line. The highest ranking non-sponsored link was by The Brick. In terms of sponsored links, startup Endy Sleep was top ranked, with both Sears Canada and Walmart Canada hard to miss.
Despite an online advertising presence (and website that appears designed to either frustrate consumers into a Sleep Country store or the arms of a competitor), both Sleep Country Canada’s banners enjoy market leading unaided brand awareness and share of traffic. We are of the opinion that significant opportunity (from either a risk mitigation or share gain perspective) exists in Sleep Country’s online capabilities, and we would look to see it become a leader (versus a laggard), in terms of its online capabilities.
Exhibit 17: Consumers’ Brand Awareness
Source: Sleep Country Canada Holdings Inc., Raymond James Ltd.
Canada Research | Page 16 of 31 Sleep Country Canada Holdings Inc.
Raymond James Ltd. | 2100 – 925 West Georgia Street | Vancouver BC Canada V6C 3L2
Financial Analysis & Outlook
2Q15 Results Summary
Sleep Country’s revenue increased 10.6% from $92.7 mln to $102.5 mln, driven by mattress sales growth of 9.8% to $83.1 mln and accessory sales growth of 14.5% to $19.4 mln. The combination of continued store refreshes (Sleep Country has converted 9 stores thus far to its new enhanced design) and focus on improved merchandizing and sleep-related accessories is facilitating particularly solid performance. In addition, the renovated stores have delivered a 22% increase in SSS since their reopening.
Sleep Country’s revenue increased a strong 10.6% from $92.7 mln to $102.5 mln, reflecting SSS growth of 7.7% (on a tough 9.1% comp). The particularly strong SSS increase marked the 8
th consecutive quarterly SSS increase, reflecting the continued momentum of its strategic
initiatives.
Gross margin performance was also noteworthy, increasing a strong 188 bp from 24.5% to 26.3% (gross profit dollars increased 19.2% from $22.7 mln to $27.0 mln), driven by improved mix, distribution efficiencies and leveraging of certain fixed costs.
Adjusted EBITDA came in at $13.4 mln, for an EBITDA margin of 13.0% versus 9.5% in the prior-year quarter. The particularly strong 356 bp margin expansion reflects higher gross margins and improved SG&A leverage (SG&A margins of 13.7% versus 16.3% in 2Q14).
Revenue
Sleep Country’s revenue increased a strong 10.6% from $92.7 mln to $102.5 mln, on mattress sales growth of 9.8% to $83.1 mln and accessory sales growth of 14.5% to $19.4 mln. The revenue growth reflects a particularly 7.7% increase in SSS (against a tough 9.1% comp), and the addition of 6 new stores in 1H15.
Gross Profit
Gross profit increased 19.2% from $22.7 mln to $27.0 mln, for a gross margin of 26.3%. The strong 188 bp margin increase reflects a more favourable product mix, distribution efficiencies, and leveraging of fixed costs. The improved mix reflects a higher proportion of (i) accessories and (ii) specialty mattress in the mix, in addition to improved promotional efficiency. Sleep Country saw further improvements in logistics costs, on improved communication stores and its distribution centres.
EBITDA
Operating EBITDA increased 52.2% from $8.8 mln to $13.4 mln, for an EBITDA margin of 13.0% (versus 9.5% in the year-ago quarter). The particularly strong 356 bp margin improvement reflects the twin tailwinds of higher gross margins and better SG&A leverage (SG&A margins were 13.7% versus 16.3% in 2Q14).
EPS
Adjusted EPS was $0.20, on adjusted net income of $7.5 mln.
Sleep Country Canada Holdings Inc. Canada Research | Page 17 of 31
Raymond James Ltd. | 2100 – 925 West Georgia Street | Vancouver BC Canada V6C 3L2
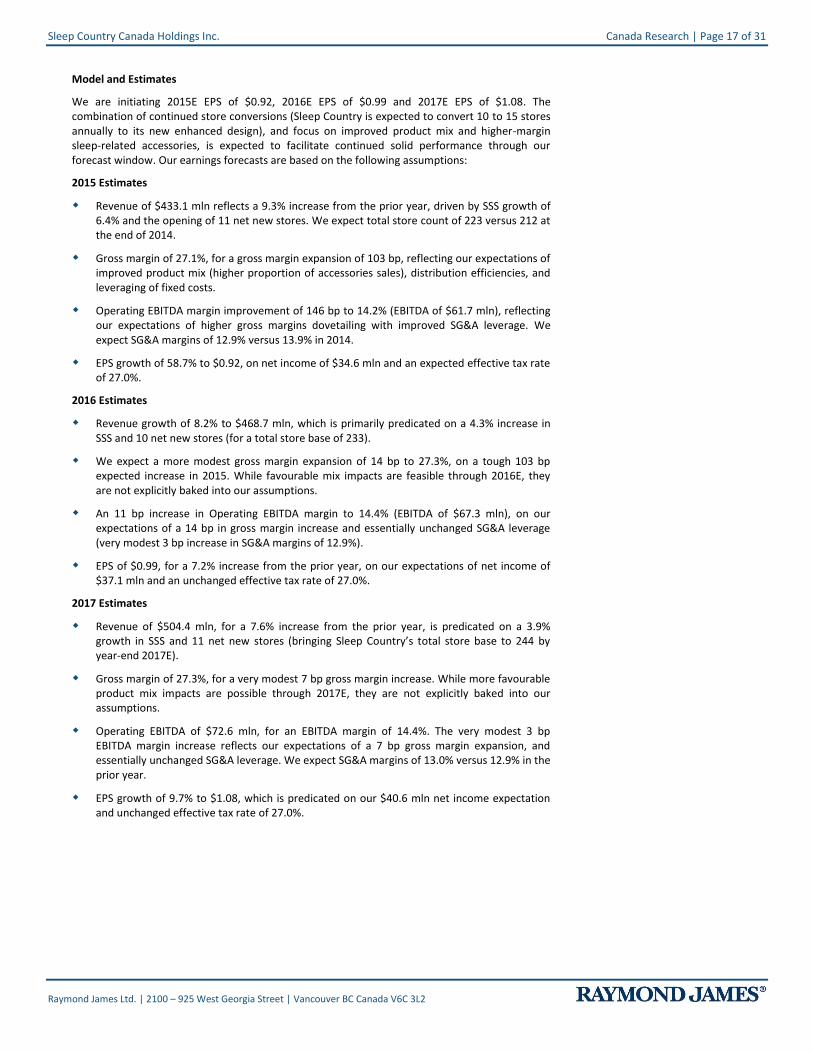
Model and Estimates
We are initiating 2015E EPS of $0.92, 2016E EPS of $0.99 and 2017E EPS of $1.08. The combination of continued store conversions (Sleep Country is expected to convert 10 to 15 stores annually to its new enhanced design), and focus on improved product mix and higher-margin sleep-related accessories, is expected to facilitate continued solid performance through our forecast window. Our earnings forecasts are based on the following assumptions:
2015 Estimates
Revenue of $433.1 mln reflects a 9.3% increase from the prior year, driven by SSS growth of 6.4% and the opening of 11 net new stores. We expect total store count of 223 versus 212 at the end of 2014.
Gross margin of 27.1%, for a gross margin expansion of 103 bp, reflecting our expectations of improved product mix (higher proportion of accessories sales), distribution efficiencies, and leveraging of fixed costs.
Operating EBITDA margin improvement of 146 bp to 14.2% (EBITDA of $61.7 mln), reflecting our expectations of higher gross margins dovetailing with improved SG&A leverage. We expect SG&A margins of 12.9% versus 13.9% in 2014.
EPS growth of 58.7% to $0.92, on net income of $34.6 mln and an expected effective tax rate of 27.0%.
2016 Estimates
Revenue growth of 8.2% to $468.7 mln, which is primarily predicated on a 4.3% increase in SSS and 10 net new stores (for a total store base of 233).
We expect a more modest gross margin expansion of 14 bp to 27.3%, on a tough 103 bp expected increase in 2015. While favourable mix impacts are feasible through 2016E, they are not explicitly baked into our assumptions.
An 11 bp increase in Operating EBITDA margin to 14.4% (EBITDA of $67.3 mln), on our expectations of a 14 bp in gross margin increase and essentially unchanged SG&A leverage (very modest 3 bp increase in SG&A margins of 12.9%).
EPS of $0.99, for a 7.2% increase from the prior year, on our expectations of net income of $37.1 mln and an unchanged effective tax rate of 27.0%.
2017 Estimates
Revenue of $504.4 mln, for a 7.6% increase from the prior year, is predicated on a 3.9% growth in SSS and 11 net new stores (bringing Sleep Country’s total store base to 244 by year-end 2017E).
Gross margin of 27.3%, for a very modest 7 bp gross margin increase. While more favourable product mix impacts are possible through 2017E, they are not explicitly baked into our assumptions.
Operating EBITDA of $72.6 mln, for an EBITDA margin of 14.4%. The very modest 3 bp EBITDA margin increase reflects our expectations of a 7 bp gross margin expansion, and essentially unchanged SG&A leverage. We expect SG&A margins of 13.0% versus 12.9% in the prior year.
EPS growth of 9.7% to $1.08, which is predicated on our $40.6 mln net income expectation and unchanged effective tax rate of 27.0%.
Canada Research | Page 18 of 31 Sleep Country Canada Holdings Inc.
Raymond James Ltd. | 2100 – 925 West Georgia Street | Vancouver BC Canada V6C 3L2
Valuation & Recommendation
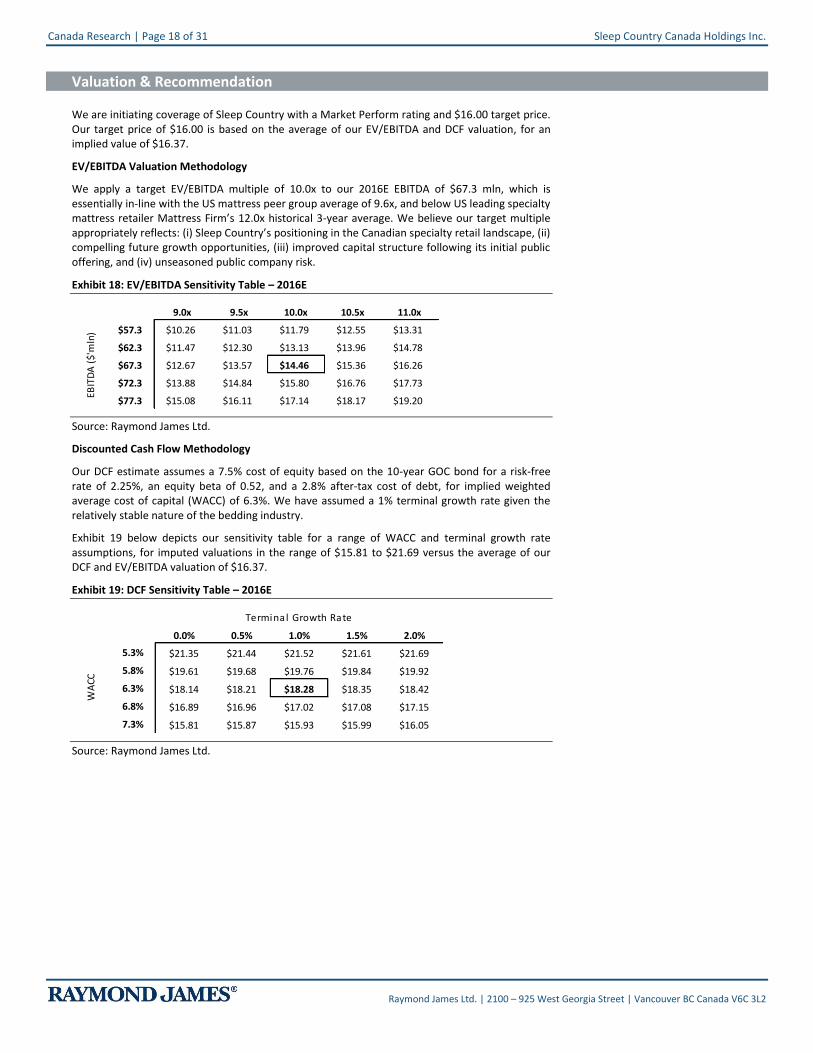
We are initiating coverage of Sleep Country with a Market Perform rating and $16.00 target price. Our target price of $16.00 is based on the average of our EV/EBITDA and DCF valuation, for an implied value of $16.37.
EV/EBITDA Valuation Methodology
We apply a target EV/EBITDA multiple of 10.0x to our 2016E EBITDA of $67.3 mln, which is essentially in-line with the US mattress peer group average of 9.6x, and below US leading specialty mattress retailer Mattress Firm’s 12.0x historical 3-year average. We believe our target multiple appropriately reflects: (i) Sleep Country’s positioning in the Canadian specialty retail landscape, (ii) compelling future growth opportunities, (iii) improved capital structure following its initial public offering, and (iv) unseasoned public company risk.
Exhibit 18: EV/EBITDA Sensitivity Table – 2016E
14.46$ 9.0x 9.5x 10.0x 10.5x 11.0x
$57.3 $10.26 $11.03 $11.79 $12.55 $13.31
$62.3 $11.47 $12.30 $13.13 $13.96 $14.78
$67.3 $12.67 $13.57 $14.46 $15.36 $16.26
$72.3 $13.88 $14.84 $15.80 $16.76 $17.73
$77.3 $15.08 $16.11 $17.14 $18.17 $19.20
EBIT
DA
($'
mln
)
Source: Raymond James Ltd.
Discounted Cash Flow Methodology
Our DCF estimate assumes a 7.5% cost of equity based on the 10-year GOC bond for a risk-free rate of 2.25%, an equity beta of 0.52, and a 2.8% after-tax cost of debt, for implied weighted average cost of capital (WACC) of 6.3%. We have assumed a 1% terminal growth rate given the relatively stable nature of the bedding industry.
Exhibit 19 below depicts our sensitivity table for a range of WACC and terminal growth rate assumptions, for imputed valuations in the range of $15.81 to $21.69 versus the average of our DCF and EV/EBITDA valuation of $16.37.
Exhibit 19: DCF Sensitivity Table – 2016E
1,828% 0.0% 0.5% 1.0% 1.5% 2.0%
5.3% $21.35 $21.44 $21.52 $21.61 $21.69
5.8% $19.61 $19.68 $19.76 $19.84 $19.92
6.3% $18.14 $18.21 $18.28 $18.35 $18.42
6.8% $16.89 $16.96 $17.02 $17.08 $17.15
7.3% $15.81 $15.87 $15.93 $15.99 $16.05
Terminal Growth Rate
WA
CC
Source: Raymond James Ltd.
Sleep Country Canada Holdings Inc. Canada Research | Page 19 of 31
Raymond James Ltd. | 2100 – 925 West Georgia Street | Vancouver BC Canada V6C 3L2
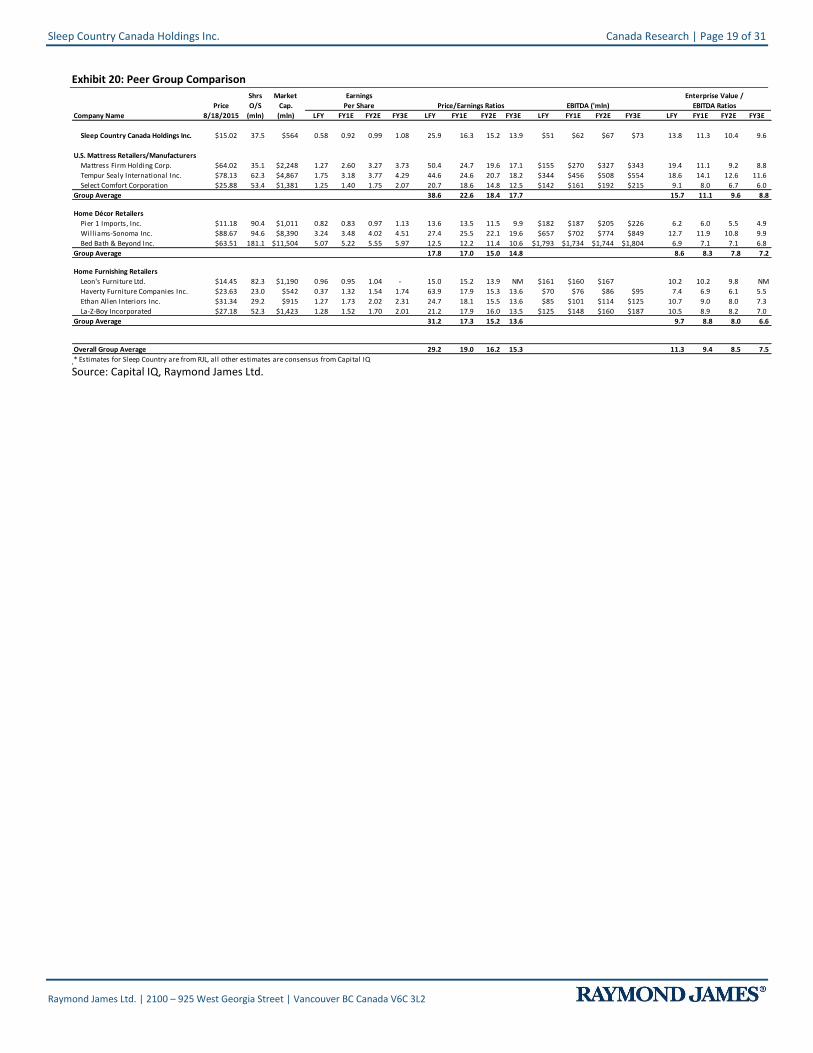
Exhibit 20: Peer Group Comparison
Shrs Market 1000 1001 1002 1003
Price O/S Cap.
Company Name 8/18/2015 (mln) (mln) LFY FY1E FY2E FY3E LFY FY1E FY2E FY3E LFY FY1E FY2E FY3E LFY FY1E FY2E FY3E
Sleep Country Canada Holdings Inc. $15.02 37.5 $564 0.58 0.92 0.99 1.08 25.9 16.3 15.2 13.9 $51 $62 $67 $73 13.8 11.3 10.4 9.6
U.S. Mattress Retailers/Manufacturers LAST 1000 1001 1002 1003
Mattress Firm Holding Corp. $64.02 35.1 $2,248 1.27 2.60 3.27 3.73 50.4 24.7 19.6 17.1 $155 $270 $327 $343 19.4 11.1 9.2 8.8
Tempur Sealy International Inc. $78.13 62.3 $4,867 1.75 3.18 3.77 4.29 44.6 24.6 20.7 18.2 $344 $456 $508 $554 18.6 14.1 12.6 11.6
Select Comfort Corporation $25.88 53.4 $1,381 1.25 1.40 1.75 2.07 20.7 18.6 14.8 12.5 $142 $161 $192 $215 9.1 8.0 6.7 6.0
Group Average 38.6 22.6 18.4 17.7 15.7 11.1 9.6 8.8
Home Décor Retailers LAST 1000 1001 1002 1003
Pier 1 Imports, Inc. $11.18 90.4 $1,011 0.82 0.83 0.97 1.13 13.6 13.5 11.5 9.9 $182 $187 $205 $226 6.2 6.0 5.5 4.9
Williams-Sonoma Inc. $88.67 94.6 $8,390 3.24 3.48 4.02 4.51 27.4 25.5 22.1 19.6 $657 $702 $774 $849 12.7 11.9 10.8 9.9
Bed Bath & Beyond Inc. $63.51 181.1 $11,504 5.07 5.22 5.55 5.97 12.5 12.2 11.4 10.6 $1,793 $1,734 $1,744 $1,804 6.9 7.1 7.1 6.8
Group Average 17.8 17.0 15.0 14.8 8.6 8.3 7.8 7.2
Home Furnishing Retailers LAST 1000 1001 1002 1003
Leon's Furniture Ltd. $14.45 82.3 $1,190 0.96 0.95 1.04 - 15.0 15.2 13.9 NM $161 $160 $167 $0 10.2 10.2 9.8 NM
Haverty Furniture Companies Inc. $23.63 23.0 $542 0.37 1.32 1.54 1.74 63.9 17.9 15.3 13.6 $70 $76 $86 $95 7.4 6.9 6.1 5.5
Ethan Allen Interiors Inc. $31.34 29.2 $915 1.27 1.73 2.02 2.31 24.7 18.1 15.5 13.6 $85 $101 $114 $125 10.7 9.0 8.0 7.3
La-Z-Boy Incorporated $27.18 52.3 $1,423 1.28 1.52 1.70 2.01 21.2 17.9 16.0 13.5 $125 $148 $160 $187 10.5 8.9 8.2 7.0
Group Average 31.2 17.3 15.2 13.6 9.7 8.8 8.0 6.6
Overall Group Average 29.2 19.0 16.2 15.3 11.3 9.4 8.5 7.5
* Estimates for Sleep Country are from RJL, all other estimates are consensus from Capital IQ
Earnings
Per Share Price/Earnings Ratios EBITDA ('mln)
Enterprise Value /
EBITDA Ratios
Source: Capital IQ, Raymond James Ltd.
Canada Research | Page 20 of 31 Sleep Country Canada Holdings Inc.
Raymond James Ltd. | 2100 – 925 West Georgia Street | Vancouver BC Canada V6C 3L2
Appendix A: Financial Statements
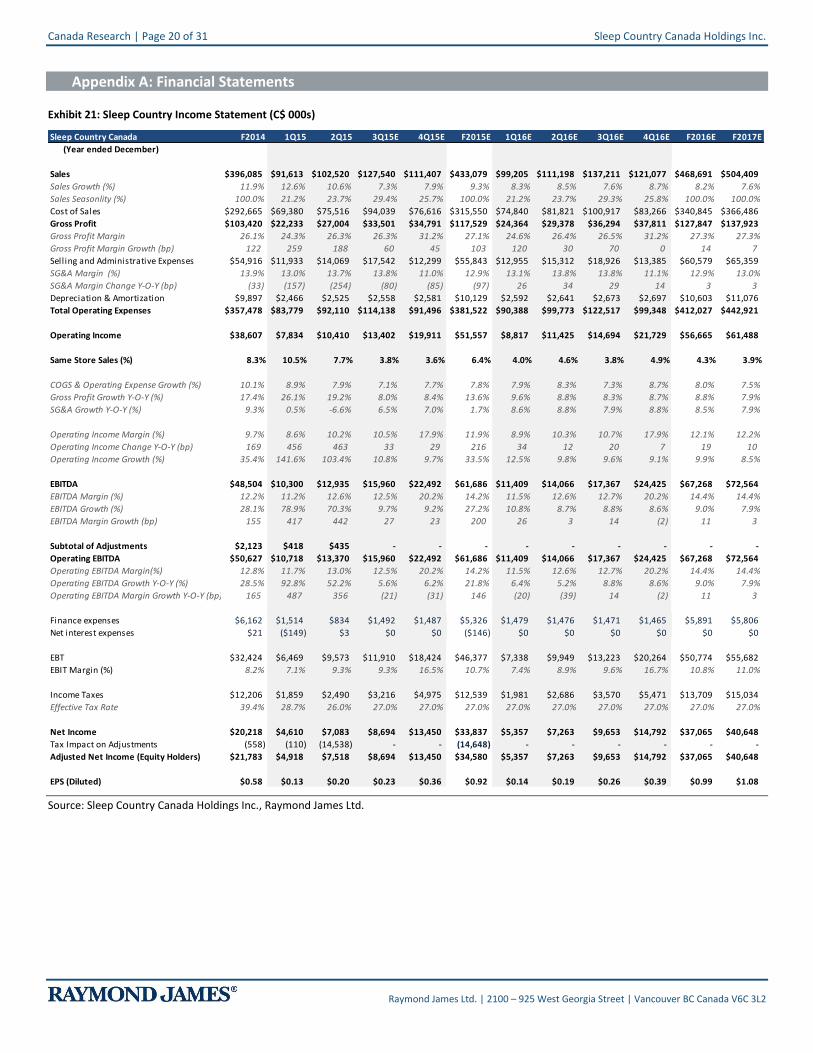
Exhibit 21: Sleep Country Income Statement (C$ 000s)
Sleep Country Canada F2014 1Q15 2Q15 3Q15E 4Q15E F2015E 1Q16E 2Q16E 3Q16E 4Q16E F2016E F2017E
(Year ended December)
Sales $396,085 $91,613 $102,520 $127,540 $111,407 $433,079 $99,205 $111,198 $137,211 $121,077 $468,691 $504,409
Sales Growth (%) 11.9% 12.6% 10.6% 7.3% 7.9% 9.3% 8.3% 8.5% 7.6% 8.7% 8.2% 7.6%
Sales Seasonlity (%) 100.0% 21.2% 23.7% 29.4% 25.7% 100.0% 21.2% 23.7% 29.3% 25.8% 100.0% 100.0%
Cost of Sales $292,665 $69,380 $75,516 $94,039 $76,616 $315,550 $74,840 $81,821 $100,917 $83,266 $340,845 $366,486
Gross Profit $103,420 $22,233 $27,004 $33,501 $34,791 $117,529 $24,364 $29,378 $36,294 $37,811 $127,847 $137,923
Gross Profit Margin 26.1% 24.3% 26.3% 26.3% 31.2% 27.1% 24.6% 26.4% 26.5% 31.2% 27.3% 27.3%
Gross Profit Margin Growth (bp) 122 259 188 60 45 103 120 30 70 0 14 7
Selling and Administrative Expenses $54,916 $11,933 $14,069 $17,542 $12,299 $55,843 $12,955 $15,312 $18,926 $13,385 $60,579 $65,359
SG&A Margin (%) 13.9% 13.0% 13.7% 13.8% 11.0% 12.9% 13.1% 13.8% 13.8% 11.1% 12.9% 13.0%
SG&A Margin Change Y-O-Y (bp) (33) (157) (254) (80) (85) (97) 26 34 29 14 3 3
Depreciation & Amortization $9,897 $2,466 $2,525 $2,558 $2,581 $10,129 $2,592 $2,641 $2,673 $2,697 $10,603 $11,076
Total Operating Expenses $357,478 $83,779 $92,110 $114,138 $91,496 $381,522 $90,388 $99,773 $122,517 $99,348 $412,027 $442,921
Operating Income $38,607 $7,834 $10,410 $13,402 $19,911 $51,557 $8,817 $11,425 $14,694 $21,729 $56,665 $61,488
Same Store Sales (%) 8.3% 10.5% 7.7% 3.8% 3.6% 6.4% 4.0% 4.6% 3.8% 4.9% 4.3% 3.9%
COGS & Operating Expense Growth (%) 10.1% 8.9% 7.9% 7.1% 7.7% 7.8% 7.9% 8.3% 7.3% 8.7% 8.0% 7.5%
Gross Profit Growth Y-O-Y (%) 17.4% 26.1% 19.2% 8.0% 8.4% 13.6% 9.6% 8.8% 8.3% 8.7% 8.8% 7.9%
SG&A Growth Y-O-Y (%) 9.3% 0.5% -6.6% 6.5% 7.0% 1.7% 8.6% 8.8% 7.9% 8.8% 8.5% 7.9%
Operating Income Margin (%) 9.7% 8.6% 10.2% 10.5% 17.9% 11.9% 8.9% 10.3% 10.7% 17.9% 12.1% 12.2%
Operating Income Change Y-O-Y (bp) 169 456 463 33 29 216 34 12 20 7 19 10
Operating Income Growth (%) 35.4% 141.6% 103.4% 10.8% 9.7% 33.5% 12.5% 9.8% 9.6% 9.1% 9.9% 8.5%
EBITDA $48,504 $10,300 $12,935 $15,960 $22,492 $61,686 $11,409 $14,066 $17,367 $24,425 $67,268 $72,564
EBITDA Margin (%) 12.2% 11.2% 12.6% 12.5% 20.2% 14.2% 11.5% 12.6% 12.7% 20.2% 14.4% 14.4%
EBITDA Growth (%) 28.1% 78.9% 70.3% 9.7% 9.2% 27.2% 10.8% 8.7% 8.8% 8.6% 9.0% 7.9%
EBITDA Margin Growth (bp) 155 417 442 27 23 200 26 3 14 (2) 11 3
Subtotal of Adjustments $2,123 $418 $435 - - - - - - - - -
Operating EBITDA $50,627 $10,718 $13,370 $15,960 $22,492 $61,686 $11,409 $14,066 $17,367 $24,425 $67,268 $72,564
Operating EBITDA Margin(%) 12.8% 11.7% 13.0% 12.5% 20.2% 14.2% 11.5% 12.6% 12.7% 20.2% 14.4% 14.4%
Operating EBITDA Growth Y-O-Y (%) 28.5% 92.8% 52.2% 5.6% 6.2% 21.8% 6.4% 5.2% 8.8% 8.6% 9.0% 7.9%
Operating EBITDA Margin Growth Y-O-Y (bp) 165 487 356 (21) (31) 146 (20) (39) 14 (2) 11 3
Finance expenses $6,162 $1,514 $834 $1,492 $1,487 $5,326 $1,479 $1,476 $1,471 $1,465 $5,891 $5,806
Net interest expenses $21 ($149) $3 $0 $0 ($146) $0 $0 $0 $0 $0 $0
EBT $32,424 $6,469 $9,573 $11,910 $18,424 $46,377 $7,338 $9,949 $13,223 $20,264 $50,774 $55,682
EBIT Margin (%) 8.2% 7.1% 9.3% 9.3% 16.5% 10.7% 7.4% 8.9% 9.6% 16.7% 10.8% 11.0%
Income Taxes $12,206 $1,859 $2,490 $3,216 $4,975 $12,539 $1,981 $2,686 $3,570 $5,471 $13,709 $15,034
Effective Tax Rate 39.4% 28.7% 26.0% 27.0% 27.0% 27.0% 27.0% 27.0% 27.0% 27.0% 27.0% 27.0%
Net Income $20,218 $4,610 $7,083 $8,694 $13,450 $33,837 $5,357 $7,263 $9,653 $14,792 $37,065 $40,648
Tax Impact on Adjustments (558) (110) (14,538) - - (14,648) - - - - - -
Adjusted Net Income (Equity Holders) $21,783 $4,918 $7,518 $8,694 $13,450 $34,580 $5,357 $7,263 $9,653 $14,792 $37,065 $40,648
EPS (Diluted) $0.58 $0.13 $0.20 $0.23 $0.36 $0.92 $0.14 $0.19 $0.26 $0.39 $0.99 $1.08
Source: Sleep Country Canada Holdings Inc., Raymond James Ltd.

Sleep Country Canada Holdings Inc. Canada Research | Page 21 of 31
Raymond James Ltd. | 2100 – 925 West Georgia Street | Vancouver BC Canada V6C 3L2
Exhibit 22: Sleep Country Balance Sheet (C$ 000s) Sleep Country Canada 2013 2014 2015E 2016E 2017E
(Year ended December)
Assets:
Current Assets:
Cash & Equivalents 27,401 41,331 37,045 52,450 71,003
Trade & Other Receivables 5,808 6,477 4,897 5,322 5,734
Due from Related Parties 11 16 1,194 - -
Inventories 27,046 26,369 31,151 33,855 36,372
Prepaid Expenses 1,482 2,475 2,287 2,287 2,287
Assets for Disposal/Held for Sale - 14,086 - - -
Non-Current Assets:
Property & Equipment 30,455 24,948 25,242 21,839 17,962
Other Assets 419 480 431 431 431
Intangibles 105,006 104,042 103,845 103,845 103,845
Goodwill 242,595 242,146 242,146 242,146 242,146
Total Assets 440,223 462,370 448,238 462,175 479,780
Liabilities & Shareholder's Equity
Current Liabilities:
Trade & Other Payables 30,546 33,729 31,151 33,855 36,372
Customer Deposits 10,093 12,116 10,811 10,811 10,811
Current Portion of Long-term Debt 885 7,367 6,928 6,208 5,488
Liabilities of Disposal Group Held for Sale - 5,210 - - -
Total Current Liabilities 41,524 58,422 48,890 50,874 52,671
Other Liabilities 7,078 6,965 6,985 6,985 6,985
Deferred Tax Liabilities 42,541 31,820 11,429 11,429 11,429
Long-term Debt 220,115 257,838 148,487 148,487 148,487
Total Liabilities 311,258 355,045 215,791 217,775 219,572
Shareholders' Equity
Share Capital 123,994 123,603 207,583 205,102 205,102
Retained Earnings/Deficit (28,234) (63,693) 24,863 39,297 55,105
Currency Translation Reserve 80 428 - - -
Total Shareholders' Equity 95,840 60,338 232,446 244,400 260,208
Non-controlling Interest 33,125 46,987 - - -
Total Liabilities & Shareholder's Equity 440,223 462,370 448,238 462,175 479,780 Source: Sleep Country Canada Holdings Inc., Raymond James Ltd.
Canada Research | Page 22 of 31 Sleep Country Canada Holdings Inc.
Raymond James Ltd. | 2100 – 925 West Georgia Street | Vancouver BC Canada V6C 3L2
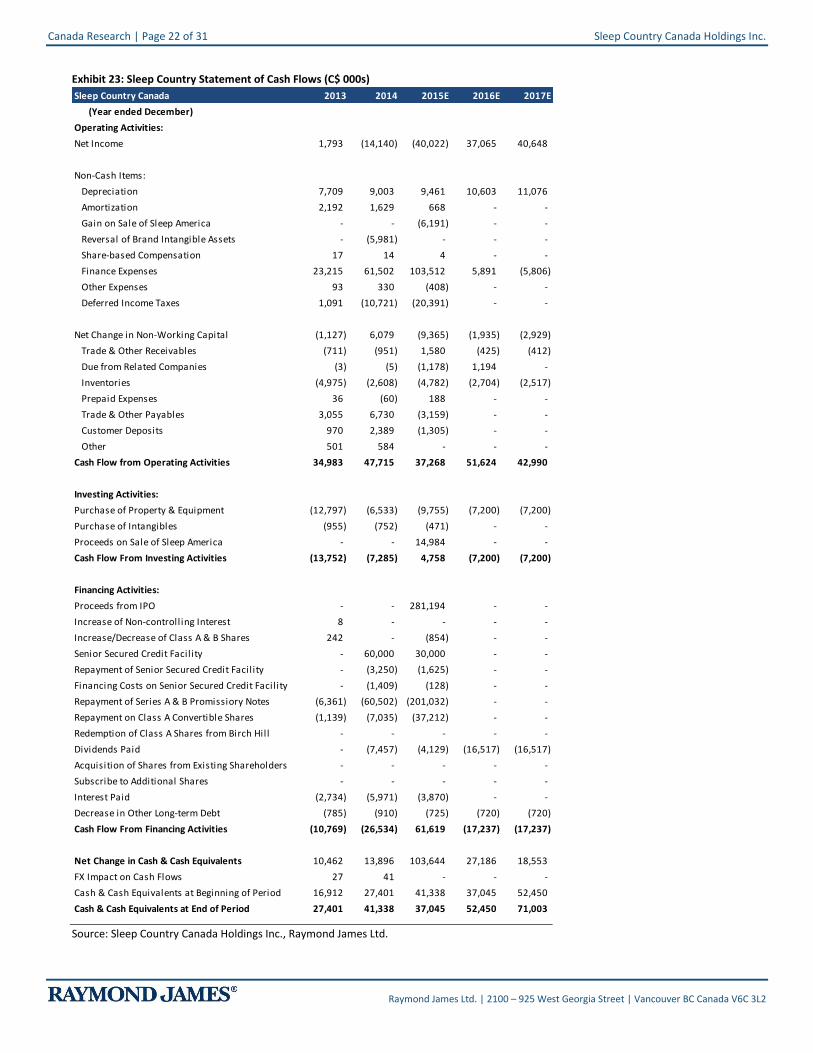
Exhibit 23: Sleep Country Statement of Cash Flows (C$ 000s)
Sleep Country Canada 2013 2014 2015E 2016E 2017E
(Year ended December)
Operating Activities:
Net Income 1,793 (14,140) (40,022) 37,065 40,648
Non-Cash Items:
Depreciation 7,709 9,003 9,461 10,603 11,076
Amortization 2,192 1,629 668 - -
Gain on Sale of Sleep America - - (6,191) - -
Reversal of Brand Intangible Assets - (5,981) - - -
Share-based Compensation 17 14 4 - -
Finance Expenses 23,215 61,502 103,512 5,891 (5,806)
Other Expenses 93 330 (408) - -
Deferred Income Taxes 1,091 (10,721) (20,391) - -
Net Change in Non-Working Capital (1,127) 6,079 (9,365) (1,935) (2,929)
Trade & Other Receivables (711) (951) 1,580 (425) (412)
Due from Related Companies (3) (5) (1,178) 1,194 -
Inventories (4,975) (2,608) (4,782) (2,704) (2,517)
Prepaid Expenses 36 (60) 188 - -
Trade & Other Payables 3,055 6,730 (3,159) - -
Customer Deposits 970 2,389 (1,305) - -
Other 501 584 - - -
Cash Flow from Operating Activities 34,983 47,715 37,268 51,624 42,990
Investing Activities:
Purchase of Property & Equipment (12,797) (6,533) (9,755) (7,200) (7,200)
Purchase of Intangibles (955) (752) (471) - -
Proceeds on Sale of Sleep America - - 14,984 - -
Cash Flow From Investing Activities (13,752) (7,285) 4,758 (7,200) (7,200)
Financing Activities:
Proceeds from IPO - - 281,194 - -
Increase of Non-controlling Interest 8 - - - -
Increase/Decrease of Class A & B Shares 242 - (854) - -
Senior Secured Credit Facil ity - 60,000 30,000 - -
Repayment of Senior Secured Credit Facil ity - (3,250) (1,625) - -
Financing Costs on Senior Secured Credit Facil ity - (1,409) (128) - -
Repayment of Series A & B Promissiory Notes (6,361) (60,502) (201,032) - -
Repayment on Class A Convertible Shares (1,139) (7,035) (37,212) - -
Redemption of Class A Shares from Birch Hill - - - - -
Dividends Paid - (7,457) (4,129) (16,517) (16,517)
Acquisition of Shares from Existing Shareholders - - - - -
Subscribe to Additional Shares - - - - -
Interest Paid (2,734) (5,971) (3,870) - -
Decrease in Other Long-term Debt (785) (910) (725) (720) (720)
Cash Flow From Financing Activities (10,769) (26,534) 61,619 (17,237) (17,237)
Net Change in Cash & Cash Equivalents 10,462 13,896 103,644 27,186 18,553
FX Impact on Cash Flows 27 41 - - -
Cash & Cash Equivalents at Beginning of Period 16,912 27,401 41,338 37,045 52,450
Cash & Cash Equivalents at End of Period 27,401 41,338 37,045 52,450 71,003
Source: Sleep Country Canada Holdings Inc., Raymond James Ltd.
Sleep Country Canada Holdings Inc. Canada Research | Page 23 of 31
Raymond James Ltd. | 2100 – 925 West Georgia Street | Vancouver BC Canada V6C 3L2
Appendix B: Management & Board of Directors
Stephen K. Gunn, Executive Co-Chair Mr. Gunn co-founded Sleep Country in 1994 and served as its Chief Executive Officer from 1997 to 2014. Prior to co-founding Sleep Country, Mr. Gunn held management consulting positions at McKinsey from 1981 to 1987, after which he co-founded Kenrick Capital. Mr. Gunn also serves on the Board of Directors at Dollarama, Golfsmith International, Cara, and Mastermind Toys. Mr. Gunn holds an MBA from University of Western Ontario, and a B.Sc. degree from Queen’s University. Christine Magee, Executive Co-Chair Ms. Magee co-founded Sleep Country in 1994 and served as its President until 2014. Prior to co-founding Sleep Country, Ms. Magee held various senior positions at Continental Bank and National Bank between 1982 and 1994. Ms. Magee also serves on the Board of Directors of SiriusXM Canada and Trillium Health Partners. In addition, Ms. Magee also serves on the Advisory Board of the Ivey School of Business and the Women’s President Organization. Ms. Magee holds an HBA from the University of Western Ontario. David Friesema, Director and Chief Executive Officer Mr. Friesema has served as Sleep Country’s Chief Executive Officer since November 2014. Mr. Friesema joined Sleep Country in 1995, during which he held various senior positions such as Head of Sales, General Manager and Chief Operating Officer. During his 20 year tenure at Sleep Country, Mr. Friesema has led the company through various strategic initiatives, such as developing sales training programs and creative marketing campaigns. Previously, Mr. Friesema worked in the mattress industry in the United States. Mr. Friesema is the Chairman of the Better Sleep Council of Canada. He attended the University of Detroit Business School and the University of Missouri-St. Louis School of Psychology. Stewart Schaefer, President of Dourmez-vous? and Chief Business Development Officer Mr. Schaefer founded Dourmez-vous? in 1994 and managed the company until it was acquired by Sleep Country in 2006. Prior to founding Dourmez-vous?, Mr. Schaefer co-founded Heritage Classic Beds, a manufacturer and distributor of iron and brass beds. Prior to entering the bedding industry, Mr. Schaefer worked as a commodity broker in Chicago, and at Dean Witter Reynolds and Refco Futures in Montreal. Mr. Schaefer studied Finance and Marketing at Concordia University in Montreal. Robert Masson, Chief Financial Officer and Corporate Secretary Mr. Masson has served in his current role since July 2013, when he joined Sleep Country. Previously, he held the position of Chief Financial Officer at Second Cup, in addition to various senior roles at IBM Canada, Manchuwok, Ernst & Young, Deloitte & Touche, and Sappi. Mr. Masson holds a Bachelor of Commerce and a Post Graduate Diploma of Accounting from the University of Kwa-Zulu Natal in South Africa. In addition, Mr. Masson holds the Chartered Accountant designation and is a member of the Chartered Professional Accountants of Ontario. David Howcroft, Senior Vice President of Sales Mr. Howcroft joined Sleep Country in 1996 and has served in his current role since 2012. During his tenure at Sleep Country, Mr. Howcroft has created various sales training programs and played an integral role in the development and implementation of sales workshops, training programs and sales processes. Mr. Howcroft has in excess of 20 years of retail sales experience, with the ability to conceive new sales strategies and a well-recognized ability to mentor and motivate. Sieg Will, Senior Vice President of Operations Mr. Will joined Sleep Country in 2002 and has served in his current role since 2012. During his tenure at Sleep Country, he has held various senior positions and played an integral role in the development and implementation of standard operating policies and procedures across the company. Previously, Mr. Will held senior positions in sales, operations and account management at Canadian Tire and PepsiCo. He serves on the Humber College Supply Chain Advisory Board, is a Team Leader for Sleeping Children Around the World and an Ambassador for the Pinehurst Club Breakfast. Mr. Will holds a B.A. (Honours) from the University of Guelph, and a Master’s Certificate in Supply Chain Management from the Schulich School of Business. He also has a Professional Logistics Designation from the Logistics Institute.

Canada Research | Page 24 of 31 Sleep Country Canada Holdings Inc.
Raymond James Ltd. | 2100 – 925 West Georgia Street | Vancouver BC Canada V6C 3L2
Eric Solomon, Senior Vice President of Merchandising and Marketing Mr. Solomon joined Sleep Country in 1996 and has served in his current role since 2012. During his tenure at Sleep Country, Mr. Solomon played an integral part of increasing the company’s brand awareness and diversifying Sleep Country’s product lineup with exclusive offerings. Mr. Solomon also led the sales and operating functions of Sleep Country. Mr. Solomon attended McMaster University.
Risks
General Economic Conditions The company’s business and operating performance may be adversely affected by economic forces beyond its control. Rising consumer debt levels and changes in consumer preferences and buying patterns, as well as changes in unemployment rate and labour costs could negatively impact the company’s performance. External factors that affect global and/or regional economies, interest rates, exchange rates, or major segments of the economy could alter investor confidence and investment prospects; an increase in minimum wage could have an adverse impact on operating costs and earnings. Competitive Landscape The Canadian retail landscape is highly competitive and continues to attract new entrants. The industry has been undergoing significant changes over the years, with both US and international players entering the Canadian retail market. In addition, with the increasing prevalence of e-commerce, existing competitors may start offering mattresses online and new competitors with an online presence may enter the bedding market. An increase in competition, both in-store and online, may result in price wars, market share loss, and reduced sales and profitability. Seasonality and Weather Retail mattress sales are subject to seasonal patterns, with the highest level of sales occurring in the second half of the year. Variable costs, such as certain selling costs and employee wages, can be managed to match seasonal fluctuations. A large portion of retail costs, such as ret, are fixed and cannot be adjusted to match seasonal demand. Unseasonable weather can result in lower traffic to Sleep Country and Dourmez-vous? stores and deter consumer spending. Supply Chain Disruption Disruptions or delays in store inventory replenishment could negatively impact operations and profitability. Factors resulting in disruptions of supply chain could include, but are not limited to, shipping slowdown or disruption due to extreme weather conditions. Product Cost and Inflation The company’s operating results may be adversely affected by the prices of the components used in the manufacture of the mattress and complementary sleep related products and accessories it sells. These prices may fluctuate based on a number of factors outside the company’s control, such as the price of oil, changes in supply and demand, general economic conditions and consumer spending, labour costs, competition, import duties and tariffs. Foreign Currency A portion of the company’s merchandize purchases are denominated in USD. As a portion of the company’s purchases are made in US dollars, unfavourable currency fluctuations relative to the Canadian dollar may adversely impact the company’s profitability. Sleep Country currently has no hedging instruments in place to mitigate the impact of fluctuating foreign exchange rates.
Sleep Country Canada Holdings Inc. Canada Research | Page 25 of 31
Raymond James Ltd. | 2100 – 925 West Georgia Street | Vancouver BC Canada V6C 3L2
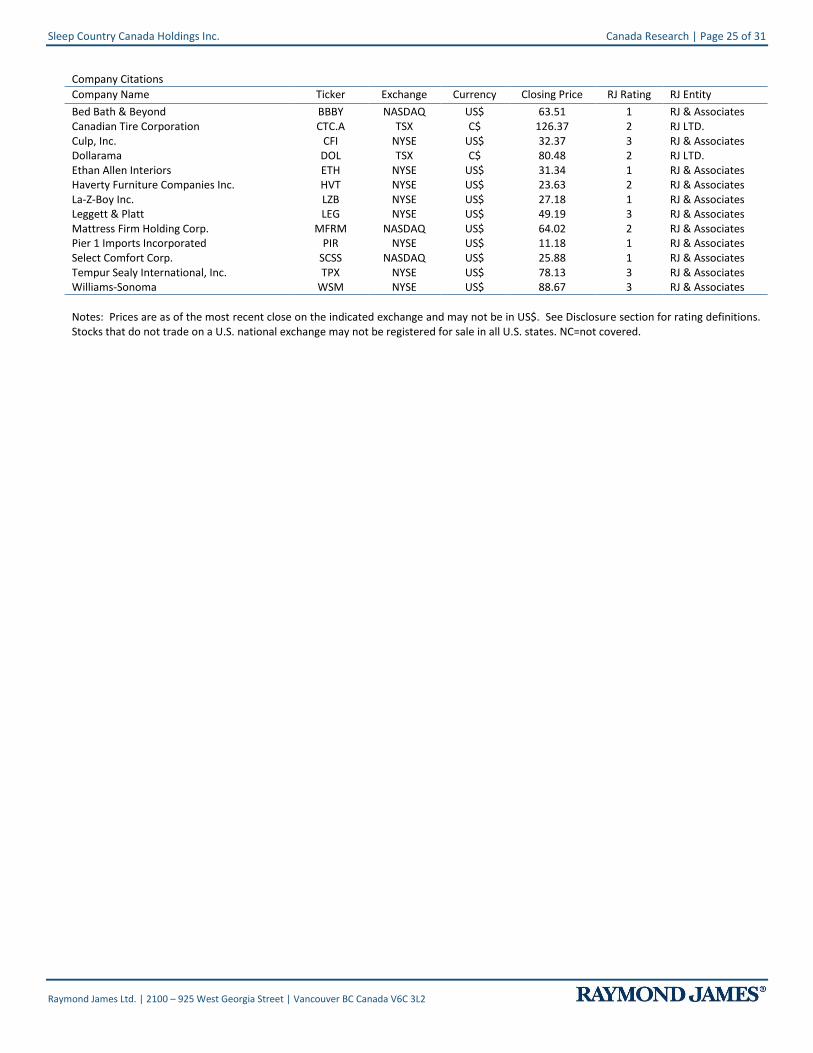
Company Citations
Company Name Ticker Exchange Currency Closing Price RJ Rating RJ Entity
Bed Bath & Beyond BBBY NASDAQ US$ 63.51 1 RJ & Associates Canadian Tire Corporation CTC.A TSX C$ 126.37 2 RJ LTD. Culp, Inc. CFI NYSE US$ 32.37 3 RJ & Associates Dollarama DOL TSX C$ 80.48 2 RJ LTD. Ethan Allen Interiors ETH NYSE US$ 31.34 1 RJ & Associates Haverty Furniture Companies Inc. HVT NYSE US$ 23.63 2 RJ & Associates La-Z-Boy Inc. LZB NYSE US$ 27.18 1 RJ & Associates Leggett & Platt LEG NYSE US$ 49.19 3 RJ & Associates Mattress Firm Holding Corp. MFRM NASDAQ US$ 64.02 2 RJ & Associates Pier 1 Imports Incorporated PIR NYSE US$ 11.18 1 RJ & Associates Select Comfort Corp. SCSS NASDAQ US$ 25.88 1 RJ & Associates Tempur Sealy International, Inc. TPX NYSE US$ 78.13 3 RJ & Associates Williams-Sonoma WSM NYSE US$ 88.67 3 RJ & Associates
Notes: Prices are as of the most recent close on the indicated exchange and may not be in US$. See Disclosure section for rating definitions. Stocks that do not trade on a U.S. national exchange may not be registered for sale in all U.S. states. NC=not covered.
Canada Research | Page 26 of 31 Sleep Country Canada Holdings Inc.
Raymond James Ltd. | 2100 – 925 West Georgia Street | Vancouver BC Canada V6C 3L2
IMPORTANT INVESTOR DISCLOSURES Raymond James & Associates (RJA) is a FINRA member firm and is responsible for the preparation and distribution of research created in the United States. Raymond James & Associates is located at The Raymond James Financial Center, 880 Carillon Parkway, St. Petersburg, FL 33716, (727) 567-1000. Non-U.S. affiliates, which are not FINRA member firms, include the following entities which are responsible for the creation and distribution of research in their respective areas; In Canada, Raymond James Ltd., Suite 2100, 925 West Georgia Street, Vancouver, BC V6C 3L2, (604) 659-8200; In Latin America, Raymond James Latin America, Ruta 8, km 17, 500, 91600 Montevideo, Uruguay, 00598 2 518 2033; In Europe, Raymond James Euro Equities, SAS, 40, rue La Boetie, 75008, Paris, France, +33 1 45 61 64 90, and Raymond James Financial International Ltd., Broadwalk House, 5 Appold Street, London, England EC2A 2AG, +44 203 798 5600.
This document is not directed to, or intended for distribution to or use by, any person or entity that is a citizen or resident of or located in any locality, state, country, or other jurisdiction where such distribution, publication, availability or use would be contrary to law or regulation. The securities discussed in this document may not be eligible for sale in some jurisdictions. This research is not an offer to sell or the solicitation of an offer to buy any security in any jurisdiction where such an offer or solicitation would be illegal. It does not constitute a personal recommendation nor does it take into account the particular investment objectives, financial situations, or needs of individual clients. Information in this report should not be construed as advice designed to meet the individual objectives of any particular investor. Investors should consider this report as only a single factor in making their investment decision. Consultation with your investment advisor is recommended. Past performance is not a guide to future performance, future returns are not guaranteed, and a loss of original capital may occur.
The information provided is as of the date above and subject to change, and it should not be deemed a recommendation to buy or sell any security. Certain information has been obtained from third-party sources we consider reliable, but we do not guarantee that such information is accurate or complete. Persons within the Raymond James family of companies may have information that is not available to the contributors of the information contained in this publication. Raymond James, including affiliates and employees, may execute transactions in the securities listed in this publication that may not be consistent with the ratings appearing in this publication.
With respect to materials prepared by Raymond James Ltd. (“RJL”), all expressions of opinion reflect the judgment of the Research Department of RJL, or its affiliates, at this date and are subject to change. RJL may perform investment banking or other services for, or solicit investment banking business from, any company mentioned in this document.
All Raymond James Ltd. research reports are distributed electronically and are available to clients at the same time via the firm’s website (http://www.raymondjames.ca). Immediately upon being posted to the firm’s website, the research reports are then distributed electronically to clients via email upon request and to clients with access to Bloomberg (home page: RJLC), Capital IQ and Thomson Reuters. Selected research reports are also printed and mailed at the same time to clients upon request. Requests for Raymond James Ltd. research may be made by contacting the Raymond James Product Group during market hours at (604) 659‐8000.
In the event that this is a compendium report (i.e., covers 6 or more subject companies), Raymond James Ltd. may choose to provide specific disclosures for the subject companies by reference. To access these disclosures, clients should refer to: http://www.raymondjames.ca (click on Equity Capital Markets / Equity Research / Research Disclosures) or call toll‐free at 1‐800‐667‐2899.
ANALYST INFORMATION
Analyst Compensation: Equity research analysts and associates at Raymond James are compensated on a salary and bonus system. Several factors enter into the compensation determination for an analyst, including i) research quality and overall productivity, including success in rating stocks on an absolute basis and relative to the local exchange composite Index and/or a sector index, ii) recognition from institutional investors, iii) support effectiveness to the institutional and retail sales forces and traders, iv) commissions generated in stocks under coverage that are attributable to the analyst’s efforts, v) net revenues of the overall Equity Capital Markets Group, and vi) compensation levels for analysts at competing investment dealers.
Analyst Stock Holdings: Effective September 2002, Raymond James equity research analysts and associates or members of their households are forbidden from investing in securities of companies covered by them. Analysts and associates are permitted to hold long positions in the securities of companies they cover which were in place prior to September 2002 but are only permitted to sell those positions five days after the rating has been lowered to Underperform.
The views expressed in this report accurately reflect the personal views of the analyst(s) covering the subject securities. No part of said person's compensation was, is, or will be directly or indirectly related to the specific recommendations or views contained in this research report. In addition, said analyst has not received compensation from any subject company in the last 12 months.
RATINGS AND DEFINITIONS
Raymond James Ltd. (Canada) definitions: Strong Buy (SB1) The stock is expected to appreciate and produce a total return of at least 15% and outperform the S&P/TSX Composite Index over the next six months. Outperform (MO2) The stock is expected to appreciate and outperform the S&P/TSX Composite Index over the next twelve months. Market Perform (MP3) The stock is expected to perform
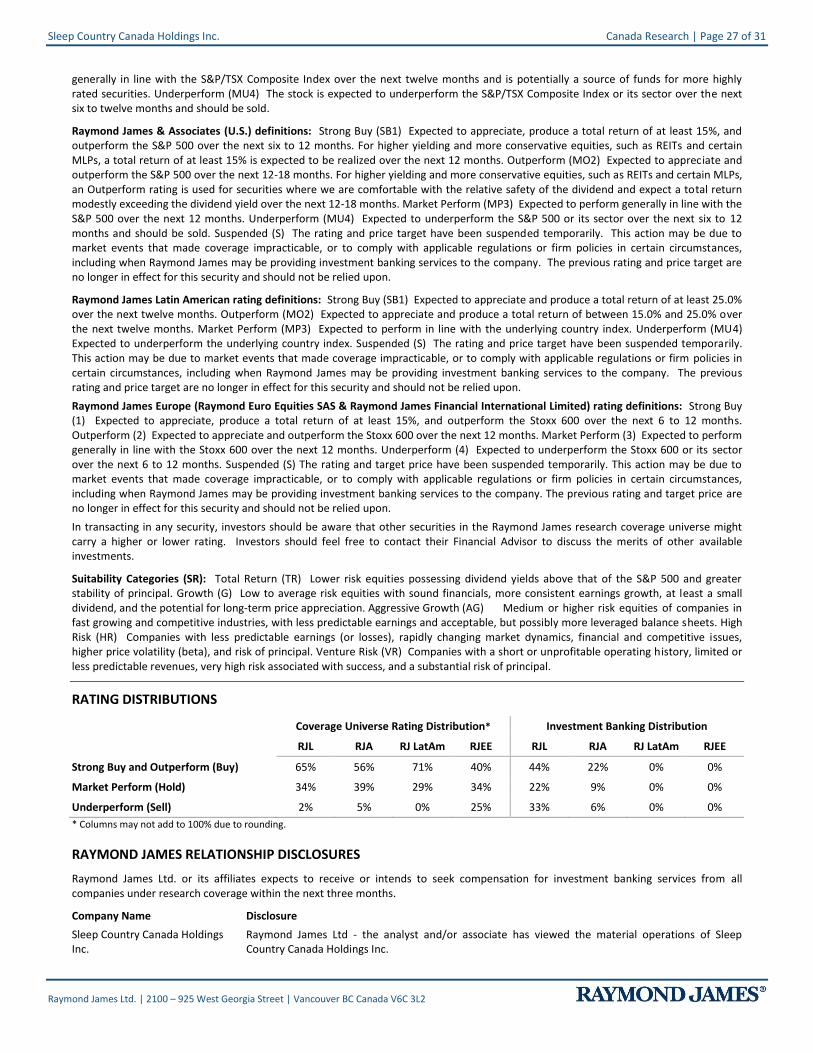
Sleep Country Canada Holdings Inc. Canada Research | Page 27 of 31
Raymond James Ltd. | 2100 – 925 West Georgia Street | Vancouver BC Canada V6C 3L2
generally in line with the S&P/TSX Composite Index over the next twelve months and is potentially a source of funds for more highly rated securities. Underperform (MU4) The stock is expected to underperform the S&P/TSX Composite Index or its sector over the next six to twelve months and should be sold.
Raymond James & Associates (U.S.) definitions: Strong Buy (SB1) Expected to appreciate, produce a total return of at least 15%, and outperform the S&P 500 over the next six to 12 months. For higher yielding and more conservative equities, such as REITs and certain MLPs, a total return of at least 15% is expected to be realized over the next 12 months. Outperform (MO2) Expected to appreciate and outperform the S&P 500 over the next 12-18 months. For higher yielding and more conservative equities, such as REITs and certain MLPs, an Outperform rating is used for securities where we are comfortable with the relative safety of the dividend and expect a total return modestly exceeding the dividend yield over the next 12-18 months. Market Perform (MP3) Expected to perform generally in line with the S&P 500 over the next 12 months. Underperform (MU4) Expected to underperform the S&P 500 or its sector over the next six to 12 months and should be sold. Suspended (S) The rating and price target have been suspended temporarily. This action may be due to market events that made coverage impracticable, or to comply with applicable regulations or firm policies in certain circumstances, including when Raymond James may be providing investment banking services to the company. The previous rating and price target are no longer in effect for this security and should not be relied upon.
Raymond James Latin American rating definitions: Strong Buy (SB1) Expected to appreciate and produce a total return of at least 25.0% over the next twelve months. Outperform (MO2) Expected to appreciate and produce a total return of between 15.0% and 25.0% over the next twelve months. Market Perform (MP3) Expected to perform in line with the underlying country index. Underperform (MU4) Expected to underperform the underlying country index. Suspended (S) The rating and price target have been suspended temporarily. This action may be due to market events that made coverage impracticable, or to comply with applicable regulations or firm policies in certain circumstances, including when Raymond James may be providing investment banking services to the company. The previous rating and price target are no longer in effect for this security and should not be relied upon.
Raymond James Europe (Raymond Euro Equities SAS & Raymond James Financial International Limited) rating definitions: Strong Buy (1) Expected to appreciate, produce a total return of at least 15%, and outperform the Stoxx 600 over the next 6 to 12 months. Outperform (2) Expected to appreciate and outperform the Stoxx 600 over the next 12 months. Market Perform (3) Expected to perform generally in line with the Stoxx 600 over the next 12 months. Underperform (4) Expected to underperform the Stoxx 600 or its sector over the next 6 to 12 months. Suspended (S) The rating and target price have been suspended temporarily. This action may be due to market events that made coverage impracticable, or to comply with applicable regulations or firm policies in certain circumstances, including when Raymond James may be providing investment banking services to the company. The previous rating and target price are no longer in effect for this security and should not be relied upon.
In transacting in any security, investors should be aware that other securities in the Raymond James research coverage universe might carry a higher or lower rating. Investors should feel free to contact their Financial Advisor to discuss the merits of other available investments.
Suitability Categories (SR): Total Return (TR) Lower risk equities possessing dividend yields above that of the S&P 500 and greater stability of principal. Growth (G) Low to average risk equities with sound financials, more consistent earnings growth, at least a small dividend, and the potential for long-term price appreciation. Aggressive Growth (AG) Medium or higher risk equities of companies in fast growing and competitive industries, with less predictable earnings and acceptable, but possibly more leveraged balance sheets. High Risk (HR) Companies with less predictable earnings (or losses), rapidly changing market dynamics, financial and competitive issues, higher price volatility (beta), and risk of principal. Venture Risk (VR) Companies with a short or unprofitable operating history, limited or less predictable revenues, very high risk associated with success, and a substantial risk of principal.
RATING DISTRIBUTIONS
Coverage Universe Rating Distribution* Investment Banking Distribution
RJL RJA RJ LatAm RJEE RJL RJA RJ LatAm RJEE
Strong Buy and Outperform (Buy) 65% 56% 71% 40% 44% 22% 0% 0%
Market Perform (Hold) 34% 39% 29% 34% 22% 9% 0% 0%
Underperform (Sell) 2% 5% 0% 25% 33% 6% 0% 0%
* Columns may not add to 100% due to rounding.
RAYMOND JAMES RELATIONSHIP DISCLOSURES
Raymond James Ltd. or its affiliates expects to receive or intends to seek compensation for investment banking services from all companies under research coverage within the next three months.
Company Name Disclosure
Sleep Country Canada Holdings Inc.
Raymond James Ltd - the analyst and/or associate has viewed the material operations of Sleep Country Canada Holdings Inc.
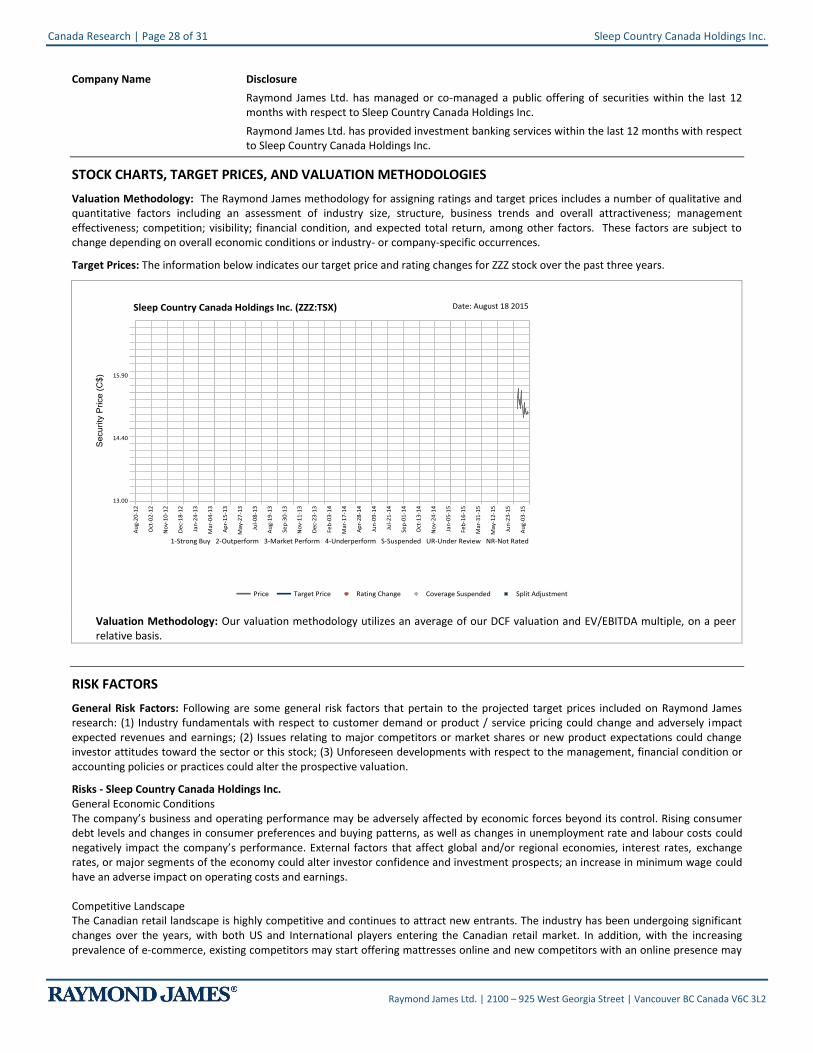
Canada Research | Page 28 of 31 Sleep Country Canada Holdings Inc.
Raymond James Ltd. | 2100 – 925 West Georgia Street | Vancouver BC Canada V6C 3L2
Company Name Disclosure
Raymond James Ltd. has managed or co-managed a public offering of securities within the last 12 months with respect to Sleep Country Canada Holdings Inc.
Raymond James Ltd. has provided investment banking services within the last 12 months with respect to Sleep Country Canada Holdings Inc.
STOCK CHARTS, TARGET PRICES, AND VALUATION METHODOLOGIES
Valuation Methodology: The Raymond James methodology for assigning ratings and target prices includes a number of qualitative and quantitative factors including an assessment of industry size, structure, business trends and overall attractiveness; management effectiveness; competition; visibility; financial condition, and expected total return, among other factors. These factors are subject to change depending on overall economic conditions or industry- or company-specific occurrences.
Target Prices: The information below indicates our target price and rating changes for ZZZ stock over the past three years.
Valuation Methodology: Our valuation methodology utilizes an average of our DCF valuation and EV/EBITDA multiple, on a peer relative basis.
RISK FACTORS
General Risk Factors: Following are some general risk factors that pertain to the projected target prices included on Raymond James research: (1) Industry fundamentals with respect to customer demand or product / service pricing could change and adversely impact expected revenues and earnings; (2) Issues relating to major competitors or market shares or new product expectations could change investor attitudes toward the sector or this stock; (3) Unforeseen developments with respect to the management, financial condition or accounting policies or practices could alter the prospective valuation.
Risks - Sleep Country Canada Holdings Inc. General Economic Conditions The company’s business and operating performance may be adversely affected by economic forces beyond its control. Rising consumer debt levels and changes in consumer preferences and buying patterns, as well as changes in unemployment rate and labour costs could negatively impact the company’s performance. External factors that affect global and/or regional economies, interest rates, exchange rates, or major segments of the economy could alter investor confidence and investment prospects; an increase in minimum wage could have an adverse impact on operating costs and earnings. Competitive Landscape The Canadian retail landscape is highly competitive and continues to attract new entrants. The industry has been undergoing significant changes over the years, with both US and International players entering the Canadian retail market. In addition, with the increasing prevalence of e-commerce, existing competitors may start offering mattresses online and new competitors with an online presence may
Sleep Country Canada Holdings Inc. Canada Research | Page 29 of 31
Raymond James Ltd. | 2100 – 925 West Georgia Street | Vancouver BC Canada V6C 3L2
enter the bedding market. An increase in competition, both in-store and online, may result in price wars, market share loss, and reduced sales and profitability. Seasonality and Weather Retail mattress sales are subject to seasonal patterns, with the highest level of sales occurring in the second half of the year. Variable costs, such as certain selling costs and employee wages, can be managed to match seasonal fluctuations. A large portion of retail costs, such as ret, are fixed and cannot be adjusted to match seasonal demand. Unseasonable weather can result in lower traffic to Sleep Country and Dourmez-vous? stores and deter consumer spending. Supply Chain Disruption Disruptions or delays in store inventory replenishment could negatively impact operations and profitability. Factors resulting in disruptions of supply chain could include, but are not limited to, shipping slowdown or disruption due to extreme weather conditions. Product Cost and Inflation The company’s operating results may be adversely affected by the prices of the components used in the manufacture of the mattress and complementary sleep related products and accessories it sells. These prices may fluctuate based on a number of factors outside the company’s control, such as the price of oil, changes in supply and demand, general economic conditions and consumer spending, labour costs, competition, import duties and tariffs. Foreign Currency A portion of the company’s merchandize purchases are denominated in USD. As a portion of the company’s purchases are made in US dollars, unfavourable currency fluctuations relative to the Canadian dollar may adversely impact the company’s profitability. Sleep Country currently has no hedging instruments in place to mitigate the impact of fluctuating foreign exchange rates.
Additional Risk and Disclosure information, as well as more information on the Raymond James rating system and suitability categories, is available for Raymond James at rjcapitalmarkets.com/Disclosures/index and for Raymond James Limited at www.raymondjames.ca/researchdisclosures.
INTERNATIONAL DISCLOSURES
FOR CLIENTS IN THE UNITED STATES:
Any foreign securities discussed in this report are generally not eligible for sale in the U.S. unless they are listed on a U.S. exchange. This report is being provided to you for informational purposes only and does not represent a solicitation for the purchase or sale of a security in any state where such a solicitation would be illegal. Investing in securities of issuers organized outside of the U.S., including ADRs, may entail certain risks. The securities of non-U.S. issuers may not be registered with, nor be subject to the reporting requirements of, the U.S. Securities and Exchange Commission. There may be limited information available on such securities. Investors who have received this report may be prohibited in certain states or other jurisdictions from purchasing the securities mentioned in this report. Please ask your Financial Advisor for additional details and to determine if a particular security is eligible for purchase in your state.
Raymond James Ltd. is not a U.S. broker‐dealer and therefore is not governed by U.S. laws, rules or regulations applicable to U.S. broker‐dealers. Consequently, the persons responsible for the content of this publication are not licensed in the U.S. as research analysts in accordance with applicable rules promulgated by the U.S. Self Regulatory Organizations.
Any U.S. Institutional Investor wishing to effect trades in any security should contact Raymond James (USA) Ltd., a U.S. broker‐dealer affiliate of Raymond James Ltd.
FOR CLIENTS IN THE UNITED KINGDOM:
For clients of Raymond James & Associates (London Branch) and Raymond James Financial International Limited (RJFI): This document and any investment to which this document relates is intended for the sole use of the persons to whom it is addressed, being persons who are Eligible Counterparties or Professional Clients as described in the FCA rules or persons described in Articles 19(5) (Investment professionals) or 49(2) (High net worth companies, unincorporated associations etc) of the Financial Services and Markets Act 2000 (Financial Promotion) Order 2005 (as amended) or any other person to whom this promotion may lawfully be directed. It is not intended to be distributed or passed on, directly or indirectly, to any other class of persons and may not be relied upon by such persons and is therefore not intended for private individuals or those who would be classified as Retail Clients.
For clients of Raymond James Investment Services, Ltd.: This report is for the use of professional investment advisers and managers and is not intended for use by clients.
For purposes of the Financial Conduct Authority requirements, this research report is classified as independent with respect to conflict of interest management. RJA, RJFI, and Raymond James Investment Services, Ltd. are authorised and regulated by the Financial Conduct Authority in the United Kingdom.
Canada Research | Page 30 of 31 Sleep Country Canada Holdings Inc.
Raymond James Ltd. | 2100 – 925 West Georgia Street | Vancouver BC Canada V6C 3L2
FOR CLIENTS IN FRANCE:
This document and any investment to which this document relates is intended for the sole use of the persons to whom it is addressed, being persons who are Eligible Counterparties or Professional Clients as described in “Code Monétaire et Financier” and Règlement Général de l’Autorité des Marchés Financiers. It is not intended to be distributed or passed on, directly or indirectly, to any other class of persons and may not be relied upon by such persons and is therefore not intended for private individuals or those who would be classified as Retail Clients.
For clients of Raymond James Euro Equities: Raymond James Euro Equities is authorised and regulated by the Autorité de Contrôle Prudentiel et de Résolution and the Autorité des Marchés Financiers.
For institutional clients in the European Economic Area (EEA) outside of the United Kingdom: This document (and any attachments or exhibits hereto) is intended only for EEA institutional clients or others to whom it may lawfully be submitted.
Raymond James Euro Equities is a French Investment Services Provider authorized by the Autorité de contrôle prudentiel et de résolution and regulated by the Autorité de contrôle prudentiel et de résolution and the Autorité des Marchés Financiers. For non-European exchanges, Raymond James Euro Equities operates under the name Raymond James International.
Proprietary Rights Notice: By accepting a copy of this report, you acknowledge and agree as follows:
This report is provided to clients of Raymond James only for your personal, noncommercial use. Except as expressly authorized by Raymond James, you may not copy, reproduce, transmit, sell, display, distribute, publish, broadcast, circulate, modify, disseminate or commercially exploit the information contained in this report, in printed, electronic or any other form, in any manner, without the prior express written consent of Raymond James. You also agree not to use the information provided in this report for any unlawful purpose.
This report and its contents are the property of Raymond James and are protected by applicable copyright, trade secret or other intellectual property laws (of the United States and other countries). United States law, 17 U.S.C. Sec.501 et seq, provides for civil and criminal penalties for copyright infringement. No copyright claimed in incorporated U.S. government works.
Additional information is available upon request. This document may not be reprinted without permission.
RJL is a member of the Canadian Investor Protection Fund. ©2015 Raymond James Ltd.
Sleep Country Canada Holdings Inc. Canada Research | Page 31 of 31
Raymond James Ltd. | 2100 – 925 West Georgia Street | Vancouver BC Canada V6C 3L2
RAYMOND JAMES LTD. CANADIAN INSTITUTIONAL EQUITY TEAM WWW.RAYMONDJAMES.CA EQUITY RESEARCH HEAD OF EQUITY RESEARCH
DARYL SWETLISHOFF, CFA 604.659.8246
CONSUMER
CONSUMER & RETAIL KENRIC TYGHE, MBA 416.777.7188 KRISZTINA KATAI (ASSOCIATE) 416.777.7060
ENERGY
OIL & GAS ENERGY SERVICES, HEAD OF ENERGY RESEARCH ANDREW BRADFORD, CFA 403.509.0503 TIM MONACHELLO (ASSOCIATE) 403.509.0562 MICHAEL SHAW (JR ASSOCIATE) 403.509.0534
OIL & GAS PRODUCERS KURT MOLNAR 403.221.0414 BRADEN PURKIS (SR ASSOCIATE) 403.509.0518 GORDON STEPPAN, CFA (SR ASSOCIATE) 403.221.0411
SR. OIL & GAS PRODUCERS | ENERGY INFRASTRUCTURE CHRIS COX, CFA 403.509.0523 MICHAEL BARTH (ASSOCIATE) 403.509.0511
INDUSTRIAL & TRANSPORTATION
INDUSTRIAL | TRANSPORTATION, HEAD OF INDUSTRIAL RESEARCH BEN CHERNIAVSKY 604.659.8244 THEONI PILARINOS, CFA 604.659.8234 EDWARD GUDEWILL (ASSOCIATE) 604.659.8280
INFRASTRUCTURE & CONSTRUCTION FREDERIC BASTIEN, CFA 604.659.8232 SAMIR GHAFIR (ASSOCIATE) 604.659.8470
TRANSPORTATION | AGRIBUSINESS & FOOD PRODUCTS STEVE HANSEN, CMA, CFA 604.659.8208 DANIEL CHEW (ASSOCIATE) 604.659.8238
MINING
BASE & PRECIOUS METALS ALEX TERENTIEW, MBA, P.GEO 416.777.4912 JEAN-CHRISTOPHE PARISIEN-LA SALLE (ASSOCIATE) 416.777.7144
PRECIOUS METALS PHIL RUSSO 416.777.7084
PRECIOUS METALS CHRIS THOMPSON, M.SC. (ENG), P.GEO 604.659.8439 BRIAN MARTIN, CFA (ASSOCIATE) 604.654.1236
URANIUM | JR EXPLORATION & DEVELOPMENT DAVID SADOWSKI 604.659.8255 MILTON-ANDRES BERNAL (ASSOCIATE) 604.659.8028
FINANCIAL SERVICES
DIVERSIFIED FINANCIALS MICHAEL OVERVELDE, CFA, CPA, CA 416.777.4943 BRENNA PHELAN, CFA, CPA, CA (ASSOCIATE) 416.777.7042
FOREST PRODUCTS
FOREST PRODUCTS DARYL SWETLISHOFF, CFA 604.659.8246 DAVID QUEZADA, CFA (ASSOCIATE ANALYST) 604.659.8257
REAL ESTATE
REAL ESTATE & REITS KEN AVALOS, MBA 727.567.1756 JOHANN RODRIGUES (ASSOCIATE ANALYST) 416.777.7189
TECHNOLOGY & COMMUNICATIONS
TECHNOLOGY, ALTERNATIVE ENERGY & CLEAN TECH STEVEN LI, CFA 416.777.4918 JONATHAN LO (ASSOCIATE) 416.777.6414
EQUITY RESEARCH PUBLISHING SENIOR SUPERVISORY ANALYST
HEATHER HERRON 403.509.0509 HEAD OF PUBLISHING | SUPERVISORY ANALYST
CYNTHIA LUI 604.659.8210
TYLER BOS (SUPERVISORY ANALYST | EDITOR) 416.777.4948 INDER GILL (RESEARCH EDITOR) 604.659.8202 KATE MAJOR (RESEARCH PRINCIPAL | EDITOR) 416.777.7173 CHRISTINE MARTE (RESEARCH EDITOR) 604.659.8200 ASHLEY RAMSAY (SUPERVISORY ANALYST |EDITOR) 604.659.8226
INSTITUTIONAL EQUITY SALES HEAD OF SALES
MIKE WESTCOTT 416.777.4935 GREG JACKSON (ECM, BUSINESS MANAGER) 416.777.7172 MICHELLE MARGUET ( ECM, INSTITUTIONAL MARKETING) 416.777.4951
TORONTO (CAN 1.888.601.6105 | USA 1.800.290.4847)
LAURA ARRELL (U.S. EQUITIES) 416.777.4920 SEAN BOYLE 416.777.4927 JEFF CARRUTHERS, CFA 416.777.4929 RICHARD EAKINS 416.777.4926 JONATHAN GREER 416.777.4930 DAVE MACLENNAN 416.777.4934 ROBERT MILLS, CFA 416.777.4945 BRADY PIMLOTT (ASSOCIATE) 416.777.4993 NICOLE SVEC-GRIFFIS, CFA (U.S. EQUITIES) 416.777.4942 NEIL WEBER 416.777.4931 ORNELLA BURNS (ASSISTANT) 416.777.4928 SATBIR CHATRATH (ASSISTANT) 416.777.4915
VANCOUVER (1.800.667.2899)
SCOT ATKINSON, CFA 604.659.8225 NICK POCRNIC 604.659.8230 TERRI MCEWAN (ASSISTANT) 604.659.8228
MONTREAL (514.350.4450 | 1.866.350.4455)
JOHN HART 514.350.4462 DAVID MAISLIN, CFA 514.350.4460 TANYA HATCHER (ASSISTANT) 514.350.4458
LONDON
ADAM WOOD 0.207.426.5612
INSTITUTIONAL EQUITY TRADING
CO-HEAD OF TRADING BOB MCDONALD, CFA 604.659.8222 ANDREW FOOTE, CFA 416.777.4924
TORONTO (CANADA 1.888.601.6105 | USA 1.800.290.4847) PAM BANKS 416.777.4923 OLIVER HERBST 416.777.4947 ANDY HERRMANN 416.777.4937 ERIC MUNRO, CFA 416.777.4983 JAMES SHIELDS 416.777.4941 BOB STANDING 416.777.4921 PETER MASON (ASSISTANT) 416.777.7195
VANCOUVER (1.800.667.2899) NAV CHEEMA 604.659.8224 FRASER JEFFERSON 604.659.8218 DEREK ORAM 604.659.8223
MONTREAL (514.350.4450 | 1.866.350.4455) JOE CLEMENT 514.350.4470 PATRICK SANCHE 514.350.4465
INSTITUTIONAL EQUITY OFFICES
Calgary Suite 4250 525 8th Avenue SW Calgary, AB T2P 1G1 403.509.0500
Montreal Suite 3000 1800 McGill College Montreal, PQ H3A 3J6 514.350.4450 Toll Free: 1.866.350.4455
Vancouver Suite 2100 925 West Georgia Street Vancouver, BC V6C 3L2 604.659.8000 Toll Free: 1.800.667.2899
Toronto Suite 5400, Scotia Plaza 40 King Street West Toronto, ON M5H 3Y2 416.777.4900 Toll Free Canada: .888.601.6105 Toll Free USA: 1.800.290.4847
International Headquarters The Raymond James Financial Center 880 Carillon Parkway St.Petersburg, FL USA 33716 727.567.1000