Embed Size (px)
Citation preview
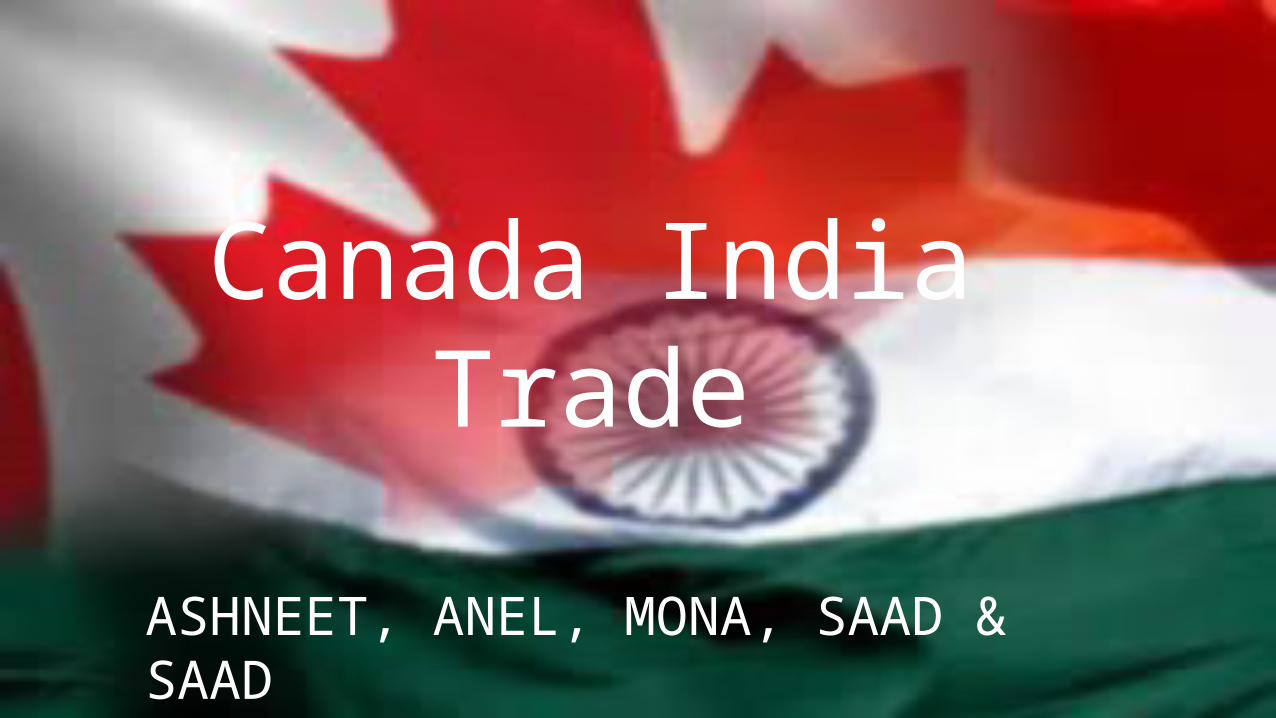
Canada India Trade
ASHNEET, ANEL, MONA, SAAD & SAAD
Introduction
This report will analyze the trade between Canada and India. It will discuss the amount and percentage of trade through exports, imports and trade balance along with the historical growth, trade agreements, barriers of trade, and prospects of trade.
It will conclude that over the past 10 years the trade between Canada and India has increased by over 70% that represents the potential growth of development in the future.
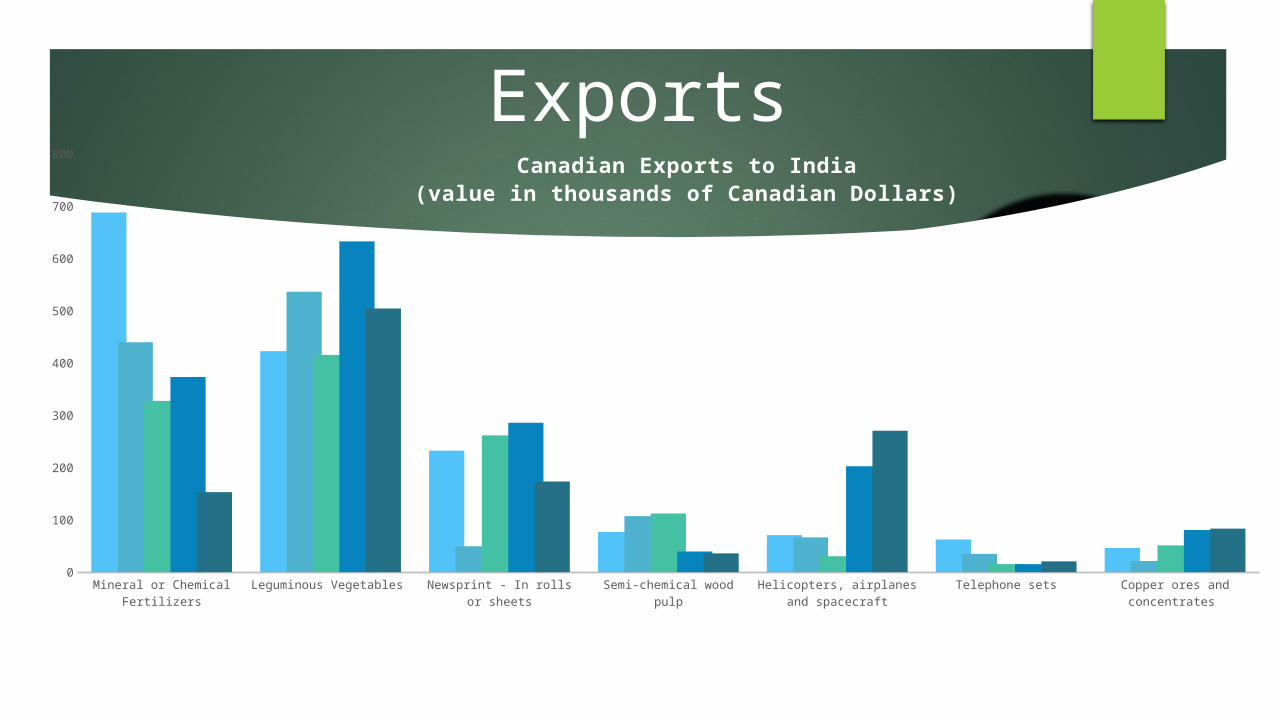
Exports
Mineral or Chemical Fertil-izers
Leguminous Vegetables Newsprint - In rolls or sheets
Semi-chemical wood pulp Helicopters, airplanes and spacecraft
Telephone sets Copper ores and concen-trates
2008 688.024 422.819 232.339 76.672 70.653 62.2 46.031
2009 439.891 536.387 49.551 107.074 66.406 34.941 21.2
2010 327.497 415.55 261.437 112.105 30.326 15.088 51.128
2011 373.402 632.675 285.795 39.353 202.538 15.343 80.497
2012 152.965 504.384 173.297 35.805 270.328 20.583 83.097
50
150
250
350
450
550
650
750Canadian Exports to India
(value in thousands of Canadian Dollars)
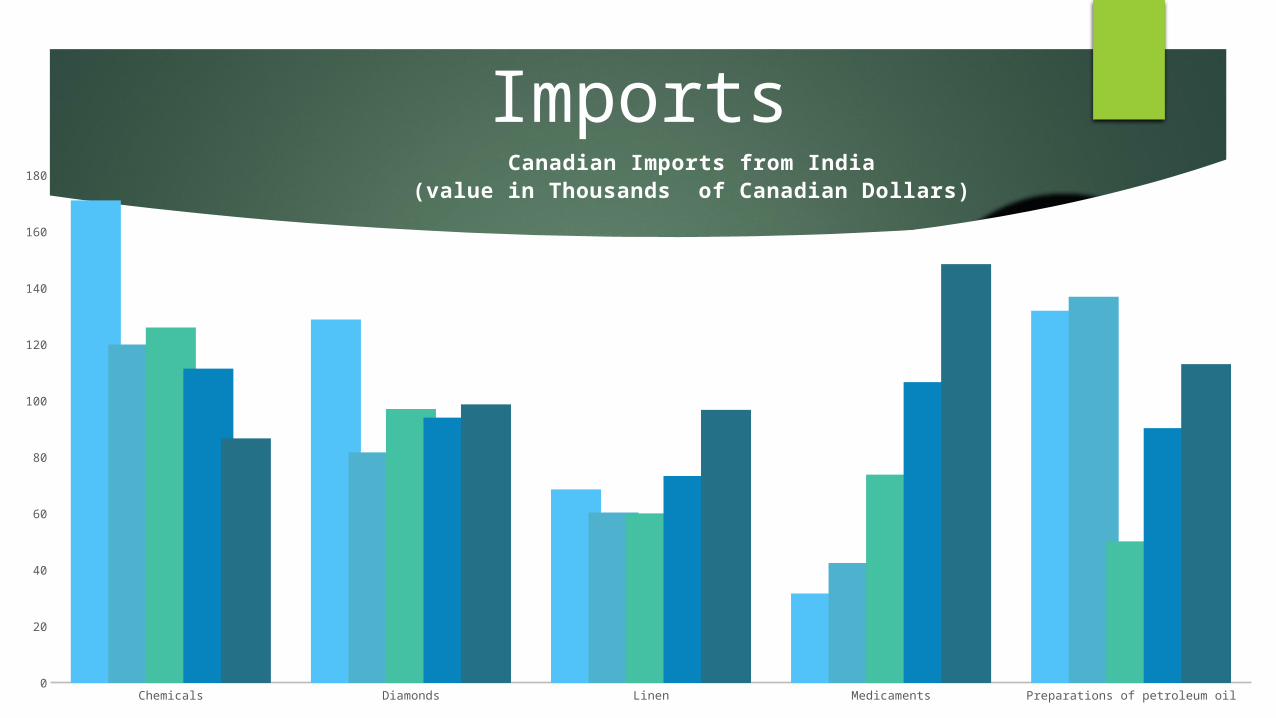
Imports
Chemicals Diamonds Linen Medicaments Preparations of petroleum oil
2008 171.186 128.922 68.64 31.717 132
2009 120.045 81.754 60.428 42.536 137
2010 126.088 97.171 60.111 73.86 50.219
2011 111.487 94.1 73.375 106.687 90.386
2012 86.75 98.811 96.854 148.543 113.087
10
30
50
70
90
110
130
150
170
Canadian Imports from India(value in Thousands of Canadian Dollars)
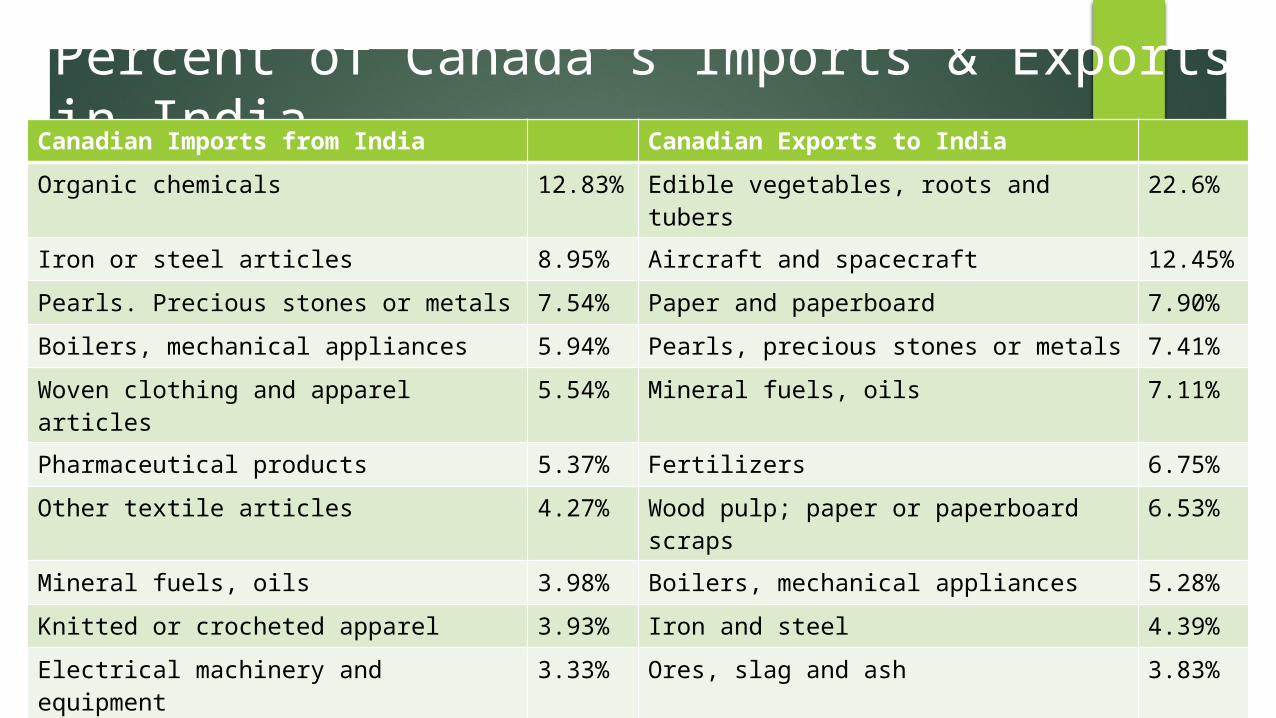
Percent of Canada’s Imports & Exports in IndiaCanadian Imports from India Canadian Exports to India
Organic chemicals 12.83% Edible vegetables, roots and tubers 22.6%
Iron or steel articles 8.95% Aircraft and spacecraft 12.45%
Pearls. Precious stones or metals 7.54% Paper and paperboard 7.90%
Boilers, mechanical appliances 5.94% Pearls, precious stones or metals 7.41%
Woven clothing and apparel articles 5.54% Mineral fuels, oils 7.11%
Pharmaceutical products 5.37% Fertilizers 6.75%
Other textile articles 4.27% Wood pulp; paper or paperboard scraps 6.53%
Mineral fuels, oils 3.98% Boilers, mechanical appliances 5.28%
Knitted or crocheted apparel 3.93% Iron and steel 4.39%
Electrical machinery and equipment 3.33% Ores, slag and ash 3.83%
Top 10 as % of Total from India 61.67% Top 10 as % of Total to India 83.80%
Indian Imports as % of Canadian Total 0.62% Indian Exports as % of Canadian Total 0.53%
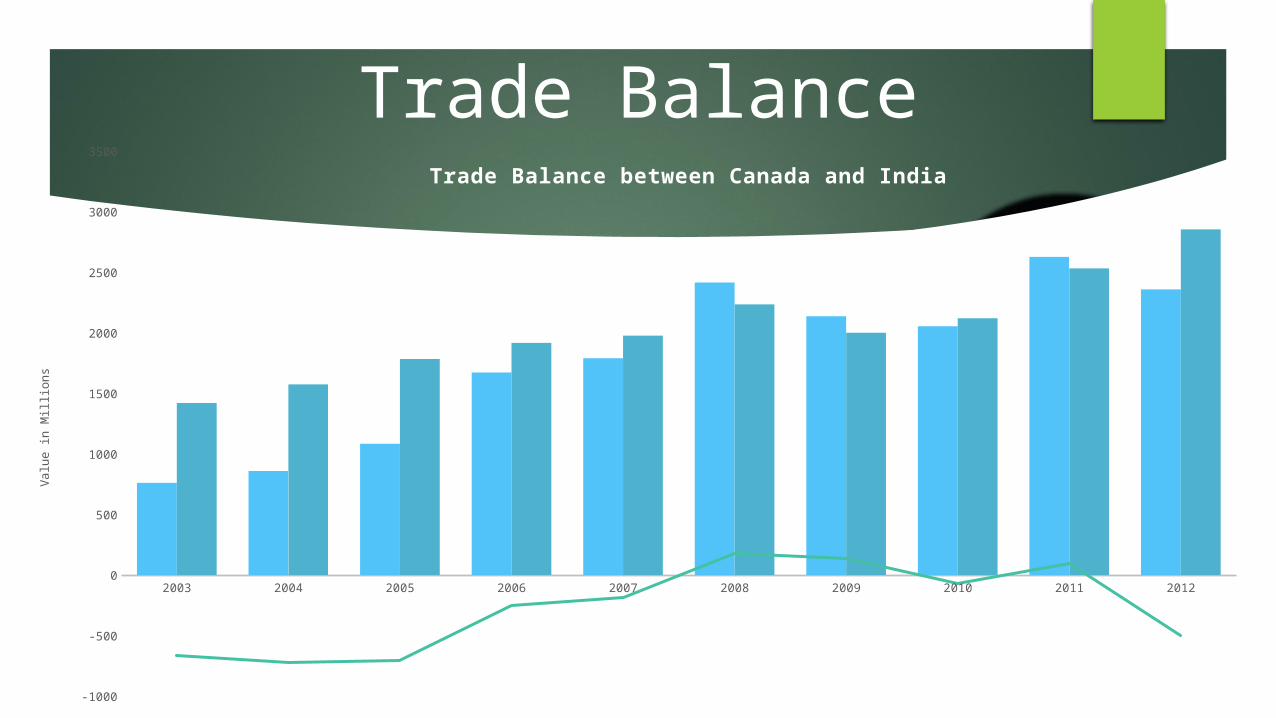
Trade Balance
2003 2004 2005 2006 2007 2008 2009 2010 2011 2012 2003 2004 2005 2006 2007 2008 2009 2010 2011 2012
Total Exports
763 861 1087 1675 1792 2418 2139 2057 2629 2361
Total Imports
1423 1577 1786 1919 1979 2237 2003 2123 2534 2856
Trade Balance
-660 -716 -699 -245 -187 181 136 -66 95 -496
-750
-250
250
750
1250
1750
2250
2750
3250
Trade Balance between Canada and India
Valu
e in
Mill
ion
s
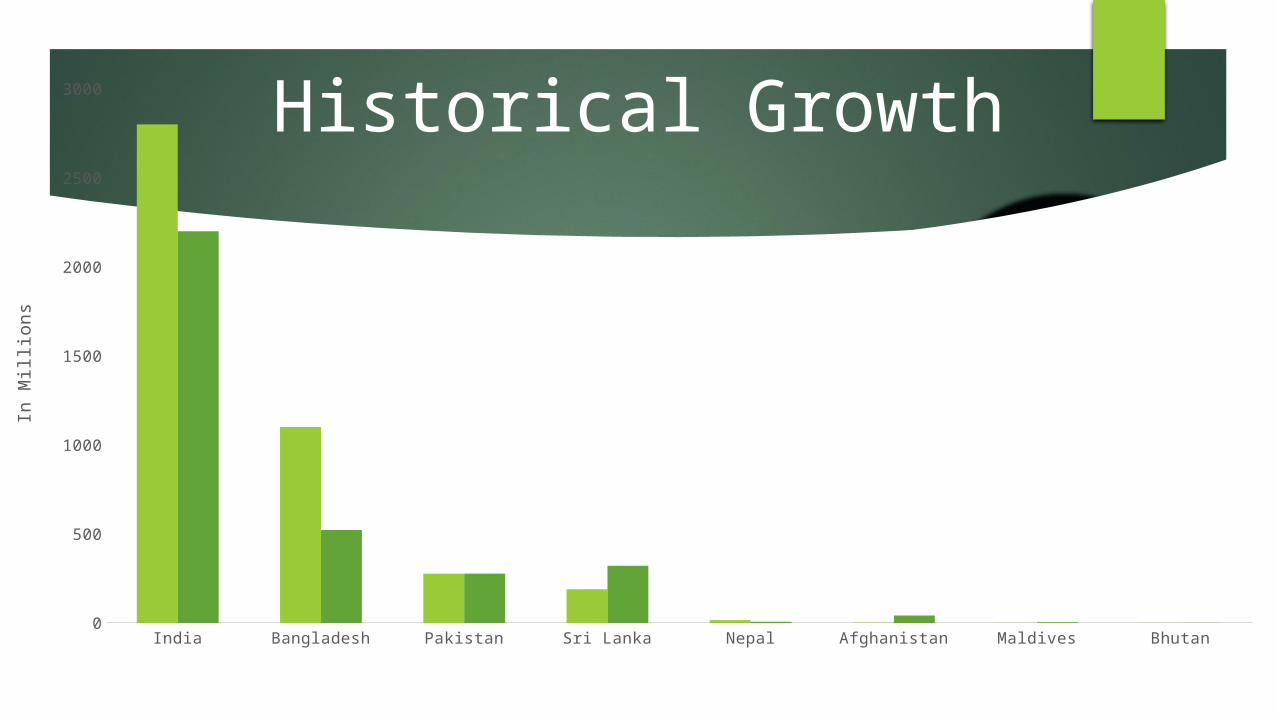
Historical Growth
India Bangladesh Pakistan Sri Lanka Nepal Afghanistan Maldives Bhutan
Imports 2800 1100 277 189 15.7 1.6 0.185 0.052
Exports 2200 522 277 321 6.5 42 4 0.019
250
750
1250
1750
2250
2750
In M
illio
ns
Historical Growth
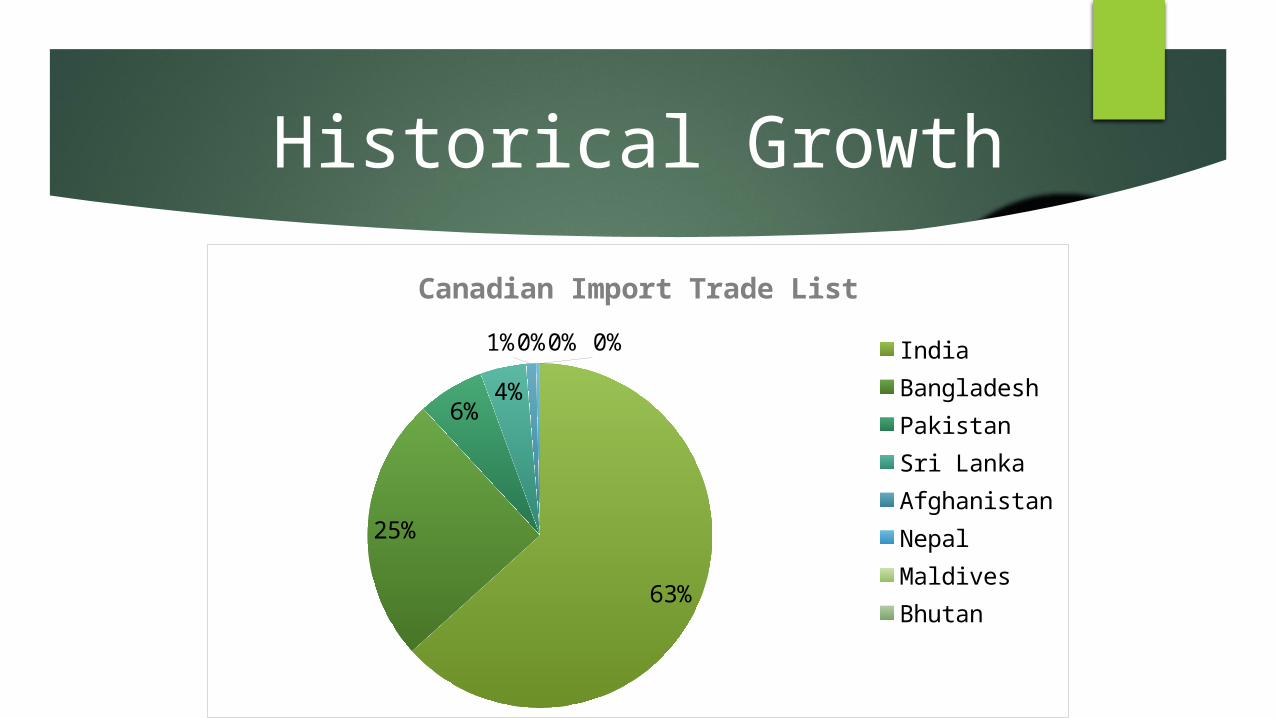
63%
25%
6%
4% 1%0% 0% 0%
Canadian Import Trade List
IndiaBangladesh Pakistan Sri Lanka AfghanistanNepalMaldives Bhutan
Historical Growth
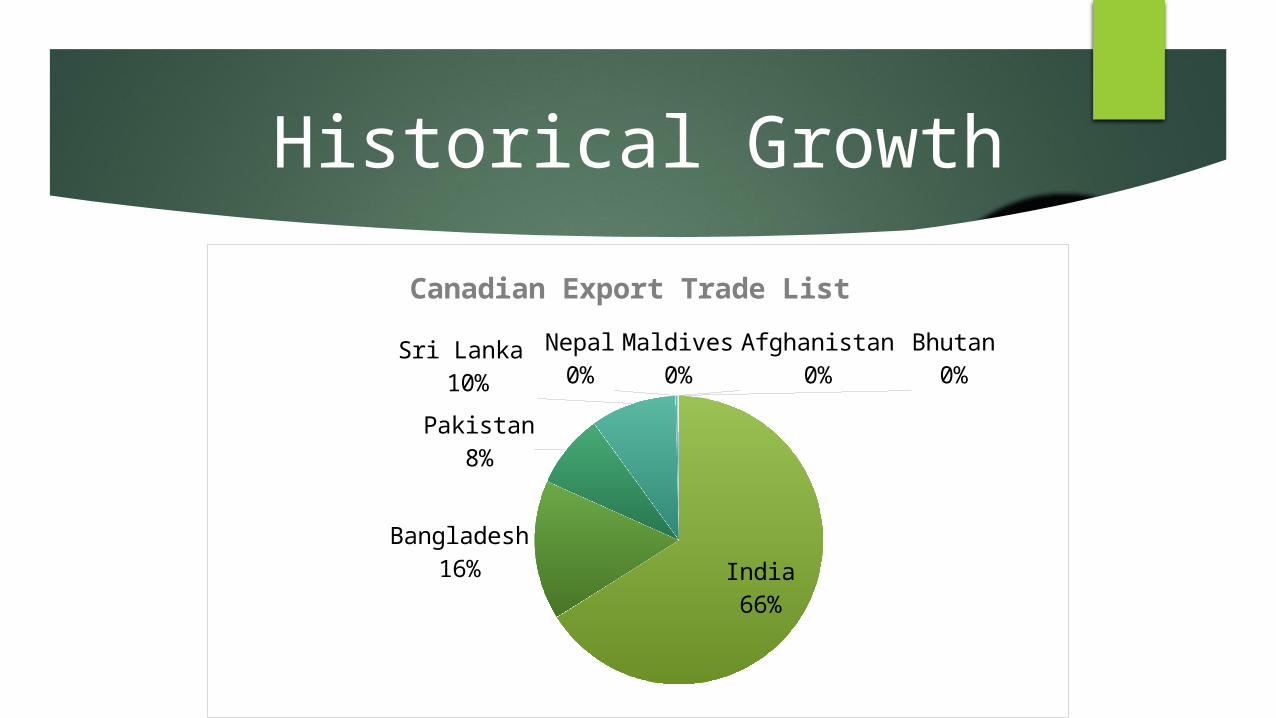
India66%
Bangladesh16%
Pakistan8%
Sri Lanka 10%
Nepal0%
Maldives0%
Afghanistan0%
Bhutan0%
Canadian Export Trade List
Trade Agreement
Barriers of Trade
Implement Swiss formula Tariffs in certain industrial sectors could
be eliminated
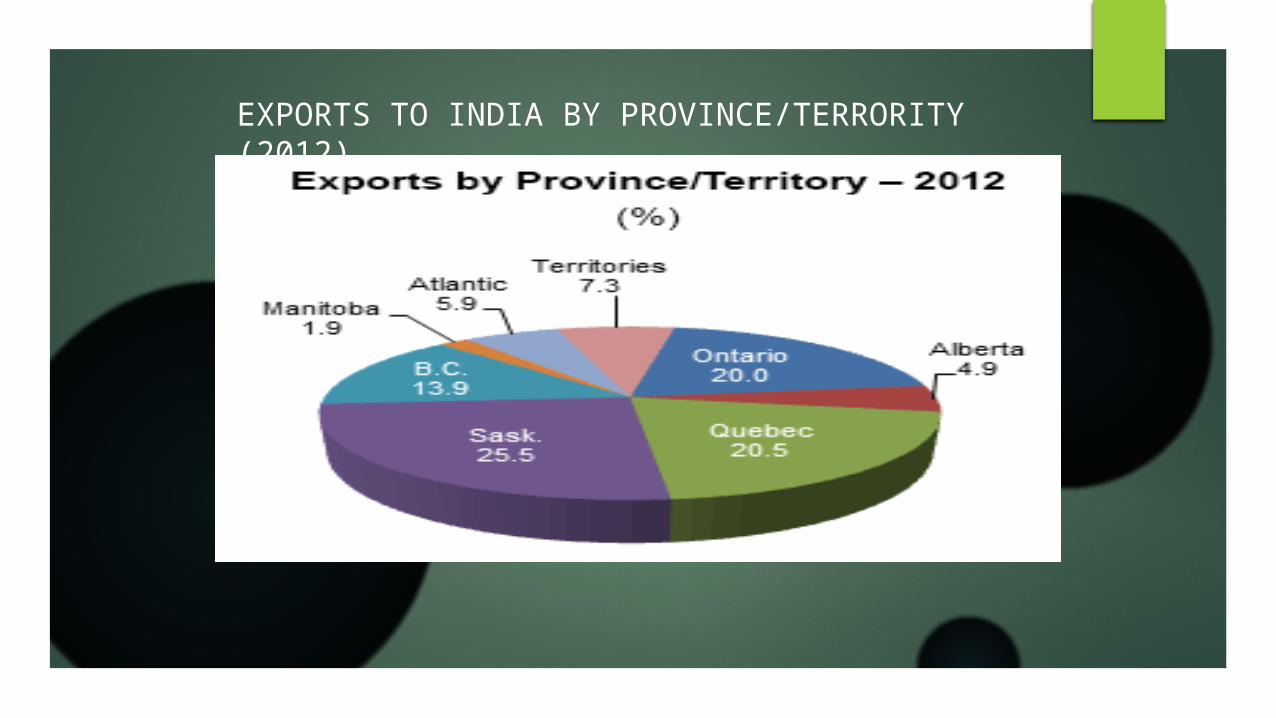
EXPORTS TO INDIA BY PROVINCE/TERRORITY (2012)
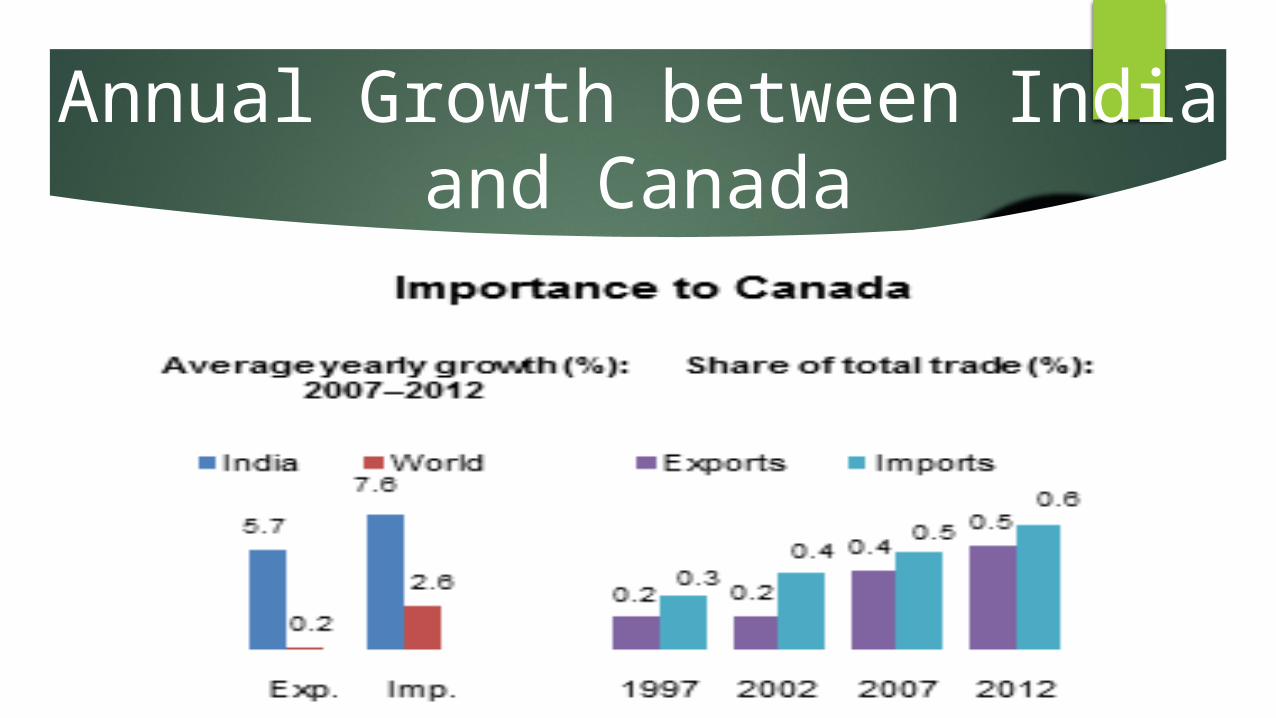
Annual Growth between India and Canada
Foreign Direct Investment
The opportunities The fear of holding back Canadian Investments VS US Investments
Future Relations
The Rupee’s weakness EU Investors FDI could be under speculation
Conclusion Canada’s exports and imports to India have decreased Decrease in deficits and an
increase in surplus despite
Historical growth of trade has increased by 70% over the past 10 years.
Trade Agreement
Imports from India have also increased to over 62%
Foreign direct investment allows 100 percent ownership by foreign investors
![[XLS] · Web viewANEL DA TAMPA REGULAGEM VALVULA - XL250R/TDM/XT225 ANEL DA TAMPA REGULAGEM VALVULA - XLX 250 R ANEL DA VARETA DE OLEO - CG/ML/TUR/NX/BIZ/TW ANEL DE VEDACAO 15,6 X](https://img.pdfslide.us/doc/110x75/5b18cf9c7f8b9a46258c062f/xls-web-viewanel-da-tampa-regulagem-valvula-xl250rtdmxt225-anel-da-tampa.jpg)