Embed Size (px)
Citation preview
Can you google the future? A study on the predictivepower of Google Trends on company shares in the UK.
Finance
Master's thesis
Leo Wuoristo
2012
Department of FinanceAalto UniversitySchool of Business
Powered by TCPDF (www.tcpdf.org)
I
Author Leo Wuoristo
Title of thesis Can you google the future? A study on the predictive power of Google Trends on company
shares in the UK.
Degree Master’s
Degree programme Finance
Thesis advisor Vesa Puttonen
Year of approval 2012 Number of pages 62 (67) Language English
Abstract
Google Trends was released in 2006. The service enables one to see the aggregated search volume for any
defined term. After its release it has gradually been incorporated into academic research from various fields,
most often as a proxy for global attention. The purpose of this study is to analyze how investor attention for a
particular stock ticker, as measured by Internet search frequency, affects its future trade volume and share
price in the UK market. The effect is analyzed separately for different time periods, market capitalization
sizes and industries. In addition the paper looks at how searches originating globally and from the UK differ
in their relation to company shares.
The data used in this study come from two different sources. Financial data is gathered via Datastream,
including weekly share prices and trade volume. Search volume data is gathered manually from Google
Trends for the company’s London Stock Exchange ticker symbol. The final sample consists of 93 firms in the
FTSE AllShare index from 2004 to 2011.
The results indicate that search volume does have predictive power over company shares. Firstly the study
shows that searches for a company ticker have a direct and significant relation to current and future trade
volume. Secondly, using a Fama-Macbeth cross-sectional regression it is proven that search volume predicts
future abnormal returns at the 1%-significance level. A one-standard-deviation increase in abnormal search
volume this week raises abnormal returns next week by 12.5 basis points, while resulting in price reversal in
subsequent weeks. Furthermore the study finds that search volume data originating from the UK is not as
good at predicting share price movement as global search volume.
Keywords Internet search, Investor attention, Google, FTSE, Ticker, Abnormal returns, Retail investor
II
Tekijä Leo Wuoristo
Otsikko Voiko Google ennustaa tulevaisuutta? Tutkimus yrityksen osakekurssin ennustamisesta Google
Trendsin avulla Iso-Britannian markkinoilla..
Tutkinto Maisteri
Ohjelma Rahoitus
Ohjaaja Vesa Puttonen
Hyväksytty 2012 Sivumäärä 62 (67) Kieli Englanti
Tiivistelmä
Google julkaisi Trends-palvelun vuonna 2006. Palvelulla voi hakea minkä tahansa hakusanan hakumäärän
kehityksen. Palvelua on käytetty eri tieteenalojen tutkimuksissa, usein mittarina maailmanlaajuiselle
huomiolle. Tämän tutkimuksen tarkoitus on analysoida, miten sijoittajien huomio tiettyä osakekurssia kohtaan
hakufrekvenssin kehityksellä mitattuna, vaikuttaa osakkeen tulevaisuuden vaihdantaan ja arvon kehitykseen
Iso-Britannian markkinoilla. Vaikutusta tarkastellaan eri ajanjaksoilla, kokoluokissa sekä toimialoilla. Lisäksi
tutkimuksessa vertaillaan, onko kansainvälisillä ja kansallisilla hakusanoilla eroa niiden kyvyssä ennustaa
osakekurssin kehitystä.
Tutkimuksessa käytettävä aineisto on kerätty kahdesta eri lähteestä. Osakekurssiin liittyvät tiedot kuten
viikoittainen osakekurssin hinta ja vaihdanta on haettu Datastream-palvelusta. Hakusana-frekvenssi on
kerätty käsin Google Trends-palvelusta käyttämällä hakusanana yrityksen London Stock Exchange ticker -
symbolia. Lopullinen otanta sisältää yhteensä 93 yritystä FTSE AllShare -indeksistä aikavälillä 2004–2011.
Tulokset osoittavat, että hakusanan hakutiheys ennustaa yrityksen osakekurssia. Tutkimus näyttää toteen,
että yrityksen ticker-symboli haut ennustavat sen tulevaa vaihdantaa. Fama-Macbeth poikkileikkaava
regressiota käyttämällä voidaan todeta, että hakusanat ennustavat osakekurssin kehitystä 1% -
merkittävyysasteella. Yhden keskihajontayksikön lisäys poikkeavaan huomion tänä viikkona ennustaa
12.5 korkopisteen nousua poikkeavissa osakekurssin tuloissa ensi viikolla, mutta seuraavina viikkoina ilmiö
kääntyy vastakkaissuuntaiseksi. Tutkimus myös osoittaa, että kansainväliset hakusanat ovat parempia kuin
kansalliset ennustamaan osakekurssia.
Avainsanat Internet hakusanat, Sijoittajahuomio, Google, FTSE, Ticker, Poikkeavat tulot, Yksityissijoittajat

III
TABLE OF CONTENTS
1. Introduction .............................................................................................................................................. 1
1.1. Background information on Google Trends ...................................................................................... 1
1.2. Theoretical background .................................................................................................................... 3
1.3. Research problem and purpose ......................................................................................................... 4
1.4. Contribution ..................................................................................................................................... 5
1.5. Limitations of the study .................................................................................................................... 6
2. Literature review ....................................................................................................................................... 8
2.1. Previous literature involving SVI ...................................................................................................... 8
2.1.1. SVI literature in general ............................................................................................................... 8
2.1.2. SVI literature and finance ........................................................................................................... 10
2.2. Previous literature involving attention............................................................................................. 14
3. Hypotheses and data implications ............................................................................................................ 16
3.1. The differences in data to the reference study .................................................................................. 16
3.2. The hypotheses of the study ............................................................................................................ 19
4. Data and sample ...................................................................................................................................... 22
4.1. Data ............................................................................................................................................... 22
4.1.1. Stock market data....................................................................................................................... 22
4.1.2. SVI data..................................................................................................................................... 25
4.2. Sample ........................................................................................................................................... 29
4.2.1. Sample size and definition process ............................................................................................. 29
4.2.2. Sample characteristics ................................................................................................................ 32
5. Methods .................................................................................................................................................. 35
5.1. Cross-correlation matrix and required parameters ........................................................................... 35
5.2. Regression methods and hypotheses testing .................................................................................... 37
6. Results .................................................................................................................................................... 39
6.1. General findings from data characteristics....................................................................................... 39
6.2. Cross-correlation matrix ................................................................................................................. 42
6.3. Regression results .......................................................................................................................... 45
6.3.1. Simple OLS regression............................................................................................................... 45
6.3.2. Fama-Macbeth regression .......................................................................................................... 47
6.3.3. Robustness checks ..................................................................................................................... 49
7. Conclusions ............................................................................................................................................ 55
7.1. Summary of main findings ............................................................................................................. 55
7.2. Suggestions for further research ...................................................................................................... 57
References ...................................................................................................................................................... 59
IV
List of Table and Figures
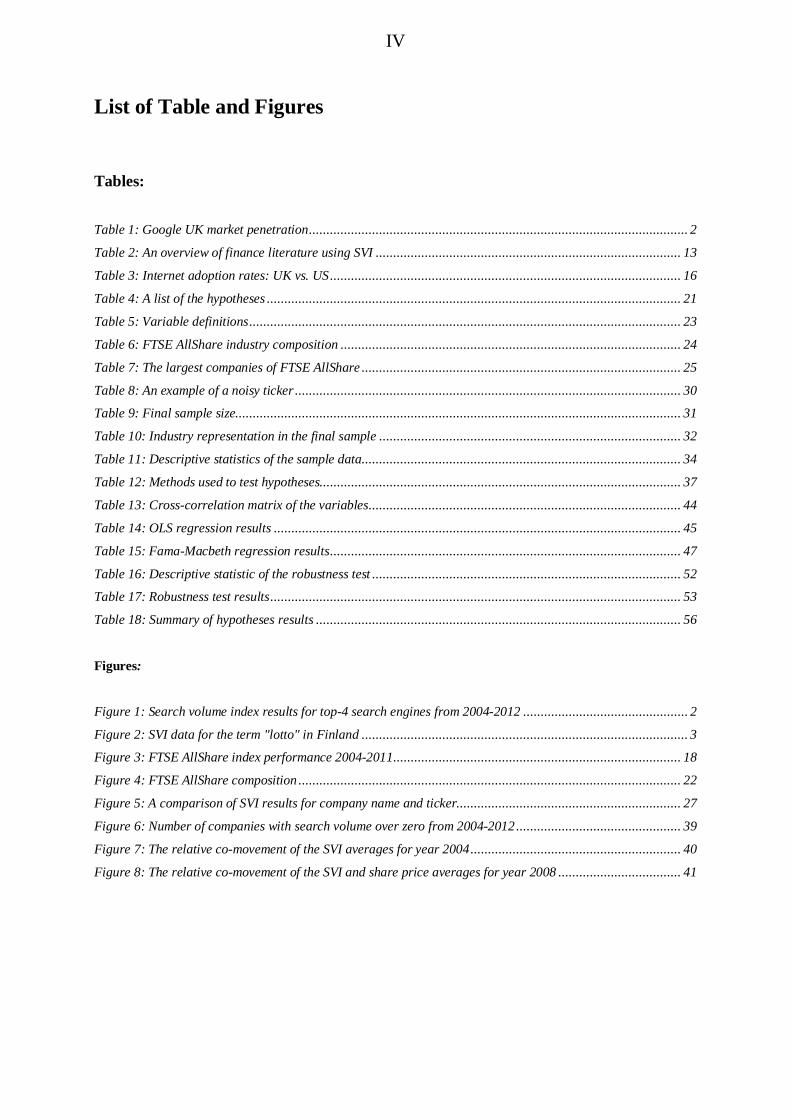
Tables:
Table 1: Google UK market penetration ............................................................................................................ 2
Table 2: An overview of finance literature using SVI ....................................................................................... 13
Table 3: Internet adoption rates: UK vs. US .................................................................................................... 16
Table 4: A list of the hypotheses ...................................................................................................................... 21
Table 5: Variable definitions ........................................................................................................................... 23
Table 6: FTSE AllShare industry composition ................................................................................................. 24
Table 7: The largest companies of FTSE AllShare ........................................................................................... 25
Table 8: An example of a noisy ticker .............................................................................................................. 30
Table 9: Final sample size............................................................................................................................... 31
Table 10: Industry representation in the final sample ...................................................................................... 32
Table 11: Descriptive statistics of the sample data ........................................................................................... 34
Table 12: Methods used to test hypotheses....................................................................................................... 37
Table 13: Cross-correlation matrix of the variables ......................................................................................... 44
Table 14: OLS regression results .................................................................................................................... 45
Table 15: Fama-Macbeth regression results .................................................................................................... 47
Table 16: Descriptive statistic of the robustness test ........................................................................................ 52
Table 17: Robustness test results ..................................................................................................................... 53
Table 18: Summary of hypotheses results ........................................................................................................ 56
Figures:
Figure 1: Search volume index results for top-4 search engines from 2004-2012 ............................................... 2
Figure 2: SVI data for the term "lotto" in Finland ............................................................................................. 3
Figure 3: FTSE AllShare index performance 2004-2011 .................................................................................. 18
Figure 4: FTSE AllShare composition ............................................................................................................. 22
Figure 5: A comparison of SVI results for company name and ticker................................................................ 27
Figure 6: Number of companies with search volume over zero from 2004-2012 ............................................... 39
Figure 7: The relative co-movement of the SVI averages for year 2004 ............................................................ 40
Figure 8: The relative co-movement of the SVI and share price averages for year 2008 ................................... 41
1
1. INTRODUCTION
Research has always been limited by the quality of tools used for measuring, and once a new
way of studying a subject is available it opens up a completely new depth of research. This
phenomenon is clearly illustrated in modern medicine, starting with the development of the
primitive microscope and leading to the current molecular level tools, each advance
contributing to new understanding on how humans work from the discovery of bacteria all the
way to genetics. The ability to measure in more detail, to gather richer data is at the forefront
of most major new discoveries. The ability to measure the volume of users aggregated search
queries (in a more approachable term; global attention) in real time is one such advance, and it
has begun contributing to a vast array of different disciples.
In the area of finance there have been emerging studies based on users search queries since
2010. In the forefront of the research are Da, Engelberg and Gao (Later referenced as DEG)
whose paper In Search of Attention is the first publication in Journal of Finance (October
2011) based on Internet search data. Due to the freshness of the study topic, there is a vast
array of subjects to approach with users search data. This paper uses the DEG (2011) study as
a reference paper and reflects on the findings of their study based on a different country, an
expanded time horizon and modified search criteria. In addition this study expands the Google
Trends tools used in previous research by analyzing how searches originating globally and
from the UK differ.
1.1. BACKGROUND INFORMATION ON GOOGLE TRENDS
Google is a company that specializes in digital data facilitation; for general issues there is the
basic Google service, for academia there is Google Scholar and for finance there is Google
Finance. The company specializes in connecting people to the vast array of data in the
Internet, which would otherwise be nearly inapproachable. Google searches are the most
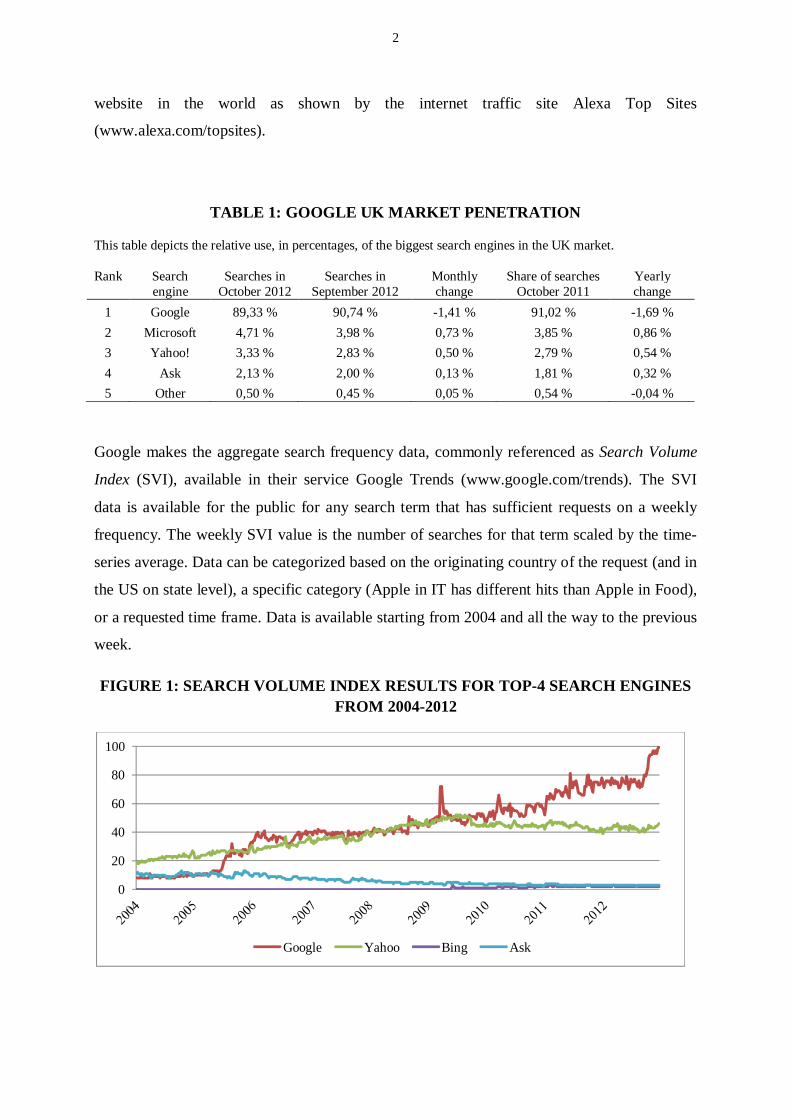
common way to navigate the Internet; in UK they contribute nearly 90% of all Internet
searches (Table 1 and Figure 1). It should also be noted that Google is by far the most visited
2
website in the world as shown by the internet traffic site Alexa Top Sites
(www.alexa.com/topsites).
TABLE 1: GOOGLE UK MARKET PENETRATION
This table depicts the relative use, in percentages, of the biggest search engines in the UK market.
Rank Searchengine
Searches inOctober 2012
Searches inSeptember 2012
Monthlychange
Share of searchesOctober 2011
Yearlychange
1 Google 89,33 % 90,74 % -1,41 % 91,02 % -1,69 %2 Microsoft 4,71 % 3,98 % 0,73 % 3,85 % 0,86 %3 Yahoo! 3,33 % 2,83 % 0,50 % 2,79 % 0,54 %4 Ask 2,13 % 2,00 % 0,13 % 1,81 % 0,32 %5 Other 0,50 % 0,45 % 0,05 % 0,54 % -0,04 %
Google makes the aggregate search frequency data, commonly referenced as Search Volume
Index (SVI), available in their service Google Trends (www.google.com/trends). The SVI
data is available for the public for any search term that has sufficient requests on a weekly
frequency. The weekly SVI value is the number of searches for that term scaled by the time-
series average. Data can be categorized based on the originating country of the request (and in
the US on state level), a specific category (Apple in IT has different hits than Apple in Food),
or a requested time frame. Data is available starting from 2004 and all the way to the previous
week.
FIGURE 1: SEARCH VOLUME INDEX RESULTS FOR TOP-4 SEARCH ENGINESFROM 2004-2012
0
20
40
60
80
100
Google Yahoo Bing Ask
3
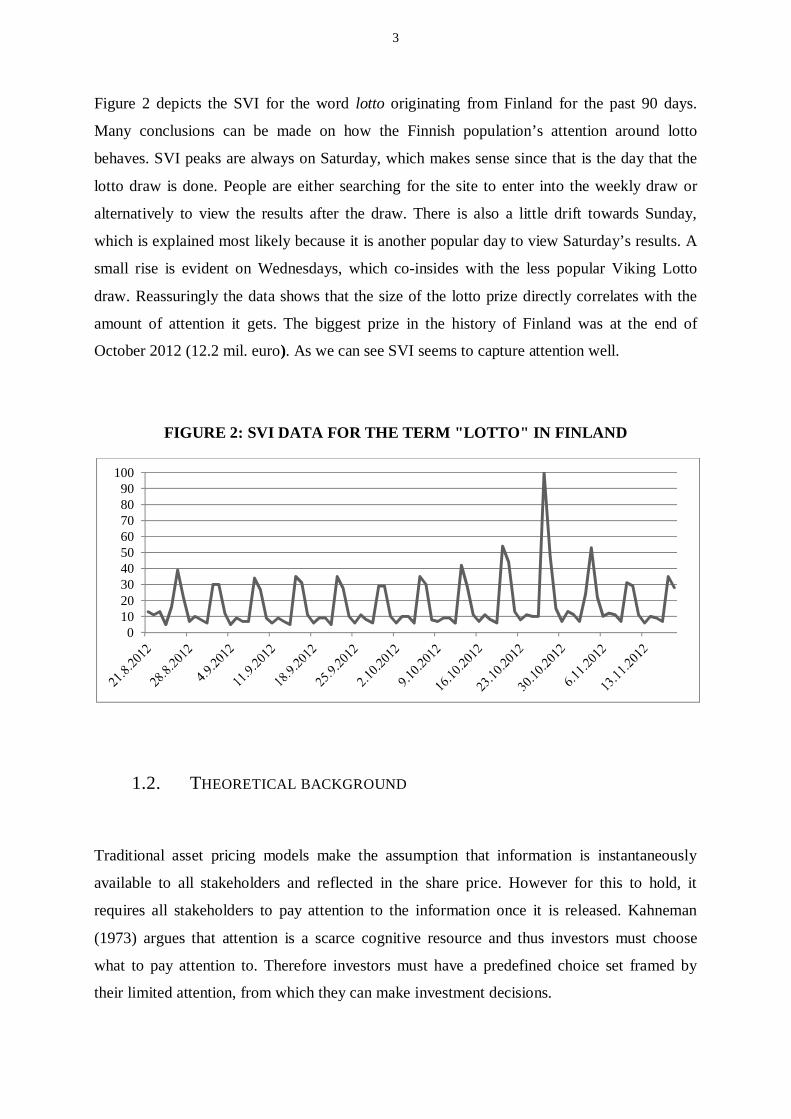
Figure 2 depicts the SVI for the word lotto originating from Finland for the past 90 days.
Many conclusions can be made on how the Finnish population’s attention around lotto
behaves. SVI peaks are always on Saturday, which makes sense since that is the day that the
lotto draw is done. People are either searching for the site to enter into the weekly draw or
alternatively to view the results after the draw. There is also a little drift towards Sunday,
which is explained most likely because it is another popular day to view Saturday’s results. A
small rise is evident on Wednesdays, which co-insides with the less popular Viking Lotto
draw. Reassuringly the data shows that the size of the lotto prize directly correlates with the
amount of attention it gets. The biggest prize in the history of Finland was at the end of
October 2012 (12.2 mil. euro). As we can see SVI seems to capture attention well.
FIGURE 2: SVI DATA FOR THE TERM "LOTTO" IN FINLAND
1.2. THEORETICAL BACKGROUND
Traditional asset pricing models make the assumption that information is instantaneously
available to all stakeholders and reflected in the share price. However for this to hold, it
requires all stakeholders to pay attention to the information once it is released. Kahneman
(1973) argues that attention is a scarce cognitive resource and thus investors must choose
what to pay attention to. Therefore investors must have a predefined choice set framed by
their limited attention, from which they can make investment decisions.
0102030405060708090
100
4
There have been numerous studies on investor attention, based on different indirect proxies
such as extreme returns, media attention and trading volume (Barber and Odean, 2008), price
limits (Seasholes and Wu, 2007) or advertising expenses (Chemmanur and Yan, 2009). The
results indicate that investors focus on attention-grabbing stocks and only then make the
selection based on individual preferences. However these studies assume that a peak in one
proxy would result in investor attention, which is not guaranteed. In the current digital age
with all types of investors having easy access to global stock markets and company
information, the questions of what to pay attention to becomes even more critical.
In 2011, the first study to use a direct measure of investor attention was published (Da,
Engelberg and Gao). The paper uses Google’s Search Volume Index (SVI) as a proxy for
investor attention based on the assumption that searching on the Internet for a company
reflects acute and direct interest. The study finds that weekly SVI, as a proxy for attention,
correlates but is different from previous forms of attention measurement. The paper also
shows that SVI captures the attention of retail investors, which is explained by institutional
investors using more sophisticated tools to search for information, such as Reuters or
Bloomberg terminals. One key contribution in the paper is to show that an increase in SVI for
Russell 30001 stocks predicts higher stock prices in the next two weeks, which ends in price
reversal within the year. The other main contribution to SVI research in the area of finance
comes from Mondria and Wu (2011) who study the relation between local and non-local
attention in the US market. They find that in situations of high information asymmetry (local
attention is high without a similar increase in non-local attention) ticker SVI is a strong
predictor of future share price movement, but however do not find a predictive effect when
information asymmetry is low. This finding contradicts the results of Dao, Engelberg and Gao
(2011), but can be explained by the fact that the study uses monthly data, instead of weekly.
1.3. RESEARCH PROBLEM AND PURPOSE
The predictive power of search queries has been a hot topic since 2009. The first significant
result shows that Google search words have the power to predict influenza epidemics
1 The Russell 3000 Index measures the performance of the largest 3000 U.S. companies representingapproximately 98% of the investable U.S. equity market. It is completely reconstituted annually to ensure newand growing equities are reflected.
5
(Ginbsberg et al, 2009) and since then many areas of academia have started to analyze what
this new tool could offer their research. There has been little academic exploration on SVI and
its relation to finance for now. However that is likely to change due to the significant findings
of the Da, Engelberg and Gao study and the constant improvements to the analytics tool. The
aim of this paper is to answer two questions;
1. Does SVI capture investor attention in the UK market?
2. Does SVI predict the stock market in the UK market?
The motivation behind this paper is to validate the findings of Da, Engelberg and Gao (2011)
by replicating a part of their study with companies listed in FTSE AllShare index.
Furthermore this study expands the time-horizon by four years to capture the increase in
digital consumption and effects of the global recession. In comparison to the DEG (2011)
paper this study uses different variables to examine the relation between SVI and share price;
such as how different industries affect the predictive power of SVI. Furthermore this paper
uses a new function of Google Trends to compare how searches originating from the UK and
globally differ.
1.4. CONTRIBUTION
This is the first study, to my knowledge, to examine the relation between SVI and the UK
market. The aim of this paper is to examine the link between SVI and company shares while
contributing to the expanding literature based on search volume data. The key reference study
that this paper follows is the paper by DEG (2011) and aims to expand on their results by
analyzing the same effect but using a different market, time horizon, additional variables and
new Google Trend functions.
The results show that the same effect presented by DEG (2011) is evident with UK data
although it is different. Firstly the study shows that there is a relation between trade volume in
the UK and a company’s London Stock Exchange ticker search frequency. The study finds
that increase in investor attention to a company ticker this week does have a positive effect on
6
share price the following week. The results are significant at the 1%-level and show that a
one-standard-deviation increase in ASVI (Abnormal Search Volume) today leads to a 12.5
basis point rise among FTSE AllShare stocks next week. Price reversal effects are evident but
not as strong as in the DEG (2011) study. Surprisingly the study also finds that searches
originating globally are better at predicting share price movement than searches originating
from the UK.
The results are validated by multiple robustness checks. Firstly the data is sorted by industry,
since it could be assumed that industries with high consumer visibility would interest retail
investors more. Secondly the data is sorted by market capitalization to see how size might
affect results. Thirdly the data is examined in different time frames to see if the outcome
could be affected by the recession or alternatively the increase of Internet adoption in
households. However the sample data size is not sufficiently large to provide significant
results on the robustness analysis.
This study contributes to the increasing amount of search volume based research by
examining for the first time the relation of ticker SVI and the stock market in UK. The study
shows that searches originating from the UK and searches globally are not identical and
provide different results towards the predictability of share movement. The main contribution
of this study is to show that search volume does capture investor attention, is related to
company shares and can be used to predict future stock market movements.
1.5. LIMITATIONS OF THE STUDY
The dependence on Google’s SVI data creates multiple limitations on the accuracy and scope
of the study. Firstly the data is accessible on a weekly level, which means that currently there
is no effective way of delving deeper into the data to see how attention shifts on a daily basis.
Google only shares the relative increase or decrease based on the average search volume for a
specific time period, and omits the numerical values of search transactions. Furthermore, there
needs to be a sufficient amount of searches for Google to publish SVI’s which means that the
lesser known companies will not produce any SVI data. Another limitation is that many
companies have noisy tickers, such as British American Tobacco’s ticker BATS, which
7
cannot be used to measure SVI since it would also pick up on searches for the nocturnal
animals.
Another key limitation is that this study does not incorporate the use of any web crawling
software and collects SVI data by hand. The benefit of this method is gaining a better
understanding of the data and its relation to what is measured, but the cost is that the sample
size must be limited due to the time-consuming process of collecting the data.
The rest of the thesis is organized as follows. Section 2 presents the most important literature
on studies based on SVI data as well as studies based on the effect of attention. Section 3
presents the research hypotheses, Section 4 the data and Section 5 the methods used. The
results are presented in Section 6, and Section 7 concludes.
8
2. LITERATURE REVIEW
This chapter reviews the literature relevant to this study. The chapter is divided into two
sections. Section 1 examines the different studies made based on the Search Volume Index,
firstly looking at the area as a whole and then focusing in more detail to research around
finance. Section 2 discusses the literature concerning investor attention and its effect on
company performance.
2.1. PREVIOUS LITERATURE INVOLVING SVI
The following two subsections discuss the literature pertaining to Search Volume Index
research. The first subsection describes literature from different field of academia, while the
second subsection focuses on the applications of SVI in finance.
2.1.1. SVI LITERATURE IN GENERAL
Google released their Trends product to the public on May 10th in 2006 and it has gone
through multiple iterations during the past six years. From an academic perspective, the
significant date was the first release of Google Insight (which was integrated into basic
Trends in 2012) in 2008, which enabled statistical analysis due to CSV importing and major
improvements in data reliability.
The literature on search volume has been relatively abundant when taking into consideration
that the data has been available and usable since 2008. However the concept of using Internet
behavior to predict real world changes has been present for a longer time, which partly
explains the quick incorporation of Trends for research purposes. Johnson et al. (2004) test if
monitoring Internet web page visits to sites that give information on influenza can predict flu
peaks. The results were moderately strong and no clear connection could be established at the
time, however it paved the road for future studies. A year later, Cooper et al. (2005) describe
using Internet search volume for cancer-related topics. The first literature on the significant
predictive power of SVI comes from the medical field as well. Ginsberg et al. (2009) found
9
that that search data for 45 terms associated to influenza predict flu outbreaks one to two
weeks before Center for Disease Control and Prevention (CDC) reports. This study is often
referred to as the verification that Google Trends has predictive power and can be used as the
basis for academic research. One example of its significance is the fact that Google has
incorporated Ginsberg’s flu predictions as a part of the base Google Trends product
(http://www.google.org/flutrends/).
Google’s Chief Economist Hal Varian has suggested that Google search data has the potential
to describe interest in a variety of economic activities in real time. In their study Choi and
Varian (2009) show that search data can predict home sales, automotive sales and tourism. In
the example of tourism, they make the assumption that Google is used for travel planning and
therefore an increase in destination related queries should indicate future trips to that
destination. The study looks at queries for the term Hong Kong from nine different locations
and compares it to the Hong Kong Tourism Board’s monthly visitor statistics, which includes
the traveler’s place of origin. The study shows that there is a strong correlation (with the
exclusion of Japan) between the two parameters.
In their research Goel et al. (2010) examine how search query volume forecasts the opening
weekend of box-office revenue for a feature film, first-month sales of video games and the
rank of songs on the Billboard Hot 100 chart. They conclude that SVI provides a useful guide
to predicting sales days, even weeks into the future. The predictability power varies between
different forms of media, being strongest in movies and weakest in music. In addition to
consumers purchasing trends, SVI has been used to measure their political actions. Lui et al.
(2011) find that SVI is a poor indicator of voting results in the US during the 2008 and 2010
congressional elections, due to the fact that voter’s attention towards a candidate does not
directly indicate an interest to vote for that candidate, it is just as likely that they are following
up on negative news. However general voting activity could be measured using SVI.
One of the key areas where SVI research has been applied is economics, one indication being
that the Central Bank of England has taken it to use as an economic indicator. The first paper
known to suggest using web search data to forecast economic statistics was by Ettredge
(2005), which examined the U.S unemployment rate. Multiple studies have shown this
suggestion to be valid, since a strong link between job search related queries (e.g.
unemployment office, jobs, resume) are shown to be linked to unemployment payments
(Baker and Fradkin, 2011) and unemployment (Askitas and Zimmerman, 2010; Choi and
10
Varian, 2011). Guzman (2011) showed that SVI can also predict inflation, by evaluating it
against 36 survey measures and showing that Google Inflation Search Index (GISI) has the
lowest forecast error of all the inflation expectation indicators tested. SVI has been used to
evaluate the economic sentiment by creating an index consisting of the SVI for a subset of
negative words (e.g. recession or bankruptcy). The study shows that an increase in the index
leads to return reversals, extreme volatility and mutual fund flow; from equity heavy funds to
bond funds (Da, Engelberg, Gao, (b) 2010). An alternative take on the same link is shown by
Dzielinksi (2012) who uses the word economic as a proxy for economic uncertainty. His
assumption is based on the hypotheses that a higher level of uncertainty increases the demand
for information, which in modern society would be visible in Internet search data and queries
related to the word economic. Another substitute word that has been suggested to indicate US
investor confidence is the search for the term gold, since investors shift their attention from
equity to alternative investment opportunities in economic downturns (The Economist, 2011).
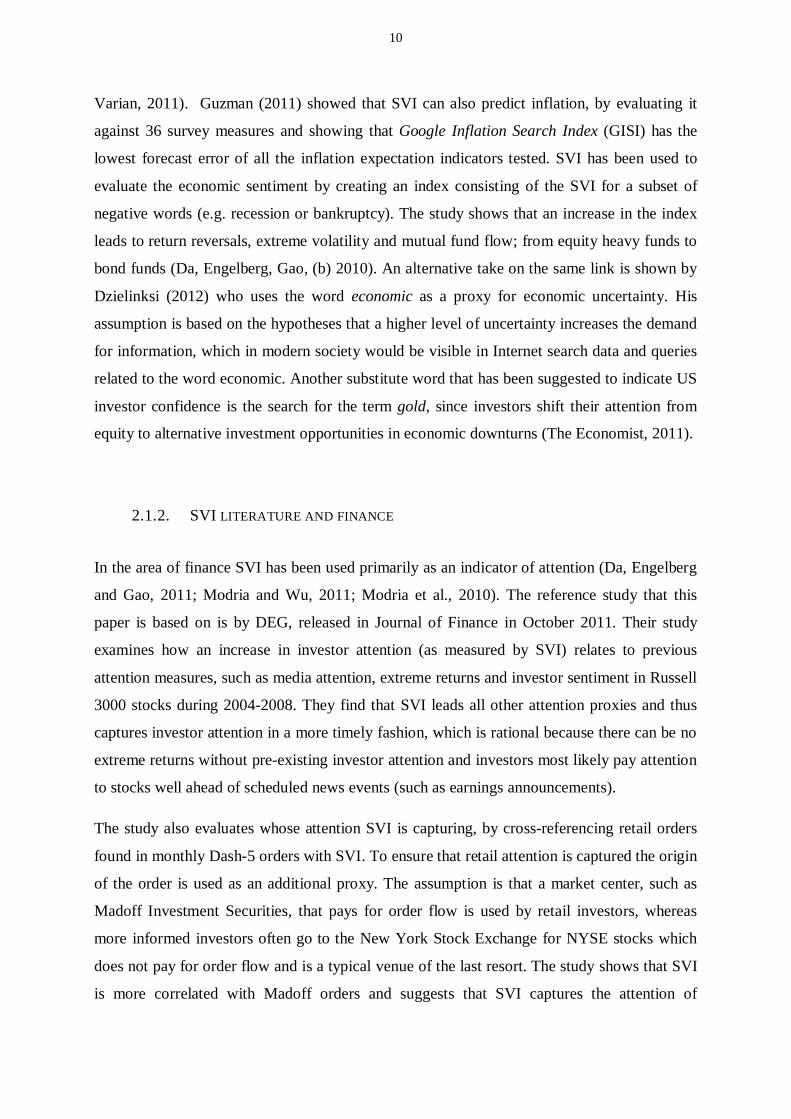
2.1.2. SVI LITERATURE AND FINANCE
In the area of finance SVI has been used primarily as an indicator of attention (Da, Engelberg
and Gao, 2011; Modria and Wu, 2011; Modria et al., 2010). The reference study that this
paper is based on is by DEG, released in Journal of Finance in October 2011. Their study
examines how an increase in investor attention (as measured by SVI) relates to previous
attention measures, such as media attention, extreme returns and investor sentiment in Russell
3000 stocks during 2004-2008. They find that SVI leads all other attention proxies and thus
captures investor attention in a more timely fashion, which is rational because there can be no
extreme returns without pre-existing investor attention and investors most likely pay attention
to stocks well ahead of scheduled news events (such as earnings announcements).
The study also evaluates whose attention SVI is capturing, by cross-referencing retail orders
found in monthly Dash-5 orders with SVI. To ensure that retail attention is captured the origin
of the order is used as an additional proxy. The assumption is that a market center, such as
Madoff Investment Securities, that pays for order flow is used by retail investors, whereas
more informed investors often go to the New York Stock Exchange for NYSE stocks which
does not pay for order flow and is a typical venue of the last resort. The study shows that SVI
is more correlated with Madoff orders and suggests that SVI captures the attention of
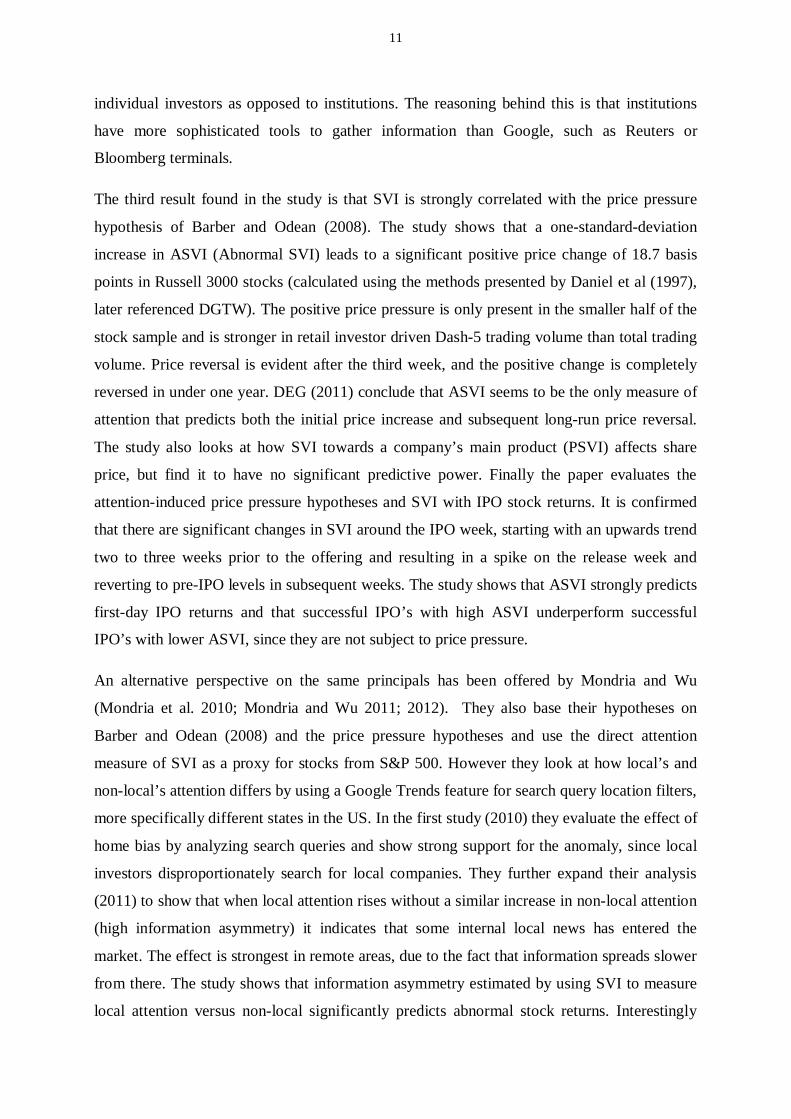
11
individual investors as opposed to institutions. The reasoning behind this is that institutions
have more sophisticated tools to gather information than Google, such as Reuters or
Bloomberg terminals.
The third result found in the study is that SVI is strongly correlated with the price pressure
hypothesis of Barber and Odean (2008). The study shows that a one-standard-deviation
increase in ASVI (Abnormal SVI) leads to a significant positive price change of 18.7 basis
points in Russell 3000 stocks (calculated using the methods presented by Daniel et al (1997),
later referenced DGTW). The positive price pressure is only present in the smaller half of the
stock sample and is stronger in retail investor driven Dash-5 trading volume than total trading
volume. Price reversal is evident after the third week, and the positive change is completely
reversed in under one year. DEG (2011) conclude that ASVI seems to be the only measure of
attention that predicts both the initial price increase and subsequent long-run price reversal.
The study also looks at how SVI towards a company’s main product (PSVI) affects share
price, but find it to have no significant predictive power. Finally the paper evaluates the
attention-induced price pressure hypotheses and SVI with IPO stock returns. It is confirmed
that there are significant changes in SVI around the IPO week, starting with an upwards trend
two to three weeks prior to the offering and resulting in a spike on the release week and
reverting to pre-IPO levels in subsequent weeks. The study shows that ASVI strongly predicts
first-day IPO returns and that successful IPO’s with high ASVI underperform successful
IPO’s with lower ASVI, since they are not subject to price pressure.
An alternative perspective on the same principals has been offered by Mondria and Wu
(Mondria et al. 2010; Mondria and Wu 2011; 2012). They also base their hypotheses on
Barber and Odean (2008) and the price pressure hypotheses and use the direct attention
measure of SVI as a proxy for stocks from S&P 500. However they look at how local’s and
non-local’s attention differs by using a Google Trends feature for search query location filters,
more specifically different states in the US. In the first study (2010) they evaluate the effect of
home bias by analyzing search queries and show strong support for the anomaly, since local
investors disproportionately search for local companies. They further expand their analysis
(2011) to show that when local attention rises without a similar increase in non-local attention
(high information asymmetry) it indicates that some internal local news has entered the
market. The effect is strongest in remote areas, due to the fact that information spreads slower
from there. The study shows that information asymmetry estimated by using SVI to measure
local attention versus non-local significantly predicts abnormal stock returns. Interestingly

12
they do not manage to replicate the findings of DEG (2011) in their data and find no
significant relation with non-local SVI and abnormal returns. This is most likely due to the
fact that the study is based on monthly data, and DEG (2011) showed strong price reversal
starting on the third week. In their latest study (2012) they test SVI attention behavior and its
effect on local and foreign (non-US) investments. They show that attention increase in foreign
stocks results in US sales of foreign stocks, which is in conflict with the general hypotheses
and results of DEG (2011) who showed that attention indicates price pressure and is related to
buying stocks. Mondria and Wu (2012) show in their study that US investors increased
attention to foreign stocks does not result in similar actions as increase towards local stocks.
In foreign stocks bad and surprising news gets a disproportionately higher SVI as opposed to
good or familiar news.
Substituting investor attention with information demand, Vlastikis and Markellos (2012)
study how search query volume predicts stock market volatility. Their study is based on the
assumption that investors demand more information as their level of risk aversion increases.
The study focuses on the 30 largest stocks traded in NYSE and shows that information supply
(as measured by Reuters news for a company) and information demand (as measured by
company SVI) do not behave in a similar manner. Information demand is driven by historical
volatility and trading volume, whereas supply is highly periodic and systematic. The study
also shows that using the expected risk premium for the S&P 500 as a proxy for time-varying
risk aversion confirms for the first time the hypotheses that information demand increases
with the level of risk aversion in the market.
13
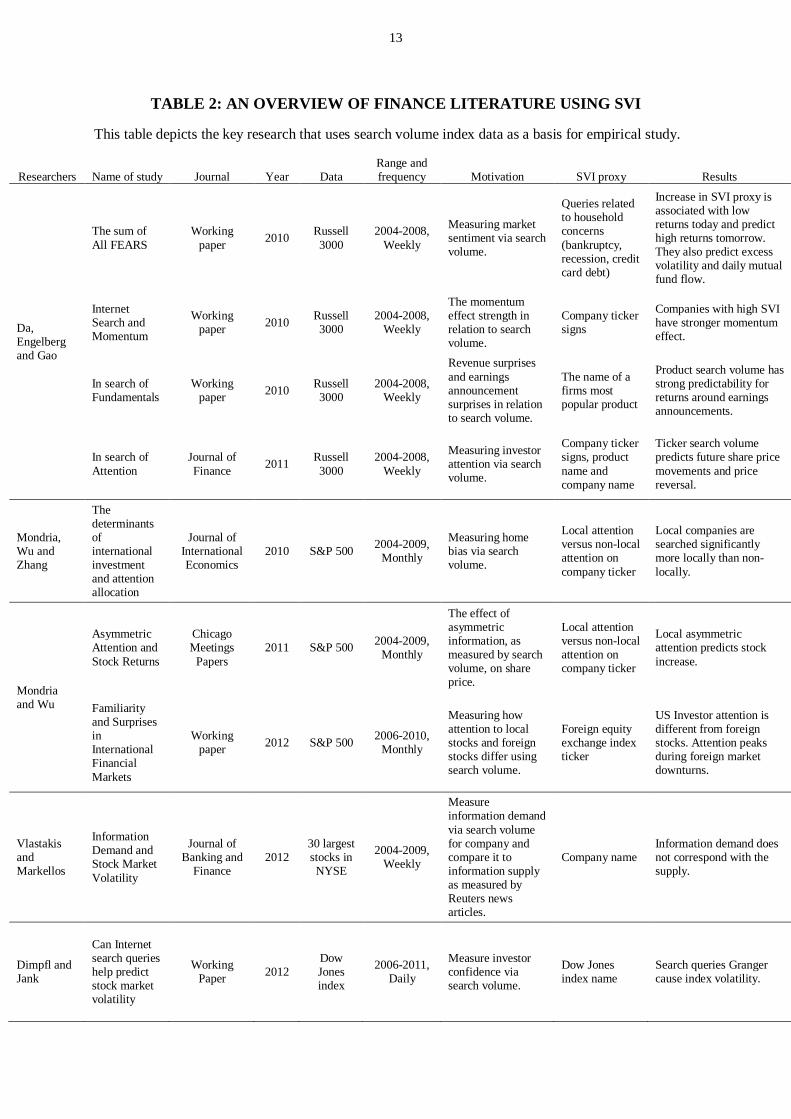
TABLE 2: AN OVERVIEW OF FINANCE LITERATURE USING SVI
This table depicts the key research that uses search volume index data as a basis for empirical study.
Researchers Name of study Journal Year DataRange andfrequency Motivation SVI proxy Results
Da,Engelbergand Gao
The sum ofAll FEARS
Workingpaper 2010 Russell
30002004-2008,
Weekly
Measuring marketsentiment via searchvolume.
Queries relatedto householdconcerns(bankruptcy,recession, creditcard debt)
Increase in SVI proxy isassociated with lowreturns today and predicthigh returns tomorrow.They also predict excessvolatility and daily mutualfund flow.
InternetSearch andMomentum
Workingpaper 2010 Russell
30002004-2008,
Weekly
The momentumeffect strength inrelation to searchvolume.
Company tickersigns
Companies with high SVIhave stronger momentumeffect.
In search ofFundamentals
Workingpaper 2010 Russell
30002004-2008,
Weekly
Revenue surprisesand earningsannouncementsurprises in relationto search volume.
The name of afirms mostpopular product
Product search volume hasstrong predictability forreturns around earningsannouncements.
In search ofAttention
Journal ofFinance 2011 Russell
30002004-2008,
Weekly
Measuring investorattention via searchvolume.
Company tickersigns, productname andcompany name
Ticker search volumepredicts future share pricemovements and pricereversal.
Mondria,Wu andZhang
Thedeterminantsofinternationalinvestmentand attentionallocation
Journal ofInternationalEconomics
2010 S&P 500 2004-2009,Monthly
Measuring homebias via searchvolume.
Local attentionversus non-localattention oncompany ticker
Local companies aresearched significantlymore locally than non-locally.
Mondriaand Wu
AsymmetricAttention andStock Returns
ChicagoMeetings
Papers2011 S&P 500 2004-2009,
Monthly
The effect ofasymmetricinformation, asmeasured by searchvolume, on shareprice.
Local attentionversus non-localattention oncompany ticker
Local asymmetricattention predicts stockincrease.
Familiarityand SurprisesinInternationalFinancialMarkets
Workingpaper 2012 S&P 500 2006-2010,
Monthly
Measuring howattention to localstocks and foreignstocks differ usingsearch volume.
Foreign equityexchange indexticker
US Investor attention isdifferent from foreignstocks. Attention peaksduring foreign marketdownturns.
VlastakisandMarkellos
InformationDemand andStock MarketVolatility
Journal ofBanking and
Finance2012
30 largeststocks inNYSE
2004-2009,Weekly
Measureinformation demandvia search volumefor company andcompare it toinformation supplyas measured byReuters newsarticles.
Company nameInformation demand doesnot correspond with thesupply.
Dimpfl andJank
Can Internetsearch querieshelp predictstock marketvolatility
WorkingPaper 2012
DowJonesindex
2006-2011,Daily
Measure investorconfidence viasearch volume.
Dow Jonesindex name
Search queries Grangercause index volatility.
14
2.2. PREVIOUS LITERATURE INVOLVING ATTENTION
Traditional asset pricing models assume that information is instantaneously calculated into
stock prices when it arrives. These models assume that investors have undivided attention to
all assets and their corresponding information streams. However that is understandably not
the case since attention is a scarce cognitive resource (Kahneman, 1973) and due to cognitive
limitations investors must choose what they pay attention to; an increase in cognitive
resources to one task requires a substitution from another task. The limitations of the perfect-
market model and costs to information seeking are at the core of Merton’s (1987) paper on
capital market equilibrium with incomplete information.
Research on investor’s limited attention and its implications has been plentiful. Hirshleifer
and Teoh (2003) take the assumption of limited attention and look at how the quality of
company disclosures can affect the attention of investors. Since investors have a limited
amount of time on hand, they must make choices on how much information they gather on a
company. The hypothesis is that due to limited attention company disclosures that clearly
state information are absorbed more readily and the more information an investor can gather
the less risky that investment will seem.
Corwin and Coughenour (2008) follow how limited attention affects specialists and their
NYSE portfolio’s liquidity by monitoring specialists during their work. They find that in
periods of increased activity the specialists allocate effort toward their most active stocks,
while the other securities are subject to less attention resulting in a lack of liquidity. The
negative effects of running out of liquidity are frequent price improvements and increased
transaction costs. The behavioral implications of limited attention for investors are also
discussed in the paper of Peng and Xiong (2006). They show that with limited attention
investors start focusing on category-level information (such as market and sector
information), as opposed to firm-specific information. The study also shows that limited
attention promotes overconfidence, since decisions need to be based more on investor
sentiment than actual company specifics.
Since it has been relatively well established in literature that investors have limited cognitive
abilities which result in limited attention, the logical follow-up question is; what grabs their
attention? In his paper Odean (1999) proposes that investors manage the problem of choosing
between thousands of possible stocks by limiting their search to stocks that have recently
15
caught their attention. In other words attention forms the subset of options for which
investment decisions can be made, and those investment decisions can vary per individual,
such as following a contrarian approach or being a momentum investor (Barber and Odean,
2008). The availability heuristic is one of the most common explanations for attention
allocation for uninformed investors.
There are multiple indirect proxies of investor attention in financial literature such as extreme
returns, media attention and trading volume (Barber and Odean, 2008). It is logical to assume
that when investors are pushed information it is more likely that they will notice it. An
example of this is when a company exhibits overly positive or negative returns, since it
becomes increasingly likely that the investor will pay attention to it than on an average
performance day. Price limits (Seasholes and Wu, 2007) and advertising expenses
(Chemmanur and Yan, 2009) are also used as proxies for investor attention. Price limits are
based on the disposition effect and the idea that when a new high (or low) price for a stock is
reached, it gathers relatively more attention. Advertising expenses work as a proxy by
assuming that the more money a company puts into advertising the more familiar it is with
investors and the more familiar it is results in higher attention, since investors are more likely
to follow firms they know compared to unfamiliar ones.
Barber and Odean (2008) test and confirm their hypothesis that individual investors are net
buyers of attention grabbing stocks, and therefore an increase in individual attention results in
temporary price pressure. The logic behind this assumption is that when investors are buying
stocks, they have to choose from a large set of available options. However when selling they
can only sell stocks that they own (with the rational assumption that individual investors do
not short their position). Therefore shocks to retail attention should lead on average to net
buying from uninformed traders. This finding is the basis for hypothesis two (H2) in this
study.
16
3. HYPOTHESES AND DATA IMPLICATIONS
This chapter presents the hypotheses between Search Volume Index and company shares. The
hypotheses are based on the theories relating to investor attention and the empirical findings
of previous research. The first Section discusses the differences between the data in this paper
and that of the DEG (2011) and what implication the differences may have on the results. The
second Section presents the hypothesis of the study. All in all there are five hypotheses
discussed below.
3.1. THE DIFFERENCES IN DATA TO THE REFERENCE STUDY
There are two major differences in data between this paper and that of DEG (2011) that could
affect the results.
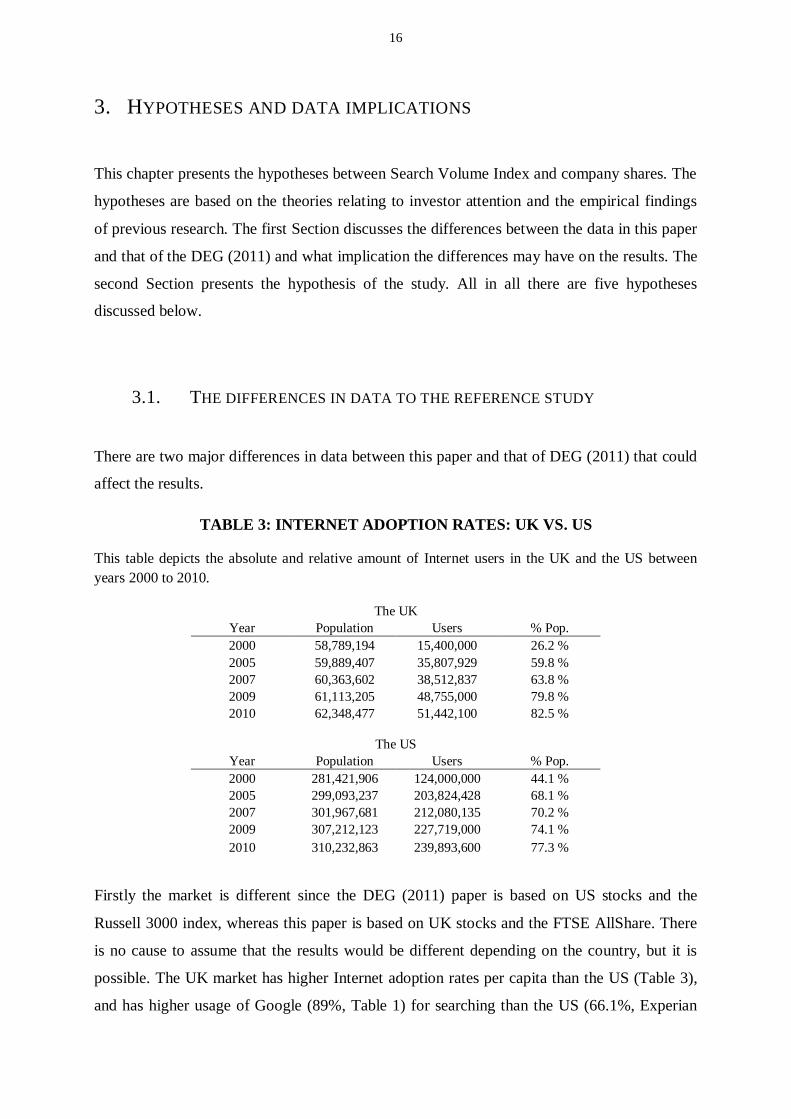
TABLE 3: INTERNET ADOPTION RATES: UK VS. US
This table depicts the absolute and relative amount of Internet users in the UK and the US betweenyears 2000 to 2010.
The UKYear Population Users % Pop.2000 58,789,194 15,400,000 26.2 %2005 59,889,407 35,807,929 59.8 %2007 60,363,602 38,512,837 63.8 %2009 61,113,205 48,755,000 79.8 %2010 62,348,477 51,442,100 82.5 %
The USYear Population Users % Pop.2000 281,421,906 124,000,000 44.1 %2005 299,093,237 203,824,428 68.1 %2007 301,967,681 212,080,135 70.2 %2009 307,212,123 227,719,000 74.1 %2010 310,232,863 239,893,600 77.3 %
Firstly the market is different since the DEG (2011) paper is based on US stocks and the
Russell 3000 index, whereas this paper is based on UK stocks and the FTSE AllShare. There
is no cause to assume that the results would be different depending on the country, but it is
possible. The UK market has higher Internet adoption rates per capita than the US (Table 3),
and has higher usage of Google (89%, Table 1) for searching than the US (66.1%, Experian
17
Hitwise report, 2012). Both of these facts support the hypothesis that retail investors would
use the Internet and more specifically Google to gather information on the companies they are
interested in, even more so than in the reference study.
There are no studies that contribute to understanding the behavioral differences between retail
investors in the UK and US. Therefore the only possibility is to rely on the data available and
make assumptions based on the data. However it should be noted that it is possible that retail
investor behavior differs from country to country. For instance it is possible that US investors
are more active traders than UK investors, and might therefore search for the ticker more
frequently to inspect company information or alternatively UK investors could rely more on
other sources of company information such as blogs or newspapers.
It should be noted that the US population (approximately 311 Million) is five times bigger
than that of the UK (approximately 63 Million), which means that there will be less search
volume in total in the UK. This might have an effect on the smaller companies being excluded
from the study due to not having enough search queries to show up on Google Trends.
Furthermore it should be noted that in the DEG (2011) study the smaller firms where
significantly affected by SVI and in bigger firms the effect was not visible.
Another market based issue is the total amount of retail investors. Although the UK market is
an investment hub, it is strongly dominated by big institutional investors. Although there
should be no major difference in retail investors per capita, once again the sheer volume of the
US market means that there are more retail investors in total. As DEG (2011) show in their
study, SVI captures the attention of retail investors and therefore it could be that the results
are weaker due to less retail investors in the UK as a whole compared to the reference study.
Another difference in the US and UK markets that can affect the data is the type of companies
that are in the indexes. In Section 4.1.1 the stock market data is described in detail. One
difference that is pointed out is that there are proportionately more consumer related stocks in
the Russell 3000 index which are recognizable to investors. Following the findings of Barber
and Odean (2009) retail investors are much more inclined to invest in companies they are
familiar with. Since many companies in the FTSE AllShare are in industries that are not
visible to consumers, there is a risk that retail investor attention will be low. It is likely that in
general the FTSE AllShare index does not garner as much retail interest attention as the major
US companies featured in the Russell 3000 index. On the other hand there is less participant
fluctuation in the FTSE AllShare index (median age 18yrs and average age 23yrs) as opposed
18
to the Russell 3000 index, so the study benefits from longer and more sequential firm-week
observations.
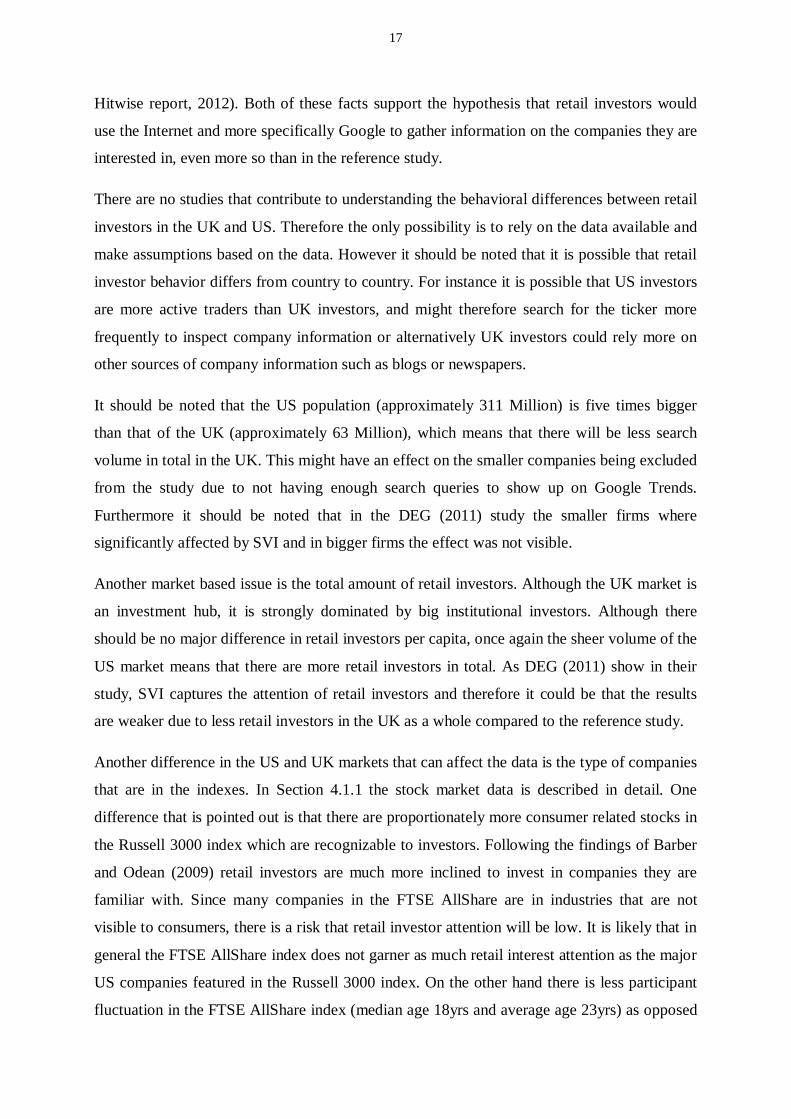
The other difference between this study and that of the reference paper is the time frame. The
DEG (2011) study consists of data up to June 2008, whereas this study has data up to
December 2011. The subprime financial crisis of 2007-2008 that involved the bailout of
banks, the bankruptcy of Lehman Brothers and subsequently led to the current global
recession should most likely be visible in the data, since investor confidence sank and money
shifted away from equity. The decrease in retail investor participation in equity markets
should be visible in data, starting from 2008 to the end of 2009 (Figure 3). However the
extended period also enables more robust analysis of the SVI effect on share prices, since the
time-frame of this study is nearly two times longer than that of DEG (2011).
FIGURE 3: FTSE ALLSHARE INDEX PERFORMANCE 2004-2011
0
50000
100000
150000
200000
250000
30.1.2004 30.1.2005 30.1.2006 30.1.2007 30.1.2008 30.1.2009 30.1.2010 30.1.2011
19
3.2. THE HYPOTHESES OF THE STUDY
The first hypothesis concerns SVI and trade volume in the UK market. Based on the findings
of DEG (2011) it is reasonable to assume that also in the UK market SVI for a company ticker
is a valid proxy for retail investor attention. If that is the case then an influx of attention
toward a company ticker should have an effect on trade volume, since retail investors are
more likely to trade stock they are aware of as opposed to unknown stocks. The assumption is
supported both by the availability heuristic (Kahneman and Tversky, 1982) and price pressure
theory (Barber and Odean, 2008).
Hypothesis 1 (H1): An increase in a company’s tickers Search Volume Index affects the
change in trade volume for that company.
If a link between retail investor attention, as measured by SVI, and stock trade volume can be
established, then the next step is to understand what type of effect there is. There is no cause
to assume that behavior between retail investors in the US and the UK would be significantly
different. Based on the price pressure hypothesis of retail investors presented by Barber and
Odean (2008), and previously shown to be accurate in the US market by DEG (2011), this
paper states the hypothesis that with an increase in company ticker SVI, the company share
price is more likely to rise than decrease. However the effect should completely reverse
during a period of one year, as in the study of DEG (2011).
Hypothesis 2 (H2): An increase in Search Volume Index for a company’s ticker has a
positive effect in the short-run for that company’s share price, but
will reverse in under one year.
The third hypothesis presented in this paper is that the effect of price pressure due to
individual buying activity should be more present in smaller stocks. This assumption is based
20
on the idea that small stocks are subject to larger price impact, as was shown in the study of
DEG (2011).
Hypothesis 3 (H3): The effect of the price pressure from retail investor attention is
stronger in small companies compared to large companies.
The fourth hypothesis is based on the finding of Chemmanur and Yan (2009) that retail
investors are more likely to purchase stocks they are familiar with. To test this we look at
the industries that have high consumer recognizability (e.g. consumer goods) and propose
that such companies will be more influenced by the retail attention measured by SVI.
Hypothesis 4 (H4): Companies with high consumer recognizability are more affected by
retail investor attention than companies that are not visible to
consumers.
The fifth and final hypothesis has to do with the way in which SVI is gathered. There is no
way to escape a certain amount of noise in the data, since for most three to five letter
combinations there is a corresponding meaning. The meaning can be a medical
abbreviation, computer virus, camera model or simply a word written wrong. By
narrowing down the market from global search words to UK based search words it can be
assumed that the possibilities for different meanings should be narrowed down. This would
mean that the results for UK stock tickers should be stronger in the UK SVIs than in global
SVIs, since there is less chance for noise. The effect of home bias also supports this
hypothesis, since it claims that investors are more inclined to invest in local stocks.
Therefore we can assume that locals will be looking more at local stocks, however the
study of Tesar and Werner (1995) shows that UK has the least amount of home bias
compared to Germany, Canada, US and Japan.
21
Hypothesis 5 (H5): The SVI results from UK are better predictors for UK company
share price than the SVI results gathered globally.
However it should be noted that for hypothesis five (H5) there is also a good chance that
global SVI results are more indicative due to the bigger amount of search volume in
general. If the ticker is searched for multiple times more around the world than in the UK,
then the global SVI can also withstand multiple amounts of noise and still be as valid.
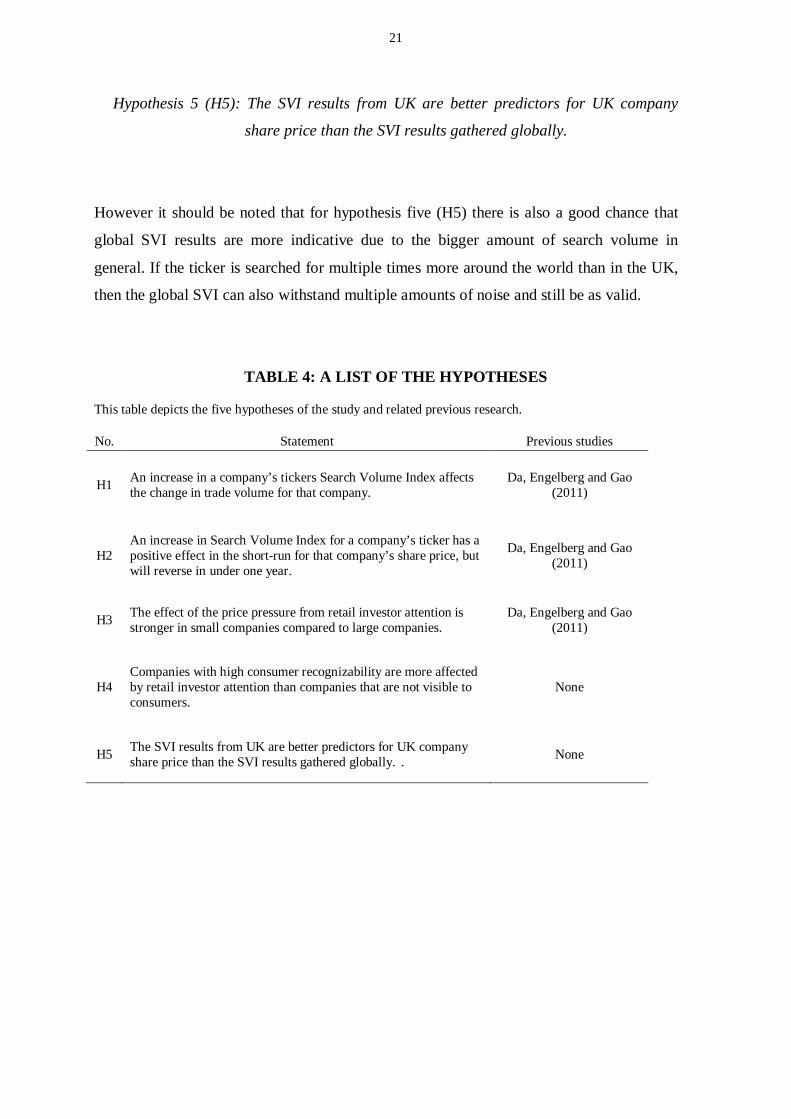
TABLE 4: A LIST OF THE HYPOTHESES
This table depicts the five hypotheses of the study and related previous research.
No. Statement Previous studies
H1 An increase in a company’s tickers Search Volume Index affectsthe change in trade volume for that company.
Da, Engelberg and Gao(2011)
H2An increase in Search Volume Index for a company’s ticker has apositive effect in the short-run for that company’s share price, butwill reverse in under one year.
Da, Engelberg and Gao(2011)
H3 The effect of the price pressure from retail investor attention isstronger in small companies compared to large companies.
Da, Engelberg and Gao(2011)
H4Companies with high consumer recognizability are more affectedby retail investor attention than companies that are not visible toconsumers.
None
H5 The SVI results from UK are better predictors for UK companyshare price than the SVI results gathered globally. . None
22
4. DATA AND SAMPLE
In this chapter, the data and sample of this study are presented. Section 1 describes the data
used in the study, firstly describing the stock market data gathered from DataStream and then
describing data gathered via Google Trends. Section 2 charts the sample formation process
and describes the final sample.
4.1. DATA
The data for this paper comes from two sources. The first subsection describes the stock
market data derived from DataStream and the following subsection the Search Volume Index
data collected manually from Google Trends.
4.1.1. STOCK MARKET DATA
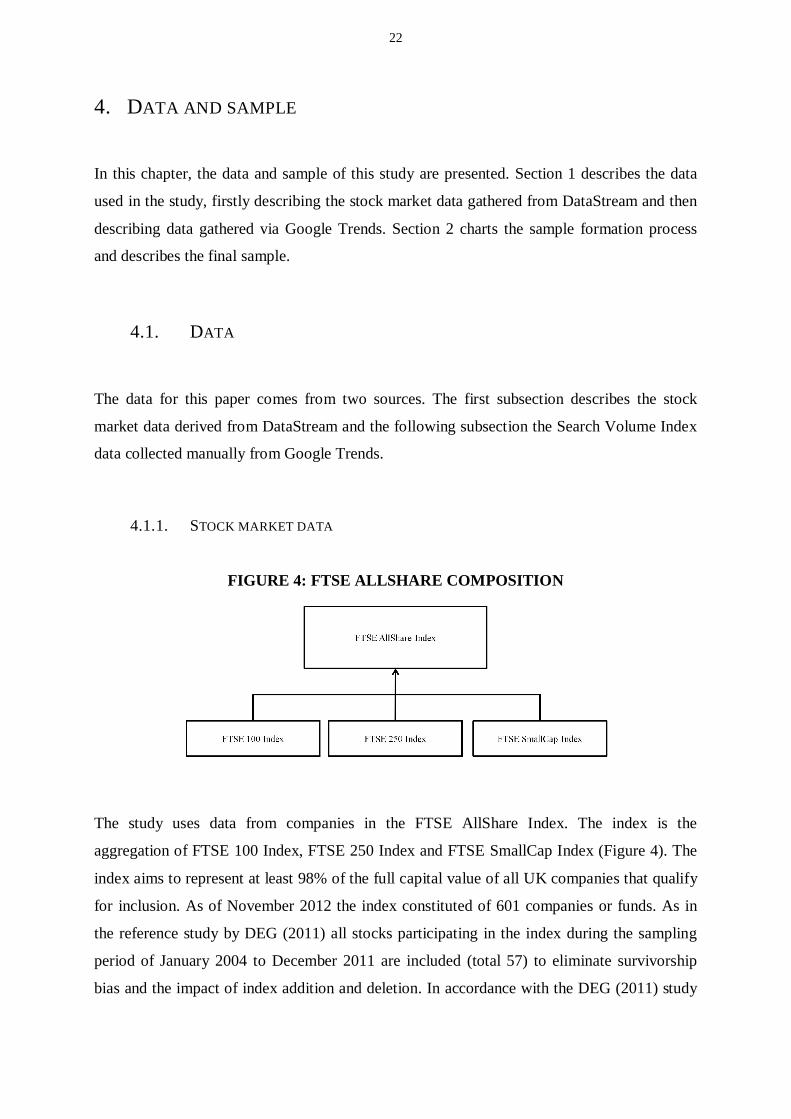
FIGURE 4: FTSE ALLSHARE COMPOSITION
The study uses data from companies in the FTSE AllShare Index. The index is the
aggregation of FTSE 100 Index, FTSE 250 Index and FTSE SmallCap Index (Figure 4). The
index aims to represent at least 98% of the full capital value of all UK companies that qualify
for inclusion. As of November 2012 the index constituted of 601 companies or funds. As in
the reference study by DEG (2011) all stocks participating in the index during the sampling
period of January 2004 to December 2011 are included (total 57) to eliminate survivorship
bias and the impact of index addition and deletion. In accordance with the DEG (2011) study
23
all stock-week observations with a market price below two pounds (approximately the three
dollars used in DEG (2011)) are omitted to alleviate market microstructure-related issues.
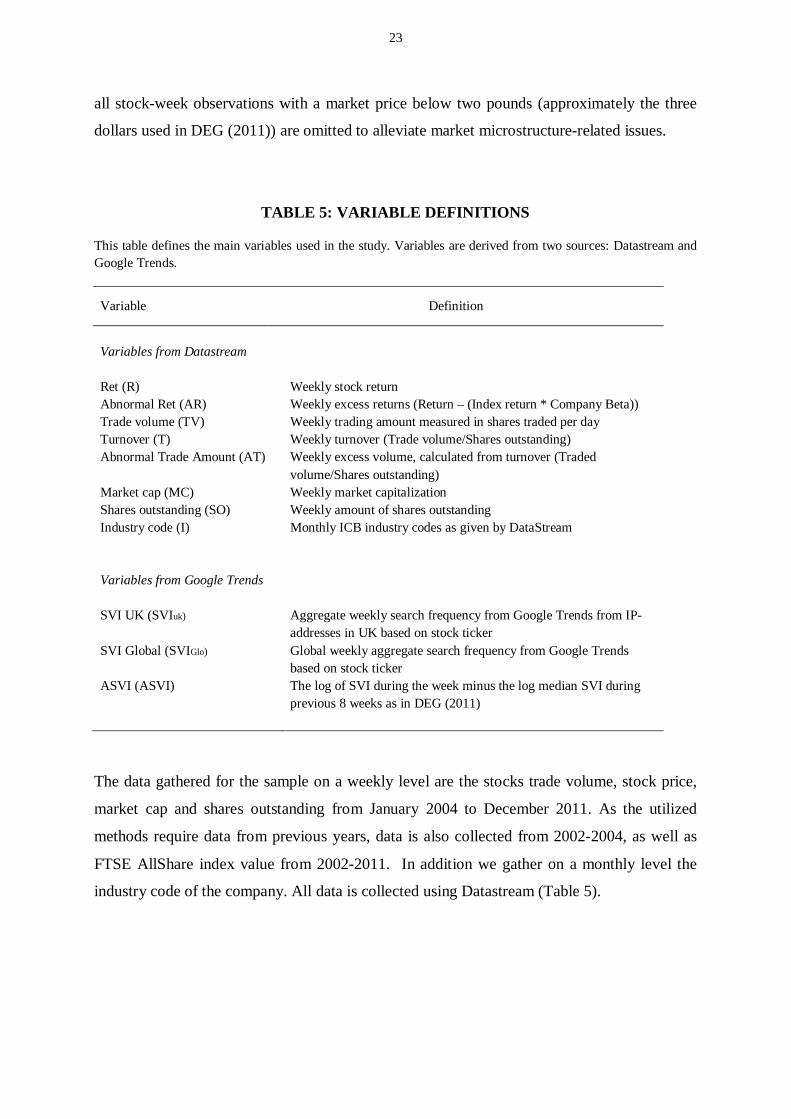
TABLE 5: VARIABLE DEFINITIONS
This table defines the main variables used in the study. Variables are derived from two sources: Datastream andGoogle Trends.
Variable Definition
Variables from Datastream
Ret (R) Weekly stock returnAbnormal Ret (AR) Weekly excess returns (Return – (Index return * Company Beta))Trade volume (TV)Turnover (T)
Weekly trading amount measured in shares traded per dayWeekly turnover (Trade volume/Shares outstanding)
Abnormal Trade Amount (AT) Weekly excess volume, calculated from turnover (Tradedvolume/Shares outstanding)
Market cap (MC)Shares outstanding (SO)
Weekly market capitalizationWeekly amount of shares outstanding
Industry code (I) Monthly ICB industry codes as given by DataStream
Variables from Google Trends
SVI UK (SVIuk) Aggregate weekly search frequency from Google Trends from IP-addresses in UK based on stock ticker
SVI Global (SVIGlo) Global weekly aggregate search frequency from Google Trendsbased on stock ticker
ASVI (ASVI) The log of SVI during the week minus the log median SVI duringprevious 8 weeks as in DEG (2011)
The data gathered for the sample on a weekly level are the stocks trade volume, stock price,
market cap and shares outstanding from January 2004 to December 2011. As the utilized
methods require data from previous years, data is also collected from 2002-2004, as well as
FTSE AllShare index value from 2002-2011. In addition we gather on a monthly level the
industry code of the company. All data is collected using Datastream (Table 5).
24
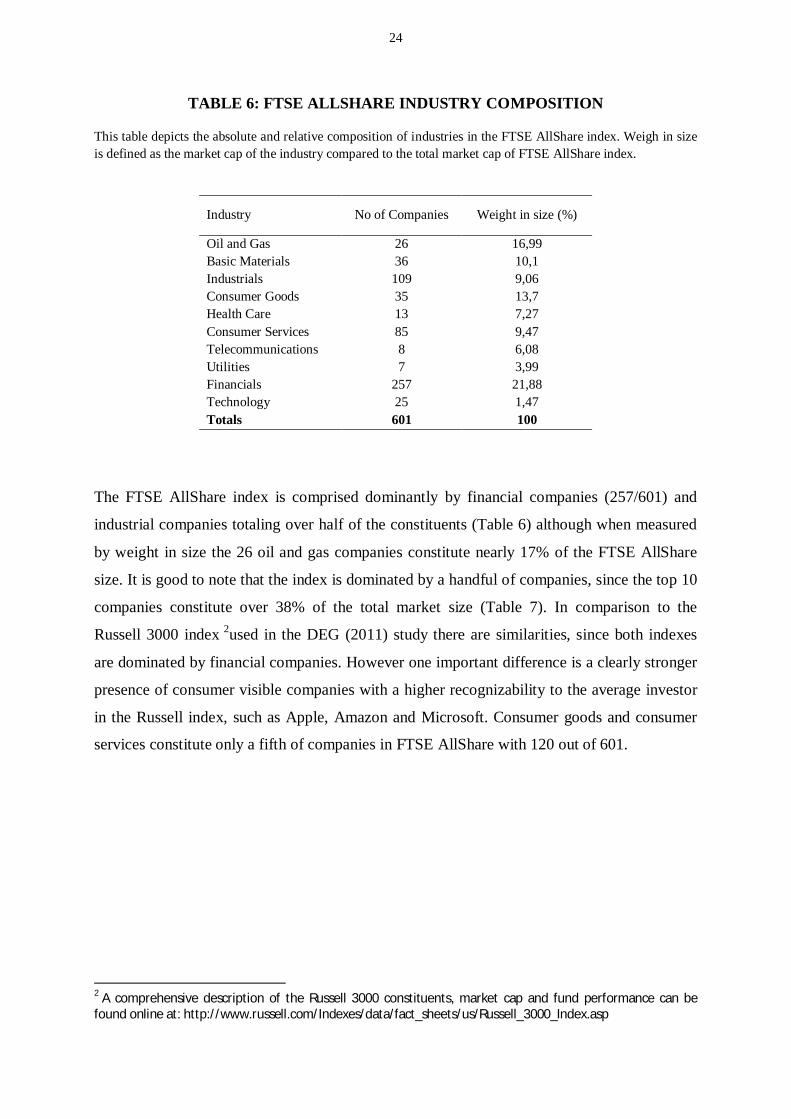
TABLE 6: FTSE ALLSHARE INDUSTRY COMPOSITION
This table depicts the absolute and relative composition of industries in the FTSE AllShare index. Weigh in sizeis defined as the market cap of the industry compared to the total market cap of FTSE AllShare index.
Industry No of Companies Weight in size (%)
Oil and Gas 26 16,99Basic Materials 36 10,1Industrials 109 9,06Consumer Goods 35 13,7Health Care 13 7,27Consumer Services 85 9,47Telecommunications 8 6,08Utilities 7 3,99Financials 257 21,88Technology 25 1,47Totals 601 100
The FTSE AllShare index is comprised dominantly by financial companies (257/601) and
industrial companies totaling over half of the constituents (Table 6) although when measured
by weight in size the 26 oil and gas companies constitute nearly 17% of the FTSE AllShare
size. It is good to note that the index is dominated by a handful of companies, since the top 10
companies constitute over 38% of the total market size (Table 7). In comparison to the
Russell 3000 index 2used in the DEG (2011) study there are similarities, since both indexes
are dominated by financial companies. However one important difference is a clearly stronger
presence of consumer visible companies with a higher recognizability to the average investor
in the Russell index, such as Apple, Amazon and Microsoft. Consumer goods and consumer
services constitute only a fifth of companies in FTSE AllShare with 120 out of 601.
2 A comprehensive description of the Russell 3000 constituents, market cap and fund performance can befound online at: http://www.russell.com/Indexes/data/fact_sheets/us/Russell_3000_Index.asp
25
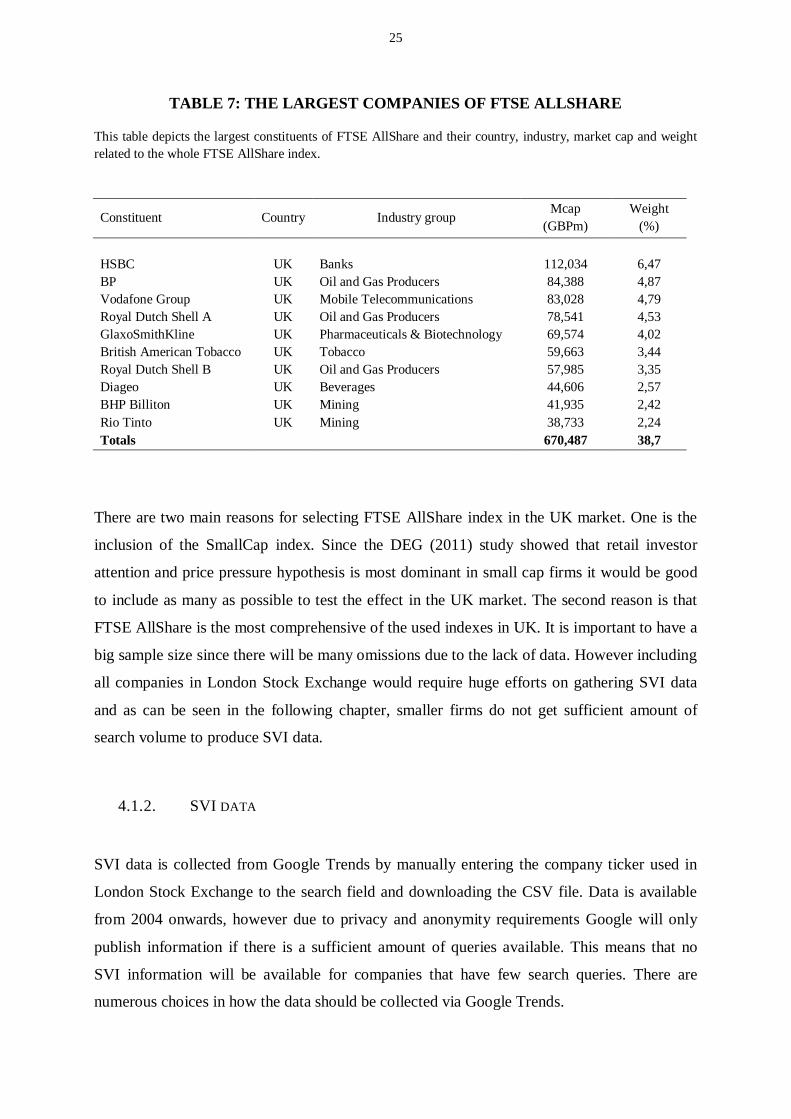
TABLE 7: THE LARGEST COMPANIES OF FTSE ALLSHARE
This table depicts the largest constituents of FTSE AllShare and their country, industry, market cap and weightrelated to the whole FTSE AllShare index.
Constituent Country Industry groupMcap
(GBPm)Weight
(%)
HSBC UK Banks 112,034 6,47BP UK Oil and Gas Producers 84,388 4,87Vodafone Group UK Mobile Telecommunications 83,028 4,79Royal Dutch Shell A UK Oil and Gas Producers 78,541 4,53GlaxoSmithKline UK Pharmaceuticals & Biotechnology 69,574 4,02British American Tobacco UK Tobacco 59,663 3,44Royal Dutch Shell B UK Oil and Gas Producers 57,985 3,35Diageo UK Beverages 44,606 2,57BHP Billiton UK Mining 41,935 2,42Rio Tinto UK Mining 38,733 2,24Totals 670,487 38,7
There are two main reasons for selecting FTSE AllShare index in the UK market. One is the
inclusion of the SmallCap index. Since the DEG (2011) study showed that retail investor
attention and price pressure hypothesis is most dominant in small cap firms it would be good
to include as many as possible to test the effect in the UK market. The second reason is that
FTSE AllShare is the most comprehensive of the used indexes in UK. It is important to have a
big sample size since there will be many omissions due to the lack of data. However including
all companies in London Stock Exchange would require huge efforts on gathering SVI data
and as can be seen in the following chapter, smaller firms do not get sufficient amount of
search volume to produce SVI data.
4.1.2. SVI DATA
SVI data is collected from Google Trends by manually entering the company ticker used in
London Stock Exchange to the search field and downloading the CSV file. Data is available
from 2004 onwards, however due to privacy and anonymity requirements Google will only
publish information if there is a sufficient amount of queries available. This means that no
SVI information will be available for companies that have few search queries. There are
numerous choices in how the data should be collected via Google Trends.
26
The first question is what identifier should be used to capture investor attention for a given
company. DEG (2011) show that ticker symbols capture the attention of retail investors and
argue that using a generic company name is partial to too much noise, since the cause of a
search word can be related to anything.
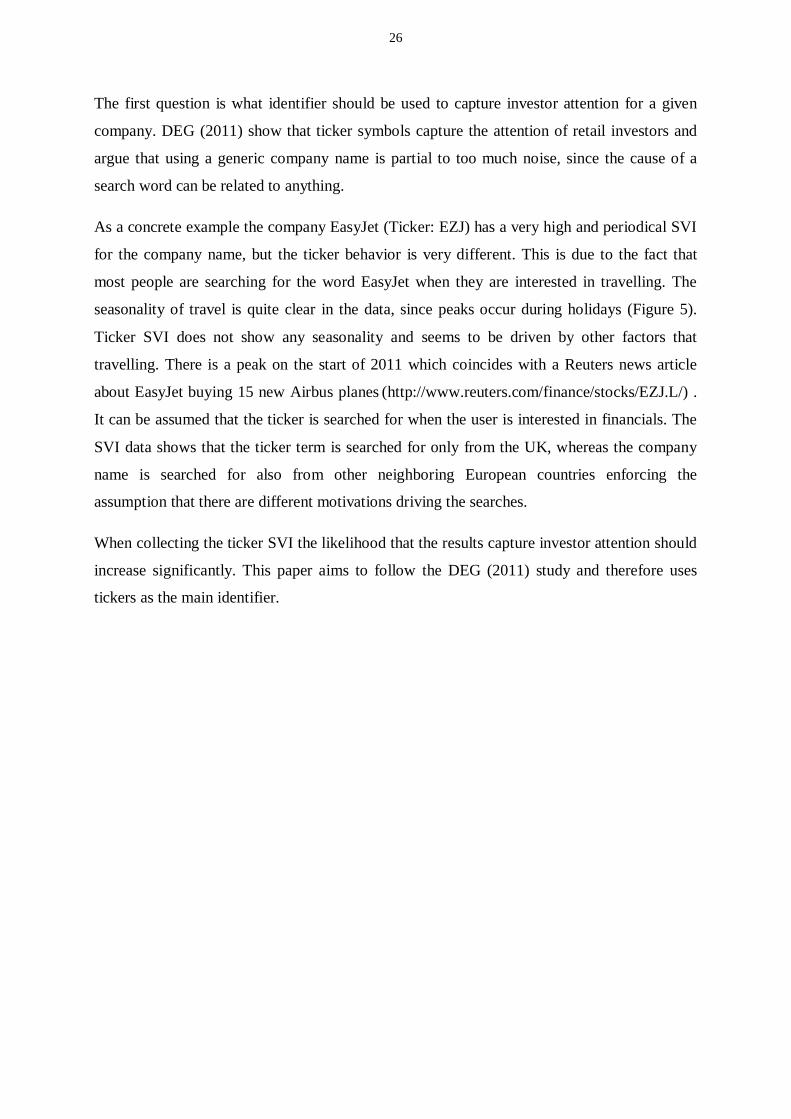
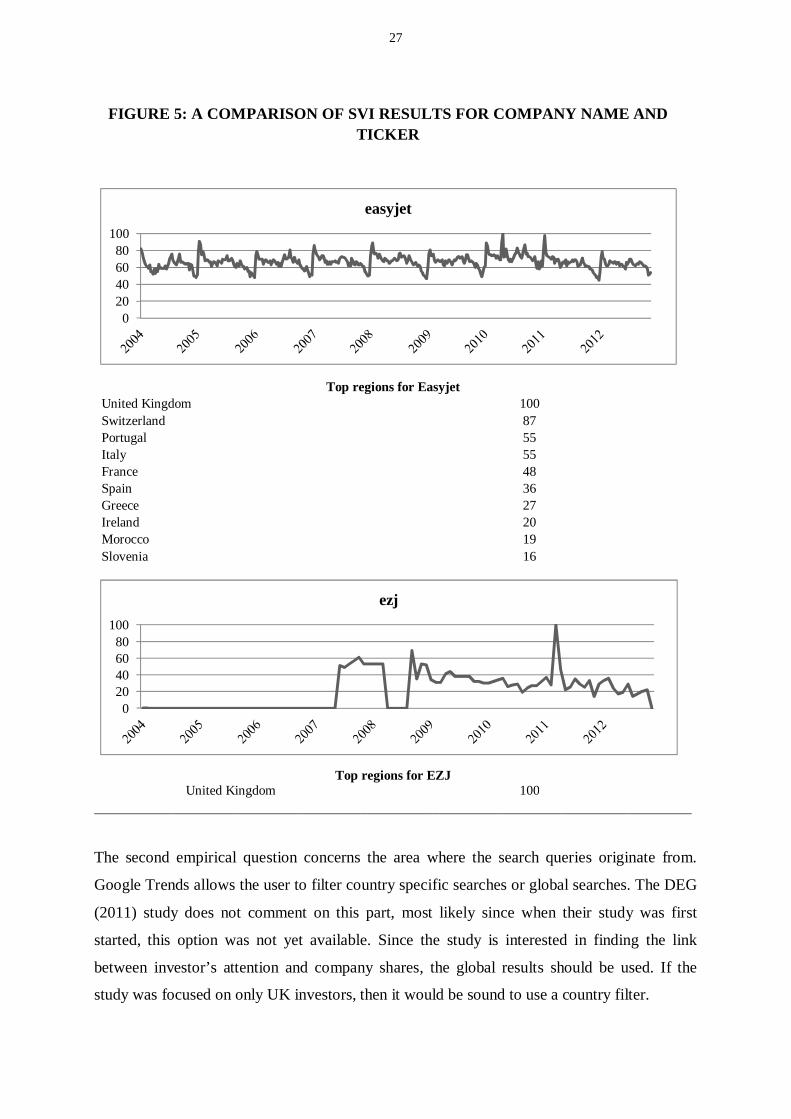
As a concrete example the company EasyJet (Ticker: EZJ) has a very high and periodical SVI
for the company name, but the ticker behavior is very different. This is due to the fact that
most people are searching for the word EasyJet when they are interested in travelling. The
seasonality of travel is quite clear in the data, since peaks occur during holidays (Figure 5).
Ticker SVI does not show any seasonality and seems to be driven by other factors that
travelling. There is a peak on the start of 2011 which coincides with a Reuters news article
about EasyJet buying 15 new Airbus planes (http://www.reuters.com/finance/stocks/EZJ.L/) .
It can be assumed that the ticker is searched for when the user is interested in financials. The
SVI data shows that the ticker term is searched for only from the UK, whereas the company
name is searched for also from other neighboring European countries enforcing the
assumption that there are different motivations driving the searches.
When collecting the ticker SVI the likelihood that the results capture investor attention should
increase significantly. This paper aims to follow the DEG (2011) study and therefore uses
tickers as the main identifier.
27
Top regions for EasyjetUnited Kingdom 100Switzerland 87Portugal 55Italy 55France 48Spain 36Greece 27Ireland 20Morocco 19Slovenia 16
Top regions for EZJUnited Kingdom 100
The second empirical question concerns the area where the search queries originate from.
Google Trends allows the user to filter country specific searches or global searches. The DEG
(2011) study does not comment on this part, most likely since when their study was first
started, this option was not yet available. Since the study is interested in finding the link
between investor’s attention and company shares, the global results should be used. If the
study was focused on only UK investors, then it would be sound to use a country filter.
020406080
100
easyjet
020406080
100
ezj
FIGURE 5: A COMPARISON OF SVI RESULTS FOR COMPANY NAME ANDTICKER
28
While conducting the analysis it became evident that much of the noise can be eradicated
from the study by focusing on country specific queries. For instance the ticker for the online
gambling company 888 Holdings is H888, however the same code is used for an Asian
mobile phone model. Therefore when searching globally for H888, the SVI results include
people interested in investing in the UK and buying mobile phones in Asia. It can also be
assumed that there is some form of home bias effect in retail investors and thus there would
be more UK company related searches in the UK (Werner and Tesar, 1995). By using the
country filter the probability that the study captures the right type of attention should increase
(H5). In this study both the global and the UK data are collected so that both results can be
evaluated.
There are additional functions that Google Trends offers that could be used in the study.
Google Trends has an option to use industry and category filters, so it would be possible to
search for firms using their industry as a filter. This might reduce noise, but since Google
does not clearly define the process, the risk of an internal filtering error affecting the sample is
not taken in this study. Google Trends does allow users to download daily data, but only if the
time frame is 90 days or less. Considering the period of eight years used in this study it would
require more than 100 independent queries to collect the data for one company. As mentioned
in the opening paragraph this study collects manually all data from Google Trends, which is
informative since the quality of data can be viewed as it is being collected. However many
studies, such as DEG (2011), use web crawling technology to automate the collecting process.
The bigger the required sample size and especially if daily values are collected, web crawlers
become increasingly useful.
It should be acknowledged that due to efficiency reasons Google does not calculate all search
queries in the SVI results, but only a sample of the total. However in the study of DEG (2011)
it was shown that there is very little deviation in the results after multiple test runs of
collecting the same sample.

29
4.2. SAMPLE
The following Section describes the sample. The first subsection charts the sample definition
process and how the final sample size has been formed. The second subsection delves deeper
into the final sample characteristics and goes through the factors that might have an effect on
the results of the study.
4.2.1. SAMPLE SIZE AND DEFINITION PROCESS
The total sample size is 658 companies from which 601 are listed in 2012 and 57 are from
previous years. To eliminate survivorship bias and the impact of index addition and deletion,
all stocks that have been listed during 2004-2012 are included in the total.
In this study there have been four processes that have determined the sample size. Firstly, the
FTSE AllShare index includes both equity and investment trusts. All investment trusts have
been omitted from the sample due to two reasons. Firstly, it is important to replicate the DEG
(2011) study as closely as possible to ensure that the results are comparable. Since the
investment trusts are solely available in the UK and not used in the DEG (2011) sample, they
are omitted. The second reason is that investment trusts most likely do not attract retail
investor attention similarly as equity, although both securities are traded in the London Stock
Exchange. Investment trust funds are reallocated based on the fund manager’s disposition,
and are therefore fundamentally different types of securities.
The second process that defines the sample size is the omission of noisy tickers from the
sample. Noisy tickers are symbols that can have alternative meanings, such as British
American Tobacco’s ticker BATS or Glencore’s ticker GLEN. These tickers cannot be used
to evaluate investor attention due to the fact that they would more likely be capturing the
alternative meaning of the word.
There have been two steps to complete this process. Firstly the list has been cleaned from the
obvious noisy tickers, such as words or names. Secondly during the SVI search process the
results of each ticker are reviewed. Google Trends informs of related words associated with
the search term with each search (Table 8). There are two different values given for any
search. One is the ”Top searches” which lists the most common word combinations associated
30
with the term. The scale is from zero to 100. A score of 100 does not mean that the term is
always used, but simply that it is used the most. The other value is “Rising searches” that
highlights the terms that have had significant growth in the given time period with respect to
the preceding period. The value of “Breakout” is assigned to terms that have experienced a
growth of over 5000% during the period.
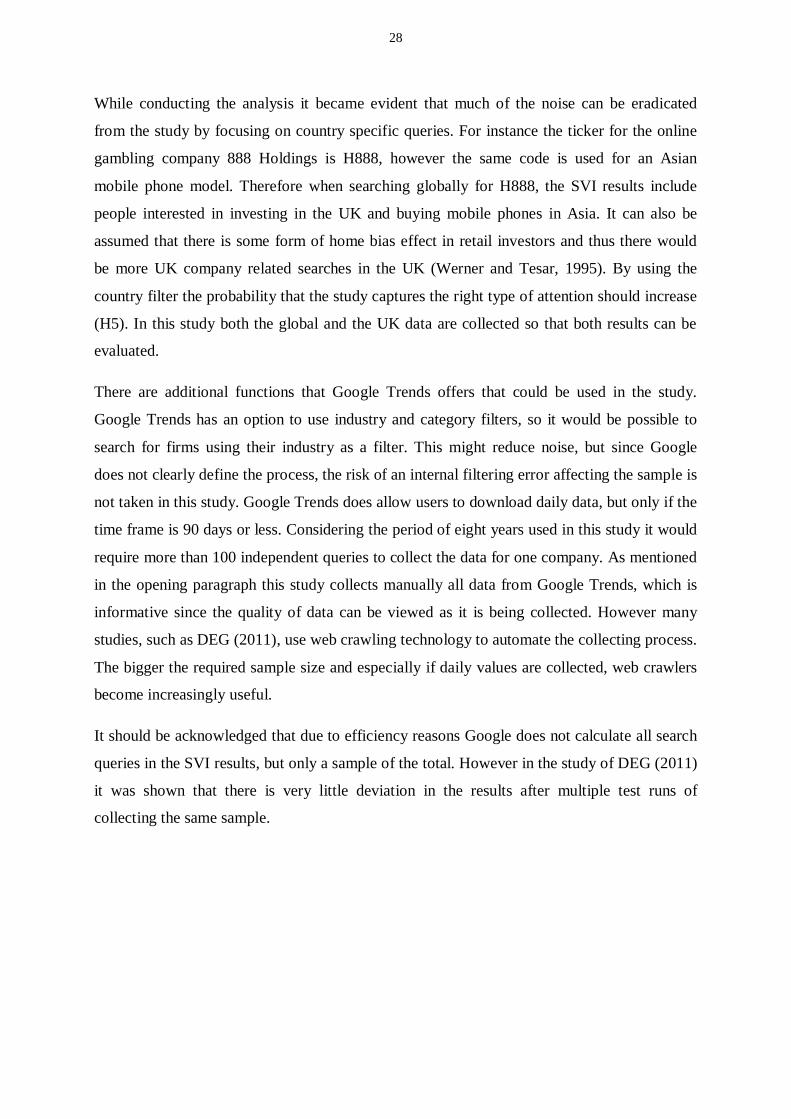
The results of the related words can often uncover noise that would otherwise go unnoticed.
For instance the ticker for industrial company Keller is KLR, and while searching for the SVI
of the ticker it is apparent that there is strong seasonality and peaks, which indicates that there
might be noise in the data. When looking at the related terms it shows that KLR is also a
model of Kawasaki motorbikes and since the relation with KLR and motorbikes is very strong
the ticker must be omitted from the study. The rule that is followed in this study is that if there
is a clear alternate definition that has a value of 100, the ticker is omitted. In other cases the
results are accepted. In the best scenario the results show that related terms include words
such as share, price, news or info which gives a strong indication that the search query is
related to the company. However this happens very rarely during the collection process. It
must be noted that there will be a certain amount of noise in a search volume based study, but
by monitoring the results the risk can be minimized.
TABLE 8: AN EXAMPLE OF A NOISY TICKER
This table depicts the top search and rising search values associated with the term klr.
Top searches for klrklr 650 100kawasaki klr 90kawasaki klr 650 50klr 250 45klr 600 25klr for sale 20kawasaki klr 250 20kawasaki klr 600 10
Rising searches for klrkawasaki klr 250 Breakoutkawasaki klr 600 Breakoutklr 250 Breakoutklr 600 Breakoutklr for sale Breakoutklr 650 180 %kawasaki klr 650 40 %
31
The third process that defines the sample size is the omission of the companies that do not
have sufficient data to conduct the analysis. There are two sources that can result in
insufficient data. Firstly, if the company is recently listed in FTSE AllShare (listing occurs
after 2010) there might not be enough data. Secondly, if there are too few search queries for
the company, Google Trends will not produce SVI data, which means that the lesser known
companies will need to be omitted from the study. The minimum requirement for sufficient
data in both cases is one year of sequential data.
The fourth and final process is to review all the SVI data collected from Google Trends to
confirm that the data is on a weekly level. When listing results Google Trends does not
indicate if the results are on a weekly basis or a monthly basis. When there are relatively few
search queries the data is delivered at a monthly level. This timeframe however does not suite
the study, since the interest is in capturing investor attention close to the event. For instance in
the DEG (2011) study price pressure was strong for one week and price reversal started on the
third week after high SVI. To compare results with the DEG (2011) study, weekly data is
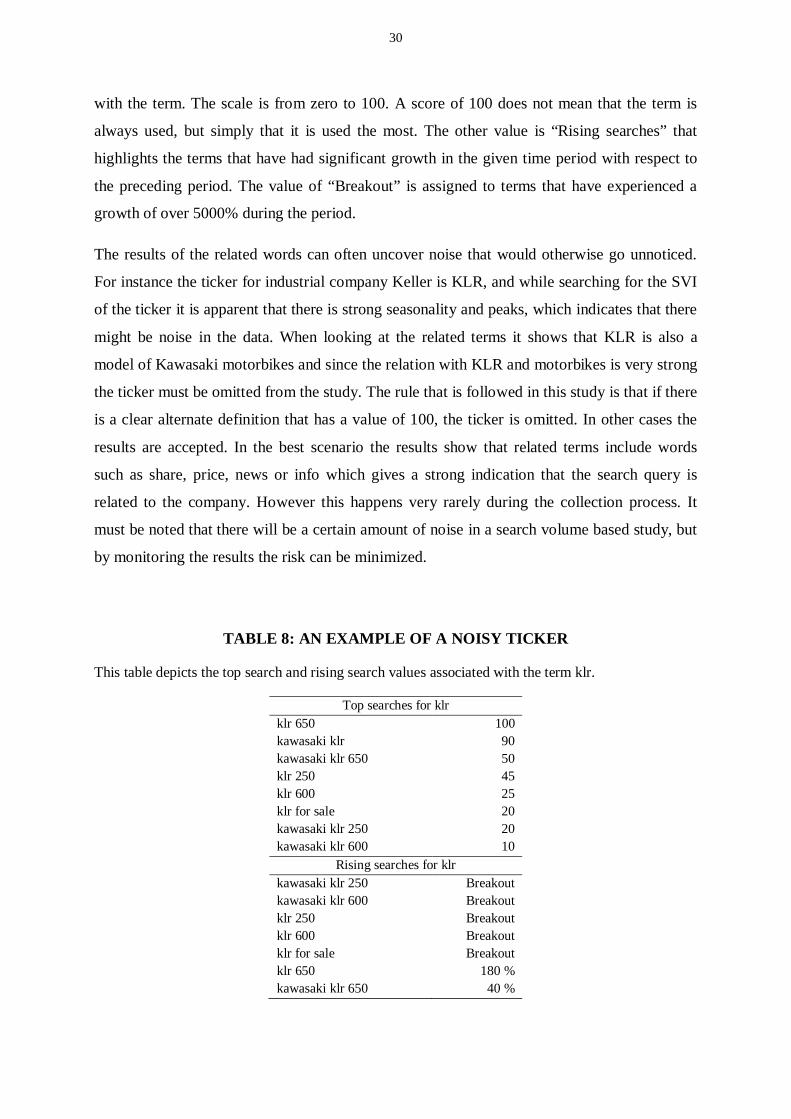
mandatory. Table 9 depicts the initial sample size, the omission per process and the final
sample size.
TABLE 9: FINAL SAMPLE SIZE
This table depicts the final sample size and the different processes that have defined it.
Data Volume
FTSE AllShare constituents 2012 601Additional constituents during 2004-2012 57Total constituents 658
Investments trusts 178Noisy tickers - pre search 63Noisy tickers - post search 102Insufficient company data 59Insufficient SVI data 98Only monthly SVI 65Final sample size 93
32
4.2.2. SAMPLE CHARACTERISTICS
This Section describes the sample characteristics from different perspectives. The first thing
to note is that the sample size has shrunk during the data collection process to 15% of its
original size. To understand the results of the study it is valuable to understand what has been
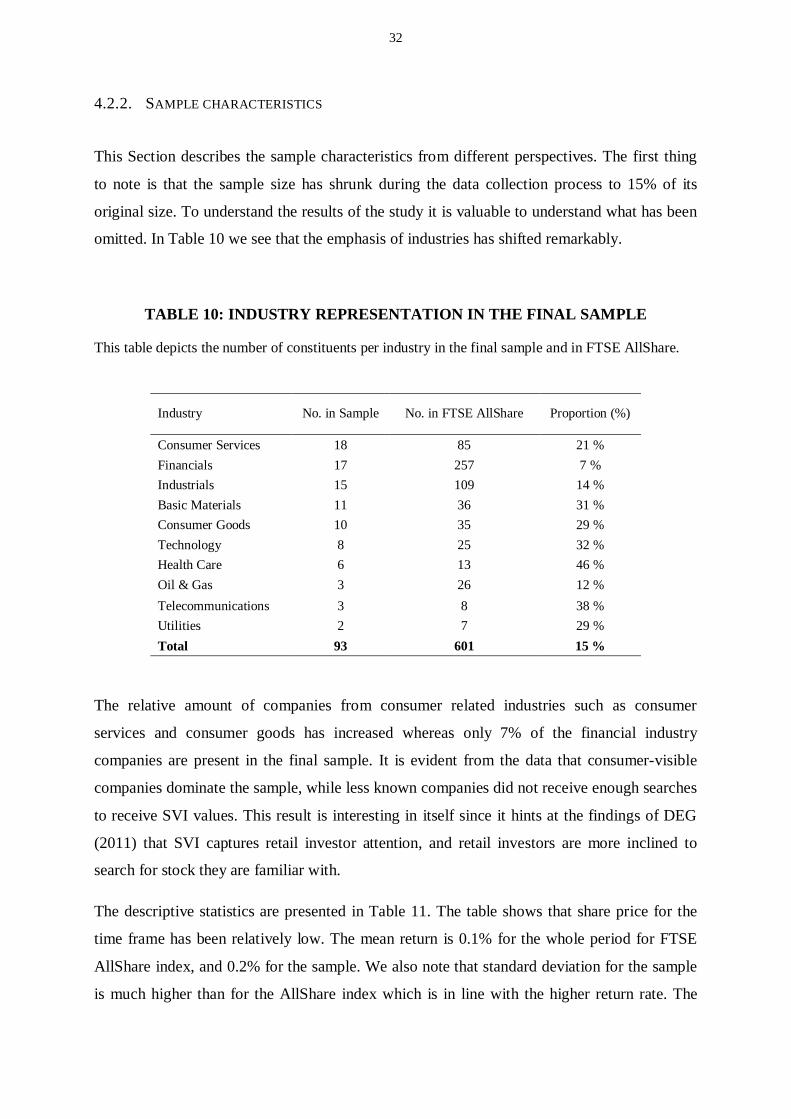
omitted. In Table 10 we see that the emphasis of industries has shifted remarkably.
TABLE 10: INDUSTRY REPRESENTATION IN THE FINAL SAMPLE
This table depicts the number of constituents per industry in the final sample and in FTSE AllShare.
Industry No. in Sample No. in FTSE AllShare Proportion (%)
Consumer Services 18 85 21 %Financials 17 257 7 %Industrials 15 109 14 %Basic Materials 11 36 31 %Consumer Goods 10 35 29 %Technology 8 25 32 %Health Care 6 13 46 %Oil & Gas 3 26 12 %Telecommunications 3 8 38 %Utilities 2 7 29 %Total 93 601 15 %
The relative amount of companies from consumer related industries such as consumer
services and consumer goods has increased whereas only 7% of the financial industry
companies are present in the final sample. It is evident from the data that consumer-visible
companies dominate the sample, while less known companies did not receive enough searches
to receive SVI values. This result is interesting in itself since it hints at the findings of DEG
(2011) that SVI captures retail investor attention, and retail investors are more inclined to
search for stock they are familiar with.
The descriptive statistics are presented in Table 11. The table shows that share price for the
time frame has been relatively low. The mean return is 0.1% for the whole period for FTSE
AllShare index, and 0.2% for the sample. We also note that standard deviation for the sample
is much higher than for the AllShare index which is in line with the higher return rate. The
33
important thing to note is the possible effect of the recession and participant withdrawal from
the equity market, due to the low investment outlooks. If equity is not interesting for the retail
investor, their attention might divert to something else, as has been shown by analyzing the
link between economic downturn and the rising search frequency for gold (The Economist,
2011).
The other interesting finding is the behavior of the two different SVI values. The SVI
collected from the UK market has a standard deviation value that is twice as large as that of
SVI global. This is rational due to the fact that there are fewer participants that generate
search volume in the UK. The global value carries with it more general noise, which makes
singular attention peaks more difficult to attain. The same effect can be noticed from the mean
values of the SVI’s. The UK SVI mean is nearly 30% smaller than the global value, meaning
that the general attention is lower. It can be that the lower amount of noise enables the more
volatile UK SVI to have stronger predictive power, but it is also possible that the results
might suffer due to insufficient data.
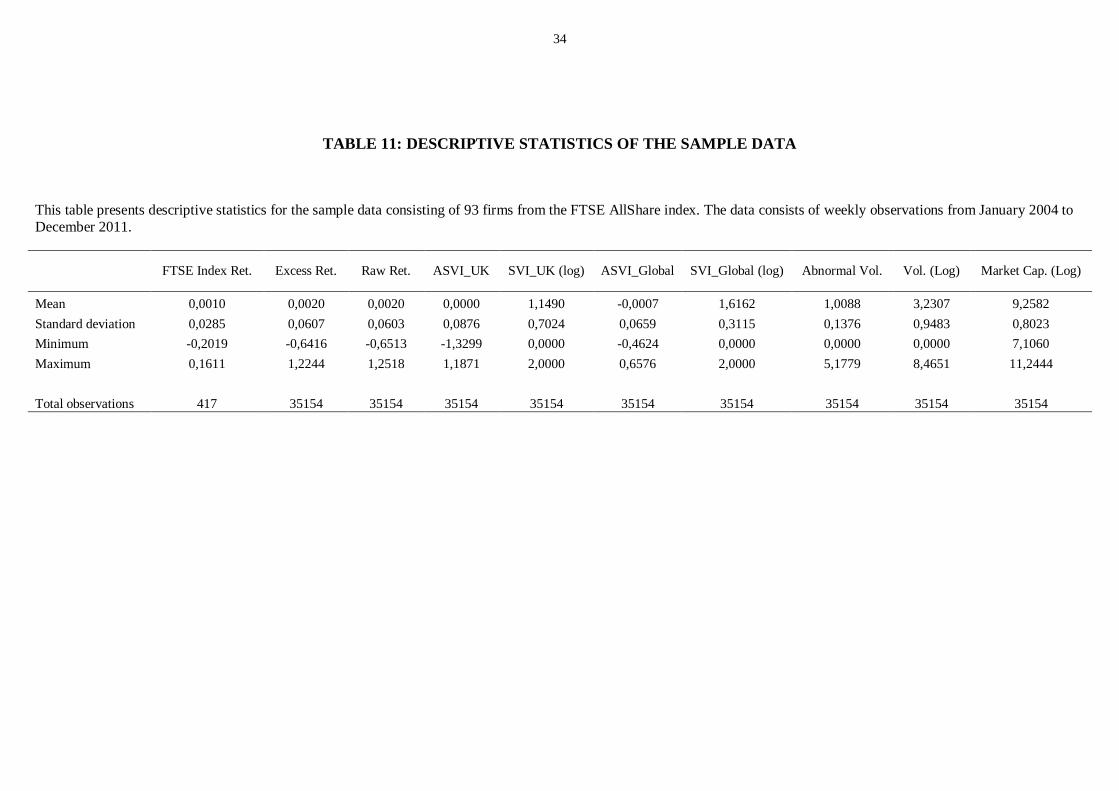
34
TABLE 11: DESCRIPTIVE STATISTICS OF THE SAMPLE DATA
This table presents descriptive statistics for the sample data consisting of 93 firms from the FTSE AllShare index. The data consists of weekly observations from January 2004 toDecember 2011.
FTSE Index Ret. Excess Ret. Raw Ret. ASVI_UK SVI_UK (log) ASVI_Global SVI_Global (log) Abnormal Vol. Vol. (Log) Market Cap. (Log)
Mean 0,0010 0,0020 0,0020 0,0000 1,1490 -0,0007 1,6162 1,0088 3,2307 9,2582Standard deviation 0,0285 0,0607 0,0603 0,0876 0,7024 0,0659 0,3115 0,1376 0,9483 0,8023Minimum -0,2019 -0,6416 -0,6513 -1,3299 0,0000 -0,4624 0,0000 0,0000 0,0000 7,1060Maximum 0,1611 1,2244 1,2518 1,1871 2,0000 0,6576 2,0000 5,1779 8,4651 11,2444
Total observations 417 35154 35154 35154 35154 35154 35154 35154 35154 35154
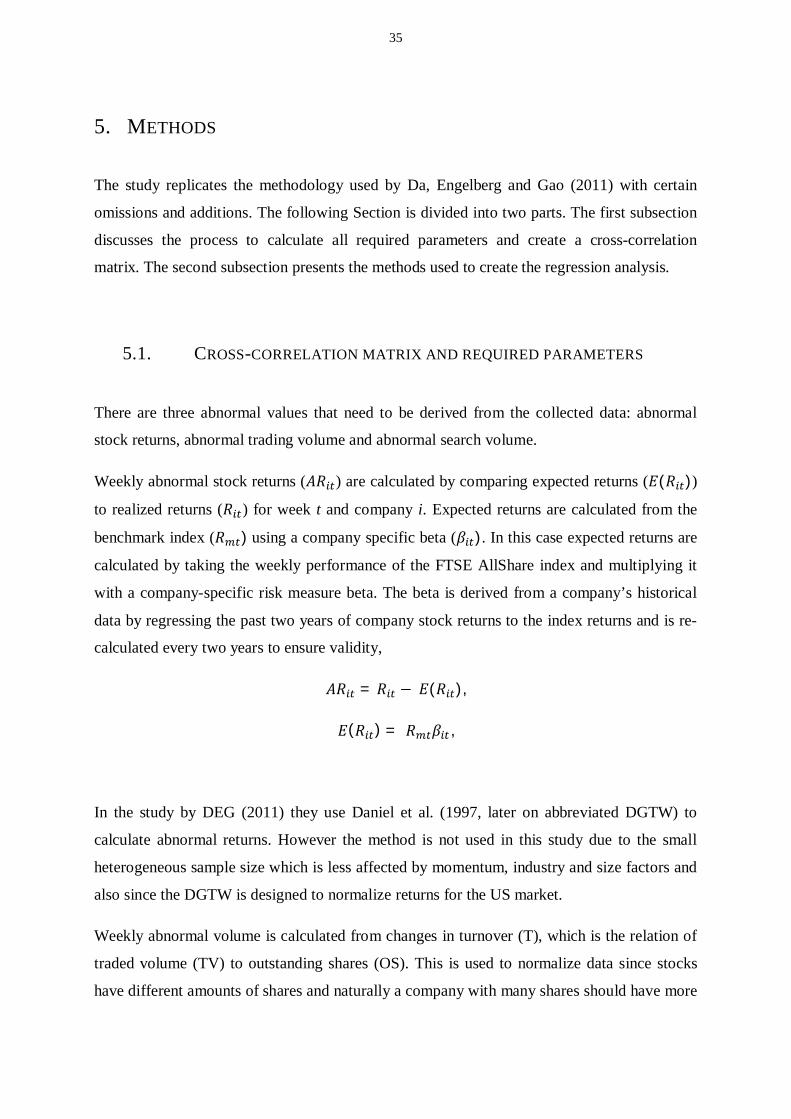
35
5. METHODS
The study replicates the methodology used by Da, Engelberg and Gao (2011) with certain
omissions and additions. The following Section is divided into two parts. The first subsection
discusses the process to calculate all required parameters and create a cross-correlation
matrix. The second subsection presents the methods used to create the regression analysis.
5.1. CROSS-CORRELATION MATRIX AND REQUIRED PARAMETERS
There are three abnormal values that need to be derived from the collected data: abnormal
stock returns, abnormal trading volume and abnormal search volume.
Weekly abnormal stock returns ( ) are calculated by comparing expected returns ( ( ))
to realized returns ( ) for week t and company i. Expected returns are calculated from the
benchmark index ( ) using a company specific beta ( ). In this case expected returns are
calculated by taking the weekly performance of the FTSE AllShare index and multiplying it
with a company-specific risk measure beta. The beta is derived from a company’s historical
data by regressing the past two years of company stock returns to the index returns and is re-
calculated every two years to ensure validity,
= ( ),
( ) = ,
In the study by DEG (2011) they use Daniel et al. (1997, later on abbreviated DGTW) to
calculate abnormal returns. However the method is not used in this study due to the small
heterogeneous sample size which is less affected by momentum, industry and size factors and
also since the DGTW is designed to normalize returns for the US market.
Weekly abnormal volume is calculated from changes in turnover (T), which is the relation of
traded volume (TV) to outstanding shares (OS). This is used to normalize data since stocks
have different amounts of shares and naturally a company with many shares should have more

36
trade volume than a company with fewer shares. To calculate abnormal volume (AV) we use
a similar method to ASVI calculation (applied from DEG (2011)) where we compare the
current turnover to the median of the past eight weeks to find peaks of abnormal volume,
= ,
= ( 1, . . . , 8)_ ,
It is important to find the abnormal attention peaks in the search volume (SVI) data. To do
this we calculate a new variable called abnormal search volume (ASVI) which is the log of
SVI during the week minus the log median SVI during the previous eight weeks, as was done
in the study by DEG (2011). This enables to find the important attention peaks that are tested
against the company’s own share price and trade volume. The formula below depicts how the
ASVI is derived,
= ( 1, . . . , 8)_ ,
In situations where there is no available data for share price, trade volume or search volume
that firm-week is omitted from the study.
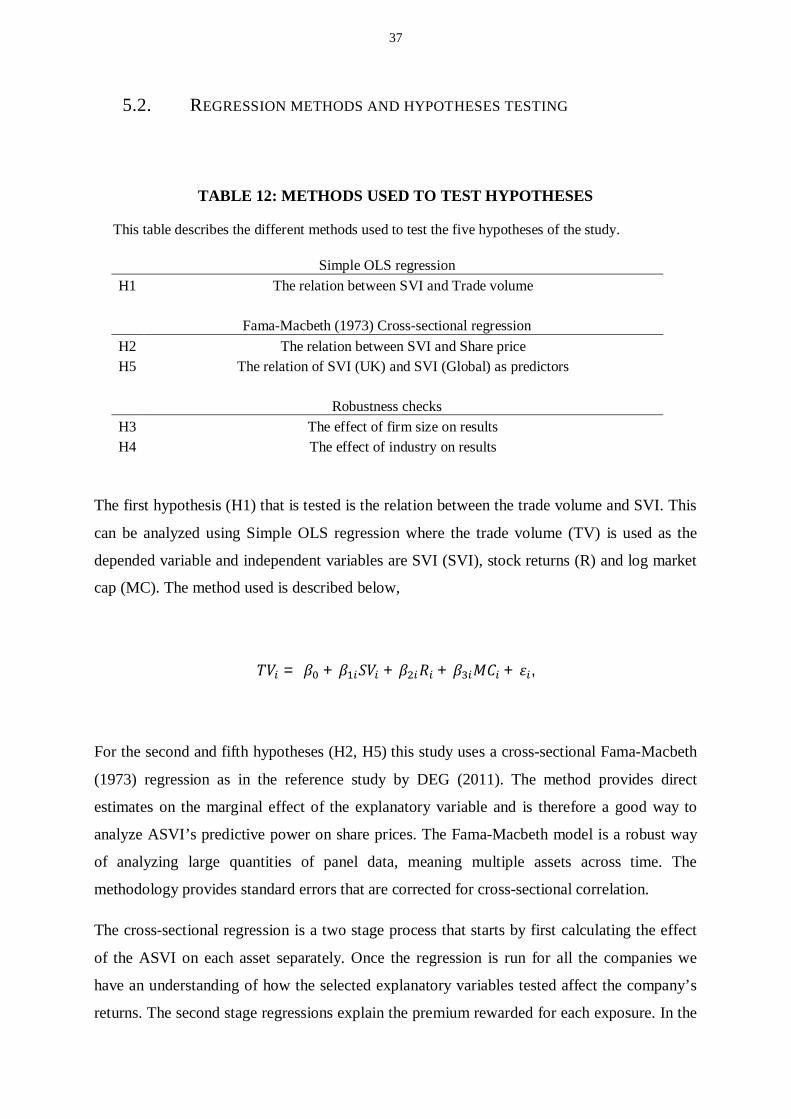
37
5.2. REGRESSION METHODS AND HYPOTHESES TESTING
TABLE 12: METHODS USED TO TEST HYPOTHESES
This table describes the different methods used to test the five hypotheses of the study.
Simple OLS regressionH1 The relation between SVI and Trade volume
Fama-Macbeth (1973) Cross-sectional regressionH2 The relation between SVI and Share priceH5 The relation of SVI (UK) and SVI (Global) as predictors
Robustness checksH3 The effect of firm size on resultsH4 The effect of industry on results
The first hypothesis (H1) that is tested is the relation between the trade volume and SVI. This
can be analyzed using Simple OLS regression where the trade volume (TV) is used as the
depended variable and independent variables are SVI (SVI), stock returns (R) and log market
cap (MC). The method used is described below,
= + + + + ,
For the second and fifth hypotheses (H2, H5) this study uses a cross-sectional Fama-Macbeth
(1973) regression as in the reference study by DEG (2011). The method provides direct
estimates on the marginal effect of the explanatory variable and is therefore a good way to
analyze ASVI’s predictive power on share prices. The Fama-Macbeth model is a robust way
of analyzing large quantities of panel data, meaning multiple assets across time. The
methodology provides standard errors that are corrected for cross-sectional correlation.
The cross-sectional regression is a two stage process that starts by first calculating the effect
of the ASVI on each asset separately. Once the regression is run for all the companies we
have an understanding of how the selected explanatory variables tested affect the company’s
returns. The second stage regressions explain the premium rewarded for each exposure. In the

38
second regression all asset returns for a fixed time period are regressed using the estimates
from the first regression. In this study there are five different time horizons for which the
dependent variable future (t+1) abnormal returns (calculated in basis points) are regressed; the
first four weeks and then the remaining year (weeks 5-52).
The following regression is run to calculate the weekly estimates for the coefficients,
= + + = 1,2, … , ,
where ARit is the abnormal return on stock i in week t. T is the total number of weeks in the
sample. Xkit are the potential explanatory variables in cross-sectional expected returns. As a
base set of these determinants of the cross-sections of returns the study uses the abnormal
search volume (ASVI), trade volume (TV) and market cap (MC). In practice the regression is
run for 93 companies weekly for duration of 8 years (January 2004 to December 2011). The
results are reported in the following Section.
For the third and fourth hypothesis (H3, H4) the study conducts a robustness analysis where
the data is sorted based on market cap and industry to see how the effects change based on
different cross-sections of the data.
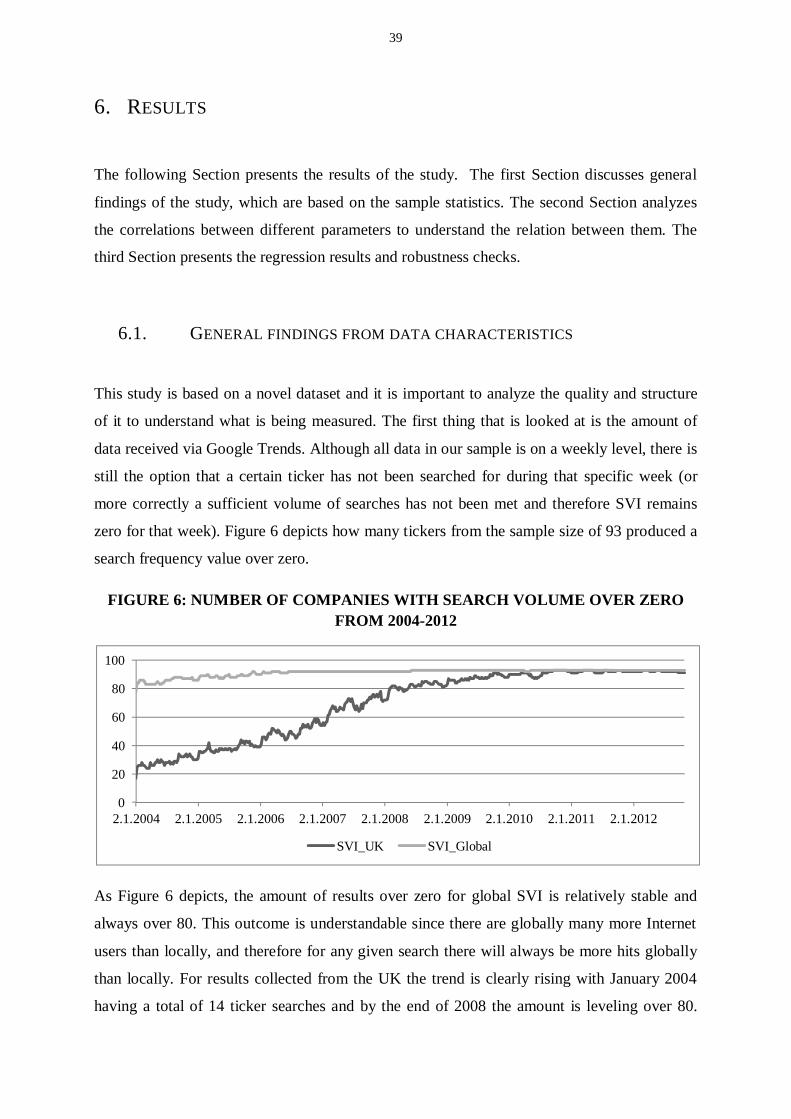
39
6. RESULTS
The following Section presents the results of the study. The first Section discusses general
findings of the study, which are based on the sample statistics. The second Section analyzes
the correlations between different parameters to understand the relation between them. The
third Section presents the regression results and robustness checks.
6.1. GENERAL FINDINGS FROM DATA CHARACTERISTICS
This study is based on a novel dataset and it is important to analyze the quality and structure
of it to understand what is being measured. The first thing that is looked at is the amount of
data received via Google Trends. Although all data in our sample is on a weekly level, there is
still the option that a certain ticker has not been searched for during that specific week (or
more correctly a sufficient volume of searches has not been met and therefore SVI remains
zero for that week). Figure 6 depicts how many tickers from the sample size of 93 produced a
search frequency value over zero.
FIGURE 6: NUMBER OF COMPANIES WITH SEARCH VOLUME OVER ZEROFROM 2004-2012
As Figure 6 depicts, the amount of results over zero for global SVI is relatively stable and
always over 80. This outcome is understandable since there are globally many more Internet
users than locally, and therefore for any given search there will always be more hits globally
than locally. For results collected from the UK the trend is clearly rising with January 2004
having a total of 14 ticker searches and by the end of 2008 the amount is leveling over 80.
0
20
40
60
80
100
2.1.2004 2.1.2005 2.1.2006 2.1.2007 2.1.2008 2.1.2009 2.1.2010 2.1.2011 2.1.2012
SVI_UK SVI_Global
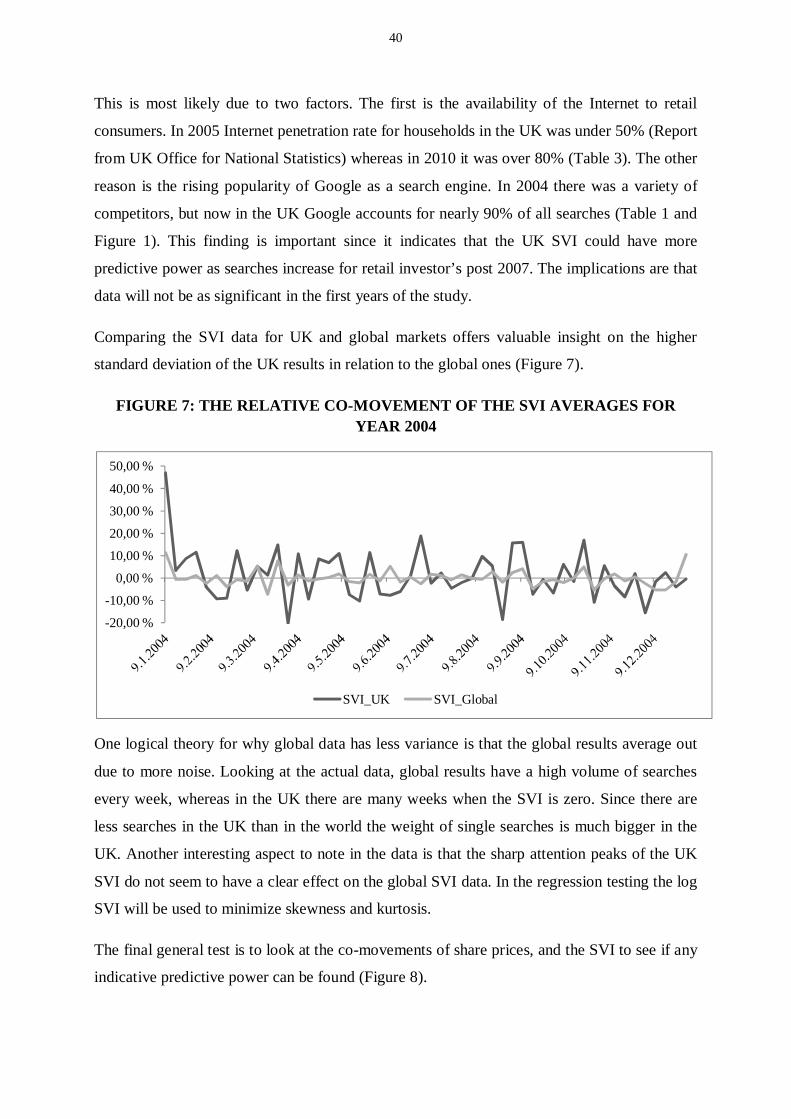
40
This is most likely due to two factors. The first is the availability of the Internet to retail
consumers. In 2005 Internet penetration rate for households in the UK was under 50% (Report
from UK Office for National Statistics) whereas in 2010 it was over 80% (Table 3). The other
reason is the rising popularity of Google as a search engine. In 2004 there was a variety of
competitors, but now in the UK Google accounts for nearly 90% of all searches (Table 1 and
Figure 1). This finding is important since it indicates that the UK SVI could have more
predictive power as searches increase for retail investor’s post 2007. The implications are that
data will not be as significant in the first years of the study.
Comparing the SVI data for UK and global markets offers valuable insight on the higher
standard deviation of the UK results in relation to the global ones (Figure 7).
FIGURE 7: THE RELATIVE CO-MOVEMENT OF THE SVI AVERAGES FORYEAR 2004
One logical theory for why global data has less variance is that the global results average out
due to more noise. Looking at the actual data, global results have a high volume of searches
every week, whereas in the UK there are many weeks when the SVI is zero. Since there are
less searches in the UK than in the world the weight of single searches is much bigger in the
UK. Another interesting aspect to note in the data is that the sharp attention peaks of the UK
SVI do not seem to have a clear effect on the global SVI data. In the regression testing the log
SVI will be used to minimize skewness and kurtosis.
The final general test is to look at the co-movements of share prices, and the SVI to see if any
indicative predictive power can be found (Figure 8).
-20,00 %
-10,00 %
0,00 %
10,00 %
20,00 %
30,00 %
40,00 %
50,00 %
SVI_UK SVI_Global
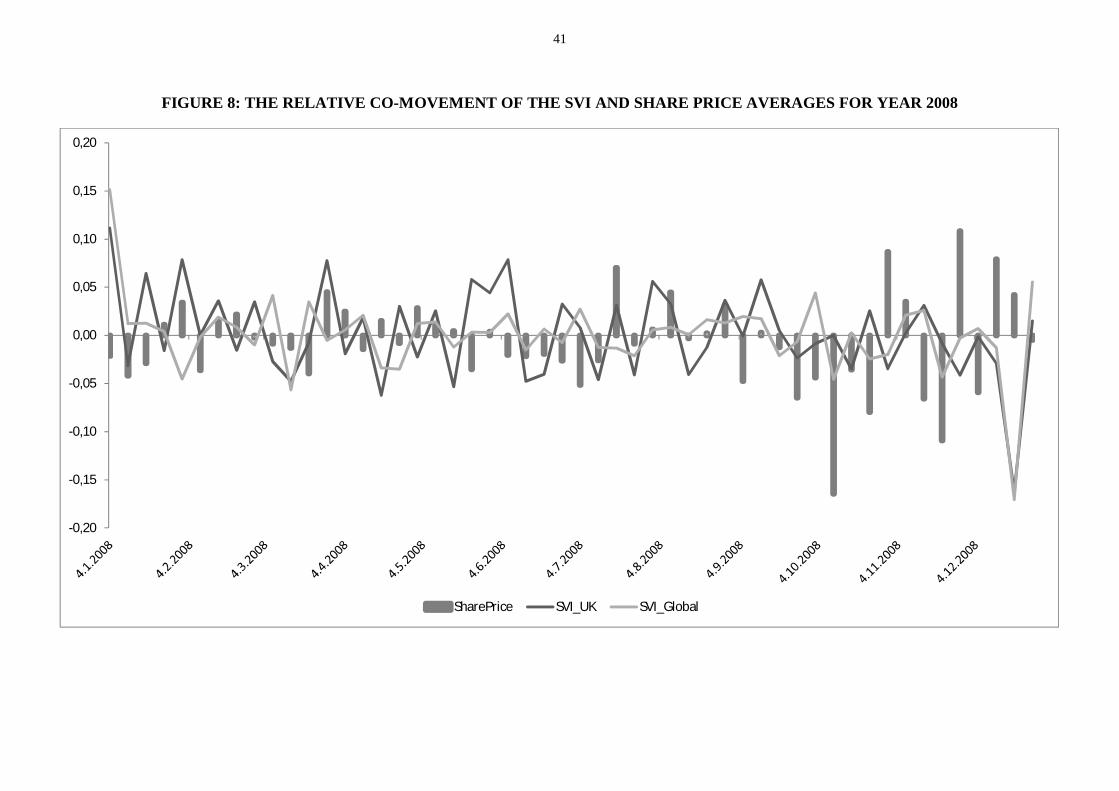
41
FIGURE 8: THE RELATIVE CO-MOVEMENT OF THE SVI AND SHARE PRICE AVERAGES FOR YEAR 2008
-0,20
-0,15
-0,10
-0,05
0,00
0,05
0,10
0,15
0,20
SharePrice SVI_UK SVI_Global
42
Figure 8 depicts the co-movement of the UK SVI, SVI Global and the share price, by
calculating the relative change per week for all companies in the sample in 2008. Two distinct
findings can be made from Figure 8.
Firstly, there seems to be very little co-movement between the SVI values and the share price,
especially the extreme peaks seem unrelated. The huge share price dips in the end of 2008, or
the subsequent bounce backs do not seem to create similar reactions in the SVI. The same
effect can be viewed in the SVI data, where especially UK SVI seems to have erratic peaks
through-out the year.
The other finding is that the ticker SVI is very high in the beginning of January and low at the
end December. Upon analyzing the data we find this result repeats itself year after year. If
ticker SVI indicates investor attention, one assumption that could be made is that in December
the retail investors are occupied with the holiday season and their attention toward stock
tickers decreases. In January the interest raises once again after the holiday. This could point
to the fact that the SVI captures retail investor’s attention due to the seasonality of the results,
whereas institutional investors do not react to seasonality as much. However, if the SVI does
not capture investor attention, then the effect most likely attributes to the general search
volume seasonality.
6.2. CROSS-CORRELATION MATRIX
The values of the correlation between sample variables are presented in Table 13. The values
are calculated on same-week basis and there is no lag in the data. There are multiple points to
note from the matrix. Firstly the correlation between returns and other sample variables seems
to be quite low. This is in line with the findings of the DEG (2011) paper that finds the
correlation between abnormal return and turnover to be 0,059 and 0,035 respectively, which is
explained by the fact that there are multiple factors contributing to share price movement.
The second finding in the correlation matrix is on the relation between SVI UK and SVI
Global. The correlation value of 0,319 indicates some relation between the two variables,
which means that there is a link between searches happening in the UK and around the world.
However the explanation for this value can be contributed to at least three effects.
43
The first explanation is the general seasonality of the searches. There are clear high and low
periods for search activity, such as the start of the year as a high peak and the end of the year
as a low peak. Therefore it can be that the relation simply has to do with general search
volume happening at the same time, not that investors in the UK and around the world are
analyzing the same company. The second explanation is that there is a noise value that is
being picked up by the correlation. While gathering the SVI data, it becomes evident how
much noise simple ticker symbols can generate. Therefore it can be that Internet users are
searching for something unrelated to the company, but it still gets captured in the SVI value.
The third explanation is that there is a link between the investors in UK and around the world
searching for company information and it is being captured. In any case the key finding is that
the UK and global SVI’s are capturing different attention for the most part and therefore it is
valuable that this study analyzes both separately.
The third finding is the relation between the trade volume and SVI values. There seems to be
a small correlation between UK SVI and trade volume. In the next chapter the study uses the
Fama-Macbeth method to understand the relation in more a significant manor. Since the data
is not lagged, it is possible that stronger links can be found once multiple time variables are
introduced into the analysis.
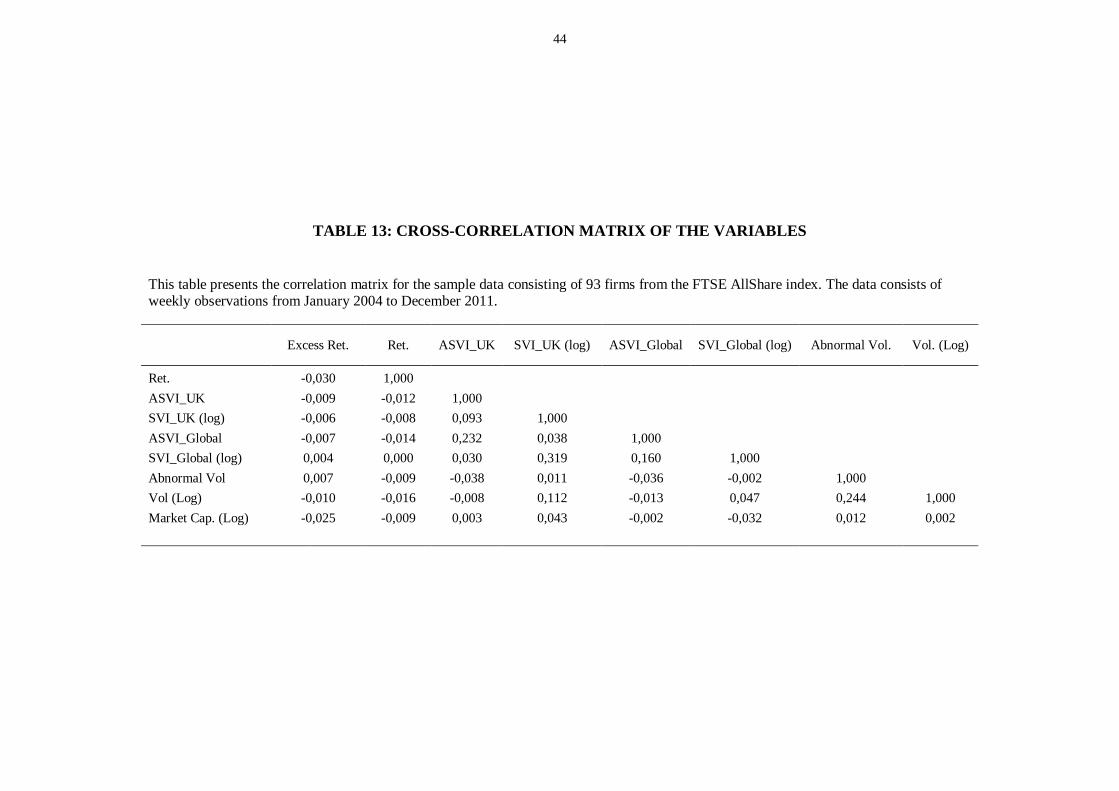
44
TABLE 13: CROSS-CORRELATION MATRIX OF THE VARIABLES
This table presents the correlation matrix for the sample data consisting of 93 firms from the FTSE AllShare index. The data consists ofweekly observations from January 2004 to December 2011.
Excess Ret. Ret. ASVI_UK SVI_UK (log) ASVI_Global SVI_Global (log) Abnormal Vol. Vol. (Log)
Ret. -0,030 1,000ASVI_UK -0,009 -0,012 1,000SVI_UK (log) -0,006 -0,008 0,093 1,000ASVI_Global -0,007 -0,014 0,232 0,038 1,000SVI_Global (log) 0,004 0,000 0,030 0,319 0,160 1,000Abnormal Vol 0,007 -0,009 -0,038 0,011 -0,036 -0,002 1,000Vol (Log) -0,010 -0,016 -0,008 0,112 -0,013 0,047 0,244 1,000Market Cap. (Log) -0,025 -0,009 0,003 0,043 -0,002 -0,032 0,012 0,002
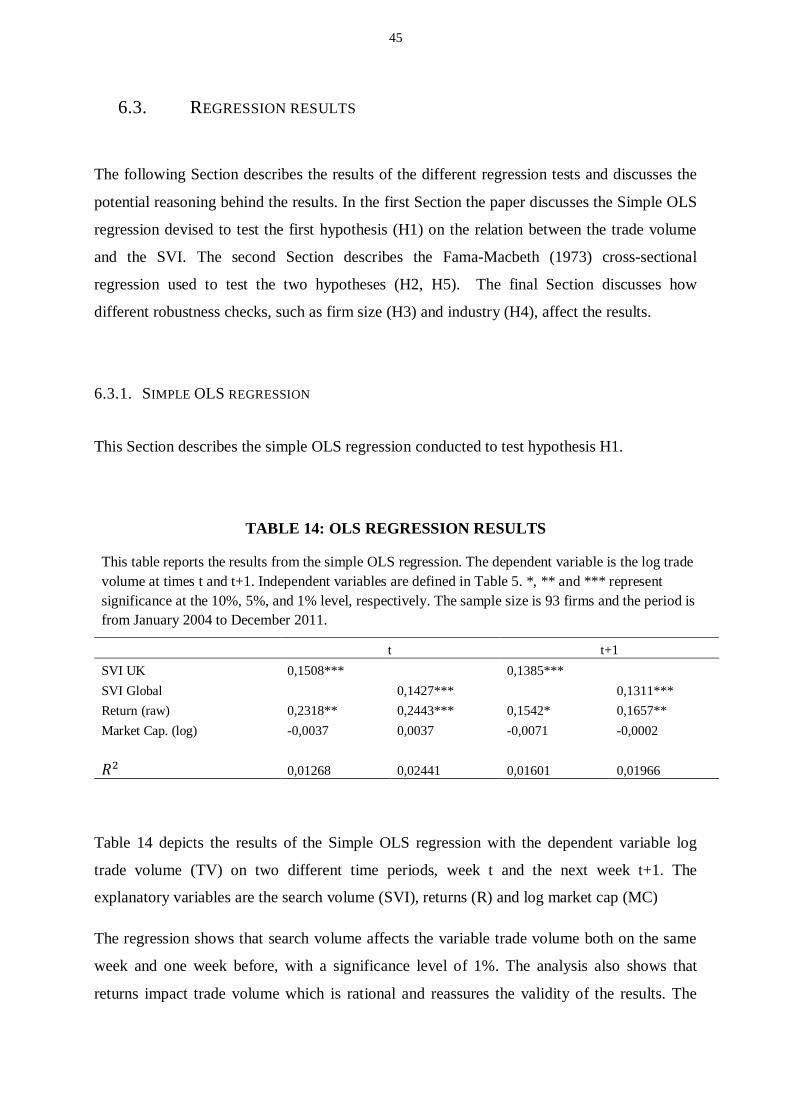
45
6.3. REGRESSION RESULTS
The following Section describes the results of the different regression tests and discusses the
potential reasoning behind the results. In the first Section the paper discusses the Simple OLS
regression devised to test the first hypothesis (H1) on the relation between the trade volume
and the SVI. The second Section describes the Fama-Macbeth (1973) cross-sectional
regression used to test the two hypotheses (H2, H5). The final Section discusses how
different robustness checks, such as firm size (H3) and industry (H4), affect the results.
6.3.1. SIMPLE OLS REGRESSION
This Section describes the simple OLS regression conducted to test hypothesis H1.
TABLE 14: OLS REGRESSION RESULTS
This table reports the results from the simple OLS regression. The dependent variable is the log tradevolume at times t and t+1. Independent variables are defined in Table 5. *, ** and *** representsignificance at the 10%, 5%, and 1% level, respectively. The sample size is 93 firms and the period isfrom January 2004 to December 2011.
t t+1SVI UK 0,1508*** 0,1385***SVI Global 0,1427*** 0,1311***Return (raw) 0,2318** 0,2443*** 0,1542* 0,1657**Market Cap. (log) -0,0037 0,0037 -0,0071 -0,0002
0,01268 0,02441 0,01601 0,01966
Table 14 depicts the results of the Simple OLS regression with the dependent variable log
trade volume (TV) on two different time periods, week t and the next week t+1. The
explanatory variables are the search volume (SVI), returns (R) and log market cap (MC)
The regression shows that search volume affects the variable trade volume both on the same
week and one week before, with a significance level of 1%. The analysis also shows that
returns impact trade volume which is rational and reassures the validity of the results. The
46
third variable market cap does not seem to have any explanatory power in relation to the trade
volume, which once again is reassuring, since trade volume in this regression is calculated as
trades per day. The effect is positive which means that a higher SVI or return increases trade
volume, which is the logical relation and supports the price pressure hypothesis of Barber and
Odean (2009).
This result does not yet identify the relative strength between SVI UK and SVI Global. Both
produce significant results, and the values are close to each other, although a little higher
on the SVI Global regressions.
Based on these results, the H1 hypothesis can be accepted. The analysis finds a simple but
significant link between the trade volume and the ticker search volume. This result provides
reassurance on the connection between SVI and company shares. In the next section the more
complex Fama-Macbeth (1973) regression is presented, which analyzes the predictive power
of the SVI on the stock price.
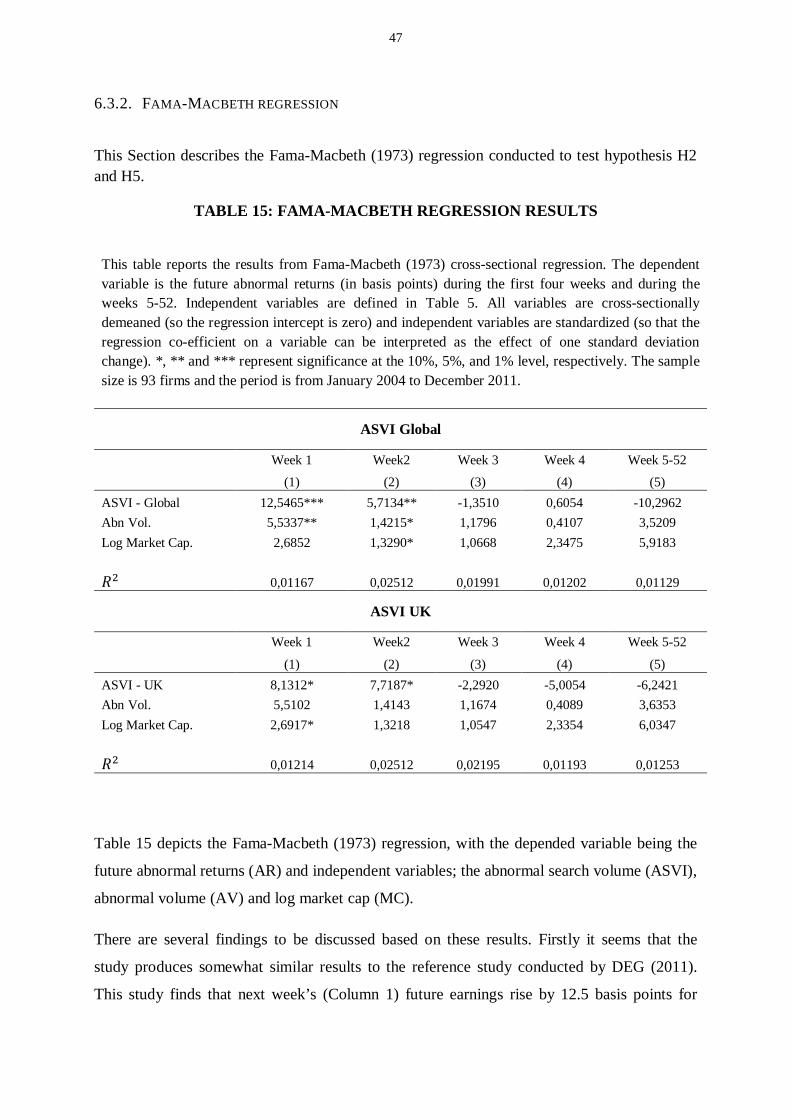
47
6.3.2. FAMA-MACBETH REGRESSION
This Section describes the Fama-Macbeth (1973) regression conducted to test hypothesis H2and H5.
TABLE 15: FAMA-MACBETH REGRESSION RESULTS
This table reports the results from Fama-Macbeth (1973) cross-sectional regression. The dependentvariable is the future abnormal returns (in basis points) during the first four weeks and during theweeks 5-52. Independent variables are defined in Table 5. All variables are cross-sectionallydemeaned (so the regression intercept is zero) and independent variables are standardized (so that theregression co-efficient on a variable can be interpreted as the effect of one standard deviationchange). *, ** and *** represent significance at the 10%, 5%, and 1% level, respectively. The samplesize is 93 firms and the period is from January 2004 to December 2011.
ASVI Global
Week 1 Week2 Week 3 Week 4 Week 5-52
(1) (2) (3) (4) (5)ASVI - Global 12,5465*** 5,7134** -1,3510 0,6054 -10,2962Abn Vol. 5,5337** 1,4215* 1,1796 0,4107 3,5209Log Market Cap. 2,6852 1,3290* 1,0668 2,3475 5,9183
0,01167 0,02512 0,01991 0,01202 0,01129
ASVI UK
Week 1 Week2 Week 3 Week 4 Week 5-52
(1) (2) (3) (4) (5)ASVI - UK 8,1312* 7,7187* -2,2920 -5,0054 -6,2421Abn Vol. 5,5102 1,4143 1,1674 0,4089 3,6353Log Market Cap. 2,6917* 1,3218 1,0547 2,3354 6,0347
0,01214 0,02512 0,02195 0,01193 0,01253
Table 15 depicts the Fama-Macbeth (1973) regression, with the depended variable being the
future abnormal returns (AR) and independent variables; the abnormal search volume (ASVI),
abnormal volume (AV) and log market cap (MC).
There are several findings to be discussed based on these results. Firstly it seems that the
study produces somewhat similar results to the reference study conducted by DEG (2011).
This study finds that next week’s (Column 1) future earnings rise by 12.5 basis points for
48
every one-standard-deviation increase in ASVI Global. This effect is significant at the 1%
level for ASVI Global variable and at the 10% level for the UK ASVI. This study also finds
slight price reversal in the following weeks, although the effect is not as strong as documented
by DEG (2011). The study shows that for ASVI Global, slight price reversal happens at week
3 (Column 3), but during week 4 (Column 4) it returns to having a positive effect. The
reversal returns when looking at the rest of the year (Column 5). The regression shows that
search volume collected globally (without location filters) is significantly better at predicting
abnormal returns compared to results collected from IP-addresses originating from the UK.
Based on these results we can accept the H2 hypothesis, with some conditions, since we do
find a significant positive effect between search volume increase today and the share price
increase next week. However the study does not produce significant or proportionally
meaningful price reversal, so based on this regression the paper cannot conclude that price
reversal occurs in the following year.
Looking at the regression in more detail, it is interesting to notice that the predictive power of
ASVI Global for the first week is stronger in this study than in DEG (2011), but at the same
time the other results and price reversal do not show up with similar significance. Most likely
this is due to the fact that this study is run on 93 firms as opposed to the DEG (2011) study
which uses nearly 1,500 firms (nearly half of the Russell 3000 stock needed to be omitted due
to the lack of data). Due to smaller sample size firm specific effects can dominate the study
and thus affect the results. Furthermore it should be noted that consumer-related industries
dominated the sample, so there can also be some industry specific effects contributing to the
results. However this study does have a longer duration than the reference study and
companies that are in the final sample have been screened for excess noise, so the data itself is
of high quality, although there are necessary compromises to the quantity due to the arduous
SVI data collection process.
Another interesting result to notice is that the SVI values gathered globally are better at
predicting the stock prices than those gathered locally. This is a surprising result and
contradicts the final hypothesis (H5), in which it was assumed that local results must be
subject to less noise, since the amount of different meanings for a ticker symbols would be
narrowed down. When analyzing the SVI data collected from the UK, it is clear that the
sample is suffering from insufficient amounts of searches. There are very strong peaks in
attention, but they do not seem to be strongly correlated with share prices. There are also
49
technical reasons that can affect the results of the UK ASVI. It is possible that the algorithm
used by Google to calculate searches originating from the UK is somehow imperfect. It is
possible that it omits some searches to ensure data validity, or simple does not work as
intended. Since Google does not specify in detail how the filtering function works, it is
difficult to further analyze this assumption. There are also user dependent reasons that might
affect why the UK ASVI does not perform as well as assumed. Perhaps retail investors travel
around the world periodically and are not staying in the UK throughout the year. The IP-
address would then shift based on location, resulting in less valid searches in the local markets
than globally. An alternative explanation could be that the retail investors have set up their
computers to be IP-anonymous or perhaps their security settings do it automatically. Another
explanation could be that there are differences in retail investors in the UK and globally.
Perhaps UK investors use alternative data sources, such as news sites, blogs or more
traditional media such as newspapers. The one thing that is clear from the data is that for
some reason there are not enough search queries related to the company, as measured by
ticker SVI, originating from the UK based on the Google filter results.
Therefore the fifth hypothesis (H5) must be rejected and conclude that based on this study
SVI Global is a better proxy for investor attention and has a stronger predictive power
towards share price movements in the UK market.
6.3.3. ROBUSTNESS CHECKS
This Section describes the three different robustness checks conducted to further analyze the
predictive power of SVI. The aim of the robustness checks is gain understanding on the
following three different effects; how firm-size (H3), industry (H4) and the time frame affect
SVI’s predictive power.
For firm-size effects the study hypothesizes (H3), based on the DEG (2011) results, that the
effect should be bigger in smaller firms. The reasoning is that small cap firms are more
influenced by price pressure (Barber and Odean, 2009) and thus the effect of attention should
be stronger. To understand the effect that firm-size has on the SVI, two different portfolios
defined as small and large cap are formed. The same analysis as in the previous section is
conducted but separately for the two subsamples. The portfolios are not re-adjusted in this
50
robustness check since the consistency would not change significantly in the duration of eight
years with the sample companies.
For industry effects the study hypothesizes (H4) that consumer recognizable firms are subject
to stronger investor attention, since consumers are aware of them and thus are more inclined
to research and invest in them. This assumption is supported both by the availability heuristic
and attention theories presented by Barber and Odean (2009). During the study it has already
been concluded that the final sample is dominated by consumer centric firms as categorized
by the ICB industry codes. The relative amount of consumer service and consumer goods
industries increased while forming the final sample compared to their original representation
in FTSE AllShare. The reason for the increased representation was that many less consumer-
visible industries, such as financial or industry categories, did not receive enough searches for
their ticker sign to produce SVI values (Table 10). The study tests to see how consumer
recognizable industries are affect by the predictive power of the SVI by dividing the sample
companies into two portfolios; consumer visible industries and the rest. The portfolios are not
re-adjusted in this robustness check, since none of the 93 companies in the sample receive a
new industry code during the time frame of this study.
The final robustness check conducted is to see how two different time frames affect the
results. The sample is divided into two separate four year segments; the first subsample
consists of data from January 2004 to December 2007, and the second subsample from
January 2008 to December 2011. There are two conflicting assumptions that are tested in the
robustness check. One is that retail investors exit the equity market during the recession and
subsequent downturn of the FTSE AllShare (starting 2008-2009). Thus the results would be
weaker for the later subsample since there would be less retail investors. The other
assumption is that digital consumption increases as time progresses and users become more
accustomed to using the Internet for information gathering. Thus the results would be stronger
for the later subsample since there would be more retail investors using Google to search for
investment information.
Looking at the subsample’s descriptive data (Table 16) there are a few things to note. Firstly
the time frame divided portfolios show that the returns for the post-2007 subsample are much
lower and have double the standard deviation compared to the pre-2008 subsample, which
indicates the effects of the recession. The other point to note is that the general attention level
51
rises as time goes on, especially in the UK data. The data shows the mean search volume in
UK doubling between the two subsamples, which corroborate the findings in Figure 6.
For the industry and market cap cross-sections there are also a few results worth noting. First
it seems that the small market cap subsample includes nearly all the consumer recognizable
companies, in addition to other small companies. This would indicate that the results will be
very similar since consumer recognizable industries, as they are defined in this paper, are also
the smaller companies of the subsample. The consumer industry subsample underperforms the
other industries with almost four times smaller mean returns during the sample period, which
should affect results. Another interesting discovery is that SVI does not seem to be
significantly affected by firm industry or size since the mean attention level is very close. This
finding is in conflict with the idea that investors are following companies they are familiar
with. However since a single robustness check subsample consist of roughly 40-50
companies the implications of the results will not be very strong.
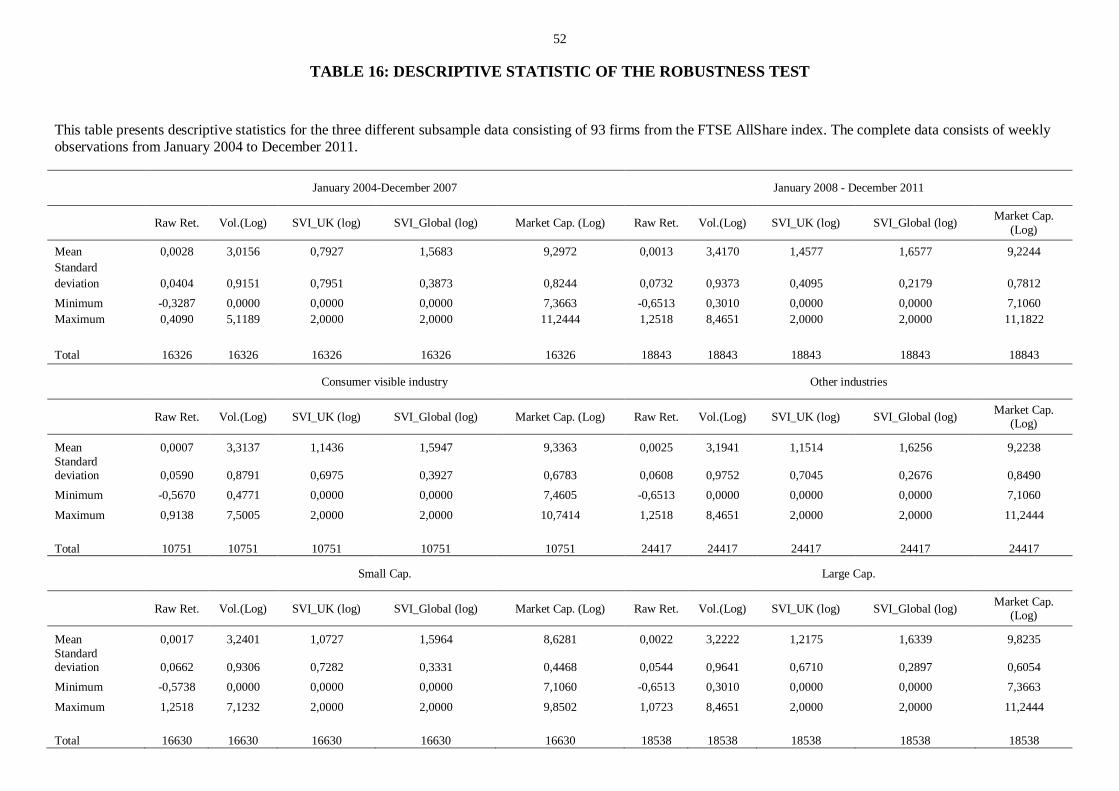
52
TABLE 16: DESCRIPTIVE STATISTIC OF THE ROBUSTNESS TEST
This table presents descriptive statistics for the three different subsample data consisting of 93 firms from the FTSE AllShare index. The complete data consists of weeklyobservations from January 2004 to December 2011.
January 2004-December 2007 January 2008 - December 2011
Raw Ret. Vol.(Log) SVI_UK (log) SVI_Global (log) Market Cap. (Log) Raw Ret. Vol.(Log) SVI_UK (log) SVI_Global (log) Market Cap.(Log)
Mean 0,0028 3,0156 0,7927 1,5683 9,2972 0,0013 3,4170 1,4577 1,6577 9,2244Standarddeviation 0,0404 0,9151 0,7951 0,3873 0,8244 0,0732 0,9373 0,4095 0,2179 0,7812Minimum -0,3287 0,0000 0,0000 0,0000 7,3663 -0,6513 0,3010 0,0000 0,0000 7,1060Maximum 0,4090 5,1189 2,0000 2,0000 11,2444 1,2518 8,4651 2,0000 2,0000 11,1822
Total 16326 16326 16326 16326 16326 18843 18843 18843 18843 18843
Consumer visible industry Other industries
Raw Ret. Vol.(Log) SVI_UK (log) SVI_Global (log) Market Cap. (Log) Raw Ret. Vol.(Log) SVI_UK (log) SVI_Global (log) Market Cap.(Log)
Mean 0,0007 3,3137 1,1436 1,5947 9,3363 0,0025 3,1941 1,1514 1,6256 9,2238Standarddeviation 0,0590 0,8791 0,6975 0,3927 0,6783 0,0608 0,9752 0,7045 0,2676 0,8490Minimum -0,5670 0,4771 0,0000 0,0000 7,4605 -0,6513 0,0000 0,0000 0,0000 7,1060
Maximum 0,9138 7,5005 2,0000 2,0000 10,7414 1,2518 8,4651 2,0000 2,0000 11,2444
Total 10751 10751 10751 10751 10751 24417 24417 24417 24417 24417
Small Cap. Large Cap.
Raw Ret. Vol.(Log) SVI_UK (log) SVI_Global (log) Market Cap. (Log) Raw Ret. Vol.(Log) SVI_UK (log) SVI_Global (log) Market Cap.(Log)
Mean 0,0017 3,2401 1,0727 1,5964 8,6281 0,0022 3,2222 1,2175 1,6339 9,8235Standarddeviation 0,0662 0,9306 0,7282 0,3331 0,4468 0,0544 0,9641 0,6710 0,2897 0,6054Minimum -0,5738 0,0000 0,0000 0,0000 7,1060 -0,6513 0,3010 0,0000 0,0000 7,3663
Maximum 1,2518 7,1232 2,0000 2,0000 9,8502 1,0723 8,4651 2,0000 2,0000 11,2444
Total 16630 16630 16630 16630 16630 18538 18538 18538 18538 18538
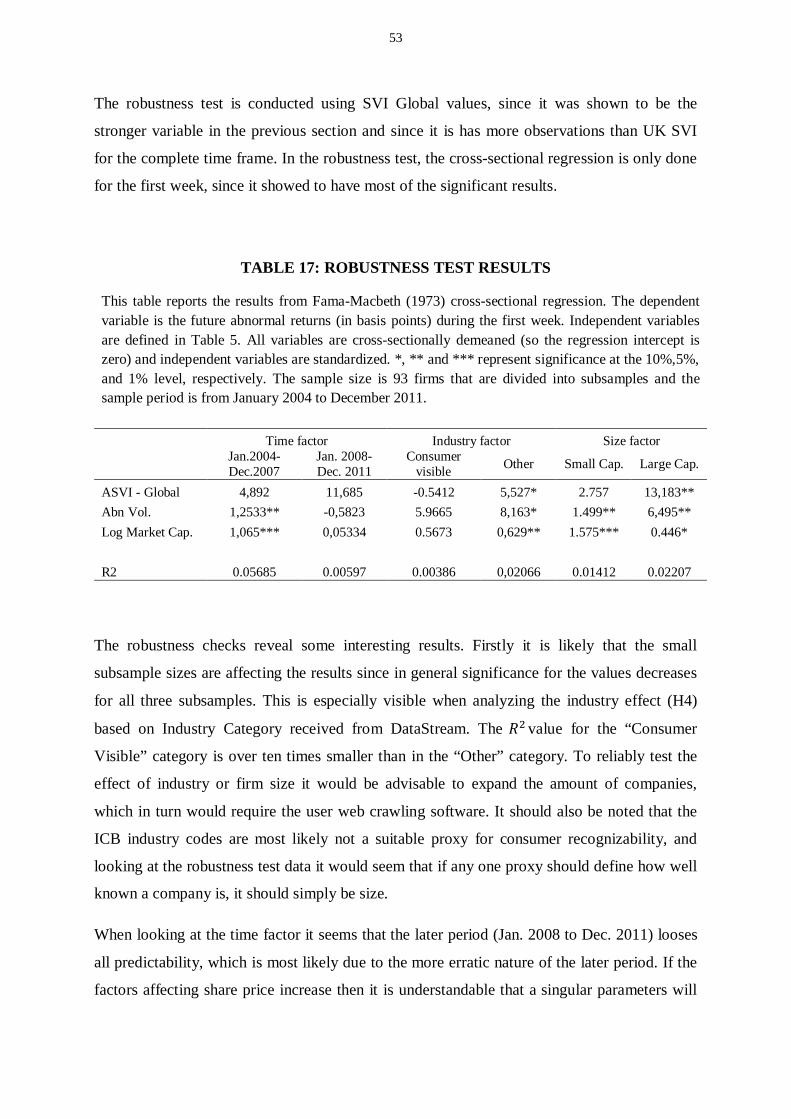
53
The robustness test is conducted using SVI Global values, since it was shown to be the
stronger variable in the previous section and since it is has more observations than UK SVI
for the complete time frame. In the robustness test, the cross-sectional regression is only done
for the first week, since it showed to have most of the significant results.
TABLE 17: ROBUSTNESS TEST RESULTS
This table reports the results from Fama-Macbeth (1973) cross-sectional regression. The dependentvariable is the future abnormal returns (in basis points) during the first week. Independent variablesare defined in Table 5. All variables are cross-sectionally demeaned (so the regression intercept iszero) and independent variables are standardized. *, ** and *** represent significance at the 10%,5%,and 1% level, respectively. The sample size is 93 firms that are divided into subsamples and thesample period is from January 2004 to December 2011.
Time factor Industry factor Size factorJan.2004-Dec.2007
Jan. 2008-Dec. 2011
Consumervisible Other Small Cap. Large Cap.
ASVI - Global 4,892 11,685 -0.5412 5,527* 2.757 13,183**Abn Vol. 1,2533** -0,5823 5.9665 8,163* 1.499** 6,495**Log Market Cap. 1,065*** 0,05334 0.5673 0,629** 1.575*** 0.446*
R2 0.05685 0.00597 0.00386 0,02066 0.01412 0.02207
The robustness checks reveal some interesting results. Firstly it is likely that the small
subsample sizes are affecting the results since in general significance for the values decreases
for all three subsamples. This is especially visible when analyzing the industry effect (H4)
based on Industry Category received from DataStream. The value for the “Consumer
Visible” category is over ten times smaller than in the “Other” category. To reliably test the
effect of industry or firm size it would be advisable to expand the amount of companies,
which in turn would require the user web crawling software. It should also be noted that the
ICB industry codes are most likely not a suitable proxy for consumer recognizability, and
looking at the robustness test data it would seem that if any one proxy should define how well
known a company is, it should simply be size.
When looking at the time factor it seems that the later period (Jan. 2008 to Dec. 2011) looses
all predictability, which is most likely due to the more erratic nature of the later period. If the
factors affecting share price increase then it is understandable that a singular parameters will
54
lose effectiveness. It can be assumed that the 2008-2009 period affects the stock prices in a
way that estimating future returns is more complex, and thus the predictive power of search
words diminishes.
The size factor robustness check shows that SVI has a bigger effect on large cap firms which
contradicts the findings of DEG (2011). There are multiple reasons for this result. One is that
in this specific study the small cap firms underperform in the eight year sample period the
large cap firms and therefore the results are affected. If there are fewer returns to predict, then
logically the predictive power should suffer. It is also possible that due to poor performance
attention has shifted from small firms to larger ones. Another reason is that small cap firms in
general do not get as many searches as bigger firms in this specific sample. This might be due
to the fact the bigger firms are more interesting to retail investors in the UK market, or simply
because the smaller a firm the less known it is. If we assume that bigger companies are more
known to investors then it is logical to assume that those are the firms searched for. It is valid
to assume investors cannot search for firms they do not know about. Therefore it can be that
the results are affected by large cap firms having more reliable and constant search volume
indicators whereas small cap firms are subject to more noise. Hence we cannot say that price
pressure is stronger for small cap firms (as presented by Barber and Odean, 2009), but neither
can we state that price pressure would be stronger for big cap firms. The result seem to
indicate that with large cap firms the ticker searches more often represent investor attention
towards the company than in small cap firms, and the most likely reasons is that they are more
known to the retail investors.
Based on these result we must reject both hypotheses H3 and H4. Based on this sample we
cannot conclude that SVI has a stronger effect on small cap firm or consumer centric
industries as defined in this study.
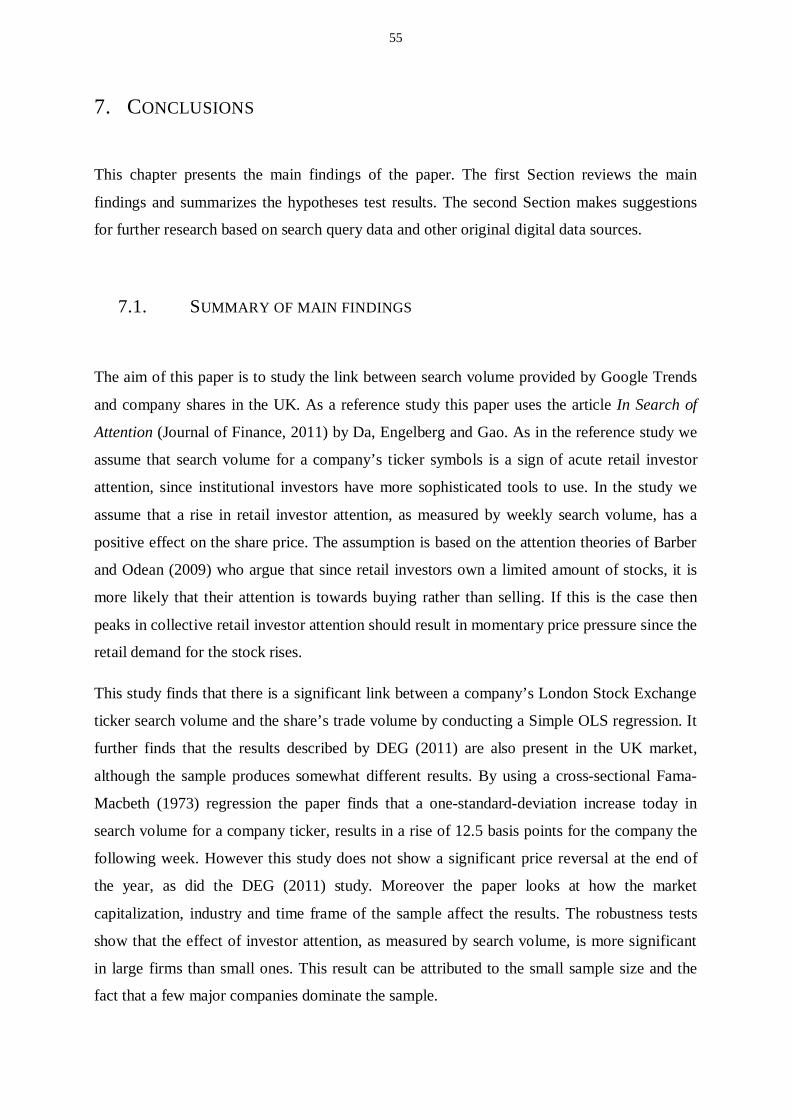
55
7. CONCLUSIONS
This chapter presents the main findings of the paper. The first Section reviews the main
findings and summarizes the hypotheses test results. The second Section makes suggestions
for further research based on search query data and other original digital data sources.
7.1. SUMMARY OF MAIN FINDINGS
The aim of this paper is to study the link between search volume provided by Google Trends
and company shares in the UK. As a reference study this paper uses the article In Search of
Attention (Journal of Finance, 2011) by Da, Engelberg and Gao. As in the reference study we
assume that search volume for a company’s ticker symbols is a sign of acute retail investor
attention, since institutional investors have more sophisticated tools to use. In the study we
assume that a rise in retail investor attention, as measured by weekly search volume, has a
positive effect on the share price. The assumption is based on the attention theories of Barber
and Odean (2009) who argue that since retail investors own a limited amount of stocks, it is
more likely that their attention is towards buying rather than selling. If this is the case then
peaks in collective retail investor attention should result in momentary price pressure since the
retail demand for the stock rises.
This study finds that there is a significant link between a company’s London Stock Exchange
ticker search volume and the share’s trade volume by conducting a Simple OLS regression. It
further finds that the results described by DEG (2011) are also present in the UK market,
although the sample produces somewhat different results. By using a cross-sectional Fama-
Macbeth (1973) regression the paper finds that a one-standard-deviation increase today in
search volume for a company ticker, results in a rise of 12.5 basis points for the company the
following week. However this study does not show a significant price reversal at the end of
the year, as did the DEG (2011) study. Moreover the paper looks at how the market
capitalization, industry and time frame of the sample affect the results. The robustness tests
show that the effect of investor attention, as measured by search volume, is more significant
in large firms than small ones. This result can be attributed to the small sample size and the
fact that a few major companies dominate the sample.
56
As a new insight the study finds that global search volume is a stronger predictor of company
shares than searches originating from the UK. This result is most likely specific for the UK
market and the sample period, and should not be assumed to hold in other markets. It is
however a significant contribution to the new field of search volume based literature, since it
shows that local searches are not more precise by default, although they should be subject to
less noise.
To conclude, this study answers the questions “Can you Google the future?” with a
resounding yes, with the forewarning that as with all new tools it is critical that one
understands what they are measuring. As the availability of real-time data on a global scale
develops, and its accuracy becomes more refined, the applications for research in finance will
undoubtedly grow. There are obvious first-mover pitfalls in approaching new data, such as
noise and inflexible systems, but as the first class in finance teaches; with potential risk comes
also the potential reward.
TABLE 18: SUMMARY OF HYPOTHESES RESULTS
This table describes the results of the five hypotheses and an explanation for each result.
No. Statement Result based on study Explanation
H1 An increase in a company’s tickersSearch Volume Index affects thechange in trade volume for thatcompany.
Accepted Simple OLS Regression showssignificant explanatory power betweenSVI and Trade Volume.
H2 An increase in Search Volume Indexfor a company’s ticker has a positiveeffect in the short-run for thatcompany’s share price, but willreverse in under one year.
Accepted conditionally Fama-Macbeth regression shows that arise in ASVI today significantly predictsa 12.5 basis point rise in stock price nextweek. However price reversal effect isnot strong enough to accept hypothesisunconditionally.
H3 The effect of the price pressure fromretail investor attention is stronger insmall companies compared to largecompanies.
Rejected The robustness test shows that ASVIeffect is stronger in large companies.
H4 Companies with high consumerrecognizability are more affected byretail investor attention thancompanies that are not visible toconsumers.
Rejected The robustness test remains inconclusivedue to too small sample size and strongindustry under performance. Furthermorethe fit of the proxy for recognizabilityused in this study can be questioned.
H5 The SVI results from UK are betterpredictors for UK company shareprice than the SVI results gatheredglobally.
Rejected The study finds that global results arestronger at predicting UK companyshares.
57
7.2. SUGGESTIONS FOR FURTHER RESEARCH
The research applications for data received from Google Trends are numerous. It can be used
to measure attention as in this paper, but many alternative uses have been presented in the
literature review section. SVI has been used as a proxy for investor sentiment, explaining
momentum, and increase in company sales to name a few. However almost all research is still
based on US data and a relatively short time span. In addition, to my knowledge, there is no
research comparing the SVI behavior of different countries.
Another approach is to study word strings in Google Trends and their effect on company
performance. There are quite a few studies that focus on how specific wording of news or
investor relations correlate with quantitative results; combining that type of study with Google
Trends could be very interesting. Since the oldest studies to use this data are only four years
old, there are still many fresh ways to use it. Furthermore, the quality and complexity of the
data is constantly evolving and with the addition of accessible one-day data frequency or even
better geographical location based data, new research topics will undoubtedly arise.
There are currently several private firms sharing data on real-time economic activity in
addition to Google; MasterCard, Federal Express, UPS, Intuit or Paypal to name a few. A
study based on these firms’ data could provide new perspective to previously done research.
For instance MasterCard will be opening up anonymous transaction data based on their card
purchases. The applications of such a data source are many-fold; for instance studying
consumer confidence as measured by daily purchases. Furthermore, there is a continuing
trend to open up data to the public, and with the release of new data comes the possibility to
do new research. As the options grow and the data becomes richer and more consistent, the
choice of using alternative data sources should become more viable. Many of the economic
proxies used to measure, for instance Behavioral Finance effects, are ex-post and indirect. As
the availability and reliability of real-time data increases, so should its use. In addition to the
valuable data offered by the private sector, there is an influx of government data being
released. For instance Iceland has shared open API’s to all their government data. Although
the applications might be to more economic studies, these new data sources should be
evaluated.

58
This study has used data from Google Trends to evaluate investor’s attention and its effect on
the company shares. However there are alternative measures of attention being discussed in
academia. Social media is increasing in popularity as a tool for research and many studies
based on attention or sentiment as measured by Facebook posts or Tweets (Zhang et al. 2011)
are being conducted. Although alternative new data sources are subject to some first mover
challenges, and in general real-time data often generates unwanted amounts of noise, these
data sources are also bringing a completely new and fresh perspective to financial research.
59
REFERENCES
Askitas, N. and Zimmermann, K. F., 2010. Google econometrics and unemployment forecasting.
Applied Economics Quarterly, 2009, 55 (2), 107-120.
Antweiler, W. and Frank, Z.F., 2004. Is All that Talk Just Noise? The information content of Internet
stock message boards, Journal of Finance 59 (3), 1259-1294.
Baker, S. and Fradkin, A., 2011. What drives job search? Evidence from Google search data. Working
Paper, Stanford University.
Barber, M.B, and Odean, T., 2008. All that glitters: The effect of attention and news on the buying
behavior of individual and institutional investors, Review of Financial Studies 21 (2), 785-818.
Barber, M.B, Odean, T. and Zhu,N., 2009. Do retail trades move markets? Review of Financial
Studies 21 (1), 151–186.
Chemmanur, T. and Yan, A., 2009. Advertising, attention, and stock returns, Working paper, Boston
College and Fordham University.
Choi, H. and Varian, H., 2009. Predicting the present with Google Trends, Working paper, Google
Inc.
Chordia, T., Huh, S-W. and Subrahmanyam, A, 2007. The cross-section of expected trading activity,
Review of Financial Studies 20 (3), 709–740.
Cooper, C., Mallon, K., Leadbetter, S., Pollack, L. and Peipins, L. 2005. Cancer Internet search
activity on a major search engine: United States 2001-2003. J Med Internet Res 7 (3) , e36.
Corwin, A.S. and Coughenour, F.J., 2008. Limited Attention and the Allocation of Effort in Securities
Trading. Journal of Finance 63 (6), 3031-3067.
Da, Z., Engelberg, J. and Gao, P., (a) 2010. Internet Search and Momentum, Working paper,
University of Notre Dame and University of North Carolina at Chapel Hill.
Da, Z., Engelberg, J. and Gao, P., (b) 2010. The sum of all FEARS: Investor sentiment and Asset
Price, Working paper, University of Notre Dame and University of North Carolina at Chapel Hill.
60
Da, Z., Engelberg, J. and Gao, P., (c) 2010. In Search of Fundamentals, Working paper, University of
Notre Dame and University of North Carolina at Chapel Hill.
Da, Z., Engelberg, J. and Gao, P., 2011. In Search of Attention. Journal of Finance 66 (5), 1461-1499.
Daniel, K.D., Grinblatt, M., Titman, S. and Wermers, R., 1997. Measuring mutual fund performance
with characteristic-based benchmarks, Journal of Finance 52 (3), 1035–1058.
Dimpfl, T. and Jank, S., 2012. Can Internet search behavior help to predict stock market volatility?
Paris December 2012 Finance Meeting EUROFIDAI-AFFI Paper. Available at SSRN:
http://ssrn.com/abstract=1941680 or http://dx.doi.org/10.2139/ssrn.1941680
Dzielinksi, M., 2012. Measuring economic uncertainty and its impact on the stock market, Finance
Research Letters 9 (3), 167-175.
Ettredge, M., Gerdes, J. and Karuga. G., 2005. Using web-based search data to predict
macroeconomic statistics. Communications of the ACM 48 (11), 87-92.
Experian Hitwise report (2012). Bing powered share of searches at 30 percent. Available online at:
http://press.experian.com/United-States/Press-Release/experian-hitwise-reports-bing-powered-share-
of-searches-at-30-percent-in-april-2012.aspx. Read: 15 December 2012.
Fama, E.F. and Macbeth, J. D., 1973. Risk return and equilibrium: Empirical tests, Journal of Political
Economy 81 (3), 607–636.
Ginsberg, J., Mohebbi M.H., Patel, R,S., Brammer, L., Smolinski M,S., and Brilliant, L. 2009,
Detecting influenza epidemics using search engine query data, Nature 457, 1012–1014.
Guzman, G,. 2011. Internet search behavior as an economic forecasting tool. The Journal of
Economic and Social Measurement. 36 (3), 119-167.
Goel, S., Hofman, J.M., Lahaie, S, Pennock, D,M. and Watts, D,J. 2010. Predicting consumer
behavior with web search, Proceedings of the National Academy of Sciences, 7 (41), 17486-17490 .
Hirshleifer, D., and Teoh, S.H., 2003. Limited attention, information disclosure, and financial
reporting, Journal of Accounting and Economics 36 (1-3), 337–386.

61
Johnson, H., 2004. Analysis of Web access logs for surveillance of influenza. Stud. Health Technol.
Inform. 107 (2), 1202–1206.
Kahneman, D.,1973, Attention and efforts. Prentice-Hall, Englewood Cliffs, NJ.
Kahneman, D. and Tversky, A., 1982. The psychology of preferences. Scientific American 246 (2),
160–173.
Lui, C., Panagiotis, T. and Mustafaraj, E., 2011. On the predictability of the U.S. elections through
search volume activity, Department of Computer Science, Wellesley College
Mondria, J. and Wu, T., 2012. Familiarity and Surprises in International Financial Markets: Bad
news travels like wildfire, good news travels slow, Working paper. University of Chapel Hill and
University of Santa Cruz.
Mondria, J. and Wu, T., 2011. Asymmetric Attention and Stock Returns, Society for Economic
Dynamics, Meeting Papers 134.
Mondria, J., Wu, T. and Zhang, Y., 2010. The determinants of international investment and attention
allocation: Using Internet search query data, Journal of International Economics 82 (1), 85-95.
Merton, R.C., 1987. A simple model of capital market equilibrium with incomplete information,
Journal of Finance 42 (3), 483–510.
Newey,W., and West, K., 1987. A simple positive semi-definite, heteroskedasticity and
autocorrelation consistent covariance matrix, Econometrica 55 (3), 703–708.
Odean, T., 1999. Do investors trade too much? American Economic Review 89 (5), 1279–1298.
Office for National Statistics, 2012. Adults' use of the Internet, 2000 to 2006. Available online at:http://www.ons.gov.uk/ons/publications/re-reference-tables.html?edition=tcm%3A77-48688 Read: 1October 2012
Peng, L., and Wei., 2006. Investor attention, overconfidence and category learning, Journal of
Financial Economics 80 (3), 563–602.
Seasholes, M,S. and Guojun W., 2007. Predictable behavior, profits, and attention, Journal of
Empirical Finance 14 (5), 590–610.
Tesar, L.L., and Werner, I., 1995. Home bias and high turnover, Journal of International Money &
Finance 14 (4), 467-492.

62
The Economist, 2011. US Confidence indicators. Available online at:
http://www.economist.com/blogs/dailychart/2011/08/us-confidence-indicators.Read: 11 October 2012.
Vlastakis, N. and Markellos, R., 2012. Information demand and stock market volatility, Journal of
Banking and Finance 36 (6), 1808-1821.
Zhang, X,. Fuehres, H. and Gloor, P., 2011. Predicting Stock Market Indicators Through twitter “I
hope it is not as bad as I fear”, Procedia – Social and Behavioral Sciences 26, 55-62.