Embed Size (px)
Citation preview

Can We Impact on COPD?
Dr. Roland LeungSpecialist in Respiratory Medicine
MBBS MD FRACP FCCP FHKCP FHKAM(Med)

Hot Off the Press –The Burden of Lung Disease Project
Organizers: Hong Kong Thoracic SocietyAmerican College of Chest Physicians (HK & Macau Chapter)
Sponsor: Hong Kong Lung Foundation

The Significant Findings
In 2005, respiratory disease was ranked as the top cause of mortality and hospitalization in Hong Kong.
Respiratory diseases accounted for 16% of all inpatient bed-days.
Although there has been a slow decline in respiratory mortality rate in the past decade, there has been no change in respiratory hospitalization rates.
Respiratory diseases, therefore, have accounted for the largest share of the health-care burden locally.

Hong Kong: Mortality & In-Patient Days
28.7%26.1%
16.0%
11.6%
0.0%
5.0%
10.0%
15.0%
20.0%
25.0%
30.0%
Repiratory Diseases 28.7% 16.0%
Cardiovascular Diseases 26.1% 11.6%
Mortality In-Patient Days
Per
cent
age
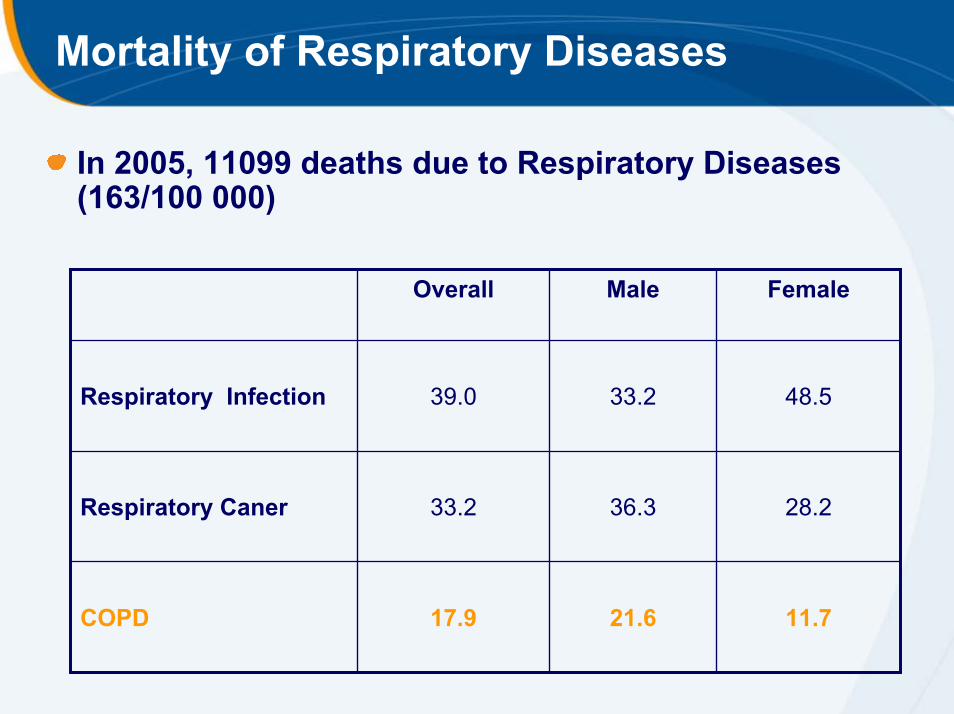
Mortality of Respiratory Diseases
In 2005, 11099 deaths due to Respiratory Diseases (163/100 000)
11.721.617.9COPD
28.236.333.2Respiratory Caner
48.533.239.0Respiratory Infection
FemaleMaleOverall

Respiratory Diseases in 2005
20.721.54.5Others
0.75.50OSA
0.20.20.4Pneumoconiosis
2.65.70.9Asthma
1.71.71.7Bronchiectasis
7.13.92.4Tuberculosis
20.514.617.9COPD
9.25.733.2Lung Cancer
37.241.339.0Respiratory infection
In-patient bed daysHospitalizationMortality% of Resp Diseases

COPDNo. 2
No.2 in Hospitalization (14.6%)No.3 in Respiratory Death (17.9%)↓ Rate of Mortality & Hospitalization from 1997-2005
Correlated with ↓ Rate of Smoking since 1980Male 32% to 15%, female 3% to 4%
Better Treatment of COPD
COPD still under-diagnosedLung Function study: (Ip et al)24.9% smokers had COPD12.8% Stage II or above

COPD is a growing burden to society and patients1
COPD is estimated to cause almost 3 million deaths per year, 15 times more than are caused by asthma.1,2
Of all the major chronic diseases, COPD is the only one with an increasing death rate.3
1. World Health Organization. COPD: burden. (www.who.int/respiratory/copd/burden/en/index.html).2. World Health Organization. Asthma: scope. (www.who.int/respiratory/asthma/scope/en/index.html).3. Global Initiative for Chronic Obstructive Lung Disease. NHLBI/WHO Workshop Report 2001. (www.goldcopd.com/workshop/toc.html).

COPD is a growing burden to society and patients1
By 2020, COPD is expected to be the third largest cause of chronic disease mortality worldwide.2
Leading causes of mortality and disability2
1. World Health Organization. COPD: burden. (www.who.int/respiratory/copd/burden/en/index.html).2. Murray CJL, Lopez AD. Lancet 1997; 349: 1498-1504.

慢阻肺病之死亡率比糖尿病高3倍比乳癌高6倍比哮喘高11倍
10

慢阻肺病在香港發病率極高較中國大陸更嚴重
慢阻肺病在亞洲地區的發病率僅次日本:
中國大陸 香港 日本 南韓 台灣 泰國
發病率 8.2% 8.9% 10.9% 7.8% 2.5% 7.1%
11

慢阻肺病之健康推廣宣傳嚴重不足
慢阻肺病與其他慢性疾病的健康教育項目比較:只及高血壓的10%只及哮喘的7%只及糖尿病的4%只及乳癌的3%
哮喘 乳癌 慢阻肺病 糖尿病 高血壓
健康推廣宣傳 6,019 14,725 443 12,395 4,479
(2006年8月30日至2007年8月30日,在世界疾病認知推廣月份的報導文章數目)
12

SCMP 17-Nov-08

AM730 17-Nov-08

What are the PROBLEMS IN COPD that clinicians are faced with?
Symptoms– Quality of Life
Exacerbations– Health care utilisation
– hospitalisation
Mortality– Lung function decline

Prospective RCTs in COPD
To determine whether treatment with tiotropium18 µg daily reduces the rate of decline of FEV1over time in patients with COPD
To compare the effectiveness of Salm/FP 50/500 with Tiotropium in reducing the rate of moderate and/or severe exacerbation in subjects with severe to very severe COPD
To investigate the long-term effects of Salm/FP 50/500 µg BID, Salm 50 µg BID and FP 500 µg on the survival of subjectsover 3 years
Objective
(a) Tiotropium 18 µg(b) Placebo + Usual Care
(a) Salm/FP 50/500 BID(b) Tiotropium 18 µg
(a) Salm/FP 50/500 BID(b) FP 500 BID(c) Salm 50 BID(d) Placebo
Treatment
5,9931,3236,112PatientNumbers
4 years2 years3 yearsDuration
UPLIFTINSPIRETORCH
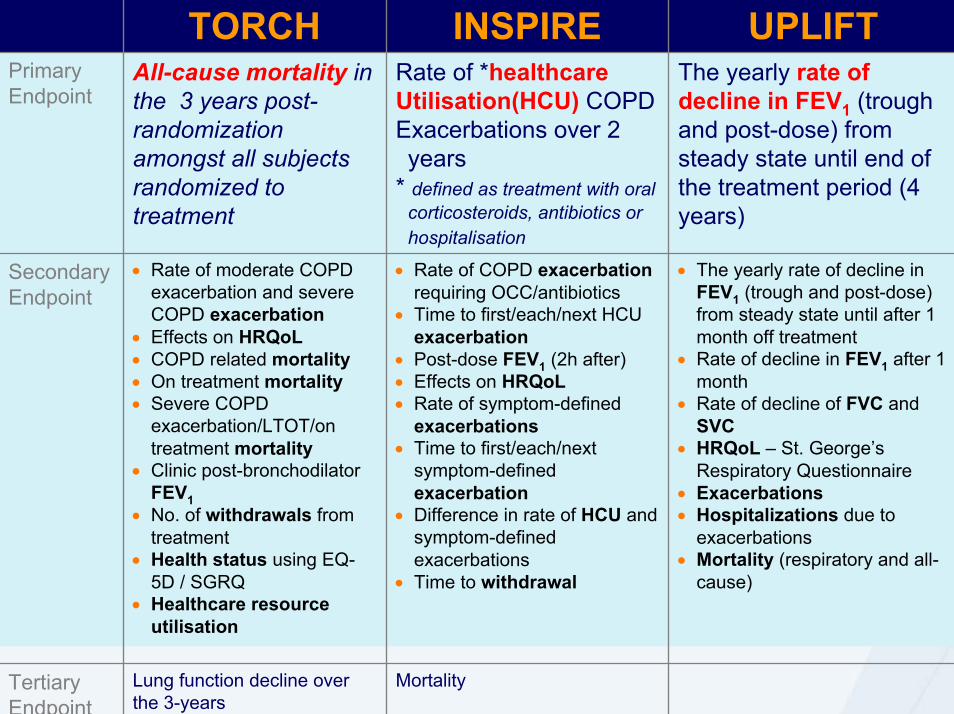
MortalityLung function decline over the 3-years
Tertiary Endpoint
• The yearly rate of decline in FEV1 (trough and post-dose) from steady state until after 1 month off treatment
• Rate of decline in FEV1 after 1 month
• Rate of decline of FVC and SVC
• HRQoL – St. George’s Respiratory Questionnaire
• Exacerbations• Hospitalizations due to
exacerbations• Mortality (respiratory and all-
cause)
• Rate of COPD exacerbationrequiring OCC/antibiotics
• Time to first/each/next HCU exacerbation
• Post-dose FEV1 (2h after)• Effects on HRQoL• Rate of symptom-defined
exacerbations • Time to first/each/next
symptom-defined exacerbation
• Difference in rate of HCU and symptom-defined exacerbations
• Time to withdrawal
• Rate of moderate COPD exacerbation and severe COPD exacerbation
• Effects on HRQoL• COPD related mortality• On treatment mortality• Severe COPD
exacerbation/LTOT/on treatment mortality
• Clinic post-bronchodilatorFEV1
• No. of withdrawals from treatment
• Health status using EQ-5D / SGRQ
• Healthcare resource utilisation
Secondary Endpoint
The yearly rate of decline in FEV1 (trough and post-dose) from steady state until end of the treatment period (4 years)
Rate of *healthcare Utilisation(HCU) COPD Exacerbations over 2 years
* defined as treatment with oralcorticosteroids, antibiotics or hospitalisation
All-cause mortality in the 3 years post-randomization amongst all subjects randomized to treatment
Primary Endpoint
UPLIFTINSPIRETORCH

When do patients present? Lung function deterioration without symptoms
Symptoms generally develop only after a significant drop in FEV1 (to less than 50%) has occurred1
FEV 1
(%of
pre
dict
ed)
100
50
20
AsymptomaticLung
functionnormal
Lungfunctionreduced
Axis ofprogression
Sym
ptom
s
Severe
Mild
1. Sutherland ER et al. N Eng J Med 2004; 350 (26): 2689-2697.

Bronchodilators in Stable COPD
Bronchodilator medications are central to symptom management in COPD
Relax bronchial airways smooth muscle and expand bronchial air passages
Inhaled therapy is preferred
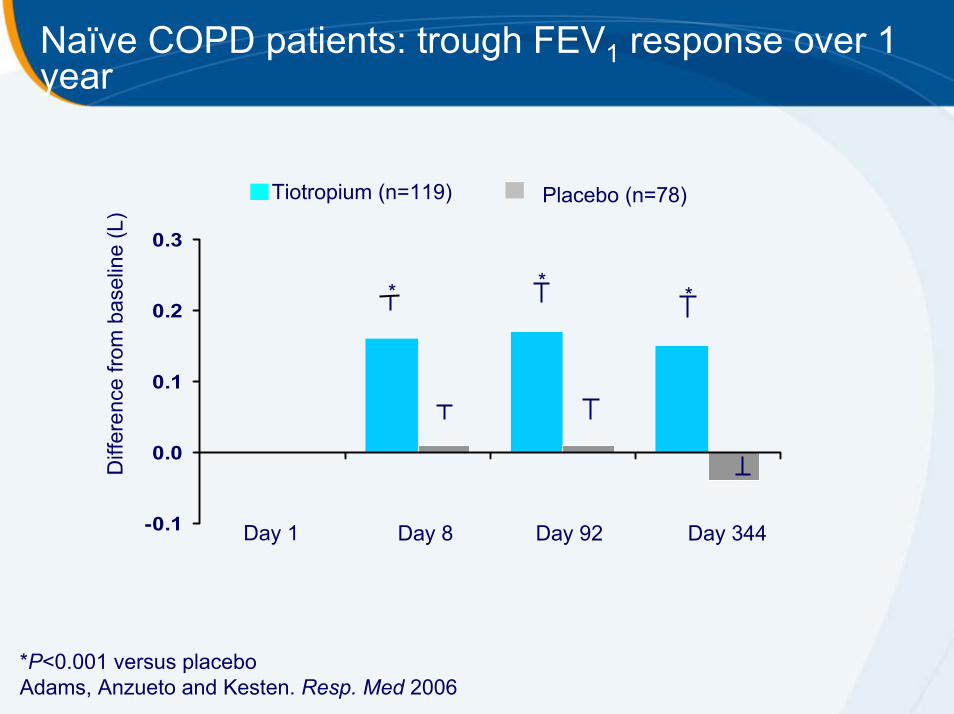
Naïve COPD patients: trough FEV1 response over 1 year
-0.1
0.0
0.1
0.2
0.3
Diff
eren
ce fr
om b
asel
ine
(L)
Tiotropium (n=119) Placebo (n=78)
Day 344Day 8Day 1 Day 92
* **
*P<0.001 versus placeboAdams, Anzueto and Kesten. Resp. Med 2006

Naïve COPD patients: dyspnea score response over 1 Year
0.0
0.5
1.0
1.5
2.0Tiotropium (n=113) Placebo (n=76)
TDI F
ocal
sco
re
*
**
50 92 176 260 344
Day*P<0.05 versus placeboAdams, Anzueto and Kesten. Resp. Med 2006

Naïve COPD patients: SGRQ over 1 year
-6
-5
-4
-3
-2
-1
0
Diff
eren
ce fr
om b
asel
ine
in
SG
RQ
Tot
al s
core
Tiotropium (n=120) Placebo (n=77)
3449250 176*
260
Improvem
ent
Day
*P<0.05 versus placeboAdams, Anzueto and Kesten. Resp. Med 2006

SPIRIVA demonstrates superior improvements in breathlessness post rehab
Combined rehab with SPIRIVA results in extended, superior outcomes in breathlessness compared with rehab alone
Casaburi, et al Chest 2005


Co-Primary Endpoints
Co-primary endpoints:– Yearly rate of decline in trough (pre-bronchodilator) FEV1 from steady
state until end of the treatment period
– Yearly rate of decline in FEV1 measured 90 minutes after inhalation of study drug and ipratropium (30 minutes after inhalation of salbutamol) from steady state until end of the treatment period

Secondary Endpoints
Key Secondary Endpoints– Time to 1st exacerbation– Time to 1st hospitalization
Other Secondary endpoints– FEV1, FVC, and SVC at all time points– Decline in FVC and SVC– COPD exacerbations & related hospitalizations– HRQoL (St. George’s Respiratory Questionnaire)– Mortality (all cause, lower respiratory)
On-treatmentOn-treatment + vital status follow-up

Study Design
Placebo qd
Tiotropium qdStop: Tiotropium qd
Start: Ipratropium qidAll previously prescribed respiratory medications permitted (except inhaled anticholinergics)
Treatment period4 years (48 month)
Run in2 weeks 30 days follow-up
Spirometry
Screening
Spirometry+ SGRQ
Spirometry Spirometry+ SGRQ
Day 1Randomization Day 30
Every 6 months
Spirometry+ SGRQ
4 yearsEnd of trial
End of follow up
Spirometry
Vital status

Clinic Visit Spirometry
Pre doseSpirometry
Ipratropium(total: 80 µg)
Salbutamol(total 400 µg)
Day 1, Randomization
Post doseSpirometry
1 hour 30 minTime
Maximizing bronchodilation
Pre doseSpirometry Ipratropium Salbutamol
Day 30 and every 6 months during 4 year study
Post doseSpirometry
1 hour 30 min
Study drugfollowed by
Time

Worldwide Distribution of UPLIFT Study Centers
Argentina France Lithuania Portugal TaiwanAustralia Germany Malaysia Russia Thailand
Austria Greece Mexico Singapore Turkey
Belgium Hong Kong Netherlands Slovakia United Kingdom
Brazil Hungary New Zealand Slovenia USCzech Republic Ireland Norway South AfricaDenmark Italy Philippines SpainFinland Japan Poland Switzerland

Baseline Characteristics
Characteristic Tiotropium(n = 2986)
Control(n = 3006)
Male (%) 75.4 73.9
Age (yrs)* 64.5 ± 8.4 64.5 ± 8.5
Body Mass Index* 26.0 ± 5.1 25.9 ± 5.1
Smoking status
Current smoker (%) 29.3 29.9
Smoking history (pack-yrs)* 49.0 ± 28.0 48.4 ± 27.9
Duration of COPD (yrs)* 9.9 ± 7.6 9.7 ± 7.4
GOLD stage (II / III / IV) (%) 46 / 44 / 8 45 / 44 / 9
SGRQ total score (units)* 45.7 ± 17.0 46.0 ± 17.2
*Mean±SD

Baseline Spirometry
Pre-Bronchodilator Post-Bronchodilator
Tiotropium(n = 2986)
Control(n = 3006)
Tiotropium(n = 2986)
Control(n = 3006)
FEV1 (L) 1.10 ± 0.40 1.09 ± 0.40 1.33 ± 0.44 1.32 ± 0.44
FEV1 (% predicted) 39.5 ± 12.0 39.3 ± 11.9 47.7 ± 12.7 47.4 ± 12.6
FVC (L) 2.63 ± 0.81 2.63 ± 0.83 3.09 ± 0.86 3.09 ± 0.90
FEV1/FVC 42.4 ± 10.5 42.1 ± 10.5 43.6 ± 10.8 43.3 ± 10.7
SVC 2.80 ± 0.82 2.80 ± 0.83 3.21 ± 0.88 3.20 ± 0.90
Mean±SD

Baseline and On Treatment+ Respiratory Medications
Medication (% of patients)
Tiotropium(n = 2986)
Control
(n = 3006)
BaselineOn Treatment +
BaselineOn Treatment +
Any respiratory medication 93.4 95.8 93.1 93.8
Short-acting anticholinergic 44.9 16.8 44.1 17.3
Short-acting beta-agonist 68.5 80.5 68.1 78.9
Long-acting beta-agonist* 60.1 71.7 60.1 72.1
Inhaled steroid* 61.6 74.0 61.9 73.9
Theophylline 22.8 34.7 23.1 35.2
Systemic steroids 8.4 53.2 8.3 55.0
Mucolytics 7.4 27.4 6.9 26.7
Leukotriene receptor antagonists 3.3 4.7 3.1 4.7
Supplemental O2 2.3 12.0 1.9 12.2
*Used alone or in combination+ at any time during treatment, incl. short-term treatment of exacerbations

Pre- and Post-bronchodilator FEV1Mean values at each time point
1.00
1.10
1.20
1.30
1.40
1.50
FEV 1
(L)
Tiotropium Control*
Day 30(steady state)
* ** * * * *
*
06 12 18 24 30 36 42 480 1
Month
* * * * * * * * *
Post-Bronch FEV1∆ = 47 – 65 mL
Pre-Bronch FEV1∆ = 87 – 103 mL
(n=2516)
(n=2374)
(n=2494)
(n=2363)
*P<0.0001 vs. control. Repeated measure ANOVA was used to estimate means. Means are adjusted for baseline measurements. Baseline trough FEV1 (observed mean) = 1.116 (trough), 1.347 (peak). Patients with ≥3 acceptable PFTs after day 30 were included in the analysis.

COPD has a significant impact on patients’ everyday activities
Percentages of patients who have daily activities affected by COPD.2
1. World Health Organization. COPD: burden. (www.who.int/respiratory/copd/burden/en/index.html).2. Rennard S, et al. Eur Respir J 2002; 20: 799-805.

SGRQ Total ScoreMean values at each time point
35
40
45
50
SGR
Q T
otal
Sco
re (U
nits
) Tiotropium (n = 2478) Control (n = 2337)
06 12 18 24 30 36 42 480
* ** *
* **
*
Impr
ovem
ent SGRQ Total Score
∆ = 2.3 units
Month*P<0.0001 vs. control. Repeated measure ANOVA was used to estimate means. Means are adjusted for baseline measurements. Baseline SGRQ Total Score (observed mean) = 45.028. Patients with ≥2 acceptable SGRQ Total Scores after month 6 were included in the analysis.

Percentage of Patients With ≥4-Unit Improvement in SGRQ Total Score*
All p-values <0.001; *compared to Day 1
49.147.5
46.144.9
41.2
39.1
36.5 36.2
30
32
34
36
38
40
42
44
46
48
50
1 year 2 years 3 years 4 years
Patie
nts
(%)
TiotropiumControl
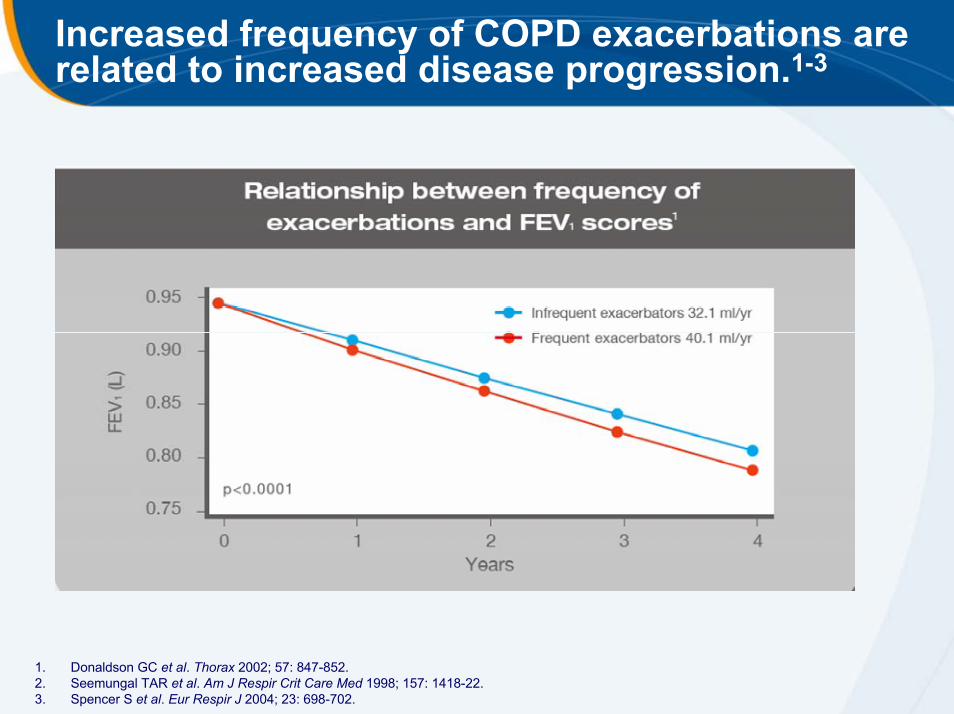
Increased frequency of COPD exacerbations are related to increased disease progression.1-3
1. Donaldson GC et al. Thorax 2002; 57: 847-852.2. Seemungal TAR et al. Am J Respir Crit Care Med 1998; 157: 1418-22.3. Spencer S et al. Eur Respir J 2004; 23: 698-702.

COPD exacerbations are related to an increased risk of mortality1-5
Outcomes of COPD exacerbations in various patient groups6-9
Up to 43% of COPD patients die within 1 year of an exacerbation-related hospital admission.4
1. Seemungal TAR et al. Am J Respir Crit Care Med 1998; 157: 1418-22.2. Spencer S et al. Eur Respir J 2004; 23: 698-702.3. Groenewegen KH et al. Chest 2003; 124: 459-467.4. Connors AF et al. Am J Respir Crit Care Med 1996; 154(4): 959-967.5. Soler-Cataluna JJ et al. Thorax 2005; 60: 925-931.6. Seneff MG et al. JAMA 1995; 274: 1852-1857.7. Murata GH et al. Ann Emerg Med 1991; 20:125-129.8. Adams SG et al. Chest 2000; 117: 1345-1352.9. Patil SP et al. Arch Intern Med 2003; 163: 1180-1186.

Probability of COPD Exacerbation
0
20
40
60
80
0 6 12 18 24 30 36 42 48
Pro
bab
ility
of e
xace
rbat
ion
(%)
Tiotropium Control
Hazard ratio = 0.86, (95% CI, 0.81, 0.91)
p < 0.0001 (log-rank test)
Month

Exacerbations
Tiotropium
Mean (SE)
Control
Mean (SE)Risk Ratio 95% CI P-value
# exacerbations per patient-year 0.73 (0.02) 0.85 (0.02) 0.86 0.81, 0.91 <0.001
# exacerbation days per patient-year
12.1 (0.32) 13.6 (0.35) 0.89 0.83, 0.95 < 0.001
Hazard ratio was estimated using Cox regression. Log-rank test was used for p-value. Wald statistics was used for CI. Randomized patients taking ≥1 dose of study medication were included in the analysis.
Number of exacerbations per patient year and the ratio between tiotropium and placebo were estimated using Poisson regression corrected for treatment exposure and overdispersion. Randomized patients with ≥1 dose of study medication were included in the analysis.

Reduced Mortality with TiotropiumOn-Treatment
Hazard ratio = 0.84, (95% CI, 0.73, 0.97)
P=0.016 (log-rank test)
Months
16% Reductionin Risk
16% Reductionin Risk
0
5
10
15
20
0 6 12 18 24 30 36 42 48
Pro
babi
lity
of d
eath
from
any
ca
use
(%)
Tiotropium Control
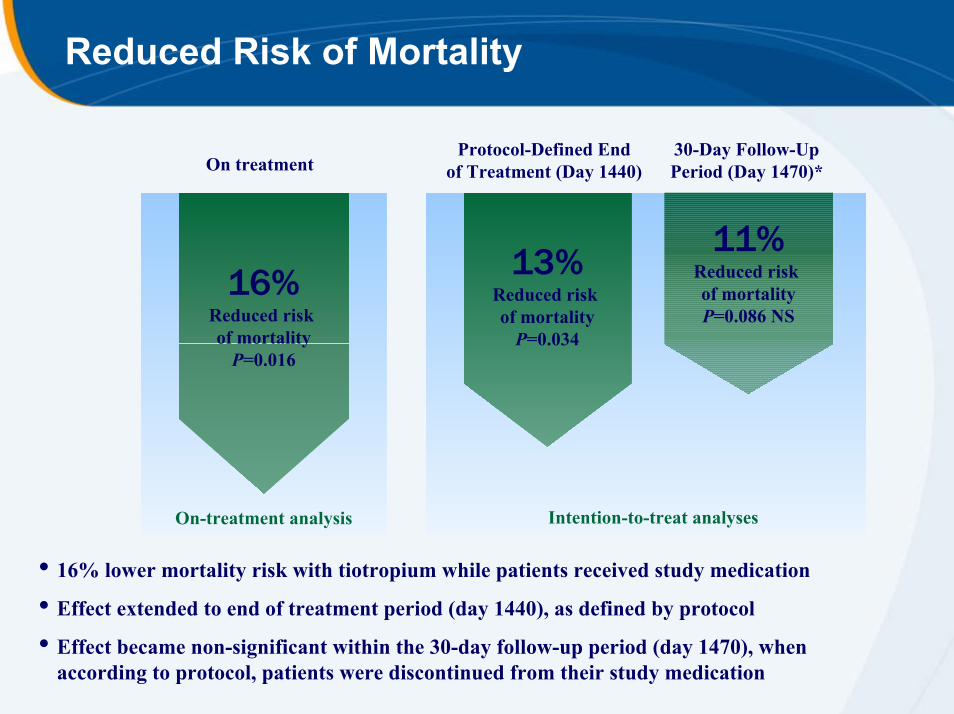
Reduced Risk of Mortality
Protocol-Defined End of Treatment (Day 1440)
30-Day Follow-Up Period (Day 1470)*On treatment
13%Reduced risk of mortalityP=0.034
Intention-to-treat analyses
11%Reduced risk of mortalityP=0.086 NS
16%Reduced risk of mortalityP=0.016
On-treatment analysis
• 16% lower mortality risk with tiotropium while patients received study medication
• Effect extended to end of treatment period (day 1440), as defined by protocol
• Effect became non-significant within the 30-day follow-up period (day 1470), when according to protocol, patients were discontinued from their study medication
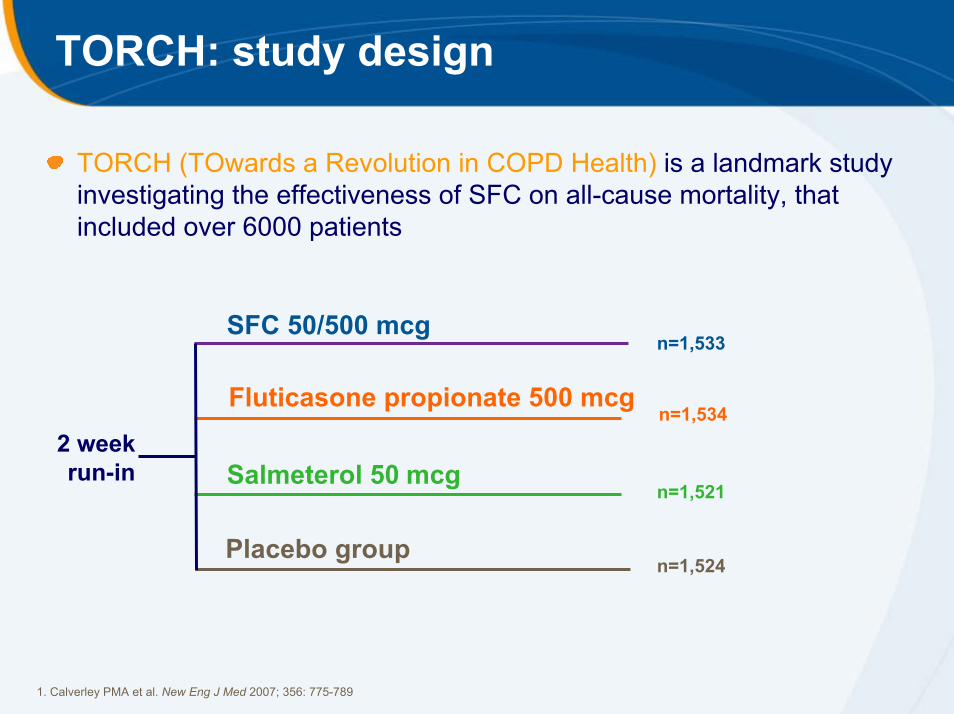
TORCH: study design
TORCH (TOwards a Revolution in COPD Health) is a landmark study investigating the effectiveness of SFC on all-cause mortality, that included over 6000 patients
SFC 50/500 mcgn=1,533
Fluticasone propionate 500 mcg n=1,534
2 week run-in Salmeterol 50 mcg
n=1,521
Placebo groupn=1,524
1. Calverley PMA et al. New Eng J Med 2007; 356: 775-789

Seretide may improve patient survival1
Comparison of death rate over 3 years with Seretide and placebo1
In the TORCH study, Seretide reduced the risk of death by 17.5% over three years compared with placebo although this missed statistical significance (p=0.052)
1. Calverley PMA et al. New Engl J Med 2007; 356 (8): 775-789.

IMPACT OF SMOKING CESSATION PROGRAMME ON MORTALITY FROM THE LUNG HEALTH STUDY (LHS)
Proportion of patients with no event1.00
0.95
0.90
0.85
0.800 1 2 3 4 5 6 7 8 9 10 11 12 13 14 15
Special intervention groupUsual care group
15%15%
Time since LHS baseline (years)
Anthonisen et al. Ann Intern Med 2005

The magnitude of the mortality reduction is comparable to other interventions
In COPD smoking cessation programs reduce mortality by 15% at 15 years
Effect of statins on all-cause mortality in patients with coronary heart disease
Meta-analysis of 17 trials
n = 40,974
Mean/median follow up 0.3–6.1 years
Relative Risk Reduction = 16%
Absolute Risk Reduction = 1.8%
1. Anthonisen NR, Skeans MA, Wise RA, et al. Ann Intern Med 2005; 142:233–9.2. Wilt et al. Arch Intern Med 2004; 164: 1427-1436

NATURAL HISTORY OF COPDFE
V 1(%
of v
alue
at a
ge 2
5)
100
75
50
25
025 50 75
Never smoked or not susceptible to smoke
Stopped at 65
Stopped at 45
Disability
Smoked regularlyand susceptible
to its effects
Death
Age (years)
Fletcher et al., 1977

Pre- and Post-bronchodilator FEV1Mean values at each time point
1.00
1.10
1.20
1.30
1.40
1.50
FEV 1
(L)
Tiotropium Control*
Day 30(steady state)
* ** * * * *
*
06 12 18 24 30 36 42 480 1
Month
* * * * * * * * *
Post-Bronch FEV1∆ = 47 – 65 mL
Pre-Bronch FEV1∆ = 87 – 103 mL
(n=2516)
(n=2374)
(n=2494)
(n=2363)
*P<0.0001 vs. control. Repeated measure ANOVA was used to estimate means. Means are adjusted for baseline measurements. Baseline trough FEV1 (observed mean) = 1.116 (trough), 1.347 (peak). Patients with ≥3 acceptable PFTs after day 30 were included in the analysis.

Rate of Decline in FEV1
Mean slope from day 30 until completion of double-blind treatment – treated setwith ≥3 post-randomization measurements
2410
2413
n Mean (SE)Mean (SE)Mean (SE)n
2554
2557
42 (1)
30 (1)
Control (mL/yr)
40 (1)
30 (1)
Tiotropium (mL/yr)
0.202 (2)Post-bronch
0.950 (2)Pre-bronch
P-value*∆ Tio - Con
*unadjusted p-value

Rate of Decline in FEV1by GOLD Stage
Post-bronchodilator FEV1
GOLD Stage Tiotropium (mL/yr) Control (mL/yr) ∆ Tio - Con P-value
n Mean (SE) n Mean (SE) Mean (SE)
II 1218 43 (2) 1158 49 (2) 6 (3) 0.02
III 1104 39 (2) 1031 38 (2) 0 (3) 0.87
IV 194 32 (5) 185 23 (5) -9 (7) 0.24
P-value for subgroup by treatment interaction = 0.07

Rate of Decline in FEV1No Baseline LABA or ICS
Mean slope from day 30 until completion of double-blind treatment – treated setwith ≥3 post-randomization measurements
764
767
n Mean (SE)Mean (SE)n
787
789
47 (3)
38 (3)
Control (mL/yr)
40 (3)
33 (2)
Tiotropium (mL/yr)
0.048Post-bronch
0.084Pre-bronch
P-value

Annual Decline in Post-Bronchodilator FEV1 in Major Long Term COPD Trials
-
-
-
-
-
Placebo*+Placebo
onlyStudy drug
~ 48%
~ 57%
~ 68%
~ 50%
~ 79%
Baseline FEV1 %
predicted
43%
41- 51%
90%
36 – 39%
100%
Current smokers
5542 / 42 / 39S / F / SFCTORCH (3 years)post hoc analysis
NAC
Triamcinolone
Fluticasone
Budesonide
Study drug
4754BRONCUS (3 years)
4744LHS II (3.3 years)
5950ISOLDE (3 years)
6957EUROSCOP (3 years)
Annual decline in FEV1
(mL/year) Study (Duration)
(order: year of publication)
42
42
40
37
-Tiotropium~ 47%30%UPLIFT (4 years)
-Tiotropium~ 47%30%UPLIFT (3 years)
* All respiratory medications permitted throughout the trial, other than inhaled anticholinergics

Most Common Adverse Events (>3%) Incidence Rate*: tiotropium>control
Tiotropiumn=2986
Controln=3006
Rate Ratio(Tio/Con)
95 % CI
Abdominal pain 1.22 1.12 1.09 0.83, 1.43
Arthralgia 1.36 1.10 1.24 0.95, 1.62
Benign Prostatic Hyperplasia 1.32 1.12 1.18 0.90, 1.54
Constipation 1.63 1.29 1.26 0.99, 1.61
Cough 2.64 2.57 1.03 0.86, 1.24
Depression 1.42 1.14 1.25 0.96, 1.62
Diarrhoea 1.50 1.43 1.04 0.82, 1.33
Dizziness 1.11 0.94 1.18 0.88, 1.58
Headache 1.88 1.61 1.17 0.94, 1.47
Insomnia 1.42 1.06 1.34 1.02, 1.75
Mouth dry 1.68 0.93 1.80 1.37, 2.36
Nasopharyngitis 4.33 4.06 1.07 0.92, 1.24
Oedema 1.57 1.52 1.03 0.82, 1.31
Sinusitis 2.14 1.90 1.12 0.91, 1.39
Urinary tract infections 2.08 2.00 1.04 0.85, 1.28
*per 100 patient years

Stroke
Tiotropium
(n = 2986)Control
(n = 3006)Risk RatioTio/Con
95% CIN with
Event
Rate /
100 pt-yrs
N with
event
Rate /
100pt-yrs
Adverse Event 82 0.88 80 0.93 0.95 0.70, 1.29
Serious adverse Event 66 0.70 63 0.73 0.97 0.70, 1.37
Fatal (on treatment) 12 0.13 12 0.14 0.92 0.41, 2.05
Fatal (on-treatment, adjudicated) 12 0.13 13 0.15 0.85 0.39, 1.87
Fatal (vital status, day 1470) 14 0.13 17 0.15 0.82 0.40, 1.66
Rate per 100 person-years of time at risk to tiotropium or control

Myocardial Infarction
Tiotropium
(n = 2986)Control
(n = 3006)Risk RatioTio/Con
95% CIN with
Event
Rate /
100 pt-yrs
N with
event
Rate /
100pt-yrs
Adverse Event 67 0.71 85 0.98 0.73 0.53, 1.00
Serious Adverse Event 65 0.69 84 0.97 0.71 0.52, 0.99
Fatal (on treatment) 14 0.5 22 0.25 0.59 0.30, 1.15
Fatal (on-treatment, adjudicated) 9 0.10 8 0.09 1.04 0.40, 2.69
Fatal (vital status, day 1470, adjudicated)
11 0.4 11 0.4 1.00 0.43, 2.30
Rate per 100 person-years of time at risk to tiotropium or control

SAE Incidence (per 100 pt-yrs) Reported By >1% in Any Treatment Group**
Tiotropiumn=2986
Controln=3006
Rate Ratio(Tio/Con)
95% CI
Cardiac SOC 3.56 4.21 0.84 0.73, 0.98*
Angina 0.51 0.36 1.44 0.91, 2.26
Atrial fibrillation 0.74 0.77 0.95 0.68, 1.33
Cardiac failure 0.61 0.48 1.25 0.84, 1.87
Cardiac failure congestive 0.29 0.48 0.59 0.37, 0.96*
Coronary artery disease 0.21 0.37 0.58 0.33, 1.01
Myocardial infarction 0.69 0.97 0.71 0.52, 0.99*
Respiratory (lower) SOC 11.32 13.47 0.84 0.77, 0.92*
Bronchitis 0.37 0.31 1.20 0.73, 1.98
COPD exacerbation 8.19 9.70 0.84 0.76, 0.94*
Dyspnea 0.38 0.62 0.61 0.40, 0.94*
Pneumonia 3.28 3.46 0.95 0.81, 1.11
Respiratory failure 0.90 1.31 0.69 0.52, 0.92*
*p<0.05; **excluding lung cancer (multiple different terms)

Respiratory Failure
0.0
0.5
1.0
1.5
2.0
UPL
IFT
29 T
rials
UPL
IFT
29 T
rials
UPL
IFT
29 T
rials
Adverse Events
Tiotropium lower risk Control lower risk
Hazard ratio (95% CI)
Serious Adverse Events
Fatal Events
n Hazard Ratio
336 0.81
75 0.80
297 0.78
63 0.68
112 0.69
13 0.55
(0.65, 0.999)*
(0.50, 1.27)
(0.62, 0.98)*
(0.41, 1.13)
(0.48, 1.01)
(0.16, 1.88)
* p < 0.05

Summary
A Landmark 4-year COPD Trial (UPLIFT) proved that tiotropium have favourable impact on the clinical course of COPD through:• Significantly sustained improvements in lung function (87-103 ml,
p<0.001)
• Significantly sustained improvement in health-related quality of life
• Significant reduction in the no. of exacerbations per patient year (14%, p<0.001)
• Significant reduction in mortality (16%, p=0.016)

Summary
Evidence for reduced cardiac morbidity– No increased risk for stroke or myocardial infarction
Reduced lower respiratory morbidity– Decreased risk for respiratory failure

GOLD Recommendations
Rabe K et al GOLD 2007 Am J Respir Crit Care Med 2007; 176:532-555

COPD AT THE TIPPING POINT
Symptom control
COPD AT THE TIPPING POINT
Preventing exacerbations
Symptom control

COPD AT THE TIPPING POINT
Symptom control
Preventing exacerbations
Reducing mortality

Can We Impact on COPD?

Yes, We Can!
Barak Obama, President-Elect

Q & A

COPD is a growing burden to society and patients1
In the Asia Pacific region, COPD affects over 56 million people.2
Estimated prevalence rates of moderate-to-severe COPD in Asia-Pacific countries.2
1. World Health Organization. COPD: burden. (www.who.int/respiratory/copd/burden/en/index.html).2. Murray CJL, Lopez AD. Lancet 1997; 349: 1498-1504.

Seretide reduces breathlessness1,2
Seretide reduced breathlessness 2 days after the start of treatment, with significant improvements after 1 week. 2
Improvements in Transition Dyspnoea Index (TDI) over 24 weeks1
1. Mahler DA et al. Am J Respir Crit Care Med 2002; 166: 1084-1091.2. Vestbo J et al. Thorax 2005; 60: 301-304.

COPD is a multicomponent disease with inflammation at its core1–6
1/671/fig 2
1. Agusti AGN et al. Respir Med 2005; 99: 670-682. 2. Wedzicha JA, Donaldson GC Resp Care 2003; 48: 1204-1215. 3. Seemungal TAR et al. Am J Respir Crit Care Med 2000; 161: 1608-1613 4. Garcia-Aymerich J Thorax 2003; 58:100-105. 5. Seemungal TAR et al. Am J Respir Crit Care Med 1998; 157: 1418-1422. 6. Pauwels RA et al. Am J Respir Crit Care Med 2001; 163: 1256-1276.

Barnes PJ. NEJM 2000; 343 : 269-280.