Embed Size (px)
Citation preview
KEER2014, LINKÖPING | JUNE 11-13 2014 INTERNATIONAL CONFERENCE ON KANSEI ENGINEERING AND EMOTION RESEARCH
Can we categorize moviegoers on their emotions? Emile Poirson, Catherine da Cunha, Jean-François Petiot
LUNAM Université, Ecole Centrale Nantes, IRCCyN UMR CNRS 6597 (Institut de Recherche en Communications et
Cybernétique de Nantes) Nantes, France,{emilie.poirson; catherine.da-cunha; jean-francois.petiot}@irccyn.ec-nantes.fr
Abstract: The choice of a product is based on the performances but also on the emotions it caused, particularly in cultural products. We hypothesize that customer preferences are partly dependent on the emotions aroused by the use. For each pair user/product type there exists a function linking emotions and preference. The design of online recommendation systems, such as those used in e-commerce, is a real challenge. This requires understanding the customer's need in order to recommend the right products for them, i.e. those that are likely to be appreciated. The current recommendation systems rely on similarities between customers based on products purchased (or assessed). The best way to advise an amateur is then to determine its emotional neighborhood, and recommend the products liked by its neighbors. To validate this hypothesis a full-scale study was conducted on a given product: movie. After determination of a list of emotions adapted to movies; data were collected through an online survey. The data processing (more than 6500 evaluations) has several objectives: 1 . Identify, for each client, relationships between emotions and overall assessment; 2 . Identify groups of customers with similar overall assessments; 3 . Identify groups of customers with similar relationships.
Keywords: User, Emotions, Preference, Neighborhood
1. INTRODUCTION
Electronic commerce websites offer a huge number of products and services for sale, therefore choosing the right product is sometimes not an easy task for a website visitor. These websites often use recommender systems. Recommender systems have emerged in order to help people to choose products or services that best meet their needs and preferences. To recommend products to an active customer, most of recommendation algorithms focus on finding customers who have purchased and/or rated products in common (collaborative filtering).
The challenge addressed in this paper concerns the understanding of why customers gave those evaluations. To explain why a product is liked or not, emotions could be used.
Since the sixties, many disciplines such as marketing, economics and engineering have taken into account users’ emotions, as their emotions influence their decision to purchase products.
1209
Emotions can be viewed as mechanisms that return signals in response to favorable or harmful events (Desmet and Hekkert, 2007). Research in customer behavior has discovered then confirmed the importance and the dominance of emotions and affective states in decision making (Richins, 1997; Camerer et al., 2005). Several studies have shown that taking into account the preference of a customer begins with an understanding of the product emotional perception (Norman, 2004). Differences between customer preferences may be due to the fact that they perceive differently the same product (Nakada, 1997; Shang et al, 2000).
The objective of the paper is to show that the integration of information concerning the emotions elicited by products in a recommender system may improve the quality of the recommendations. The proposed approach enables finding customers having the same ratings of products but also getting those who have similar perceptions of products, from an emotional point of view.
The product chosen to illustrate our approach is a movie, product for which preferences are mostly guided by emotions. After a determination of a list of emotions adapted to movies, data were collected through an online survey. The data processing (more than 6500 evaluations) has several objectives: 1 . Identify, for each client, relationships between emotions and overall assessment; 2 . Identify groups of customers with similar overall assessments; 3 . Identify groups of customers with similar relationships.
2. DATA COLLECTION
2.1. The Web Survey An online survey was designed to allow participants to rate a set of 100 movies, chosen among
the most popular in the last decade. For each film, the subject can either pass (if he/she hasn’t seen it) or rate. In this second case, the evaluation had to be complete i.e. the subject rated a global appreciation (on a 10-point scale) and different emotions. For emotion, we choose to relies on DES adaptation to films’ evaluation (McHugo et al., 1982 ). 8 adjectives were defined: (1) amused; (2) sad; (3) angry; (4) scared; (5) attentive; (6) anxious; (7) surprised; (8) joyful. Ratings of feelings within each category were made on a 7-point scale from "not at all" to "very strongly."
Hundred films were selected for this study. The list was built using 9 film experts (4 men and 5 women), films should be recent (released in the 3 last years) and cover a broad diversity of genre (action, comedy, horror, etc.). To collect the data, a survey was conducted using the application Survey Monkey ™, invitations were sent using the university mailing list. The target population was then expected to have a good understanding of French (the language of evaluation). The list of hundred films was presented for all users in the same order.
Subjects had the choice to leave the questionnaire at any time (in case of fatigue), this is indicated by the button "Exit". Survey Subjects were also asked to indicate (if they agree) their gender and age.
Over June 2013, 854 subjects responded:
526 subjects rated more than 4 films, 169 subjects rated less than 4 films, and 159 subjects rated no film at all.
The quantity of ratings was considered as important enough to allow us to make a statistical study of these results.
1210
Firstly, the homogeneity of the group has to be tested. This statistical study will focus on the 695 subjects who have seen at least one film of the list.
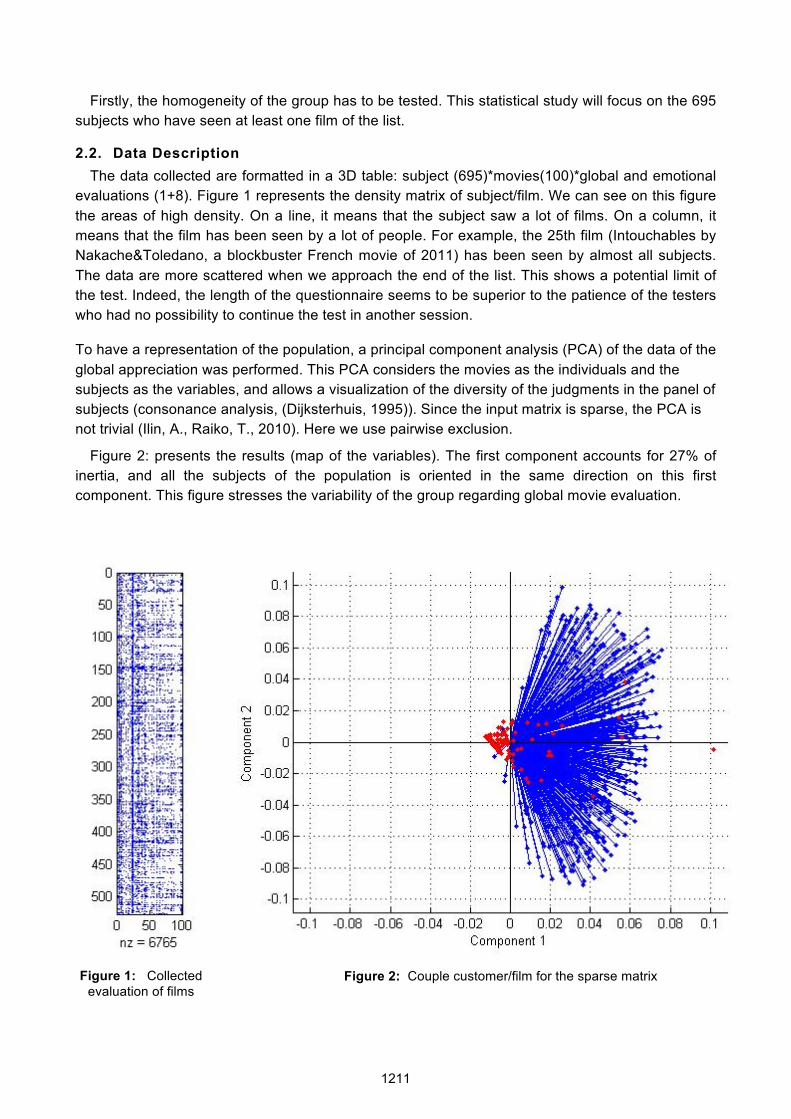
2.2. Data Description The data collected are formatted in a 3D table: subject (695)*movies(100)*global and emotional
evaluations (1+8). Figure 1 represents the density matrix of subject/film. We can see on this figure the areas of high density. On a line, it means that the subject saw a lot of films. On a column, it means that the film has been seen by a lot of people. For example, the 25th film (Intouchables by Nakache&Toledano, a blockbuster French movie of 2011) has been seen by almost all subjects. The data are more scattered when we approach the end of the list. This shows a potential limit of the test. Indeed, the length of the questionnaire seems to be superior to the patience of the testers who had no possibility to continue the test in another session.
To have a representation of the population, a principal component analysis (PCA) of the data of the global appreciation was performed. This PCA considers the movies as the individuals and the subjects as the variables, and allows a visualization of the diversity of the judgments in the panel of subjects (consonance analysis, (Dijksterhuis, 1995)). Since the input matrix is sparse, the PCA is not trivial (Ilin, A., Raiko, T., 2010). Here we use pairwise exclusion.
Figure 2: presents the results (map of the variables). The first component accounts for 27% of inertia, and all the subjects of the population is oriented in the same direction on this first component. This figure stresses the variability of the group regarding global movie evaluation.
Figure 1: Collected
evaluation of films Figure 2: Couple customer/film for the sparse matrix
1211

3. DATA TREATMENT
A strong assessment of this study is that the preference of a subject is guided by subject's emotions. The first idea to test with the data is: are there one or more preference functions based on emotions? In other words, can we classify people by "type" of preferences function? For example, a preference function of a subject who appreciates comic films would give a high preference score when the rating “amused” is high and the rating “anxious” is low.
3.1. Relationship between emotion and overall preference To verify the existence of this relationship and identify the function f such as
overall preference=f(emotions), we apply a multiple linear regression. For each subject i who saw films from 1 to J, we assume there exists a function F such as:
F(i,j) = overall preference = Ct + ai,1*SAmused(j) + a i,2*SSad(j) + a i,3*SAngry(j) + a i,4*SScared(j) + ai,5*SAttentive(j) + a i,6*SAnxious(j) + a i,7*SSurprised(j) + ai,8*SJoyful(j)
Given that 9 parameters must be estimated in this model, this regression is only meaningful for subjects who evaluated more than 9 films, 325 subjects in our study.
To illustrate the results, Figure 3 represents the regression coefficients obtained for 4 subjects, randomly chosen. For example, customer 4 is waiting for films that provoke scaring. On the opposite, customer 8 wants surprising and anxious films but not scared at all. We distinguish different profiles of moviegoers. Each user is represented by his/her function. The aim of the study is to find if profiles can be determined, that is to say some groups of users that share the same functions.
Figure 3: Coefficients of the regression for 4 selected subjects
To verify the predictive quality of function f, we determined its statistical confidence. The functions are reversed to predict the "preference" evaluation of each subject. A scale of half points materializes the difference between the real score and the predictive score. Figure 4 presents the absolute mean of the prediction for each subject. The column finds its legend on the left side of the graph. The squared linked line is linked to the right legend. For 86% of the 325 subjects the projected evaluation stands in a 1-point interval around the actual evaluation. Only for one subject did the error exceed 2-points.
1212
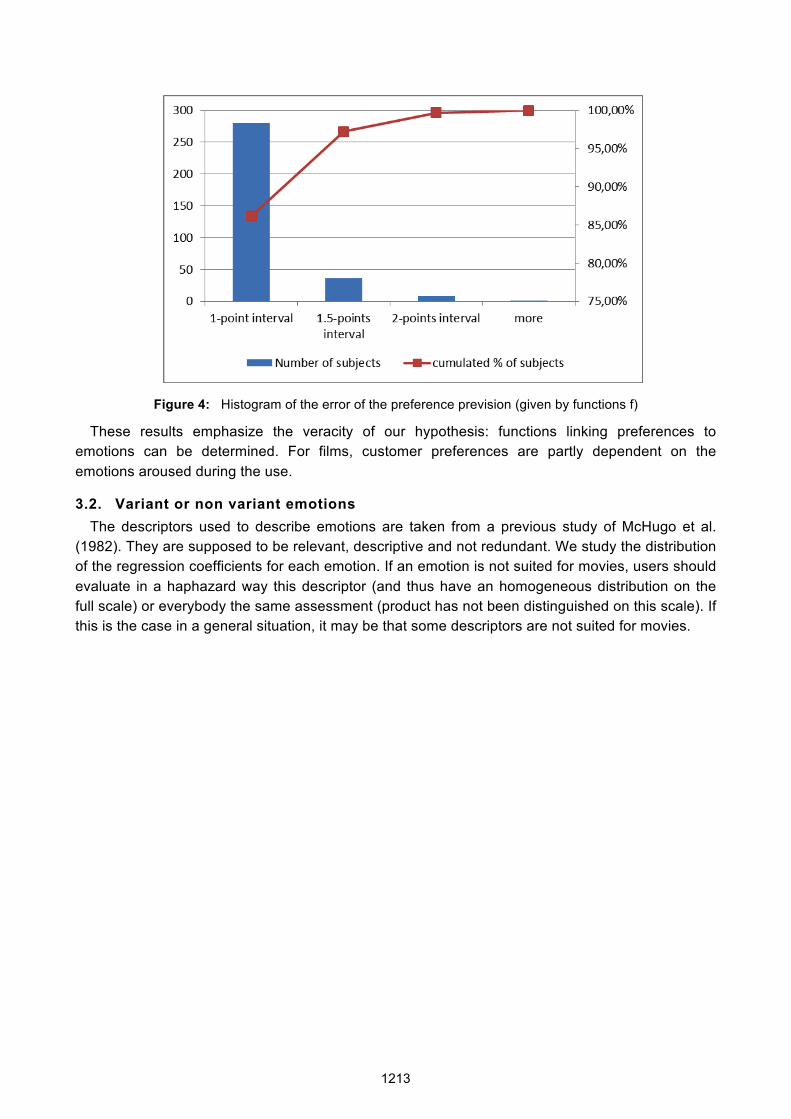
Figure 4: Histogram of the error of the preference prevision (given by functions f)
These results emphasize the veracity of our hypothesis: functions linking preferences to emotions can be determined. For films, customer preferences are partly dependent on the emotions aroused during the use.
3.2. Variant or non variant emotions The descriptors used to describe emotions are taken from a previous study of McHugo et al.
(1982). They are supposed to be relevant, descriptive and not redundant. We study the distribution of the regression coefficients for each emotion. If an emotion is not suited for movies, users should evaluate in a haphazard way this descriptor (and thus have an homogeneous distribution on the full scale) or everybody the same assessment (product has not been distinguished on this scale). If this is the case in a general situation, it may be that some descriptors are not suited for movies.
1213

Figure 5: Box-plot of the coefficients of the models f for all the panel of subjects
Figure 5 describes the coefficients of the 325 "f" functions. On each box, the central mark is the median; the edges of the box are the 25th and 75th percentiles. The spacings between the different parts of the box help indicate the degree of dispersion. For all the emotions, we see a dispersion of all the coefficients. For example, the sadness is an emotion researched by people while others rejected it. Anxious seems to be the more consensual. We choose to keep all the descriptors for the following of the study, meaning that McHugo et al.'s list seems to be generic.
We can notice that for some subjects the Constant term is predominant which means that emotions are not the main driver of global evaluation.
3.3. Preference and Perception neighborhood To generate the preference and perceptual data, we have assumed that customers obey certain
"profiles" of preferences. This assumption is quite consistent with marketing studies showing that customer preferences obey to behaviors that can be typed by groups, segments. The interest of stressing the existence of dependence between preference and emotions is to use either or both of these input data to create neighborhood. Those neighborhoods could then be used to recommend products to potential customers.
To create neighborhoods we use 2 matrixes:
1. Subjects/overall preferences
2. Subjects/weights of emotions (coefficients of f).
1214
The first clustering will group the subjects according to the films they like or dislike while the second one will group subjects considering the reasons why they like or dislike films. To make the groups, we use iterative k-mean clustering with squared Euclidean distance. This iterative partitioning minimizes the sum, over all clusters, of the within-cluster sums of point-to-cluster-centroid distances (Seber 1984; Spath, 1985). We face the problem of matrix Subjects/overall preferences sparsity. For a given pair of subjects, distance is then computed based only on the films in common.
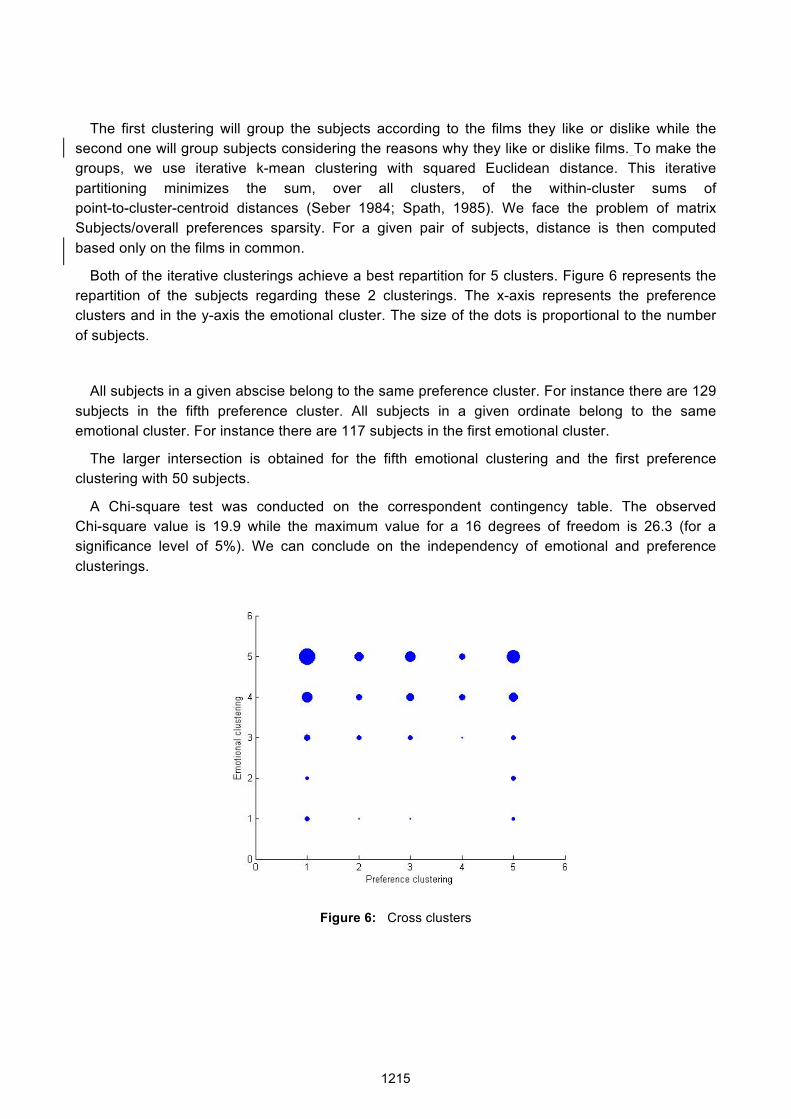
Both of the iterative clusterings achieve a best repartition for 5 clusters. Figure 6 represents the repartition of the subjects regarding these 2 clusterings. The x-axis represents the preference clusters and in the y-axis the emotional cluster. The size of the dots is proportional to the number of subjects.
All subjects in a given abscise belong to the same preference cluster. For instance there are 129 subjects in the fifth preference cluster. All subjects in a given ordinate belong to the same emotional cluster. For instance there are 117 subjects in the first emotional cluster.
The larger intersection is obtained for the fifth emotional clustering and the first preference clustering with 50 subjects.
A Chi-square test was conducted on the correspondent contingency table. The observed Chi-square value is 19.9 while the maximum value for a 16 degrees of freedom is 26.3 (for a significance level of 5%). We can conclude on the independency of emotional and preference clusterings.
Figure 6: Cross clusters
1215
4. DISCUSSION AND CONCLUSION
The proposed approach enables finding customers having the same ratings of products but also getting those who have the same perceptive reasons of ratings.
In this study, we determined a list of emotions adapted to movies and collected data through an online survey. We identify for each client, relationships between emotions and overall assessment. We grouped subjects with similar overall assessments and subjects with reasons for these assessments. Overall assessments are currently used by e-commerce websites as base for the recommendation system. Yet our results stress the existence of other possible relevant informations that could be of great interest to find customer with the same product expectation.
We can then predict a product based on films that other users have liked (overall score of preference) but also in terms of perceptual reasons that guided the note. This can become very useful cause emotions often guide the choice of a product, whether technological, cultural or edible. Further work will explore the use of the emotional information to improve product recommendation.
One of the next steps is to study the adaptability of DES emotions. Can we use the same words to speak about emotions involve by a film, by a telephone or by a yogurt? Is there a common list of vocabulary or the process of selection is to redo for each application?
REFERENCES Camerer, C., Loewenstein, G. and Prelec, D. (2005). Neuroeconomics: How Neuroscience Can Inform Economics. Journal of Economic Literature. Vol. 43, pp. 9–64
Desmet, P.M.A. and Hekkert, P. (2007). Framework of Product Experience. International Journal of Design. Vol.1, No. 1 Dijksterhuis, G. (1995). Assessing panel consonance. Food Quality and Preference, Vol.6, pp 7–14.
Ilin, A., Raiko, T. (2010). Practical approaches to principal component analysis in the presence of missing values. The Journal of Machine Learning Research Vol. 99, pp. 1957–2000.
McHugo, G.J., Smith, C.A., and Lanzetta, J.T. (1982). The Structure of Self-Report of Emotional Responses to Film Segments. Motivation and Emotion, Vol. 6, No. 4, pp. 365-385K
Nakada, K. (1997). Kansei engineering research on the design of construction machinery. International Journal of Industrial Ergonomics, Vol. 19, pp. 129-146
Norman, D. (2004). Emotional design : Why we love (or hate) everyday things. London : Basic Books
Richins, M. (1997). Measuring Emotions in the Consumption Experience. Journal of Consumer Research. Vol. 24, No. 2, pp. 127-146
Seber, G. A. F. Multivariate Observations. Hoboken, NJ: John Wiley & Sons, Inc., 1984. Shang, H., Hsu, Ming, C., Chuang, Chien, C., Chang, C. (2000). A semantic differential study of designers’ and users’ product form perception. International Journal of Industrial Ergonomics, Vol. 25, pp. 375-391
Spath, H. Cluster Dissection and Analysis: Theory, FORTRAN Programs, Examples. Translated by J. Goldschmidt. New York: Halsted Press, 1985.
1216