Embed Size (px)
Citation preview
November 12, 2015
Can Voluntary Nutrition Labeling Lead to a Healthier Food Market?
Xiaoou Liu
School of Agricultural and Rural Development Renmin University of China
Beijing, China
Rigoberto A. Lopez Department of Agricultural and Resource Economics
University of Connecticut, Storrs, USA
Chen Zhu†
College of Economics and Management China Agricultural University
Beijing, China
Invited paper prepared for the AAEA session “Frontiers in the Economics of Food
Labeling,” Allied Social Science Association Annual Conference, San Francisco, CA,
January 4, 2016.
------------------------------------------------------------------------------------------------------- †The corresponding author is Chen Zhu, Email: [email protected]. Xiaoou Liu is an associate professor in the School of Agricultural Economics and Rural Development, Renmin University of China in Beijing, China. Rigoberto A. Lopez is head and a professor in the Department of Agricultural and Resource Economics, University of Connecticut in Storrs, CT, USA. Chen Zhu is an assistant professor in the College of Economics and Management, China Agricultural University in Beijing, China. The research is funded by the National Science Foundation of China (71373268), the National Social Science Fund of China (14CJY018), the Chinese Universities Scientific Fund (2015QC010), the Zwick Center for Food and Resource Policy at the University of Connecticut, and the Center for Food and Health Economic Research (C’FHER) at China Agricultural University.
Abstract
This article reviews approaches to voluntary nutrition labeling (VNL), such as front-of-
package (FOP) labels, that emerged in the 2001-2014 period to provide simplified nutrition
information, thus lowering the search cost for nutritional information. We present a market
model to assess consumer and producer responses to changes in information search cost
brought about by VNL. We specifically focus on the introduction of VNL in the ready-to-
eat cereal (RTEC) market and illustrate trends in labeling and the overall healthfulness of
RTEC products. Both the conceptual and empirical evidence suggest that VNL has been
instrumental in attaining a healthier RTEC market. Finally, we suggest a research agenda
to further theory development and empirical (experimental and big data) research to better
comprehend the role of VNL in relation to market healthfulness.
Keywords: nutrition labels; food market; front-of-package labeling; voluntary
nutrition labeling.
JEL codes: D12, L66, I19, M30
3
In the last decade, the food industry voluntarily started to experiment with different
front-of-package (FOP) and retail-shelf nutrition labeling schemes. In contrast to its
counterpart, the mandatory Nutrition Facts Panel (NFP),1 voluntary nutrition labels
(VNL) have been shown to effectively alter consumers’ behavior and choices.2 Even
though many studies are emerging in this area, a fundamental question remains: Can
VNL lead to a healthier food market? As the market also includes firms’ responses to
consumer behavior, insight into firms’ behavior in providing VNL is also needed.
A better understanding of the role that voluntary nutrition labeling plays in
connecting consumers’ food choices, industry strategies, and the overall healthfulness
of food markets is important for several reasons. First, nutritional labels are signals of
food quality; they have been used to transform credence attributes of food products into
search attributes and to solve the ensuing incomplete information problem (Nelson,
1974; Caswell and Mojduszka, 1996). Second, as diet-related chronic diseases become
more prevalent, how to effectively use nutritional labels to affect consumers’ food
choices to trigger socially preferable health outcomes is a major concern of public
policy makers. While the mandatory NFP labeling system has been found ineffective
1 Since 1994, the U.S. government has required manufacturers to print a NFP on the back or side of
food packages. The Food and Drug Administration’s revision of the NFP emphasizes calories and
added sugar content (Cha and Thompson, 2014).
2 Consumers prefer simpler labels with a summarized key nutrition facts printed conveniently on the
front of a package (Williams 2005; Wansink, Sonka, and Hasler 2004; Grunert and Wills 2007), and they
are more likely to use information in simplified formats, particularly for calories (Bollinger, Leslie, and
Sorensen 2011). Kiesel and Villas-Boas (2013) find that some summarized and simple nutrition labels
have a positive impact on sales of microwave popcorn but that the impact diminishes when labels become
complicated. Zhu, Lopez and Liu (2016) find FOP labels increase the probability that heterogeneous
consumers will choose healthier food products. Zhen and Zheng (2015) show that posting the NuVal
score increases sales for products with higher scores.
4
in terms of consumer behavior or healthfulness of the market, VNL is a product of
market forces driven by changes in consumers’ attitude towards health as well as firms’
responses, potentially leading to a desirable market outcome.3 Thus, VNL could
provide a private market solution to a public health problem.
This article has three goals to address the issues outlined above: (1) it reviews and
documents VNL by food manufacturers and retailers in the last decade; (2) it proposes
a conceptual analysis to frame questions about the provision of VNLs and their
effectiveness; and (3) it provides preliminary empirical evidence on trends in overall
healthfulness in the food market using data from the ready-to-eat cereal (RTEC) market.
The conceptual analysis and the empirical evidence presented are suggestive but
supportive of the fact that VNL can lead to a healthier food market. Our paper also
points out gaps in the labeling literature that future research could address.
Evolution of Voluntary Nutrition Labeling
To illustrate, we adopt the RTEC market to show the trends in VNL. The RTEC market
provides an excellent case study to illustrate the evolution of VNL for several reasons.
First, RTEC is the largest category of breakfast foods in the U.S., with approximately
3 Many consumers do not understand NFP labels (Rothman et al. 2006; Visschers, Hess and Siegrist
2010). Only 53% of consumers report ever using NFP information, and the usage has been declining
(Blitstein and Evans 2006; Todd and Variyam, 2008). In fact, the NFP causes no change in consumers'
search behaviors (Balasubramanian and Cole, 2002). Recent evidence even reveals that introduction of
the NFP has been counterproductive in terms of promoting healthfulness of food choices—an unintended
consequence of the regulation (Moorman, Ferraro, and Huber 2012; Wang, Rojas, and Bauner 2015). An
explanation for the ineffectiveness of the NFP is that there is a high information cost when consumers
have to process complicated nutrition information (Kiesel, McCluskey, and Villas-Boas 2011; Levy and
Fein 1998; Berning, Chouinard, and McCluskey 2008).
5
$10 billion in sales in 2014 (Strom, 2014). Second, brand entry and exit occur
frequently in the RTEC market, affording the reconfiguration of nutritional product
characteristics by the firm. Third, none of the national brands has a truly dominant hold
on the market, which imposes a considerable informational burden on consumers.
Fourth, the industry has been a leader in experimenting with VNL formats in the past
decade.
Compared with the mandatory NFP labeling system, the word “voluntary” here
means that the nutrition information provided through labeling is determined by the
manufacturers and/or retailers in the food industry, not by a regulator.4 From 2001-
2014, the evolution of voluntary labeling systems can be divided into three broad types,
discussed below: criteria-based systems, fact-based systems, and evaluative systems
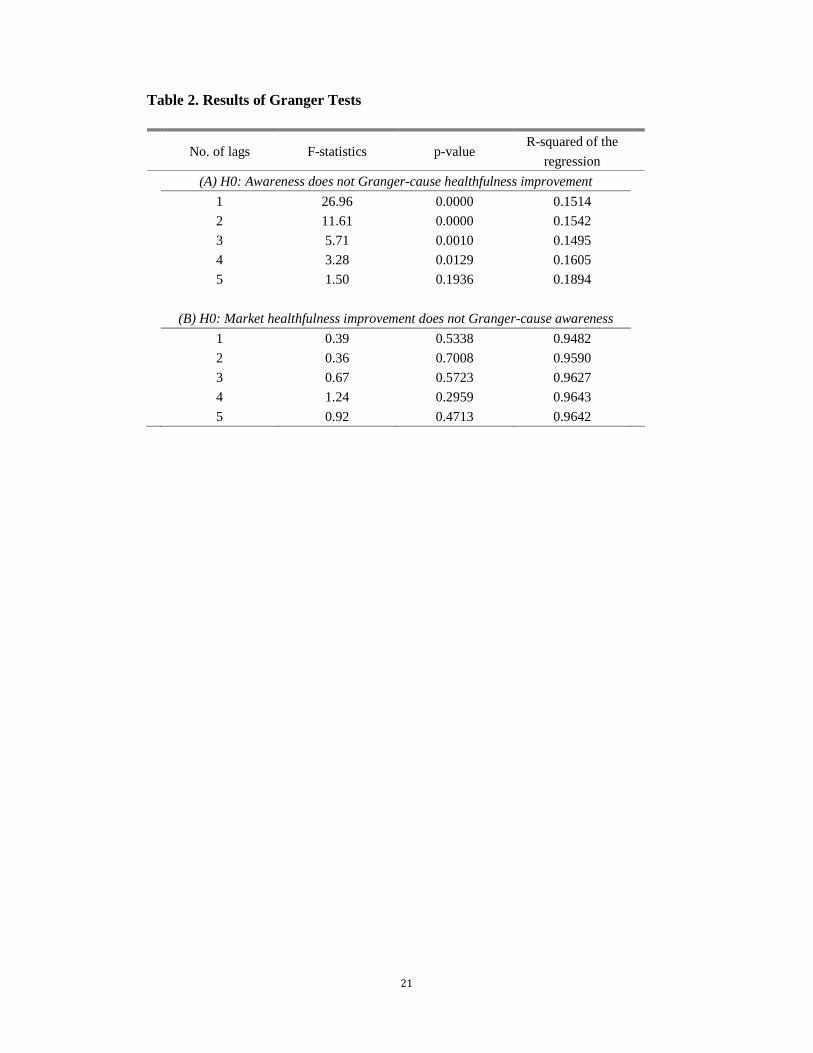
(Pereira, 2010; Norton, Rucker and Lamberton, 2015). Figure 1 summarizes the
timeline of major labeling events discussed below.
FIGURE 1 AROUND HERE
Criteria-based Labels
The criteria-based nutrition labeling systems categorize food products based on
manufacturers’ own criteria or guidelines, and qualified products can print certain
symbols on the front of the package (FOP). This FOP label usually provides qualitative
information only.
4 Note that VNL systems were introduced in addition to the mandatory NFP; they do not provide new
nutritional information not included in the NFP.
6
The RTEC market began to experiment with criteria-based VNL in 2004, when
PepsiCo printed its Smart Spot front-of-package (FOP) label on its packages. General
Mills followed by launching the Goodness Corner FOP labeling system, but consumers
found it overly complicated. Kraft Foods started to print the Sensible Solution FOP
label on food products meeting certain standards in 2005. In August 2009, Smart
Choices labels replaced several existing FOP schemes. However, it was soon
abandoned, in late 2009, due to its questionable nutritional criteria.
In 2012, Walmart launched the Great For You labeling system for both packaged
and fresh food products. The foods that are eligible for this green icon must meet
nutrition criteria informed by the latest nutrition science and authoritative guidance of
the 2010 Dietary Guidelines for Americans (U.S. Department of Human and Health
Services and U.S. Department of Agriculture, 2010). Walmart also invited other leading
food manufacturers to adopt these nutrition criteria and its logo.
Fact-based Labels
The fact-based nutrition labeling systems usually restate some of the facts listed on the
Nutrition Facts Panel in a more concise manner, which can help consumers quickly find
the key nutritional information they need. The nutrients presented often include calories,
sugar, sodium, fat and their percent daily value (PVD), but may also include fiber or
other micronutrients.
One of the first fact-based FOP label systems was Kellogg’s Nutrition at a Glance,
introduced in October 2007. Based on the European Guideline Daily Amounts (GDA)
7
system, Nutrition at a Glance displays the total amount per serving of calories, total fat,
sodium, and sugar along with a percentage of the recommended daily amount. The
system also highlights additional nutrients, such as fiber, calcium, magnesium,
potassium, or vitamins. In the meantime, General Mills adopted the Nutrition
Highlights FOP system, which has a similar format. These labeling systems provide at-
a-glance information about key nutrients in a standardized format without placing an
additional information burden on consumers.
In 2011, the Grocery Manufacturers Association (GMA) and the Food Marketing
Institute (FMI) developed the Facts Up Front (formerly known as Nutrition Keys) FOP
labeling system. The basic label shows calories per serving and information on three
major nutrients to limit in the diet: sugar, saturated fat, and sodium. So far, Facts Up
Front is one of the most prevalent voluntary labeling programs, with more than 50
leading manufacturers, retailers and wholesalers participating.
Evaluative Labels
The evaluative nutrition labeling systems provide consumers with an overall evaluation
of a product’s healthfulness and help consumers quickly choose healthier alternatives
based on scores within a specific rating system. In the United States evaluative nutrition
labels have been provided by grocery retailers at the point of sale. For example, in 2006
Hannaford Brothers, an east coast supermarket chain, launched the first store-wide
nutrition rating system, Guiding Stars. Food products were awarded one (good), two
8
(better) or three (best) stars based on a proprietary algorithm. The system has expanded
to more than 1,400 stores representing several supermarket chains.
Another example is the NuVal nutrition scoring system, launched in 2008, which
rates the nutritional content of foods with a numeric score from 1 to 100. In stores of
participating retailers, NuVal labels are usually displayed on the shelf tags next to prices
rather than on the food package. Since 2010 NuVal has also started to appear in
cafeterias and vending machines of participating schools, aiming to help students and
their parents make healthier dietary decisions.
Conceptual framework
Although no integrated theory with respect to VNL exists, we suggest a conceptual
framework stemming from consumer’s search for nutritional information to analyze the
health outcome of VNL. In the conceptual framework, consumers respond to VNL by
increasing their demand for healthier products, and firms respond by changing their
portfolios of healthy products to match consumer desires.
Following Salop and Stiglitz (1977), we consider a market with two kinds of
products: one category is healthy brands with nutrition indicator h and the other
contains not-healthy brands with nutrition indicator h. Consumers are aware of the
existence of the two categories but do not know a priori in which category a product
belongs. When health-aware consumers search for products, they incur a cost c for
obtaining nutrition information to help them to choose healthier brands. Consumers
may have different information costs c because of differing ability to understand and
9
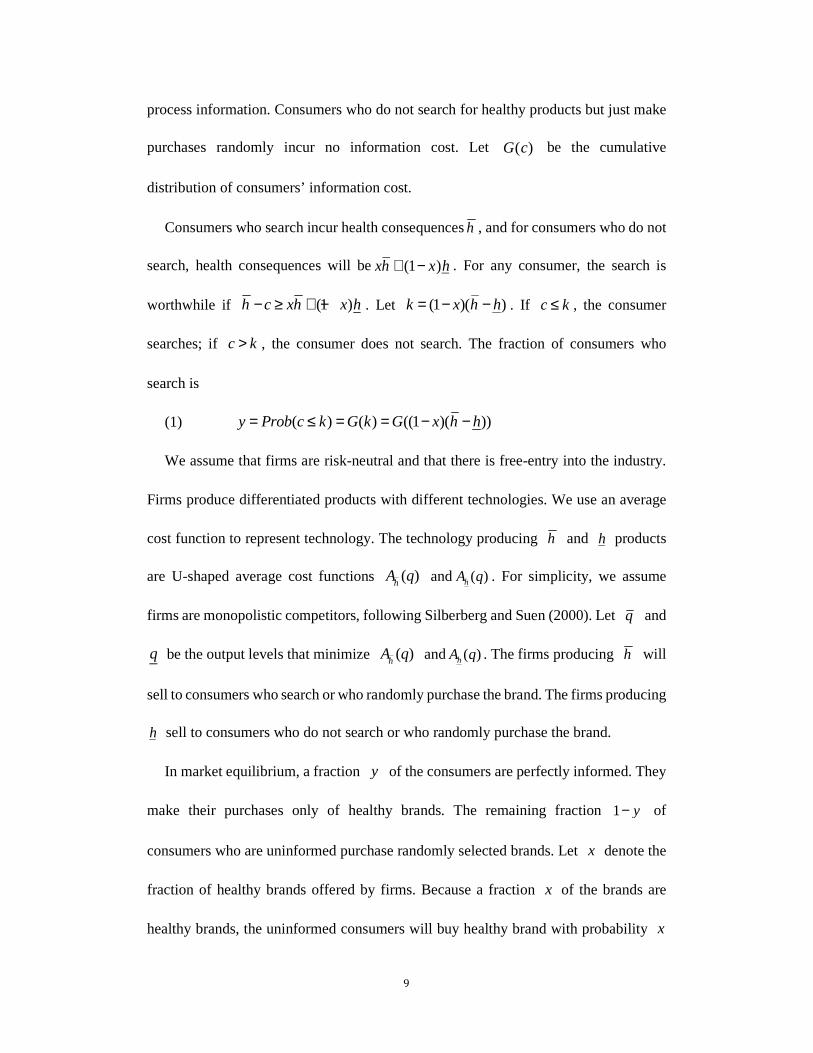
process information. Consumers who do not search for healthy products but just make
purchases randomly incur no information cost. Let G(c) be the cumulative
distribution of consumers’ information cost.
Consumers who search incur health consequencesh , and for consumers who do not
search, health consequences will be xh + (1− x)h . For any consumer, the search is
worthwhile if (1 )h c xh x h− ≥ + − . Let (1 )( )k x h h= − − . If c k≤ , the consumer
searches; if c k> , the consumer does not search. The fraction of consumers who
search is
(1) ( ) ( ) ((1 )( ))y Prob c k G k G x h h= ≤ = = − −
We assume that firms are risk-neutral and that there is free-entry into the industry.
Firms produce differentiated products with different technologies. We use an average
cost function to represent technology. The technology producing h and h products
are U-shaped average cost functions ( )h
A q and ( )hA q . For simplicity, we assume
firms are monopolistic competitors, following Silberberg and Suen (2000). Let q and
q be the output levels that minimize ( )h
A q and ( )hA q . The firms producing h will
sell to consumers who search or who randomly purchase the brand. The firms producing
h sell to consumers who do not search or who randomly purchase the brand.
In market equilibrium, a fraction y of the consumers are perfectly informed. They
make their purchases only of healthy brands. The remaining fraction 1 y− of
consumers who are uninformed purchase randomly selected brands. Let x denote the
fraction of healthy brands offered by firms. Because a fraction x of the brands are
healthy brands, the uninformed consumers will buy healthy brand with probability x
10
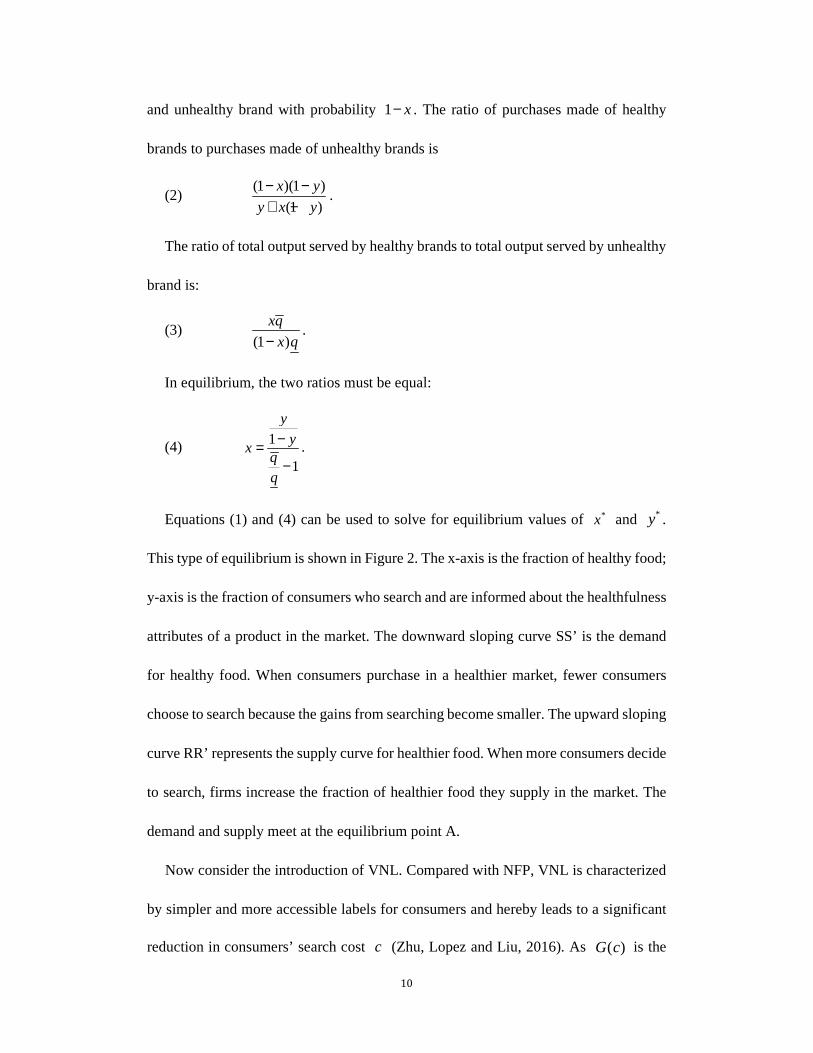
and unhealthy brand with probability 1 x− . The ratio of purchases made of healthy
brands to purchases made of unhealthy brands is
(2) (1 )(1 )
(1 )
x y
y x y
− −+ −
.
The ratio of total output served by healthy brands to total output served by unhealthy
brand is:
(3) (1 )
xq
x q−.
In equilibrium, the two ratios must be equal:
(4) 1
1
y
yx
−=−
.
Equations (1) and (4) can be used to solve for equilibrium values of *x and *y .
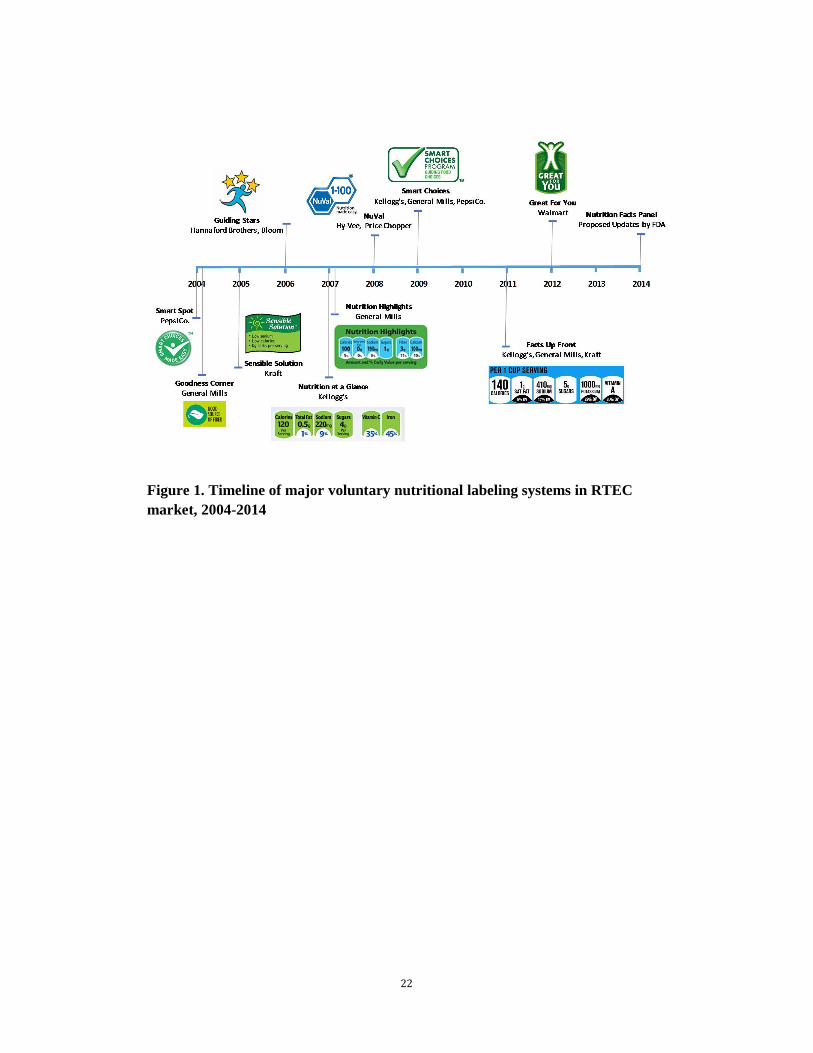
This type of equilibrium is shown in Figure 2. The x-axis is the fraction of healthy food;
y-axis is the fraction of consumers who search and are informed about the healthfulness
attributes of a product in the market. The downward sloping curve SS’ is the demand
for healthy food. When consumers purchase in a healthier market, fewer consumers
choose to search because the gains from searching become smaller. The upward sloping
curve RR’ represents the supply curve for healthier food. When more consumers decide
to search, firms increase the fraction of healthier food they supply in the market. The
demand and supply meet at the equilibrium point A.
Now consider the introduction of VNL. Compared with NFP, VNL is characterized
by simpler and more accessible labels for consumers and hereby leads to a significant
reduction in consumers’ search cost c (Zhu, Lopez and Liu, 2016). As G(c) is the

11
fraction of consumers with search costs less than c , a general decrease of search costs
will increase the demand for healthy food (SS’) for any given c. The new equilibrium
occurs at point B in figure 2. Thus, a decrease in search costs increases the fraction of
informed consumers as well as the fraction of healthy brands purchased from the supply
side. The point is that voluntary nutritional labeling, by conveying nutritional
information with a lower search cost, increases both healthiness of consumer product
choices and the share of healthy products in the marketplace.
FIGURE 2 AROUND HERE
Preliminary Empirical Evidence
To correlate observed food market healthiness data with the expansion of VNL schemes
in the last decade, we present preliminary results that suggest that VNL can lead to a
healthier RTEC market. Our preliminary evidence is more suggestive than conclusive,
but it does support our claim that VNL has increased the healthfulness of the RTEC
market.
We use a unique panel of nutrition information from the Mintel Global New Products
Database (GNPD) to show the trend of overall healthfulness in the U.S. RTEC market
from 2001-2014.5 By including all newly launched and available brands, our sample
covers 2,149 national and private label cereal brands in this period. Compared with
existing studies (Ippolito and Mathios 1990; Wang, Rojas, and Bauner 2015), our
5 The GNPD database records product reformulations, new product introductions, new product
packaging, and new product varieties.

12
sample shows a more comprehensive trend of the overall nutritional quality of the
RTEC market.
TABLE 1 AROUND HERE
Table 1 presents content changes of main nutrients from 2001 to 2014. Although the
number of new products doubled during this period, two negative nutrients, sugar and
sodium, follow a notably decreasing trend. The median sodium content dropped by
60.2%, from 150.61 to 59.89 milligrams per ounce, and the median sugar content
declined by 21.2%, from 8.5 to 6.7 grams per ounce. Meanwhile, the median content
of fiber, which is considered a positive nutrient, increased by 18.4%, from 1.74 to 20.6
grams per ounce. Table 1 also reports the Nutrient-Rich Foods Index (NRF), developed
by Fulgoni, Keast, and Dewnowski (2009) to evaluate the overall healthfulness of food
products.6
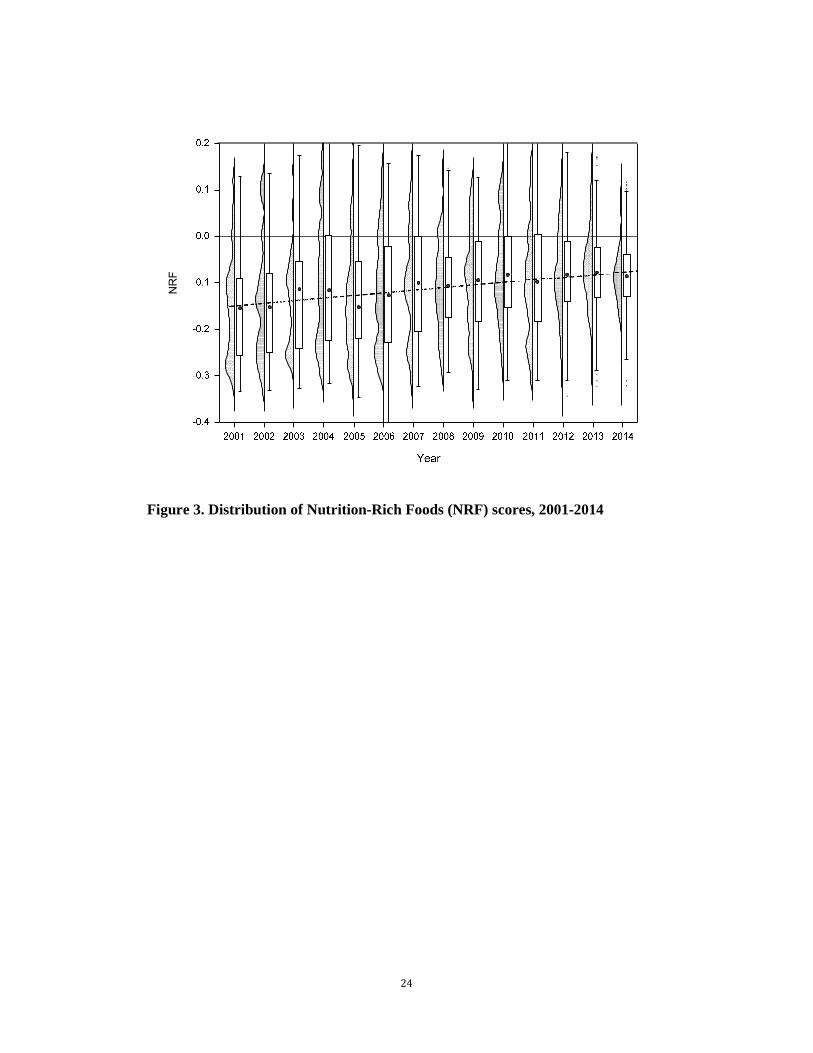
Figure 3 displays the distribution of NRF (shaded area) and the median NRF scores
(big black dots in box plots) of all the newly launched RTEC products each year from
2001-2014. The linear fitted values of median NRF scores are connected by the dashed
line. The NRF distribution becomes more concentrated around the median. The dashed
line shows an increasing trend of the median NRF score and thereby the improved
overall healthfulness of the RTEC market.
FIGURE 3 AROUND HERE
6 NRF is calculated as the sum of the percent daily values (DV) for dietary fiber minus the DV for
sugar, sodium, and saturated fat per 100 kcal RTEC.
13
Future Research Agenda
While our theoretical framework and empirical evidence are more suggestive than
definite, a full framework, theoretical or empirical, is beyond the scope of this paper.
Our suggestions to motivate future research are motivated by the need to bridge the
gaps between theory and empirics with respect to VNL and emerging research in
related fields that may be applicable to food labeling in general. Given the body of
literature to date, more research is needed to determine the effects of VNL labeling on
consumers’ actual shopping behavior (Hersey et al. 2003) as well as on firms’
behavior with respect to VNL and product reformulation.
Our theoretical framework and empirical evidence suggest that VNL can result in
a healthier food market. The question as to why firms adopt VNL remains elusive. To
this end, the literature of firms’ voluntarily participation in self-regulated programs
provide several plausible models of firms undertaking such behavior, including
generating firm-specific public goodwill (Smart 1992; Arora and Gangopadhyay 1995;
Esty 1997; Khanna and Damon 1999), adopting stricter self-regulation to avoid
potentially more costly government policies (Jochem and Eichhammer, 1999; Nyborg
2000; Roe and Sheldon 2007), or raising the costs of their rivals (Salop and Scheffman,
1983). In the context of search cost theory, an interesting model that generates several
untested hypotheses with respect to firm’s optimal pricing and profits is the one
provided by Branco, Sun, and Villas-Boas (2012).
In the case of VNL, an alternative explanation is that when consumers become
more aware of diet-related risks, firms respond by supplying VNL and reformulating

14
products to meet the changing demand.7 To test this premise, we explore the role that
increases in consumers’ concerns towards food and health may have on the
healthfulness of the market, using the RTEC industry as an illustration. More
specifically, we use the number of media incidences of health-related keywords since
January 2001 from LexisNexis News data as a proxy of consumers’ concern.8 The
trend in Figure 4 shows a significant increase in the number of publications in the media
regarding food and health in last 15 years, thus indicating that consumer concerns about
food healthfulness have increased in this time period, during which food manufacturers
and retailers introduced and expanded VNL. In addition, we determined that consumer
7 As more scientific evidence over the past decades reveals solid links between diet and health, the mass
communication of this knowledge to consumers has increased their awareness of this issue. Consumers’
attitudes toward health are usually captured by consumers’ risk aversion over health capital in the utility
function (Grossman, 1972). The pioneering work of LaValle (1968) has shown consumers’ risk aversion
is a driving force of consumers’ demand value of information. A recent application connecting the
demand for information and consumer preferences for nutrition attributes is the work of Berning,
Chouinard, and McCluskey (2008), who conclude that consumers who have stronger preferences for
nutrition attributes tend to demand more information.
8 The difficulty in outlining consumers’ concerns about health is to find a valid proxy variable. Mocan
and Altindag (2014) use the proportion of correctly answered questions about health risks of certain
behaviors via surveys as a proxy. The limitation of this proxy is that it cannot be used to study a long-
run and continuous evolution in consumers’ health concerns. We adopt the approach by Cawley and
Ruhm (2011), using the trend of numbers of media publications. As discussed by Cawley and Ruhm
(2011), although many factors may drive the increasing trend in media publications concerning health,
the trend of popularity on public platforms can be used as a proxy for the increasing concern of the public
and government with health. The media data in this paper is from LexisNexis News data, which is drawn
from national and international newspapers, news transcripts from TV and radio, popular and general-
interest magazines, economics and trade journals, company financial reports, and the “Public Opinion
Online” database produced by the Roper Center for Public Opinion Research at the University of
Connecticut. We searched the database using the criteria “calories OR sugar OR healthy food OR
nutritional health OR diet health OR food label OR nutritional information.”

15
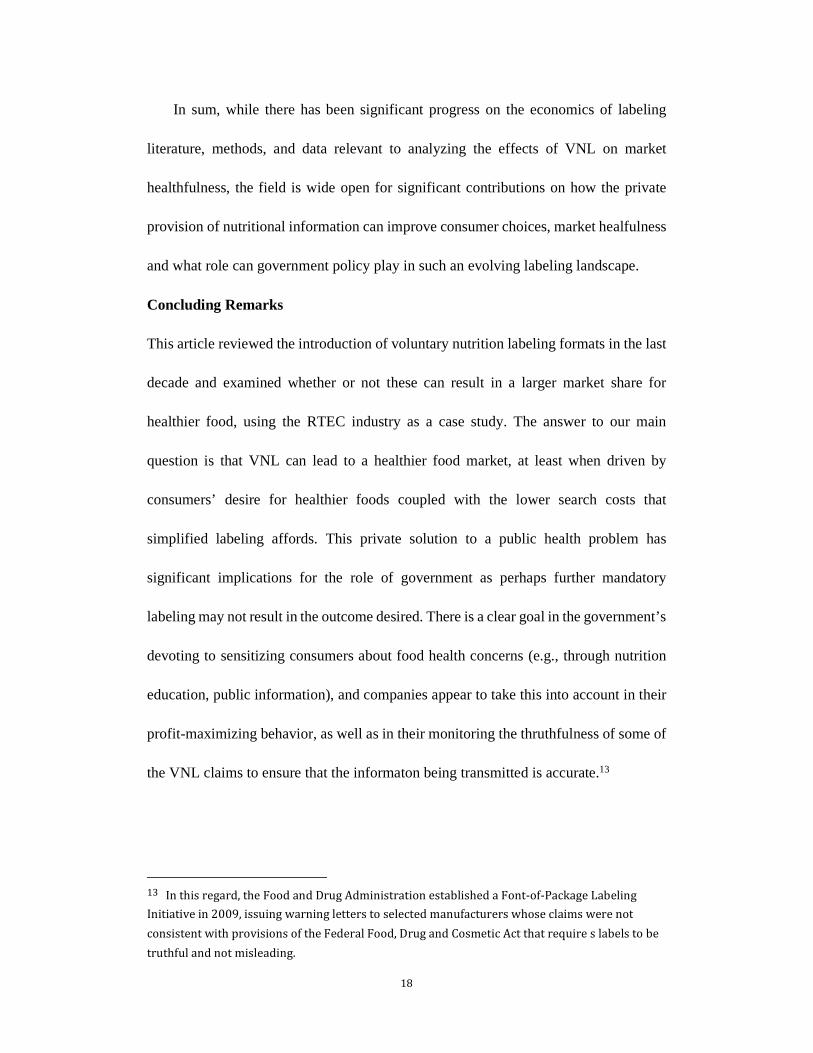
concerns about food healthiness Granger-cause an increase in healthiness in the RTEC
market.9
FIGURE 4 AROUND HERE
TABLE 2 AROUND HERE
More recent theory on consumer search for information focuses on consumers’
ability to process information to explain why they may ignore complex or over-
abundant information. More specifically, this work points to consumers being
“bounded rational” (exhibiting limited attention) or “rationally inattentive” (optimally
allocating attention) (Manzini and Mariotti 2014; Matjka and McKay 2015), which
would suggest that simplified labeling, such as VNL, increases the likelihood of healthy
food choices.
In the empirical area, researchers could synthetically use experimental methods,
observed (big) data, or surveys to test hypotheses regarding the impact of VNL format
on the healthfulness of consumers’ choices. In this section, we focus on the first two.
Recently there has been a significant increase in the use of experimental economics to
investigate consumers’ reaction to nutrition labeling formats, which has implications
for VNL. Recent work in this area is being conducted at several centers of experimental
economics research that have focused on nutrition, including RTI International in North
Carolina, Cornell’s Lab for Experimental Economics and Decision Research as well as
9 We use a Granger causality test to illustrate the second fact. The results are in table 2. The F-statistics
are significant at the 5% level for lags of 1-4 and confirm that the variable of consumers’ health concerns
Granger-cause the variable of RETC market healthfulness. In contrast, market healthfulness does not
Granger-cause consumers’ health concerns given the insignificant F-statistics for all lags of 1-4.
16
its Center for Behavioral Economics and Child Nutrition Programs, whose aims are not
focused exclusively on VNL but that are contributing to the understanding of consumer
behavior with respect to food attributes, presentation and labeling contexts.10 The work
in experimental psychology and computational modeling can also contribute to the
evaluation and improvement of VNL (e.g., Helfer and Shultz (2014), who show that
quantitative, single attribute labeling schemes have greater usability than multi-attribute
and binary ones). Comprised of psychologists and public health faculty, the newly
created Duke/University of North Carolina/USDA Center for Behavioral Economics
and Healthy Food Choice Research aims to conduct field experiments in conjunction
with big data analysis to investigate both consumer and industry behavior and impacts
of nutrition policies, including VNL.11
Another emerging area of interest applicable to empirical work with implications
for the effective design of VNL is eye-tracking (documenting consumers’ visual
attention via cameras or similar equipment), particularly on the effectiveness of
capturing consumer attention and comprehension. Further research in this growing field
can guide label modification to improve consumers’ ability to use nutrition labels and
to select healthy foods via evaluation of alternative labeling designs on packages and
on retail shelves. A comprehensive review of this research is provided by Graham,
10 For example, the work of Liaukonyte, Streletkaya, and Kaiser (2015). 11 Nutrition labeling, and VNL research in particular, can also benefit from new knowledge being
acquired through research in environmental labeling. In this regard, it is also worth mentioning that
centers and labs at other universities are conducting important, related work on consumer behavior
towards environmental labeling and consumer responses to perceived risks, such as the USDA Center
for Behavioral and Experimental Agri-Environmental Policy Research at the University of Delaware.

17
Orqui and Visschers (2012), and a good example of a recent application to RTEC
products is provided by Pennings, Striano, and Oliveiro (2014).
In the non-experimental area, the use of big data (e.g., scanner data) and natural
experiments for identification of strategies promises to shed additional light on the
effectiveness of VNL and other labeling schemes, particularly their impact on
consumers’ choices of healthy food. The literature in this area has focused on the
consumer side, given the policy interest in influencing consumer choices, but research
is also needed to explore incentive schemes and the motivations in the food industry.
Europe has a rich history of evaluating and experimenting with VNL and other labeling
schemes, albeit focused on consumer response, that could provide some guidance for
future research in other countries (e.g., Grunert and Wills 2007; Boztug et al. 2015, on
consumers’ response to an FOP label in the U.K. using scanner data). It is also worth
mentioning Mintel database pictures of labels of most U.S. products at the UPC level,
which can be instrumental in both collecting detailed nutrition information (which can
be converted into healthfulness metrics), product entry and exit, as well as the incidence
of various types of VNL. A recent example is the paper by Zhu, Lopez and Liu (2016),
which utilizes 2.8 million observations matched to Mintel data to assess the impact of
labels on consumers’ healthy food choices.12
12 A barrier to entry into research with customized big data is their cost of scanner data (IRI or Nielsen)
or other datasets like Mintel or Nielsen’s advertising datasets. Researchers interested in these databases
could also consider non-customized datasets such as those available from the Kilts Center for Marketing
at the University of Chicago or the IRI Academic Dataset that can be used in conjunction with labeling
data, such as Mintel. For a review of the conditions of using non-customized IRI marketing dataset see
the paper by Bronnenberg, Kruger, and Mela (2008). For applications of Nielsen databases see Mrrick
and Lambert (2013).
18
In sum, while there has been significant progress on the economics of labeling
literature, methods, and data relevant to analyzing the effects of VNL on market
healthfulness, the field is wide open for significant contributions on how the private
provision of nutritional information can improve consumer choices, market healfulness
and what role can government policy play in such an evolving labeling landscape.
Concluding Remarks
This article reviewed the introduction of voluntary nutrition labeling formats in the last
decade and examined whether or not these can result in a larger market share for
healthier food, using the RTEC industry as a case study. The answer to our main
question is that VNL can lead to a healthier food market, at least when driven by
consumers’ desire for healthier foods coupled with the lower search costs that
simplified labeling affords. This private solution to a public health problem has
significant implications for the role of government as perhaps further mandatory
labeling may not result in the outcome desired. There is a clear goal in the government’s
devoting to sensitizing consumers about food health concerns (e.g., through nutrition
education, public information), and companies appear to take this into account in their
profit-maximizing behavior, as well as in their monitoring the thruthfulness of some of
the VNL claims to ensure that the informaton being transmitted is accurate.13
13 In this regard, the Food and Drug Administration established a Font-of-Package Labeling
Initiative in 2009, issuing warning letters to selected manufacturers whose claims were not
consistent with provisions of the Federal Food, Drug and Cosmetic Act that require s labels to be
truthful and not misleading.

19
The ground is fertile for further research to advance the frontier of knowledge in
this important area of public health, either using experimental data (including eye-
tracking and lab experiments) or big data (including scanner data and labeling-specific
data such as Mintel GNDP). Additional work using any of the avenues suggested in this
paper would provide further insights into the relationship of voluntary nutrition labeling
and market healthfulness while also addressing important public health questions that
await further theoretical and empirical analysis

20
Table 1. Median contents of key nutrients in top RTEC brands, 2001-2014
Year Observations NRF
(per 100 kcal)
Sugar
(g/ounce)
Sodium
(mg/ounce)
Fiber
(g/ounce)
Calories
(per ounce)
2001 101 -0.15 8.50 150.61 1.74 108
2002 82 -0.15 8.57 137.70 1.20 110
2003 112 -0.11 7.80 146.32 1.77 109
2004 153 -0.11 7.32 129.60 1.89 108
2005 143 -0.15 8.55 132.30 1.77 110
2006 183 -0.13 7.94 132.30 1.89 107
2007 152 -0.10 7.09 118.12 2.13 106
2008 136 -0.11 7.09 116.31 1.98 107
2009 128 -0.09 6.64 113.40 2.06 108
2010 166 -0.08 6.45 77.87 2.14 106
2011 159 -0.09 6.47 97.93 2.02 108
2012 164 -0.08 6.27 97.93 2.33 108
2013 224 -0.08 6.25 72.59 2.27 109
2014 246 -0.09 6.70 59.89 2.06 111
21
Table 2. Results of Granger Tests
No. of lags F-statistics p-value R-squared of the
regression
(A) H0: Awareness does not Granger-cause healthfulness improvement
1 26.96 0.0000 0.1514 2 11.61 0.0000 0.1542 3 5.71 0.0010 0.1495 4 3.28 0.0129 0.1605 5 1.50 0.1936 0.1894
(B) H0: Market healthfulness improvement does not Granger-cause awareness
1 0.39 0.5338 0.9482 2 0.36 0.7008 0.9590 3 0.67 0.5723 0.9627 4 1.24 0.2959 0.9643
5 0.92 0.4713 0.9642
22
Figure 1. Timeline of major voluntary nutritional labeling systems in RTEC market, 2004-2014
23
Figure 2. Demand and supply curves for healthy products
24
Figure 5. Distribution and median of NRF from 2001 to 2014
Figure 3. Distribution of Nutrition-Rich Foods (NRF) scores, 2001-2014
NRF

25
Figure 4. The number of media publications containing health related keywords, 2001-2014
26
References:
Arora, S. and S. Gangopadhyay. 1995. Toward a theoretical model of voluntary
overcompliance. Journal of Economic Behavior and Organization, 28: 289–309.
Balasubramanian, S. K. and C. Cole. 2002. Consumers’ search and use of nutrition
information: The challenge and promise of the Nutrition Labeling and Education
Act. Journal of Marketing, 66 (3): 112-127.
Berning, J. P., H. H. Chouinard and J. J. McCluskey. 2008. Consumer preferences for
detailed versus summary formats of nutrition information on grocery store shelf
labels. Journal of Agricultural & Food Industrial Organization, 6 (1): 1-22.
Blitstein, J. L. and W. D. Evans. 2006. Use of nutrition facts panels among adults who
make household food purchasing decisions. Journal of Nutrition Education and
Behavior, 38 (6): 360-64.
Bollinger, B., P. Leslie, and A. Sorensen. 2011. Calorie posting in chain restaurants.
American Economic Journal: Economic Policy, 3 (1): 91-128.
Boztug, Y., H.J. Juhl, O. Elshiewy, and M.B. Jensen. 2015. Consumer response to
monochrome guideline daily amount nutrition labels. Food Policy, 53(1): 1-8.
Branco, F., M. Sun, and J.M. Villas-Boas. 2012. Management Science, 58(11): 2037-
2056.
Bronnenberg, B.J., M.W. Kruger, and C.F. Mela. 2008. Marketing Science, 27(4): 745-
748.
27
Caswell, J. A. and E. M. Mojduszka. 1996. Using informational labeling to influence
the market for quality in food products. American Journal of Agricultural
Economics, 78 (5): 1248-53.
Cawley, J. and C. J. Ruhm. 2011. The economics of risky health behaviors. Handbook
of Health Economics, 2: 95-199.
Cha, A. E. and K. Thompson. 2014. Food labels to get first makeover in 20 years with
new emphasis on calories, sugar. Washington Post, February 27, 2014.
Esty, D. C. 1997. Clean and competitive: Business-led environmental management. In
Business-led Initiatives in Environmental Management: The Next Generation of
Policy. Special Report 92, Proceedings of Pre-conference Workshop to the
American Agricultural Economics Association Annual Meeting, Toronto.
Fulgoni, V. L., D. R. Keast, and A. Drewnowski. 2009. Development and validation of
the nutrient-rich foods index: A tool to measure nutritional quality of foods. The
Journal of Nutrition, 139 (8): 1549-54.
Graham, D.J., J.L. Orquin, and V.H.M. Visschers. 2012. Eye tracking and nutrition
label use: a review of the literature and recommendations for label enhancement.
Food Policy, 37(4 ):378-382.
Grossman, M. 1972. On the concept of health capital and the demand for health.
Journal of Political Economy. 80 (2): 461-483.
Grunert, K. G. and J. M. Wills. 2007. A review of European research on consumer
response to nutrition information on food labels. Journal of Public Health, 15 (5):
385-99.

28
Helfer, P. and T.R. Shultz. 2014. Effects of nutrition labeling on consumer food choices:
a psychological experiment and computational model. Annals of the New York
Academy of Science, December: 174-185.
Hersey, J.C., K.C. Wohlgenant, J.E. Arsenault, K.M. Kosa, and M.K. Muth. 2013.
Effects of front-of-package and shelf nutrition labeling systems on consumers.
Nutrition Reviews, 71(1): 1-14.
Ippolito, P. M. and A. Mathios. 1990. Information, advertising and health choices: a
Study of the cereal market. RAND Journal of Economics, 21 (3): 459-80.
Jochem, E. and W. Eichhammer. 1999. Voluntary agreements as an instrument to
substitute regulations and economic instruments: lessons from the German
voluntary agreements on CO2 reduction. In C. Carraro and F. Lévêque, eds.,
Voluntary Approaches in Environmental Policy. Dordrecht: Kluwer Academic
Publishers, 209–227.
Khanna, M. and L. Damon. 1999. EPA’s voluntary 33/50 Program: Impact on toxic
releases and economic performance of firms. Journal of Environmental Economics
and Management, 37 (1): 1–25.
Kiesel, K., J. McCluskey and S. B. Villas-Boas. 2011. Nutritional labeling and
consumer choices. Annual Review of Resource Economics, 3 (1): 141-58.
Kiesel, K. and S.B. Villas-Boas. 2013. Can information costs affect consumer choice?
Nutritional labels in a supermarket experiment. International Journal of Industrial
Organization, 31 (2): 153–63.
29
LaValle, I. H. 1968. On cash equivalents and information evaluation in decisions under
uncertainty: Parts I, II, and III. Journal of the American Statistical Association, 63
(321): 252-76.
Levy, A. S. and S. B. Fein. 1998. Consumers’ ability to perform tasks using nutrition
labels. Journal of Nutrition Education, 30 (4): 210-217.
Liaukonyte, J., N. A. Streletskaya and H. M. Kaiser. 2015. Noisy information signals
and endogenous preferences for labeled attributes. Journal of Agricultural and
Resource Economics, 40 (2): 179-202.
Manzini, P. and M. Mariotti. 2014. Stochastic choice and consideration sets.
Econometrica, 82 (3): 1153-76.
Matejka, F. and A. McKay. 2015. Rational inattention to discrete choices: A new
foundation for the multinomial logit model. American Economic Review, 105
(1): 272-98.
Merrick, A. and E. Lambert. 2013. The secrets of shopping: what economists and
marketers are learning from newly accessible data. Capital Ideas, fall issue, Booth
Business School.
Mocan, N. and D. T. Altindag. 2014. Education, cognition, health knowledge, and
health behavior. The European Journal of Health Economics, 15 (3): 265-79.
Moorman, C., R. Ferraro, and J. Huber. 2012. Unintended nutrition consequences: Firm
responses to the Nutrition Labeling Act. Marketing Science, 31 (5): 717-37.
Nelson, P. 1974. Advertising as information. Journal of political economy, 82 (4): 729-
54.
30
Norton, M. I., D. D. Rucker, and C. Lamberton. 2015. The Cambridge Handbook of
Consumer Psychology. Cambridge University Press.
Nyborg, K. 2000. Voluntary agreements and non-verifiable emissions. Environmental
and Resource Economics, 17 (2): 125–44.
Pennings, M.C., T. Striano and S. Oliveiro. 2014. A picture tells a thousand words:
impact of an additional nutrition booklet on nutrition label gazing. Marketing
Letters, 25 (4): 355-360.
Pereira, R. 2010. Understanding the maze of nutrition symbols and nutrition labeling
systems. Diabetes Spectrum, 23 (1): 57-63.
Roe, B. and I. Sheldon. 2007. Credence good labeling: the efficiency and distributional
implications of several policy approaches. American Journal of Agricultural
Economics, 89(4): 1020-1033.
Rothman, A. J., R. D. Bartels, J. Wlaschin, and P. Salovey. 2006. The strategic use of
gain- and loss-framed messages to promote healthy behavior: How theory can
inform practice. Journal of Communication, 56 (s1): S202-20.
Salop, S. C. and D. T. Scheffman. 1983. Raising rivals’ costs. The American Economic
Review, 73 (2): 267-71.
Salop, S. and J. Stiglitz. 1977. Bargains and ripoffs: a model of monopolistically
competitive price dispersion, The Review of Economic Studies, 44 (3): 493-510.
Silberberg, E. and W. Suen. 2000. The structure of economics: a mathematical analysis.
3rd ed., McGraw-Hill/Irwin.
31
Smart, B. 1992. Beyond Compliance: A New Industry View of the Environment.
Washington, D.C.: World Resource Institute.
Strom, S. 2014. Cereals begin to lose their snap, crackle and pop, The New York Times,
Sept. 10, 2014.
Todd, J. E. and J. N. Variyam. 2008. The decline in consumer use of food nutrition
labels, 1995-2006. U.S. Department of Agriculture, Economic Research Service,
Technical Report No. 63, August.
U.S. Department of Health Human Services and U.S. Department of Agriculture. 2010.
Dietary Guidelines for Americans. Washington, D.C., 2010.
Visschers, V. H., R. Hess, and M. Siegrist. 2010. Health motivation and product design
determine consumers’ visual attention to nutrition information on food products.
Public Health Nutrition, 13 (7): 1099-106.
Wang, E., C. Rojas, and C. Bauner. 2015. Evolution of nutritional quality in the U.S.:
Evidence from the ready-to-eat cereal industry. Economics Letters, 133: 105-8.
Wansink, B., S. T. Sonka, and C. M. Hasler. 2004. Front-label health claims: When less
is more. Food Policy, 29 (6): 659-67.
Williams, P. 2005. Consumer understanding and use of health claims for foods.
Nutrition Reviews, 63 (7): 256-64.
Zhen, C. and X. Zheng. 2015. The effects of expert opinion on consumer demand for
goods with credence attributes: Evidence from a natural experiment. Working
Paper, Department of Agricultural Economics, North Carolina State University.

32
Zhu, C., R. A. Lopez and X. Liu. 2016. Information cost and consumer choices of
healthy foods. American Journal of Agricultural Economics, forthcoming.