Embed Size (px)
Citation preview

Can the Sustainable Development Goals stem rising income inequality in the world?
Professor Rolph van der Hoeven
Valedictory Lecture in abridged form delivered on 8 October 2015
on the occasion of the 63rd Dies Natalis of the International
Institute of Social Studies of Erasmus University Rotterdam
2 Can the Sustainable Development Goals stem rising income inequality in the world?
Colophon
OBT, The Hague
Design
Ontwerpwerk, The Hague
Photo cover
John Steenwinkel
ISBN/EAN
978-90-6490-053-2
© Rolph van der Hoeven, 2015
Material contained in this publication may be freely quoted
and reproduced for individual use or for research, scholarly or
educational purposes. It may not be used in any way for profi t.
For reproduction in compiled volumes, readers or inclusion in
any information storage or retrieval system, the permission of
the author is required. Requests should be sent to [email protected].
In any subsequent use of this work, the author should be given
appropriate acknowledgement.
3Valedictory Lecture 8 October 2015 Professor Rolph van der Hoeven
Contents
Income Inequality, past and present 5
Drivers of Income Inequality 13
Income Inequality and Globalization 18
Globalization and factor income inequality 22
Increasing share of top 1% income groups in developing countries 27
Millennium Development Goals and Sustainable Development Goals 29
Inequality and Sustainable Development Goals 34
Words of thanks 41
References 43
Annex 1 Millennium Development Goals (MDGs) 48
Annex 2 Sustainable Development Goals (SDGs) 48

4 Can the Sustainable Development Goals stem rising income inequality in the world?
5Valedictory Lecture 8 October 2015 Professor Rolph van der Hoeven
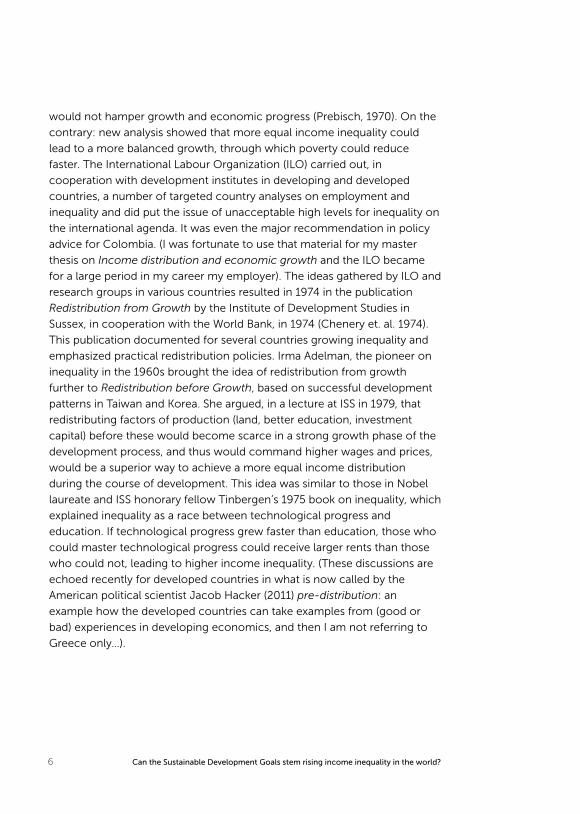
Income Inequality, past and present
Three days after the fall of the American banking giant Lehmann Brothers,
and amidst the crisis or great recession of 2008, I gave my inaugural
address at ISS. I concluded then: The current crisis and the increased public
concern for improved income equality might provide the basis for a
renewed political coalition to make employment creation and fair income
distribution again major objectives for economic policy-making. But it is far
from clear whether in most countries such a coalition would have suffi cient
infl uence to drastically changing economic policy. (van der Hoeven, 2010).
I had sincerely hoped that the tide of growing income inequality would be
turning, but sadly enough this is not the case in most countries, neither in
the world nor among all citizens in the world, as I later will explain in more
detail.
My concern for income inequality was not triggered by the crisis of 2008;
actually it started much earlier in my academic live: end 1960s early 1970s,
when I was studying econometrics in Amsterdam and where I was inspired
by writings, and listening to, Jan Tinbergen and Jan Pen, who wrote and
spoke with much conviction on inequality in the world and in the
Netherlands. The beginning of the 1970s saw an increasing interest in
income inequality, also for developing countries. This was not so obvious
actually. Take for example the proposal for the fi rst Development Decade of
the United Nations (1960-1970) that stated: It is true that the General
Assembly resolution lays down a precise quantitative target only for the
increase in aggregate incomes, and that there is no similar quantitative
target for changes in income distribution. We can, however, take it for
granted that the 5 per cent growth target established by the resolution also
implies that the increment in income thus achieved should be wisely used
for the benefi t of the poorer sections of the population and should result in
a degree of social progress which is at least in “balance” with the rise in
aggregate national income (Meier, 1971, p.54). This sounds familiar even
these days isn’t?
In the early 1970s however, more and more scholars and activists started to
voice concern about growing inequality and enduring poverty, especially
from Latin American countries where progress coincided with enduringly
high or growing income inequality. The Prebisch report in 1970 advocated
for example reduction of inequality and argued that reducing inequality
6 Can the Sustainable Development Goals stem rising income inequality in the world?
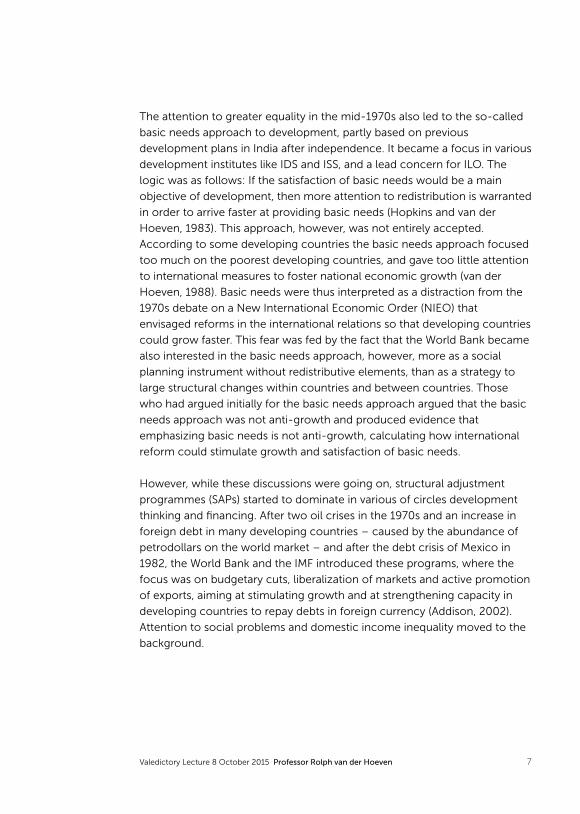
would not hamper growth and economic progress (Prebisch, 1970). On the
contrary: new analysis showed that more equal income inequality could
lead to a more balanced growth, through which poverty could reduce
faster. The International Labour Organization (ILO) carried out, in
cooperation with development institutes in developing and developed
countries, a number of targeted country analyses on employment and
inequality and did put the issue of unacceptable high levels for inequality on
the international agenda. It was even the major recommendation in policy
advice for Colombia. (I was fortunate to use that material for my master
thesis on Income distribution and economic growth and the ILO became
for a large period in my career my employer). The ideas gathered by ILO and
research groups in various countries resulted in 1974 in the publication
Redistribution from Growth by the Institute of Development Studies in
Sussex, in cooperation with the World Bank, in 1974 (Chenery et. al. 1974).
This publication documented for several countries growing inequality and
emphasized practical redistribution policies. Irma Adelman, the pioneer on
inequality in the 1960s brought the idea of redistribution from growth
further to Redistribution before Growth, based on successful development
patterns in Taiwan and Korea. She argued, in a lecture at ISS in 1979, that
redistributing factors of production (land, better education, investment
capital) before these would become scarce in a strong growth phase of the
development process, and thus would command higher wages and prices,
would be a superior way to achieve a more equal income distribution
during the course of development. This idea was similar to those in Nobel
laureate and ISS honorary fellow Tinbergen’s 1975 book on inequality, which
explained inequality as a race between technological progress and
education. If technological progress grew faster than education, those who
could master technological progress could receive larger rents than those
who could not, leading to higher income inequality. (These discussions are
echoed recently for developed countries in what is now called by the
American political scientist Jacob Hacker (2011) pre-distribution: an
example how the developed countries can take examples from (good or
bad) experiences in developing economics, and then I am not referring to
Greece only…).
7Valedictory Lecture 8 October 2015 Professor Rolph van der Hoeven
The attention to greater equality in the mid-1970s also led to the so-called
basic needs approach to development, partly based on previous
development plans in India after independence. It became a focus in various
development institutes like IDS and ISS, and a lead concern for ILO. The
logic was as follows: If the satisfaction of basic needs would be a main
objective of development, then more attention to redistribution is warranted
in order to arrive faster at providing basic needs (Hopkins and van der
Hoeven, 1983). This approach, however, was not entirely accepted.
According to some developing countries the basic needs approach focused
too much on the poorest developing countries, and gave too little attention
to international measures to foster national economic growth (van der
Hoeven, 1988). Basic needs were thus interpreted as a distraction from the
1970s debate on a New International Economic Order (NIEO) that
envisaged reforms in the international relations so that developing countries
could grow faster. This fear was fed by the fact that the World Bank became
also interested in the basic needs approach, however, more as a social
planning instrument without redistributive elements, than as a strategy to
large structural changes within countries and between countries. Those
who had argued initially for the basic needs approach argued that the basic
needs approach was not anti-growth and produced evidence that
emphasizing basic needs is not anti-growth, calculating how international
reform could stimulate growth and satisfaction of basic needs.
However, while these discussions were going on, structural adjustment
programmes (SAPs) started to dominate in various of circles development
thinking and fi nancing. After two oil crises in the 1970s and an increase in
foreign debt in many developing countries – caused by the abundance of
petrodollars on the world market – and after the debt crisis of Mexico in
1982, the World Bank and the IMF introduced these programs, where the
focus was on budgetary cuts, liberalization of markets and active promotion
of exports, aiming at stimulating growth and at strengthening capacity in
developing countries to repay debts in foreign currency (Addison, 2002).
Attention to social problems and domestic income inequality moved to the
background.
8 Can the Sustainable Development Goals stem rising income inequality in the world?
Middle and late 1980s saw a countermovement. Critics saw the SAPs,
because of their liberal economic policy, as a major cause for increasing
inequality and other social problems, especially in those countries that were
obliged to take part in the program. Critics were led by national politicians,
NGOs, scientists from the South and the North and by organizations in the
UN system itself. These were not only organizations with a more social
mandate, such as UNICEF, ILO and UNRISD, but also regional economic
organizations such as, ECA and ECLAC, as well as the trade and
development organisation UNCTAD. The criticism of the structural
adjustment programmes rose, not only from the social angle, but also more
and more from the economic angle, because the programs often did not
lead to accelerated growth and reduction in debt. (A special program for
debt forgiveness in poorer countries − HIPC – had to therefore also to be
set up in the 1990s). It would take until the middle of the 1990s until more
social objectives of development cooperation gained traction again.
Early 1990, the UNDP launched its annual Human Development Report,
based on the ideas of Nobel Prize laureate and ISS honorary fellow Amartya
Sen, asking for more attention to human development and also acting as a
counterpart for the already existing World Development Report of the
World Bank. The UN itself has organized a number of world summits on
development issues. After the Berlin Wall fell, cold war issues no longer
dominated the discussions in the UN. One of those was the Social Summit
in Copenhagen in 1995 (World Summit for Social Development), which
dealt with the problems of, and gave policy recommendations for poverty
reduction, employment and social inclusion. The Social Summit contained
explicit recommendations for the reduction of political, legal, economic
and social factors that promote or maintain inequality in income.
The results of the renewed attention to social issues led to preparations for
the UN Millennium Summit in 2000 and to the subsequent formulation of
the Millennium Development Goals, in which a 50 per cent reduction of
poverty and improving several social targets at the global level were among
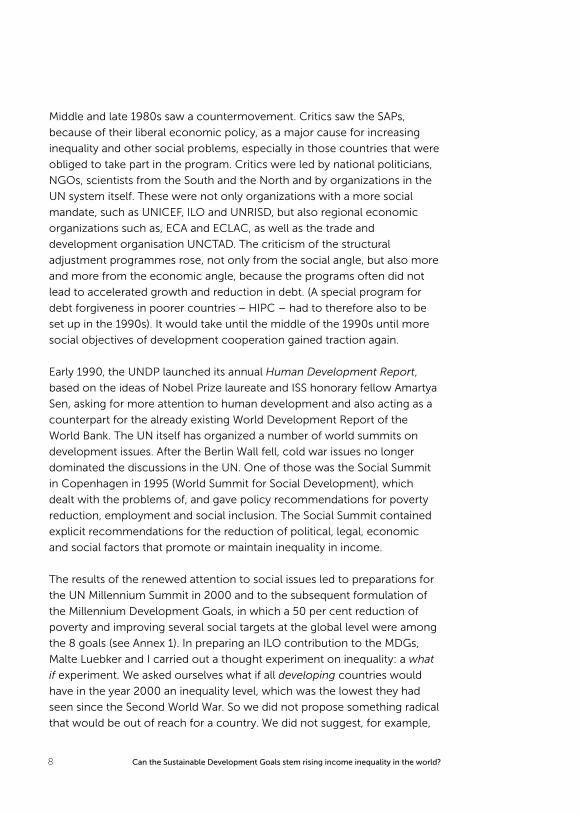
the 8 goals (see Annex 1). In preparing an ILO contribution to the MDGs,
Malte Luebker and I carried out a thought experiment on inequality: a what
if experiment. We asked ourselves what if all developing countries would
have in the year 2000 an inequality level, which was the lowest they had
seen since the Second World War. So we did not propose something radical
that would be out of reach for a country. We did not suggest, for example,

9Valedictory Lecture 8 October 2015 Professor Rolph van der Hoeven
Populations in poverty
1275
900800
1370
400500600700800900
10001100120013001400
Actual Best distribution Best distributionand positive
growth aspect
Worst distribution
M1758 - STAVEREN Text.indd 255 20/2/09 08:28:04
Figure 1: Population in Poverty in the year 2000 according to actual and hypothetical
best income distribution scenarios
Source: Compiled from Luebker 2002
that a highly unequal country Brazil should become as equal as Sweden etc.
The outcome of this thought experiment was that the number of poor
people in 2000 could have been one third less if countries would have a
level of inequality equal to that what they would have had in the past. In a
second thought experiment we added another fact, namely that a country
with moderate inequality would grow faster than a country with greater
inequality. Under this scenario the number of poor would have been
reduced by almost 40 per cent (Figure 1).
At the end of the 1990’s The Economic Research Institute of the United
Nations (UNU-WIDER) started under its new director Andrea Cornia and
deputy Tony Addison a large research program on inequality, growth,
poverty and globalization. Globalization is characterized by greater
integration in terms of trade and capital fl ows, made possible by new
technologies but more so by international conventions and agreements that
liberalised the rules governing external markets, as explained a.o. in the
report of the World Commission on the Social Dimensions of Globalization
of which Deepak Nayyar was a member, and for which I led the research
secretariat.
10 Can the Sustainable Development Goals stem rising income inequality in the world?
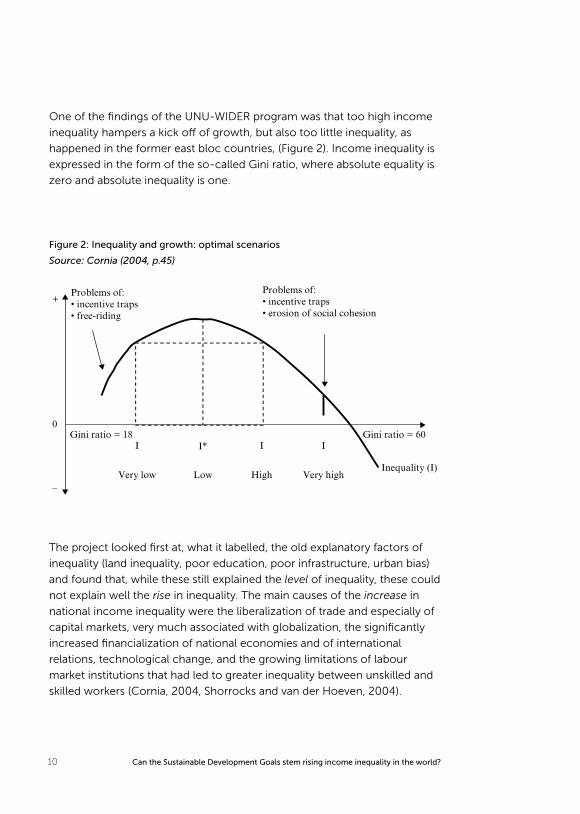
One of the fi ndings of the UNU-WIDER program was that too high income
inequality hampers a kick off of growth, but also too little inequality, as
happened in the former east bloc countries, (Figure 2). Income inequality is
expressed in the form of the so-called Gini ratio, where absolute equality is
zero and absolute inequality is one.
Figure 2: Inequality and growth: optimal scenarios
Source: Cornia (2004, p.45)
Problems of:• incentive traps• free-riding
+
–
0
Problems of:• incentive traps• erosion of social cohesion
I I II*Gini ratio = 18
Very low Low High Very highInequality (I)
Gini ratio = 60
M1758 - STAVEREN Text.indd 254 20/2/09 08:28:04
The project looked fi rst at, what it labelled, the old explanatory factors of
inequality (land inequality, poor education, poor infrastructure, urban bias)
and found that, while these still explained the level of inequality, these could
not explain well the rise in inequality. The main causes of the increase in
national income inequality were the liberalization of trade and especially of
capital markets, very much associated with globalization, the signifi cantly
increased fi nancialization of national economies and of international
relations, technological change, and the growing limitations of labour
market institutions that had led to greater inequality between unskilled and
skilled workers (Cornia, 2004, Shorrocks and van der Hoeven, 2004).
11Valedictory Lecture 8 October 2015 Professor Rolph van der Hoeven
Despite these and various other analyses, the MDGs did not include
reducing national income disparity in the targets for poverty reduction, and,
for that matter, did not include reducing national inequality in other targets,
such as those for education and health, as Jan Vandemoortele, who was
involved in formulating the MDGs, has been arguing since the formulation
of the MDGs. I will come back to this in the second part of my lecture.
In the early years of this century some major developing countries, now
more appropriately called, 'emerging countries' showed strong growth in
national income. These countries are catching up as Deepak Nayyar has
phrased it so well in his latest book (Nayyar, 2013b). Also some poorer
countries showed faster growth for the fi rst time. However, income
inequality rose in many countries, developing countries, emerging countries
and developed countries alike. A number of countries in Latin America
showed some decrease in income inequality, but this was not enough to
get them out of the leading group of countries with the greatest income
inequality in the world.
Halfway through the fi rst decade of the new millennium a large number of
reports from, among others, the UN, the World Bank, UNDP and ILO,
appeared which all called for a reduction of rising or high income inequality,
based on extensive research and data collections in this fi eld. The validity of
the Kuznets curve (which argued that during a process of development
income inequality would rise and thereafter would decline, hence there
would be no need for special attention) was rejected and valid arguments
were put forward that a more equal distribution of income and assets did
not have to lead to a decrease in economic growth.
After the fi nancial crisis even the more traditional fi nancial and economic
circles sounded the alarm bell, fearing that large and rising income
inequalities could aff ect the foundations of the free-market system. The
number of items in the Financial Times about income inequality increased
signifi cantly. Piketty’s book on Capital in the Twenty First Century (Piketty,
2014) was well received and also on the ski slopes of Davos, where the
annual World Economic Forum takes place, growing or large income
inequality is the last two years one of the most important agenda items.
12 Can the Sustainable Development Goals stem rising income inequality in the world?
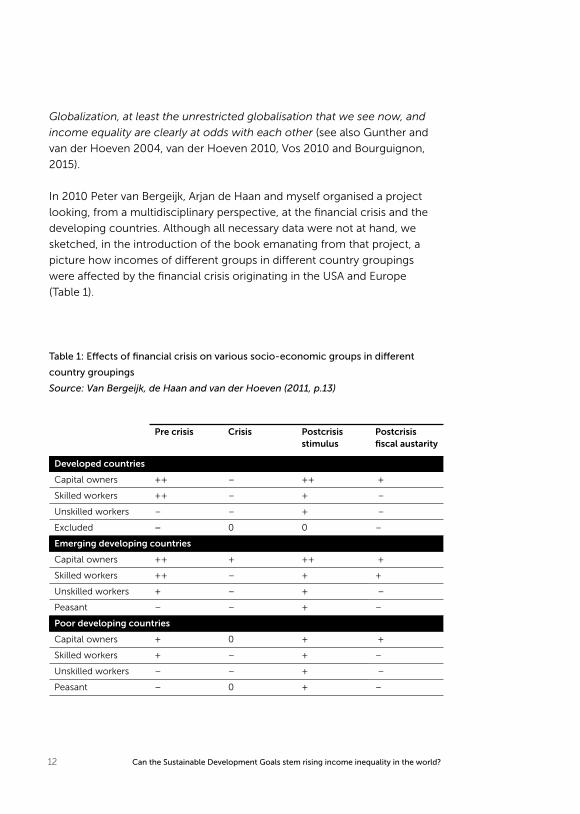
Table 1: Eff ects of fi nancial crisis on various socio-economic groups in diff erent
country groupings
Source: Van Bergeijk, de Haan and van der Hoeven (2011, p.13)
Pre crisis Crisis Postcrisis
stimulus
Postcrisis
fi scal austarity
Developed countries
Capital owners ++ – ++ +
Skilled workers ++ – + –
Unskilled workers – – + –
Excluded – 0 0 –
Emerging developing countries
Capital owners ++ + ++ +
Skilled workers ++ – + +
Unskilled workers + – + –
Peasant – – + –
Poor developing countries
Capital owners + 0 + +
Skilled workers + – + –
Unskilled workers – – + –
Peasant – 0 + –
Globalization, at least the unrestricted globalisation that we see now, and
income equality are clearly at odds with each other (see also Gunther and
van der Hoeven 2004, van der Hoeven 2010, Vos 2010 and Bourguignon,
2015).
In 2010 Peter van Bergeijk, Arjan de Haan and myself organised a project
looking, from a multidisciplinary perspective, at the fi nancial crisis and the
developing countries. Although all necessary data were not at hand, we
sketched, in the introduction of the book emanating from that project, a
picture how incomes of diff erent groups in diff erent country groupings
were aff ected by the fi nancial crisis originating in the USA and Europe
(Table 1).
13Valedictory Lecture 8 October 2015 Professor Rolph van der Hoeven
In eff ect, the poorer segments in the developed countries face a triple
whammy: they did not profi t from globalization, they were hardest hit in
terms of unemployment and are now bearing the consequences of fi scal
tightening following the massive stimulus and bank bail-outs. The situation
for developing countries though is more complex. The growth path of the
emerging developing economies shows similar movements as that of
developed countries, but of less intensity and these economies were thus
less aff ected by the crisis. However, except for some Latin American
countries, the growing inequality which was building up or being reinforced,
is not yet being halted, and wage shares in most emerging market
economies are still declining, with a negative eff ect on domestic demand.
The poorer developing countries, mainly in Africa, were less aff ected as
their banking system was less developed, but still suff ered from slower
exports proceeds, remittances and lower aid levels.
Drivers of Income Inequality
What are the drivers of inequality? In order to answer that question we must
fi rst defi ne income inequality more precisely. But fi rst another issue: I have
been talking until now about income inequality within countries. One may
say: should we not have a more cosmopolitan approach, especially given
the strong growth of several emerging economies, and rather look at
inequality in the world? Several authors have done so in detail, e.g.
Milanovic (2012) and van Bergeijk (2013). UNDP (2013) in a recent report has
demonstrated what this entails (Figure 3).
14 Can the Sustainable Development Goals stem rising income inequality in the world?
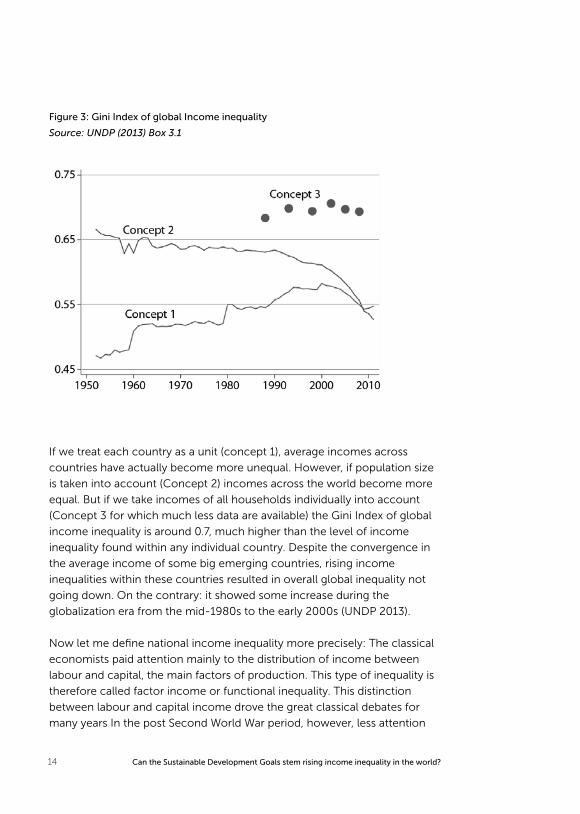
Figure 3: Gini Index of global Income inequality
Source: UNDP (2013) Box 3.1
If we treat each country as a unit (concept 1), average incomes across
countries have actually become more unequal. However, if population size
is taken into account (Concept 2) incomes across the world become more
equal. But if we take incomes of all households individually into account
(Concept 3 for which much less data are available) the Gini Index of global
income inequality is around 0.7, much higher than the level of income
inequality found within any individual country. Despite the convergence in
the average income of some big emerging countries, rising income
inequalities within these countries resulted in overall global inequality not
going down. On the contrary: it showed some increase during the
globalization era from the mid-1980s to the early 2000s (UNDP 2013).
Now let me defi ne national income inequality more precisely: The classical
economists paid attention mainly to the distribution of income between
labour and capital, the main factors of production. This type of inequality is
therefore called factor income or functional inequality. This distinction
between labour and capital income drove the great classical debates for
many years In the post Second World War period, however, less attention
15Valedictory Lecture 8 October 2015 Professor Rolph van der Hoeven
was given to this type of inequality, as neoclassical production functions
often assumed a constant capital share under the assumption that wage
increases follow productivity increases. Attention shifted to personal
income or household income distribution.
One can interpret household income distribution in three ways (van der
Hoeven, 2010):
• Primary income distribution: the distribution of household incomes
consisting of the (sometimes cumulated) diff erent factor incomes in
each household, before taxes and subsidies as determined by markets
and market institutions.
• Secondary income distribution: the distribution of household incomes
after deduction of taxes and inclusion of transfer payments (i.e. as
determined by fi scal policies).
• Tertiary income distribution: the distribution of household incomes when
imputed benefi ts from public expenditure are added to household
income after taxes and subsidies. This interpretation of household
income is particularly relevant for developing countries as diff erent
services and government services are often provided for free or below
market prices.
Most policy discussions on inequality though focus on secondary
household income distribution (take home pay, rents, interest earnings and
profi ts after taxes).
More recently attention is shifting back to factor income distribution.1
Daudey and Garcia Penalosa (2007) argue that the distribution of personal
or household income depends on three factors: the distribution of labour
endowments, the distribution of capital endowments, and the way in which
aggregate output is shared between the two production factors.
1 The IMF (Jaumotte, and Tytell 2007) investigated the eff ect of globalization on the labour income share in developed countries as did the OECD ( Bessani and Manfredi, 2012) while UNDP (Rodriguez and Jayadev, 2010) and ILO (2011) and (2012) carried out several analyses on a broader set of data encompassing all countries in the world.
16 Can the Sustainable Development Goals stem rising income inequality in the world?
The factor distribution of income is a statistically signifi cant determinant of
the personal distribution of income2: a larger labour share is statistically
associated with a lower Gini index of personal incomes. It is therefore
important to also (re-) consider the factor distribution of income.
The focus on factor income inequality points to the importance of better
understanding the changing position of labour in the production process in
order to correctly interpret inequality trends, as labour has been losing
ground relative to capital over the past 20 years (ILO 2011). Furthermore,
experience has shown that it is not possible to reduce primary household
income inequality without addressing how incomes are generated in the
production process and how this aff ects factor income inequality (van der
Hoeven 2011). The great British scholar Tony Atkinson (2009) argues
convincingly that there are at least three reasons to pay again greater
attention to factor income distribution:
• To make a link between incomes at the macroeconomic level (national
accounts) and incomes at the level of the household;
• To help understand inequality in the personal distribution of income;
• To address the social justice concerns with the fairness of diff erent
returns to diff erent sources of income.
Also the too early deceased Andrew Glyn (2009) argued that factor income
distribution matters to people for at least two reasons. Firstly, despite
broader access to capital among households, wealth, and especially
high-yielding wealth, is still extremely unevenly distributed as Thomas
Piketty (2014) has reminded us so eloquently last year. Therefore
redistribution from labour to property still has a signifi cant eff ect in raising
household income inequality. Secondly, the fact that profi ts may be rising
much faster than wages, confl icts with widely held views of social justice
and fairness.
2 Other variables used are manufacturing share, GDP per capita, openness, civil liberties and, human capital.

17Valedictory Lecture 8 October 2015 Professor Rolph van der Hoeven
More recently Trapp (2015) has argued that dynamics in the factor income
distribution are of particular relevance for developing countries, especially
in their eff ort to fi ght poverty. Regressive redistribution of factors and their
remuneration will be felt strongly in these countries, due to weak social
safety nets and limited access to capital by the poor. The main asset of the
poor certainly is labour. As such, the labour income share can serve as an
indicator in designing policies for social protection and tax systems as these
usually target the factor income distribution (minimum wage policies, tax
concessions for investments, etc.).
It is therefore important to be more explicit about the drivers of factor
income distribution, as well as the drivers of primary, secondary and tertiary
household income distribution and the relation between these. There are
many drivers that aff ect the diff erent types of income distribution. One can
distinguish between drivers that are largely exogenous (outside the purview
of domestic policy) and endogenous drivers (i.e. drivers that are mainly
determined by domestic policy). However, a clear line is diffi cult to draw,
because even drivers that at fi rst sight may appear to be exogenous or
autonomous are often the outcome of policy decisions in the past or the
outcome of a domestic political decision to create international institutions
(for example the creation of WTO to establish trade liberalization or the
decision to invest in technical progress). With increased globalization,
exogenous drivers gain in importance. As a consequence more is expected
from national policy drivers to counteract the eff ect of the more exogenous
drivers. Table 2 shows the interactions between the various exogenous and
endogenous drivers and the various types of income distribution.

18 Can the Sustainable Development Goals stem rising income inequality in the world?
Table 2: Interaction between main drivers and various types of income distribution
Source: UNDP (2013) Table 3.8
Distribution type
Factor
income
distribution
Wage
distribution
Primary
household
income
distribution
Secondary
household
income
distribution
Tertiary
household
income
distribution
Drivers
Exogenous Drivers
1. Trade globalisation X X X
2. Financial globalisation X X X
3. Technical change X X X
Endogenous Drivers
4. Macroeconomic policies X X X
5. Labourmarket policies X X X X
6. Wealth inequality X X X
7. Fiscal policies: Taxation and Transfers
X X X X
8. Govt Expenditure X
The crosses in the table indicate were the eff ects of these various drivers is
the strongest. We see that exogenous factors (globalisation) aff ect mainly
factor income and primary household income distribution (upper left
quadrant of Table 2), while endogenous drivers aff ect both factor income
and various types of household income distribution (lower left and right
hand quadrants).
Income Inequality and Globalization
Many aspects of globalization can be seen as drivers of income inequality,
especially the factor and primary household income inequality (van der
Hoeven 2009). Traditionally, most attention has been given to the eff ects of
trade and trade openness on income inequality, but more recently
fi nancialization and technical change (particularly in relation to its eff ect on
wage diff erentials) have also been the focus of much attention. The impact
19Valedictory Lecture 8 October 2015 Professor Rolph van der Hoeven
of these globalization drivers on income inequality depends however also
on national macroeconomic and labour market policies, which can either
counteract or intensify their eff ects.
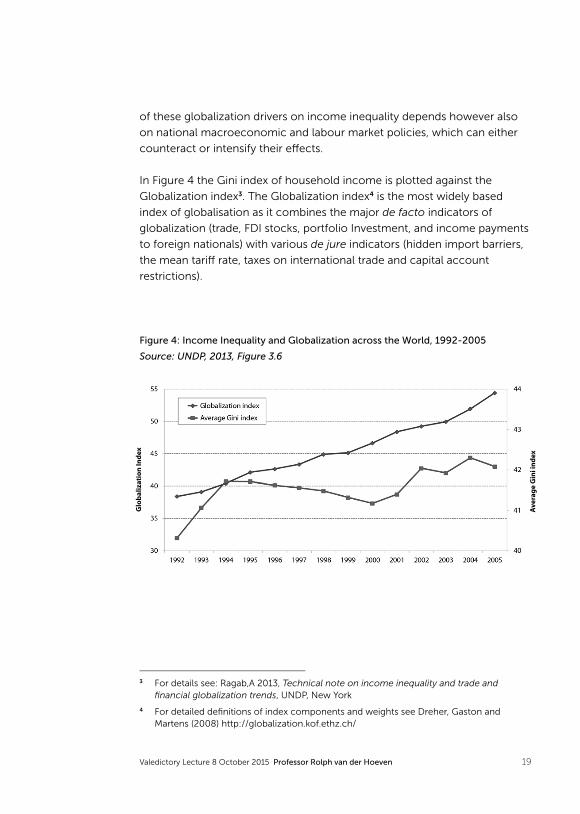
In Figure 4 the Gini index of household income is plotted against the
Globalization index3. The Globalization index4 is the most widely based
index of globalisation as it combines the major de facto indicators of
globalization (trade, FDI stocks, portfolio Investment, and income payments
to foreign nationals) with various de jure indicators (hidden import barriers,
the mean tariff rate, taxes on international trade and capital account
restrictions).
3 For details see: Ragab,A 2013, Technical note on income inequality and trade and fi nancial globalization trends, UNDP, New York
4 For detailed defi nitions of index components and weights see Dreher, Gaston and Martens (2008) http://globalization.kof.ethz.ch/
Figure 4: Income Inequality and Globalization across the World, 1992-2005
Source: UNDP, 2013, Figure 3.6
Glo
baliz
atio
n In
dex
Ave
rage
Gin
i ind
ex
20 Can the Sustainable Development Goals stem rising income inequality in the world?
In a sample of 102 countries (30 high income countries, 72 lower and
middle income countries), the rise in the Gini index coincided with an
increase in globalization. For countries in this sample the average level of
inequality increased by 4% during the period, while the index of
globalization increased by 42%. The correlation between the two measures
is above 70 percent.5
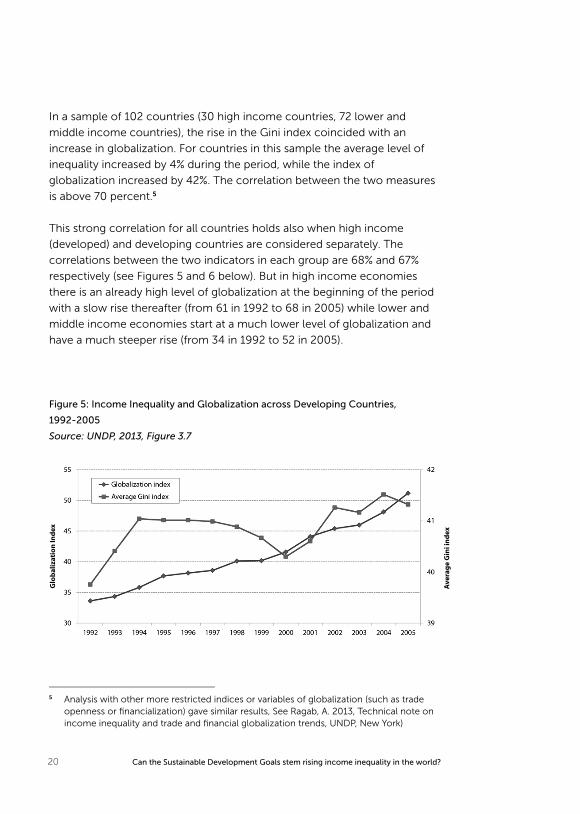
This strong correlation for all countries holds also when high income
(developed) and developing countries are considered separately. The
correlations between the two indicators in each group are 68% and 67%
respectively (see Figures 5 and 6 below). But in high income economies
there is an already high level of globalization at the beginning of the period
with a slow rise thereafter (from 61 in 1992 to 68 in 2005) while lower and
middle income economies start at a much lower level of globalization and
have a much steeper rise (from 34 in 1992 to 52 in 2005).
5 Analysis with other more restricted indices or variables of globalization (such as trade openness or fi nancialization) gave similar results, See Ragab, A. 2013, Technical note on income inequality and trade and fi nancial globalization trends, UNDP, New York)
Figure 5: Income Inequality and Globalization across Developing Countries,
1992-2005
Source: UNDP, 2013, Figure 3.7
Glo
baliz
atio
n In
dex
Ave
rage
Gin
i ind
ex
21Valedictory Lecture 8 October 2015 Professor Rolph van der Hoeven
Glo
baliz
atio
n In
dex
Ave
rage
Gin
i ind
ex
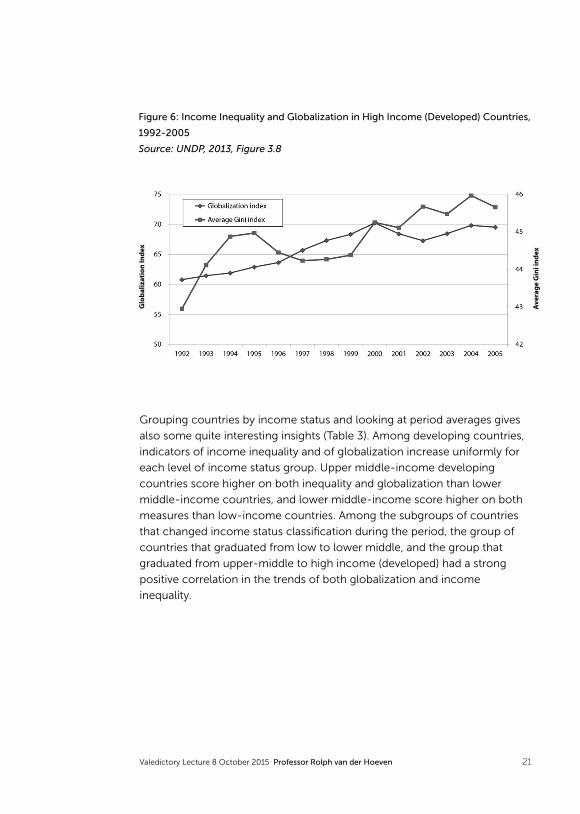
Figure 6: Income Inequality and Globalization in High Income (Developed) Countries,
1992-2005
Source: UNDP, 2013, Figure 3.8
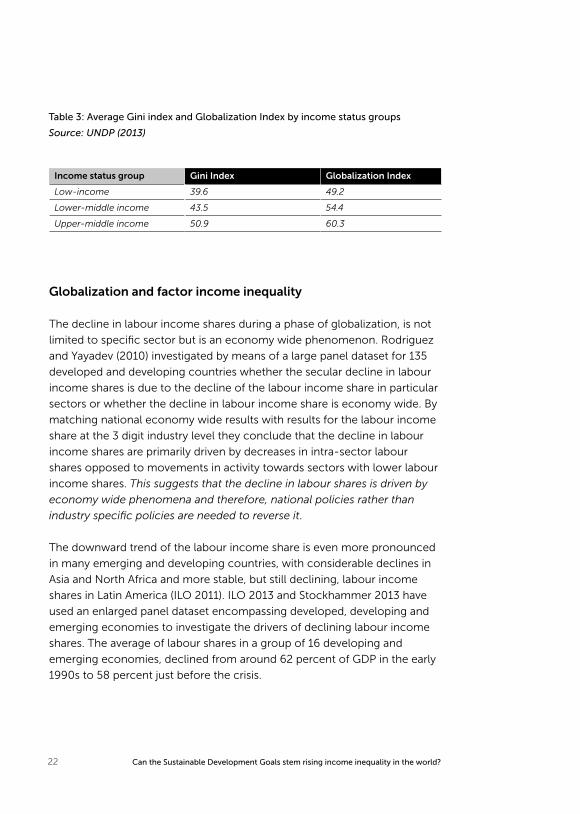
Grouping countries by income status and looking at period averages gives
also some quite interesting insights (Table 3). Among developing countries,
indicators of income inequality and of globalization increase uniformly for
each level of income status group. Upper middle-income developing
countries score higher on both inequality and globalization than lower
middle-income countries, and lower middle-income score higher on both
measures than low-income countries. Among the subgroups of countries
that changed income status classifi cation during the period, the group of
countries that graduated from low to lower middle, and the group that
graduated from upper-middle to high income (developed) had a strong
positive correlation in the trends of both globalization and income
inequality.
22 Can the Sustainable Development Goals stem rising income inequality in the world?
Table 3: Average Gini index and Globalization Index by income status groups
Source: UNDP (2013)
Income status group Gini Index Globalization Index
Low-income 39.6 49.2
Lower-middle income 43.5 54.4
Upper-middle income 50.9 60.3
Globalization and factor income inequality
The decline in labour income shares during a phase of globalization, is not
limited to specifi c sector but is an economy wide phenomenon. Rodriguez
and Yayadev (2010) investigated by means of a large panel dataset for 135
developed and developing countries whether the secular decline in labour
income shares is due to the decline of the labour income share in particular
sectors or whether the decline in labour income share is economy wide. By
matching national economy wide results with results for the labour income
share at the 3 digit industry level they conclude that the decline in labour
income shares are primarily driven by decreases in intra-sector labour
shares opposed to movements in activity towards sectors with lower labour
income shares. This suggests that the decline in labour shares is driven by
economy wide phenomena and therefore, national policies rather than
industry specifi c policies are needed to reverse it.
The downward trend of the labour income share is even more pronounced
in many emerging and developing countries, with considerable declines in
Asia and North Africa and more stable, but still declining, labour income
shares in Latin America (ILO 2011). ILO 2013 and Stockhammer 2013 have
used an enlarged panel dataset encompassing developed, developing and
emerging economies to investigate the drivers of declining labour income
shares. The average of labour shares in a group of 16 developing and
emerging economies, declined from around 62 percent of GDP in the early
1990s to 58 percent just before the crisis.
23Valedictory Lecture 8 October 2015 Professor Rolph van der Hoeven
These results confi rm of Diwan’s earlier observation (Diwan, 2001) that
currency crises are associated with sharp declines in the labour income
share, reiterating that the cost of fi nancial instability aff ects labour
disproportionally. More recent analyses (Stockhammer 2013 and ILO 2013)
fi nd decline of the welfare state and weakening of labour market institutions
in addition to fi nancialization, globalization and technical change as drivers
of factor income inequality.
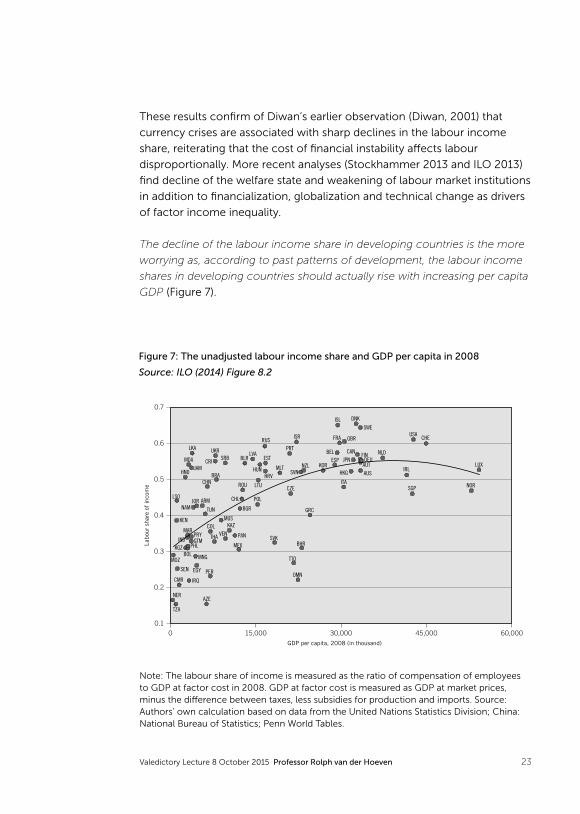
The decline of the labour income share in developing countries is the more
worrying as, according to past patterns of development, the labour income
shares in developing countries should actually rise with increasing per capita
GDP (Figure 7).
Figure 7: The unadjusted labour income share and GDP per capita in 2008
Source: ILO (2014) Figure 8.2
0.2
0.3
0.4
0.5
0.6
Labo
ur s
hare
of
inco
me
GDP per capita, 2008 (in thousand)
0.1
0.7
J
J
J
J
J
J
J
J
J
JJ
JJ
J
J
JJ
J
J
J
J
J
J
JJ
J
J
J
JJ
JJ
J
J
J
JJJ
J
JJJ
JJ
J
J
J
J
JJ
J
J
J
J
J
J
J
J
J
J
J
JJ
J
J
J
J
J
J
J
J
JJ
J
JJJ J
J
J
J J
J
J
NER
MOZ
TZA
KEN
LSO
SEN
CMR
HND
KGZIND
MAR
BOLPHL
MDA
IRQ
GTMPRY
JAM
LKA
NAM
MNG
JOR
EGY
ARM
TUN
AZE
CHN
PER
COL
THA
CRI
UKR
BRA
MUS
SRB
VENKAZ
PAN
MEX
BGR
CHL
ROU
BLRLVA
POL
LTU
HUN
RUS
HRV
EST
SVK
MLT
PRT
CZE
TTO
ISR
OMN
SVN
BHR
NZL
GRC
KORESP
BEL
ISL
FRA
ITA
GBR
HKG
JPN
DNK
CANFIN
SWE
AUTAUS
DEUNLD
IRL
SGP
USACHE
NOR
LUX
0 15,000 30,000 45,000 60,000
wow_2014_EN.indd 153 08.08.14 11:28
Note: The labour share of income is measured as the ratio of compensation of employees to GDP at factor cost in 2008. GDP at factor cost is measured as GDP at market prices, minus the diff erence between taxes, less subsidies for production and imports. Source: Authors’ own calculation based on data from the United Nations Statistics Division; China: National Bureau of Statistics; Penn World Tables.
24 Can the Sustainable Development Goals stem rising income inequality in the world?
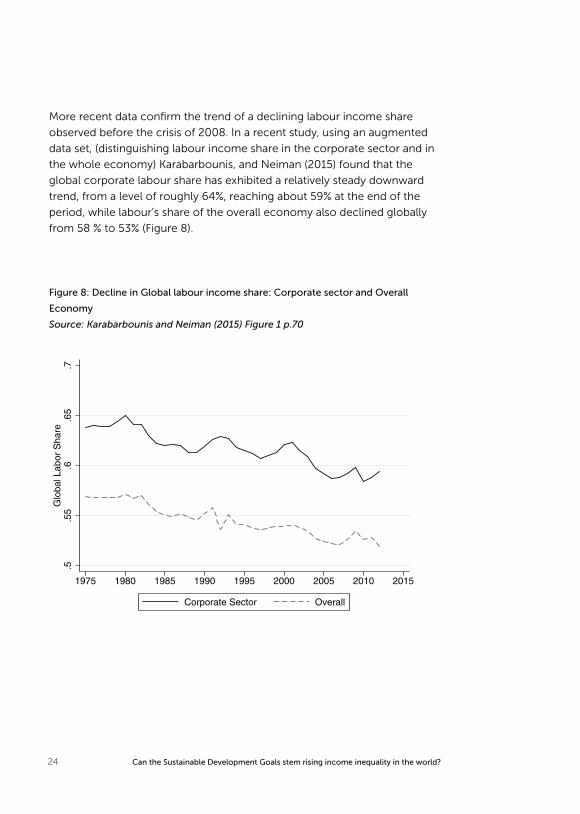
More recent data confi rm the trend of a declining labour income share
observed before the crisis of 2008. In a recent study, using an augmented
data set, (distinguishing labour income share in the corporate sector and in
the whole economy) Karabarbounis, and Neiman (2015) found that the
global corporate labour share has exhibited a relatively steady downward
trend, from a level of roughly 64%, reaching about 59% at the end of the
period, while labour’s share of the overall economy also declined globally
from 58 % to 53% (Figure 8).
Figure 8: Decline in Global labour income share: Corporate sector and Overall
Economy
Source: Karabarbounis and Neiman (2015) Figure 1 p.70
.5.5
5.6
.65
.7G
loba
l Lab
or S
hare
1975 1980 1985 1990 1995 2000 2005 2010 2015
Corporate Sector Overall
25Valedictory Lecture 8 October 2015 Professor Rolph van der Hoeven
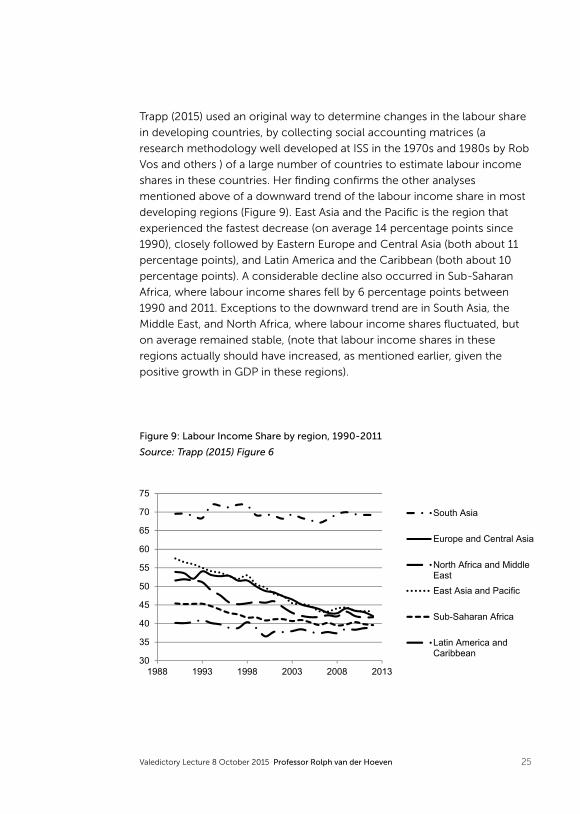
Trapp (2015) used an original way to determine changes in the labour share
in developing countries, by collecting social accounting matrices (a
research methodology well developed at ISS in the 1970s and 1980s by Rob
Vos and others ) of a large number of countries to estimate labour income
shares in these countries. Her fi nding confi rms the other analyses
mentioned above of a downward trend of the labour income share in most
developing regions (Figure 9). East Asia and the Pacifi c is the region that
experienced the fastest decrease (on average 14 percentage points since
1990), closely followed by Eastern Europe and Central Asia (both about 11
percentage points), and Latin America and the Caribbean (both about 10
percentage points). A considerable decline also occurred in Sub-Saharan
Africa, where labour income shares fell by 6 percentage points between
1990 and 2011. Exceptions to the downward trend are in South Asia, the
Middle East, and North Africa, where labour income shares fl uctuated, but
on average remained stable, (note that labour income shares in these
regions actually should have increased, as mentioned earlier, given the
positive growth in GDP in these regions).
Figure 9: Labour Income Share by region, 1990-2011
Source: Trapp (2015) Figure 6
30
35
40
45
50
55
60
65
70
75
1988 1993 1998 2003 2008 2013
South Asia
Europe and Central Asia
North Africa and MiddleEastEast Asia and Pacific
Sub-Saharan Africa
Latin America andCaribbean
26 Can the Sustainable Development Goals stem rising income inequality in the world?
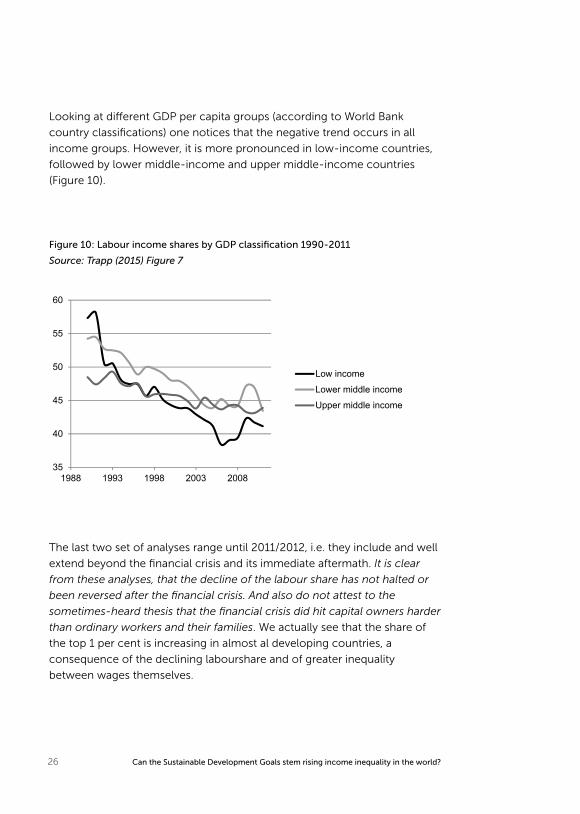
Looking at diff erent GDP per capita groups (according to World Bank
country classifi cations) one notices that the negative trend occurs in all
income groups. However, it is more pronounced in low-income countries,
followed by lower middle-income and upper middle-income countries
(Figure 10).
Figure 10: Labour income shares by GDP classifi cation 1990-2011
Source: Trapp (2015) Figure 7
35
40
45
50
55
60
1988 1993 1998 2003 2008
Low income
Lower middle income
Upper middle income
The last two set of analyses range until 2011/2012, i.e. they include and well
extend beyond the fi nancial crisis and its immediate aftermath. It is clear
from these analyses, that the decline of the labour share has not halted or
been reversed after the fi nancial crisis. And also do not attest to the
sometimes-heard thesis that the fi nancial crisis did hit capital owners harder
than ordinary workers and their families. We actually see that the share of
the top 1 per cent is increasing in almost al developing countries, a
consequence of the declining labourshare and of greater inequality
between wages themselves.
27Valedictory Lecture 8 October 2015 Professor Rolph van der Hoeven
Increasing share of top 1% income groups in
developing countries
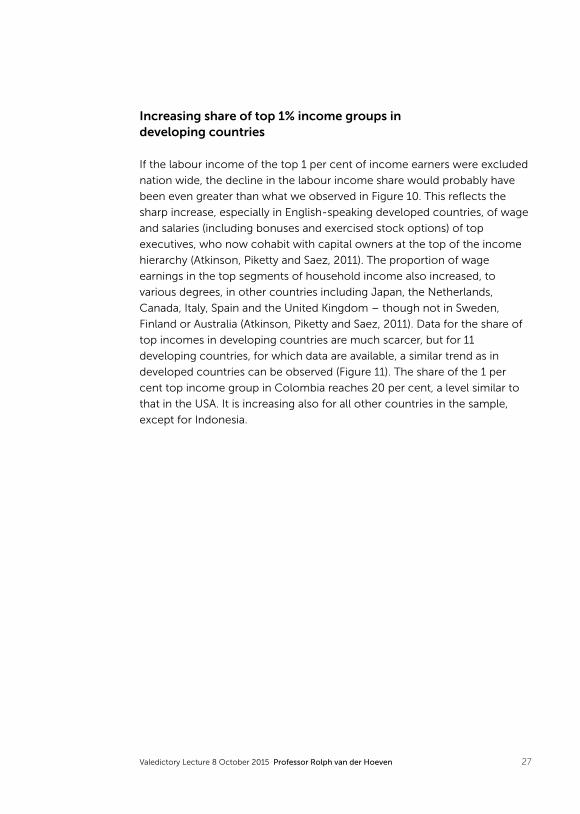
If the labour income of the top 1 per cent of income earners were excluded
nation wide, the decline in the labour income share would probably have
been even greater than what we observed in Figure 10. This refl ects the
sharp increase, especially in English-speaking developed countries, of wage
and salaries (including bonuses and exercised stock options) of top
executives, who now cohabit with capital owners at the top of the income
hierarchy (Atkinson, Piketty and Saez, 2011). The proportion of wage
earnings in the top segments of household income also increased, to
various degrees, in other countries including Japan, the Netherlands,
Canada, Italy, Spain and the United Kingdom – though not in Sweden,
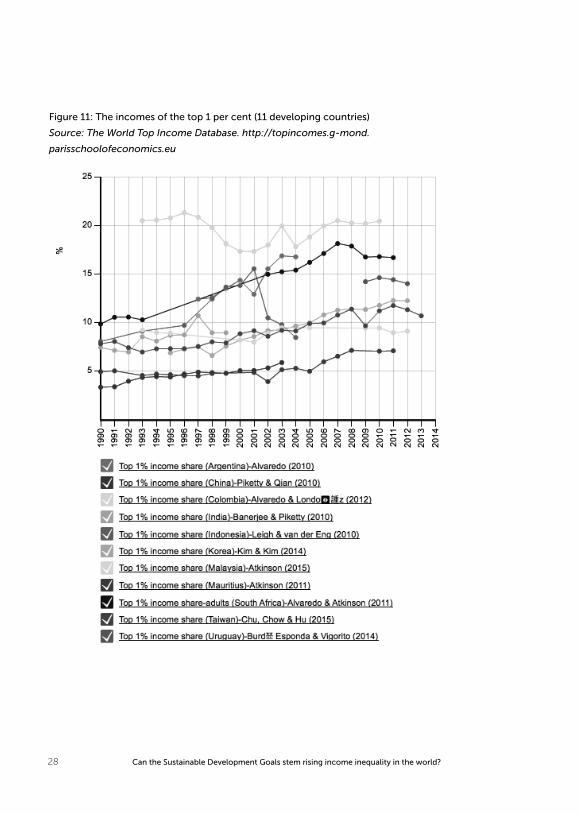
Finland or Australia (Atkinson, Piketty and Saez, 2011). Data for the share of
top incomes in developing countries are much scarcer, but for 11
developing countries, for which data are available, a similar trend as in
developed countries can be observed (Figure 11). The share of the 1 per
cent top income group in Colombia reaches 20 per cent, a level similar to
that in the USA. It is increasing also for all other countries in the sample,
except for Indonesia.
28 Can the Sustainable Development Goals stem rising income inequality in the world?
Figure 11: The incomes of the top 1 per cent (11 developing countries)
Source: The World Top Income Database. http://topincomes.g-mond.
parisschoolofeconomics.eu
29Valedictory Lecture 8 October 2015 Professor Rolph van der Hoeven
Millennium Development Goals and Sustainable
Development Goals
Let me now turn to the question of whether the Sustainable Development
Goals can stem this growing income inequality. The 17 Sustainable
Development Goals (see Annex 2) have been adopted last month at the UN
Sustainable Development Summit in New York. These goals come into force
as of January 1, 2016 and are the successors of the Millennium
Development Goals (MDGs) which were adopted in 1991 and whose target
date is the end of 2015.
In order to understand the making of the SDGs, we have to see briefl y how
the MDGs came about. An enthusiastic group in the secretariat of the UN
developed them on the basis of the UN Millennium Summit declaration of
20006. The MDGs refl ected the wish of many development practitioners to
have, at a global level, clear goals and measurable outcomes of a number of
desirable development challenges, without proscribing a fi xed sets of
policies, as this would have led, in the wake of the dissatisfaction with
structural adjustment policies of the 1980s and 1990s, to great controversy
and to a rejection of an otherwise generally accepted policy document
(Vandemoortele, 2011). However, the absence of a well-founded
development theory meant that in practice for most countries development
policies remained business as usual, considerably infl uenced by the Poverty
Reduction Strategies, the successor of the Structural Adjustment Policies of
the World Bank. As Saith (2006) puts it: ‘Poverty reduction is somehow
detached from the constraints imposed by structural inequalities and
anti-poor and anti-labour policy biases. The answer is held to lie in the
simple equation: external assistance + technological fi xes + good local
governance = poverty reduction’.
6 These were based on early conceptualization of development goals by the OECD and drew on the Millennium Declaration, accepted by all Heads of State at the Millennium Summit of the UN in September 2000. The Declaration itself has a longer and higher set of aspirations, and should not be confused with the very specifi c and time-bound set of indicators which comprise the 8 MDGs and 21 targets through which progress towards the MDGs are measured (Melaned, 2012, p.4)
30 Can the Sustainable Development Goals stem rising income inequality in the world?
UNCTAD (2014) argues that the MDG approach was essentially a linear one,
focusing mainly on human and some environmental development goals
and programs, targeted directly at meeting those goals. By focusing on
outcome goals, to the exclusion of the means for achieving them, the
MDGs encouraged reliance on specifi c programs aimed at improving the
targeted indicators that were mostly fi nanced by Offi cial Development
Assistance (ODA). Ensuring sustainability depends, however, critically on
reversing vicious circles of development, in which especially many least
developed countries fi nd themselves (UNCTAD 2014). Economic
development has thus a major role to play in achieving human development
goals, and a still more critical role in sustaining advances in human
development over the long term. Employment is a critical linkage in this
process, especially when it is accompanied by rising labour productivity
(Nayyar, 2013a). An economic development process is needed that creates
productive and remunerative jobs allowing people to generate the income
needed to escape poverty, while also generating the public revenues
needed to fi nance health services and education. This in turn requires an
international economic system that supports such development processes.
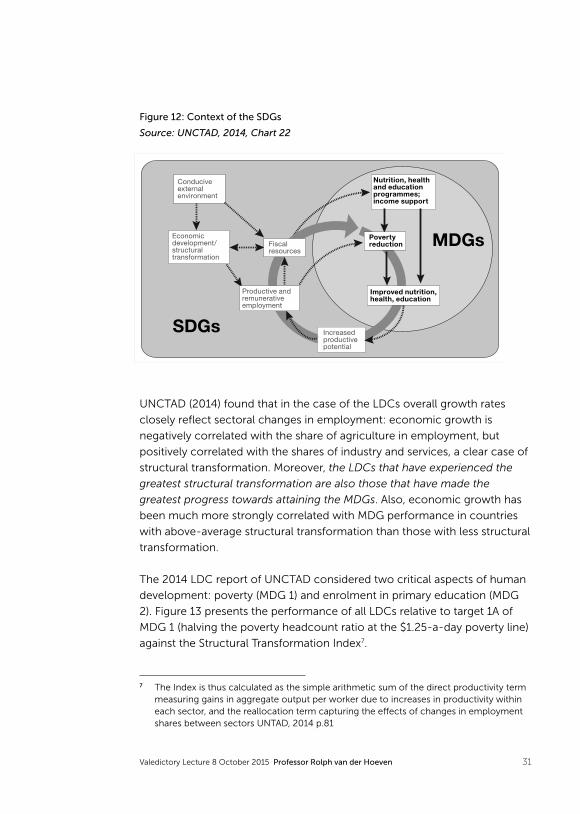
If the post-2015 agenda is to be successful in achieving the adopted SDGs,
it needs to encompass all of the elements presented in Figure 12: economic
transformation, employment creation, the generation of fi scal resources
and a favorable global economic environment, also called structural
transformation, a necessary condition for long-term growth of per capita
income (Ocampo et al., 2009). Indeed,
“(i)t is associated with two types of dynamic effi ciency, accelerating the
growth of productivity, output and employment over time. The fi rst is a
Schumpeterian effi ciency eff ect, whereby those sectors with the
highest rates of productivity growth and capacity expansion lead the
innovation process and drive productivity gains. The second is a
Keynesian effi ciency eff ect, whereby the pattern of specialization shifts
towards sectors that benefi t from faster growth of domestic and
external demand, generating positive impacts on output and
employment. These two types of effi ciency generally go hand in hand,
as the more knowledge-intensive sectors also tend to face stronger
domestic demand growth in the long run, and tend to be more
competitive in international markets” (UNCTAD 2014)
31Valedictory Lecture 8 October 2015 Professor Rolph van der Hoeven
UNCTAD (2014) found that in the case of the LDCs overall growth rates
closely refl ect sectoral changes in employment: economic growth is
negatively correlated with the share of agriculture in employment, but
positively correlated with the shares of industry and services, a clear case of
structural transformation. Moreover, the LDCs that have experienced the
greatest structural transformation are also those that have made the
greatest progress towards attaining the MDGs. Also, economic growth has
been much more strongly correlated with MDG performance in countries
with above-average structural transformation than those with less structural
transformation.
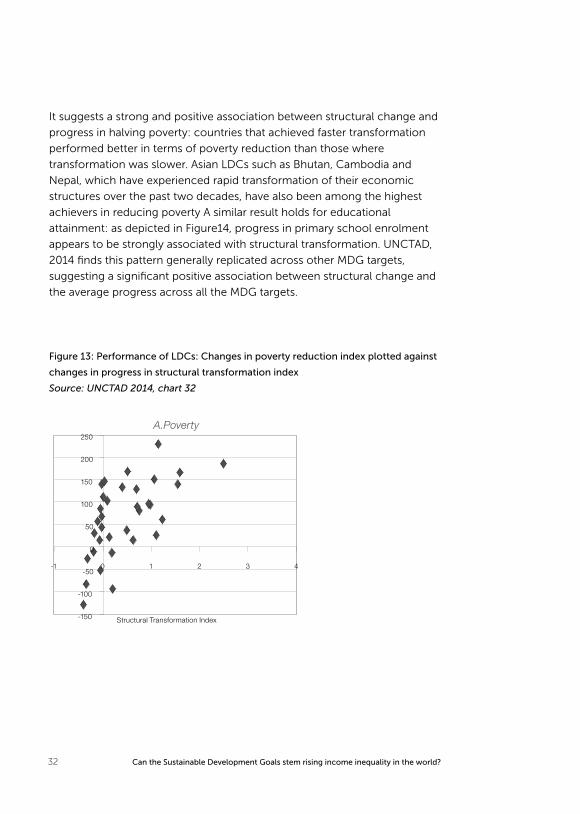
The 2014 LDC report of UNCTAD considered two critical aspects of human
development: poverty (MDG 1) and enrolment in primary education (MDG
2). Figure 13 presents the performance of all LDCs relative to target 1A of
MDG 1 (halving the poverty headcount ratio at the $1.25-a-day poverty line)
against the Structural Transformation Index7.
Figure 12: Context of the SDGs
Source: UNCTAD, 2014, Chart 22
Nutrition, healthand educationprogrammes;income support
Conduciveexternalenvironment
Economicdevelopment/structuraltransformation
Increasedproductivepotential
Productive and remunerativeemployment
Fiscalresources
Improved nutrition,health, education
Povertyreduction
SDGs
MDGs
7 The Index is thus calculated as the simple arithmetic sum of the direct productivity term measuring gains in aggregate output per worker due to increases in productivity within each sector, and the reallocation term capturing the eff ects of changes in employment shares between sectors UNTAD, 2014 p.81
32 Can the Sustainable Development Goals stem rising income inequality in the world?
It suggests a strong and positive association between structural change and
progress in halving poverty: countries that achieved faster transformation
performed better in terms of poverty reduction than those where
transformation was slower. Asian LDCs such as Bhutan, Cambodia and
Nepal, which have experienced rapid transformation of their economic
structures over the past two decades, have also been among the highest
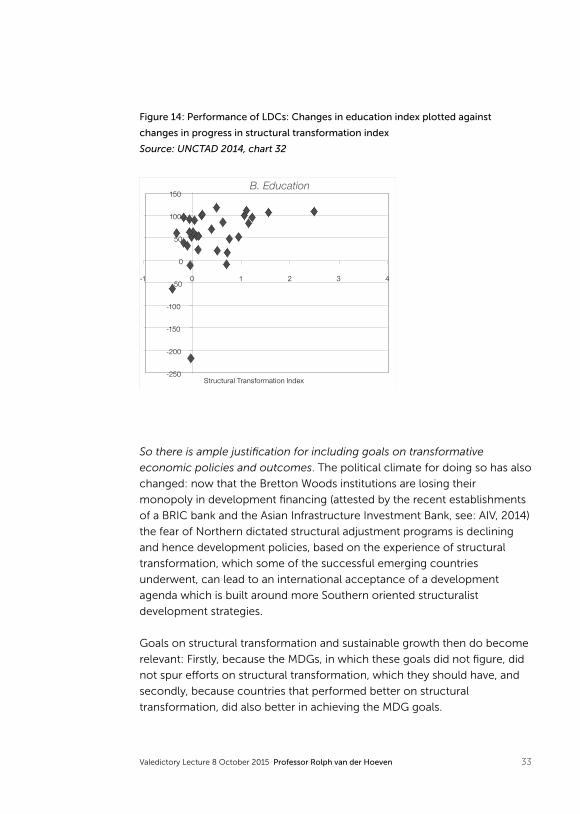
achievers in reducing poverty A similar result holds for educational
attainment: as depicted in Figure14, progress in primary school enrolment
appears to be strongly associated with structural transformation. UNCTAD,
2014 fi nds this pattern generally replicated across other MDG targets,
suggesting a signifi cant positive association between structural change and
the average progress across all the MDG targets.
Figure 13: Performance of LDCs: Changes in poverty reduction index plotted against
changes in progress in structural transformation index
Source: UNCTAD 2014, chart 32
-150
-100
-50
0
50
100
150
200
250
-1 0 1 2 3 4
Structural Transformation Index
A.Poverty
33Valedictory Lecture 8 October 2015 Professor Rolph van der Hoeven
So there is ample justifi cation for including goals on transformative
economic policies and outcomes. The political climate for doing so has also
changed: now that the Bretton Woods institutions are losing their
monopoly in development fi nancing (attested by the recent establishments
of a BRIC bank and the Asian Infrastructure Investment Bank, see: AIV, 2014)
the fear of Northern dictated structural adjustment programs is declining
and hence development policies, based on the experience of structural
transformation, which some of the successful emerging countries
underwent, can lead to an international acceptance of a development
agenda which is built around more Southern oriented structuralist
development strategies.
Goals on structural transformation and sustainable growth then do become
relevant: Firstly, because the MDGs, in which these goals did not fi gure, did
not spur eff orts on structural transformation, which they should have, and
secondly, because countries that performed better on structural
transformation, did also better in achieving the MDG goals.
Figure 14: Performance of LDCs: Changes in education index plotted against
changes in progress in structural transformation index
Source: UNCTAD 2014, chart 32
-250
-200
-150
-100
-50
0
50
100
150
-1 0 1 2 3 4
Structural Transformation Index
B. Education
34 Can the Sustainable Development Goals stem rising income inequality in the world?
Hence it is logical that in the preparation of the SDGs more attention was
given to issues of sustainable growth and structural transformation. Actually,
the list of SDGs refl ects much more the principles and aspirations of the
Millennium Declaration of 2000, and represents therefore a more integrated
approach to development, in which economic, social and ecological
concerns are more balanced. They contain, as Mkandawire (2004)
formulated, a possible agenda for transformative social policies. If we
classify the 17 goals as social, economic, environmental or general (an
exercise which is open to multiple interpretations, as some goals can be
typifi ed by more than one term) we arrive at 5 social goals, 5 environment
goals, 3 economic goals and 4 general goals.8 This classifi cation does also
point to a rather balanced set of goals.
Inequality and Sustainable Development Goals
Various authors (van der Hoeven, 2010, Vandemoortele, 2011, Melaned,
2012) have argued that the MDGs, by emphasizing targets at a global level
(and more and more also at national level), have ignored the inequalities
that averages conceal. They suggest therefore that attention to inequality is
imperative in any formulation of the SDGs and that targets for all SDGs
should be broken down for diff erent socioeconomic classes or for diff erent
income groups. These argumentations have been strengthened by recent
analyses that conclude that greater equality and more equal access to
government services will contribute to improved and sustained
development in general (Wilkenson and Pickett, 2009). However, for a
workable set of SDGs it is not only necessary to make the various impacts
on poorer groups more visible and to suggest corrective measures in terms
of public and development aid expenditures, but also to analyse and take
action on what kind of economic or social processes are causing these
enormous (often growing) inequalities.
8 See annex 2 for all 17 SDGs; 5 Social Goals (SDG 1 ,2, 3, 4, 6), 5 Environmental Goals (SDG 7, 12, 13, 14, 15), 3 Economic Goals (SDG 8, 9 and 10), 4 General Goals (SDG 5, 11, 16, 17)
35Valedictory Lecture 8 October 2015 Professor Rolph van der Hoeven
In the evaluation of the results of the MDGs it became clear that the lack of
any reference to inequality was a great oversight in the MDGs. This mistake
was exacerbated by the fact that currently most poor people, defi ned as
those living on less than 1.25 a day, do not live any more in low income
countries, as Andy Sumner made clear (Sumner, 2012). Various scholars and
activist came to conclusion that tackling inequality is actually a greater
challenge than tackling poverty. During the preparation of the SDGs, I
joined a group of about 90 concerned scholars that in an open letter9 urged
the Secretary of the High-Level Panel of Eminent Persons on the Post 2015
Development Agenda that the SDGs should take inequality on board in all
its aspects and adopt as a goal the reduction of the Palma ratio, which
indicates how much more the income of the 10 per cent richest is,
compared to 40 per cent poorest. As Palma has elaborated in a special issue
of Development and Change (Palma, 2011) this ratio does not only gives a
better picture of inequality, but also can shed light on the specifi c situation
of the middle class. Palma correctly argued that diff erences in inequality are
less an outcome of technical factors and more the result of the political
process, where norms and habits determine the degree of inequality and
where the attitude of the middle class plays an important role.
Which measures are necessary to stem the growing inequality? To answer
this question it is useful to return to Table 2, which distinguishes between
exogenous and endogenous drivers of inequality. Exogenous drivers of
inequality are shaped by international trade and investment agreements as
part of an improved system of global governance, giving developing
countries more policy space and allowing them to set in motion a process
of structural change. But equally important are the endogenous drivers of
inequality.
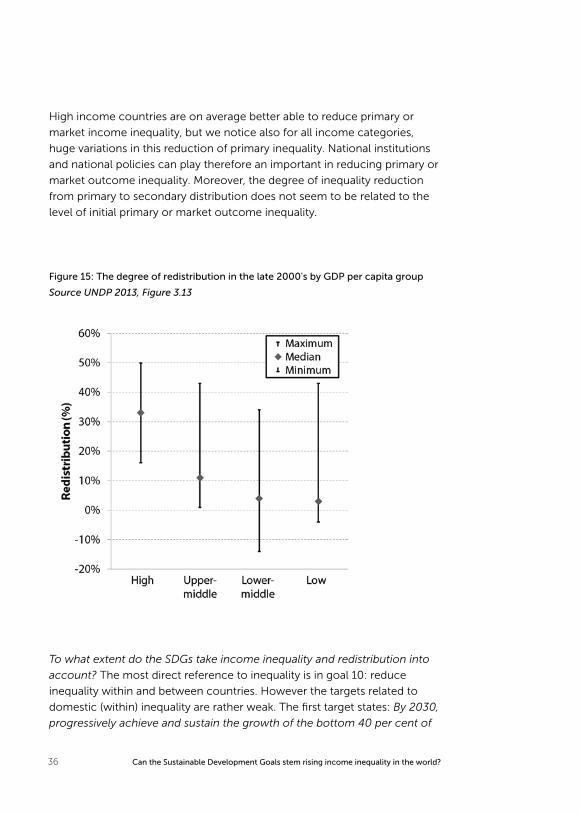
It is on those endogenous drivers that I want to concentrate now. The
literature has shown that domestic policies can have a great eff ect on
inequality (Dagdeviren et al. 2004). Figure 15 gives the degree of
redistribution that governments in countries at diff erent levels of GDP per
capita did perform. In all income groups there is great variation.
9 http://www.post2015hlp.org/wp-content/uploads/2013/03/Dr-Homi-Kharas.pdf
36 Can the Sustainable Development Goals stem rising income inequality in the world?
High income countries are on average better able to reduce primary or
market income inequality, but we notice also for all income categories,
huge variations in this reduction of primary inequality. National institutions
and national policies can play therefore an important in reducing primary or
market outcome inequality. Moreover, the degree of inequality reduction
from primary to secondary distribution does not seem to be related to the
level of initial primary or market outcome inequality.
Figure 15: The degree of redistribution in the late 2000's by GDP per capita group
Source UNDP 2013, Figure 3.13
To what extent do the SDGs take income inequality and redistribution into
account? The most direct reference to inequality is in goal 10: reduce
inequality within and between countries. However the targets related to
domestic (within) inequality are rather weak. The fi rst target states: By 2030,
progressively achieve and sustain the growth of the bottom 40 per cent of
37Valedictory Lecture 8 October 2015 Professor Rolph van der Hoeven
the population at a rate higher than the national average, followed by
targets calling to promote inclusion, and ensure equal opportunity a.o. by
eliminating discriminatory laws. Another target is to adopt policies,
especially fi scal, wage and social protection policies and progressively
achieve greater equality.
The formulations of these targets refl ect the diffi culty among the
negotiators behind the SDGs to come to clear statements on inequality. The
only time bound target (rate of income growth of bottom 40 per cent faster
than national average) is rather vague and completely misses the fact that
increases in inequality are especially created at the top end of the income
scale. One can only deplore that the modest suggestion to use the Palma
ratio, which is sensitive to more than proportionate increases at the top
income scale, has not been taking into account in the current SDGs.
The other targets are calling for more policy attention to national inequality.
In this respect it might be instructive to see what happened at the recent
conference on Financing for Development (FfD), a preparatory conference
this July in Addis Ababa setting policies and actions for fi nal adaptation of
the SDGs in September. Although the outcome document of the FfD
conference, the Addis Ababa Action Agenda, mentions several concerns on
growing inequality and urges national governments to increase fi scal
resources, that can be used to counteract the growing income inequality
stemming from globalization (see also Bourguignon, 2015), it fails to
recommend fundamental changes in the International Financial System
which could increase the fi scal capacity of developing countries to fi nance
amongst others redistributive policies. Firstly, various developed countries
prevented recommendations on changing the current global fi nancial
architecture in the Addis Ababa Action Agenda. A change would have led to
less volatility in foreign fl ows and hence less need for developing countries
to hold costly foreign reserves to face growing volatility. With less volatility,
these foreign reserves could have been used by developing countries for
national investment.
38 Can the Sustainable Development Goals stem rising income inequality in the world?
Nobel prize laureate Joseph Stiglitz has calculated that the eff ect of using
foreign reserves for domestic investment in developing countries would
have been a bigger contribution to the fi nancing of the MDGs than current
development aid10. Secondly, recommendations to set up an international
tax body to stem the illicit outfl ow of resources from developing countries
through tax treaties and transfer pricing etc., which would have greatly
increased the fi scal situation in developing countries, were not accepted, as
developed countries wanted to keep the discussion and measures on tax
issues under the auspices of the OECD, an organisation dominated by
western developed countries. Thirdly, sensible proposals to set up a
Sovereign Debt Reduction Mechanism, the adoption of which would have
avoided unregulated and ad hoc debt rescheduling, were not accepted,
putting yet another strain on the fi scal situation in developing countries (AIV,
2014).
So on a fi rst reading one could say that the SDGs and the Addis Ababa
Action Agenda, in the way they have been currently formulated, will not be
able to stem the growing inequality in the World. However, another issue
that came to the fore during the preparation of the SDGs, is the active
involvement of civil society. Civil society and some governments have
achieved that the SDGs are now embedded in the Human Rights
Declaration and in the other international instruments relating to human
rights and international law and that a follow-up and review process should
be an integral part of the SDGs. Here opportunities still exist. The Statistical
Commission of the UN, in consultation with all stakeholders will set in 2016
verifi able indicators towards the targets of the SDGs, while member states
are encouraged to develop national strategies, which will be part of a review
process coordinated by the High Level Political Forum on Sustainable
Development, based on SDG progress reports. These review processes will
10 ‘Developing countries earn at most 1 to 2 per cent in real return on their foreign reserves. They could invest these reserves locally with returns up to 10 to 15 per cent. Assuming a diff erence of 10 per cent between domestic and foreign returns, the opportunity cost of holding reserves is quite high, well in excess of $300 billion per year – more than 2 per cent of GDP. The total opportunity cost of reserves is roughly equal to the amount of funds needed by developing countries to fi nance necessary investments to meet the MDGs’ (Stiglitz, 2006, p.249)
39Valedictory Lecture 8 October 2015 Professor Rolph van der Hoeven
not only be informed by governments and international agencies, but also
by civil society. It is in these processes that I see a continued and future
challenge to put issues of inequality at the forefront of development policy.
At various passages in the SDGs and in the Addis Ababa Action Agenda
many lofty words have been said about reducing inequality. Active
involvement of civil society can thus call governments and the UN system
to task on growing national and international income inequalities and
demand measures which go beyond the formulation of some of the time
bound exact targets, but which follow the general language of the SDGs
and the Post 2015 development agenda and which could then form the
basis of a global social contract (van der Hoeven, 2011, Ghosh, 2015) for an
eff ective development partnership.
It is also here that I look at ISS. On the hand, ISS has great capacity to
analyze income and poverty trends and the eff ects of international and
national economic policies, but on the other hand ISS has also great
knowledge on how politics, laws and social policies work and how people
and disadvantaged groups can make themselves stronger through more
eff ective civic action. The SDGs provide for the ISS a continuing incentive to
stay on this multidisciplinary path of solid analysis and of understanding
national and international trends and policies, with policy and civic action to
stem the growing inequality in the world.

40 Can the Sustainable Development Goals stem rising income inequality in the world?

41Valedictory Lecture 8 October 2015 Professor Rolph van der Hoeven
Words of thanks
I come to the end of my lecture, but will not close before expressing my
gratitude to all at ISS, with whom I had the pleasure of working. It is fi rst of
all a delight to be engaged with eight generations of students, who have
shown me again and again how vibrant the world is. I worked with three
rectors, Louk Box, Leo de Haan and recently Inge Hutter. They all, in their
own way, gave me space at ISS to develop my ideas and to pursue my
inklings, something which I very much have appreciated. Also members and
ex-members of the board, notable Mohamed Salih, Freek Schiphorst and
Wil Hout encouraged and supported me in all kind of matters. I have found
a welcome home in the staff groups Work, Employment and Globalization,
ably led by Freek Schiphorst and Irene van Staveren, and Economics for
Development, where Peter van Bergeijk, Mansoob Murshed and Arjun Bedi
made me realize that one is never too old to learn, as did ISS affi liated
professors Rob Vos and Nico Schrijver. ISS can also be proud of its
nonacademic staff , including all the librarians and ICT people and the
secretariat, which helped me in carrying forward the mission of the ISS. In
particular I benefi tted from collaborating with Linda Johnson, executive
secretary of the ISS, Femke van der Vliet, Sandra Nijhof, Jane Pocock,
Annette van Geen and Sharmini Bisessar, some of whom helped me literally
until the last minute today. I would also like to thank all my colleagues and
friends from abroad, some of whom came from far to join this morning’s
seminar and who are all with us this afternoon. Your cooperation, insights,
and friendship mean a lot to me.
However this all pales with the support I got from Marianne, Kees and
Jorick. They gave me inspiration, and also their valuable and frank opinion
on family and world aff airs. It is not always easy with an often-away
travelling husband and father. Marianne, Kees and Jorick thank you very
much.
It is the tradition that a valedictory lecture in the Netherlands ends with ik
heb gezegd. But to me that sound somewhat pedantic. Firstly because, as I
sketched above, there are many opinions and mine is only one, and
secondly ik heb gezegd sounds so defi nitive. I certainly will continue to
speak my mind in the years to come. So let me end in a more English
tradition: Thank you for joining and for listening to me, I have appreciated
that a lot.

42 Can the Sustainable Development Goals stem rising income inequality in the world?
43Valedictory Lecture 8 October 2015 Professor Rolph van der Hoeven
References
Addison, T., Structural Adjustment (2002) in Clarke, R., C. Kirkpatrick,
C. Polidano (eds.) Handbook on Development Policy and Management,
Edward Elgar, Cheltenham.
Adelman, I. (1979) ‘Redistribution before growth.’ in: Institute of Social
Studies, Development of Societies: The next twenty-fi ve years pp. 160-176.
Martinus Nijhoff , Den Haag.
AIV (Advisory Council on International Aff airs) (2012) Unequal Worlds:
Poverty, Growth, Inequality And The Role Of International Cooperation,
Advisory Report 80, The Hague.
AIV (Advisory Council on International Aff airs) (2014) Improving Global
Financial Cohesion, The Importance of a Coherent International Economic
and Financial Architecture, Advisory Report 89, The Hague.
Atkinson, A. B. (2009) ‘Factor shares: the principal problem of political
economy?’ Oxford Review of Economic Policy, vol. 25, n. 1, 3-16.
Atkinson, A.B., T. Piketty and E. Saez (2011) ‘Top Incomes in the
Long Run of History’ Journal of Economic Literature 2011, 49:1, 3-71
http:www.aeaweb.org/articles.php?doi= 10.1257/jel.49.1.3
van Bergeijk, P. A.G (2013) Earth Economics Edward Elgar, Cheltenham.
van Bergeijk, P. A.G, A. de Haan and R. van der Hoeven (eds) (2011)
The Financial Crisis and Developing Countries, A global Multidisciplinary
Perspective, Edward Elgar, Cheltenham.
Bourguignon, F. (2015) The Globalization of Inequality, Princeton University
Press, Princeton.
Cornia, Giovanni A. (ed.) (2004) Inequality, Growth and Poverty in an Era of
Liberalization and Globalization, Oxford University Press, Oxford.
44 Can the Sustainable Development Goals stem rising income inequality in the world?
Chenery, H. et. al. (1974) Redistribution with Growth, Oxford University
Press, Oxford.
Dagdeviren, H., R. van der Hoeven and J. Weeks (2004) ‘Redistribution does
matter: growth and redistribution for poverty reduction’, in: Shorrocks,
T. and R. van der Hoeven (eds), Growth, Inequality, and Poverty: Prospects
for Pro-poor Economic Development, Oxford University Press, Oxford.
Daudey, E and Garcia-Penalosa, C (2007) ‘The personal and the factor
distribution of Income in a Cross-Section of Countries, Journal of
Development Studies. vol. 43, no 5, p 812-829.
Diwan, Ishac (1999) Labor shares and fi nancial crises. World Bank, Mimeo
Washington, DC.
Dreher, N. Gaston and P.Martens (2008) Measuring Globalisation – Gauging
its Consequences Springer, New York, http://globalization.kof.ethz.ch/
Ghosh J. (2015) ‘Beyond The Millenium Development Goals: A Southern
Perspective On A Global New Deal’ Journal of International Development,
27, 320-329, DOI: 10.1002/jid.3087
Glyn, A. (2009) ‘Functional Distribution and Inequality’, in Salverda, W.,
Nolan, B. and Smeeding, T. M. (eds.), The Oxford Handbook of Economic
Inequality, 101-126, Oxford University Press, Oxford.
Gunther, B. and R. van der Hoeven (2004) ‘The social dimension of
globalization: a review of the literature’, International Labour Review, 143
(1-2), 7-43.
Hacker, J. (2011) The Institutional Foundations of Middle Class Democracy
The Think ank Policy Network, London.
van der Hoeven, R. (1988) Planning for Basic Needs: A Soft Option or a Solid
Policy, A Basic Needs Simulation Model Applied to Kenya, Gower, Aldershot.
van der Hoeven, R. (2009) ‘Inequality’ in Handbook of Economics and
Ethics, Peil, J. and I. van Staveren (eds) Edward Elgar, Cheltenham.
45Valedictory Lecture 8 October 2015 Professor Rolph van der Hoeven
van der Hoeven, R. (2010) Income inequality and employment revisited: Can
one make sense of economic policy? In: Journal of Human Development
and Capabilities, Vol. 11:1.
van der Hoeven, R., (ed.) (2011) Employment, Inequality and Globalization:
A Continuous Concern, London, Routledge.
van der Hoeven, R. (2012) A global social contract to follow the Millennium
Development Goals, New York, Washington: Council on Foreign Relations
(CFR).
Hopkins, M. and R. van der Hoeven (1983) Basic Needs in development
Planning, Gower, Aldershot.
ILO (2004) A Fair Globalization: Creating Opportunities for All, Geneva:
World Commission on the Social Dimension of Globalization, Geneva.
ILO (2011) World of Work report 2011: Income Inequalities in the Age of
Financial Globalization, Geneva, ILO.
ILO (2013) Global Wage Report 2012/13: Wage and Equitable Growth,
Geneva.
ILO (2014) World of Work report 2014, Geneva.
Karabarbounis, L. and Neiman, B. (2015) ‘The Global Decline of the Labor
Share’ The Quarterly Journal of Economics, 61–103. doi:10.1093/qje/qjt032
Luebker, Malte (2002) Assessing the impact of past distributional shifts on
global poverty levels, Employment Paper 2002–37, International Labour
Organization, Geneva.
Meier, G.M. (1971) Leading issues in development (second edition), Oxford
University Press, Oxford.
Melaned, C. (2012) After 2015: Contexts, politics and processes for a Post
2015 Global Agreement on Development, London, ODI.
46 Can the Sustainable Development Goals stem rising income inequality in the world?
Milanovic, B. (2012) “Global inequality recalculated and updated: the eff ect
of new PPP estimates on global inequality and 2005 estimates”, Journal of
Economic Inequality, volume 10, issue 1, 2012, pp. 1-18.
Mkandawire, T. (ed) (2004) Social Policy in a Development Context. Palgrave
Macmillan, Basingstoke.
Nayyar, D. (2013a) ‘The Millennium Development Goals Beyond 2015: Old
Frameworks and New Constructs’, Journal of Human Development and
Capabilities 14:3, 371-392, DOI: 10.1080/19452829.2013.764853
Nayyar, D. (2013b) Catch Up, Developing Countries in the World Economy,
Oxford University Press, Oxford.
Ocampo J.A., Rada C. and Taylor L. (2009) Growth and Policy in Developing
Countries: A Structuralist Approach. Columbia University Press, New York,
NY.
Palma, J. G. (2011) ‘Homogeneous Middles vs. Heterogeneous Tails, and the
End of the ‘Inverted-U’: It's All About the Share of the Rich’. Development
and Change, 42: 87–153. doi: 10.1111/j.1467-7660.2011.01694.x
Piketty, T. (2014) Capital in the Twenty-First Century, Harvard University
Press, Cambridge.
Prebish, R. (1970) Change And Development – Latin America's Great Task:
Report Submitted To The Inter-American Development Bank, Praeger,
New York.
Ragab, A. (2013) Technical note on income inequality and trade and
fi nancial globalization trends, UNDP, New York.
Rodriguez and Yayadev (2010) The declining Labor Share of Income,
Human development Reports Research paper 2010/36, UNDP, New York.
Saith, A. (2006) ‘From Universal Values to Millennium Development Goals:
Lost in Translation’, Development and Change, Vol. 37, No. 6, pp. 1167-1199.
47Valedictory Lecture 8 October 2015 Professor Rolph van der Hoeven
Shorrocks, T. and R. van der Hoeven (eds) (2004) Growth, Inequality, and
Poverty: Prospects for Pro poor Economic Development, Oxford University
Press, Oxford.
Stiglitz, J. (2006) Making Globalization Work. W.W. Norton and Company,
New York.
Stockhammer, E. (2013) Why have wage shares fallen? A panel analysis of
the determinants of functional income distribution, Conditions of Work and
Employment Series No. 35, ILO, Geneva.
Sumner, A. (2012) Where do the poor live? A new update, IDS Working
Paper 2012-339, IDS, Sussex.
Tinbergen, J. (1975) Income Distribution, Analysis and Policies,
North Holland, Amsterdam.
Trapp, K. (2015) Measuring the labour income share of developing countries,
WIDER working paper 2015/041, UNU-WIDER, Helsinki.
UNDP (2013) Humanity Divided: Confronting Inequality in Developing
Countries, New York.
UNCTAD (2014) The least developed countries report 2014, Growth with
Structural Transformation: A post 2015 development Agenda, Geneva.
Vandemoortele, J. (2011) ‘The MDG Story: Intention Denied.’ Development
and Change, 42: 1–21. doi: 10.1111/j.1467-7660.2010.01678.x
Vos, R.P. (1994) Debt and Adjustment in the World Economy: Structural
Asymmetries in North-South Interactions. MacMillan, London.
Vos, R.P. (2010) ‘The crisis of Globalization as an Opportunity to Create a
Fairer World’ In: Journal of Human Development and Capabilities, Vol 11:1
Wilkinson, R. and K. Pickett (2010) The Spirit Level. Why Equality is Better for
Everyone. Penguin Books, London.

48 Can the Sustainable Development Goals stem rising income inequality in the world?
Annex 1 Millennium Development Goals (MDGs)
1. Eradicate extreme poverty and hunger
2. Achieve universal primary education
3. Promote gender equality and empower women
4. Reduce child mortality
5. Improve maternal health
6. Combat HIV/AIDS, malaria and other diseases
7. Ensure environmental sustainability
8. Develop a global partnership for development
Annex 2 Sustainable Development Goals (SDGs)
1. End poverty in all its forms everywhere
2. End hunger, achieve food security and improve nutrition and promote
sustainable agriculture
3. Ensure healthy lives and promote well-being for all at all ages
4. Ensure inclusive and equitable education and promote life-long learning
opportunities for all
5. Achieve gender equality and empower women and girls
6. Ensure availability and sustainable management of water and sanitation
for all
7. Ensure access to aff ordable, reliable sustainable and modern energy
for all
8. Promote sustained, inclusive and sustainable economic growth, full and
productive employment and decent work for all
9. Build resilient infrastructure, promote inclusive and sustainable
industrialization and foster innovation
10. Reduce inequality within and among countries
11. Make cities and human settlements inclusive, safe and sustainable
12. Ensure sustainable consumption and production patterns
13. Take urgent action to combat climate change and its impacts
14. Conserve and sustainably use the oceans, seas and marine resources for
sustainable development
15. Protect, restore and promote sustainable use of terrestrial ecosystems,
sustainably manage forests, combat desertifi cation and halt land
degradation and biodiversity loss
16. Promote peaceful and inclusive societies, provide access to justice for
all, and built eff ective, accountable and inclusive institutions at all levels
17. Strengthen the means of implementation and revitalize the global
partnership for sustainable development