Embed Size (px)
Citation preview

Can one hear the shape of
Information?
Copyright 2014 by Evans M. Harrell II.
Evans HarrellGeorgia Tech
www.math.gatech.edu/~harrell
November, 2014

What is the mathematics behind the ear's ability to pick information out of a sound signal? What sort of information do we pick out when we listen to music?
"Sonification" is the name for a current method in data science that involves turning data into sound and using the human ear to detect patterns. As we'll see, patterns are extracted from a signal through Fourier series and the Fourier transform, which I'll introduce. In order to answer the question of what kind of information we pick out, I'll discuss how the shape of an object and the sounds it makes are connected, in terms of the wave equation and associated eigenvalues. Then I'll discuss some recent research where information is instead encoded in a graph (network) and we use eigenvalues to detect some of of its features.
Can one hear the shape of
Information?

An insight of Joseph Fourier

An insight of Joseph Fourier
Or, as usual, maybe of Leonhard Euler before him: “Any” sound is a superposition of pure frequencies.

An insight of Joseph Fourier
Or, as usual, maybe of Euler before him: “Any” sound is a superposition of pure frequencies.
Your inner ear turns out to be an instrument capable of breaking sounds into pure frequencies, multiples of
cos(wt - f) or exp(i(wt))

Fourier series and integrals
If a signal (function) is periodic, f(t) = f(t+p), it is a sum of sine functions:
Fourier series and integrals
An arbitrary signal (say, square-integrable) is still an integral:

Fourier series and integrals
Moreover, given the signal, the formula for the coefficients is remarkably simple:

A recent trend in “data mining”
Turn it into music and listen. You could hear about “sonification,” example in a BBC report.

A recent trend in “data mining”
Anyway, it is easy, because the graph of any function can equally well be interpreted visually on Cartesian axes or as a sound wave.

A recent trend in “data mining”
Anyway, it is easy, because the graph of any function can equally well be interpreted visually on Cartesian axes or as a sound wave.
In Mathematica, there are two parallel commands:


Examples of sonification
Cosmic microwave backgroundGalaxy spectraHiggs bosonTohoku earthquake
(compare to:Japanese drumming)Financial market data (more
randomness)

A recent trend in “data mining”
Turn it into music and listen.First Life - Translating Scientific Data Into
Music, a collaboration of Steve Everett, Professor of Music at Emory and Martha Grover, Chemical & Biomolecular Engineering at Georgia Tech. (Sept. 2013, at the Atlanta Botanical Garden.)
Molecular music. (March, 2014, Atlanta Science Festival.)
European Science Café Atlanta

A recent trend in “data mining”


How are sounds produced?
Until now we have touched on how to take a sound apart into its frequencies.
Another question is: How can we put a sound together? What kinds of sounds does an object make?

Shapes of musical instruments
Instruments that produce sustained sound (i.e., not percussion) are almost all roughly one-dimensional in some way. Either they use strings or they have one dimension that is much more extended than the others. Why?
How are sounds produced?
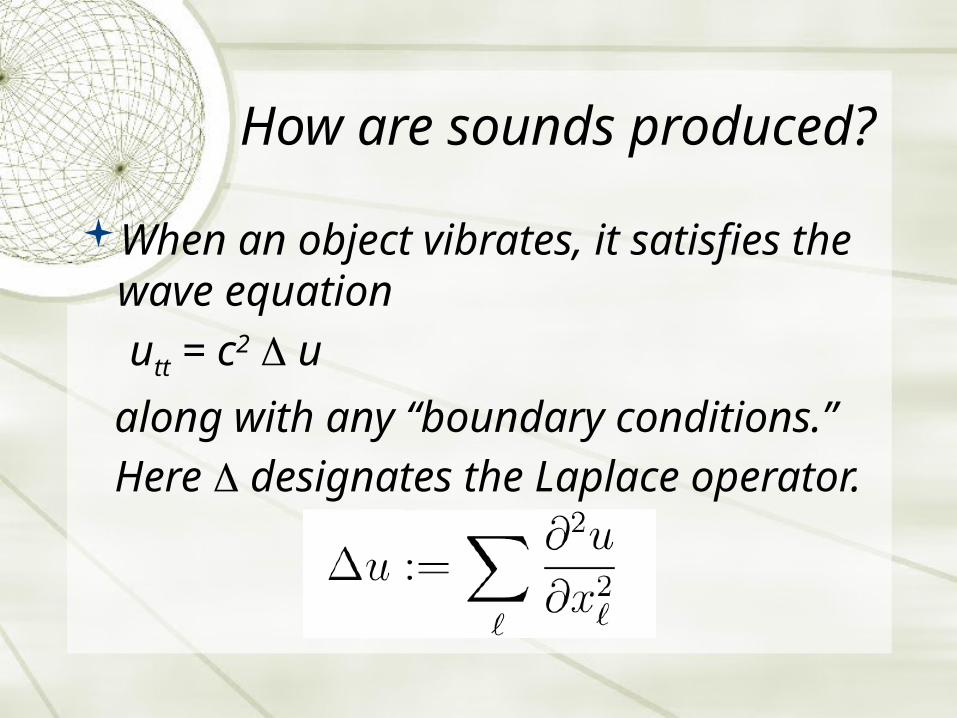
When an object vibrates, it satisfies the wave equation
utt = c2 D u
along with any “boundary conditions.” Here D designates the Laplace operator.
How are sounds produced?
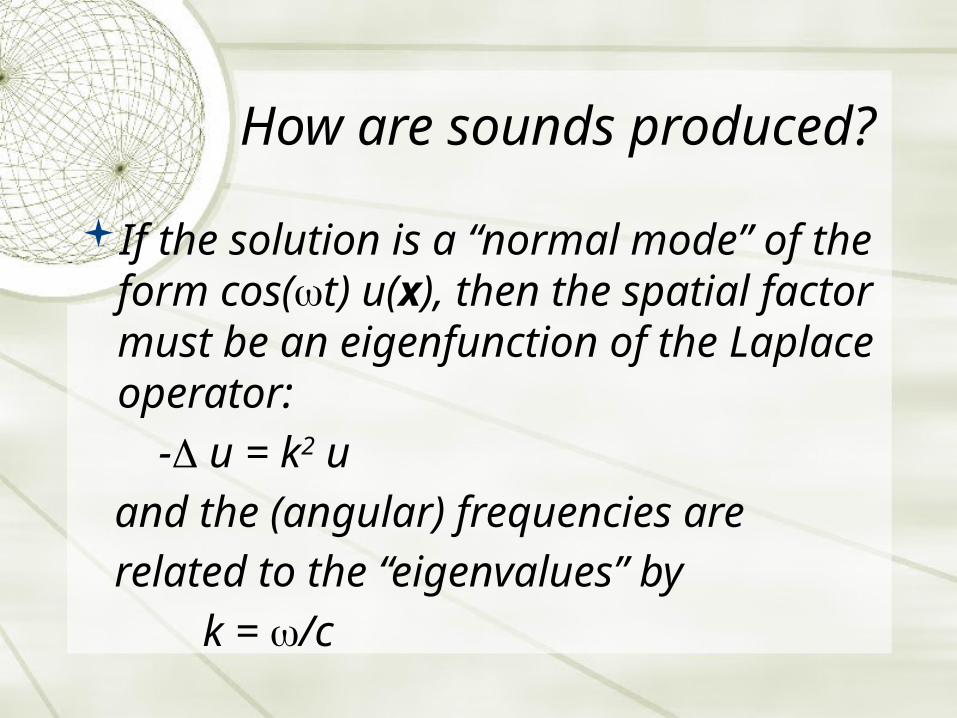
If the solution is a “normal mode” of the form cos(wt) u(x), then the spatial factor must be an eigenfunction of the Laplace operator:
-D u = k2 u and the (angular) frequencies are related to the “eigenvalues” by k = w/c

What do eigenvalues tell us about shapes?
Mark Kac, Can one hear the shape of a drum?, Amer. Math. Monthly, 1966.

What do eigenvalues tell us about shapes?
Mark Kac, Can one hear the shape of a drum?, Amer. Math. Monthly, 1966.
Already in 1946, G. Borg considered whether you could hear the density of a guitar string, but he failed to think of such a colorful title.

What do eigenvalues tell us about shapes?
Mark Kac, Can one hear the shape of a drum?, Amer. Math. Monthly, 1966.
Besides, the answer is now known to be “no.” However, there are some facts about the shape we can hear, because the statistical distribution of eigenvalues satisfies many conditions in which volume, surface area, and other properties appear.

So, can one hear the shape of a drum?
Gordon, Webb, and Wolpert, 1991
Depending on your beliefs…
You could say that animals like you are either evolved or designed to pick out statistical relations among frequencies (eigenvalues), so that your hearing helps you make sense of your environment.

Depending on your beliefs…
You could say that animals like you are either evolved or designed to pick out statistical relations among frequencies (eigenvalues), so that your hearing helps you make sense of your environment.
The fact that the underlying mathematical formulae are simple made such abilities possible.
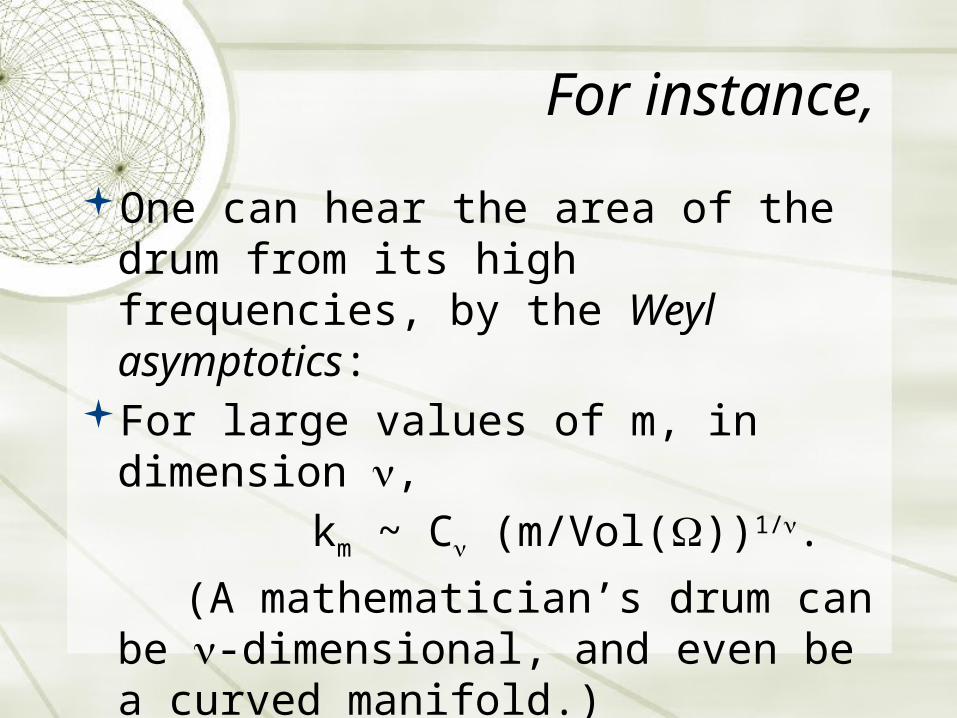
For instance,
One can hear the area of the drum from its high frequencies, by the Weyl asymptotics:
For large values of m, in dimension n,
km ~ Cn (m/Vol())1/n.
(A mathematician’s drum can be n-dimensional, and even be a curved manifold.)

For instance,
One can hear the area of the drum from its high frequencies, by the Weyl asymptotics:
For large values of m, in dimension n,
km ~ Cn (m/Vol())1/n.
In 1 dimension, the ratios of these numbers are rational, but not in any other dimension.

Shapes of musical instruments
If the part of a musical instrumental that produces vibrations is basically one-dimensional, then it will tend to have harmonic overtones. (The three-dimensionality only kicks in for much higher frequencies than you can hear.)

Wave forms of a vibrating string

Shapes of musical instruments
Percussion instruments tend to have two and three-dimensional structures, but they are less used for sustained musical tones.

What about network data, as encoded in a combinatorial graph?

Let the graph vibrate, and listen to it!
The discrete version of the Laplace operator is a certain n´n matrix, where n is the number of vertices. Its eigenvalues are the squares of the frequencies of normal modes.

Let the graph vibrate, and listen to it!
There are actually different ways to set up the discrete Laplacian, but in any version, the frequencies do not alwaysdetermine the graph.
Example of Steve Butler, Iowa State, for the “normalized Laplacian” and adjacency matrix.
Mouse and fish for the standard Laplacian.

One can “hear” the number of edges, the number of triangles, and some other facts
about connectedness:
Some special graphs (cycle, complete, etc.) have unique spectra (= sets of eigenvalues). One can also easily hear whether a graph is bipartite (= needs only 2 colors).

One can “hear” the number of edges, the number of triangles, and some other facts
about connectedness:

Let the graph vibrate, and listen to it!
Nobody completely understands what sets of frequencies are possible for graphs, but there are regularities.
Yay! Open problems and
conjectures!


Dimension and complexity
A two-dimensional image can be complicated, but, as Descartes emphasized, each point in the image can be located by asking only two questions.
In this way, dimension is a measure of complexity: How many questions do you need to ask to understand the data?
Is this something one can hear?

Is dimension (complexity) something that one can
hear?
(See Mathematica notebook)

Dimension and complexity
A two-dimensional image can be complicated, but, as Descartes emphasized, each point in the image can be located by asking only two questions.
In this way, dimension is a measure of complexity. As we saw, one can hear the dimension of a vibrating object.

Dimension and complexity
A two-dimensional image can be complicated, but as Descartes emphasized, each point in the image can be located by asking only two questions.
In this way, dimension is a measure of complexity. As we saw, one can hear the dimension of a vibrating object.
What about a graph?

Dimension and complexity
This is a randomly generated “graph” showing 520 connections among 100 items. How many independent kinds of information (“dimensions”) are there?

Dimension and complexity
Some graphs, like regular lattices, have an obvious dimensionality. Zn can be said to have dimension n..

Dimension and complexityDimension and complexity
Harrell-Stubbe, Linear Algebra and Applications, 2014.

More exactly…
Harrell-Stubbe, Linear Algebra and Applications, 2014.
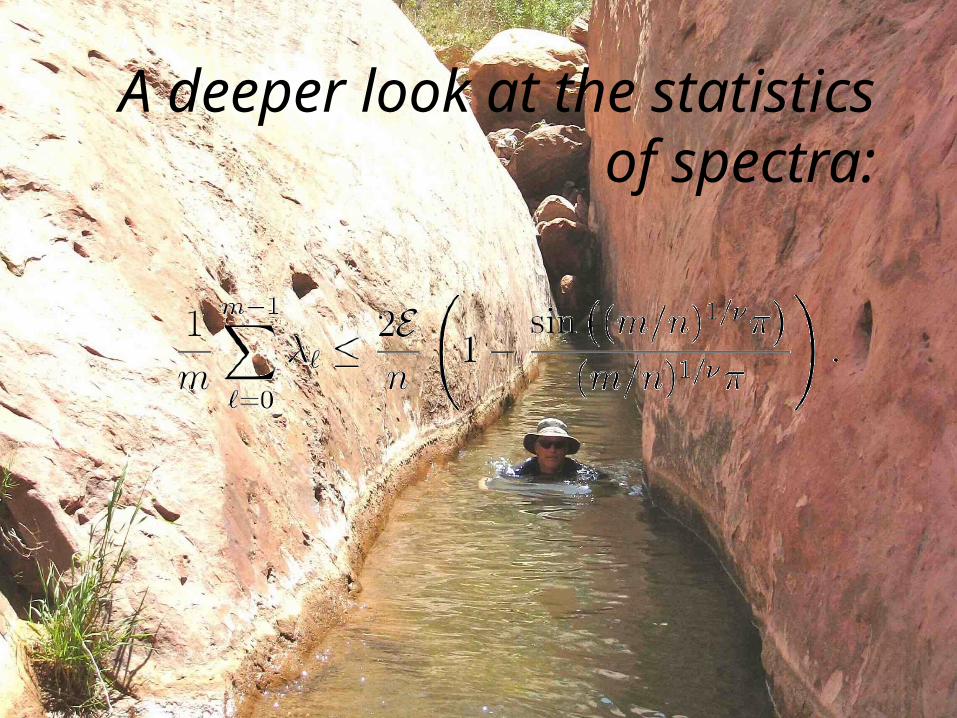
A deeper look at the statistics of spectra:
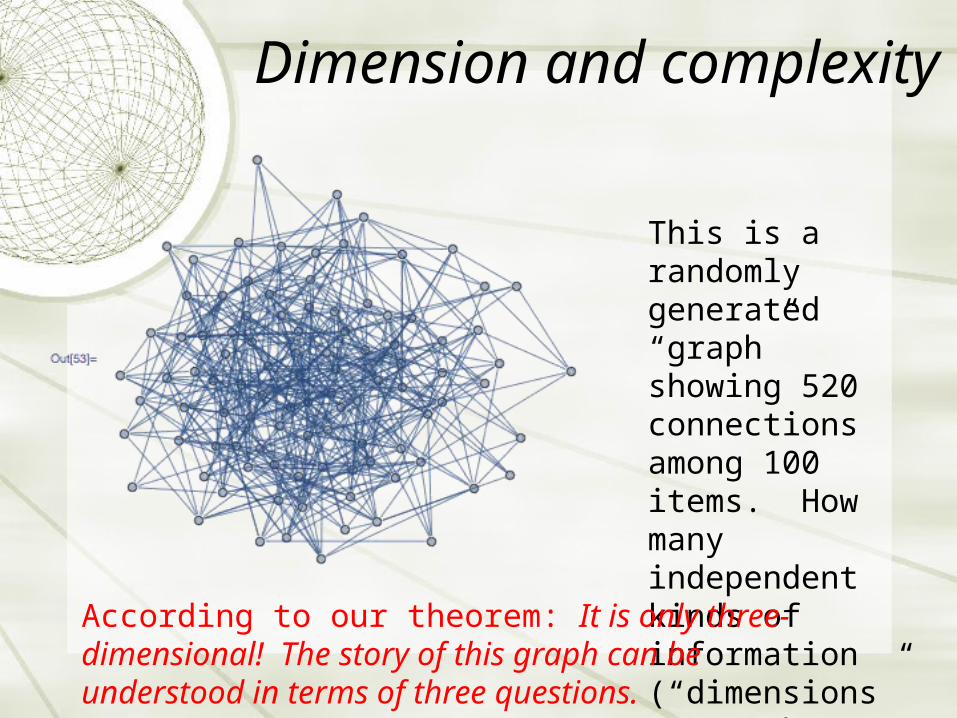
This is a randomly generated “graph” showing 520 connections among 100 items. How many independent kinds of information (“dimensions”) are there?
According to our theorem: It is only three-dimensional! The story of this graph can be understood in terms of three questions.
Dimension and complexity

THE END