Embed Size (px)
Citation preview

Technology, Media & Entertainment and Telecommunications
Global Capital Confidence BarometerDecember 2017 | ey.com/ccb | 17th edition
Can increased M&A competition and better dealmaking coexist?Active portfolio management, strong deal narratives and advance integration analysis help deliver on M&A strategies
2 | Global Capital Confidence Barometer
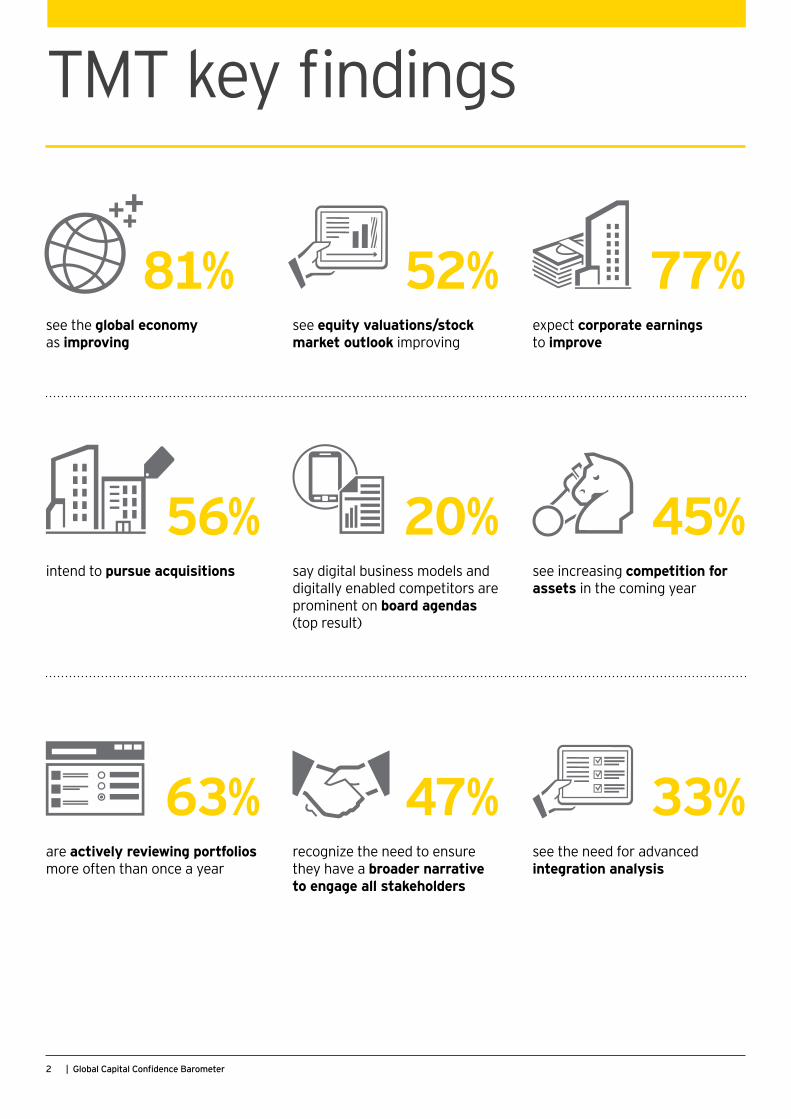
TMT key findings
45%see increasing competition for assets in the coming year
20%say digital business models and digitally enabled competitors are prominent on board agendas (top result)
56%intend to pursue acquisitions
52%see equity valuations/stock market outlook improving
81%see the global economy as improving
77%expect corporate earnings to improve
47%recognize the need to ensure they have a broader narrative to engage all stakeholders
63%are actively reviewing portfolios more often than once a year
33%see the need for advanced integration analysis
3TMT Capital Confidence Barometer |
Active portfolio management, strong deal narratives and advance integration analysis help deliver on M&A strategiesM&A competition comes to the fore in this Capital Confidence Barometer of technology, media and entertainment, and telecommunications (TMT) companies. In general, conditions are ripe for dealmaking, say TMT executives, who have expressed high confidence in the global economy, capital markets and corporate earnings growth.
Enter private equity (PE). PE firms today are flush with hundreds of billions in cash. TMT executives rank the return of PE buyers as the predominant theme in the M&A market for the coming year. Forty-five percent of TMT survey respondents expect heightened competition, and of those, half see challenges coming from PE. Even beyond PE, hostile and competitive bids are expected to have a sizable impact on dealmaking.
This competition is growing amid greater confidence in global economic growth than at any time since the financial crisis. Four-fifths of TMT executives expect the economy to continue improving — an indicator that has quadrupled over the past year — while confidence in the stock market outlook has risen 18 percentage points and optimism about corporate earnings is up 23 percentage points. Near-term TMT dealmaking intentions remain near record levels (56%), in aggregate, and well above the 45% average since April 2013.
Of course, M&A competition in the TMT sector was already on the rise for an altogether different reason — rapid and ongoing digital change, with emerging technologies and business models disrupting incumbents, blurring the lines that once separated the tech, media and entertainment, telecom and other industries — and compelling executives to act. In fact, from 2014 through the first half of 2017, EY analysis shows $2.4 trillion in announced deals of $50 million or more for TMT sector assets.
Competitive pressures demand a more active and strategic approach to M&A, expeditiously targeting the right assets to respond to shifting consumer preferences and new entrants. Almost two-thirds of TMT executives say they now review portfolios more often than once a year (with 19% reviewing continuously), though another third still do so annually.
To close their deals, almost half of TMT executives (47%) emphasize the importance of a strong deal narrative; communicating a credible investment strategy early helps convey synergies and generate positive market reaction. Advance integration analysis is also top of mind for a third of TMT executives.
But it’s not just about doing the deal. Even as steps like these can confer advantage in increasingly competitive TMT dealmaking, they serve a much larger purpose. Active portfolio management, strong deal narratives and advance integration analysis all pave the way for far better returns on M&A investments and other actual business outcomes as well. The following pages will look into what’s driving dealmaking in the individual technology, media and entertainment, and telecommunications industries.
Will FisherEY Global Media & Entertainment Sector LeaderTransaction Advisory Services
Ken WelterEY Global Technology Sector Leader Transaction Advisory Services
Axel MajertEY Global Telecommunications Sector Leader Transaction Advisory Services
4 | Global Capital Confidence Barometer
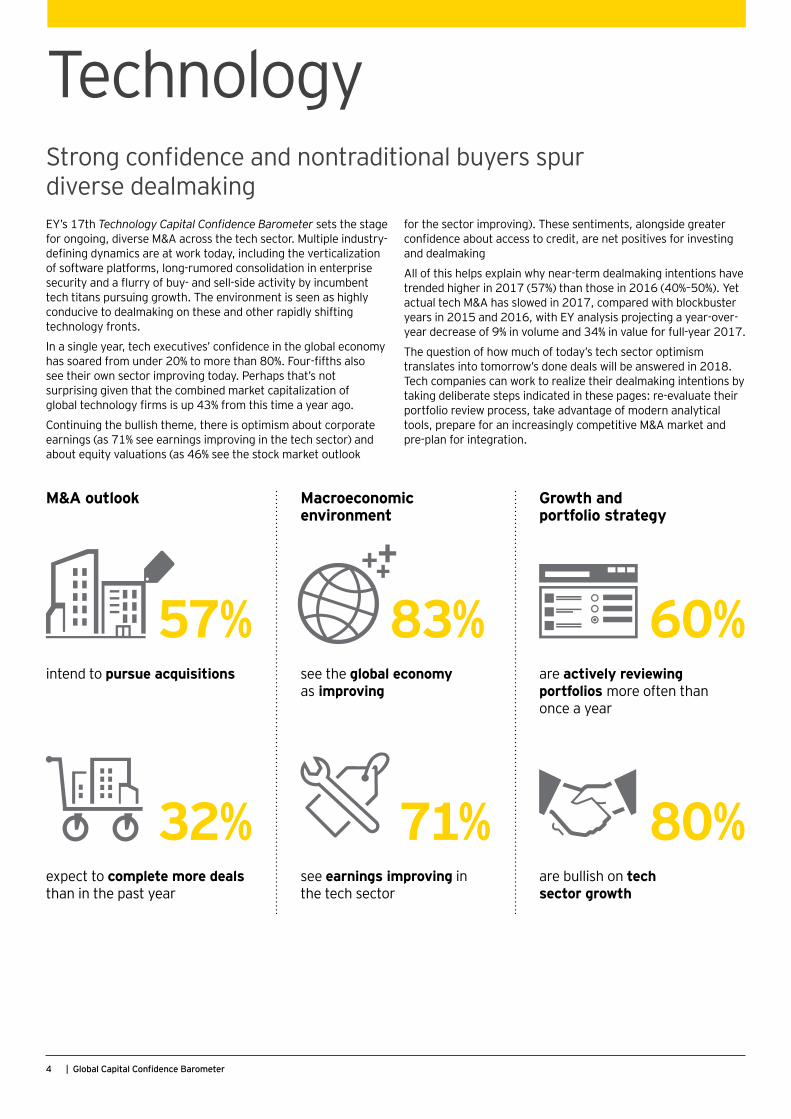
Technology
71%see earnings improving in the tech sector
Macroeconomic environment
80%are bullish on tech sector growth
Growth and portfolio strategy
M&A outlook
32%expect to complete more deals than in the past year
83%see the global economy as improving
60%are actively reviewing portfolios more often than once a year
57%intend to pursue acquisitions
Strong confidence and nontraditional buyers spur diverse dealmakingEY’s 17th Technology Capital Confidence Barometer sets the stage for ongoing, diverse M&A across the tech sector. Multiple industry-defining dynamics are at work today, including the verticalization of software platforms, long-rumored consolidation in enterprise security and a flurry of buy- and sell-side activity by incumbent tech titans pursuing growth. The environment is seen as highly conducive to dealmaking on these and other rapidly shifting technology fronts.
In a single year, tech executives’ confidence in the global economy has soared from under 20% to more than 80%. Four-fifths also see their own sector improving today. Perhaps that’s not surprising given that the combined market capitalization of global technology firms is up 43% from this time a year ago.
Continuing the bullish theme, there is optimism about corporate earnings (as 71% see earnings improving in the tech sector) and about equity valuations (as 46% see the stock market outlook
for the sector improving). These sentiments, alongside greater confidence about access to credit, are net positives for investing and dealmaking
All of this helps explain why near-term dealmaking intentions have trended higher in 2017 (57%) than those in 2016 (40%–50%). Yet actual tech M&A has slowed in 2017, compared with blockbuster years in 2015 and 2016, with EY analysis projecting a year-over-year decrease of 9% in volume and 34% in value for full-year 2017.
The question of how much of today’s tech sector optimism translates into tomorrow’s done deals will be answered in 2018. Tech companies can work to realize their dealmaking intentions by taking deliberate steps indicated in these pages: re-evaluate their portfolio review process, take advantage of modern analytical tools, prepare for an increasingly competitive M&A market and pre-plan for integration.
80+20+0+M
5TMT Capital Confidence Barometer |
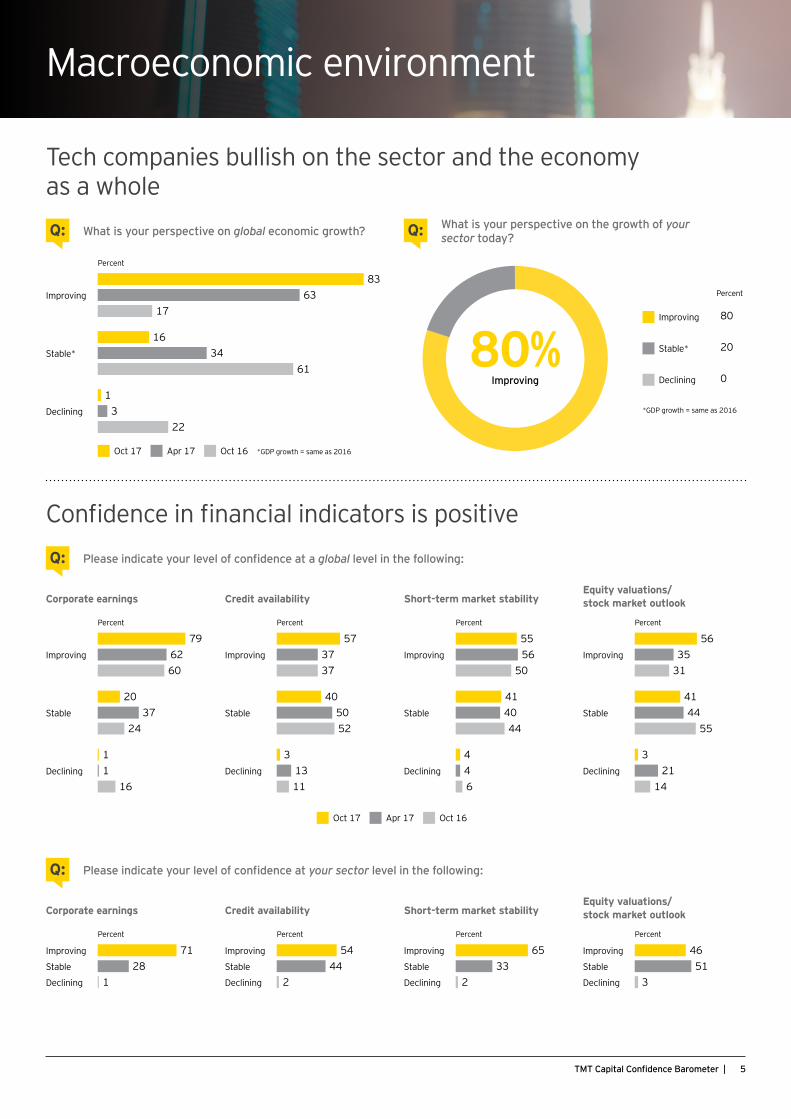
Tech companies bullish on the sector and the economy as a whole
Confidence in financial indicators is positive
Macroeconomic environment
What is your perspective on global economic growth?Q: What is your perspective on the growth of your sector today?Q:
80%Improving
Please indicate your level of confidence at a global level in the following:Q:
Please indicate your level of confidence at your sector level in the following:Q:
Percent
Improving
8363
17
Stable*
1634
61
Declining
13
22
Oct 17 Apr 17 Oct 16 *GDP growth = same as 2016
83+63+17+16+34+61+1+3+22Percent
Improving 80
Stable* 20
Declining 0
* GDP growth = same as 2016
Corporate earnings
Percent
Improving
796260
Stable
2037
24
Declining
11
16
Corporate earnings
Percent
Improving 71Stable 28Declining 1
Credit availability
Percent
Improving
573737
Stable
405052
Declining
31311
Credit availability
Percent
Improving 54Stable 44Declining 2
Short-term market stability
Percent
Improving
5556
50
Stable
414044
Declining
446
Short-term market stability
Percent
Improving 65Stable 33Declining 2
Equity valuations/ stock market outlook
Percent
Improving
5635
31
Stable
4144
55
Declining
321
14
Equity valuations/ stock market outlook
Percent
Improving 46Stable 51Declining 3
Oct 17 Apr 17 Oct 16
79+62+60+20+37+24+1+1+1671+28+1+
6 | Global Capital Confidence Barometer
M&A outlook
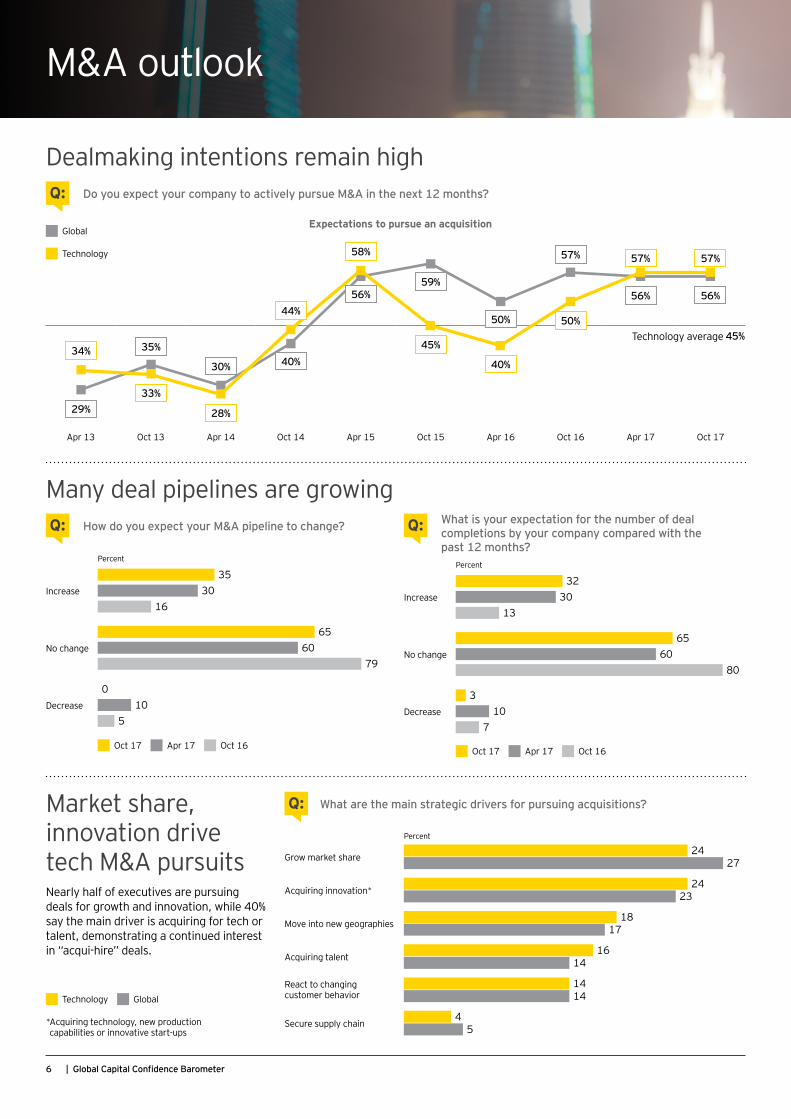
Dealmaking intentions remain high
Many deal pipelines are growing
Market share, innovation drive tech M&A pursuits
What are the main strategic drivers for pursuing acquisitions? Q:
How do you expect your M&A pipeline to change?Q: What is your expectation for the number of deal completions by your company compared with the past 12 months?
Q:
Do you expect your company to actively pursue M&A in the next 12 months?Q:
Nearly half of executives are pursuing deals for growth and innovation, while 40% say the main driver is acquiring for tech or talent, demonstrating a continued interest in “acqui-hire” deals.
Technology Global
* Acquiring technology, new production capabilities or innovative start-ups
Percent
Grow market share24
27
Acquiring innovation*24
23
Move into new geographies18
17
Acquiring talent16
14
React to changing customer behavior
1414
Secure supply chain4
5
24+27+ 24+23+ 18+17+ 16+14+ 14+14+ 4+5+ Percent
Increase
3530
16
No change
6560
79
Decrease
010
5
Oct 17 Apr 17 Oct 16
Percent
Increase
3230
13
No change
6560
80
Decrease
310
7
Oct 17 Apr 17 Oct 16
32+30+13+65+60+80+3+10+7 Apr 13 Oct 13 Apr 14 Oct 14 Apr 15 Oct 15 Apr 16 Oct 16 Apr 17 Oct 17
Technology average 45%
Expectations to pursue an acquisition Global
Technology
29%
56%59%
50%
57%
56% 56%
35%
30% 40%34%
58%
45%
40%
50%
57% 57%
33%
28%
44%
37+16+17+27+3+M
7TMT Capital Confidence Barometer |
Portfolio review
Rising competition
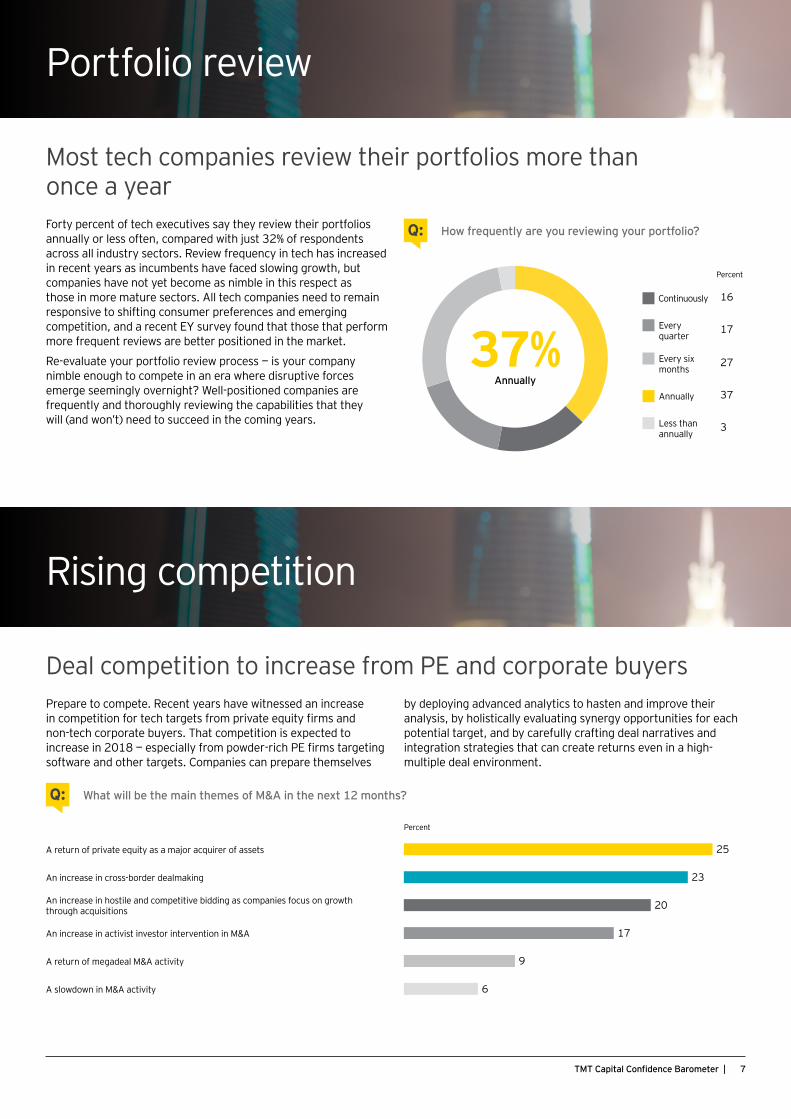
Most tech companies review their portfolios more than once a year
Deal competition to increase from PE and corporate buyers
Forty percent of tech executives say they review their portfolios annually or less often, compared with just 32% of respondents across all industry sectors. Review frequency in tech has increased in recent years as incumbents have faced slowing growth, but companies have not yet become as nimble in this respect as those in more mature sectors. All tech companies need to remain responsive to shifting consumer preferences and emerging competition, and a recent EY survey found that those that perform more frequent reviews are better positioned in the market.
Re-evaluate your portfolio review process — is your company nimble enough to compete in an era where disruptive forces emerge seemingly overnight? Well-positioned companies are frequently and thoroughly reviewing the capabilities that they will (and won’t) need to succeed in the coming years.
Prepare to compete. Recent years have witnessed an increase in competition for tech targets from private equity firms and non-tech corporate buyers. That competition is expected to increase in 2018 — especially from powder-rich PE firms targeting software and other targets. Companies can prepare themselves
by deploying advanced analytics to hasten and improve their analysis, by holistically evaluating synergy opportunities for each potential target, and by carefully crafting deal narratives and integration strategies that can create returns even in a high-multiple deal environment.
How frequently are you reviewing your portfolio?Q:
37%Annually
What will be the main themes of M&A in the next 12 months?Q:
24+27+ 24+23+ 18+17+ 16+14+ 14+14+ 4+5+ Percent
Continuously 16
Every quarter
17
Every six months
27
Annually 37
Less than annually
3
Percent
A return of private equity as a major acquirer of assets 25
An increase in cross-border dealmaking 23
An increase in hostile and competitive bidding as companies focus on growth through acquisitions 20
An increase in activist investor intervention in M&A 17
A return of megadeal M&A activity 9
A slowdown in M&A activity 6
25+23+20+17+9+6
8 | Global Capital Confidence Barometer
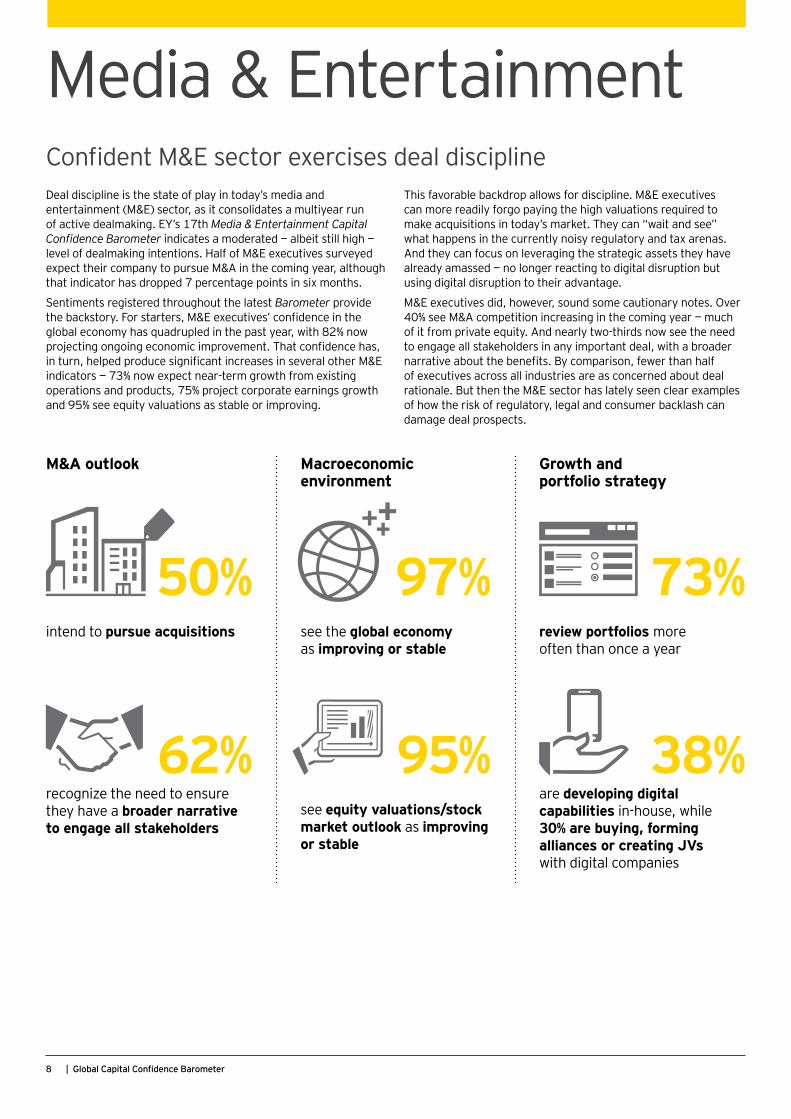
Media & EntertainmentConfident M&E sector exercises deal disciplineDeal discipline is the state of play in today’s media and entertainment (M&E) sector, as it consolidates a multiyear run of active dealmaking. EY’s 17th Media & Entertainment Capital Confidence Barometer indicates a moderated — albeit still high — level of dealmaking intentions. Half of M&E executives surveyed expect their company to pursue M&A in the coming year, although that indicator has dropped 7 percentage points in six months.
Sentiments registered throughout the latest Barometer provide the backstory. For starters, M&E executives’ confidence in the global economy has quadrupled in the past year, with 82% now projecting ongoing economic improvement. That confidence has, in turn, helped produce significant increases in several other M&E indicators — 73% now expect near-term growth from existing operations and products, 75% project corporate earnings growth and 95% see equity valuations as stable or improving.
This favorable backdrop allows for discipline. M&E executives can more readily forgo paying the high valuations required to make acquisitions in today’s market. They can “wait and see” what happens in the currently noisy regulatory and tax arenas. And they can focus on leveraging the strategic assets they have already amassed — no longer reacting to digital disruption but using digital disruption to their advantage.
M&E executives did, however, sound some cautionary notes. Over 40% see M&A competition increasing in the coming year — much of it from private equity. And nearly two-thirds now see the need to engage all stakeholders in any important deal, with a broader narrative about the benefits. By comparison, fewer than half of executives across all industries are as concerned about deal rationale. But then the M&E sector has lately seen clear examples of how the risk of regulatory, legal and consumer backlash can damage deal prospects.
Macroeconomic environment
95%see equity valuations/stock market outlook as improving or stable
Growth and portfolio strategy
38%are developing digital capabilities in-house, while 30% are buying, forming alliances or creating JVs with digital companies
97%see the global economy as improving or stable
M&A outlook
62%recognize the need to ensure they have a broader narrative to engage all stakeholders
73%review portfolios more often than once a year
50%intend to pursue acquisitions
9TMT Capital Confidence Barometer |
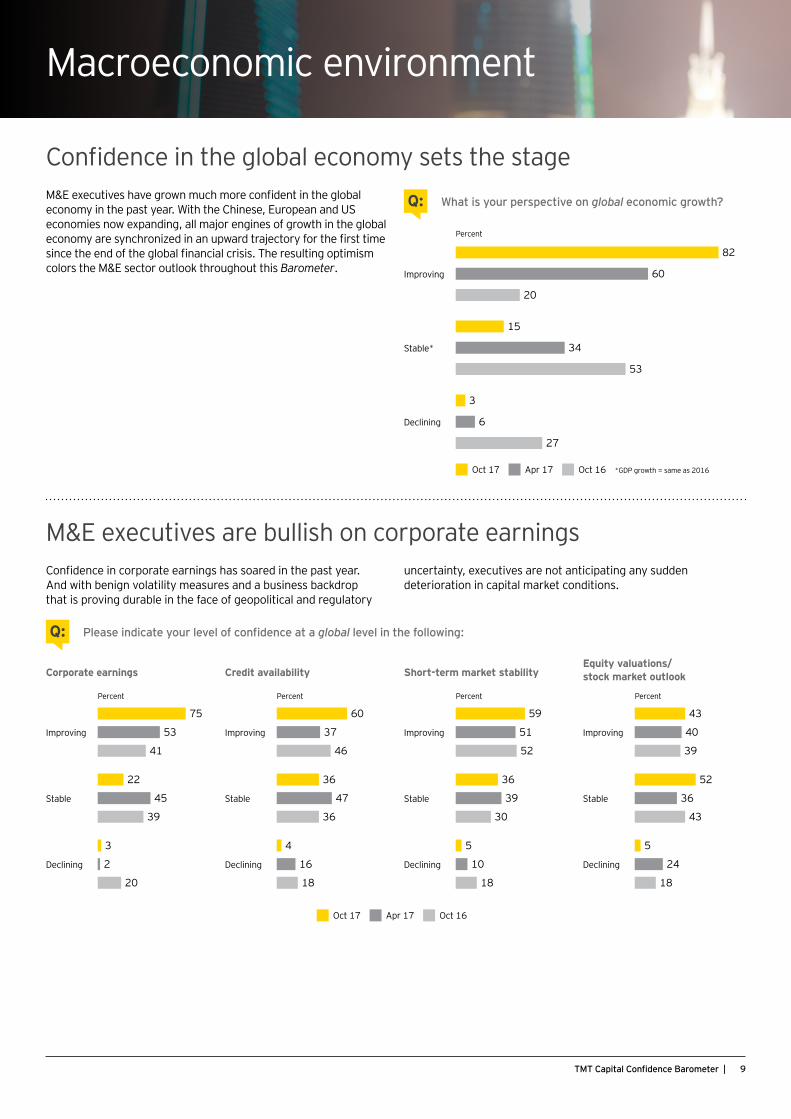
M&E executives have grown much more confident in the global economy in the past year. With the Chinese, European and US economies now expanding, all major engines of growth in the global economy are synchronized in an upward trajectory for the first time since the end of the global financial crisis. The resulting optimism colors the M&E sector outlook throughout this Barometer.
Confidence in the global economy sets the stage
Confidence in corporate earnings has soared in the past year. And with benign volatility measures and a business backdrop that is proving durable in the face of geopolitical and regulatory
uncertainty, executives are not anticipating any sudden deterioration in capital market conditions.
M&E executives are bullish on corporate earnings
Macroeconomic environment
What is your perspective on global economic growth?Q:
Please indicate your level of confidence at a global level in the following:Q:
Percent
Improving
82
60
20
Stable*
15
34
53
Declining
3
6
27
Oct 17 Apr 17 Oct 16 *GDP growth = same as 2016
82+60+20+15+34+53+3+6+27
Corporate earnings
Percent
Improving
75
53
41
Stable
22
45
39
Declining
3
2
20
Credit availability
Percent
Improving
60
37
46
Stable
36
47
36
Declining
4
16
18
Short-term market stability
Percent
Improving
59
51
52
Stable
36
39
30
Declining
5
10
18
Equity valuations/ stock market outlook
Percent
Improving
43
40
39
Stable
52
36
43
Declining
5
24
18
Oct 17 Apr 17 Oct 16
75+53+41+22+45+39+3+2+20
10 | Global Capital Confidence Barometer
M&A outlook
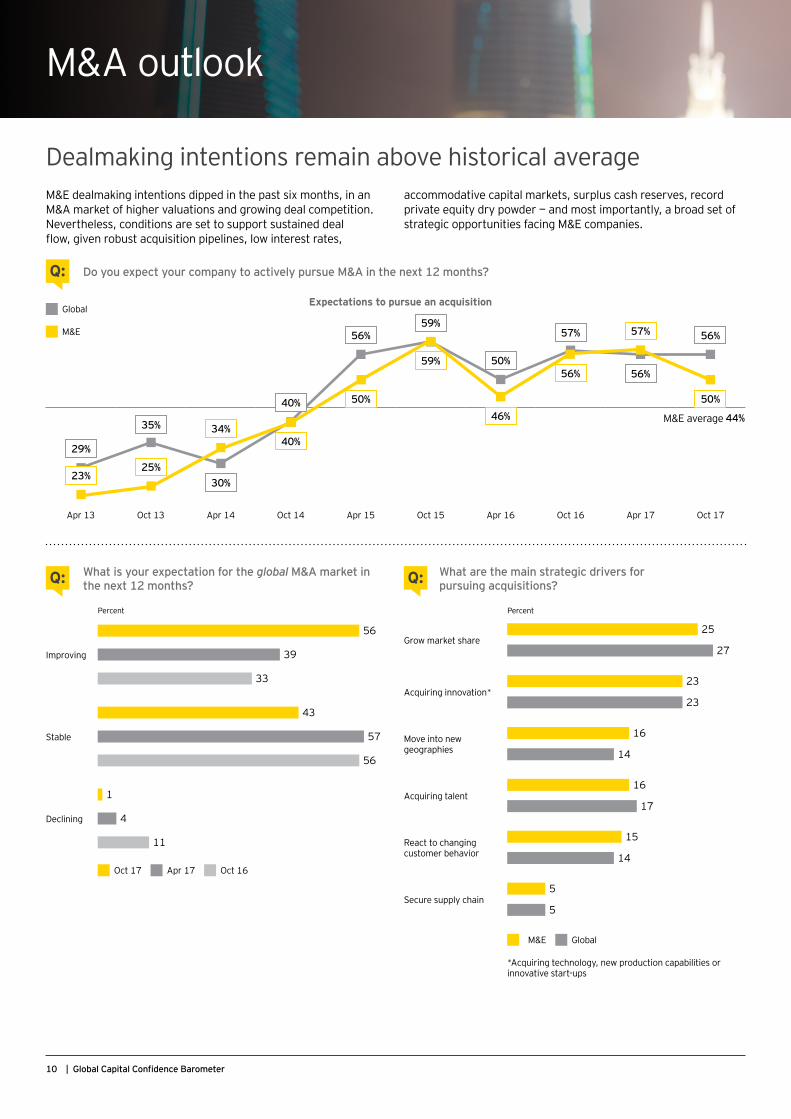
Dealmaking intentions remain above historical average
Do you expect your company to actively pursue M&A in the next 12 months?Q:
M&E dealmaking intentions dipped in the past six months, in an M&A market of higher valuations and growing deal competition. Nevertheless, conditions are set to support sustained deal flow, given robust acquisition pipelines, low interest rates,
accommodative capital markets, surplus cash reserves, record private equity dry powder — and most importantly, a broad set of strategic opportunities facing M&E companies.
What are the main strategic drivers for pursuing acquisitions? Q:What is your expectation for the global M&A market in
the next 12 months?Q:
Apr 13 Oct 13 Apr 14 Oct 14 Apr 15 Oct 15 Apr 16 Oct 16 Apr 17 Oct 17
M&E average 44%
Expectations to pursue an acquisition Global
M&E
Percent
Grow market share25
27
Acquiring innovation*23
23
Move into new geographies
16
14
Acquiring talent16
17
React to changing customer behavior
15
14
Secure supply chain5
5
M&E Global
*Acquiring technology, new production capabilities or innovative start-ups
25+27+ 23+23+ 16+14+ 16+17+ 15+14+ 5+5+ Percent
Improving
56
39
33
Stable
43
57
56
Declining
1
4
11
Oct 17 Apr 17 Oct 16
56+39+33+43+57+56+1+4+1129%
56%59%
50%
57%
56%
56%
35%
30%
40%
23%
50%
59%
46%
56%
57%
50%
25%
34%40%
28+26+19+23+4+M
11TMT Capital Confidence Barometer |
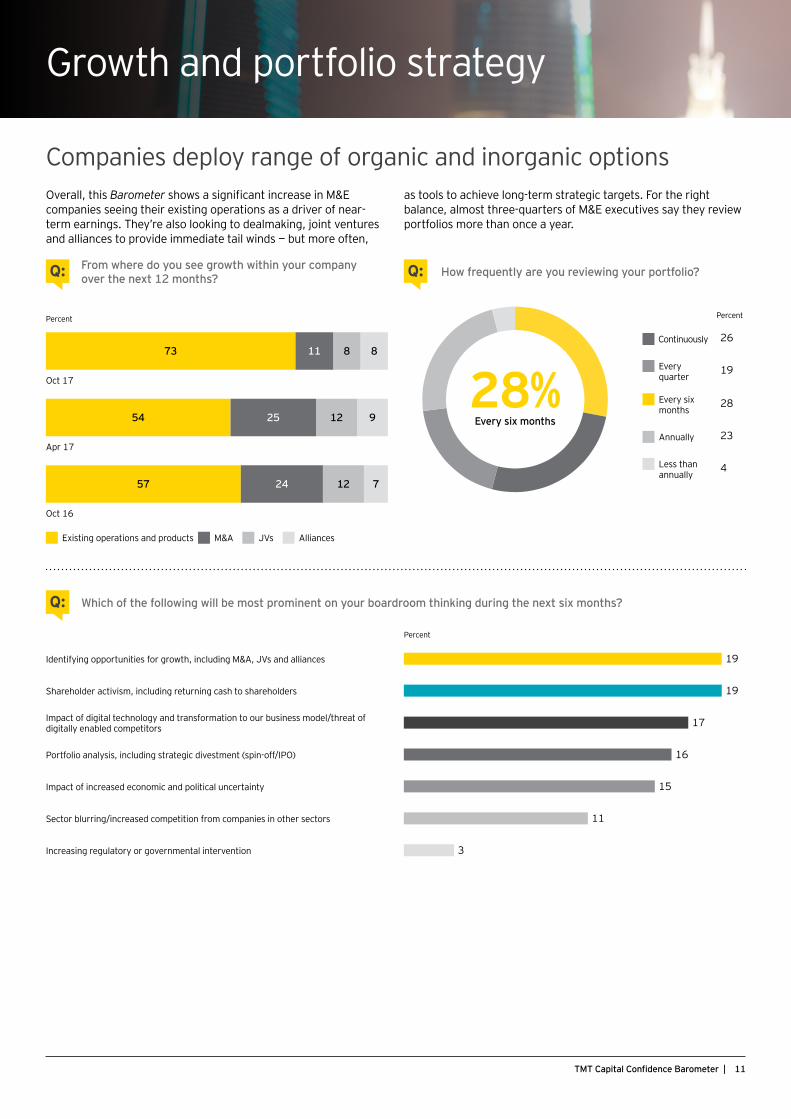
Companies deploy range of organic and inorganic optionsOverall, this Barometer shows a significant increase in M&E companies seeing their existing operations as a driver of near-term earnings. They’re also looking to dealmaking, joint ventures and alliances to provide immediate tail winds — but more often,
as tools to achieve long-term strategic targets. For the right balance, almost three-quarters of M&E executives say they review portfolios more than once a year.
From where do you see growth within your company over the next 12 months?Q:
Growth and portfolio strategy
How frequently are you reviewing your portfolio?Q:
28%Every six months
Which of the following will be most prominent on your boardroom thinking during the next six months? Q:
Percent
Continuously 26
Every quarter
19
Every six months
28
Annually 23
Less than annually
4
Percent
73 8811
Oct 17
54 91225
Apr 17
57 71224
Oct 16
Existing operations and products M&A JVs Alliances
Percent
Identifying opportunities for growth, including M&A, JVs and alliances 19
Shareholder activism, including returning cash to shareholders 19
Impact of digital technology and transformation to our business model/threat of digitally enabled competitors 17
Portfolio analysis, including strategic divestment (spin-off/IPO) 16
Impact of increased economic and political uncertainty 15
Sector blurring/increased competition from companies in other sectors 11
Increasing regulatory or governmental intervention 3
19+19+17+16+15+11+3
12 | Global Capital Confidence Barometer
Telecommunications
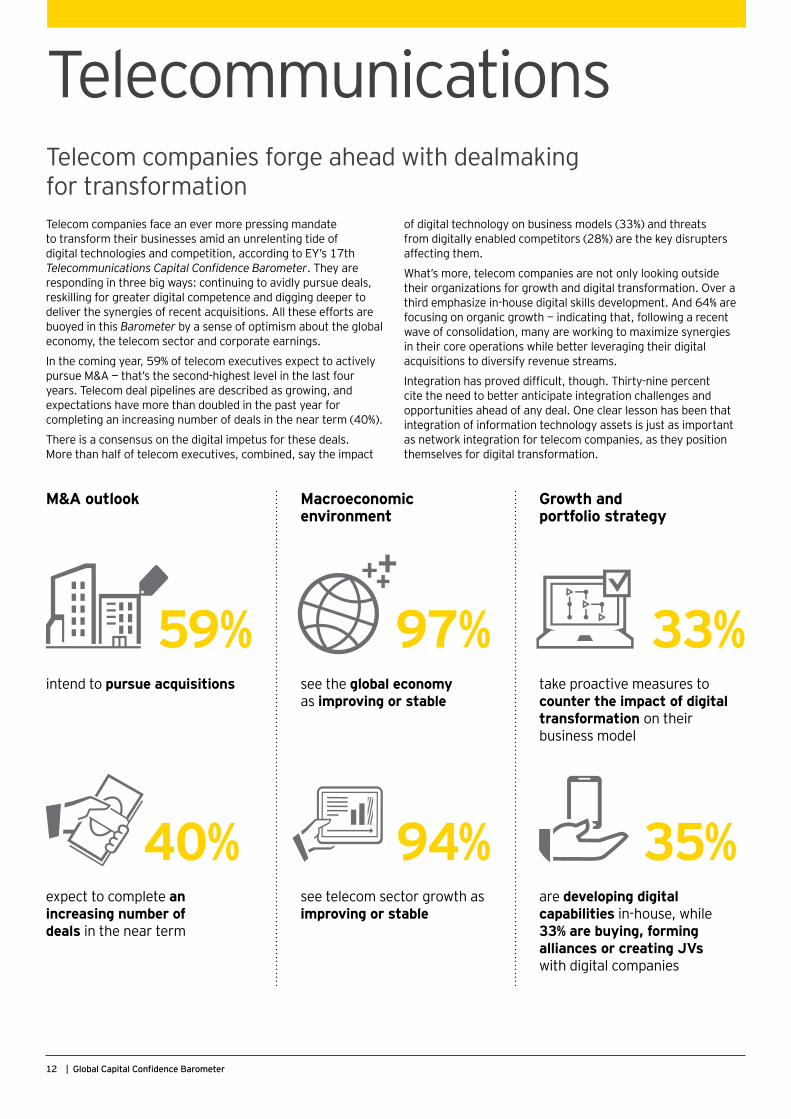
Telecom companies face an ever more pressing mandate to transform their businesses amid an unrelenting tide of digital technologies and competition, according to EY’s 17th Telecommunications Capital Confidence Barometer. They are responding in three big ways: continuing to avidly pursue deals, reskilling for greater digital competence and digging deeper to deliver the synergies of recent acquisitions. All these efforts are buoyed in this Barometer by a sense of optimism about the global economy, the telecom sector and corporate earnings.
In the coming year, 59% of telecom executives expect to actively pursue M&A — that’s the second-highest level in the last four years. Telecom deal pipelines are described as growing, and expectations have more than doubled in the past year for completing an increasing number of deals in the near term (40%).
There is a consensus on the digital impetus for these deals. More than half of telecom executives, combined, say the impact
of digital technology on business models (33%) and threats from digitally enabled competitors (28%) are the key disrupters affecting them.
What’s more, telecom companies are not only looking outside their organizations for growth and digital transformation. Over a third emphasize in-house digital skills development. And 64% are focusing on organic growth — indicating that, following a recent wave of consolidation, many are working to maximize synergies in their core operations while better leveraging their digital acquisitions to diversify revenue streams.
Integration has proved difficult, though. Thirty-nine percent cite the need to better anticipate integration challenges and opportunities ahead of any deal. One clear lesson has been that integration of information technology assets is just as important as network integration for telecom companies, as they position themselves for digital transformation.
Telecom companies forge ahead with dealmaking for transformation
Macroeconomic environment
Growth and portfolio strategy
M&A outlook
94%see telecom sector growth as improving or stable
35%are developing digital capabilities in-house, while 33% are buying, forming alliances or creating JVs with digital companies
97%see the global economy as improving or stable
40%expect to complete an increasing number of deals in the near term
33%take proactive measures to counter the impact of digital transformation on their business model
59%intend to pursue acquisitions
13TMT Capital Confidence Barometer |
Digital transformation
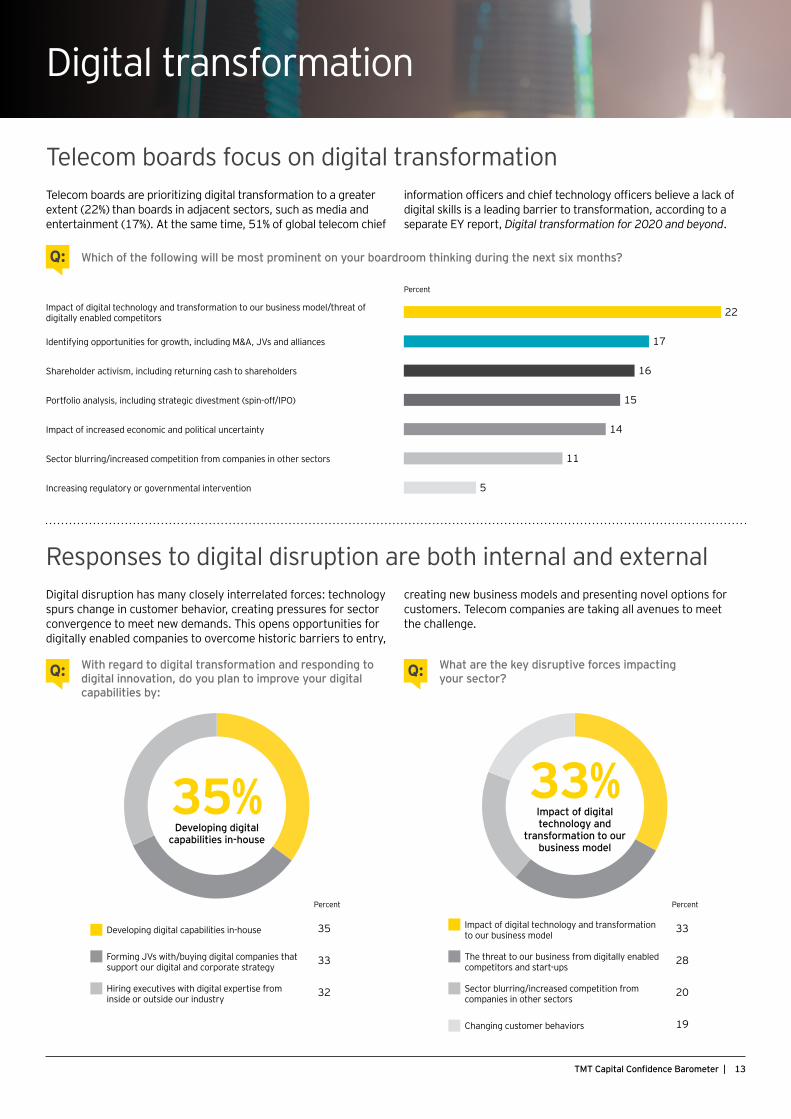
Telecom boards are prioritizing digital transformation to a greater extent (22%) than boards in adjacent sectors, such as media and entertainment (17%). At the same time, 51% of global telecom chief
information officers and chief technology officers believe a lack of digital skills is a leading barrier to transformation, according to a separate EY report, Digital transformation for 2020 and beyond.
Telecom boards focus on digital transformation
Which of the following will be most prominent on your boardroom thinking during the next six months? Q:
What are the key disruptive forces impacting your sector?Q:With regard to digital transformation and responding to
digital innovation, do you plan to improve your digital capabilities by:
Q:
Responses to digital disruption are both internal and externalDigital disruption has many closely interrelated forces: technology spurs change in customer behavior, creating pressures for sector convergence to meet new demands. This opens opportunities for digitally enabled companies to overcome historic barriers to entry,
creating new business models and presenting novel options for customers. Telecom companies are taking all avenues to meet the challenge.
35+33+32+M35%Developing digital
capabilities in-house 33+28+20+19+M33%Impact of digital technology and
transformation to our business model
Percent
Impact of digital technology and transformation to our business model/threat of digitally enabled competitors 22
Identifying opportunities for growth, including M&A, JVs and alliances 17
Shareholder activism, including returning cash to shareholders 16
Portfolio analysis, including strategic divestment (spin-off/IPO) 15
Impact of increased economic and political uncertainty 14
Sector blurring/increased competition from companies in other sectors 11
Increasing regulatory or governmental intervention 5
22+17+16+15+14+11+5Percent
Developing digital capabilities in-house 35
Forming JVs with/buying digital companies that support our digital and corporate strategy
33
Hiring executives with digital expertise from inside or outside our industry
32
Percent
Impact of digital technology and transformation to our business model
33
The threat to our business from digitally enabled competitors and start-ups
28
Sector blurring/increased competition from companies in other sectors
20
Changing customer behaviors 19
14 | Global Capital Confidence Barometer
M&A outlook
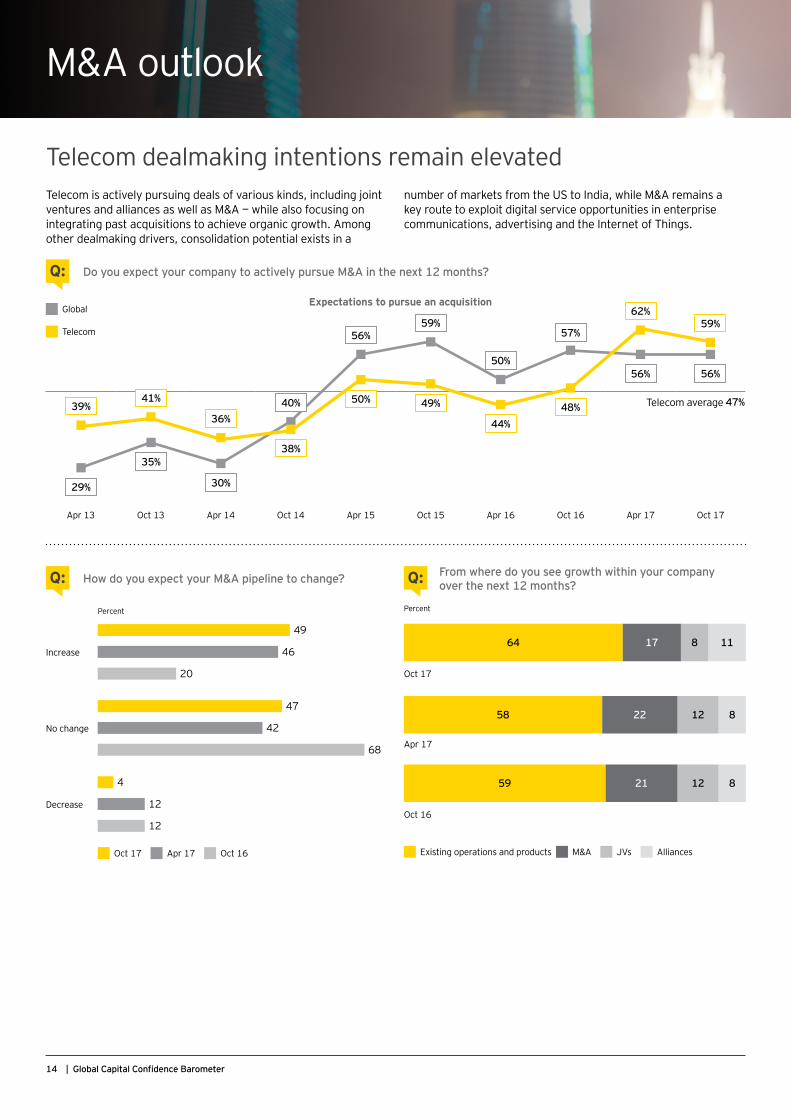
Telecom dealmaking intentions remain elevated
Do you expect your company to actively pursue M&A in the next 12 months?Q:
Telecom is actively pursuing deals of various kinds, including joint ventures and alliances as well as M&A — while also focusing on integrating past acquisitions to achieve organic growth. Among other dealmaking drivers, consolidation potential exists in a
number of markets from the US to India, while M&A remains a key route to exploit digital service opportunities in enterprise communications, advertising and the Internet of Things.
How do you expect your M&A pipeline to change?Q: From where do you see growth within your company over the next 12 months?Q:
Apr 13 Oct 13 Apr 14 Oct 14 Apr 15 Oct 15 Apr 16 Oct 16 Apr 17 Oct 17
Telecom average 47%
Expectations to pursue an acquisition Global
Telecom
Percent
Increase
49
46
20
No change
47
42
68
Decrease
4
12
12
Oct 17 Apr 17 Oct 16
49+46+20+47+42+68+4+12+12 Percent
64 11817
Oct 17
58 81222
Apr 17
59 81221
Oct 16
Existing operations and products M&A JVs Alliances
29%
56%59%
50%
57%
56% 56%
35%
30%
40%39%50% 49%
44%48%
62%59%
41%
36%
38%
64+30+6+M
15TMT Capital Confidence Barometer |
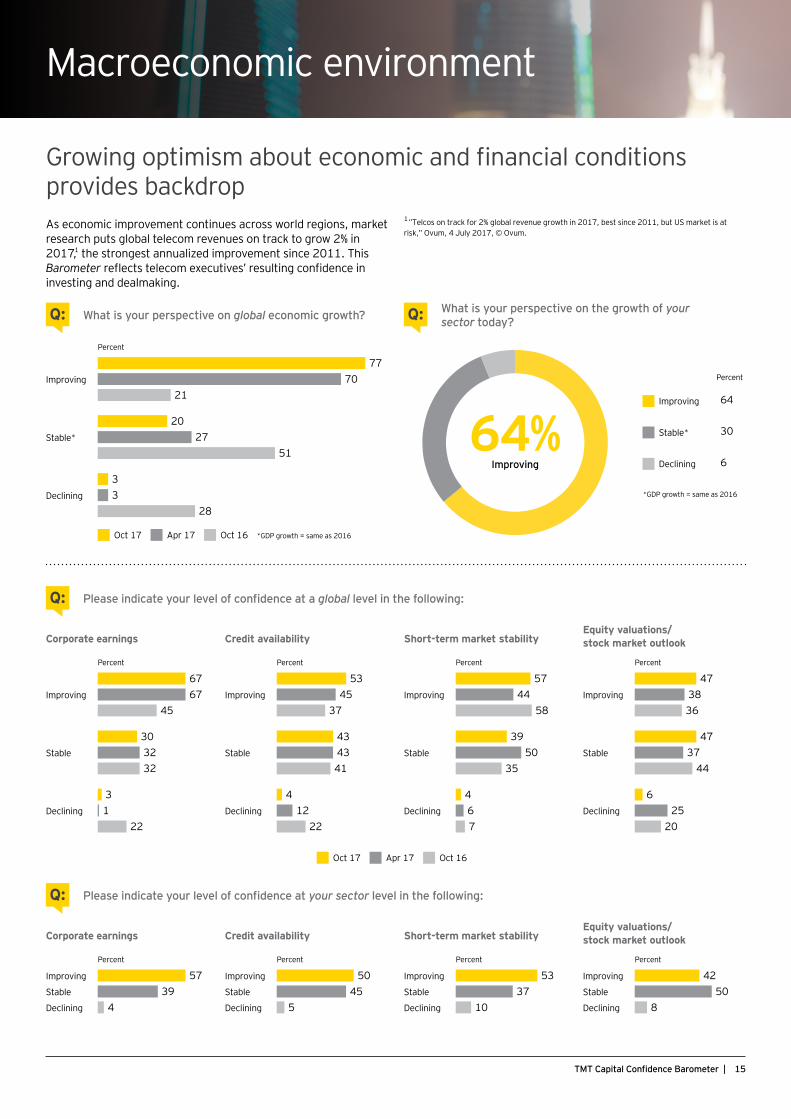
Macroeconomic environment
Growing optimism about economic and financial conditions provides backdropAs economic improvement continues across world regions, market research puts global telecom revenues on track to grow 2% in 20171, the strongest annualized improvement since 2011. This Barometer reflects telecom executives’ resulting confidence in investing and dealmaking.
What is your perspective on global economic growth?Q: What is your perspective on the growth of your sector today?Q:
64%Improving
Please indicate your level of confidence at a global level in the following:Q:
Please indicate your level of confidence at your sector level in the following:Q:
1”Telcos on track for 2% global revenue growth in 2017, best since 2011, but US market is at risk,” Ovum, 4 July 2017, © Ovum.
Percent
Improving
7770
21
Stable*
2027
51
Declining
33
28
Oct 17 Apr 17 Oct 16 *GDP growth = same as 2016
77+70+21+20+27+51+3+3+28Percent
Improving 64
Stable* 30
Declining 6
*GDP growth = same as 2016
Corporate earnings
Percent
Improving
6767
45
Stable
303232
Declining
31
22
Corporate earnings
Percent
Improving 57Stable 39Declining 4
Credit availability
Percent
Improving
5345
37
Stable
434341
Declining
412
22
Credit availability
Percent
Improving 50Stable 45Declining 5
Short-term market stability
Percent
Improving
5744
58
Stable
3950
35
Declining
467
Short-term market stability
Percent
Improving 53Stable 37Declining 10
Equity valuations/ stock market outlook
Percent
Improving
473836
Stable
4737
44
Declining
625
20
Equity valuations/ stock market outlook
Percent
Improving 42Stable 50Declining 8
Oct 17 Apr 17 Oct 16
67+67+45+30+32+32+3+1+2257+39+4+
EY | Assurance | Tax | Transactions | Advisory
About EYEY is a global leader in assurance, tax, transaction and advisory services. The insights and quality services we deliver help build trust and confidence in the capital markets and in economies the world over. We develop outstanding leaders who team to deliver on our promises to all of our stakeholders. In so doing, we play a critical role in building a better working world for our people, for our clients and for our communities.
EY refers to the global organization, and may refer to one or more, of the member firms of Ernst & Young Global Limited, each of which is a separate legal entity. Ernst & Young Global Limited, a UK company limited by guarantee, does not provide services to clients. For more information about our organization, please visit ey.com.
About EY’s Transaction Advisory ServicesHow you manage your Capital Agenda today will define your competitive position tomorrow. We work with clients to create social and economic value by helping them make better, more-informed decisions about strategically managing capital and transactions in fast-changing markets. Whether you’re preserving, optimizing, raising or investing capital, EY’s Transaction Advisory Services combine a set of skills, insight and experience to deliver focused advice. We can help you drive competitive advantage and increased returns through improved decisions across all aspects of your Capital Agenda.
© 2017 EYGM Limited. All Rights Reserved.
EYG no. 06878-174Gbl
1709-2410424
ED NoneThis material has been prepared for general informational purposes only and is not intended to be relied upon as accounting, tax or other professional advice. Please refer to your advisors for specific advice.
ey.com/ccb
About the surveyThe Global Capital Confidence Barometer gauges corporate confidence in the economic outlook and identifies boardroom trends and practices in the way companies manage their Capital Agendas — the EY framework for strategically managing capital. It is a regular survey of senior executives from large companies around the world, conducted by Euromoney Institutional Investor Thought Leadership (EIITL). Our panel comprises select global EY clients and contacts and regular EIITL contributors.
• In September and October, we surveyed a panel of almost 3,000 executives in 43 countries; 63% were CEOs, CFOs and other C-level executives.
• Respondents represented 14 sectors, including financial services; consumer products and retail; technology; life sciences; automotive and transportation; oil and gas; power and utilities; mining and metals; industrials; and real estate, hospitality and construction.
• In this survey, 621 respondents were from TMT companies, of which 64% were C-level executives.
• Surveyed TMT companies’ annual global revenues were as follows: less than US$500m (32%); US$500m–US$999.9m (26%); US$1b–US$2.9b (17%); US$3b–US$4.9b (7%); and greater than US$5b (18%).
• TMT company ownership was as follows: publicly listed (62%), privately owned (35%), family-owned (2%) and government-/state-owned (1%).
TMT contactsTechnologyKen WelterEY Global Technology Sector Leader Transaction Advisory Services [email protected]
Nina LapachetEY Global Technology Resident Transaction Advisory Services [email protected]
Media & EntertainmentWill FisherEY Global Media & Entertainment Sector Leader Transaction Advisory Services [email protected]
John HarrisonEY Global Media & Entertainment Leader [email protected]
TelecommunicationsAxel MajertEY Global Telecommunications Sector Leader Transaction Advisory Services [email protected]
Adrian BaschnongaEY Global Telecommunications Lead Analyst [email protected]