Embed Size (px)
Citation preview
I N S I G H T S
Can Growth Form Classification Predict Litter Nutrient Dynamics and DecompositionRates in Lowland Wet Forest?
Louis S. Santiago1
Department of Botany & Plant Sciences and Center for Conservation Biology, University of California, 2150 Batchelor Hall, Riverside,
CA 92521, U.S.A.
ABSTRACT
This study investigates whether it is possible to simplify the complex influence of numerous species on leaf litter decomposition in a diverse tropical forest usingfunctional classifications to predict litter quality, decomposition rate, and nutrient dynamics during decomposition, over a 2-yr period. Thirty-three lowland tropicalforest plant species from contrasting growth forms (canopy trees, pioneer trees, lianas, palms, herbs) were studied. Twelve of 18 indices of litter quality varied sig-nificantly among growth forms, with canopy trees and palms showing lower litter quality than pioneer trees and herbs. Canopy leaves decomposed more slowly thanunderstory leaves. Decomposition rate and mass loss trended greater (Po 0.1) in herbs and pioneer trees compared with other growth forms. There were no significantdifferences between monocots and dicots, and no phylogenetic signal for decomposition was observed. Significant correlations between continuous litter qualityvariables and decomposition rate were observed with correlation coefficients up to 0.72. Litter lignin:Mg, P concentration, and lignin:K, were the litter quality variablesmost related to decomposition rate. All elements showed significant negative correlations between initial litter concentration and percent remaining, but many elementsshowed significant correlation between percent element remaining and initial concentrations of other elements, indicating a stoichiometric balance between theseelements during decomposition. The results show that although classification by growth form and canopy position are helpful for considering the ecosystem impli-cations of changing community composition, litter quality traits provide additional predictive power for estimating the effects of species change on decomposition.
Abstract in Spanish is available at http://www.blackwell-synergy.com/loi/btp
Key words: canopy position; lianas; nitrogen; Panama; phosphorus; potassium; understory herbs; wet tropical forest.
LEAF LITTER DECOMPOSITION is a major pathway by which terrestrial
vegetation modifies the soil environment (Swift et al. 1979, Ander-
son & Swift 1983), and represents one of the best examples of the
effects of species on ecosystem processes (Hobbie 1992, Eviner &
Chapin 2003, Dıaz et al. 2004). The carbon dioxide evolved fromleaf litter decomposition is a major flux in the global carbon cycle
(Schlesinger 1991), yet questions remain regarding how changes in
species composition, caused by land-use decisions, disturbance, or
climate change, are manifested at the ecosystem scale (Santiago &
Mulkey 2005). Simplifying the complex influence of numerous
species on leaf litter decomposition would therefore improve our
ability to predict the effects of vegetation change on ecosystem pro-
cesses. This study investigates variation in decomposition rates oflowland tropical forest plant species from a broad array of growth
forms.
Decomposition studies across a range of biomes suggest that
functional classification of plant species has the potential to im-
prove our ability to predict how species composition affects decom-
position and nutrient cycling (Cornwell et al. 2008). For example,
in a wide range of temperate plant species, growth form identity
and degree of deciduousness explained part of the variability ofmass loss among species (Cornelissen 1996, Cornelissen & Thomp-
son 1997). In Alaskan tundra, species within a growth form were
more similar in decomposition rates than species belonging to
different growth forms (Hobbie 1996), and in temperate fens and
bogs, variation in nutrient use efficiency and litter chemistry among
grasses, mosses, and shrubs, were shown to control decomposition
rate and nutrient dynamics during decomposition (Aerts et al.1999). Furthermore, invasive species have been shown to decom-
pose more rapidly than native species in Hawaiian montane forests
(Allison & Vitousek 2004). Finally, a recent global analysis of vari-ation in leaf litter quality and decomposition among 818 species
demonstrates that growth form can have strong effects on decom-
position and soil processes, and that groups of species with similar
leaf characteristics, such as specific leaf area (SLA) and leaf nitrogen
concentration, often produce litter with consistent decomposition
properties (Cornwell et al. 2008). These results suggest that func-
tional classification has the potential to cluster the wide assortment
of species into units that are more manageable for predicting theeffects of vegetation change on nutrient cycling processes.
Although growth forms represent a convenient type of func-
tional classification, there is some evidence that variation in decom-
position may be the result of evolutionary divergences in leaf types
from deep within the phylogeny of plants. For example, in Hawai-
ian montane forests, decomposition rates of angiosperms and ferns
are correlated with different indices of litter chemistry (Amatangelo
& Vitousek 2009). In a global analysis of decomposition, ferns,bryophytes, gymnosperms, and monocots, were all shown to de-
compose more slowly than dicots (Cornwell et al. 2008). Differ-
ences in leaf structure between monocots and dicots in tropical
forest are especially apparent, suggesting that contrasting venation
patterns and support structures could cause dissimilar decomposi-
tion dynamics. Additionally, it is known that certain chemicals that
have the potential to influence palatability to herbivores and possi-
bly decomposers (Grime et al. 1996), are prevalent in specificReceived 24 January 2009; revision accepted 3 September 2009.1Corresponding author; e-mail: [email protected]
BIOTROPICA 42(1): 72–79 2010 10.1111/j.1744-7429.2009.00604.x
72 r 2009 The Author(s)
Journal compilation r 2009 by The Association for Tropical Biology and Conservation
taxonomic groups (Judd et al. 2002). Thus if closely related species
tend to have similar decomposition rates, there could be a phylo-
genetic signal to decomposition that functions somewhat indepen-
dently of growth form, but that also may reduce the complexities ofhigh species diversity into clades that have some predictive power
for nutrient cycling.
An alternative approach to predicting decomposition among
many species involves using continuous characters such as litter
chemical composition, or litter quality, which is recognized as an
important factor controlling litter decomposition rates (Swift et al.1979, Melillo et al. 1982, Anderson & Swift 1983, Gholz et al.2000). Continuous characteristics of live leaves, especially those re-lated to SLA and leaf nitrogen concentration have also been used to
predict decomposition (Cornelissen & Thompson 1997, Santiago
2007, Cornwell et al. 2008). Species tend to vary along a spectrum
from leaves with low nutrient concentration and relatively high
concentrations of recalcitrant compounds that decompose slowly,
delaying the release of nutrients to plants and microbes, to thinner
leaves with greater concentrations of nutrients and less structural
deterrents to decomposing organisms that decompose more rapidly(Chapin 1980, Santiago 2007). In tropical forests, light availability
is a major factor that determines leaf structure (Chazdon et al.1996), with understory species and early successional species exhib-
iting thinner leaves relative to late successional canopy tree species
(Lusk et al. 2008). Therefore, continuous leaf and litter character-
istics related to canopy position may determine where species fall
on the spectrum of high to low decomposition rates.
The purpose of this study was to determine the extent to whichdecomposition in a wet tropical forest in Panama is regulated by
growth form identity and variation in leaf litter quality. Specific
questions included: (1) Do key litter quality characteristics, dynam-
ics of mass loss, or element concentration during decomposition,
vary among growth forms? (2) Do species of contrasting phylo-
genetic groups or canopy position vary in their decomposition
dynamics? (3) How well do continuous litter quality traits predict
decomposition?
METHODS
STUDY SITE AND SPECIES.—The study was conducted in lowland
tropical forest in San Lorenzo National Park on the Caribbean coast
of Central Panama (91170 N, 791580 W). Mean annual precipita-
tion is 3100 mm with a mild dry season from January to March in
which ca 10 percent of annual precipitation falls (Paton & Wright2009). Mean annual temperature is 261C with minimal variation
among months and mean relative humidity is ca 95 percent (Paton
& Wright 2009). The vegetation is old growth lowland tropical
forest located on a plateau 140 m asl and 5 km from the Caribbean
coast. The site contains a canopy crane maintained by the Smith-
sonian Tropical Research Institute, and a 6-ha forest dynamics plot
administered by the Center for Tropical Forest Science in which all
stems Z1 cm diam. have been measured, mapped, and identified tospecies. This study was conducted in the canopy crane plot, a 1-ha
subplot containing 169 species of plants with a stem diam. Z1 cm
(S. Lao, pers. comm.). Thirty-three plant species that represent a
broad selection of growth forms including canopy and pioneer
trees, lianas, understory herbs, palms, and shrubs, were selected for
study (Table S1). An attempt was made to include as many growth
forms as possible from species common enough that 3–12 individ-uals could be sampled.
Five growth forms were distinguished: canopy trees, pioneer
trees, lianas, palms, and understory herbs (Table S1). Prior work
indicates that regeneration requirements vary continuously among
canopy tree species in central Panama with most species occupying
intermediate positions along a continuum of light requirements for
regeneration (Gilbert et al. 2006). Therefore, pioneer trees were
distinguished from canopy trees as the most light-demanding trees(Wright et al. 2003). Lianas were defined as woody vines that rely
on other species for structural support, palms were defined as spe-
cies in the family Arecaceae, and herbs represent the shade-tolerant
herbaceous component of the plant community. Litter sampling
was restricted to individuals of the maximum height that each spe-
cies commonly attains, and litter samples were collected from the
most exposed leaves of each individual to minimize within-plant
variation in leaf morphology (Westoby 1998). To control for theeffects of light availability, tree and liana leaf litter were always col-
lected from shoots in full sun, and understory plant leaf litter was
always collected in heavily shaded conditions.
LITTER COLLECTION AND DECOMPOSITION.—Leaf litter was collected
during the dry season, between January and March 2001, when
many species shed or exchange leaves. I accessed the canopy with a
52-m-tall construction crane equipped with a gondola. Senescentleaves were collected by hand from 3–12 individuals of per species.
Entire leaves with complete discoloration were gently shaken and
harvested only if they came off the plant with a light touch, indi-
cating a well-formed abscission zone (Austin & Vitousek 2000).
Palm fronds and monocot herb leaves remain on the plant for sev-
eral months after retranslocation, so the most recent senescing leaf
or frond that had no remaining green pigmentation was selected.
Leaves were air dried in an air-conditioned laboratory (45%RH and 241C) for 4 1 mo. Three grams (� 0.2 SE) of litter from
each species were placed in 1� 1 mm mesh nylon-covered fiber-
glass window screen. Leaves of several species can weigh 4 3 g and
for these species one entire leaf was placed in each bag. For palms, a
leaflet was separated from the rachis and treated as a leaf. Four sizes
of litterbags: 10� 10, 10� 30, 20� 20 and 30� 30 cm were used
to accommodate different leaf sizes, minimize folding, and stan-
dardize packing density. Litterbags were heat-sealed with a dry ironand placed in the field on the litter layer surface on March 30, 2001,
about 1 month before the beginning of the rainy season that year.
The bags were placed in a flat area with dense canopy coverage,
characteristic of mature forest. Litterbags were tied together with
monofilament line staked to the soil. Approximately 10 cm sepa-
rated individual litterbags. Ten grams of litter from each species was
set aside for initial litter quality chemical analyses. A 1-g subsample
was dried at 651C for 48 h so that initial masses of litter placed inthe field could be normalized to oven dry mass.
At 1, 3, 6, 15, and 24 mo, five bags per species were collected
from the field. Bags were gently rinsed with distilled water to
Decomposition in Wet Tropical Forest 73
remove adhered soil particles and any roots that had grown into the
bags were removed before weighing. A subsample of each species
was weighed fresh for moisture content, while the rest of the bags
were placed in a freezer overnight. The contents of each litterbagwere then dried for 48 h at 651C and weighed to determine mass
remaining. Litter mass remaining (mr) was calculated as
mr ¼mf
m0 � ðm0ðfcÞÞ100%; ð1Þ
where mf is the dry mass of litter harvested from the field, m0 is the
initial mass of litter before being placed in the field and fc is thefactor for correcting air-dried litter to litter dried at 651C (approx-
imately 0.07).
INITIAL LITTER QUALITY.—A subsample of litter from each specieswas dried for 48 h at 651C in preparation for the determination of
initial litter quality. Carbon fraction analyses were performed using
a series of increasingly aggressive extractants (Ryan et al. 1989).
Dried litter samples were digested in a detergent solution, which
separated non-polar extractives (NPE, cell contents) from neutral
detergent fiber (NDF), which includes cell wall constituents and
fractions that are not immediately nutritionally available. A dilute
acid detergent solution was then used to determine acid detergentfiber (ADF, lignocellulose) before lignin was separated from cellu-
lose in 72 percent H2SO4. A separate subsample was analyzed for
C and N using an elemental analyzer (Carlo Erba, Milano, Italy).
Litter P, K, Ca, and Mg were determined using inductively coupled
plasma emission spectroscopy (ICP) with EPA method 200.7.
NUTRIENT DYNAMICS.—Litter samples recovered from the field after
24 mo were ground in a Wiley mill through a 40 size mesh afterdrying as described above. Concentrations of C, N, P, K, Ca, and
Mg, remaining or accumulating in litter after 24 mo were deter-
mined as described for initial litter samples. Percent element re-
maining was determined by dividing the final concentration of each
element by the concentration of that element in the initial litter
sample.
DATA ANALYSIS.—Decomposition rate constants (k) were calculatedusing the single exponential decay model (Olson 1963):
Wt ¼ W0e�kt ; ð2Þ
where Wt and W0 are litter masses at time t and time 0, respectively,
k is the decomposition constant (in/yr) and t is time (in yr).
Data were tested for normality and equality of variance and,
when necessary, were loge-transformed before analysis. Eleven of 18litter quality indices, mass remaining at 1, 3, and 6 mo, k, and per-
cent C, N, P, and K remaining in litter after 24 mo, needed to be
loge-transformed to meet assumptions of normality. One-way anal-
ysis of variance (ANOVA) was used to compare litter quality, mass
remaining, k, and percent element remaining in litter after 24 mo,
among growth forms, and k between phylogenetic groups (mono-
cot vs. dicot) and canopy position (canopy vs. understory). Differ-
ences among growth forms were analyzed with a posthoc Duncan’smultiple range test. Relationships between litter quality and
decomposition, and percent element remaining, were assessed
using Pearson correlation. All analyses were performed using SAS
version 9.1.
To investigate whether decomposition shows phylogenetic sig-nal, a tree of all study species was constructed using Phylomatic
(http://phylodiversity.net/phylomatic/phylomatic.html), based on
the Angiosperm consensus tree (Davies et al. 2004). Phylogenetic
signal was tested using a randomization procedure in Phylocom
3.41 (Webb et al. 2007), which tests whether related species tend to
have similar values for decomposition which would be interpreted
as phylogenetic signal (Blomberg et al. 2003).
RESULTS
Mean moisture content of air-dried leaf litter placed in the field was
7.1 percent by weight. After 1 mo in the field, mean moisture con-
tent increased to 23.8 percent and after 3 mo, stabilized at ca 75
percent for the rest of the study. Decomposition patterns for most
species showed standard exponential decay curves and decomposi-
tion rate varied by more than a factor of 10 from a minimumof 0.41/yr in the canopy tree Vochysia ferruginea to a maximum
of 4.58/yr in the pioneer tree Piper hispidum (Table S1). Mass re-
maining after 24 mo varied by a factor of 35 and ranged from
1.7 to 60.1 percent in P. hispidum and V. ferruginea, respectively
(Table S1).
Among indices of decomposition, SLA was significantly great-
er in herbs and pioneer trees than palms, lianas, and canopy trees
(Table 1). Comparisons of litter element concentrations showedthat C was significantly lower in herbs compared canopy trees, with
other growth forms at intermediate values (Table 1). Litter P was
significantly greater in herbs and pioneer trees compared with other
growth forms, whereas litter K was significantly greater in herbs and
pioneer trees compared with canopy trees, with lianas and palms
showing intermediate values (Table 1). Litter Ca was significantly
lower in palms compared with most other forms, and litter C:P was
greatest in canopy trees, followed by lianas and palms, with pioneertrees and herbs having the lowest values (Table 1). Litter N, Mg,
and C:N showed no significant variation among growth forms
(P4 0.05; data not shown).
Among litter carbon fractions, cellulose, ADF, and NDF were
greater in monocot growth forms: herbs and palms (Table 1). Litter
lignin:P, lignin:K, and lignin:Ca tended to be greater in canopy
trees and palms over other growth forms (Table 1). Litter lignin,
lignin:N, and lignin:Mg were statistically indistinguishable amonggrowth forms (P4 0.05; data not shown).
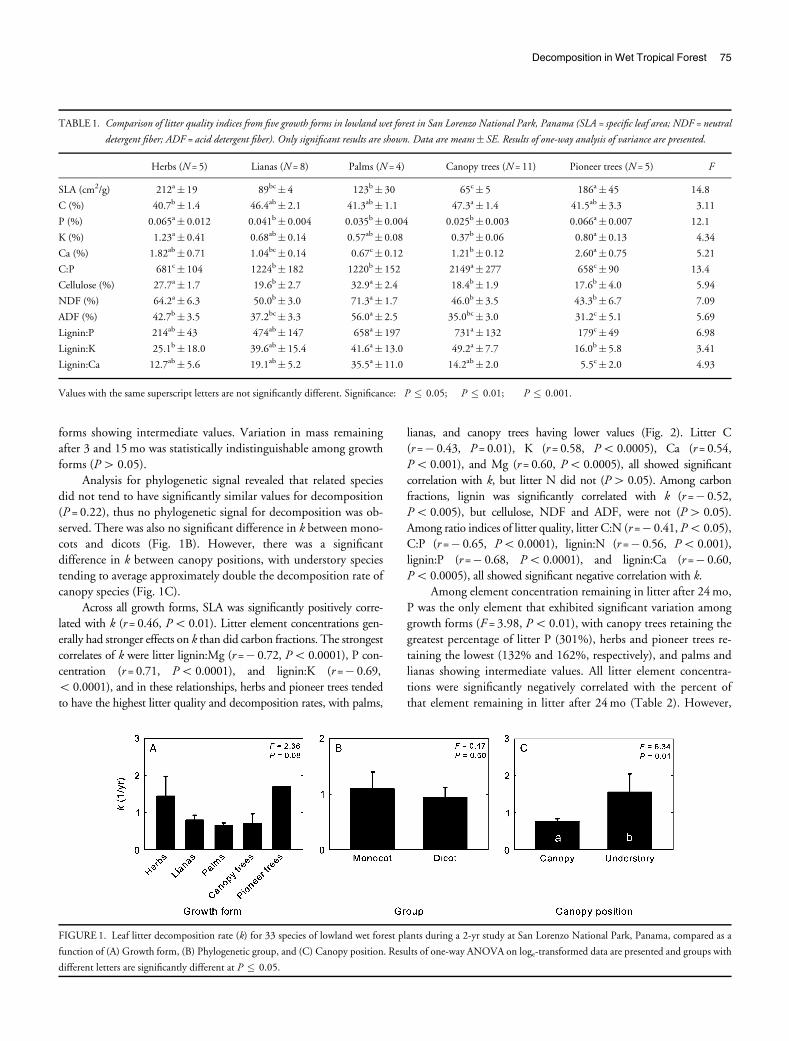
Decomposition rate (k) showed marginally significant differ-
ences among growth forms (Fig. 1A), with herbs and pioneer trees
showing trends of greater decomposition rates. Mass remaining also
showed marginally significant variation among growth forms after
1 mo (F = 2.41, P = 0.07) and after 6 mo (F = 2.51, P = 0.06), as
canopy trees and palms retained significantly more mass than pio-
neer trees, with herbs and lianas showing intermediate values. Massremaining after 24 mo also showed marginally significant variation
among growth forms (F = 2.40, P = 0.07), with canopy trees retain-
ing the greatest mass, herbs retaining the lowest, and other growth
74 Santiago
forms showing intermediate values. Variation in mass remaining
after 3 and 15 mo was statistically indistinguishable among growth
forms (P4 0.05).
Analysis for phylogenetic signal revealed that related species
did not tend to have significantly similar values for decomposition
(P = 0.22), thus no phylogenetic signal for decomposition was ob-
served. There was also no significant difference in k between mono-cots and dicots (Fig. 1B). However, there was a significant
difference in k between canopy positions, with understory species
tending to average approximately double the decomposition rate of
canopy species (Fig. 1C).
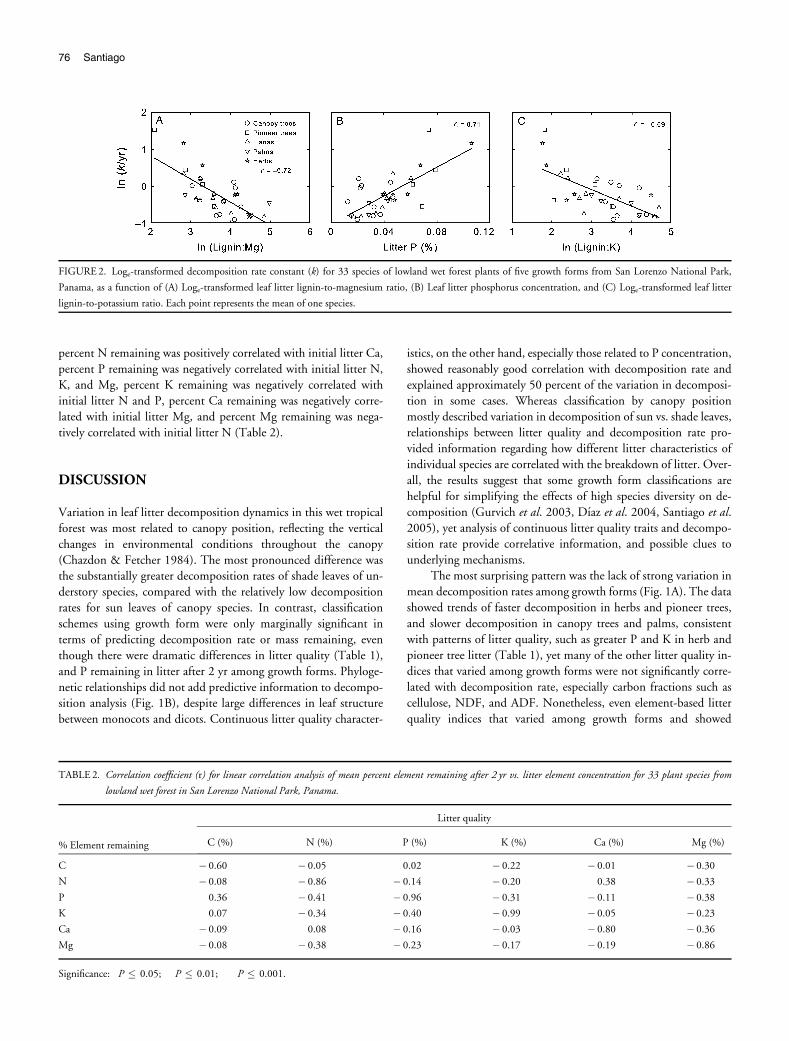
Across all growth forms, SLA was significantly positively corre-
lated with k (r = 0.46, Po 0.01). Litter element concentrations gen-
erally had stronger effects on k than did carbon fractions. The strongest
correlates of k were litter lignin:Mg (r =� 0.72, Po 0.0001), P con-centration (r = 0.71, Po 0.0001), and lignin:K (r =� 0.69,
o 0.0001), and in these relationships, herbs and pioneer trees tended
to have the highest litter quality and decomposition rates, with palms,
lianas, and canopy trees having lower values (Fig. 2). Litter C
(r =� 0.43, P = 0.01), K (r = 0.58, Po 0.0005), Ca (r = 0.54,
Po 0.001), and Mg (r = 0.60, Po 0.0005), all showed significant
correlation with k, but litter N did not (P4 0.05). Among carbon
fractions, lignin was significantly correlated with k (r =� 0.52,
Po 0.005), but cellulose, NDF and ADF, were not (P4 0.05).
Among ratio indices of litter quality, litter C:N (r =� 0.41, Po 0.05),C:P (r =� 0.65, Po 0.0001), lignin:N (r =� 0.56, Po 0.001),
lignin:P (r =� 0.68, Po 0.0001), and lignin:Ca (r =� 0.60,
Po 0.0005), all showed significant negative correlation with k.
Among element concentration remaining in litter after 24 mo,
P was the only element that exhibited significant variation among
growth forms (F = 3.98, Po 0.01), with canopy trees retaining the
greatest percentage of litter P (301%), herbs and pioneer trees re-
taining the lowest (132% and 162%, respectively), and palms andlianas showing intermediate values. All litter element concentra-
tions were significantly negatively correlated with the percent of
that element remaining in litter after 24 mo (Table 2). However,
TABLE 1. Comparison of litter quality indices from five growth forms in lowland wet forest in San Lorenzo National Park, Panama (SLA = specific leaf area; NDF = neutral
detergent fiber; ADF = acid detergent fiber). Only significant results are shown. Data are means� SE. Results of one-way analysis of variance are presented.
Herbs (N = 5) Lianas (N = 8) Palms (N = 4) Canopy trees (N = 11) Pioneer trees (N = 5) F
SLA (cm2/g) 212a� 19 89bc� 4 123b� 30 65c� 5 186a� 45 14.8���
C (%) 40.7b� 1.4 46.4ab� 2.1 41.3ab� 1.1 47.3a� 1.4 41.5ab� 3.3 3.11�
P (%) 0.065a� 0.012 0.041b� 0.004 0.035b� 0.004 0.025b� 0.003 0.066a� 0.007 12.1���
K (%) 1.23a� 0.41 0.68ab� 0.14 0.57ab� 0.08 0.37b� 0.06 0.80a� 0.13 4.34��
Ca (%) 1.82ab� 0.71 1.04bc� 0.14 0.67c� 0.12 1.21b� 0.12 2.60a� 0.75 5.21��
C:P 681c� 104 1224b� 182 1220b� 152 2149a� 277 658c� 90 13.4���
Cellulose (%) 27.7a� 1.7 19.6b� 2.7 32.9a� 2.4 18.4b� 1.9 17.6b� 4.0 5.94��
NDF (%) 64.2a� 6.3 50.0b� 3.0 71.3a� 1.7 46.0b� 3.5 43.3b� 6.7 7.09���
ADF (%) 42.7b� 3.5 37.2bc� 3.3 56.0a� 2.5 35.0bc� 3.0 31.2c� 5.1 5.69��
Lignin:P 214ab� 43 474ab� 147 658a� 197 731a� 132 179c� 49 6.98���
Lignin:K 25.1b� 18.0 39.6ab� 15.4 41.6a� 13.0 49.2a� 7.7 16.0b� 5.8 3.41�
Lignin:Ca 12.7ab� 5.6 19.1ab� 5.2 35.5a� 11.0 14.2ab� 2.0 5.5c� 2.0 4.93��
Values with the same superscript letters are not significantly different. Significance: �P � 0.05; ��P � 0.01; ���P � 0.001.
FIGURE 1. Leaf litter decomposition rate (k) for 33 species of lowland wet forest plants during a 2-yr study at San Lorenzo National Park, Panama, compared as a
function of (A) Growth form, (B) Phylogenetic group, and (C) Canopy position. Results of one-way ANOVA on loge-transformed data are presented and groups with
different letters are significantly different at P � 0.05.
Decomposition in Wet Tropical Forest 75
percent N remaining was positively correlated with initial litter Ca,
percent P remaining was negatively correlated with initial litter N,
K, and Mg, percent K remaining was negatively correlated with
initial litter N and P, percent Ca remaining was negatively corre-lated with initial litter Mg, and percent Mg remaining was nega-
tively correlated with initial litter N (Table 2).
DISCUSSION
Variation in leaf litter decomposition dynamics in this wet tropical
forest was most related to canopy position, reflecting the vertical
changes in environmental conditions throughout the canopy
(Chazdon & Fetcher 1984). The most pronounced difference wasthe substantially greater decomposition rates of shade leaves of un-
derstory species, compared with the relatively low decomposition
rates for sun leaves of canopy species. In contrast, classification
schemes using growth form were only marginally significant in
terms of predicting decomposition rate or mass remaining, even
though there were dramatic differences in litter quality (Table 1),
and P remaining in litter after 2 yr among growth forms. Phyloge-
netic relationships did not add predictive information to decompo-sition analysis (Fig. 1B), despite large differences in leaf structure
between monocots and dicots. Continuous litter quality character-
istics, on the other hand, especially those related to P concentration,
showed reasonably good correlation with decomposition rate and
explained approximately 50 percent of the variation in decomposi-
tion in some cases. Whereas classification by canopy positionmostly described variation in decomposition of sun vs. shade leaves,
relationships between litter quality and decomposition rate pro-
vided information regarding how different litter characteristics of
individual species are correlated with the breakdown of litter. Over-
all, the results suggest that some growth form classifications are
helpful for simplifying the effects of high species diversity on de-
composition (Gurvich et al. 2003, Dıaz et al. 2004, Santiago et al.2005), yet analysis of continuous litter quality traits and decompo-sition rate provide correlative information, and possible clues to
underlying mechanisms.
The most surprising pattern was the lack of strong variation in
mean decomposition rates among growth forms (Fig. 1A). The data
showed trends of faster decomposition in herbs and pioneer trees,
and slower decomposition in canopy trees and palms, consistent
with patterns of litter quality, such as greater P and K in herb and
pioneer tree litter (Table 1), yet many of the other litter quality in-dices that varied among growth forms were not significantly corre-
lated with decomposition rate, especially carbon fractions such as
cellulose, NDF, and ADF. Nonetheless, even element-based litter
quality indices that varied among growth forms and showed
FIGURE 2. Loge-transformed decomposition rate constant (k) for 33 species of lowland wet forest plants of five growth forms from San Lorenzo National Park,
Panama, as a function of (A) Loge-transformed leaf litter lignin-to-magnesium ratio, (B) Leaf litter phosphorus concentration, and (C) Loge-transformed leaf litter
lignin-to-potassium ratio. Each point represents the mean of one species.
TABLE 2. Correlation coefficient (r) for linear correlation analysis of mean percent element remaining after 2 yr vs. litter element concentration for 33 plant species from
lowland wet forest in San Lorenzo National Park, Panama.
% Element remaining
Litter quality
C (%) N (%) P (%) K (%) Ca (%) Mg (%)
C � 0.60��� � 0.05 0.02 � 0.22 � 0.01 � 0.30
N � 0.08 � 0.86��� � 0.14 � 0.20 0.38� � 0.33
P 0.36 � 0.41� � 0.96��� � 0.31� � 0.11 � 0.38�
K 0.07 � 0.34� � 0.40� � 0.99��� � 0.05 � 0.23
Ca � 0.09 0.08 � 0.16 � 0.03 � 0.80��� � 0.36�
Mg � 0.08 � 0.38� � 0.23 � 0.17 � 0.19 � 0.86���
Significance: �P � 0.05; ��P � 0.01; ���P � 0.001.
76 Santiago
relatively good correlation with decomposition rate, did not lead to
strong differences among growth forms in decomposition rate.
Therefore, it appears that in wet tropical forest, high resource avail-
ability and fairly constant climatic conditions may result in a largedegree of functional convergence (Hubbell & Foster 1986, Meinzer
2003), in which selection to maximize carbon gain in a specific en-
vironment causes constraints in leaf metabolic and biophysical
characteristics (Reich et al. 1997), and narrows the diversity of leaf
characteristics, resulting in minimal variation in decomposition dy-
namics among growth forms or phylogenetic groups.
Canopy position was the one functional classification that did
show variation in mean decomposition rates between canopy andunderstory species (Fig. 1C). This result suggests that the contrast
in light environment, between the sunlit canopy and the dappled
understory, is a primary determinant of leaf traits in tropical forest
(Poorter 2007, Santiago & Wright 2007, Lusk et al. 2008), with
implications for decomposition (Santiago 2007). SLA varied
strongly between canopy (82� 5) and understory (217� 17) spe-
cies, and was significantly correlated with decomposition rate
(r = 0.46, P = 0.006). Herbs and pioneer trees, which lost moremass, also had the greatest SLA (Table 1), consistent with the ob-
servations of Lusk et al. (2008), who point out that high SLA can
occur in both low light and high light conditions. But overall, these
results indicate that the suite of traits that vary between the canopy
and understory, including SLA, leaf nutrient concentration, and
possibly other characteristics such as antiherbivore defenses, are the
primary determinants of decomposition in this tropical forest. For
modeling purposes, this is good news because wet tropical forestshave a leaf area index of around five (Clark et al. 2008), and one
layer can be considered a canopy layer, with approximately four
understory layers below. In addition, it is known that canopy leaves
have a faster production rate and shorter lifespan than understory
leaves (Osada et al. 2001), and thus contribute more to the litter
layer. If the pattern that litter decomposition in wet tropical forests
proceeds more rapidly in shade leaves than sun leaves is robust, and
decomposition can be modeled as a function of canopy position,this would greatly simplify predicting the effects of changes in forest
structure on decomposition. Nonetheless, further studies in other
systems covering a range of biotic and abiotic conditions are needed
to validate the generality of these patterns.
Based on the relatively strong correlations of P, K, Ca, and Mg
with decomposition rates and mass remaining, it appears that mi-
crobial activity at this site may be relatively more limited by nutri-
ents other than N. This result is consistent with previous findingsdemonstrating limitation of decomposition in tropical forest by P
in Hawaii (Hobbie & Vitousek 2000). Furthermore, significant
effects of litter P and K on decomposition in this study are consis-
tent with a fertilization study at the Barro Colorado Nature Mon-
ument in Panama where P and K addition increased rates of
decomposition (Kaspari et al. 2008). It has also been advanced,
that N:P ratios of green leaves 4 16 are indicative of P-limited
systems (Aerts & Chapin 2000). Mean N:P of fresh leaves of speciesin this study was 17.3 (� 3.9 SD), suggesting that N is relatively
more available for plant uptake than is P. Additionally, reports of
microbial activity during decomposition of soil organic matter in
Costa Rica and Kenya provide strong evidence for P-limitation of
microbial respiration in tropical ecosystems (Cleveland et al. 2002,
Kwabiah et al. 2003). Therefore, the elemental control of litter de-
composition dynamics manifested through species in this study islikely related to the nutrient limitation of microbial processes at the
site. The stronger response of decomposition to element concen-
trations than carbon fractions also suggests that labile carbon is rel-
atively more available than nutrients to decomposing organisms in
this forest. Further studies of the interplay among nutrient limita-
tion, allocation of nutrients to leaf processes in contrasting growth
forms, or canopy positions across tropical forest sites will improve
our ability to predict how changes in community composition mayinfluence nutrient cycling processes.
The data presented in this study also suggest that stoichiome-
try between nutrients is an important consideration during litter
decomposition. Leaf litter decomposition requires the breakdown
of a variety of substrates, necessitating a coordinated acquisition of
resources to produce an assortment of enzymes by different mi-
crobes (Wardle 2002, Kaspari et al. 2008). I observed that in several
cases, litter concentration of one element was correlated with thedynamics of another element during decomposition (Table 2). For
example, stoichiometry of N and P cycling during litter decompo-
sition was maintained. Mean litter N:P across all species regardless
of growth form was 24.4 and was largely maintained as mean N:P
of litter remaining after 2 yr was 23.0. In addition, litter N concen-
tration had significant effects on P remaining in litter after 2 yr
(Table 2), further suggesting coordination in use of N and P by
microbes during decomposition. Therefore, element ratios of leaflitter in this tropical forest have the potential to reveal stoichiomet-
ric patterns that may operate regardless of species or growth form.
This study examined the utility of grouping species by growth
form to understand and model effects of species on ecosystem pro-
cesses. Part of the desire to classify species into growth forms or
plant functional types is rooted in the legacy of Carl Linneaus
(1707–1778) and the discrete classification approaches of system-
atic biology. Such approaches have received much attention in re-cent decades due to the need to model changes in species
composition in response to climate change using fewer groups than
species to simplify predictions (Gitay & Noble 1997). My data in-
dicate that in this tropical forest, functional variation largely reflects
the dichotomy between sun and shade leaves, which has consider-
able utility for simplifying the diverse effects of species assemblages
on nutrient cycling processes. The data also suggest, however, that
much of the variation in the effects of species on the ecosystemprocess of decomposition collapses when litter quality-decomposi-
tion relationships are used to predict decomposition rate (Melillo etal. 1982). Therefore, although growth form classification offers op-
portunities for understanding how changes in composition of ma-
jor plant groups could affect ecosystem-scale nutrient cycling,
species-scale analyses of litter quality, although more time-consum-
ing and labor-intensive, also provide detailed information. Future
attempts that integrate classification and trait-basedapproaches will allow us to understand the implications of changes
in species and growth form composition for decomposition and
ecosystem processes.
Decomposition in Wet Tropical Forest 77
ACKNOWLEDGMENTS
I am grateful to K. Kitajima, S. Mulkey, J. Wright, T. Martin, and
J. Putz, for critical advice and mentorship; E. Osorio and D. Nolettifor laboratory and field assistance; J. Yavitt, B. Ostertag, S. Bou-
chard, and T. Schuur for advice with methods; K. Silvera and E.
Garrido for comments on the manuscript; E. Andrade, J. Herrera,
O. Saldana, and J. Pitti, for dexterity in operating the crane; the
Smithsonian Tropical Research Institute and the U.S. Environ-
mental Protection Agency for funding; and the University of Cal-
ifornia for logistical support.
SUPPORTING INFORMATION
Additional Supporting Information may be found in the online
version of this article:
TABLE S1. Growth form classification, phylogenetic groups basedon the Angiosperm Phylogeny Project (APG), canopy position, leaf littermass remaining, and decomposition rate for study species.
Please note: Wiley-Blackwell is not responsible for the content or
functionality of any supporting materials supplied by the authors.
Any queries (other than missing material) should be directed to the
corresponding author for the article.
LITERATURE CITED
AERTS, R., AND F. S. CHAPIN. 2000. The mineral nutrition of wild plantsrevisited: A re-evaluation of processes and patterns. Adv. Ecol. Res. 30:1–66.
AERTS, R., J. T. A. VERHOEVEN, AND D. F. WHIGHAM. 1999. Plant-mediatedcontrols on nutrient cycling in temperate fens and bogs. Ecology 80:2170–2181.
ALLISON, S. D., AND P. M. VITOUSEK. 2004. Rapid nutrient cycling in leaf litterfrom invasive plants in Hawai’i. Oecologia 141: 612–619.
AMATANGELO, K. L., AND P. M. VITOUSEK. 2009. Contrasting predictors of fernversus angiosperm decomposition in a common garden. Biotropica 41:154–161.
ANDERSON, J. M., AND M. J. SWIFT. 1983. Decomposition in tropical forests. InS. L. Sutton, T. C. Whitmore, and A. C. Chadwick (Eds.). Tropical rainforest: ecology and management, pp. 287–309. Blackwell Scientific,Oxford, UK.
AUSTIN, A. T., AND P. M. VITOUSEK. 2000. Precipitation, decomposition andlitter decomposability of Metrosideros polymorpha in native forests onHawai’i. J. Ecol. 88: 129–138.
BLOMBERG, S. P., T. GARLAND, AND A. R. IVES. 2003. Testing for phylogeneticsignal in comparative data: Behavioral traits are more labile. Evolution57: 717–745.
CHAPIN, F. S. III. 1980. The mineral nutrition of wild plants. Ann. Rev. Ecol.Sys. 11: 233–260.
CHAZDON, R. L., AND N. FETCHER. 1984. Light environments of tropical forests.In E. Medina, H. A. Mooney, and C. Vazquez-Yanes (Eds.). Physiolog-ical ecology of plants of the wet tropics, pp. 553–564. Dr. W. JunkPublishers, The Hague, The Netherlands.
CHAZDON, R. L., R. W. PEARCY, D. W. LEE, AND N. FETCHER. 1996. Photosyn-thetic responses of tropical forest plants to contrasting light environ-ments. In S. S. Mulkey, R. L. Chazdon, and A. P. Smith (Eds.). Tropicalforest plant ecophysiology, pp. 5–55. Chapman & Hall, New York,New York.
CLARK, D. B., P. C. OLIVAS, S. F. OBERBAUER, D. A. CLARK, AND M. G. RYAN.
2008. First direct landscape-scale measurement of tropical rain forest
Leaf Area Index, a key driver of global primary productivity. Ecol. Lett.
11: 163–172.CLEVELAND, C. C., A. R. TOWNSEND, AND S. K. SCHMIDT. 2002. Phosphorus
limitation of microbial processes in moist tropical forests: Evidence from
short-term laboratory incubations and field studies. Ecosystems 5:
680–691.CORNELISSEN, J. H. C. 1996. An experimental comparison of leaf decomposition
rates in a wide range of temperate plant species and types. . Ecol. 84:
573–582.CORNELISSEN, J. H. C., AND K. THOMPSON. 1997. Functional leaf attributes pre-
dict litter decomposition rate in herbaceous plants. New Phytol. 135:
109–114.CORNWELL, W. K., J. H. C. CORNELISSEN, K. AMATANGELO, E. DORREPAAL, V. T.
EVINER, O. GODOY, S. E. HOBBIE, B. HOORENS, H. KUROKAWA, N.
PEREZ-HARGUINDEGUY, H. M. QUESTED, L. S. SANTIAGO, D. A. WARDLE,
I. J. WRIGHT, R. AERTS, S. ALLISON, P. V. BODEGOM, V. BROVKIN, A.
CHATAIN, T. CALLAGHAN, S. DIAZ, E. GARNIER, D. E. GURVICH, E.
KAZAKOU, J. A. KLEIN, J. READ, P. B. REICH, N. A. SOUDZILOVSKAIA, M.
V. VAIERETTI, AND M. WESTOBY. 2008. Plant species traits are the pre-
dominant control on litter decomposition rates within biomes world-
wide. Ecol. Lett. 11: 1065–1071.DAVIES, T. J., T. G. BARRACLOUGH, M. W. CHASE, P. S. SOLTIS, D. E. SOLTIS,
AND V. SAVOLAINEN. 2004. Darwin’s abominable mystery: Insights
from a supertree of the angiosperms. Proc. Natl. Acad. Sci. USA 101:
1904–1909.DIAZ, S., J. G. HODGSON, K. THOMPSON, M. CABIDO, J. H. C. CORNELISSEN,
A. JALILI, G. MONTSERRAT-MARTI, J. P. GRIME, F. ZARRINKAMAR, Y. ASRI,
S. R. BAND, S. BASCONCELO, P. CASTRO-DIEZ, G. FUNES, B. HAMZEHEE,
M. KHOSHNEVI, N. PEREZ-HARGUINDEGUY, M. C. PEREZ-RONTOME,
F. A. SHIRVANY, F. VENDRAMINI, S. YAZDANI, R. ABBAS-AZIMI,
A. BOGAARD, S. BOUSTANI, M. CHARLES, M. DEHGHAN, L. DE TORRES-
ESPUNY, V. FALCZUK, J. GUERRERO-CAMPO, A. HYND, G. JONES,
E. KOWSARY, F. KAZEMI-SAEED, M. MAESTRO-MARTINEZ, A. ROMO-DIEZ,
S. SHAW, B. SIAVASH, P. VILLAR-SALVADOR, AND M. R. ZAK. 2004. The
plant traits that drive ecosystems: Evidence from three continents.
J. Veg. Sci. 15: 295–304.EVINER, V. T., AND F. S. CHAPIN III. 2003. Functional matrix: A conceptual
framework for predicting multiple plant effects on ecosystem processes.
Ann. Rev. Ecol. Sys. 34: 455–485.GHOLZ, H. L., D. A. WEDIN, S. M. SMITHERMAN, M. E. HARMON, AND W. J.
PARTON. 2000. Long-term dynamics of pine and hardwood litter in con-
trasting environments: Towards a global model of decomposition.
Global Change Biol. 6: 751–765.GILBERT, B., S. J. WRIGHT, H. C. MULLER-LANDAU, K. KITAJIMA, AND A.
HERNANDEZ. 2006. Life history trade-offs in tropical trees and lianas.
Ecology 87: 1281–1288.GITAY, H., AND I. R. NOBLE. 1997. What are functional types and how should we
seek them? In T. M. Smith, H. H. Shugart, and F. I. Woodward (Eds.).
Plant functional types, pp. 3–19. Cambridge University Press, Cam-
bridge, UK.GRIME, J. P., J. H. C. CORNELISSEN, K. THOMPSON, AND J. G. HODGSON. 1996.
Evidence of a causal connection between anti-herbivore defence and the
decomposition rate of leaves. Oikos 77: 489–494.GURVICH, D. E., T. A. EASDALE, AND N. PEREZ-HARGUINDEGUY. 2003. Subtrop-
ical montane tree litter decomposition: Links with secondary forest types
and species’ shade tolerance. Austral Ecol. 28: 666–673.HOBBIE, S. E. 1992. Effects of plant species on nutrient cycling. Trends Ecol.
Evol. 7: 336–339.HOBBIE, S. E. 1996. Temperature and plant species control over litter decom-
position in Alaskan tundra. Ecol. Monogr. 66: 503–522.HOBBIE, S. E., AND P. M. VITOUSEK. 2000. Nutrient limitation of decomposition
in Hawaiian forests. Ecology 81: 1867–1877.
78 Santiago
HUBBELL, S. P., AND R. B. FOSTER. 1986. Biology, chance, and history and the
structure of tropical rain forest tree communities. In J. Diamond and T. J.
Case (Eds.). Community ecology, pp. 314–329. Harper & Row, New
York, New York.JUDD, W. S., C. S. CAMPBELL, E. A. KELLOGG, P. F. STEVENS, AND M. J. DON-
OGHUE. 2002. Plant systematics: A phylogenetic approach. Sinauer
Associates, Sunderland, Massachusetts.KASPARI, M., M. N. GARCIA, K. E. HARMS, M. SANTANA, S. J. WRIGHT, AND J. B.
YAVITT. 2008. Multiple nutrients limit litterfall and decomposition in a
tropical forest. Ecol. Lett. 11: 35–43.KWABIAH, A. B., C. A. PALM, N. C. STOSKOPF, AND R. P. VORONEY. 2003. Re-
sponse of soil microbial biomass dynamics to quality of plant materials
with emphasis on P availability. Soil Biol. Biochem. 35: 207–216.LUSK, C. H., P. B. REICH, R. A. MONTGOMERY, D. D. ACKERLY, AND J. CAVE-
NDER-BARES. 2008. Why are evergreen leaves so contrary about shade?
Trends Ecol. Evol. 23: 299–303.MEINZER, F. C. 2003. Functional convergence in plant responses to the envi-
ronment. Oecologia 134: 1–11.MELILLO, J. M., J. D. ABER, AND J. F. MURATORE. 1982. Nitrogen and lignin
control of hardwood leaf litter decomposition dynamics. Ecology 63:
621–626.OLSON, J.S. 1963. Energy storage and the balance of producers and decomposers
in ecological systems. Ecology 44: 322–331.OSADA, N., H. TAKEDA, A. FURUKAWA, AND M. AWANG. 2001. Leaf dynamics
and maintenance of tree crowns in a Malaysian rain forest stand. J. Ecol.
89: 774–782.PATON, S., AND S. J. WRIGHT. 2009. Terrestrial Environmental Science Program.
Smithsonian Institution, Washington, DC. Available at http://striweb.si.
edu/esp/POORTER, L. 2007. Are species adapted to their regeneration niche, adult niche,
or both? Am. Nat. 169: 433–442.
REICH, P. B., M. B. WALTERS, AND D. S. ELLSWORTH. 1997. From tropics totundra: Global convergence in plant functioning. Proc. Natl. Acad. Sci.U.S.A. 94: 13730–13734.
RYAN, M. G., J. M. MELILLO, AND A. RICCA. 1989. A comparison of methods fordetermining proximate carbon fractions of forest litter. Can. J. For. Res.20: 166–171.
SANTIAGO, L.S. 2007. Extending the leaf economics spectrum to decomposition:Evidence from a tropical forest. Ecology 88: 1126–1131.
SANTIAGO, L. S., AND S. S. MULKEY. 2005. Leaf productivity along a precipitationgradient in lowland Panama: Patterns from leaf to ecosystem. Trees 19:349–356.
SANTIAGO, L. S., E. A. G. SCHUUR, AND K. SILVERA. 2005. Nutrient cycling andplant-soil feedbacks along a precipitation gradient in lowland Panama.J. Trop. Ecol. 21: 461–470.
SANTIAGO, L. S., AND S. J. WRIGHT. 2007. Leaf functional traits of tropical forestplants in relation to growth form. Funct. Ecol. 21: 19–27.
SCHLESINGER, W.H. 1991. Biogeochemistry: an analysis of global change. Aca-demic Press, New York, New York.
SWIFT, M. J., O. W. HEAL, AND J. M. ANDERSON. 1979. Decomposition in ter-restrial ecosystems. Blackwell Scientific, Oxford, UK.
WARDLE, D.A. 2002. Communities and ecosystems: linking the abovegroundand belowground components. Princeton University Press, Princeton,New Jersey.
WEBB, C. O., D. D. ACKERLY, AND S. W. KEMBEL. 2007. Phylocom: softwarefor the analysis of community phylogenetic structure and characterevolution. Version 3.41. Available at http://www.phylodiversity.net/phylocom/ (accessed May 7, 2009).
WESTOBY, M. 1998. A leaf-height-seed (LHS) plant ecology strategy scheme.Plant. Soil 199: 213–227.
WRIGHT, S. J., H. C. MULLER-LANDAU, R. CONDIT, AND S. P. HUBBELL. 2003.Gap-dependent recruitment, realized vital rates, and size distributions oftropical trees. Ecology 84: 3174–3185.
Decomposition in Wet Tropical Forest 79