Embed Size (px)
Citation preview
Can E-Governance Reduce Capture of Public Programs?
Experimental Evidence from a Financial Reform of India's
Employment Guarantee∗
Abhijit Banerjee†, Esther Du�o‡, Clement Imbert§,Santhosh Mathew¶, Rohini Pande‖
May 20, 2015
Abstract
Traditionally, fund �ow to local bodies responsible for implementing social programs is basedon intended expenditure rati�ed by higher levels of administration. This paper reports ona �eld experiment which evaluated an e-governance reform of the fund-�ow system for theworkfare program in the Indian state of Bihar. The reform changed the traditional fund�ow practice by instead conditioning funds disbursement for wage payments on incurredexpenditure as re�ected in worker detail entry on a new electronic platform. This reformreduced the number of administrative tiers associated with wage disbursement and changedthe informational requirements for requesting and disbursing program funds. We �nd thatprogram expenditure and reported employment declined by 25%, but with no discernibleimpact on actual employment as measured by independent surveys. Our results suggest thate-governance can reduce leakages of public funds but may not by itself improve public servicedelivery.
∗We thank Abhishek Anand, Madeline Duhon, Shweta Rajwade, M.R. Sharan, Niki Shrestha and PankajVerma for excellent research assistance. We thank the International Initiative for Impact Evaluation (3ie) and theInternational Growth Centre (IGC) for �nancial support. We thank conference and seminar participants at theCMPO Workshop (Bristol University), the IGC Growth Week, the Indian Statistical Institute and the Universityof Oxford for helpful comments. Santhosh Mathew is a member of the IAS and currently at the Ministry ofRural Development in Government of India. However, all views and errors are solely ours and this paper doesnot represent the view of the MoRD or any part of the Government of India.†MIT, [email protected]‡MIT, edu�[email protected]§Oxford, [email protected]¶Ministry of Rural Development [email protected]‖Harvard, [email protected]
1

I Introduction
Implementation bottlenecks constrain the e�ectiveness of social programs the world over, but
the corruption costs of poor implementation are particularly severe in lower income countries.
Yet, somewhat perversely, the implementation bottlenecks that generate rent-seeking and appar-
ent program ine�ciency are often themselves a consequence of government-instituted monitoring
and accountability mechanisms (Banerjee, 1997).
A classic manifestation of this two-way relationship between implementation bottlenecks
and the potential for corruption is the traditional funds-�ow mechanism for social programs
in the developing world. Decentralization of program delivery to local bodies for a host of
programs � ranging from health and education to community development projects and local road
construction � raises the need for a fund �ow mechanism to transfer funds from more centralized
tiers of government to local bodies. Traditionally, the physical distance between central and
local bodies and communication di�culties meant that funds needed to be released prior to
expenditure if cash-strapped local bodies were to undertake any activity . This, however, opens
the possibility of funds embezzlement by local bodies. In order to prevent such malfeasance,
typical public sector management practice is to institute requirements that fund-requests be
rati�ed by higher levels of administration prior to funds release. But, of course, creating a long
chain of intermediaries also increases the number of players who would bene�t from rent-seeking.
Studies who track public expenditures in developing countries document signi�cant �leakages�,
and often �nd that these rents are increasing in the number of o�cials involved (Olken, 2006;
Reinikka and Svensson, 2011; Niehaus and Sukhtankar, 2013).
Can the advent of e-governance help cut the gordian knot between administrative practices
and corruption? This paper reports on a large-scale randomized experiment which sought to
reform the fund-�ow mechanism for India's workfare program � Mahatma Gandhi National
Rural Employment Guarantee Scheme (MGNREGS).1 The evaluation was conducted between
September 2012 and March 2013 in conjunction with the Department of Rural Development in
Bihar and spanned twelve districts (with a population of 33 million). The status quo �ow of
1In 2013 close to 50 million households participated in MGNREGS and total expenditures amounted to 0.5%of India's GDP. There is evidence that it led to an increase in rural wages (Azam, 2012; Berg et al., 2013; Imbertand Papp, ming), a reduction in seasonal migration from rural areas (Imbert and Papp, 2014) and a reduction inpoverty (Deininger and Liu, 2013).
2
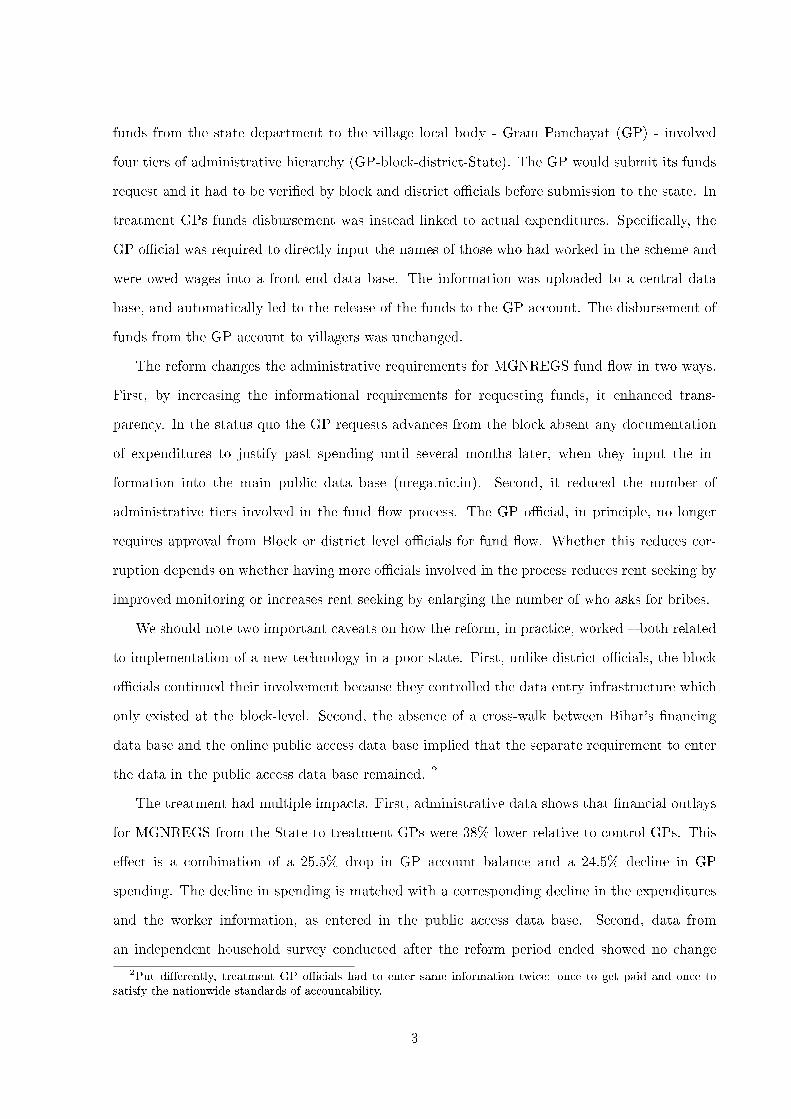
funds from the state department to the village local body - Gram Panchayat (GP) - involved
four tiers of administrative hierarchy (GP-block-district-State). The GP would submit its funds
request and it had to be veri�ed by block and district o�cials before submission to the state. In
treatment GPs funds disbursement was instead linked to actual expenditures. Speci�cally, the
GP o�cial was required to directly input the names of those who had worked in the scheme and
were owed wages into a front end data base. The information was uploaded to a central data
base, and automatically led to the release of the funds to the GP account. The disbursement of
funds from the GP account to villagers was unchanged.
The reform changes the administrative requirements for MGNREGS fund �ow in two ways.
First, by increasing the informational requirements for requesting funds, it enhanced trans-
parency. In the status quo the GP requests advances from the block absent any documentation
of expenditures to justify past spending until several months later, when they input the in-
formation into the main public data base (nrega.nic.in). Second, it reduced the number of
administrative tiers involved in the fund �ow process. The GP o�cial, in principle, no longer
requires approval from Block or district level o�cials for fund �ow. Whether this reduces cor-
ruption depends on whether having more o�cials involved in the process reduces rent seeking by
improved monitoring or increases rent seeking by enlarging the number of who asks for bribes.
We should note two important caveats on how the reform, in practice, worked � both related
to implementation of a new technology in a poor state. First, unlike district o�cials, the block
o�cials continued their involvement because they controlled the data entry infrastructure which
only existed at the block-level. Second, the absence of a cross-walk between Bihar's �nancing
data base and the online public access data base implied that the separate requirement to enter
the data in the public access data base remained. 2
The treatment had multiple impacts. First, administrative data shows that �nancial outlays
for MGNREGS from the State to treatment GPs were 38% lower relative to control GPs. This
e�ect is a combination of a 25.5% drop in GP account balance and a 24.5% decline in GP
spending. The decline in spending is matched with a corresponding decline in the expenditures
and the worker information, as entered in the public access data base. Second, data from
an independent household survey conducted after the reform period ended showed no change
2Put di�erently, treatment GP o�cials had to enter same information twice: once to get paid and once tosatisfy the nationwide standards of accountability.
3

in days worked and payment received by households. Instead, the number of �ghost workers�
(individuals who are in the public access data base but have in fact never worked) declined,
suggesting a reduction in leakage. In addition, there is no change in public infrastructures built
under the program. Third, a�davit data on public employee assets shows a corresponding decline
in reported assets at almost all quantiles of the distribution of (self reported) wealth in treatment
GPs and blocks.
Thus, the �nancial reform was e�ective in reducing corruption and program costs, but actual
demand that was met by the program was unchanged. This is contrary to the hypothesis that
the red tape that generates implementation bottlenecks causes a large share of the ine�ciency.
Our analysis period was particularly di�cult for MGNREGS in Bihar with the state funds pool
running dry and GP functionaries going on strike in the three to four months of the seven month
intervention period. We observe an initial increase in delays in payment for bene�ciaries which
disappeared after three months. Delays may be due to the fairly onerous data entry requirements
for the GP under the new system, or to initial strain on the Central Bank of India which had
to process many more payments. Hence, the clear reduction in leakage is impressive given the
challenging context, but our �ndings also suggest a need for complementary reforms to improve
delivery to bene�ciaries.
Our paper makes contributions to multiple strands of the economic literature. First, it adds
to a growing number of studies which evaluate administrative reforms in settings with weak state
capacity (Banerjee et al., 2012; Du�o et al., 2013; Bó et al., 2013). Some of these studies focus on
the use of information technology, or e-governance (Barnwal, 2014; Muralidharan et al., 2014).
Most closely related is Muralidharan et al. (2014) who evaluate an experiment in Andhra Pradesh
(from 2010 to 2012), in which biometric smart cards were provided to MGNREGS bene�ciaries
and wage disbursement was shifted from post o�ce workers to locally hired bank employees.
Our intervention, in contrast, did not a�ect this �nal chain in the process. Re�ecting di�erences
in what was reformed, we observe di�erences in the margins along which the reform reduced
corruption. Muralidharan et al. (2014) �nd that biometric identi�cation of bene�ciaries reduced
opportunities to over-report MGNREGS days for actual bene�caries while we �nd a reduction in
the incidence of fake workers. They �nd no evidence of payment delays increasing which possibly
re�ects the better infrastructure in the state and that biometric identi�cation in treatment areas
4

was voluntary, not mandatory.3
Second, we contribute to the forensic economics literature which seeks to obtain objective
estimates of corruption (see Olken and Pande (2012) for a review). Studies that track expendi-
tures typically compare expenditures made by the state to what is disbursed by the lowest level
of administration, or received by bene�caries (Reinikka and Svensson, 2011; Olken, 2006). In the
context of MGNREGS, Niehaus and Sukhtankar (2013) sample households which are reported
to have worked for the program according to the o�cial website nrega.nic.in and attempt to
survey them, and to measure how much employment and wages they actually received. Ours
is one of the few studies which combine this �forensic� method with a randomized control trial
to provide experimental evidence on corruption mechanisms (Olken, 2007; Muralidharan et al.,
2014). Speci�cally, rather than comparing levels in reported and actual outcomes, we identify
leakages by comparing changes in reported and actual outcomes in randomly selected treatment
and control areas, following the implementation of an administrative reform.
Third, we contribute to a nascent literature on the industrial organization of public service
delivery, and its implications for corruption. The theoretical literature on corruption has long
emphasized the importance of administrative structure and task-organization in a�ecting corrup-
tion (Shleifer and Vishny, 1993; Banerjee, 1997; Banerjee et al., 2012). However, most empirical
studies have focused on the e�ect of information disclosure, increased monitoring, and monetary
incentives, keeping the administrative structure constant (Olken, 2007; Reinikka and Svensson,
2011; Ferraz and Finan, 2011). Few examine the e�ect of changing the administrative structure
itself. Two existing studies examine changes in the number of functionaries or jurisdictions at
lower administrative levels, which compete to provide services to the public (Olken and Barron,
2009; Burgess et al., 2012). Our paper is one of the �rst to estimate empirically the e�ect of
replacing intermediary layers of administration which in the status quo are in charge of funds
release and monitoring by automatic transfers and online documentation of expenditures enabled
by information technologies. Across the world, a system similar to our status quo is typically
in place, and in most settings, it would now be technologically feasible to adopt the reformed
system we study.
3They �nd higher payment to NREGS workers and higher household incomes, with no change in governmentoutlay, indicating a reduction in leakage. They also �nd that the delays in payment and the time spent collectingpayment decreased substantially.
5

The paper is structured as follows. Section Two presents the context and describes the
intervention and its expected impact. Section Three details the data we use and our empirical
strategy. Section Four presents the results, and Section Five concludes.
II Background and intervention
A MGNREGS in Bihar: Context and Performance
The Mahatma Gandhi National Rural Employment Guarantee Scheme (MGNREGS) was
created in 2005 by the National Rural Employment Guarantee Act. The Act guarantees 100 days
of work per year per household for all rural adults who are willing to do unskilled manual labor
at the stipulated minimum wage. Local o�cials have the responsibility to register bene�ciaries
and provide them work on local infrastructure projects. With close to 50 million bene�ciary
households in 2013, the MGNREGS is one of the largest social protection programs in the world
today.
From the start, the quality of its implementation has been very unequal across Indian states.
Employment provision under the act is concentrated in seven �star� states - including Andhra
Pradesh, Madhya Pradesh, Rajasthan and Tamil Nadu - and consistently low in some of India's
poorer states - including Bihar Jharkhand, Orissa and West Bengal - Imbert and Papp (2015).
As Dutta et al. (2012) note �the incidence of unmet demand tends to be higher in poorer states
even though demand for the scheme is higher there�. This is particularly stark in the case of
Bihar, which has one of the highest poverty rates in India and the highest unmet demand for
MGNREGS work. Using NSS data for 2009-2010, we estimate that 35% of households in Bihar
both want to work and could not �nd work (a further 10% did �nd work).4 By comparison,
in the better performing state of Andhra Pradesh only 12% both want work and could not
�nd work (and 39% of households participated in MGNREGS). Historically, Bihar has also had
a poor record of governance and poverty reduction. However, since 2005, it has seen growth
accelerate and alongside government e�orts to promote economic development have been widely
acknowledged (The Economist, 2010).
MGNREGS implementation has also been plagued by widespread corruption. Comparing
4Authors' calculation based on National Sample Survey data for July 2009 to June 2010.
6

public reports on nrega.nic.in and National Sample Survey data from June 2007 and July 2008,
Imbert and Papp (2011) �nd that employment estimates based on survey data only account for
42-56% of o�cial �gures on MGNREGS employment. Since the early years of implementation,
the central and state governments took important steps to reduce corruption, e.g. regular imple-
mentation of administrative and independent audits, mandatory payments through banks or post
o�ces. Applying the same method to data from July 2011 to June 2012 yields higher estimates
about 80% (Imbert, 2014). In Bihar, similar e�orts have been carried out but corruption is still
widespread. Dutta et al. (2014) estimate that 20-25% of MGNREGS payments are unaccounted
for in survey data. In our own survey, 48% of surveyed politicians mentioned corruption in
the administration as a major implementation issue. A politician from Jamui district declared
�Bribery is so common that it almost seems like it is the only way anything gets done in the GP�.
Respondents described a system of �taxes� extracted by MGNREGS functionaries, equivalent to
21-30% of expenditures.5
Both supply- and demand-side factors have been identi�ed for the continuing weak perfor-
mance of MGNREGS in the state. On the supply side, a lack of awareness about the scheme
among potential bene�ciaries is often cited as an important reason. In qualitative interviews
we conducted with 350 local politicians, 44% cite the lack of people's willingness to work as
a major implementation issue.6 However, experimental evidence provided by Ravallion et al.
(2013) suggests that increasing awareness about MGNREGS and improving perceptions of the
scheme is inadequate to increase participation. This suggests an important role for the lack of
administrative capacity at the local level, which, among other things, has reduced the state's
ability to spend centrally-funded schemes in the past (Mathew and Moore, 2011). Certainly,
local politicians are fast to ascribe poor implementation to a lack of funds.7 Below we describe
the status quo system and some basic diagnostics.
5Qualitative interviews conducted with 350 GP heads. The data collection and methodology is described insection A below.
6The survey methodology is described in section A below.785% of Mukhiya interviewd by us (from a pool of 350 Mukhiya) made this claim. The methodology is
described in section A below.
7

B Fund�ow management in MGNREGS
1 . Overview
MGNREGS is �nanced by the federal government which transfers funds to the state on
the basis of projected demand. Thus, MGNREGS fund-�ow has two parts: from the central
government to the state and then from the state to lower tiers of administration called district,
block and Gram Panchayat (GP). The GP is the local implementing agency.
The transfer of funds from centre to state happens in tranches, the �rst tranche is made on
the basis of anticipated demand and expenditure from previous years, and the next tranches
are upon request by the state. To enable accountability of subsequent expenditures, the central
government requires that at least some fraction of labor expenditures are �accounted� for before
releasing the next tranche of funds (this fraction was 60% during the period we study). This
reporting occurs in an electronic data collection system (nrega.nic.in). The Central Government
enforces compliance with the entry in the data base by refusing money to states. In October
2012, less than a month after the launch of our intervention, the state pool of MGNREGS funds
ran dry due to incomplete data entry on the part of the state. The state administration, in turn,
argued that poor record keeping and incomplete data entry by GP o�cials were the reasons for
incomplete data entry (Dutta et al., 2014).
Turning to within-state fund �ow, the demand-driven nature of the program implies that
funds requests originate from GP but then are aggregated up the chain to the state-level. Sim-
ilarly, disbursements typically move incrementally down administrative tiers. First, from state
to districts then from districts to the block and �nally from the block to GP accounts. Since
the money disbursed to a district is typically lower than what is requested, there is signi�cant
discretion in how each administrative tier redistributes resources to the next tier. Also given
that the money is pushed down the chain in lumpy transfers, some units may run out of funds
while others have large unspent amounts (�parking of funds�).
In the two years prior to our intervention (2010-11) the Bihar government introduced e-
governance reforms to improve the monitoring of the fund �ow and coordinate e�orts to obtain
funds from the Center. An electronic platform called Central Planning Scheme Monitoring
System (CPSMS) was introduced to monitor account balances of all agencies. Alongside, it
created a state level pool of funds which channelled all transfers from the Center and opened
8

Zero Balance Accounts for all districts, which suppressed any parking of funds at the district
level.8 It also allowed districts to monitor GP balance and to transfer funds from the state pool
to the GP account directly, without having to go through the blocks.
The state published guidelines, to request districts to transfer funds automatically to GP,
whenever the balance of their account fell below INR 1 Lakh. However, due to various ine�cien-
cies in the bureaucratic system, this push was not made automatically, and was in fact based
on some bargaining between the block and the GP, and in turn between the district and the
block. Based on our analysis of fund-�ow data of GP accounts, between July 2011 and July
2012 in 12 districts of Bihar, the average time taken to replenish a GP account that was short of
funds was about 3 months. GP o�cials interviews we conducted in May-July 2013 suggest block
and district o�cials requested bribes to process payments. GP level o�cials would hence pay as
kick-backs part of payments received after in�ating the number of days worked by MGNREGS
bene�ciaries.
2 . Within-state fund �ow: Status quo and the reform
In 2012 Bihar's Rural Development Department decided to implement and evaluate a reform
to how MGNREGS fund �ow within the state. We describe in turn the status quo and the
reformed fund �ow.
Figure 2 describes the fund �ow in the status quo. At the beginning of each �nancial year,
a �rst installment is sent to each GP account. If the district has not replenished the account
automatically, when it runs out of funds, a GP needs to make a written or verbal request
to the next administrative tier (block). The block o�cials ratify this request and pass it on
to the district administration. The district administration then uses the CPSMS platform to
request funds transfer from the state pool to the GP savings account (4).9 The funds request
is typically based on anticipated need and, therefore, does not need to be supported by speci�c
documentation of expenditure, although the veri�cation process by higher levels is certainly
intended to play a monitoring role. The documentation of worker details on the nrega.nic.in
8Since any payment made is automatically compensated by a transfer from the state pool, Zero BalanceAccounts enable districts to transfer funds to local implementation agencies regardless of the amount of fundsthey individually received from the Center. The budget constraint is binding collectively at the state level.
9In principle, district o�cials can use CPSMS to monitor the balance of GP accounts and transfer moneywithout waiting for the GP to request funds. The state administration gave them guidelines to do exactly this,but our �eld reports suggest they were not closely followed.
9

occurs independent of the within-state fund �ow process.10
Figure 3 describes the reformed fund �ow for labor payments: after entering bene�ciary
details the GP o�cial can now directly log into CPSMS. After this, it can action the automatic
transfer of incurred wage expenses from the state pool to the GP savings account. In practice,
this data entry occurred at the Block o�ce (with assistance from a data entry operator hired at
that level), since most GPs do not have the necessary infrastructure.
Three important aspects of funds-�ow system were not a�ected by our reform. First, the
reform only a�ected the process through which funds for labor move from the State pool to
the GP account. The last step (bene�ciary payment) is the same under the old and the new
system: the GP transmits a list of payment to be made to the postal o�ce as well as an
aggregate check, and the postal o�ce credits each account. Possible frauds persist at that level,
for example if the bene�ciary entrusts his passbook to the village-level functionary or Mukhyas
(Muralidharan et al., 2014). Second, it did not a�ect the process for payment for materials, which
was still disbursed through CPSMS by the districts. It could still indirectly a�ect expenditures
for material, however, because of the rule that at least 60% of the expenditure must be made
on labor. Finally, the requirement that all the data be independently entered in the nrega.nic.in
data base remained. The GP o�cials thus had to enter the same information twice: once to get
paid, and once after the fact.
C How may �nancial reform a�ect rent-seeking and program e�ciency?
1 . Impact on corruption
The shift from the status quo to the reformed system had two main consequences.
First, transparency was enhanced, since disbursements were now directly linked to an actual
(reported) expenditure. As described above in the status quo, the GP gets an advance, and the
District is supposed to replenish the account as soon as it falls below some threshold. District
o�cials have the authority to require documentation before releasing the next tranche, but it
is not done on a routine basis. In the new system, funds are released to the GP only when
they document that a speci�c person has worked for a speci�c number of days. This both
10In this data base, information on every single job spell, including the identify of the bene�ciary and thepayment, is required, However, due to the lack of IT infrastructures at the local level, the data entry is oftendelayed by many months, which makes it more di�cult to monitor spending and delays funds release.
10

creates a direct link between a transfer made by the Center and a documented expenditure
and makes auditing (either by the government or by social auditors) easier. In the status quo,
documentation occurs only ex-post through data entry in nrega.nic.in, and is only loosely tied
in with actual expenditure. For example, in Bihar at the time of the intervention, there was a
delay of six months in getting 60% of the data entered, despite intense pressure from the Center
to the State. Hence, the ability to use expenditures documented by the GP as a monitoring tool
may be limited.11
Second, the intervention reduced the number of people involved in disbursing money. In
contrast to the �over�shing� set up analyzed, for example in Olken and Barron (2009), where
a number of players try to extract rent with no coordination, the setting here is one where the
lower level o�cial exerts e�ort (both the real e�ort and the corruption e�ort and risk) and the
higher level o�cials (at the block and the district) extract a tax. Since the IT infrastructure and
the data entry operator were at the block, the block o�cial remain in a key position of power
(in fact his power may be even bigger since he is now not o�cially responsible for anything, but
the data entry cannot happen without his cooperation). However, the district o�cials were now
entirely cut out. They were in fact quite aware of it, and our �eld report suggests that they
actively opposed the system. The e�ect on corruption is ambiguous: this can be understood
as a reduction in the tax rate on any corruption receipts of the lower GP o�cial. The income
e�ect would thus lead to a reduction in corruption. However, the substitution e�ect goes in the
opposite direction if the GP o�cial can keep a larger share of its gains.
Overall, the impact of the reform, which increased transparency and reduced the number
of intermediaries, should thus be to reduce corruption, unless the substitution e�ects were very
large.
2 . Impact on bene�ciaries
The impact of the reform on how well MGNREGS targets work demand is less clear.
On the one hand, several argue that the reduction in the number of workdays provided under
the scheme in states like Rajasthan, which is a star performer and has emphasised social audits,
11With the long delay, and bulk entry, it is easy to argue that any discrepancy between the records and thereality seen in the �eld is the result of a clerical errors, or poor recollection by the workers. Even though the casecan be made that on average there are both ghost days and ghost workers in the system, it is much more di�cultto build an individual case based on that evidence.
11

can be partially attributed to the strong control on corruption: GP o�cials basically see very
little upside in running the scheme. If the probability of an audit is large, and the consequence
potentially severe, organising work sites and projects may be more trouble than it's worth. This
is, in part, the argument that is routinely made by GP functionaries when they go on strike
(including the strike that happened during our project). More speci�c to the implementation of
this particular project, the new procedure turned out to be onerous for the GP o�cials, since
they had to go to the Block to access the proper IT infrastructure and were often dependent on
a DEO who was not necessarily very motivated. This added one more step for them to carry
out their responsibilities to provide the program, that some of them came to resent. If there is a
�xed cost to going to the Block, it also means that they prefer to do all the entry in bulk: they
may thus either pay workers with extra delay, or postpone starting new projects until they got
around to enter the data and get money.
On the other hand, several aspects of the status quo system could have lowered program
activity. First, since the advances are not systematic, but depends on the actions both of Block
and GP o�cials, there is considerable uncertainty on when and whether a GP will receive funds.
This means that they can be quite reluctant to start a project until they see money in the
account (but conversely the higher level o�cials may be reluctant to disburse money until they
see activities). The lack of a link between the disbursement and the expenses also mean that
some Panchayat may have money they don't spend while another cannot get money to �nance
projects, so that there are liquidity constraints at the local level even though there are funds in
the system on aggregate. Both of these problems are solved by the new system, making funds
availability less likely to be a constraint.12
3 . Impact on Program Costs
The reform in cash management systems should reduce �nancial costs for achieving program
outcomes by two mechanisms. First, by eliminating �oat funds parked at the GP level it should
reduce the overall requirement for funds to be transferred by the state. Second, by allowing GPs
to pull funds as and when they are needed, the distribution of funds should be more e�cient.
12Although unfortunately, the fact that the launch of the new system almost coincided with the State Poolrunning dry due to the con�ict with the Center over data entry means that the GP o�cials may not have perceivedthis advantage, and may in fact have wrongly made the opposite causal inference.
12

This should allow GP s to harmonize their funds requests with their spending levels, aligning
funds movement with program activity. Therefore, the improved cash management system should
reduce the �nancial costs to the state for achieving the same level of program activity.
III Data and Experimental Design
A Data
Our analysis makes use of multiple data sources. To measure GP-level MGNREGS expendi-
tures we combine two administrative sources. First, the CPSMS system which covers GP savings
accounts from September 2011 to January 2014. We observe every credit and debit made in the
account, which allows us to monitor daily spending in treatment and control GPs. The data
does not, however, identify transfer recipients. Second, nrega.nic.in which reports �scal year
expenditures from April 1st to March 31st of every year - the year 2012-13 includes a part of the
pre-intervention period and the treatment period. Data from nrega.nic.in allows us to decompose
expenditures into four categories - unskilled labour, material, skilled labour and administrative
expenses - which is not possible with CPSMS data.
To measure employment and wage payments we combine administrative reports and inde-
pendent survey data. Administrative data include work days and MGNREGS worker payments
as reported on the household job card in nrega.nic.in. These data likely include false worker
names and false accounting of days to workers (ghost workers and ghost days).
In May-July 2013 we conducted a survey of 10,036 households in 390 GP to independently
measure MGNREGS participation, employment and payments.13 Each household member was
asked about his/her participation in MGNREGS every week since July 2012 as well as the
amount, date and type of payments for each workspell.
To compare administrative reports and survey data for the same household, we attempted
to match survey households and nrega.nic.in job cards. The paucity of household information
provided on a job card restricts us to using household member name and age and we de�ne
households with at least one matched household member as matched. We matched 71% of the
survey sample to at least one job card, and each matched household was on average matched
13We randomly sampled two GP per block, and 25 households per GP. The survey methodology is detailed inAppendix V.
13

with 5.2 job cards. Matching imprecision implies that a comparison of employment levels across
survey and website data is unlikely to yield a reliable measure of total leakage. However, as
long as matching quality is similar across treatment and control, we can compare di�erences in
matching rates between treatment and control.
In parallel with the household survey, we also surveyed 4,165 MGNREGS infrastructure
projects (10 per GP) randomly sampled from o�cial reports in nrega.nic.in. Surveyors recorded
whether they could �nd the asset and whether it was completed. Finally, we conducted a
semi-qualitative interview of the head of each GP (Mukhiya). 358 Mukhiya could be located
and interviewed. We collected information on characteristics of the Mukhiya and her family,
including ownership of movable and immovable assets, as well as cattle. Part of the interview
was dedicated to issues with MGNREGS implementation. Mukhiyas were asked to provide
reasons for why two GPs in the same block could have di�erent spending levels. Their answers
were later transcripted and coded. At the end of the interview a simple lottery was used to
measure their risk preferences.
B Sample and Reform Implementation
Our �eld experiment spanned 12 districts in the South and West of Bihar, covering a rural
population of 33 million (see Figure 1). In each district one third of the blocks were randomly
selected to implement the new fund �ow (69 �treatment� blocks) and the remaining 126 �control�
blocks kept the status quo. The intervention was launched in September 2012 and concluded in
March 2013.
An important pre-requisite for implementing the reform was IT infrastructure for GPs to
connect to CPSMS.14 Appendix Table A.1 shows in July 2012, two months before the reform, a
minority of blocks had required facilities, and the number of computers and operators fell short
of meeting the requirements of three per block on average. By January 2013, �ve months into the
intervention period, a majority of treatment blocks had a generator, internet, scanner and printer
and the number of computers was close to ful�ll the requirements. In April 2013, immediately
after the intervention was rolled back, treatment blocks still had the required infrastructure,
and were better equipped than the control blocks. The number of data entry operators and
14These prerequisites included computers, data entry operators, generator to ensure constant power supply,internet access, scanner and printer.
14

computers, which were often hired on temporary contracts and could be laid o� as soon as the
data entry requirements were removed, had already fallen but remained higher than in control
blocks.
The intervention was o�cialy launched on September, 8th 2012 but in the following month the
MGNREGS pool of funds ran dry. Speci�cally, the federal ministry refused to release funds until
at least 60% of expenditures since April 2012 were documented on nrega.nic.in. This process took
close to three months and state funds were only replenished mid-December 2012. Moreover, soon
after GP functionaries went on strike for two weeks. Figure 4 shows that MGNREGS spending
fell sharply in September and rose only slowly in January 2013.15 This sequence of events
reduced treatment uptake and also led to perceptions that the reform may have contributed to
funds drying up.
Another early implementation hurdle arose from the fact that the bank which processed
payments at the CPSMS back end lacked resources to deal with large amounts of small invoices
sent by the GP in treatment blocks, and gave priority to larger invoices coming from Control
blocks. Treatment GPs eventually started sending larger invoices and the bank increased its
capacity.
The new fund �ow really started to function in January 2013. Figure 5 shows the fraction
of treatment GP who have used CPSMS once, which went up from less than 20% in December
2012 across all districts to 60% in April 2013. There is large heterogeneity across districts: the
best performing district, Begusarai had more than two third of Panchyat using the system in
December 2012, and the proportion reached more than 90% in April 2013. By contrast, the
fraction of GP using the system in Madhubani, the worst performing district only increased
slowly after December to reach 40% by April 2013.
C Empirical Methodology
In order to evaluate the e�ects of the intervention, we compare the GP in the 69 treatment
blocks with GP in the 126 control blocks. The random selection of treatment blocks ensures in
principle that the two groups of GP are ex ante identical. As a check, we examine pre-treatment
15Part of this variation is due to the seasonality of MGNREGS works themselves, which close during the peakseason of agriculture from July to December (Imbert and Papp 2014). However the dip was stronger in that year.
15

di�erences between treatment and control GPs from estimating regressions of the form:
Xpd = α+ βTp + ηd + εp
whereXpd is a vector of baseline characteristics of GP p in district d, Td is a dummy which is equal
to one if GP p is in a treatment block, ηd are district �xed e�ects, and erorrs εp are assumed to
be correlated within each block. The estimated coe�cient β represent pre-treatment di�erences
between treatment and control GP. Table 1 presents the results of the estimation. We observe
few signi�cant di�erences between the two groups. Villages in treatment and control GP have
similar socio-demographic characteristics and have the same level of infrastructures according
to 2001 census. Treatment GP are less likely to be reserved for women but the di�erence is
small (1.5 percentage point), we �nd no di�erence in caste reservation. Finally, according to
nrega.nic.in, Treatment GP had 15% higher MGNREGS labor expenditures between April 2011
and March 2012, i.e. the �nancial year preceding the intervention. The di�erence is signi�cant
at the 10% level. There is no di�erence in total MGNREGS spending between treatment and
control GP at baseline according to CPSMS.
A �rst set of results considers the e�ect of the intervention on MGNREGS expenditures,
which are measured at the GP level before, during and after the intervention. Let Ypdt denote
the outcome for GP p in district d for period t. As before, Tp is a dummy variable which equals
to one if GP p is in a treatment block and ηd is a district �xed e�ect. We estimate the following
equation separately for each period t:
Ypdt = α+ βTp + ηd + εpt (1)
where the errors εpt are clustered at the block level. The coe�cient β estimates the treatment
e�ect when t is the treatment period (September 2012 to March 2013). Whenever possible, we
split the intervention period to consider separately the September to December 2012 period,
when the state pool of funds was dry and the PRS were on strike, and the January to March
2013 period, when the new system was running smoothly.
A second set of results explores the e�ect of the intervention on household outcomes, such as
MGNREGS participation, employment and wages. Let Yhdt denote the outcome for household
16

h in district d at period t. Let Zh denote a vector of household characteristics, which includes
religion, caste, gender and literacy of the head of the household, household size, the number of
adults in the household, the type of house which the household occupies and a dummy variable
for whether the household owns land. Th is a dummy variable for whether the household lives
in a treatment block. We estimate the following equation separately for each period t:
Yhdt = α+ βTh + δZh + ηd + εht (2)
where standard errors are clustered at the block level.
Finally, we estimate the e�ect of the program on outcomes measured for the GP head, the
Mukhiya. We use a speci�cation similar to the one for household outcomes, except that the set
of controls now includes Mukhiya religion, caste category, gender, a dummy variable for whether
the Mukhiya has completed high school, a dummy variable for whether the Mukhiya is older
than 40, and two dummy variables for whether the Mukhiya or a family member was elected in
past elections held in 2001 and 2006, respectively.
IV Results
This section starts by examining the e�ect of the intervention on MGNREGS expenditures
and reported outcomes, before turning to actual MGNREGS outcomes measured by our inde-
pendent survey. Finally, it provides some evidence on the margin of leakages which was a�ected
by the reform.
A Program Financial Costs
1 . Reduction in Expenditure
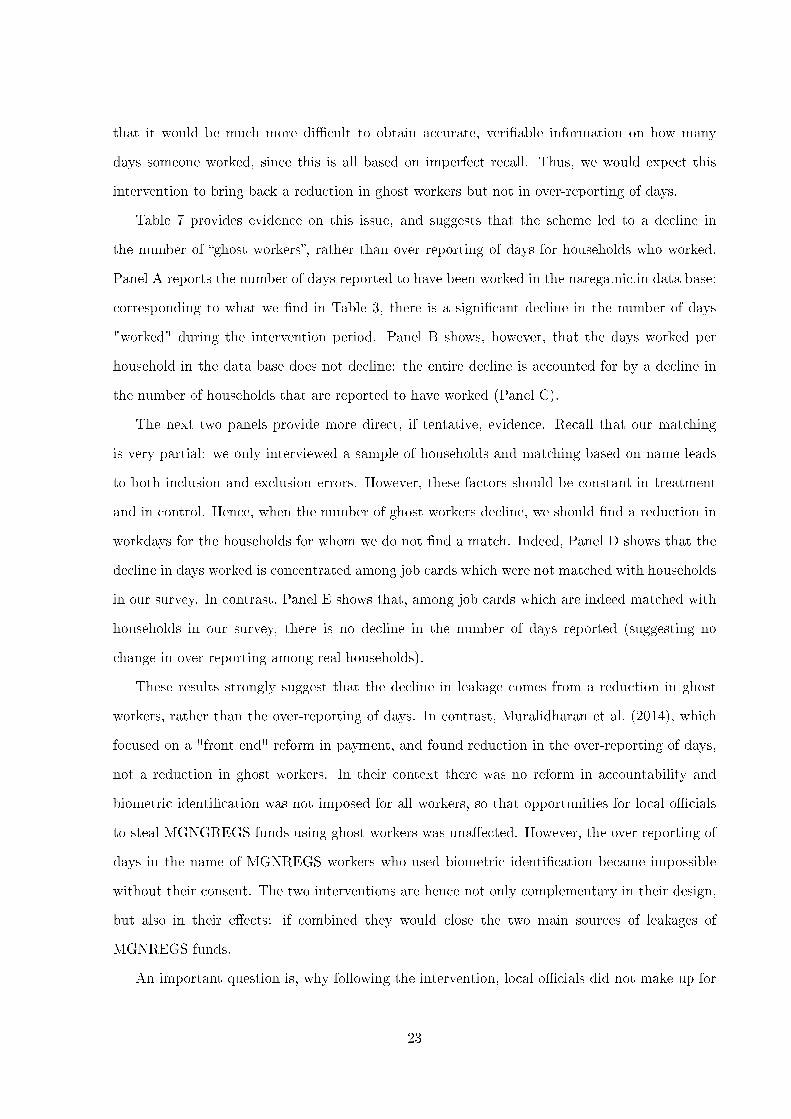
CPSMS data on daily debits from GP Savings Account allows us to compare MGNREGS
spending across treatment and control blocks. Figure 4 plots average daily spending in treatment
and control GPs for the three year period from July 2011 to January 2014. We observe a seasonal
pattern to spending in the �scal year prior to treatment which re�ects the fact that MGNREGS
work largely occurs in agricultural lean season.
In the year prior to treatment the spending trends are similar across treatment and control
17

GPs. However, between September 2012 and March 2013 a clear di�erence emerges with lower
spending in treatment as compared to control. After the intervention is rolled back on April 1
2013, treatment blocks rapidly converge back to control block spending levels. Panel C in Table 2
presents the same evidence with a regression analysis, using the estimating Equation 1 described
in the previous section. There is no signi�cant di�erence between treatment and control blocks
before the implementation period. Between September to December 2012, spending is 19% lower
in treatment blocks, and from January to March 2013 it is 31% lower. After April 2013 there is
no signi�cant di�erence in spending between treatment and control blocks.
The decline in MGNREGS spending in treatment blocks is con�rmed by data on nrega.nic.in
(which is entered independently from the �nancial data). Table 3 shows that for the �nancial
year 2012-13, i.e. between April 1st 2012 and March 31st 2013, expenditures on labour and
on materials were respectively 17% and 14% lower in treatment blocks. The intervention was
shorter than a �scal year, so the �scal year does not quite represent our intervention period.
Given their di�erent time spans of 7 and 12 months respectively, CPSMS and nrega.nic.in data
provide very consistent estimates for the negative e�ect of the intervention on spending. This is
not surprising as, eventually, it appears that about 100% of the expenditures in CPSMS (and
not just 60%) are eventually matched with records in the Nrega.nic.in data base.16
The treatment e�ect on material expenditures as reported in nrega.nic.in is an indirect impact
of the fund �ow reform: while materials were not a�ected by the change, there is a rule that
constraints material expenditure to be at most 40% of the total spending on a project, and
that rule is close to binding (it is close to be binding on aggregate as well in table 3). Thus,
the reduction in reported labor expenditure must be matched by a reduction in the material
expenditures.
2 . Reduction in Funds Float
I think this should go �rst. Discuss Panel A, B then C of Table 2. By linking funds released
to reported expenditures the electronic transfer system reduced the amount of �oat held in
treatment GP accounts. Panel B in Table 2 illustrates this e�ect. The balance of GP accounts
was the same in treatment and control blocks at the beginning of the intervention in September
16Appendix Table A.2 compares annual expenditures per GP in CPSMS and nrega.nic.in. The discrepanciesare only about 8-11% in 2012-13.
18

2012 and declined both in control and treatment until December 2012, because the state pool of
funds was dry and the GP depleted their accounts. However, by December 2012, the state pool
was replenished and control GP received large instalments, while treatment GP only received
funds corresponding to the expenditures they had documented in the electronic system. By the
end of the intervention in April 2013, the balance in treatment GP was 25% lower than the
balance in control. Hence, on the top of the decline in expenditures, the state transferred Rs.
200 million, or 3.5 million dollars less to treatment GP.
By the end of the intervention, MGNREGS expenditure declined by 25% and GP account
balances were reduced by 25%. In combination, the reduction in expenditure and funds �oat
reduced the �nancial cost to the state for implementing the program in treatment GPs by 38% as
the Panel A in Table 2 shows. However, this reduction in �nancial costs of the program could be
due to a reduction in real outcomes (days of employment o�ered, and asset built), or a reduction
in leakage, or both. We now turn to this question by using our household survey to measure real
outcomes.
B Actual MGNREGS Outcomes
1 . Employment
Using household survey data we construct three measures of MGNREGS employment. The
�rst is a binary indicator of participation in MGNREGS, the second is the number of weeks in
which households declare having worked in MGNREGS, the third is the number of days worked.
We regress these outcomes on a treatment dummy, household controls and district �xed e�ects
using Equation 2 from the previous section.
Panel A of Table 4 reports treatment impacts on the probability of participating in MGN-
REGS. The estimates are small and insigni�cant for the whole of the period from July 2012 to
July 2013, as well as for the intervention period only. Note that MGNREGS participation rates
were low at 4%, arguably re�ecting the relative lack of funds in Financial year 2012-2013.17
17The mean of 4% of households having participated in the scheme in the study period is lower than the 9%participation found for Bihar for July 2011 to June 2012 in the NSS. This is not a measurement issue, but tothe time period. When we aggregate our weekly observations to an entire year, we also �nd a participation of8%. We also asked the household head whether anybody had participated in the scheme �since the last rainyseason�, and 9% of households report that they did. The treatment e�ect, presented in table A.3 is the same.The lower number during the intervention period is due to the fact that the intervention period did not cover thepeak season of unemployment under the scheme: it started just after one and was cancelled just before the next
19

Nevertheless, given the small size of the standard errors, the results imply a precisely esti-
mated zero e�ect of the intervention on MGNREGS employment. Treatment e�ect estimates on
the number of weeks of public employment in Panel B of Table 4 yield the same conclusion. If
anything, the probability that a household works in a given week is higher in treatment blocks,
but the di�erence is not signi�cant.
Panel C of Table 4 presents the estimated e�ect on the number of days provided, which may
include more measurement error (since it is based on retrospective questions and recall of the
exact number of days may be an issue). The treatment impacts are similar to those of the number
of weeks and participation rate. The number of days worked was a little lower in treatment just
before the intervention started. To the extent this was some underlying di�erence, the simple
di�erence in the post period may actually under-estimate the treatment e�ect.18
2 . Labor Payments
Table 5 shows the impact on wage payment to households (from the household survey). For
each spell worked in MGNREGS, the respondents declared whether, when, and how much they
had been paid at the time of the survey.
As for the probability of working (Panel A), there was a small underlying di�erence between
treatment and control before the intervention started (wage payments were somewhat lower in
the treatment). There is however no signi�cant e�ect on payments made for work spells during
the intervention. The estimates are noisily estimated, equivalent to -11% of payments in control
during the �rst four months and +14% during the next three months. The total e�ect is an
insigni�cant -0.7%.
Panel B of Table 5 yields further insight about the e�ect of the intervention on MGNREGS
payments. As compared to an average delay of 73 days in the control, workers employed during
the �rst phase of the intervention (Sep-Dec 2012) in treatment blocks waited 44 more days for
their payment. The e�ect is large, and statistically signi�cant. Workers who worked during
the second phase of the intervention also waited longer in treatment than in control blocks but
the di�erence is smaller (11 days) and statistically insigni�cant. These results suggest that the
one.18We also �nd that participation in MGNREGS was lower before the intervention in treatment GP, but the
di�erence is not signi�cant (see Appendix Table A.3).
20

intervention slowed down the disbursement of funds to GP, and further delayed workers payments,
especially during the �rst phase of the intervention. Qualitatively, this is corroborated by the
Mukhiyas whom we interviewed in parallel to the household survey. Results presented in Panel
C of Appendix Table A.4 shows that twice as many Mukhiyas either spontaneously declared or
agreed with the view that the CPSMS created delays in fund �ow in treatment (34%) than in
control blocks (17%).
This increase in delay in payment is not inocuous, and is a signi�cant downside of the inter-
vention, as implemented at least initially. The scheme is designed to serve as insurance in the
lean period, and delays in payment signi�cantly hampers its ability to play this role: a delay
in 73 days essentially means that work done during the worst seasons is paid for during the
high season. An objective of the scheme was to reduce this delay by removing steps in the fund
�ow, but it had the opposite e�ect. There are two reasons for this, which might both have been
temporary: the �rst is that, in the early days, the bank handling CPSMS payment found itself
completely deluged with the small payment request coming from the GP s. They responded by
waiting for a batch of invoices to treat them together, which caused delays. The second is that
GP level functionaries delayed the data entry (since it required traveling to the block o�ce),
and thus the payments. All these interpretations and the smaller and insigni�cant treatment
e�ect during the second part of the intervention period suggests that the problem may have been
temporary, but was still a failure of the intervention.
The increase in delays could have had a negative unintended consequence. One way in which
Mukhyas or other GP functionaries take advantage of the delays in payment is by lending worker
money. They pay them immediately, but when the funds do come and get to the Postal Account,
they get reimbursed. The interest is collected in advance by paying the workers less than what
they are due. Repayment is enforced by collecting the worker's bank passbook, and cashing out
their postal account on their behalf. Panel C of Table 5 suggests that this apparently was not the
case: instances of illegal advance payment are indeed frequent (a quarter to a third of payments
in the control group), but they are not increased by the intervention. Using our survey, we also
compare household consumption levels in the treatment as compared to control GP and �nd no
evidence of a long term cost on treatment households (Appendix Table A.5).
21

3 . MGNREGS projects
Another check of whether there was any decline in real activities is provided by looking at
the infrastructure built under the program. Table 6 shows that the number of MGNREGS assets
reported as having started (Column One) or being complete (Column Two) in the nrega.nic.in
data base is the same in treatment and control (note the very low fraction of complete project
relative to started project). We sent teams to the villages with a list of infrastructures to �nd.
The fraction found is actually high (86%), and remains similar in the treatment and in the control
blocks.
C Leakages: Over-reporting of days or Ghost workers?
Overall, our �ndings suggest that the 25% decline in MGNREGS spending in the treat-
ment blocks does not re�ect a drop in public employment provision, but rather reduced leakages
of MGNREGS funds. The existing evidence reviewed in section II shows that corruption in
MGNREGS administration is widespread, and available estimates suggest that more than 20%
of MGNREGS funds are stolen by local o�cials. The local politicians we surveyed, who may
themselves participate in the corruption nexus, often complain about corruption in the admin-
istration: in control blocks, 20% of them mentioned it spontaneously and 26% agreed that it
was a main issue in MGNREGS implementation. Interestingly, the fraction of politicians who
thought this was an issue is signi�cantly lower, by 10 percentage point, in the treatment blocks
(see Appendix Table A.4).
Since the reports in the nrega.nic.in data base decline proportionally to the decline in expen-
ditures measured in CPSMS (table 3), and labor payments in that data base are directly linked
to days worked by individual workers, we can directly investigate whether there are now fewer
�ghost� workers (people who are reported to be paid but are non-existent, or exist but have never
worked), or fewer over reporting of workdays (people who have worked under the scheme but for
fewer days than what is reported).
The fund �ow reform increases accountability: it now becomes easier to send an auditor to
the �eld to verify that a particular person has been employed. However, while it is relatively
easy to verify that someone indeed exists in the village (and is thus not a true �ghost�) or that
someone who exists has in fact ever been employed (another form of �ghost� worker), it seems
22
that it would be much more di�cult to obtain accurate, veri�able information on how many
days someone worked, since this is all based on imperfect recall. Thus, we would expect this
intervention to bring back a reduction in ghost workers but not in over-reporting of days.
Table 7 provides evidence on this issue, and suggests that the scheme led to a decline in
the number of �ghost workers�, rather than over reporting of days for households who worked.
Panel A reports the number of days reported to have been worked in the narega.nic.in data base:
corresponding to what we �nd in Table 3, there is a signi�cant decline in the number of days
"worked" during the intervention period. Panel B shows, however, that the days worked per
household in the data base does not decline: the entire decline is accounted for by a decline in
the number of households that are reported to have worked (Panel C).
The next two panels provide more direct, if tentative, evidence. Recall that our matching
is very partial: we only interviewed a sample of households and matching based on name leads
to both inclusion and exclusion errors. However, these factors should be constant in treatment
and in control. Hence, when the number of ghost workers decline, we should �nd a reduction in
workdays for the households for whom we do not �nd a match. Indeed, Panel D shows that the
decline in days worked is concentrated among job cards which were not matched with households
in our survey. In contrast, Panel E shows that, among job cards which are indeed matched with
households in our survey, there is no decline in the number of days reported (suggesting no
change in over-reporting among real households).
These results strongly suggest that the decline in leakage comes from a reduction in ghost
workers, rather than the over-reporting of days. In contrast, Muralidharan et al. (2014), which
focused on a "front end" reform in payment, and found reduction in the over-reporting of days,
not a reduction in ghost workers. In their context there was no reform in accountability and
biometric identi�cation was not imposed for all workers, so that opportunities for local o�cials
to steal MGNGREGS funds using ghost workers was una�ected. However, the over-reporting of
days in the name of MGNREGS workers who used biometric identi�cation became impossible
without their consent. The two interventions are hence not only complementary in their design,
but also in their e�ects: if combined they would close the two main sources of leakages of
MGNREGS funds.
An important question is, why following the intervention, local o�cials did not make up for
23

the lost ghost workers by over-reporting more. It is possible that there is some limit to how
much over-reporting of workdays can be done in the name of existing workers, e.g. because of
the limited number of infrastructure projects carried out. Conversely, Muralidharan et al. (2014)
do not �nd evidence of increased employment among ghost workers when over-reported days
decline.
V Conclusion
This paper reports on a large-scale �eld experiment that evaluated a seven-months reform
to the within-state fund �ow system for MGNREGS � India's federal workfare program. Our
evaluation covered a population of 33 million in one of India's poorest states � Bihar.
The introduction of an electronic funds management platform o�ered to the Bihar government
an opportunity to pilot reforms to the MGNREGS fund �ow. The reform linked fund �ow to
incurred expenditures and reduced the number of intermediaries involved in the process. The
reform led to very signi�cant reductions in funds leakages in treatment blocks: MGNREGS
expenditures declined by 25% with no corresponding change in real outcomes.
To the extent that the reductions in expenditure re�ects lower program leakage, we would
expect earnings of some o�cials involved in fund �ow for MGNREGS to be lowered. We explore
this using survey data on assets of the GP head (Mukhiya) and assets of MGNREGS functionar-
ies. While we are still �nalizing data entry of the asset declaration by MGNREGS functionaries
(at the GP and block level), Figure 7, 8 and 9 provides suggestive evidence. During the interven-
tion (i.e. before they could accumulate more), the distribution of assets look similar in treatment
and control (Figure 7). After the intervention, the distribution of asset appear to shift to the
right in the treatment group (Figure 8). Quantile regression estimates presented in Figure 9
show that, up to the median, the quintile of the distribution of asset declines in the treatment
group after the intervention, compared to the treatment group. The decline is about 20% for
all those lower quantiles.19. The e�ect disappears at the higher quantiles, perhaps because at
those higher levels, the assets cannot be explain any more by leakage in MGNREGS. The point
estimate of the treatment on the average wealth reported is not signi�cant (this may change with
19we present unclustered standard errors and block-bootstrapped standard errors�with an administrative blockas the unit of block-boostraping
24

better data) but it is still 14%. We should also note that because the randomization was done
within districts, our analysis precludes district o�cials who were arguably the biggest losers from
the reform, which excluded them entirely from the wage funds.
On the �ip side, the reform was not adequate to improve administrative ability to respond
to villager needs� neither employment nor wages received by households rose and we �nd some
evidence of increased payment delays for the �rst four months. The reform also likely increased
administrative burdens on GP o�cials. The technical challenges with managing a computer-
based system in areas with frequent electricity shortages and limited IT help should not be
underestimated. In addition, lack of coordination between CPSMS and nrega.nic.in meant worker
details had to be entered twice. As would be expected, the personnel costs, frustrations with
lags in infrastructure rollout and dismay over a reformed system which reduced rents was well
vocalized. In contrast, state o�cials in the capital city lacked information on whether the
observed decline in expenditure re�ected lower rent seeking or a genuine decline in employment
provision. Thus, at the end of the �scal year, state-level o�cials were well aware of the personnel
and infrastructure costs of the program but had limited knowledge of the revenue bene�ts, which
convinced them to roll back the intervention.
The reform also demonstrates that better cash management systems can achieve the same
program outcomes with less �nancial resources, e�ectively reducing the overall cost of program
implementation. However, this study only examines the implications of reducing parked funds at
the GP level. It should be possible to implement similar cash management systems to eliminate
parked funds at State, District and Block level agencies. These systems could be extended to
cover bene�ciary payments in a manner that allows implementation agencies to initiate ben-
e�ciary payments directly from a central pool of funds. Such cash management systems can
completely eliminate the need to maintain parked funds at all levels of the programme imple-
mentation level, and support reduction in program costs at a much larger scale. The need for
better cash management models is not exclusive to MGNREGS: the Government of India spends
approximately Rs 3 trillion ($50 billion) every year on Centrally Sponsored Schemes for which
money is released to implementating agencies in lumpy instalments.
25

References
Azam, M. (2012). The Impact of Indian Job Guarantee Scheme on Labor Market Outcomes:
Evidence from a Natural Experiment. IZA Discussion Paper. 1
Bó, E. D., F. Finan, and M. A. Rossi (2013). Strengthening State Capabilities: The Role of
Financial Incentives in the Call to Public Service. The Quarterly Journal of Economics 128 (3),
1169�1218. I
Banerjee, A., R. Chattopadhyay, E. Du�o, D. Keniston, and N. Singh (2012, March). Improving
Police Performance in Rajasthan, India: Experimental Evidence on Incentives, Managerial Au-
tonomy and Training. NBER Working Papers 17912, National Bureau of Economic Research,
Inc. I
Banerjee, A., S. Mullainathan, and R. Hanna (2012, April). Corruption. NBER Working Papers
17968, National Bureau of Economic Research, Inc. I
Banerjee, A. V. (1997, November). A Theory of Misgovernance. The Quarterly Journal of
Economics 112 (4), 1289�1332. I
Barnwal, P. (2014, November). Curbing leakages in public programs with biometric identi�cation
systems: Evidence from india's fuel subsidies. Manuscript. I
Berg, E., S. Bhattacharyya, R. Durgam, and M. Ramachandra (2013, October). Can Rural Public
Employment Schemes Increase Equilibrium Wages? Evidence from a Natural Experiment
inIndia. 1
Burgess, R., M. Hansen, B. A. Olken, P. Potapov, and S. Sieber (2012). The Political Economy
of Deforestation in the Tropics. The Quarterly Journal of Economics 127 (4), 1707�1754. I
Deininger, K. and Y. Liu (2013). Welfare and poverty impacts of india's national rural employ-
ment guarantee scheme. Technical Report 6543, World Bank Policy Research Working Paper.
1
Du�o, E., M. Greenstone, R. Pande, and N. Ryan (2013). Truth-telling by Third-party Auditors
and the Response of Polluting Firms: Experimental Evidence from India. The Quarterly
Journal of Economics 128 (4), 1499�1545. I
26

Dutta, P., R. Murgai, M. Ravallion, and D. van de Walle (2012). Does India's employment
guarantee scheme guarantee employment ? Policy Research Discussion Paper 6003, The
World Bank. A
Dutta, P., R. Murgai, M. Ravallion, and D. van de Walle (2014, March). Right to Work?
Assessing India's Employment Guarantee Scheme in Bihar. Number 17195 in World Bank
Publications. The World Bank. A, 1 .
Ferraz, C. and F. Finan (2011, June). Electoral accountability and corruption: Evidence from
the audits of local governments. American Economic Review 101 (4), 1274�1311. I
Imbert, C. (2014). Mgnregs labor markets and poverty. Technical report. Background paper for
the Social Protection and Labour India Team, World Bank. A
Imbert, C. and J. Papp (2011). Estimating Leakages in India's Employment Guarantee. In
R. Khera (Ed.), Battle for Employment Guarantee, pp. 269�278. Oxford University Press. A
Imbert, C. and J. Papp (2014). Short-term Migration and Rural Workfare Programs: Evidence
from India. Manuscript. 1
Imbert, C. and J. Papp (2015). Labor market e�ects of social programs: Evidence from india's
employment guarantee. American Economic Journal: Applied Economics 7 (2), 233�63. A
Imbert, C. and J. Papp (forthcoming). Labor market e�ects of social programs: Evidence from
india's employment guarantee. American Economic Journal - Applied Economics. 1
Mathew, S. and M. Moore (2011). State incapacity by design: Understanding the bihar story.
Technical report, Institute of Development Studies. IDS Working Papers. A
Muralidharan, K., P. Niehaus, and S. Sukhtankar (2014, March). Building State Capacity:
Evidence from Biometric Smartcards in India. NBER Working Papers 19999, National Bureau
of Economic Research, Inc. I, 2 ., C
Niehaus, P. and S. Sukhtankar (2013, November). Corruption Dynamics: The Golden Goose
E�ect. American Economic Journal: Economic Policy 5 (4), 230�69. I
Olken, B. A. (2006, May). Corruption and the costs of redistribution: Micro evidence from
indonesia. Journal of Public Economics 90 (4-5), 853�870. I
27

Olken, B. A. (2007). Monitoring corruption: Evidence from a �eld experiment in indonesia.
Journal of Political Economy 115, 200�249. I
Olken, B. A. and P. Barron (2009, 06). The Simple Economics of Extortion: Evidence from
Trucking in Aceh. Journal of Political Economy 117 (3), 417�452. I, 1 .
Olken, B. A. and R. Pande (2012, 07). Corruption in Developing Countries. Annual Review of
Economics 4 (1), 479�509. I
Ravallion, M., D. van de Walle, P. Dutta, and R. Murgai (2013, September). Testing information
constraints on India's largest antipoverty program. Policy Research Working Paper Series 6598,
The World Bank. A
Reinikka, R. and J. Svensson (2011, August). The power of information in public services:
Evidence from education in uganda. Journal of Public Economics 95 (7-8), 956�966. I
Shleifer, A. and R. W. Vishny (1993, August). Corruption. The Quarterly Journal of Eco-
nomics 108 (3), 599�617. I
The Economist (2010, January). Bihar's remarkable recovery. The Economist . A
28

Figure 1: Map of Sample Districts
Figure 2: MGNREGS Fund-�ow in Control BlocksStatus Quo State Pool in Central Bank of India
CPSMS Access
Panchayat Savings Account
Fund
Req
uest
Panchayat
Fund Transfer
Block
District
1
2
3
4
5
29

Figure 3: MGNREGS Fund-�ow in Treatment BlocksInterven'on State Pool in Central Bank of India
CPSMS Access
Panchayat Savings Account
Fund
Req
uest
Panchayat
Fund Transfer 1
2
Figure 4: GP daily Expenditures on MGNREGS during the Study Period
30

Figure 5: Fraction of Treatment GP which used CPSMS at least once
Figure 6: GP Daily Expenditures on MGNREGS in Treatment and Control Blocks
31

Figure 7: Asset of MGNREGS functionaries: during the intervention
Figure 8: Asset of MGNREGS functionaries: after the intervention
32

Figure 9: Quantile Treatment E�ect on GP and Block functionaries after the intervention
Figure 10: Treatment e�ect on the balance of GP accounts
33

Table 1: Balance test
Panchayat Characteristics SourceControl Blocks
Treatment Blocks
Difference
Superficy (hectares) 2001 Census 1582 1617 34.95Number of households 2001 Census 1302 1276 -26.21% SC Population 2001 Census 0.248 0.247 -0.000538% ST Population 2001 Census -0.000679 0.0035 0.00418Literacy Rate 2001 Census 0.554 0.547 -0.00675% Population in village with education facility 2001 Census 0.233 0.206 -0.0273% Population in village with medical facility 2001 Census 0.0569 0.0503 -0.00666% Population in village with post office 2001 Census 0.0341 0.0362 0.00209% Population in village with bank branch 2001 Census 0.0155 0.0138 -0.00162% Population in village with electricity supply 2001 Census 0.0337 0.00721 -0.0265*% Land Irrigated 2001 Census 0.108 0.1 -0.00720Political reservation for women State Election Commission 0.463 0.447 -0.0155**Political reservation for Other Backward Caste State Election Commission 0.177 0.169 -0.00833Political reservation for Scheduled Caste State Election Commission 0.238 0.241 0.00371Political reservation for Scheduled Tribe State Election Commission -0.000774 0.00155 0.00232MGNREGS beneficiary households nrega.nic.in (Apr 2011-Mar 2012) 243.2 253.3 10.16MGNREGS work days provided nrega.nic.in (Apr 2011-Mar 2012) 9066 9485 418.9MGNREGS labor expenditures (lakhs) nrega.nic.in (Apr 2011-Mar 2012) 6.307 7.343 1.036*MGNREGS material expenditures (lakhs) nrega.nic.in (Apr 2011-Mar 2012) 7.073 7.645 0.572MGNREGS panchayat spending CPSMS (Jul 2011-Mar 2012) 16.11 15.95 -0.153Number of Panchayat 1953 1003Note: The unit of observation is a Panchayat. The difference between control and treatment blocks is estimated using a regression of each Panchayat characteristic on a dummy equal to one for treatment blocks and district fixed effects. Standard errors are clustered to take into account correlation at the block level. Stars denote signicance levels. *, ** and *** denote significant differences at the 10%, 5% and 1% levels respectively.
34

Table 2: Treatment e�ect on MGNREGS spending (CPSMS)
Before the intervention After the interventionJuly 2011 - Sep 2012 Sept-Dec
2012Jan - Mar
2013Whole Period Apr 2013 - Jan 2014
(1) (2) (3) (4) (5)Panel A: Total Credit to Panchayat AccountsTreatment 0.164 -2.199*** -1.284*** -3.471*** 0.857
(1.093) (0.376) (0.339) (0.557) (0.964)Observations 2,918 2,918 2,917 2,919 2,766Mean in Control 19.47 5.102 3.984 9.079 16.69Effect as % of Control Mean 0.842 -43.11 -32.24 -38.23 5.135Panel B: Average Balance in Panchayat AccountsTreatment -0.0811 -0.436** -1.577*** -1.005*** -0.347
(0.129) (0.190) (0.213) (0.187) (0.244)Observations 2,918 2,918 2,917 2,919 2,766Mean in Control 3.639 3.719 4.174 3.945 4.493Effect as % of Control Mean -2.227 -11.71 -37.78 -25.47 -7.724Panel C: Total Debit from Panchayat AccountsTreatment -0.360 -1.034*** -1.300*** -2.324*** -0.449
(0.961) (0.322) (0.283) (0.540) (0.974)Observations 2,918 2,918 2,917 2,919 2,766Mean in Control 18.38 5.367 4.126 9.487 16.71Effect as % of Control Mean -1.959 -19.26 -31.51 -24.50 -2.685
During the intervention
Note: The unit of observation is a Panchayat. In Panel A the dependent variable is the sum of credits made to the savings account of each Panchayat for each period (in lakhs Rupees). In Panel B the dependent variable is the average balance on the savings account of each Panchayat during each period (in lakhs Rupees). In Panel C the dependent variable is the sum of debits from the savings account of each Panchayat for each period (in lakhs Rupees). Treatment is a dummy which is equal to one for the blocks selected for the intervention. All specifications include district fixed effects. Standard errors are clustered at the block level.
35

Table 3: Treatment e�ect on MGNREGS spending (nrega.nic.in)
Expenditure items Labor Material Labor Material Labor Material(1) (2) (3) (4) (5) (6)
Treatment 0.996** 0.508 -2.270*** -1.077** -0.271 0.315(0.495) (0.432) (0.760) (0.526) (0.729) (0.534)
Observations 2,950 2,950 2,947 2,947 2,954 2,954Mean in Control 7.551 6.504 13.83 7.717 13.66 8.377Effect as % of Control Mean 13.19 7.807 -16.42 -13.96 -1.980 3.758
Annual Panchayat Expenditures from nrega.nic.inApr 2011-Mar 2012 Apr 2012-Mar 2013 Apr 2013-Mar 2014
Note: The unit of observation is a Panchayat. The dependent variables are expenditures from MIS reports for financial years 2011-12, 2012-13, 2013-14 (in lakhs Rupees). Data was downloaded from the MGNREGS website (nrega.nic.in) in November 2014. The intervention started in September 2012 and ended on March 31st, 2013. Treatment is a dummy which is equal to one for the blocks selected for the intervention. All specifications include district fixed effects. Standard errors are clustered at the block level.
36

Table 4: Treatment e�ect on MGNREGS employment (household survey)
Before intervention
Since Intervention
Jul - Aug 2012
Sept-Dec 2012
Jan-Mar 2013
Whole Period
Apr - Jun 2013
(1) (2) (3) (4) (5)
Treatment -0.00673*** 0.000417 0.00188 0.00225 0.00355(0.00240) (0.00391) (0.00304) (0.00528) (0.00505)
Observations 9,969 9,969 9,969 9,969 9,969Mean in Control 0.0124 0.0217 0.0174 0.0378 0.0391Effect as % of Control Mean -54.47 1.921 10.80 5.966 9.078
Treatment -0.00697 0.0141 0.0260 0.0402 0.00837(0.0227) (0.0308) (0.0323) (0.0564) (0.0330)
Observations 9,969 9,969 9,969 9,969 9,969Mean in Control 0.0853 0.151 0.172 0.324 0.184Effect as % of Control Mean -8.176 9.335 15.10 12.41 4.558Panel C: Number of days workedTreatment -0.153*** 0.0627 0.138 0.200 0.0873
(0.0493) (0.147) (0.139) (0.225) (0.359)Observations 9,969 9,969 9,969 9,969 9,969Mean in Control 0.231 0.676 0.515 1.192 1.825Effect as % of Control Mean -66.47 9.266 26.69 16.80 4.786
Panel A: MGNREGS Participation
Panel B: Number of weeks worked
Intervention Period
Note: The unit of observation is a household. In Panel A the dependent variables is a dummy variable which is equal to one if any household member participated to MGNREGS. In Panel B the dependent variable is the total number of weeks worked by household members under MGNREGS. In Panel C the dependent variable is the total number of days worked by household members. The data was collected by a representative survey of 10,036 households in May-July 2013. Households were asked about work spells from July 2012 to the time of the survey. Treatment is a dummy which is equal to one for the blocks selected for the intervention. All specifications include district fixed effects and household controls. Household controls include sets of dummies for religion, caste, type of housing, land ownership, gender and literacy of the household head, household size and number of adults.
37

Table 5: Treatment e�ect on MGNREGS payments (household survey)
Before Intervention
Since Intervention
Jul - Aug 2012
Sept - Dec 2012
Jan - Mar 2013
Whole PeriodApr - Jun
2013(1) (2) (3) (4) (5)
Panel A: Wages received for MGNREGS employment Treatment -18.06*** -6.821 6.106 -0.716 -25.03
(5.854) (15.09) (12.62) (22.44) (26.75)Observations 10,036 10,036 10,036 10,036 10,036Mean in Control 24.33 59.88 43.54 103.4 113.5Effect as % of Control Mean -74.22 -11.39 14.02 -0.692 -22.06Panel B: Average delays in payment (days)Treatment -18.54 44.09*** 10.92 28.19*** -1.798
(23.43) (15.31) (8.770) (10.33) (6.104)Observations 123 218 175 379 383Mean in Control 73.44 72.61 45.15 60.12 38.41Effect as % of Control Mean -25.24 60.73 24.19 46.90 -4.682Panel C: Illegal advance paymentsTreatment -0.0488 -0.0163 0.0625 0.00235 0.0436
(0.136) (0.0802) (0.0912) (0.0590) (0.0565)Observations 104 176 143 309 250Mean in Control 0.394 0.273 0.294 0.291 0.380Effect as % of Control Mean -12.38 -5.989 21.29 0.805 11.47Note: The unit of observation is a household. In Panel A The dependent variable is total wage payments received by each household for MGNREGS employment. In Panel B the dependent variable is the average number of days between the time of work spells and the time of each payment. When payments have not been made at the time of the survey, the delay is set equal to the time between the work spell and the survey date. In Panel C the dependent variable is a binary variable which is equal to one if any household member has received a payment for MGNREGS work in cash within 15 days of the work spell. The data was collected by a representative survey of 10,036 households in May-July 2013. Households were asked about all work spells since July 2012. The intervention period is Sept 1st 2012-March 31st 2013. Treatment is a dummy which is equal to one for the blocks selected for the intervention. All specifications include district fixed effects and household controls. Household controls include sets of dummies for religion, caste, type of housing, land ownership, gender and literacy of the household head, household size and number of adults.
Intervention Period
38

Table 6: Treatment e�ect on MGNREGS infrastructures
Number Registered
Number Completed
Fraction Found
(1) (2) (3)Treatment 0.0494 0.372 0.0176
(0.263) (0.342) (0.0176)Observations 390 390 4,165Mean in Control 13.82 2.126 0.855Effect as % of Control Mean 0.357 17.48 2.057Note: In column one and two the unit of observation is a Panchayat. In column three the unit of observation is a MGNREGS infrastructure projects. The dependent variables are the number of projects registered in the MIS (nrega.nic.in) (1), the number of projects declared as complete in the MIS (2), and the fraction of assets sampled which were actually found by surveyors (3). Out of 5391 projects registered in nrega.nic.in, a random sample of 4165 projects were surveyed. All specifications include district fixed effects.
39

Table 7: Treatment e�ect on MGNREGS employment reported in nrega.nic.in
Before intervention
Intervention Period
Since Intervention
(1) (2) (3)
Treatment -245.8 -692.8* -890.2(340.5) (364.1) (543.4)
Observations 2,941 2,941 2,941Mean in Control 4956 5008 10567Effect as % of Control Mean -4.959 -13.83 -8.424
Treatment -0.578 0.0530 -0.116(0.797) (0.935) (0.841)
Observations 2,874 2,856 2,930Mean in Control 28.54 33.57 40.29Effect as % of Control Mean -2.025 0.158 -0.288
Treatment 0.853 -14.20* -15.16(9.940) (8.141) (9.941)
Observations 2,941 2,941 2,941Mean in Control 168.2 139.6 249.5Effect as % of Control Mean 0.508 -10.17 -6.079
Treatment -250.5 -704.0* -910.8*(336.8) (360.1) (534.4)
Observations 2,941 2,941 2,941Mean in Control 4896 4954 10440Effect as % of Control Mean -5.117 -14.21 -8.725
Treatment 0.764 -3.829 27.98(30.66) (62.09) (67.96)
Observations 372 372 372Mean in Control 89.89 456.4 436.1Effect as % of Control Mean 0.850 -0.839 6.416
Panel E: Days worked by household matched with survey (nrega.nic.in)
MGNREGS days worked per household
Panel A: Days worked (nrega.nic.in)
Panel B: Days per working household (nrega.nic.in)
Panel C: Number of working households (nrega.nic.in)
Panel D: Days worked by household not matched with survey (nrega.nic.in)
Note: The unit of observation is a Panchayat. In Panel A the dependent variable is the total number of days provided. In panel B the dependent variable is the total number of days provided to households reported to have worked. In panel C the dependent variable is the number of households reported to have worked. In panel D the dependent variable is the number of days worked by households who could not be matched with survey households. In Panel E the dependent variable is the number of days worked by households matched with survey households. The data was extracted from Job card information on the nrega.nic.in server. It covers the period from July 2011 to Sept 2013. Treatment is a dummy which is equal to one for the blocks selected for the intervention. All specifications include district fixed effects.
40

APPENDIX: FOR ONLINE PUBLICATION ONLY
Data Appendix
In this appendix, we describe the di�erent sources of information we use in the analysis. We
�rst present the o�cial data on expenditures and employment, and then turn to the surveys we
implemented to assess actual MGNREGS implementation.
We use two sources of o�cial reports on MGNREGS expenditures and employment: CPSMS
and nrega.nic.in.
CPSMS: In July 2014, we were granted access to detailed information MGNREGS expendi-
tures via the Central Planning Scheme Monitoring (CPSMS) Portal. Both treatment and control
GP were monitored in the system from July 2011 onward, and we could observe all credit and
debit transactions from GP savings account. We use this information to compute MGNREGS
spending per GP for the di�erent periods of interests: from July 2011 to the start of the in-
tervention in September 2012, from September 2012 to December 2012, from Januaray 2013 to
March 2013 and from the end of the intervention in April 2013 until July 2014.
NREGA.NIC.IN: The government website nrega.nic.in provides publicly available infor-
mation on MGNREGS expenditures per GP for every �nancial year (a �nancial year start on
April 1st). In July 2014, using a newly available facility called the Public Data Portal (jointly
produced by the Ministry of Rural Development and Evidence for Policy Design) we downloaded
data on GP spending on labor and material for the �nancial years 2011-12, 2012-13 and 2013-14.
Labor expenditures �gures in nrega.nic.in are aggregates of work and payment details of each
MGNREGS worker which is also entered on the website and made publicly available in the form
of job cards. We requested access to job card information from the Ministry of Rural Devel-
opment and were provided with all job card details of workers in our sample districts for the
�nancial years 2011-12, 2012-13 and 2013-14.
In order to provide independent measures of MGNREGS implementation, we carried out our
own survey in the 12 sample districts between May and July 2013. Within each district, we
visited every block � in total, we had 69 treatment blocks and 126 control blocks, 195 blocks in
total. We surveyed 2 randomly sampled GP s in each block � this gave us a total of 390 GP s.
41

The survey consisted of three main surveys: a household survey, a survey of MGNREGS assets
and a survey of GP head (or Mukhiya).
Household Survey: We have a household survey covering 10,036 households. In each GP,
we covered at least 25 households. These households were sampled from the list of households
obtained from the District Rural Development Authority (DRDA). These lists were initially
compiled in 2002 for the purpose of identifying BPL households, so each household was given a
poverty score, based on various criteria. From these lists, we sampled 66 per cent of households
below the median poverty score and 33 per cent households from above the score. In the case a
sampled household had left the village or all its members were defunct, surveyors were asked to
interview a replacement household who had been randomly chosen from the initial list. Because
the sampling lists were 10 years old and many areas had high migration rates, the proportion of
households interviewed as replacents was also high, about 30%.
In order to compare MGNREGS employment in the survey data and in o�cial reports, we
matched survey households and nrega.nic.in job cards by name, gender and age of each household
member. A survey household and a job card were considered as a match if any household member
matched. Because the same name is frequently shared by many individuals in the same GP, our
matching is very fuzzy: on average one survey household was matched with �ve job cards.
Asset Survey: We sampled 10 infrastructure projects from each GP. These were randomly
sampled from the MIS (www.nrega.nic.in). In total, we sampled a total of 4165 infrastructure
projects.
Mukhiya Survey: We attempted to interview the Mukhiya of every single GP we visited.
We managed to locate and interview a total of 358 Mukhiyas. Unlike the other two surveys, the
Mukhiya survey was conducted on paper and was both quantitative and qualitative in nature.
42

Table A.1: Infrastructure availability
Jan '13 RequiredInfrastructure T C T T CComputers (Number) 1.32 1.06 2.48 2.06 1.61 3Operators (number) 1.22 0.86 2.20 1.75 1.27 3Generator (1=Yes 0=No) 0.67 0.56 0.97 0.90 0.85 1Internet (1=Yes 0=No) 0.38 0.33 0.85 0.71 0.60 1Scanner (1=Yes 0=No) 0.57 0.37 0.73 0.81 0.65 1Printer (1=Yes 0=No) 0.59 0.43 0.71 0.83 0.76 1Sampled Blocks 69 126 66 69 123
July '12 Apr '13
Source: Phone surveys of Block Level MGNREGS functionaries (Program officers). The intervention started in September 2012 and ended in April 2013. "T" denotes treatment blocks and "C" denotes control blocks.
43

Table A.2: MGNREGS Spending levels from di�erent data sources
Panel A Control Treatment Difference PvalueDebit in CPSMS
2012-13 19.27 16.84 -2.43 0.112013-14 16.99 16.32 -0.67 0.65
Total Expenditures in MIS2012-13 21.66 18.27 -3.38 0.052013-14 21.48 21.27 -0.21 0.90
Difference CPSMS-MIS2012-13 -2.39 -1.44 0.95 0.152013-14 -4.49 -4.95 -0.46 0.63
Panel B Control Treatment Difference PvaluePayments in Job Cards
2011-12 8.30 9.26 0.96 0.242012-13 15.74 14.25 -1.49 0.292013-14 16.27 14.61 -1.66 0.26
Labor Expenditures in MIS2011-12 7.59 9.04 1.45 0.082012-13 13.91 11.66 -2.26 0.062013-14 13.23 12.83 -0.41 0.71
Difference Job Cards-MIS2011-12 0.71 0.22 -0.49 0.212012-13 1.82 2.59 0.77 0.032013-14 3.03 1.78 -1.25 0.02
Source: CPSMS Credit Debit Data, MIS Financial Reports (nrega.nic.in), Job Cards (nrega.nic.in). All amounts are annual panchayat averages in lakhs. CPSMS data is not available for the whole financial year 2011-12. p-values take into account correlation of errors at the block level. Years are financial years (Apr 1st-Mar 31st).
44

Table A.3: Household participation in MGNREGS (household survey)
Anytime before Since July 2012(1) (2)
Treatment -0.0161 0.000842(0.0136) (0.00861)
Observations 10,018 10,007Mean in Control 0.288 0.0936Effect as % of Control Mean -5.608 0.899Note: The unit of observation is a household. In Column one the outcome is a binary variable equal to one if any member of the household worked for MGNREGS in the past. In Column Two the outcome is a binary variable equal to one if any member of the household did MGNREGS worked since July 2012. The data was collected by a representative survey of 10,036 households in May-July 2013. Treatment is a dummy which is equal to one for the blocks selected for the intervention. All specifications include district fixed effects and household controls. Household controls include sets of dummies for religion, caste, type of housing, land ownership, gender and literacy of the household head, household size and number of adults.
Household Participation in MGNREGS
45

Table A.4: MGNREGS Implementation issues reported by the GP head (Mukhiya survey)
Spontaneously When Prompted Either(1) (2) (3)
Panel A: Lack of funds from the governmentTreatment 0.0500 -0.0473 0.00273
(0.0589) (0.0467) (0.0494)Observations 346 346 346Mean in Control 0.489 0.229 0.718Effect as % of Control Mean 10.23 -20.63 0.381Panel B: Corruption in the administrationTreatment -0.0377 -0.0656 -0.103*
(0.0438) (0.0501) (0.0567)Observations 346 346 346Mean in Control 0.207 0.264 0.471Effect as % of Control Mean -18.22 -24.81 -21.91Panel C: CPSMS fund-flow creates delaysTreatment 0.127*** 0.0513 0.179***
(0.0443) (0.0356) (0.0525)Observations 346 346 346Mean in Control 0.0749 0.0925 0.167Effect as % of Control Mean 170.1 55.47 106.7
Main issue in MGNREGS implementation mentioned by the Mukhiya
Note: The unit of observation is a Mukhiya (head of Panchayat). The dependent variables are the fractions of Mukhiya who declared that the lack of funds from the government (panel A) corruption in the administration (panel B) and delays in fund-flow created by CPSMS (panel C) are important issues in MGNREGS implementation. The data was collected from a representative sample of 354 Mukhiya from treatment and control blocks in May-July 2013. Treatment is a dummy which is equal to one for the blocks selected for the intervention. All specifications include district fixed effects and Mukhiya controls. Mukhiya controls include sets of dummies for Mukhiya's Religion, caste, gender, education (university education), age (above 42), whether any member of the family was elected Mukhiya in 2001 and 2006.
46

Table A.5: Treatment e�ect on household consumption
AllFrequent
expendituresRecurrent
expendituresRare
expenditures(1) (2) (3) (4)
Treatment -0.00764 -0.00788 -0.0400 0.00104(0.0212) (0.0163) (0.0261) (0.0393)
Observations 10,033 10,032 10,016 10,009
Log Monthly Consumption
Note: The dependent variable are the log of household monthly expenditures for different categories of expenditures. Frequent expenditures are expenditures reported every week. Recurrent expenditures are reported every month. Rare expenditures are reported over the past five months. The data was collected by a representative survey of 10,036 households in May-July 2013. Treatment is a dummy which is equal to one for the blocks selected for the intervention. All specifications include district fixed effects and household controls. Household controls include sets of dummies for religion, caste, type of housing, land ownership, gender and literacy of the household head, household size and number of adults.
47