Embed Size (px)
Citation preview
Max-Planck-Institut für demografische ForschungMax Planck Institute for Demographic ResearchDoberaner Strasse 114 · D-18057 Rostock · GERMANYTel +49 (0) 3 81 20 81 - 0; Fax +49 (0) 3 81 20 81 - 202; http://www.demogr.mpg.de
MPIDR WORKING PAPER WP 1999-003APRIL 1999
Can Diet and Life Style ExplainRegional Differences in AdultMortality in the Balkans?
Arjan Gjonça ([email protected])Chris Wilson ([email protected])Jane Falkingham ([email protected])
This working paper has been approved for release by: James W. Vaupel ([email protected]) Head ofthe Laboratory of Survival and Longevity.
© Copyright is held by the authors.
Working papers of the Max Planck Institute for Demographic Research receive only limited review. Views oropinions expressed in working papers are attributable to the authors and do not necessarily reflect those of theInstitute.
Gjonça, Wilson, Falkingham
1
Can diet and life style explain regional differences in adult mortality in theBalkans?
1. Introduction
The health of any population is determined by a complex set of factors. Whiledemographers often consider socio-economic determinants, such as income or urban-ruralstatus, longer-standing cultural factors are often hard to assess. Nevertheless, there areparts of the world where issues such as diet and life-style, often linked both to geographyand history are important considerations for a full understanding of a population’s health.One such region is the Balkans in south-east Europe, the focus of this paper.
After this introduction, the paper begins (section 2) with a consideration of thehistorical background that has influenced the economic, social and cultural life of theBalkans. It then goes on to consider the availability and quality of the data for this study(section 3), before assessing the trends and levels of mortality in Balkan countries sinceWorld War II (section 4). Section 5 considers regional (sub-national) patterns of adultmortality, with special reference to Albania, Greece and the Former Yugoslavia. Insection 6 we investigate the issue of regional (sub-national) patterns in cardiovasculardisease, the leading cause of death in these countries, with particular reference to Albania,Bulgaria and the Former Yugoslavia. Section 7 considers if diet can provide a possibleexplanation of the observed regional mortality patterns. The paper ends (section 8) withour conclusions and our ideas for a future research agenda.
2. Historical Background
An awareness of the past is an essential component to any understanding of thepresent. This is true for all populations, but none more so than the Balkans. Most aspectsof the history, geography and current pattern of ethnic and cultural diversity in theBalkans, though complex, are, fortunately, already very well documented (King 1973,Poulton 1991; Bookman 1994, Carter and Norris 1996). While a simple definition ofwhat constitutes the Balkans remains elusive, and disagreement continues over just howbest to categorise the various groups in question, there is no doubt that south-easternEurope is one of the most culturally diverse regions on earth (Hall and Danta 1996).With about 20 identifiable ethnic groups, at least ten languages (many of which havemarked regional dialects), three alphabets and three main religions, the Balkansconstitutes a patchwork quilt of traditions and beliefs. This diversity is undoubtedlyinfluenced by the geography and history of the region. The mountainous terrain of manyareas has encouraged isolationism, while historical forces led to the arrival and dispersionof many population groups. For almost half a millennium the region was a zone ofborder conflict between the Ottoman and Hapsburg empires, both of whom sought toconsolidate their control by deliberately encouraging settlement by groups they favouredand discouraging others.

Gjonça, Wilson, Falkingham
2
In contrast with the distribution of different ethnic and cultural groups, whichreflects the long and turbulent history of the region, the national borders of the Balkansmostly date only from the late-nineteenth and early-twentieth centuries. At that time aseries of international conferences, overseen by the great powers of the day, partitionedthe European territories of the collapsing Ottoman empire (Palmer 1993). Theboundaries assigned at that time by the major powers owed more to realpolitikconsiderations of maintaining a balance between their various client states than creatinglogical units of cultural identification. In consequence, national frontiers bear only apartial relationship to ethnic and cultural patterns.
Thus, when it comes to cultural, ethnic and life style differences, it is difficult tofind a region more diverse than the Balkans. Socio-economic differences are also verymarked in the region. Moreover, such differences are found not just among the nationstates, but also between the numerous regions of a particular country. Simply recallingthat the former Yugoslavia was a state build on ten nationalities, one can get some insightinto the diversity of the Balkans. While analysing the trends in former Yugoslavia, Kunitzargues that health transition and mortality trends in Yugoslavia can only be understood inthe context firstly of moves toward national unification of Yugoslavia, and then of thesubsequent demise of this aspiration (Kunitz, 1996, p. 270). Similarly Bookman (1994)has argued that economic stagnation or decline is an essential pre-requisite for traditionalculturally-defined differences to emerge. In short, the complex web of cultural, socialand economic variation can often be hard to disentangle.
In spite of its tremendous diversity, however, the geographical and politicalrealities of the Balkans make it unquestionably a coherent unit of study. As Sjoberg andWyzan (1991) put it, “Despite the great diversity of experiences, one should not losesight of the fact that the Balkans are once again an integral unit whose component stateshave sufficient in common to make the concept meaningful.”
It is these arguments that lead us in this paper to focus our analysis not just on themortality differences between nation states, but also, wherever possible, among theircomposing sub-regions.
The mortality trends and patterns of different Balkan countries have been thefocus of considerable research during the last decade. One reason for this was the rapidimprovement of life expectancy in some of these countries after World War II. Thesecond reason was the unexpected slow down in improvements in much of easternEurope. The Balkan countries generally had rather relatively stable trends during theeighties and the beginning of the nineties. Albania and Yugoslavia did not experience themortality increases among adults in this period seen in some other former communistcountries. While Bulgaria and Romania had a less substantial worsening compared withformer communist countries further north and east. Different scholars have consideredthis phenomena. Thus, Mesle (1991, 1996) points out that countries such as Albania andYugoslavia, which had the worst life expectancy at birth in 1950 were among the leadingEast European countries in 1990. The second important point considered by Mesle is that,

Gjonça, Wilson, Falkingham
3
unlike the adverse trend of mortality in most East European countries during the 1980s,Albania and Yugoslavia looked much better in 1990. Other authors have tried to givesome explanations to this different mortality trend and pattern by focusing on particularcountries (Watson, 1995; Gjonca et al. 1997).
It is obvious that there is a profound shortage of, and urgent need for, comparativestudies of mortality in the Balkans. We need not only to detail the mortality patterns ofthese countries, but also to try to find plausible explanations for these patterns. Inparticular the national focus of almost all studies has tended to obscure the mortalitydifferences within the ethnically and culturally diverse countries of the Balkans. Thispaper tries to avoid this problem, by focusing on regional level analysis wheneverpossible, and by doing so tries to find the common determinants of these patterns.However, we realise that this is only a first tentative step towards a more seriouscomparative epidemiology of the Balkans.
3. Data Description.
The overall mortality of the populations studied in this paper is generally welldocumented; regular censuses and more or less complete death registration data areavailable for all Balkan countries from the early-twentieth century, or even earlier in thecase of Greece and Bulgaria. Until recently, this statement could not be made without thequalification that Albania had to be excluded from this analysis. However, long-run datafor that country became available in 1991, and the analysis over the last five years,including our own research (Gjonça et al,1997) has put the final piece into the Balkandata jigsaw. The detail and the quality of the mortality data is of course somewhat varied,and not all data are available classified by region.
This work is based on aggregate level data on mortality of these populations andtheir cause-specific patterns. The sources of these data are the publications of nationalstatistical offices of these countries, as well as international publications. Thus, forYugoslavia most of the data are extracted from the Demographic Statistics (DemografskaStatistika), which was an annual publication of the Federal Statistical Office ofYugoslavia. The data on Bulgaria, Greece and Romania are also taken from their annualstatistical yearbooks. In order to check on the accuracy of these data, as well as to fill thepossible missing data, other international publications are also used, such as estimates ofMurray et al. in The Health of Adults in the Developing World. (Feachem et al.eds.,1992), and the demographic yearbooks of the United Nations. The data on Albania havebeen corrected for completeness of death registration and census coverage by the authors(Gjonca et al. 1997). These data were collected from the Albanian National Archives.
When we move on to considering causes of death or the availability ofinformation on the possible determinants of mortality, the data situation is much lesssatisfactory. There is no standard, comparable basis for the reporting of cause of death byregion or age. Moreover, the quality of the reported causes of death is often debatable.

Gjonça, Wilson, Falkingham
4
Information on diet and socio-economic variables is often even less adequate. Thus, atpresent, the data do not permit a truly comprehensive assessment of the question posed inthe title of this paper.
Some data related to possible determinants of mortality patterns in the Balkans doexist in national and international publications. However, it is important point to note thatindividual level data that could conclusively demonstrate the causal mechanisms at workare rarely to be found in the Balkans. Moreover, even when individual level data exist,comparability between nation states and sub-regions is almost impossible. As aconsequence the analysis of mortality differences in the Balkans in this paper is primarilybased on the aggregate level data.
The analysis in this paper will focus on mortality at the end of the eighties andbeginning of the nineties. This focus is determined by several considerations. First, mostof the Balkan countries experienced similar social, political and economic systems until1990. In common with the rest of Eastern Europe, communist governments ruled allBalkan states except Greece until 1990. This shared political and social experienceprovides a convenient degree of homogeneity, facilitating comparisons. Secondly, after1990 the Federal Republic of Yugoslavia disintegrated, and the Balkans experienced theformation of new states: Slovenia, Croatia, FYR of Macedonia, Bosnia-Herzegovina anda rump of Yugoslavia made up of Serbia and Montenegro. With the political andeconomic changes that happened to most of the Balkan countries after 1990, the systemsof data collecting changed and consequently the information collected also changed. Insome cases, political turbulence and even military action during the 1990s renderednormal data gathering impossible. For all these reasons, at present 1990 is the last datefor which comprehensive and comparable data are available.
4. Mortality in the Balkans since World War II.
Over the last 50 years the mortality of Balkan countries has been converging.After World War II, there was a large difference between life expectancy at birth of theBalkan countries. Figure 1a and 1b demonstrate this trend. If Greece is left out (as italready had far lower mortality than the other states), the gap of life expectancy at birthbetween the best and worst cases was about 7 years for males, and 12 years for females.The especially large difference in e0 for females is mainly due to the life expectancy atbirth in Albania, which was lower than the value for males. Gjonça et al. (1997, p. 598)have argued that this difference was due to the traditional customs of Albanian society,whereby females were very disadvantaged compared with males.
Figure 1a. Life expectancy at birth for males in the Balkans, 1950-1990 (about here).
Figure 1b. Life expectancy at birth for females in the Balkans, 1950-1990 (about here).
Gjonça, Wilson, Falkingham
5
The mortality of these countries converged substantially over time. By 1990 thegap between the highest and the lowest life expectancy at birth, (again leaving Greeceaside for the moment), was 2.8 years for males, and 2.3 years for females. The mostsubstantial improvement of mortality during this period occurred for Yugoslavia andAlbania. Life expectancy at birth for Yugoslavia improved by 14.6 years for males, andby 17.6 years for females. In Albania the gain for males was 16 years, and that forfemales 23 years.
Improvement of mortality in Romania has been slow compared with other Balkanstates, while in Bulgaria mortality has actually worsened since seventies, in particular formales. It is important to note in this context that Bulgaria had already achieved arelatively high life expectancy at birth for both sexes by 1960. This was similar to that ofGreece, and even some of the more prosperous countries of Europe, such as France andGreat Britain for males, and Italy and Spain for females (Mesle, 1991, p. 600-2). Relativesuccess in the 1950s and 1960s, followed by stagnation or decline in life expectancyduring the 1970s and 1980s was seen in several other East European countries, includingthe Soviet Union.
Even simple graphs such as Figures 1a and 1b make it clear that the experience ofGreece differs substantially from that of the other Balkan states. In the period after WorldWar II, life expectancy at birth in Greece was much higher than in the rest of the Balkans.During the following years mortality improved steadily, with no sign of stagnation. Thelast two decades, in particular, show an increasing gap of life expectancy at birth betweenGreece and the other Balkan countries, in particular Romania and Bulgaria. Thisincreased gap comes partly as a result of a slow down or even worsening of mortality inthese countries, but also because of sustained improvement in Greece. Thus, in 1990 thedifference of e0 between Greece and Bulgaria was about 6.4 years for males, and 4.8 yearsfor females, while in 1960 the mortality in Bulgaria was better for both sexes.
When the different components of overall mortality are considered, a somewhatdifferent picture of mortality differences in the Balkans emerges. Thus, when the infantmortality rate is considered, as shown in Figure 2, it is clear that infant mortality shows aless marked trend to convergence. Albania and Romania, despite the improvementsduring this period, still in 1990 had relatively high infant mortality rates at 41.6 and 26.9deaths per thousand live births respectively. In contrast, Greece and Bulgaria hadrelatively low values of infant mortality at 9.7 and 14.8 per thousand respectively. A highinfant mortality rate in the Balkans is not a phenomenon of the nineties; it has been highsince World War II compared with other Europeans. Thus, in 1950 for the whole Balkanstaken together (excluding Greece), the infant mortality rate was over 100 deaths perthousand. Yugoslavia had the highest infant mortality rate at 139.8, with Albania littlebetter with a value of 134 per thousand. Even in 1990 infant mortality remains high in theBalkan countries, when compared with the rest of Europe and when compared withmodel life tables with the same level of life expectancy. As with the levels and trends inlife expectancy at birth, the difference between Greece and the other Balkan states is alsoevident in infant mortality trends.
Gjonça, Wilson, Falkingham
6
Figure 2. Infant mortality rate of the Balkan countries, both sexes, 1950-1990(about here).
Moving from infant to adult mortality, Figure 3 shows the changes in lifeexpectancy at age 15 during the period 1950-1990. It is interesting to note that a largeamount of the variance in mortality in the Balkans can be attributed to differences inmortality at ages over 15 years. Thus, in 1990, life expectancy at 15 varies from 57.3years in Romania to 60.6 years in Albania and 63.0 years in Greece. Another verydistinctive feature of these ages is that instead of convergence of mortality, what one cansee from Figure 3 is a divergence over time.
Figure 3. Life expectancy at age 15 in the Balkans, both sexes, 1950-1990. (about here)
It is interesting to note that Albania shows a somewhat paradoxical mortalitypattern in which infant mortality rate is the highest in Europe, while mortality for agesover 15 years is among the lowest in Europe. Previous research has suggested that thisunexpected pattern is due to the importance of diet and life style factors in reducing adultdeaths, while a poor health system cannot do likewise for infants (Gjonça and Bobak,1997).
The changes of mortality among adults in the Balkans will be the focus of the nextsections of this paper, where a detailed analysis by age and region will be introduced.
5. Analysis of Adult Mortality Differences by Sub-regions.
In attempting to analyse patterns of adult mortality in Europe, scholars to datehave focused on two major divisions in Europe. The first is the division betweenNorthern and Southern Europe (or the Mediterranean). The mortality rates of adults in thelatter group are often much lower than in the North European countries, especially forparticular causes of death. These differences are not just found between nation states, butalso within particular countries. Thus, distinctive differences are found in Italy betweenthe South and the North; mortality is lower in the Mediterranean South than in the morecontinental North (Caselli, 1996). This north-south gradient of mortality differences isfound also in other Mediterranean countries, such as France and Portugal (Mesle, 1991)and Albania (Gjonca and Bobak, 1997). Many of these differentials have been attributedto the beneficial effects of the Mediterranean diet and life style.
The second dimension of difference in European adult mortality is that betweenWestern and Eastern Europe (Bobak and Marmot, 1995, 1996; Mesle, 1991, 1995). Thecollapse of communism in Eastern Europe has been accompanied by an increase in thedeath rates among adults, and especially among males, since the late eighties. Differentauthors attribute this worsening of mortality to a range of factors, including the effect ofincreased stress due to economic, political and social uncertainty, a rise in alcohol

Gjonça, Wilson, Falkingham
7
consumption and smoking. However, a relative worsening of health in much of EasternEurope was evident during the last two decades of communist rule, so that factors relatedto the transition to the market economy cannot be the sole determinants.
The analysis of adult mortality in the Balkan countries is also broken down to thesub-national level in the following section, starting with a consideration of Albania,which has been the focus of our earlier research. The section goes on to consider sub-national patterns in Greece and the Former Yugoslavia. Analogous data for Romania andBulgaria had not been traced at the time of writing.
Albania
Figure 4 shows the adult mortality maps in Albania at two points in time: 1960and 1989. This comparison allows us to gauge the extent to which regional differencesare enduring features of mortality. The data on Albania allowed the analysis of regionaldifferences for 26 districts of the country.
Figure 4. Regional Differences in adult mortality (45q15) in Albania. (about here)
Albania as a whole has had very low adult mortality since the 1960s. This findingis also true at the regional level. Thus, the worst value of probability of dying at ages 15-60 in 1960 Albania was Pogradec with a 45q15 of 21.70 per hundred, which is similar tothe 45q15 of Hungary and Soviet Union in the eighties (Feachem et al, 1992, p. 301). Thevariation at the regional level in adult mortality is marked in Albania. Thus in 1960, thedifference between the worst value of 45q15, Pogradec (21.7) and the best, Sarande (11.0),was almost two to one.
In 1960 the districts with the highest probability of dying among adults are to befound in eastern Albania, such as Pogradec (21.70 per 100), Korca (17.05), Kolonja(17.05), Librazhd (19.44) and Gramsh (17.18), and in the north of the country, Tropoja(20.10), Shkodra (17.11), Diber (18.14), and Puke (16.11). The districts that showrelatively low adult mortality in 1960 are the south-western districts of Saranda (11.03),Tepelena (11.28), Lushnja (11.82), Vlora (12.22), Fier (12.45), and Berat (12.84). Thecapital Tirana also had a low probability of dying in 1960 with 12.48 per 100. It isinteresting to note that even though adult mortality improved substantially from 1960 to1989, the pattern of regional differences does not change much. Thus, Figure 4 showsclearly that the north-east and south-west gradient in adult mortality is still there.
To conclude the assessment of regional differences in adult mortality in Albania,it can be said that the north-east and south-west mortality division found in overallmortality (Gjonca and Bobak, 1997, p. 1816-1817) is also present in adult mortality. Wecan also note that relative adult mortality worsens in the east of Albania over time, inplaces such as Korca, Kolonja and Pogradec and improves in the coastal regions ofDurres and Kruje.
Gjonça, Wilson, Falkingham
8
Greece
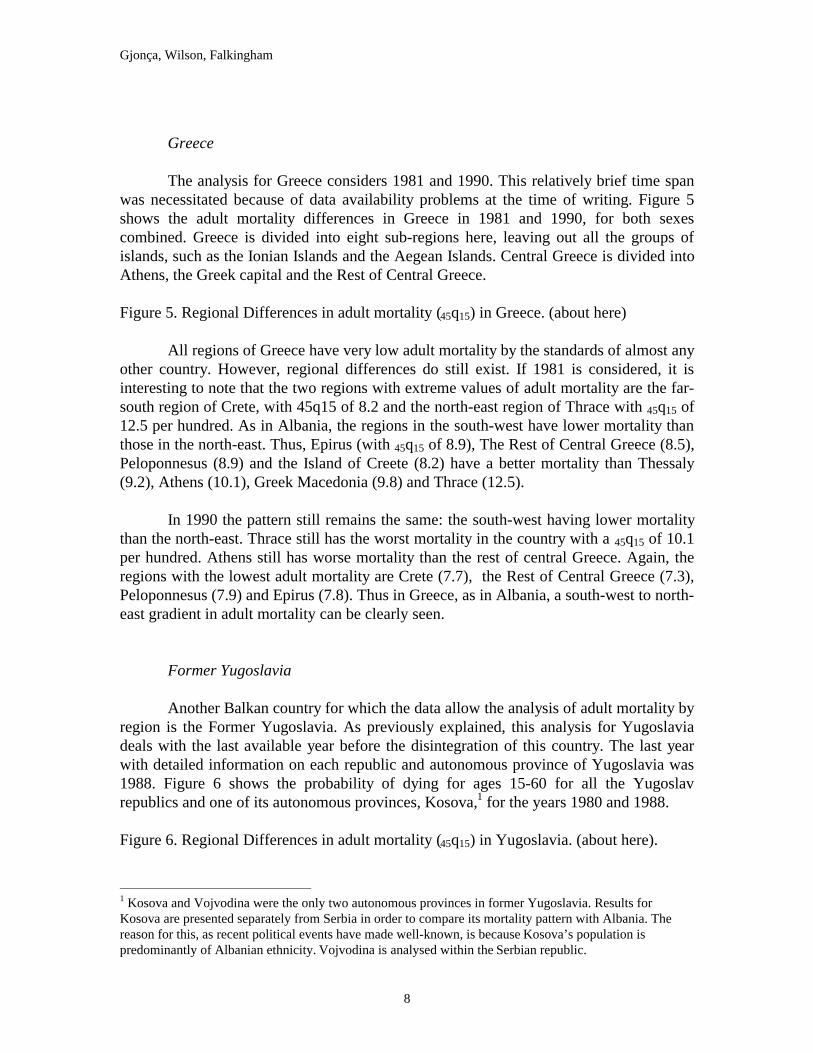
The analysis for Greece considers 1981 and 1990. This relatively brief time spanwas necessitated because of data availability problems at the time of writing. Figure 5shows the adult mortality differences in Greece in 1981 and 1990, for both sexescombined. Greece is divided into eight sub-regions here, leaving out all the groups ofislands, such as the Ionian Islands and the Aegean Islands. Central Greece is divided intoAthens, the Greek capital and the Rest of Central Greece.
Figure 5. Regional Differences in adult mortality (45q15) in Greece. (about here)
All regions of Greece have very low adult mortality by the standards of almost anyother country. However, regional differences do still exist. If 1981 is considered, it isinteresting to note that the two regions with extreme values of adult mortality are the far-south region of Crete, with 45q15 of 8.2 and the north-east region of Thrace with 45q15 of12.5 per hundred. As in Albania, the regions in the south-west have lower mortality thanthose in the north-east. Thus, Epirus (with 45q15 of 8.9), The Rest of Central Greece (8.5),Peloponnesus (8.9) and the Island of Creete (8.2) have a better mortality than Thessaly(9.2), Athens (10.1), Greek Macedonia (9.8) and Thrace (12.5).
In 1990 the pattern still remains the same: the south-west having lower mortalitythan the north-east. Thrace still has the worst mortality in the country with a 45q15 of 10.1per hundred. Athens still has worse mortality than the rest of central Greece. Again, theregions with the lowest adult mortality are Crete (7.7), the Rest of Central Greece (7.3),Peloponnesus (7.9) and Epirus (7.8). Thus in Greece, as in Albania, a south-west to north-east gradient in adult mortality can be clearly seen.
Former Yugoslavia
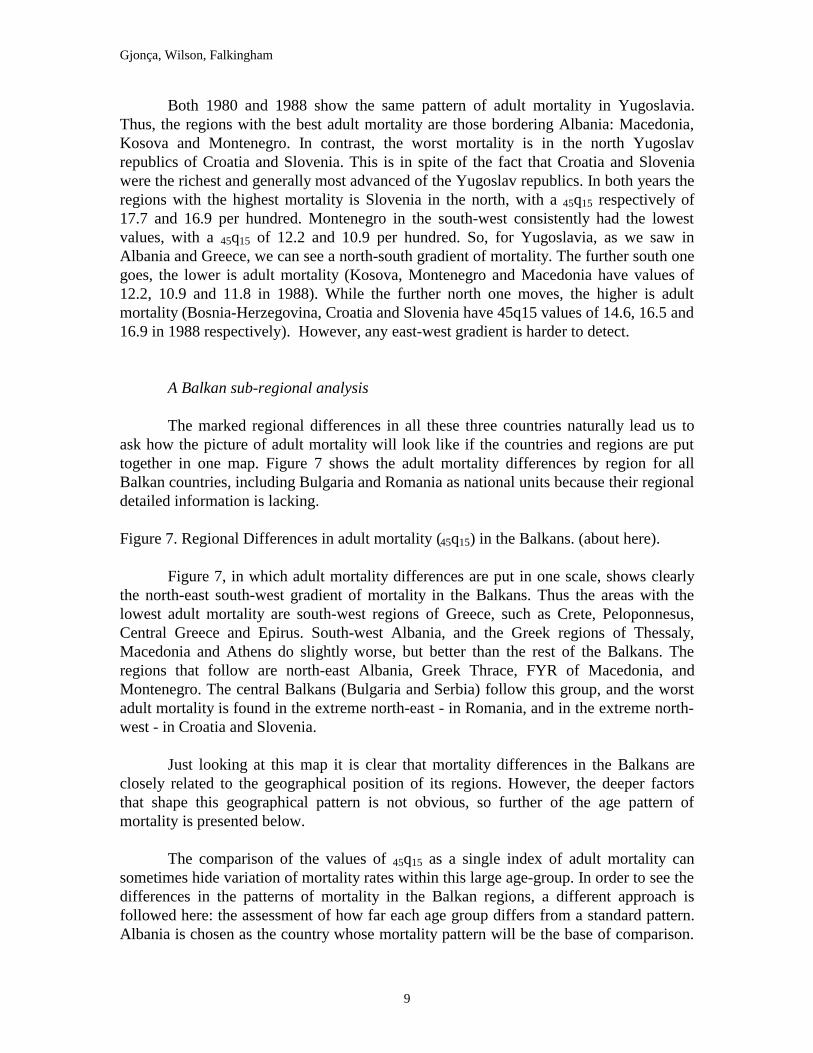
Another Balkan country for which the data allow the analysis of adult mortality byregion is the Former Yugoslavia. As previously explained, this analysis for Yugoslaviadeals with the last available year before the disintegration of this country. The last yearwith detailed information on each republic and autonomous province of Yugoslavia was1988. Figure 6 shows the probability of dying for ages 15-60 for all the Yugoslavrepublics and one of its autonomous provinces, Kosova,1 for the years 1980 and 1988.
Figure 6. Regional Differences in adult mortality (45q15) in Yugoslavia. (about here).
1 Kosova and Vojvodina were the only two autonomous provinces in former Yugoslavia. Results forKosova are presented separately from Serbia in order to compare its mortality pattern with Albania. Thereason for this, as recent political events have made well-known, is because Kosova’s population ispredominantly of Albanian ethnicity. Vojvodina is analysed within the Serbian republic.
Gjonça, Wilson, Falkingham
9
Both 1980 and 1988 show the same pattern of adult mortality in Yugoslavia.Thus, the regions with the best adult mortality are those bordering Albania: Macedonia,Kosova and Montenegro. In contrast, the worst mortality is in the north Yugoslavrepublics of Croatia and Slovenia. This is in spite of the fact that Croatia and Sloveniawere the richest and generally most advanced of the Yugoslav republics. In both years theregions with the highest mortality is Slovenia in the north, with a 45q15 respectively of17.7 and 16.9 per hundred. Montenegro in the south-west consistently had the lowestvalues, with a 45q15 of 12.2 and 10.9 per hundred. So, for Yugoslavia, as we saw inAlbania and Greece, we can see a north-south gradient of mortality. The further south onegoes, the lower is adult mortality (Kosova, Montenegro and Macedonia have values of12.2, 10.9 and 11.8 in 1988). While the further north one moves, the higher is adultmortality (Bosnia-Herzegovina, Croatia and Slovenia have 45q15 values of 14.6, 16.5 and16.9 in 1988 respectively). However, any east-west gradient is harder to detect.
A Balkan sub-regional analysis
The marked regional differences in all these three countries naturally lead us toask how the picture of adult mortality will look like if the countries and regions are puttogether in one map. Figure 7 shows the adult mortality differences by region for allBalkan countries, including Bulgaria and Romania as national units because their regionaldetailed information is lacking.
Figure 7. Regional Differences in adult mortality (45q15) in the Balkans. (about here).
Figure 7, in which adult mortality differences are put in one scale, shows clearlythe north-east south-west gradient of mortality in the Balkans. Thus the areas with thelowest adult mortality are south-west regions of Greece, such as Crete, Peloponnesus,Central Greece and Epirus. South-west Albania, and the Greek regions of Thessaly,Macedonia and Athens do slightly worse, but better than the rest of the Balkans. Theregions that follow are north-east Albania, Greek Thrace, FYR of Macedonia, andMontenegro. The central Balkans (Bulgaria and Serbia) follow this group, and the worstadult mortality is found in the extreme north-east - in Romania, and in the extreme north-west - in Croatia and Slovenia.
Just looking at this map it is clear that mortality differences in the Balkans areclosely related to the geographical position of its regions. However, the deeper factorsthat shape this geographical pattern is not obvious, so further of the age pattern ofmortality is presented below.
The comparison of the values of 45q15 as a single index of adult mortality cansometimes hide variation of mortality rates within this large age-group. In order to see thedifferences in the patterns of mortality in the Balkan regions, a different approach isfollowed here: the assessment of how far each age group differs from a standard pattern.Albania is chosen as the country whose mortality pattern will be the base of comparison.
Gjonça, Wilson, Falkingham
10
There are three reasons for selecting Albania as a standard. Firstly, it has been the subjectof our previous analysis and thus we are most familiar with its detailed pattern (Gjonça etal 1997). Secondly, Albania occupies an intermediate position in terms of adultmortality, between the lowest values of Greece and the higher rates of other mainlandBalkan states. And thirdly, Albania itself sits across a major contour of mortality,dividing the north-east and south-west of the country, and thus Albania contains within itboth Mediterranean and continental mortality patterns.
The regions selected for this comparison are made up as follows. There are fourwhich border Albania: Kosova, FYR Macedonia, Greek Epirus and Greek Macedonia, aswell as three further regions one in the very north of the Balkans, Croatia, one in the verysouth Peloponnesus, and one in the south-east Balkans, Thrace. This selection of regionscaptures the main variants of mortality patterns within the Balkans.
It is known that Greece has some of the lowest death rates in Europe, in particularfor adult ages. In 1990, Greece had a life expectancy for males of 74.6 years and 79.7 forfemales. Looking at the previous decades, mortality in Albania and Yugoslavia was muchhigher than Greece. Thus, in 1951 Greece had an e0 of 63.5 years for males and 66.7 forfemales, while Albania and Yugoslavia had an e0 of respectively 51.9 and 55.0 years formales, and 51.3 and 58.7 for females. This difference in the level of overall mortalitymakes the comparison of mortality patterns difficult. However, in order to facilitatecomparison of mortality this approach is followed.
First, for the same level of life expectancy at birth (e0 in 1989 Albania is taken),the nqx values of selected Greek and Yugoslav regions were interpolated for both sexes.
Then, the differences between the patterns are calculated as ratios of the nqx values
between each region and Albania. The standard deviations of all ages and ages 15-60 arecalculated to see the variation of each pattern (Greek and Yugoslav region) from theAlbanian pattern. The values of standard deviations are given in Table 6.7. In otherwords, the values of Table 6.7 show the standard deviation of the ratios between themortality rates (nqx values) of these regions and Albania. The higher the value of the
standard deviation, the larger the differences between the age-mortality patterns of theseregions and Albanian standard.
Table 1 generally shows more variation for females than for males, whencomparing each population with the Albanian pattern (Croatia is the only exception). Thismeans that the Albanian mortality pattern for females is more distinctive than the malepattern when compared with these regions. The other noteworthy point of this table is thatthe Albanian pattern is similar (the SD is lower) to the Greek regions, but not especiallyclose to those of Yugoslavia. For example, the comparison of males for all ages showsthat the lowest variation from the Albanian pattern is in the Greek regions of Epirus,Macedonia, and Peloponnesus. A similar result holds for females, but in this case thevariation is lowest between the Albanian pattern and Greek Epirus and Peloponnesus. It isalso clear that the more one moves towards the north of the Balkans, the greater is thestandard deviation, implying that the patterns are more distinct from each other. Thus, the
Gjonça, Wilson, Falkingham
11
variation for Croatia is the highest for both sexes, but especially for males - three or fourtimes higher than the Greek regions of Epirus and Peloponnesus. The regions located inthe east of the Balkans, FYR of Macedonia, Greek Macedonia, and Thrace also showmore differences from Albania, though to a lesser extend than Croatia.
Table 1 Variation from Albanian mortality pattern of some selected regions in theBalkans. (about here)
These differences within the patterns are even more clear-cut, when ages 15 to 60are considered. The most similar age patterns to Albania again are those of Greek Epirusand Greek Peloponnesus. The further one moves in north or east, the greater thedivergence from the Albanian pattern. Thus, for males, comparison with the Greekregions shows that in Greek Macedonia, and further east, in Thrace, the standarddeviation is higher than in the southern regions of Greece. This is also true the further onemoves north. Thus, the difference between the FYR of Macedonia and Albania is greaterthan the Greek comparisons, but is lower than Kosova, and much lower than Croatia. Forfemales, once more Albania has a similar pattern to Greek Epirus and Peloponnesus, anda rather different one from Croatia, FYR of Macedonia and Greek Macedonia. It isinteresting to note that Kosova, although mostly made up of ethnic Albanians, does nothave a particularly close fit in the age-pattern of its adult mortality with Albania itself.
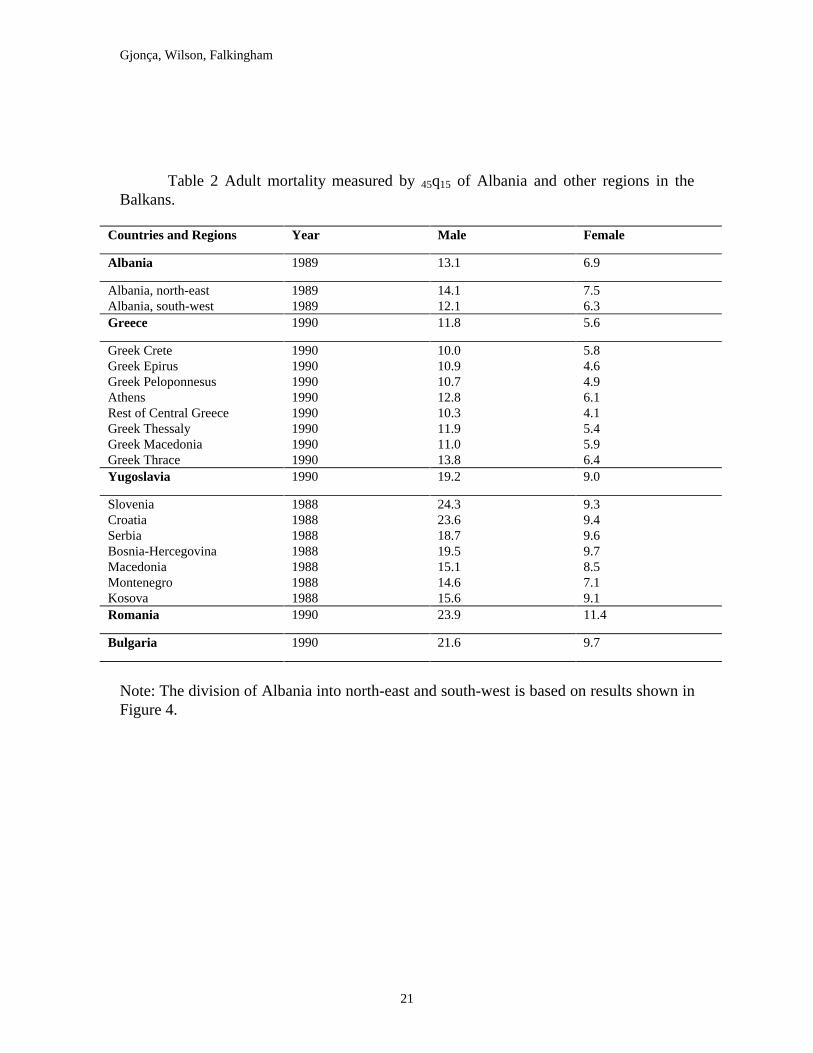
When the regional differences were considered at the beginning of this section,adult mortality was compared for both sexes combined. Table 2 shows the values of 45q15
for these regions and for Albania for males and females separately. The comparison nowincludes all the Yugoslav republics, all Greek regions, as well as Romania and Bulgaria.Albania is sub-divided into two main mortality patterns found at the beginning of thissection, north-east and south-west regions.
Table 2 Adult mortality measured by 45q15 of Albania and other regions in the Balkans(about here)
Looking at the values of 45q15 in Table 2, it is clear that for both sexes, Albaniahas slightly higher adult mortality than Greece and its regions, but much lower rates thanYugoslavia, Romania or Bulgaria. The worst adult mortality in 1990 is found in the northeast of the Balkans, in Slovenia, Croatia, Romania, Bulgaria, Serbia and Bosnia-Herzegovina. Moving further south, adult mortality improves even within Yugoslavia.Thus, the southern regions have lower adult mortality than the northern regions. This“north-east rule” is true even within Albania. The north-east of the country has a level ofadult mortality that is similar to its northern neighbour, Montenegro, while south-westAlbania has lower mortality than any region to its north or east, but it has slightly higheradult mortality than the southern Greek regions of Epirus Peloponnesus or Crete. This isparticularly true for male adult mortality.
Concluding this section of adult mortality comparisons in the Balkans, one canreasonably conclude that a south-west to north-east gradient of mortality is present. This
Gjonça, Wilson, Falkingham
12
was shown by the regional analysis of individual nation states (Albania, Greece, theFormer Yugoslavia), and by the analysis of the Balkans as one entity. In order to begin toassess the possible reasons behind this very distinctive geographical pattern, the causes ofdeath need to be considered. The following section, therefore, concentrates on one of themain causes of death for all of Balkan countries - cardiovascular disease.
6. Regional Differences in Cardiovascular Mortality in the Balkans.
All the Balkan countries in general have relatively low mortality, and in suchcircumstances the cardiovascular diseases take on great importance. Thus, previousresearch (Murray et al, 1992, p. 302-50) shows clearly that for countries such as Greece,Bulgaria, Yugoslavia and Romania, the leading cause of death in mid-eighties wascardiovascular disease (especially for men). Thus, the 45q15 value for males forcardiovascular diseases in Bulgaria was 7.8 per hundred, while the next major killerswere the neoplasms, with a values of 4.6. While for Yugoslavia these values were 6.2 forcardiovascular diseases, and 4.6 for neoplasms.
Unlike the data on mortality in general, the data on causes of death differsubstantially between Balkan countries in terms of details and availability. Thus, for theFormer Yugoslavia cause specific data are available for 5-year age groups, allowing thecalculation of multiple decrement life tables for all regions of this country. In contrast, inAlbania these data were available for larger age intervals, allowing us to calculate onlythe standardised mortality rates (SMRs), instead of net probabilities of dying. While forthe other three countries at the time of writing regional cause-specific information by agewas missing entirely, making it impossible to build comparable indicators. However, forBulgaria some limited published data on cardiovascular diseases are available. In suchcircumstances putting together a general comparison for all the Balkan is impossible.Nevertheless, these data allow us to see if the mortality differences from cardiovasculardiseases follow the regional pattern of adult mortality from all causes in each of thesethree countries.
Albania
Figure 8 shows the regional differences in mortality from cardiovascular diseasesin Albania for males and females separated. Ages considered here are the same as in theall cause mortality - 15-60 years. In 1989 cardiovascular diseases in Albania accountedfor about 38% of all deaths. From Figure 8 it is clear that both sexes show the samepattern of differences in cardiovascular mortality for adults. Thus, the worst mortalityfrom cardiovascular diseases is in the north-east area of the country. For both sexes thecoastal district of Shkodra in the north has a low rate from cardiovascular mortality. It isinteresting to note that the coastal districts, starting from the north, with Lezha and Kruja,to the south, with Vlora and Saranda have the lowest cardiovascular mortality rates in thecountry for both sexes. The cardiovascular mortality map shows similar patterns to theoverall adult mortality map for Albania. The only marked difference here is that the main

Gjonça, Wilson, Falkingham
13
urban centres, such as Tirana, Durres, and the industrial city of Elbasan are among thecities with the highest cardiovascular mortality in the country. Apart from this urbanexception, Figure 8 shows the same south-west to north-east gradient in mortality as theall causes mortality in Albania.
Figure 8. Regional differences in adult mortality from cardiovascular diseases (measuredby SMRs), Albania 1989. (about here)
Former Yugoslavia
Figure 9a shows the cardiovascular mortality differences in the former Yugoslaviain 1988, measured by the net probability of dying. Looking at the map, the values show arelatively similar pattern to that seen in all cause mortality. Again, the regions with lowcardiovascular mortality are Montenegro with a net probability of dying of 3.1 %,followed by Macedonia and Kosova with 45q15 respectively of 4.4 and 4.6 %. The onlydifference here is that Slovenia and Croatia have a somewhat lower cardiovascular ratethan one would expect from their high rate of all cause mortality for adults. If thecardiovascular mortality for these two regions is analysed by sex (not presentedgraphically here), than the reason for the divergence is clear; females in both republicshave very low cardiovascular rates, of 2.1 and 2.7% respectively. If the malecardiovascular rates are considered, the map of cardiovascular mortality closely resemblesthe map of all cause mortality. Serbia and Bosnia-Herzegovina in central Yugoslavia havesimilar cardiovascular mortality with each other and Croatia, but still lower than the restof the country, including Slovenia. Overall, for the former Yugoslav republics, it can besaid that the regional differences in cardiovascular mortality are relatively similar to thedifferences in all cause mortality for ages 15 to 60 years. The only really large exceptionto this is Slovenia, which has a very low cardiovascular mortality for females.
Figure 9a. Regional differences in cardiovascular mortality for Former Yugoslavia(measured by SMR for ages 0-60) (about here)
Bulgaria
Figure 9b shows the cardiovascular mortality differences for Bulgaria in 1993.Different from all previous data, that are own calculations, these data were abstractedfrom the Atlas of Leading and ‘Avoidable’ Causes of Death in Countries of Central andEastern Europe (WHO, KSH. 1997). The data allow the comparison of mortality only forages 0 to 60 years. Mortality differences are measured by standardised mortality ratios.Despite the fact that Bulgaria is located in the far east of the Balkans, one can still find aclear north-east south-west gradient of cardiovascular diseases. Mortality fromcardiovascular diseases in the south-west regions of Sofia, Plovdiv and Haskovo is verylow compared with the northern regions of Razdrag, Varna, Burgas, Lovetch andMichailovgrad. One distinctive feature of cardiovascular mortality in Bulgaria is that thecapital, Sofia, has the lowest cardiovascular death rate in the country.

Gjonça, Wilson, Falkingham
14
Figure 9b. Regional differences in cardiovascular mortality for Bulgaria (measured by45q15) (about here)
Concluding this section on cardiovascular mortality differences, despite the factthat we are only able to consider three countries, it can be said that the north-east south-west gradient of mortality persists. The maps of mortality from cardiovascular diseases toa large degree parallel the all cause mortality differences for the adult ages.
7. Mediterranean versus Continental - Is Diet a Possible Explanation?
When data were discussed at the beginning of this paper, it was stated that theindividual data to accurately assess the possible causal mechanisms involved are lacking,not just for the Balkans as a whole, but even for individual countries. Moreover, if onewants to look at determinants of mortality patterns at the regional level, these data are allbut non-existent. In such circumstances any effort to try to identify causal mechanism fordeciding on the influence of different factors to mortality pattern must inevitably becautious. The discussion of this section is based on existing evidence on both individualand aggregate level data for this area.
Different authors have tried to find a correlation between socio-economicdevelopment of these countries and their levels of mortality. Thus, in the formerYugoslavia one can possibly relate the level of development of different regions with thelevel of infant mortality rate. Kosova and FYR of Macedonia had the highest rate ofinfant mortality in 1990, and they are the least developed regions of Yugoslavia. Movingon to mortality at old ages (60+) we might expect to find a similar relationship. The oldare clearly susceptible to the ill effects of economic decline (and the resultant decline inhealth care services) and environmental hazards. Kunitz, for example, has argued that thiswas the case in former Yugoslavia (Kunitz, 1996).However, it is impossible to find anycorrelation between the level of adult mortality as a whole in the regions of formerYugoslav and their level of developments. Kosova and FYR of Macedonia, although theleast developed regions, have some of the lowest levels of adult mortality, especially ofcardiovascular mortality, in the former Yugoslavia.
Considering Greece, Matsaganis (1992) has pointed out that there is norelationship between the social and economic development of Greek regions and theirlevel of overall mortality. Thus, the two extreme regions in terms of income, Athens (thewealthiest) and Thrace (the poorest) have similar mortality. As the analysis in this paperhas shown, these two regions have the worst levels of adult mortality in Greece over thelong run.
The case of Albania is similar. It has been shown that there is no relation betweenthe regional differences of overall mortality in general, and adult mortality in particular,and the level of education. In Albania education can be taken as a good indicator of

Gjonça, Wilson, Falkingham
15
development. Similarly, no relation was found between the level of urbanisation andindustrialisation and the mortality differences (Gjonca, 1998, p. 134-135).
In such circumstances, where the socio-economic differences cannot account forregional mortality differences, one has to turn to the possible life-style factors. It is beensuggested for some time that the low adult mortality in the Mediterranean countries canbe attributed to the positive effects of the Mediterranean diet. A high intake ofmonounsaturated fats and a low intake of saturated fats, high consumption of fresh fruitsand vegetables and of wine have been most often proposed to account for the differencesbetween the northern and southern European mortality.
Given the data difficulties that plague the systematic analysis of these issues in theBalkans, it is ironic that one of the first important studies supporting the positive effectsof Mediterranean diet and life style came from research which involved Mediterraneanpopulations of the Balkans. The “Seven Countries” longitudinal study, involving 16cohorts from different populations and countries, included six cohorts from Balkanpopulations. Thus, in Greece two cohorts of men aged 40-59 were enrolled in the study:one from the island of Crete and the other from the island of Corfu. In the formerYugoslavia, there were four cohorts in the study: two Croatia - Dalmatia and Slavonia,and two in Serbia - Velika Krsna and Zrenjanin. (Keys et al., 1980, 1986).
The full study involved 16 male cohorts (11 of them rural) drawn frompopulations in northern Europe, the United States, Japan, and Mediterranean populations.The cohorts were males, aged 40-59 at entry, and were followed for 20 years (somecohorts for 25 years). The size of the cohorts mostly varied from 500 to 1000 men(Vershuren et al. 1995). The aim of the study was to find out if the death rate and theincidence of coronary heart diseases were related to any risk factors, and to what extentthese populations differ from each other in terms of these risk factors. Our particularinterest in this research arises because the populations chosen in the Balkans arerepresentative of the range of Balkan experience. Thus, the two Croatian cohorts(Dalmatia on the sea coast and Slavonia in inland Croatia) were chosen because the dietof one group (Dalmatia) is based on olive oil and the other on lard (Keys et al. 1980, p.72). The two cohorts in Serbia are part of the central Balkans, and the Greek islands ofCrete and Corfu are located in the south and north of Greece. The evaluation of evidencefrom this study was followed up to 20 years after the first entry, but because the twoCroatian cohorts dropped out, here we consider the results of the 15 years evaluation(Menotti et al., 1989, p. 175-179).
Keys et al. found marked differences in the 15 years death rates and coronary heartdiseases rates for the cohorts under the study. The results for the six Balkan cohorts areshown in Table 3. Death rates are low in Corfu and Crete, most notably the death ratesfrom coronary heart diseases. Another interesting piece of evidence is that the death ratefor all causes and, especially, for coronary heart diseases in Dalmatia is much lower thanin Slavonia.

Gjonça, Wilson, Falkingham
16
Table 3. 15 year death rates, violence excluded, per 10000 “healthy” men aged 40-59years at entry, for all causes, coronary heart diseases (CHD): Seven Country Study.(about here)
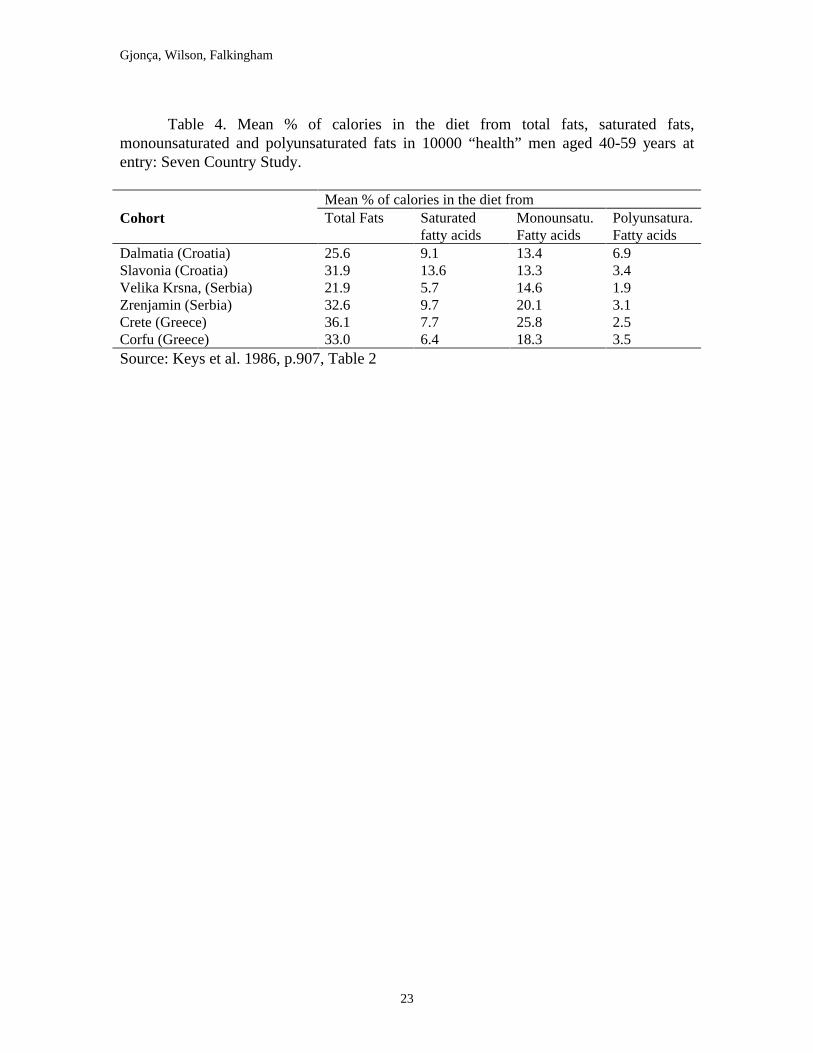
Keys et al. also looked at the relation between the death rate from coronary heartdisease and the calorific intakes in diet from total fats, unsaturated and saturated fats.Some of the results are given in Table 4. The study showed high correlations between theaverage percentage of dietary energy from saturated fatty acids and the incidence anddeath rate from CHD. Thus, the correlation coefficients were r=0.80 for incidence ofCHD and r=0.84 for the death from CHD. These are very marked associations, given therelatively small samples sizes in the study, and the resultant scope for random effects.
Table 4. Mean % of calories in the diet from total fats, saturated fats, monounsaturatedand polyunsaturated fats in 10000 “health” men aged 40-59 years at entry: Seven CountryStudy. (about here)
Among a range of other findings, one of the most important was the majordifferences found among the cohorts in the percentage of monounsaturated fatty acids inthe diet, which reflects the use of olive oil. The olive oil used in the diet of Italy, Greece,and Dalmatia (Croatia) is around 80% oleic acid. It is possible that the benefits attributedto monounsaturated fatty acids in the diet of these cohorts may well be simply due to theoleic acid. Of the six cohorts, three are Mediterranean populations and are similar to eachother in that olive oil provides from 15-30 % of total energy, with wine also an importantpart of their meals. In contrast, in the other cohorts of Yugoslavia the main energy comesfrom milk and meat fats, and the main alcoholic beverages are beer and distilled liquors,often not taken with meals (Keys et al. 1986, p. 912).
Perhaps the most important findings of this study for the present paper is that intwo cases the use of olive oil can explain regional patterns of mortality. First, thedifference in coronary heart disease mortality between Crete, in the south of Greece, andCorfu, in the north, can be explained by the use of olive oil in the two cohorts. Secondly,the differences between Dalmatia in West Croatia and Slavonia in East Croatia also bearthe same interpetation. Thus, most of the research coming from this study supports thepositive effects of Mediterranean diet in explaining the regional differences in mortality.
This evidence is also supported by the case of Albania. We have argued in aprevious work (Gjonça et al. 1997) that the low mortality in Albania (which occurs inspite of its poverty) could be attributed to the traditional forms of the Mediterranean dietexisting in the country. Moreover, Gjonca and Bobak have argued that even the regionaldifferences within Albania can be explained by different regional dietary patterns of thecountry (Gjonça and Bobak, 1997). Thus, the north east has a more continental dietarypattern, in which animal fats are widely used. It experiences higher mortality than thesouth-west of Albania, where a Mediterranean dietary pattern, based on a large-scale useof olive oil and fruits and vegetables is predominant. Figure 10 shows the regionalmortality pattern compared with the regional differences in the production and

Gjonça, Wilson, Falkingham
17
consumption of olives. Overall, Albania, a country with 3.2 million people, cultivates 5.8million olive trees (INSTAT 1992). The olives and their oil are mainly consumed by thetwo-thirds of the country’s population located in the south-west.
Figure 10. Geographical distribution of olive production and regional mortality inAlbania (about here).
8. Conclusions and an Agenda for Future Research
As we mentioned at the start of this paper, the research reported here is only a firsttentative step towards a thorough comparative epidemiology of the Balkans. In order tomake further progress we need more consistent and detailed aggregate information aswell as a greater body of individual level data. However, we feel that in this paper wehave been able to sketch out the beginnings of a comparative analysis and to advance ahypothesis to form the basis of future research: that diet does indeed play a major role indetermining regional mortality patterns. On what basis do we make this assertion?
When considering trends over time, diet may be an important consideration inunderstanding why some south-east European countries, such as Albania and Yugoslaviadid not experience worsening mortality during the 1980s and 1990s. However, in general,our research on the impact of diet on mortality trends is far from conclusive.
We are much more certain of the cross-sectional regional differences. There isample evidence of a north-east to south-west gradient of mortality across the Balkans.Both within individual countries and in the region as a whole, adult mortality is lower inthe south-west and higher in the north-east. The role of diet in shaping these differencesis still conjectural, but seems to us highly plausible. One reason to argue this is the factthat both impoverished Albania and relatively wealthy Greece are part of the lowmortality south-west zone, while relatively rich Slovenia experiences high mortality.Clearly the main causes of the regional patterns must transcend conventional definitionsof the level of development. In this regard, the lessons from the Balkans may be of muchwider relevance than might at first be imagined.
Finally, we believe that the present paper sets the agenda for future research. Wehope to overcome the data deficiencies that prevent us reaching a definitive conclusionhere. Better aggregate information, especially on cause-specific mortality, and moreindividual level information on diet and health will enable us to reach firm conclusions.Even this limited analysis, however, has clearly shown the value of a comparativeperspective. We hope that this can also serve as an example for future epidemiologicaland demographic work.

Gjonça, Wilson, Falkingham
18
References
Bobak, M. and Marmot, M. 1995. East-west mortality divide and its potentialexplanations: proposed research agenda. British Medical Jounal, 312, pp. 421-25
Bobak, M. and Marmot, M. 1996. East West Health Divide and potential explanations.In, Hertzman, Kelly and Bobak (eds) East-West Life Expectancy Gap in Europe, 1996,NATO ASI Series, Volume 19.
Bookman, M.Z. 1994. Economic Decline and Nationalism in the Balkans. London:Macmillan.
Carter, F.W. and H.T. Norris (eds.) 1996. The Changing Shape of the Balkans. Londonand Boulder, Colorado: Westview Press.
Caselli, G. 1996. National differences in the health transition in Europe. HistoricalMethods, 29, 3, pp. 107-125.
Feachem, G. A. R., Kjellstrom, T., Murray, C. J. L., Over, M. Phillips, M. A. (eds.) 1992.Health of Adults in the Developing World, A World Bank Book, Oxford University Press,New York.
Gjonca A. and Bobak M. 1997. Albanian paradox, another example of protective effect ofMediterranean lifestyle? Lancet, 350, pp.1815-1817.
Gjonca A, Wilson C. Falkingham J. 1997. Paradoxes of health transition in Europe’spoorest country: Albania, 1950-90, Population and Development Review, 23, 3, pp. 585-609.
Gjonca A. 1998. Mortality Transition in Albania 1950 - 1990. PhD Thesis. University ofLondon, England. London School of Economics and Political Science.
Hall, D. and D. Danta (eds.) 1996. Reconstructing the Balkans: a Geography of the NewSoutheast Europe. Chichester and New York: Wiley
INSTAT 1992. Statistical Yearbook of Albania 1991, Institute of Statistics, Tirana,Albania.
Keys, A. 1980, Seven Countries Study: a Multivariate Analysis of Death and CoronaryHeart Disease. Cambridge, Massachusetts Harvard University Press.
Keys. A. et al. 1986, The diet and 15-year death rate in the seven countries study.American Journal of Epidemiology, 124, pp. 903915

Gjonça, Wilson, Falkingham
19
King, R.R. 1973. Minorities under Communism: Nationalities as a Source of TensionAmong Balkan Communist States. Cambridge, Massachusetts: Harvard University Press
Kunitz, S. 1996. What Yugoslavia means: progress, nationalism and health. In R.M.Douglas, G. Jones and R.M. D’Souza (eds.) The Shaping of Fertility and MortalityDeclines: the Contemporary Demographic Transition. Supplement to Health TransitionReview, volume 6.
Matsaganis, 1992 An Economic Approach and Inter-Regional Mortality Variations withSpecial Reference to Greece. PhD Thesis. University of Bristol, England. Faculty ofSocial Sciences
Menotti A. et al. 1989, Seven countries study. First 20-year mortality data in 12 cohortsof six countries, Annals of Medicine, 21, pp. 175-179
Mesle, F. 1996 Mortality in Eastern and Western Europe: A Widening Gap. In DavidColeman (ed.). Europe’s Population in the 1990s. Oxford University Press, Oxford,England.
Mesle F. 1991 La mortalite dans les pays d’Europe de l’Est, Population, 3, pp. 599-650.
Murray, CJL, Yang, G. Qiao, X. 1992, Adult Mortality: Levels, Patterns and Causes. InFeachem, G. A. R., Kjellstrom, T., Murray, C. J. L., Over, M. Phillips, M. A. (eds.)Health of Adults in the Developing World, A World Bank Book, Oxford University Press,New York.
Palmer, A. 1993. The Decline and Fall of the Ottoman Empire. London: Weidenfeld.
Poulton, H. 1991. The Balkans: Minorities and States in Conflict. London: MinorityRights Publications.
Sjoberg, O and M.L. Wyzan. 1991. Economic Change in the Balkan states. London andNew York: St. Martin’s Press.
Verschuren, M. et al, 1995, Serum total cholesterol and long-term coronary heart diseasemortality in different cultures, Journal of the American Medical Association, 274, 2, pp.131-136.
Watson, P. 1995. Explaining rising mortality among men in Eastern Europe, SocialScience and Medicine, 41, 7, pp. 923-934.
WHO and KSH, 1997, Atlas of Leading and ‘Avoidable’ Cause of Death in Countries ofCentral and Eastern Europe. Hungarian CSO Publishing House, Budapest, 1997.

Gjonça, Wilson, Falkingham
20
Table 1 Variation from Albanian mortality pattern of some selected regions in theBalkans.
Countries andRegions
Standard Deviation (in%)
for all ages ages 15-60
Males Females Males Females
Greek EpirusGreek MacedoniaGreek PeloponnesusGreek ThraceFYR of MacedoniaKosovaCroatia
17.617.817.620.526.429.468.9
32.050.932.035.038.229.648.4
8.28.68.310.522.030.848.5
22.436.422.023.033.523.142.5
Note: 1.The level of e0 on which these calculations are based is for males 67.92 years
and females 73.84 years (e0 of Albania in 1989).
2. The standard deviations are shown in per hundred.
Gjonça, Wilson, Falkingham
21
Table 2 Adult mortality measured by 45q15 of Albania and other regions in theBalkans.
Countries and Regions Year Male Female
Albania 1989 13.1 6.9
Albania, north-eastAlbania, south-west
19891989
14.112.1
7.56.3
Greece 1990 11.8 5.6
Greek CreteGreek EpirusGreek PeloponnesusAthensRest of Central GreeceGreek ThessalyGreek MacedoniaGreek Thrace
19901990199019901990199019901990
10.010.910.712.810.311.911.013.8
5.84.64.96.14.15.45.96.4
Yugoslavia 1990 19.2 9.0
SloveniaCroatiaSerbiaBosnia-HercegovinaMacedoniaMontenegroKosova
1988198819881988198819881988
24.323.618.719.515.114.615.6
9.39.49.69.78.57.19.1
Romania 1990 23.9 11.4
Bulgaria 1990 21.6 9.7
Note: The division of Albania into north-east and south-west is based on results shown inFigure 4.

Gjonça, Wilson, Falkingham
22
Table 3. 15 year death rates, violence excluded, per 10000 “healthy” men aged 40-59 years at entry, for all causes, coronary heart diseases (CHD)..: Seven Country Study.
Cohort No. of men at risk All causes CHDDalmatia (Croatia)Slavonia (Croatia)Velika Krsna, (Serbia)Zrenjamin (Serbia)Crete (Greece)Corfu (Greece)
622680487476655525
1,5612,3651,4061,5158551,317
2163896729738202
Source: Keys et al. 1986, p.905, Table 1
Gjonça, Wilson, Falkingham
23
Table 4. Mean % of calories in the diet from total fats, saturated fats,monounsaturated and polyunsaturated fats in 10000 “health” men aged 40-59 years atentry: Seven Country Study.
Mean % of calories in the diet fromCohort Total Fats Saturated
fatty acidsMonounsatu.Fatty acids
Polyunsatura.Fatty acids
Dalmatia (Croatia)Slavonia (Croatia)Velika Krsna, (Serbia)Zrenjamin (Serbia)Crete (Greece)Corfu (Greece)
25.631.921.932.636.133.0
9.113.65.79.77.76.4
13.413.314.620.125.818.3
6.93.41.93.12.53.5
Source: Keys et al. 1986, p.907, Table 2

50
55
60
65
70
75
80
1950 1960 1970 1980 1990
Yea
rs
Greece
Yugoslavia
Bulgaria Romania
Albania
50
55
60
65
70
75
80
85
1950 1960 1970 1980 1990
Yea
rsFigure 1a. Life expectancy at birth for males in the Balkans, 1950-1990
Figure 1b. Life expectancy at birth for females in the Balkans, 1950-1990
Greece
Yugoslavia
Albania
Bulgaria
Romania
SOURCES: Statistical Yearbooks of each country, and UN Demographic Yearbooks.NOTE: Data on Albania are corrected for the completeness of death registration.

0
25
50
75
100
125
150
1950 1960 1970 1980 1990
51
53
55
57
59
61
63
65
1950 1960 1970 1980 1990
Yea
rs
SOURCES: Statistical Yearbooks of each country, and UN Demographic Yearbooks.NOTE: Data on Albania are corrected for the completeness of death registration.
Figure 2. Infant mortality rate in the Balkans, both sexes, 1950-1990
Figure 3. Life expectancy at age 15 in the Balkans, both sexes, 1950-1990
Albania
Yugoslavia
Romania
Bulgaria
Greece
Albania
Greece
Bulgaria
Romania
Yugoslavia