Embed Size (px)
Citation preview
Can Data and Technology Support the Insurance Industry to Regain Lost Relevance?June 2019
While the nature of risks organisations face has changed dramatically in the last 20 years, the Insurance industry, that is setup to help manage this risk, hasn t. This very slow response to change, has meant the Insurance industry has lost relevance. More concerning is that, without effective insurance, both companies and individuals may not be willing to take risk on, and innovation and economic development can be delayed.
Data and emerging technologies are creating opportunities for the Insurance industry to regain relevance. If the industry is able to innovate, increase efficiency and improve customer experience, there is potential to overcome the most pressing challenges. It will allow the industry to keep up with customer demands and re-emerge as a core contributor to the global economy. If, however, the Insurance industry fails to deliver, either others will fill the space, or investing in new areas will become a much riskier proposition.
Summary . . . . . . . . . . . . . . . . . . . . . . . . . . . . . . . . . . . . . . . . . . . . . . . . . . 2
1 Introduction . . . . . . . . . . . . . . . . . . . . . . . . . . . . . . . . . . . . . . . . . . . . . 3
2 Insurance industry is losing relevance . . . . . . . . . . . . . . . . . . . . . . . . . 42.1 Insurance industry is slow to evolve . . . . . . . . . . . . . . . . . . . . . . . . . . . . . . . . .5
2.2 Struggling to meet customer needs . . . . . . . . . . . . . . . . . . . . . . . . . . . . . . . . .6
2.3 Core business in decline . . . . . . . . . . . . . . . . . . . . . . . . . . . . . . . . . . . . . . . . . .8
3 Status Quo is being challenged . . . . . . . . . . . . . . . . . . . . . . . . . . . . . . 93.1 Growth in new ‘alternative’ capital . . . . . . . . . . . . . . . . . . . . . . . . . . . . . . . . . .9
3.2 Growth of intangible assets . . . . . . . . . . . . . . . . . . . . . . . . . . . . . . . . . . . . . . .10
3.3 Sharing economy . . . . . . . . . . . . . . . . . . . . . . . . . . . . . . . . . . . . . . . . . . . . . . .11
3.4 InsurTech . . . . . . . . . . . . . . . . . . . . . . . . . . . . . . . . . . . . . . . . . . . . . . . . . . . . .12
4 Data and technology with potential to transform . . . . . . . . . . . . . . . 134.1 Artificial Intelligence . . . . . . . . . . . . . . . . . . . . . . . . . . . . . . . . . . . . . . . . . . . . .13
4.2 Internet of Things . . . . . . . . . . . . . . . . . . . . . . . . . . . . . . . . . . . . . . . . . . . . . . .14
4.3 Blockchain . . . . . . . . . . . . . . . . . . . . . . . . . . . . . . . . . . . . . . . . . . . . . . . . . . . .15
5 How will the industry respond? . . . . . . . . . . . . . . . . . . . . . . . . . . . . . 165.1 The industry structure will change . . . . . . . . . . . . . . . . . . . . . . . . . . . . . . . . .16
5.2 We will have new products . . . . . . . . . . . . . . . . . . . . . . . . . . . . . . . . . . . . . . .16
5.3 Products will be increasingly integrated . . . . . . . . . . . . . . . . . . . . . . . . . . . . .18
5.4 Insurance will be cheaper . . . . . . . . . . . . . . . . . . . . . . . . . . . . . . . . . . . . . . . .18
6 Conclusion . . . . . . . . . . . . . . . . . . . . . . . . . . . . . . . . . . . . . . . . . . . . . 18
7 References . . . . . . . . . . . . . . . . . . . . . . . . . . . . . . . . . . . . . . . . . . . . . . 19
8 Contacts . . . . . . . . . . . . . . . . . . . . . . . . . . . . . . . . . . . . . . . . . . . . . . . 19
Summary
Can Data and Technology Support the Insurance Industry to Regain Lost Relevance? 3
Since the start of the Third Industrial Revolution in the 1980s, the world has changed in many different ways: rapid introduction and adoption of technological innovation (global internet; social networks; mobile technologies; evolving payment solutions; data availability); new economic realities (volatile and shorter economic cycles; interconnected financial climate; under utilisation of assets); structural shifts in society’s values (desire for community; generational altruism; active citizenship); and demographic readjustment (increasing population; urbanization; longer life expectancy; millennials in the work force).
While these changes have been happening, the Insurance industry has seemingly preferred to operate in a closed environment oblivious to much of the impact these changes could bring. Resistance to change, failure to meet changing customer demands and a decrease in the importance of attritional risks has led the Insurance industry to reduce its relevance.
However the availability of data, the introduction of new capital providers, the impact of new business models emerging from the sharing economy and the challenge of InsurTechs are affecting the industry complacency. Collectively, these factors are creating the perfect storm for the incumbents allowing them to re-evaluate their preference for maintaining the status quo. There is an ever increasing expectation from the industry to be more innovative and deliver a vastly improved customer experience.
As data and emerging technology are accelerating the need for change, they are also opening doors. The industry is at cross roads where it can either choose to regain relevance by adapting to the new world order or it can continue to decline. Should it choose the latter, it could expose the US$ 5 trillion market to approaches from large technology firms and manufacturers who have the access to customers, transformational capabilities and more than enough capital to fill the void left by the traditional players.
1 Introduction
4 Can Data and Technology Support the Insurance Industry to Regain Lost Relevance?
2 Insurance industry is losing relevance
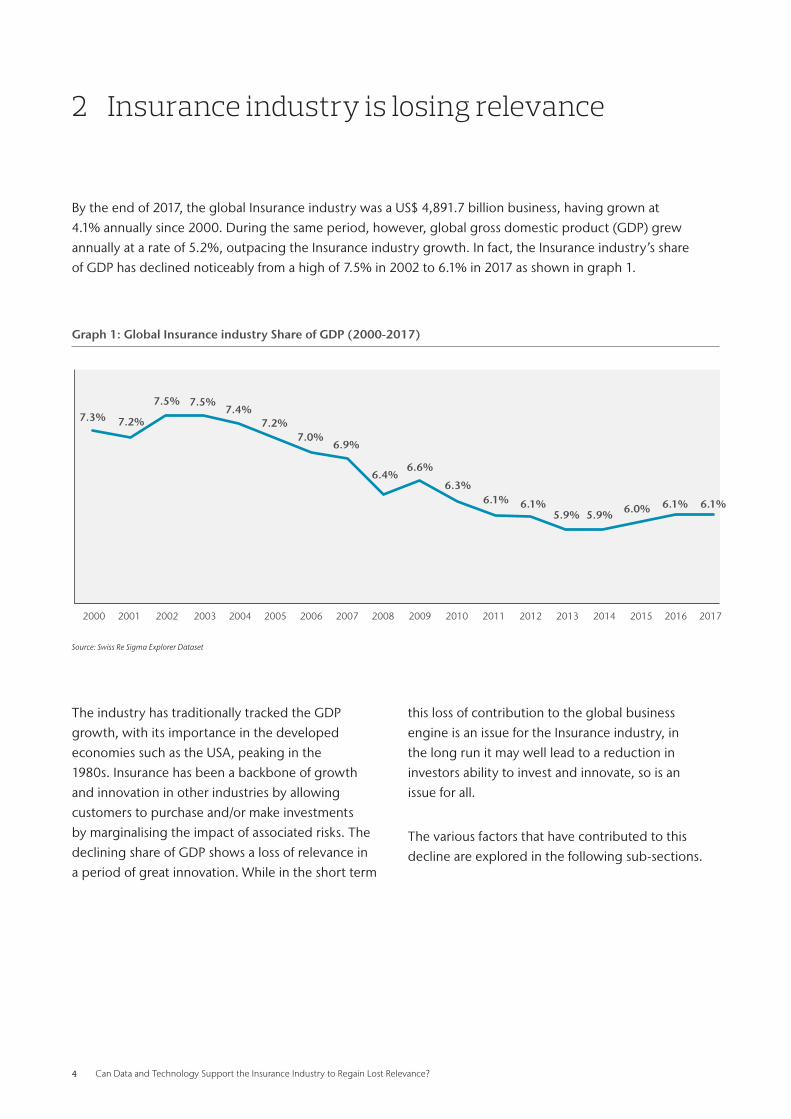
By the end of 2017, the global Insurance industry was a US$ 4,891.7 billion business, having grown at 4.1% annually since 2000. During the same period, however, global gross domestic product (GDP) grew annually at a rate of 5.2%, outpacing the Insurance industry growth. In fact, the Insurance industry’s share of GDP has declined noticeably from a high of 7.5% in 2002 to 6.1% in 2017 as shown in graph 1.
The industry has traditionally tracked the GDP growth, with its importance in the developed economies such as the USA, peaking in the 1980s. Insurance has been a backbone of growth and innovation in other industries by allowing customers to purchase and/or make investments by marginalising the impact of associated risks. The declining share of GDP shows a loss of relevance in a period of great innovation. While in the short term
this loss of contribution to the global business engine is an issue for the Insurance industry, in the long run it may well lead to a reduction in investors ability to invest and innovate, so is an issue for all.
The various factors that have contributed to this decline are explored in the following sub-sections.
Graph 1: Global Insurance industry Share of GDP (2000-2017)
7.3% 7.2%
7.5% 7.5%7.4%
7.2%7.0%
6.9%
6.4%6.6%
6.3%6.1% 6.1%
5.9% 5.9% 6.0% 6.1% 6.1%
2000 2001 2002 2003 2004 2005 2006 2007 2008 2009 2010 2011 2012 2013 2014 2015 2016 2017
Source: Swiss Re Sigma Explorer Dataset
Can Data and Technology Support the Insurance Industry to Regain Lost Relevance? 5
2 .1 Insurance industry is slow to evolve
The Insurance industry has historically lacked an appetite to evolve and has shown reluctance in adopting industry-wide
changes. A number of key elements, have created high barriers to entry. New entrants have found it difficult to challenge the
status quo and lack appetite to win market share from incumbents with significantly large balance sheets. Such high barriers
have kept the impact of disruption to minimal, allowing the industry to stay complacent even when most other industries
have undergone significant structural shifts. In many ways ‘Darwin’ has not been at work.
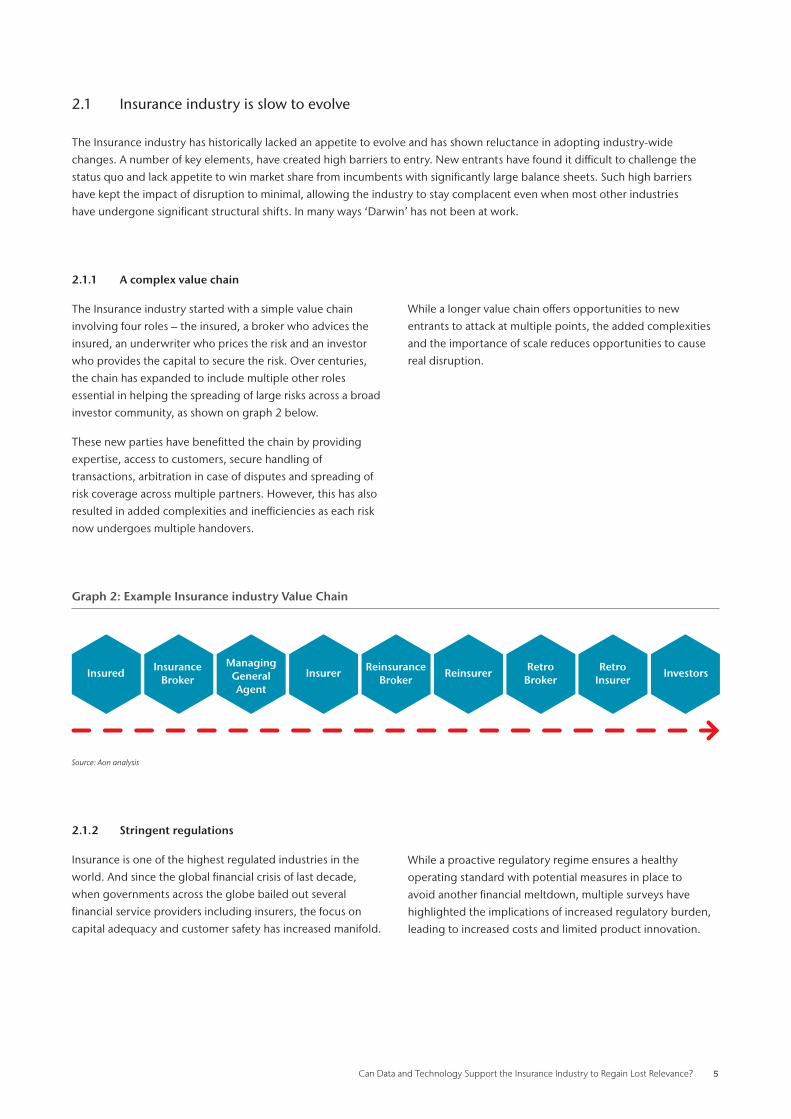
2.1.1 A complex value chain
The Insurance industry started with a simple value chain
involving four roles – the insured, a broker who advices the
insured, an underwriter who prices the risk and an investor
who provides the capital to secure the risk. Over centuries,
the chain has expanded to include multiple other roles
essential in helping the spreading of large risks across a broad
investor community, as shown on graph 2 below.
These new parties have benefitted the chain by providing
expertise, access to customers, secure handling of
transactions, arbitration in case of disputes and spreading of
risk coverage across multiple partners. However, this has also
resulted in added complexities and inefficiencies as each risk
now undergoes multiple handovers.
While a longer value chain offers opportunities to new
entrants to attack at multiple points, the added complexities
and the importance of scale reduces opportunities to cause
real disruption.
2.1.2 Stringent regulations
Insurance is one of the highest regulated industries in the
world. And since the global financial crisis of last decade,
when governments across the globe bailed out several
financial service providers including insurers, the focus on
capital adequacy and customer safety has increased manifold.
While a proactive regulatory regime ensures a healthy
operating standard with potential measures in place to
avoid another financial meltdown, multiple surveys have
highlighted the implications of increased regulatory burden,
leading to increased costs and limited product innovation.
Insured Insurer ReinsurerInsurance Broker
ReinsuranceBroker
RetroBroker
Retro Insurer
InvestorsManaging
General Agent
Graph 2: Example Insurance industry Value Chain
Source: Aon analysis
6 Can Data and Technology Support the Insurance Industry to Regain Lost Relevance?
2.1.4 Need for proprietary and historical data.
Accurate pricing of the risk is key to survival in the industry.
The insurers (specifically underwriters supported by
actuaries) rely excessively on experience and statistical
analysis to determine the premiums that they would be
willing to take to cover the risk.
Access to correct and historical data is of chief importance
and has been a key differentiating factor amongst insurers.
Since the dawn of Third Industrial Revolution in the 1980s,
insurers have been involved in a race to acquire, store and
develop proprietary databases that allow them to price risks
better than the competitors.
The collection of these extensive databases by incumbent
insurers have given them immense benefits over new
entrants that do not typically have similar datasets.
Additionally, the incumbents have continued to add on
to these databases through an unchallenged continuation
of underwriting– which has further widened the gap for
new entrants.
2 .2 Struggling to meet customer needs
Despite years of existence, the Insurance industry has failed
to keep up with the demand for risk coverage. For example
the economic value of losses from all natural disasters has
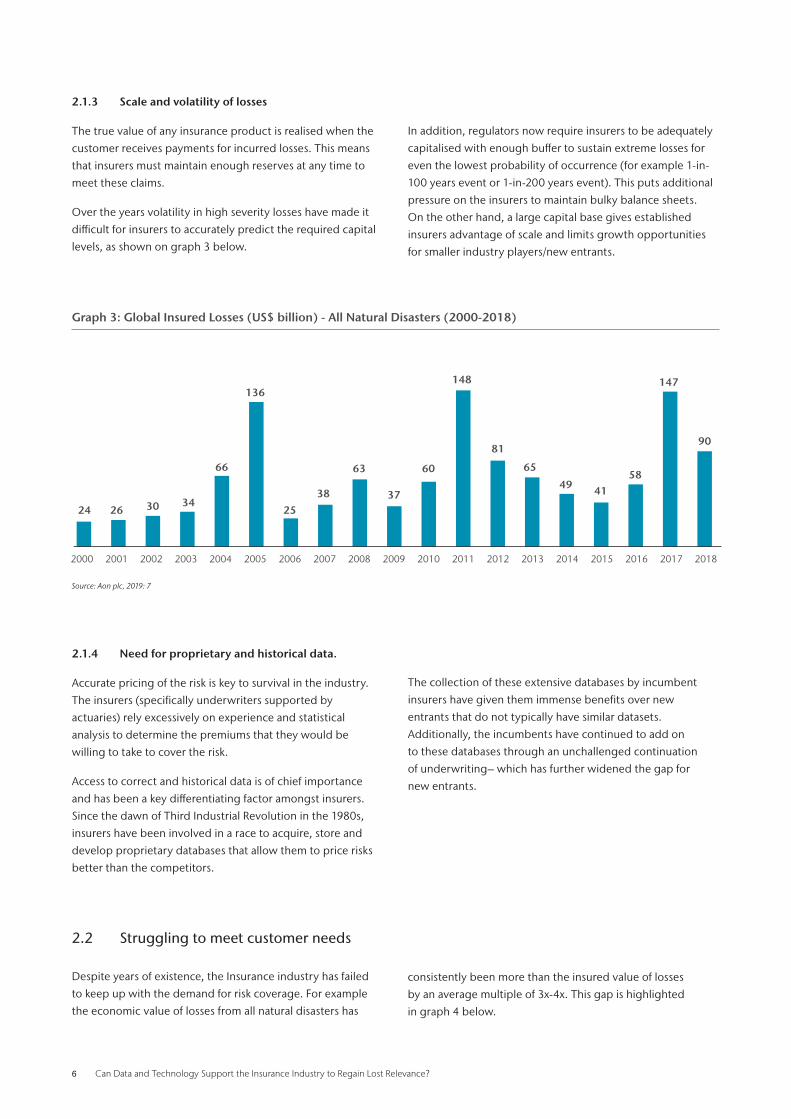
2.1.3 Scale and volatility of losses
The true value of any insurance product is realised when the
customer receives payments for incurred losses. This means
that insurers must maintain enough reserves at any time to
meet these claims.
Over the years volatility in high severity losses have made it
difficult for insurers to accurately predict the required capital
levels, as shown on graph 3 below.
In addition, regulators now require insurers to be adequately
capitalised with enough buffer to sustain extreme losses for
even the lowest probability of occurrence (for example 1-in-
100 years event or 1-in-200 years event). This puts additional
pressure on the insurers to maintain bulky balance sheets.
On the other hand, a large capital base gives established
insurers advantage of scale and limits growth opportunities
for smaller industry players/new entrants.
consistently been more than the insured value of losses
by an average multiple of 3x-4x. This gap is highlighted
in graph 4 below.
2000 2001 2002 2003 2004 2005 2006 2007 2008 2009 2010 2011 2012 2013 2014 2015 2016 2017 2018
Graph 3: Global Insured Losses (US$ billion) - All Natural Disasters (2000-2018)
24 26 30 34
66
136
25
38
63 60
148
81
65
49 4158
147
90
37
Source: Aon plc, 2019: 7
Can Data and Technology Support the Insurance Industry to Regain Lost Relevance? 7
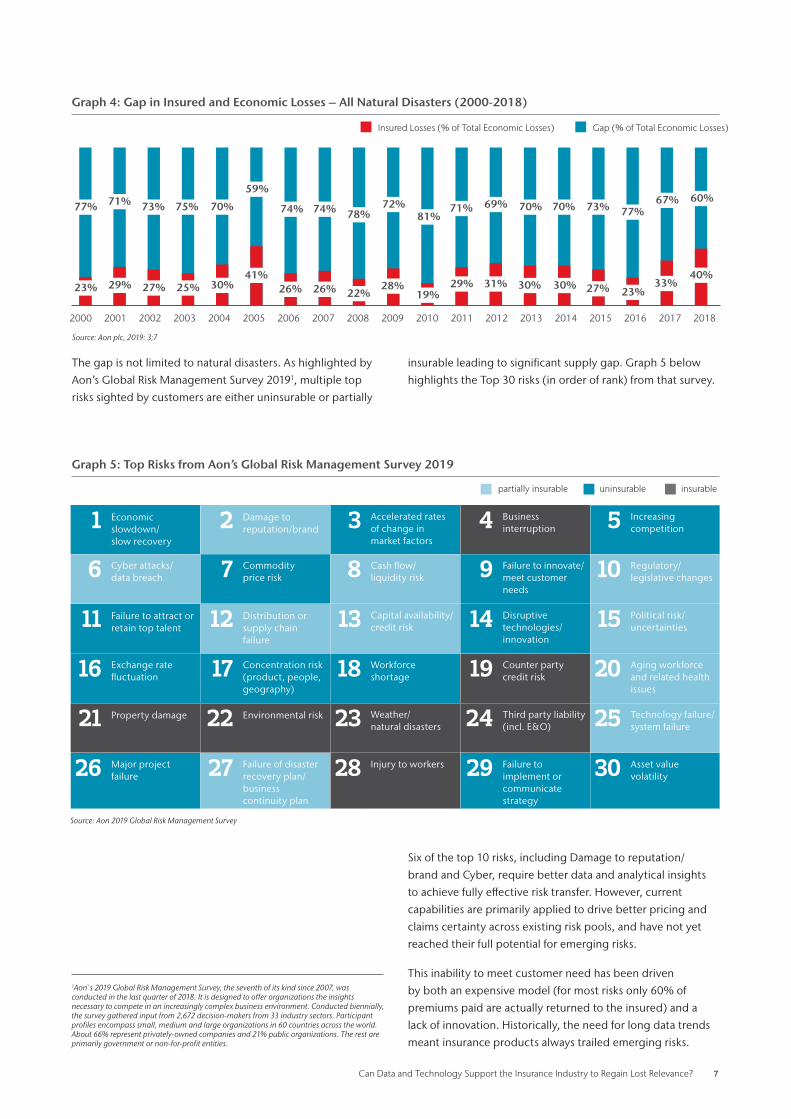
The gap is not limited to natural disasters. As highlighted by
Aon’s Global Risk Management Survey 20191, multiple top
risks sighted by customers are either uninsurable or partially
Six of the top 10 risks, including Damage to reputation/
brand and Cyber, require better data and analytical insights
to achieve fully effective risk transfer. However, current
capabilities are primarily applied to drive better pricing and
claims certainty across existing risk pools, and have not yet
reached their full potential for emerging risks.
This inability to meet customer need has been driven
by both an expensive model (for most risks only 60% of
premiums paid are actually returned to the insured) and a
lack of innovation. Historically, the need for long data trends
meant insurance products always trailed emerging risks.
Source: Aon plc, 2019: 3;7
Graph 4: Gap in Insured and Economic Losses – All Natural Disasters (2000-2018)
2000 2001 2002 2003 2004 2005 2006 2007 2008 2009 2010 2011 2012 2013 2014 2015 2016 2017 2018
77%
23% 29% 27% 25% 30%41%
26% 26% 22%28% 29% 31% 30% 30% 27% 23%
33%40%
19%
71% 73% 75% 70%
59%
74% 74% 78%72% 71% 70% 70% 73%
67% 60%77%
69%81%
Insured Losses (% of Total Economic Losses) Gap (% of Total Economic Losses)
Source: Aon 2019 Global Risk Management Survey
Graph 5: Top Risks from Aon’s Global Risk Management Survey 2019
partially insurable uninsurable insurable
1Aon s 2019 Global Risk Management Survey, the seventh of its kind since 2007, was conducted in the last quarter of 2018. It is designed to offer organizations the insights necessary to compete in an increasingly complex business environment. Conducted biennially, the survey gathered input from 2,672 decision-makers from 33 industry sectors. Participant profiles encompass small, medium and large organizations in 60 countries across the world. About 66% represent privately-owned companies and 21% public organizations. The rest are primarily government or non-for-profit entities.
insurable leading to significant supply gap. Graph 5 below
highlights the Top 30 risks (in order of rank) from that survey.
1 Economic slowdown/ slow recovery
2 Damage to reputation/brand 3 Accelerated rates
of change in market factors
4 Business interruption 5 Increasing
competition
6 Cyber attacks/ data breach 7 Commodity
price risk 8 Cash flow/ liquidity risk 9 Failure to innovate/
meet customer needs
10 Regulatory/ legislative changes
11 Failure to attract or retain top talent 12 Distribution or
supply chain failure
13 Capital availability/ credit risk 14 Disruptive
technologies/ innovation
15 Political risk/ uncertainties
16 Exchange rate fluctuation 17 Concentration risk
(product, people, geography)
18 Workforce shortage 19 Counter party
credit risk 20 Aging workforce and related health issues
21 Property damage 22 Environmental risk 23 Weather/ natural disasters 24 Third party liability
(incl. E&O) 25 Technology failure/ system failure
26 Major project failure 27 Failure of disaster
recovery plan/ business continuity plan
28 Injury to workers 29 Failure to implement or communicate strategy
30 Asset value volatility
8 Can Data and Technology Support the Insurance Industry to Regain Lost Relevance?
2 .3 Core business in decline
Attritional losses are defined as losses occurring from non-
catastrophe events. These are high frequency-low severity
losses that are generally stable and relatively easier to model
and reserve for. Insurers are keen to cover attritional losses
to counter-balance the volatility-prone and uncorrelated
catastrophe-risks.
However, given the improvements in technology and
infrastructure, an increase in consumer awareness on
health and safety matters and a focus on prevention rather
than claim, attritional losses have followed a downward
trajectory. The data below highlights a reduction in
frequency of incidents leading to lower attritional losses,
which consequently impacts the demand for such
insurance products.
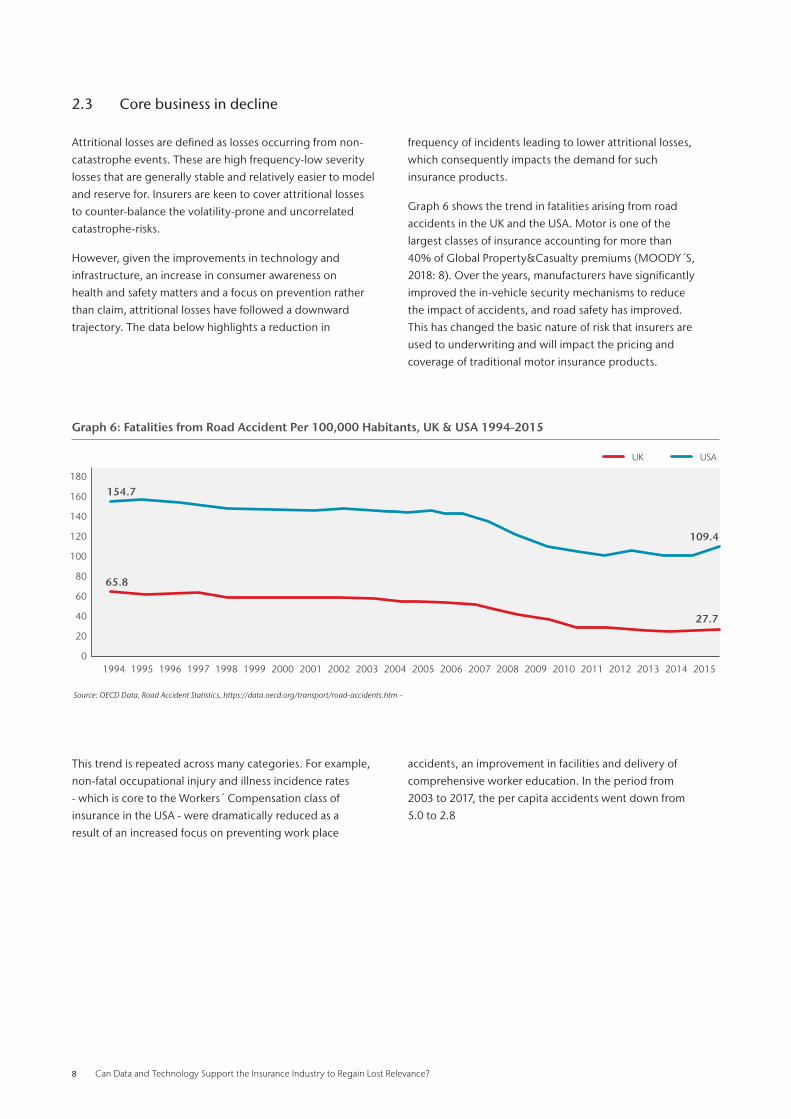
Graph 6 shows the trend in fatalities arising from road
accidents in the UK and the USA. Motor is one of the
largest classes of insurance accounting for more than
40% of Global Property&Casualty premiums (MOODY´S,
2018: 8). Over the years, manufacturers have significantly
improved the in-vehicle security mechanisms to reduce
the impact of accidents, and road safety has improved.
This has changed the basic nature of risk that insurers are
used to underwriting and will impact the pricing and
coverage of traditional motor insurance products.
This trend is repeated across many categories. For example,
non-fatal occupational injury and illness incidence rates
- which is core to the Workers Compensation class of
insurance in the USA - were dramatically reduced as a
result of an increased focus on preventing work place
accidents, an improvement in facilities and delivery of
comprehensive worker education. In the period from
2003 to 2017, the per capita accidents went down from
5.0 to 2.8
Graph 6: Fatalities from Road Accident Per 100,000 Habitants, UK & USA 1994-2015
1994 1995 1996 1997 1998 1999 2000 2001 2002 2003 2004 2005 2006 2007 2008 20122009 20132010 20142011 2015
180
160
140
120
100
80
60
40
20
0
UK USA
154.7
65.8
109.4
27.7
Source: OECD Data, Road Accident Statistics, https://data.oecd.org/transport/road-accidents.htm –
Can Data and Technology Support the Insurance Industry to Regain Lost Relevance? 9
3 Status Quo is being challenged
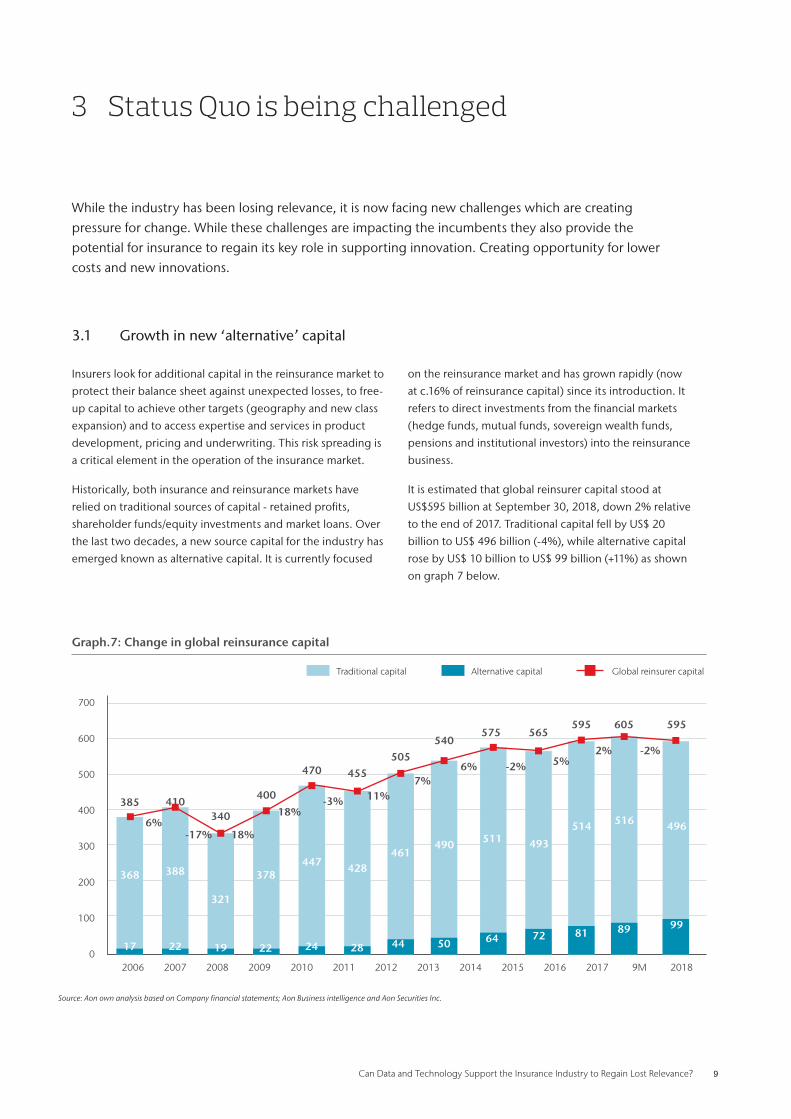
While the industry has been losing relevance, it is now facing new challenges which are creating pressure for change. While these challenges are impacting the incumbents they also provide the potential for insurance to regain its key role in supporting innovation. Creating opportunity for lower costs and new innovations.
3 .1 Growth in new ‘alternative’ capital
Insurers look for additional capital in the reinsurance market to
protect their balance sheet against unexpected losses, to free-
up capital to achieve other targets (geography and new class
expansion) and to access expertise and services in product
development, pricing and underwriting. This risk spreading is
a critical element in the operation of the insurance market.
Historically, both insurance and reinsurance markets have
relied on traditional sources of capital - retained profits,
shareholder funds/equity investments and market loans. Over
the last two decades, a new source capital for the industry has
emerged known as alternative capital. It is currently focused
on the reinsurance market and has grown rapidly (now
at c.16% of reinsurance capital) since its introduction. It
refers to direct investments from the financial markets
(hedge funds, mutual funds, sovereign wealth funds,
pensions and institutional investors) into the reinsurance
business.
It is estimated that global reinsurer capital stood at
US$595 billion at September 30, 2018, down 2% relative
to the end of 2017. Traditional capital fell by US$ 20
billion to US$ 496 billion (-4%), while alternative capital
rose by US$ 10 billion to US$ 99 billion (+11%) as shown
on graph 7 below.
Graph.7: Change in global reinsurance capital
Source: Aon own analysis based on Company financial statements; Aon Business intelligence and Aon Securities Inc.
2006 2007 2008 2009 2010 2011 2012 2013 2014 2015 2016 2017 9M 2018
700
600
500
400
300
200
100
0
385
6%-17% 18%
18%-3%
368 388
321
378447 428
461490 511 493
514 516 496
17 22 19 22 24 28 44 50 64 72 81 89 99
410400
470 455
505540
575 565595 605 595
340
11%7%
-2%6% 5%2% -2%
Traditional capital Alternative capital Global reinsurer capital

10 Can Data and Technology Support the Insurance Industry to Regain Lost Relevance?
Alternative capital firstly appeared in the early 1990s.
Hurricanes Andrew and Iniki (both in 1992), followed by the
Northridge Earthquake (in 1994), led to higher reinsurance
prices and questions about the ability of traditional reinsurance
to pay losses after catastrophes. In 2005, losses from hurricanes
in the USA stimulated the growth of the non-traditional risk
transfer market and increased the popularity of Cat Bonds,
Industry Loss Warranties (ILWs)2 and Sidecars3. These products
were supported by alternative capital. In essence, the capital
was used to absorb the effects of a hard market (rising prices)
or to manage complex or difficult risk exposures which
were often uninsurable in the traditional insurance market.
(BRUGGEMAN, V. 2007: 5). This was aided by the increased
availability of structured and historial data on losses.
After the financial crisis of 2008, the incentive to diversify
investments and a need for returns further enhanced the appeal
of Insurance industry to the holders of alternative capital.
With further improvements in data and analytics, alternative
capital can potentially bypass the traditional value chain to
access ‘pure’ insurance risks. Supported by detailed exposure
data and facilitated by emerging technologies, this form of
capital is cheaper and allows for more efficient transaction
mechanisms compared to traditional forms of capital. It has
significant potential in lowering the long term costs of gaining
insurance due to its lower cost of capital. Enabling insurance
to cover more risk.
3 .2 Growth of intangible assets
The insurance customer landscape has changed considerably:
traditional property and casualty losses are no longer the only
main risks that corporations are focused on mitigating. The
importance of intellectual property and brand/reputation in value
creation is leading to a realignment in the customer risk profile.
Value in the corporate world is no longer driven by physical/
tangible assets. As technology has advanced, it has led to
the growth of intangibles assets in the form of intellectual
property. The graph below shows that 84% of market
capitalization in 2018 was driven by intangible assets. While
the five largest corporations in 1975 were manufacturing
companies (IBM; Exxon Mobil; P&G; GE; 3M), that has
completely changed in 2018 as the first five positions were
occupied by Tech companies (Apple; Alphabet; Microsoft;
Amazon; Facebook).
Yet, organizations are only able to secure coverage to insure
a relatively small portion of their intangible assets (15%)
compared to insurance coverage for legacy tangible assets
(59%), as shown on graph 9 below.
This shift represents both a challenge and an opportunity for
the Insurance industry. The ability to provide coverage for
intangible assets would enable insurance to regain relevance
and support innovation and investment. Until it can, its
importance is likely to remain muted.
2Industry Loss Warranties (ILW): the specified limite denotes the amount of compensation received if the industry loss warranty is triggered3Sidecar is a quota share contract between (re)insurers and investors covering a book of business
Graph.8: Tangible vs Intangible assets for S&P Companies 1975-2018
1975 1985 1995 2005 2018
83%17%
Tangible Assets Intangible Assets
16%
84%
Source: Aon own analysis based on Company financial statements; Aon Business intelligence and Aon Securities Inc.
Graph.9: Percentage of Property, Plant & Equipment (PP&E) and Information assets covered by insurance
70%
60%
50%
40%
30%
20%
10%
0%
59%
15%
The percentage of potential loss to PP&E assets covered
by insurance
The percentage of potential loss to information assets
covered by insurance
Source: PONEMON INSTITUTE LLC, 2017: 3
Can Data and Technology Support the Insurance Industry to Regain Lost Relevance? 11
3 .3 Sharing economy
The sharing economy is an emerging economic system,
based on the use of internet and mobile technology, to
share assets or services on a peer-to-peer level. It allows
the participants to gain instant access to goods, services,
experiences, resources or information without the burden
of ownership or long-term commitment.
Popularized by the likes of Airbnb and Uber, the sharing
economy has emerged as a global movement that
continues to shape the global economy. Although still
relatively small – revenues globally are estimated in US$ 15
billion in 2014 – it is projected to reach US$ 335 billion by
2025 (PwC, 2015: 14).
Shared assets promoted by these firms is beginning to have
an affect on insurance, changing the relationships between
insured and insurer. Increasingly to support shared assets,
insurance needs to be integrated into the shared service,
rather than being a policy held by an individual.
No where is this more relevant that in the rise of shared and
autonomous vehicles. By 2025, the car market for partially
autonomous vehicles is expected to be at US$ 36 billion
while the market for fully autonomous vehicles lags at
US$ 6 billion4 . Some industry experts predict up to 21
million autonomous cars could be sold globally in 2035,
and that more than half of US traffic could be autonomous
by 2050.
Self-driving cars will change how cars are insured with
most of the liability asscociated with self-driving cars
stemming from manufacturer rather than driver. This new
generation of cars will create new types of risks, such as
cyber, which were not associated with traditional motor
insurance (DELOITTE, 2016: 7)
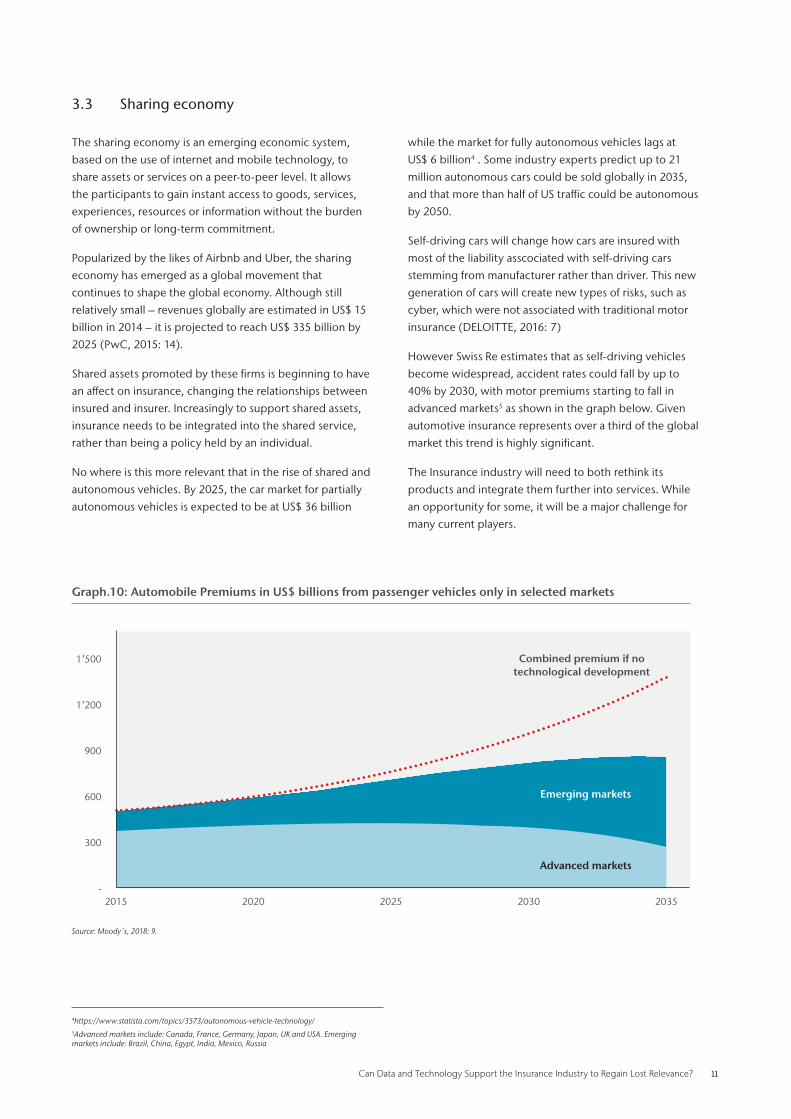
However Swiss Re estimates that as self-driving vehicles
become widespread, accident rates could fall by up to
40% by 2030, with motor premiums starting to fall in
advanced markets5 as shown in the graph below. Given
automotive insurance represents over a third of the global
market this trend is highly significant.
The Insurance industry will need to both rethink its
products and integrate them further into services. While
an opportunity for some, it will be a major challenge for
many current players.
Graph.10: Automobile Premiums in US$ billions from passenger vehicles only in selected markets
1’500
1’200
900
600
300
-2015 2020 2025 2030 2035
Combined premium if no technological development
Emerging markets
Advanced markets
Source: Moody s, 2018: 9.
4https://www.statista.com/topics/3573/autonomous-vehicle-technology/5Advanced markets include: Canada, France, Germany, Japan, UK and USA. Emerging markets include: Brazil, China, Egypt, India, Mexico, Russia

12 Can Data and Technology Support the Insurance Industry to Regain Lost Relevance?
3 .4 InsurTech
The Insurance industry has had traditionally manual
processes, and has been a paper driven industry with
huge inefficiencies. While customers needs are evolving
at an unprecedented quick pace, the incumbents large
legacy systems and naturally conservative approach, make
them slow to reach the market with new products and an
improved customer experience.
InsurTechs are companies that use technology to make the
traditional insurance value chain more efficient. They are
beginning to reshape the Insurance industry by targeting
particular value pools or services in the sector, rather than
seek to provide end-to-end solutions.
InsurTechs have seen more than US$ 11 billion of funding
since 2015, and the volume in 2018 is expected to reach
US$ 3,8 billion (FT PARTNERS). While Insurtechs were
originally viewed as a disruptive force competing with
traditional insurers to gain market share, there is a growing
collaboration and partnership with the incumbent
players. Most of them are launched to help solve legacy
insurer problems across the organization, from general
inefficiency in operations to enhancing underwriting,
distribution, and claims functions, especially in consumer
facing insurance. More recently they are also moving into
the commercial segment focusing on loss prevention
and efficiency. (CATLIN, T. et al. 2017). Incumbent
insurers have managed to leverage InsurTechs to speed
up innovation (DELOITTE, 2018: 11). From a funding
perspective most of the US$ 2.6 billion that went into
the InsurTechs in the first nine months of 2018 came from
incumbent Insurers. (MOODY S, 2018: 6).
The accelerated use of technology and digital capabilities
again represents both a challenge for the industry but also
an opportunity to innovate and develop more efficient
products and services.
Can Data and Technology Support the Insurance Industry to Regain Lost Relevance? 13
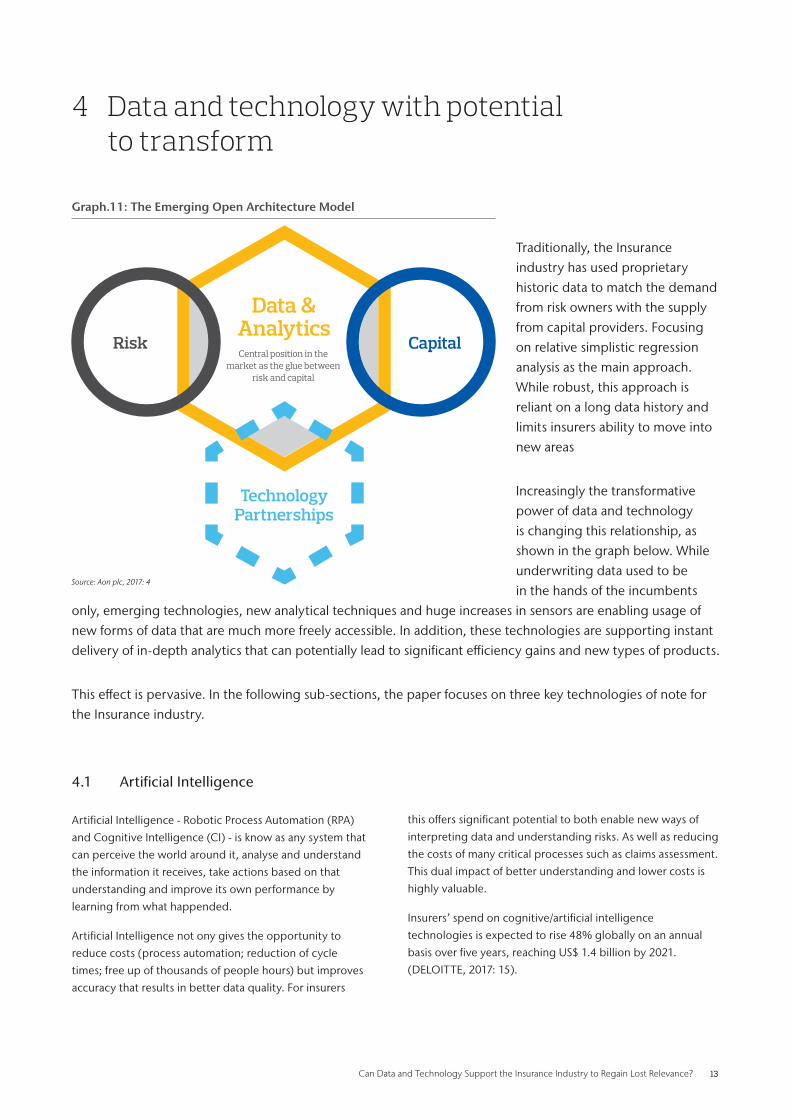
4 Data and technology with potential to transform
Traditionally, the Insurance industry has used proprietary historic data to match the demand from risk owners with the supply from capital providers. Focusing on relative simplistic regression analysis as the main approach. While robust, this approach is reliant on a long data history and limits insurers ability to move into new areas
Increasingly the transformative power of data and technology is changing this relationship, as shown in the graph below. While underwriting data used to be in the hands of the incumbents
only, emerging technologies, new analytical techniques and huge increases in sensors are enabling usage of new forms of data that are much more freely accessible. In addition, these technologies are supporting instant delivery of in-depth analytics that can potentially lead to significant efficiency gains and new types of products.
This effect is pervasive. In the following sub-sections, the paper focuses on three key technologies of note for the Insurance industry.
4 .1 Artificial Intelligence
Artificial Intelligence - Robotic Process Automation (RPA)
and Cognitive Intelligence (CI) - is know as any system that
can perceive the world around it, analyse and understand
the information it receives, take actions based on that
understanding and improve its own performance by
learning from what happended.
Artificial Intelligence not ony gives the opportunity to
reduce costs (process automation; reduction of cycle
times; free up of thousands of people hours) but improves
accuracy that results in better data quality. For insurers
this offers significant potential to both enable new ways of
interpreting data and understanding risks. As well as reducing
the costs of many critical processes such as claims assessment.
This dual impact of better understanding and lower costs is
highly valuable.
Insurers’ spend on cognitive/artificial intelligence
technologies is expected to rise 48% globally on an annual
basis over five years, reaching US$ 1.4 billion by 2021.
(DELOITTE, 2017: 15).
Data & Analytics
Capital
Technology Partnerships
RiskCentral position in the
market as the glue between risk and capital
Source: Aon plc, 2017: 4
Graph.11: The Emerging Open Architecture Model
14 Can Data and Technology Support the Insurance Industry to Regain Lost Relevance?
4 .2 Internet of Things
The Internet of Things refers to the digitization of objects
around us. It works by embedding advanced hardware (e.g.
sensors, cameras and meters) into everyday objects and
even people themselves, linking those objects further to on-
line networks. (MOODY S, 2018: 11).
For example, connected devices in the homes such as
water leakage detectors, smoke alarms, C02 readers
and sophisticated home security systems will support
prevention and reduction in losses from water damage, fire
and burglary, respectively.
The Internet of Things has the potential to significantly
change the way that risks are underwritten. The ability
to have access to data in ‘real time’ will provide greater
precision in the pricing of risk and also help insurers to
respond better to the evolving customer needs. Consider
the example of home insurance; customers will be forced
to resconsider the decision to buy home insurance as
packaged currently when their house is already monitored
24/7 for break-ins and the sensors are constantly monitoring
the appliances to prevent fires. The insurers could utilise
the same data to develop customised insurance policies
depending on usage and scope of sensors.
The Internet of Things applies equally to wearable devices
with embedded sensors for tracking vital statistics to improve
the health, safety and productivity of individuals at work. It is
predicted that the connected health market will be worth US$
61 billion by 20206.
The Internet of Things offers the Insurance industry an
opportunity to reinvent itself and to move from simply
insuring against risk to helping customers protect the
properties / health. This integration of insurance with
products through live sensor data can revolutionise how
insurance is embedded into our every day lives.
6https://medium.com/iotforall/how-will-iot-transform-the-insurance-industry-609f89a12bf1
Can Data and Technology Support the Insurance Industry to Regain Lost Relevance? 15
4 .3 Blockchain
All disruptive technologies have a “tipping point” – the
exact moment when it moves from early adopters to
widespread acceptance. Just as it was for Google in the
late 1990s and smartphones in the 2000s, could we be
approaching the tipping point for the next big disruptive
technology – blockchain?
Essentially, blockchain is a shared digital ledger technology
that allows a continuously growing number of transactions
to be recorded and verified electronically over a network
of computers. It holds an immutable record of data, stored
locally by each party to remove the barrier of trust. Through
smart contacts, blockchain can enable automation of tasks
for more efficient processing. It made its debut in 2009 as
the system used to track dealing in the first cryptocurrency,
Bitcoin, and, since then, organisations around the world
have spotted blockchain’s potential to transform operations.
Most industries are currently experimenting with blockchain
to identify and prove successful use cases to embrace the
technology in business as usual. IDC, a leading market
intelligence firm, expects the spend on blockchain to
increase from US$ 1.8 billion in 2018 to US$ 11.7 billion in
2022 at a growth rate of 60%7.
With all the aforementioned benefits, blockchain also
has potential to impact the Insurance industry. It can
help Insurers reduce operational and administrative
costs through automated verification of policyholders,
auditable registration of claims and data from third parties,
underwriting of small contracts and automation of claims
procedures. Equally, it can help reduce the fraud which
would contribute to reduce total cost.
In an industry where ‘trust’ is critical, the ability to have
guaranteed contracts, with claims certainty will help the
take-up of insurance in new areas.
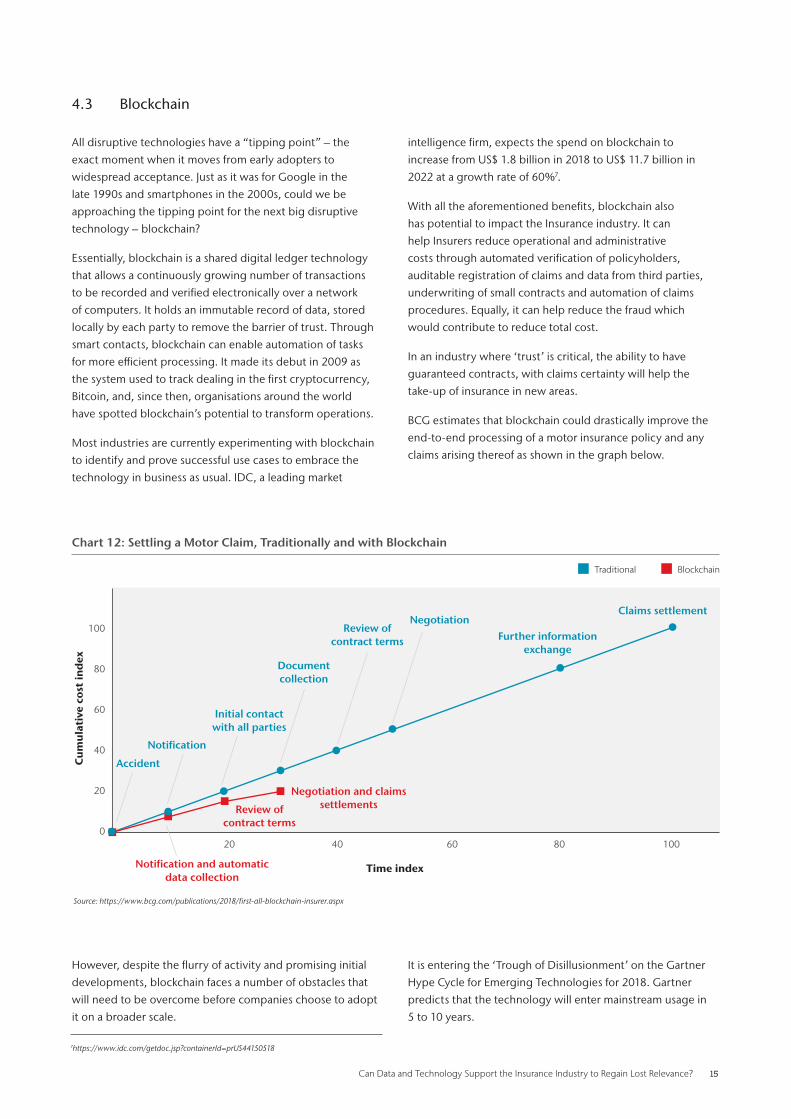
BCG estimates that blockchain could drastically improve the
end-to-end processing of a motor insurance policy and any
claims arising thereof as shown in the graph below.
However, despite the flurry of activity and promising initial
developments, blockchain faces a number of obstacles that
will need to be overcome before companies choose to adopt
it on a broader scale.
100
80
60
40
20
020 40 60 80 100
Time index
Cu
mu
lati
ve c
ost
ind
ex
Chart 12: Settling a Motor Claim, Traditionally and with Blockchain
Claims settlement
Further information exchange
NegotiationReview of
contract terms
Document collection
Negotiation and claims settlementsReview of
contract terms
Notification and automatic data collection
Initial contact with all parties
Notification
Accident
Traditional Blockchain
Source: https://www.bcg.com/publications/2018/first-all-blockchain-insurer.aspx
It is entering the ‘Trough of Disillusionment’ on the Gartner
Hype Cycle for Emerging Technologies for 2018. Gartner
predicts that the technology will enter mainstream usage in
5 to 10 years.
7https://www.idc.com/getdoc.jsp?containerId=prUS44150518
16 Can Data and Technology Support the Insurance Industry to Regain Lost Relevance?
5 How will the industry respond?
The Insurance industry is facing unprecedented challenges to its identity. After years of decline the industry finds itself at a cross roads. Insurance needs are changing rapidly, new technologies and data are available and finally the barriers to change are coming down. The industry is at an inflection point and must decide a course of action to regain relevance. If insurance gains relevance all industries prosper as our ability to invest and innovate grows. So how will the Insurance industry respond?
5 .1 The industry structure will change
Propietary data and a large capital base are the two most
critical factors that have protected incumbents from
competition. However, these factors are severely under
challenge from the increased availability of digital data
and the emergence of alternative capital. In response,
Managing General Agents (MGAs) have emerged and are
forcing a restructuring of the industry value chain.
MGAs act as underwriters without holding the actual risk
on their books. They rely on availability of non-proprietary
data to price and manage risks on behalf of a capital
provider (traditional or alternative) and often support
coverage of niche products. As the MGAs are not required
to hold capital, same regulatory restrictions do not apply
as they do to traditional underwriters. This allows for more
innovative coverages with a higher speed to bring new
products to market. Given their size and age, the MGAs are
able to operate efficiently and adapt in accordance with
customer demands.
MGAs are increasingly being supported by investors of
alternative capital that are now seeking higher returns by
covering ‘pure risks’. This is leading to a shortening of the
value chain as shown in Graph 2.
The growth of MGAs is a sign of the industry beginning to
innovate. By the end of 2015, MGAs wrote US$ 41.6 billion
Property & Casualty insurance premiums in the USA. This
reflected an annual increase of 8.9% between 2011 and
2015. During the same time, the number of active MGAs
in the USA increased from 399 in 2011 to 610 in 2015 at an
annual rate of 10.0%. (USA Statutory Filings)
To put this into perspective – in 1999, MGAs accounted
for 4% of the Commercial Property & Casualty insurance
business written in the USA. By 2015, this share had
increased to over 14% and is expected to rise further.
(USA Statutory Filings).
5 .2 We will have new products
There is a growing demand for coverage of new risks
emanating from emerging technologies, new business
models – like Airbnb - and the increased interconnectivity.
To gain relevance, the industry must address these
demands in a timely manner.
Cyber is the most important of such new risks. A Cyber
attack impacts every area of an organization and could
lead to an infinite number of further loss events. The reality
is that only 30% of the corporations surveyed in the “2017
Global Cyber Risk Transfer Comparison Report” are “fully
aware” of the economic and legal consequences of an
international data breach or security exploit. It therefore
requires a holistic, multi-disciplinary approach to manage.
There s been a tremendous rise since 2017 in the
sophistification, scale and impact of Cyber attacks. As
corporations strive to enrich their customer experiences
through a spectrum of endpoints - ranging from mobile
devices to automobiles – the attack surface has increased
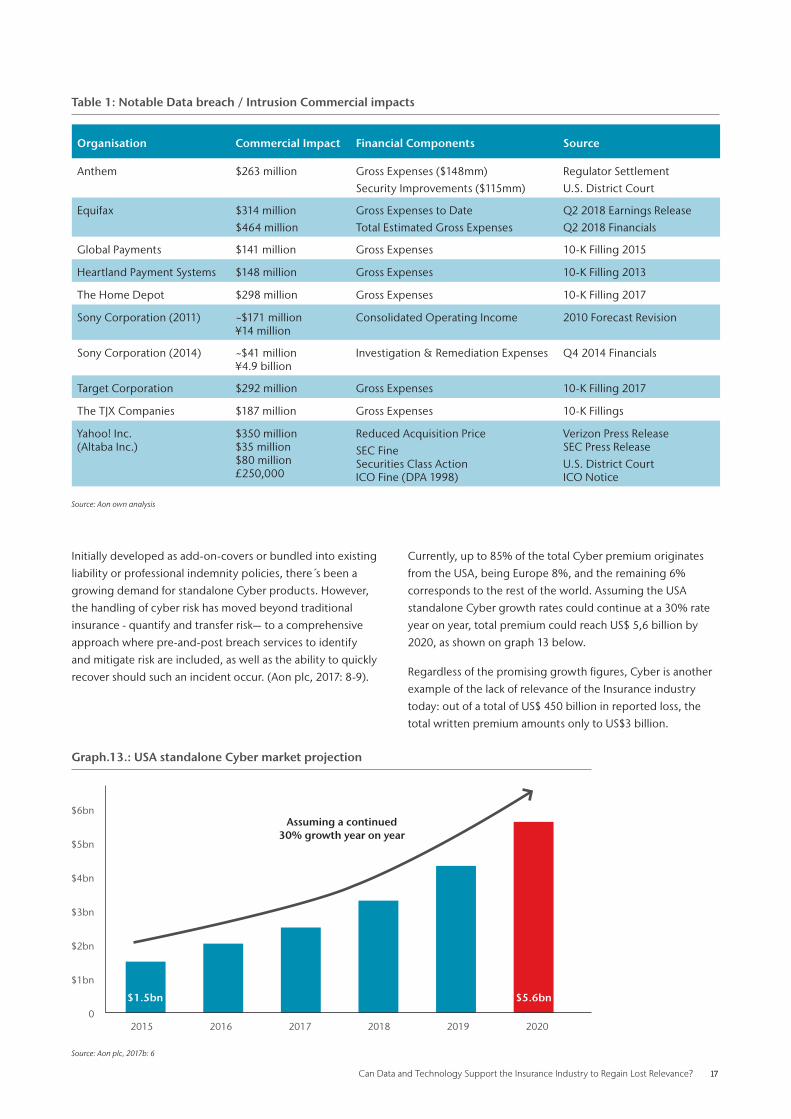
dramatically. The table below shows some of the most
notable breaches and its commercial impact.
Can Data and Technology Support the Insurance Industry to Regain Lost Relevance? 17
Initially developed as add-on-covers or bundled into existing
liability or professional indemnity policies, there s been a
growing demand for standalone Cyber products. However,
the handling of cyber risk has moved beyond traditional
insurance - quantify and transfer risk— to a comprehensive
approach where pre-and-post breach services to identify
and mitigate risk are included, as well as the ability to quickly
recover should such an incident occur. (Aon plc, 2017: 8-9).
Organisation Commercial Impact Financial Components Source
Anthem $263 million Gross Expenses ($148mm)Security Improvements ($115mm)
Regulator SettlementU.S. District Court
Equifax $314 million$464 million
Gross Expenses to DateTotal Estimated Gross Expenses
Q2 2018 Earnings ReleaseQ2 2018 Financials
Global Payments $141 million Gross Expenses 10-K Filling 2015
Heartland Payment Systems $148 million Gross Expenses 10-K Filling 2013
The Home Depot $298 million Gross Expenses 10-K Filling 2017
Sony Corporation (2011) ~$171 million ¥14 million
Consolidated Operating Income 2010 Forecast Revision
Sony Corporation (2014) ~$41 million ¥4.9 billion
Investigation & Remediation Expenses Q4 2014 Financials
Target Corporation $292 million Gross Expenses 10-K Filling 2017
The TJX Companies $187 million Gross Expenses 10-K Fillings
Yahoo! Inc. (Altaba Inc.)
$350 million $35 million $80 million £250,000
Reduced Acquisition PriceSEC Fine Securities Class Action ICO Fine (DPA 1998)
Verizon Press Release SEC Press ReleaseU.S. District Court ICO Notice
Source: Aon own analysis
Table 1: Notable Data breach / Intrusion Commercial impacts
Currently, up to 85% of the total Cyber premium originates
from the USA, being Europe 8%, and the remaining 6%
corresponds to the rest of the world. Assuming the USA
standalone Cyber growth rates could continue at a 30% rate
year on year, total premium could reach US$ 5,6 billion by
2020, as shown on graph 13 below.
Regardless of the promising growth figures, Cyber is another
example of the lack of relevance of the Insurance industry
today: out of a total of US$ 450 billion in reported loss, the
total written premium amounts only to US$3 billion.
$6bn
$5bn
$4bn
$3bn
$2bn
$1bn
02015 2016 2017 2018 2019 2020
Graph.13.: USA standalone Cyber market projection
$1.5bn $5.6bn
Assuming a continued 30% growth year on year
Source: Aon plc, 2017b: 6
18 Can Data and Technology Support the Insurance Industry to Regain Lost Relevance?
6 Conclusion
The relevance of insurance, which has declined over the last few decades, after peaking in the early 1980s, is set to increase again.
Big shifts in insurance needs, both in the commercial and consumer segments, new sources of cheap capital, the prevelance of cheap and accessible data and the technology to automate and analyse will transform the Insurance industry.
Not only is this important for insurers, it is also important for all of us. Insurance is the grease behind investment and innovation. The long term decline in the Insurance s industry ability to reduce risk could be a significant impediment on future growth. However we believe that the reversal of this trend will mean that insurance can once again grow in its importance of protecting our key investments and activities.
5 .3 Products will be increasingly integrated
Insurance will increasingly need to be integrated into
products and services. As we shift towards a more shared
economy with fewer owned assets we would expect
insurance to respond by increasingly becoming integrated
and invisible.
Insurance as part of a car journey, insurance as part of a
home rental, insurance as part of a flight cost. The ability for
manufacturers and service providers to understand their own
data and use it to manage risk will change how we interact
with insurance.
5 .4 Insurance will be cheaper
Perhaps the major driver of insurance loss of relevance is its
cost. Any service which has a 40% cost of usage is unlikely to
make economic sense except when it is either required, or in
the most high risk situations.
The availability of cheap capital and the availability of
cheap data, as well as the technology to analyse it and the
technology to automate and simplify processes, will be
revolutionary in insurance. Ultimately this lower cost will drive
demand and support growth and relevance.
Can Data and Technology Support the Insurance Industry to Regain Lost Relevance? 19
7 References
• Boletin de Estudios Económicos, Vol. LXXIV, - No. 226, abril 2019• Aon plc (2019): Weather, Climate & Catastrophe Insight. 2018 Annual Report.• Aon plc (2017): Global Insurance Market Opportunities – Twelfth edition. • Aon plc (2017b): Global Cyber market overview.• BRUGGEMAN, V. (2007): Capital Market Instruments for Catastrophe Risk Financing. American Risk and
Insurance Association. 2007 Annual Meeting. August.• CB INSIGHTS (2018): Insurers Are Teaming Up With Car Subscriptions. Searched in 2018 on https://www.
cbinsights.com/research/insurance-car-subscription-partnerships/ • CAP GEMINI; EFMA (2018): World Insurance Report 2018.• CATLIN, T.; LORENZ, J-T; MÜNSTERMANN, B.; BRAAD OLESEN, P.; RICCIARDI, V. (2017): “Insurtech – the
threat that inspires”. McKinsey Quarterly. March 2017.• DELOITTE (2018): InsurTech entering its second wave.• DELOITTE (2017): 2018 Insurance Outlook: shifting strategies to compete in a cutting-edge future.• DELOITTE (2016): Turbulence ahead. The future of general insurance.• FT PARTNERS (2018): searched in 2018 on https://ftpartners.docsend.com/view/eg2xen4• MOODY S (2018): (Re)Insurers step up tech investments as disruption threat grows. Moody s Investors
Service. November.• PONEMON INSTITUTE LLC (2017): 2017 Global Cyber Risk Transfer Comparison Report. Searched in
2019 on http://www.aon.com/forms/2017/2017-global-cyber-risk-transfer-comparison-report.jsp • PwC (2018): 21st CEO Survey.• PwC (2017): Blockchain, a catalyst for new approaches in insurance.• PwC (2015): The Sharing economy. Consumer Intelligence Series. • SWISS RE SIGMA EXPLORER DATASET: searched in 2019 on http://sigma-explorer.com/
ContactsJames Platt Global Solution Lines Chief Operating Officer, Aon+44 2070 8601 [email protected]
Joaquin Pedruelo Managing Director, Aon+ 34 9442 [email protected]
Kshitij Nangia Director Global Operations, Aon+44 2075 2238 [email protected]
AcknowledgmentsThis paper builds on the contribution made by our colleagues Jillian Slyfield; Josh Sanders; Paul Schultz; Preeti Asthana; Steven Petrevski; Theresa Bourdon; Vanessa Leemans
Boletin de Estudios Económicos, Vol. LXXIV, - No. 226, abril 2019

About Aon Aon plc (NYSE:AON) is a leading global professional services firm providing a broad range of risk, retirement and health solutions. Our 50,000 colleagues in 120 countries empower results for clients by using proprietary data and analytics to deliver insights that reduce volatility and improve performance.
© Aon plc 2019 . All rights reserved .The information contained herein and the statements expressed are of a general nature and are not intended to address the circumstances of any particular individual or entity. Although we endeavor to provide accurate and timely information and use sources we consider reliable, there can be no guarantee that such information is accurate as of the date it is received or that it will continue to be accurate in the future. No one should act on such information without appropriate professional advice after a thorough examination of the particular situation.
www.aon.com