Embed Size (px)
Citation preview
Tourism and Hospitality Management, Vol. 23, No. 2, pp. 251-266, 2017
A. Yousaf, I. Amin: CAN CUSTOMER BASED BRAND EQUITY HELP DESTINATIONS TO STAY ...
251
CAN CUSTOMER BASED BRAND EQUITY HELP DESTINATIONS TO STAY IN RACE?
AN EMPIRICAL STUDY OF KASHMIR VALLEY
Anish Yousaf
Insha Amin
Preliminary communication Received 1 December 2016
Revised 31 January 2017
30 May 2017
Accepted 17 July 2017
https://doi.org/10.20867/thm.23.2.4
Abstract Purpose – Current study focus on measuring the customer based brand equity of a tourist
destination (CBBETD) named Kashmir valley (India).
Design – A structured questionnaire was prepared, using Man (2010) consisting of 21 items.
Single stage cluster sampling and systematic simple random techniques were used to collect final
responses of 290 responses with a response rate of 87%.
Findings – Findings of the study revealed a high destination based brand equity for select
destination. Analysis also revealed lowest mean for perceived service quality dimension for
Kashmir which needs to be relooked into by policy makers. Age and length of stay were found to
have associated with each other. Also, length of stay was found to have an impact on CBBETD.
Originality – Originality and core beneficence of the current study lies in the fact that brand
equity measurement of Kashmir valley (mini Switzerland of the world) as a destination brand has
been taken for the first time with an empirical evidence supporting the findings. It is evident
from the study that Kashmir as a destination is very popular among travelers and destination
image dimension for Kashmir has a strong and affirmative influence on the overall development
of the destination equity.
Keywords customer-based brand equity, CBBETD, destination branding, destination image,
Kashmir, Tourism
1. INTRODUCTION
As per 2016 UNWTO report, there has been 4% increase in the number of global
tourist arrivals during the last decade with a record 1.2 billion tourist arrivals in 2015.
This has increased inter-destination competition and had prompted destination planners
to differentiate their destinations with strong unique selling propositions (Gartner,
2014). The concept of destination branding is not new and holds too much importance
for destination planners It has been widely established that destinations which are
successful in establishing / differentiating themselves have a strong destination image
and increased tourist inflow (Chigora & Zvavahera, 2015). The essence of destination
branding also lies in forming overall moving service experiences for customers and
influencing them in such a way that they revisit the destination over and over again
(White, 2013). Developing destinations also helps in generating stronger and unique
competitive advantage and destination repositioning (Hemmonsbey & Knott, 2016;
Same & Vasquez, 2014).
Tourism and Hospitality Management, Vol. 23, No. 2, pp. 251-266, 2017
A. Yousaf, I. Amin: CAN CUSTOMER BASED BRAND EQUITY HELP DESTINATIONS TO STAY ...
252
Unlike products destination branding is quite compound as there are so many attributes
to a destination for that can be branded at once by considering various socio economic ,
cultural and technological issues that are related with destinations and give them a clue
of products (Anholt, 2004; Kerr, 2006). A continuous effort has been observed from
time to time by researchers, where they have come up with efforts and faced various
challenges while applying the concept of brand theory to destinations. (Gartner &
Ruzzier, 2011) and concluded that to brand destination is more complex and difficult
then to brand products and properly manage and market them as there is a very little
and limited involvement of the destination marketers and various related agencies in
the process (Same & Vasquez, 2014).
Despite various challenges for investigating destination brands, it has found wide
application through various available literatures (Pike & Bianchi, 2016; Pike et al.,
2010, Morgan, Pritchard, & Pride, 2002). It is very important for destination planners
to implement useful strategies for branding destinations strategies, so as to stand
differently in recall of potential and loyal tourists as a viable choice of destination
(Atadil, Turk & Altintas, 2015). Pike and Bianchi (2016) also argued in favor of
destination branding for creating destinations with high customer based brand equity
(Mar, Carmen & Arturo, 2015) causing high destination awareness and positive tourist
associations (Pike & Bianchi, 2016). The concept has been tested for many destinations
by various researchers. For example, Boo, Busser, and Baloglu (2009), Ford and
Purwanegara (2013) and Far (2014) measured the customer based brand equity for
tourist destinations (CBBETD hereafter) for Las Vegas and Atlantic, Indonesia, and
Kish Islands respectively and all argued in favour of treating destinations as brands for
unique differentiation (Pike & Bianchi, 2016; Mar, Carmen & Arturo 2015).
India is one among the famous tourist destination offering multiple destinations that
has successfully established her on global tourism map after launching the ‘incredible
India campaign’. Kashmir valley which lies in the northernmost region of India is one
popular tourist destination famous for its tourist circuits such as Pahalgam, Gulmargh,
Sonmargh, Srinagar and many others. This destination has also been nicknamed as
“mini Switzerland” or “heaven on earth” based on tourist attractions that it offers.
Kashmir valley as a tourist destination has been successful in attracting 8.77 lakh
tourists (both national and international) in 2015 because of unparallel potential it
enjoys in terms of tourism (JKTDC, 2015). Despite its global popularity, very
negligible research has been carried out to evaluate the CBBETD for Kashmir valley as
a tourist destination.
In the present study, an effort has been made by the researchers to fill this gap by
measuring the CBBETD of Kashmir valley. The purpose is to extend and measure the
concept of CBBETD for Kashmir valley which is considered among the most preferred
tourist destination in North India. This will help to explore the impact that Kashmir as a
destination has for creating memorable experiences for tourists to further build up the
CBBETD of this destination (Im, Kim, Elliot, & Han, 2012).
In the following section, a thorough review of literature has been done for better
understanding of the concept of CBBETD which is followed by explaining research
design, data analysis and interpretation of findings. In the last, limitations of the study
Tourism and Hospitality Management, Vol. 23, No. 2, pp. 251-266, 2017
A. Yousaf, I. Amin: CAN CUSTOMER BASED BRAND EQUITY HELP DESTINATIONS TO STAY ...
253
were discussed and directions for future research were suggested by the researchers for
more contribution to literature.
2. REVIEW OF LITERATURE
2.1. Brand Equity and CBBETD
Keller (2008) define brand equity as “the bundle of possessions, obligations and values
that have been added to a particular brand associated with identity of a specific product
or service’s name and signifying a particular logo and symbol, which differentiates it
from other competitors in the market”. The key is that consumers must be in a state to
perceive disparity amongst the brands (i.e., positioning); because a brand perceived
distinct, unique and appealing is difficult to get replaced by other brands (Keller, 2001)
and it is more significant to comprehend what associations of a brand are beneficial
over competitors (i.e. points of disparity) helping customers to optimistically assess the
brand and get attached to it (Keller, 2008).
For destinations the concept of brand-equity highlights the importance of branding in
developing marketing strategies for destinations to generate positive emotional values
arising from tourist’s relationship with the destination (Kashif, Samsi, & Sarifuddin,
2014). Pike et al. (2016) also argued in favor of creating destinations as strong brands
and argued a close connection between customer based brand equity and destination
brands. To establish a strong destination brand it is very necessary that complete
information about destinations should be floated through various available sources and
participation of various stakeholders should be confirmed (Amin, Yousaf & Gupta,
2016). The successful circulation of the destination brand only takes place when it is
accepted by people and eventually becomes popular.
McIntosh et al. (2000) define destination brands as “specific names, representation,
sign, word mark or other explicit feature that both identifies and differentiates the
destination, in addition, it conveys the guarantee of a unforgettable travel experience
that is exceptionally related with the destination, it also serves to merge and strengthen
the recall of pleasing memories of the destination experience”. For creating strong
CBBETD, it is important to study and measure it from the perspective of tourists and
their perception about destination visited (Yuwo, Ford & Purwanegara, 2014; Kladou
& Kehagias, 2014; Konecnik, 2010; Konecnik & Gartner, 2007).
Tourism and Hospitality Management, Vol. 23, No. 2, pp. 251-266, 2017
A. Yousaf, I. Amin: CAN CUSTOMER BASED BRAND EQUITY HELP DESTINATIONS TO STAY ...
254
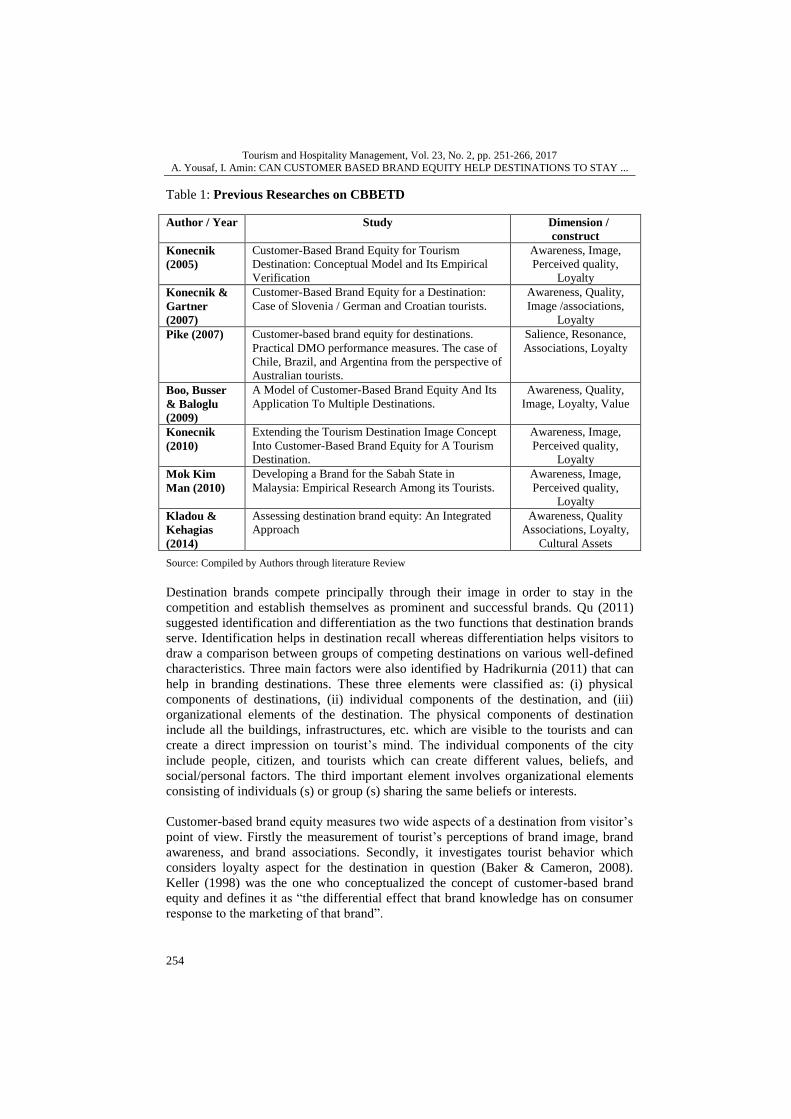
Table 1: Previous Researches on CBBETD
Author / Year Study Dimension /
construct
Konecnik
(2005)
Customer-Based Brand Equity for Tourism
Destination: Conceptual Model and Its Empirical
Verification
Awareness, Image,
Perceived quality,
Loyalty
Konecnik &
Gartner
(2007)
Customer-Based Brand Equity for a Destination:
Case of Slovenia / German and Croatian tourists.
Awareness, Quality,
Image /associations,
Loyalty
Pike (2007) Customer-based brand equity for destinations.
Practical DMO performance measures. The case of
Chile, Brazil, and Argentina from the perspective of
Australian tourists.
Salience, Resonance,
Associations, Loyalty
Boo, Busser
& Baloglu
(2009)
A Model of Customer-Based Brand Equity And Its
Application To Multiple Destinations.
Awareness, Quality,
Image, Loyalty, Value
Konecnik
(2010)
Extending the Tourism Destination Image Concept
Into Customer-Based Brand Equity for A Tourism
Destination.
Awareness, Image,
Perceived quality,
Loyalty
Mok Kim
Man (2010)
Developing a Brand for the Sabah State in
Malaysia: Empirical Research Among its Tourists.
Awareness, Image,
Perceived quality,
Loyalty
Kladou &
Kehagias
(2014)
Assessing destination brand equity: An Integrated
Approach
Awareness, Quality
Associations, Loyalty,
Cultural Assets
Source: Compiled by Authors through literature Review
Destination brands compete principally through their image in order to stay in the
competition and establish themselves as prominent and successful brands. Qu (2011)
suggested identification and differentiation as the two functions that destination brands
serve. Identification helps in destination recall whereas differentiation helps visitors to
draw a comparison between groups of competing destinations on various well-defined
characteristics. Three main factors were also identified by Hadrikurnia (2011) that can
help in branding destinations. These three elements were classified as: (i) physical
components of destinations, (ii) individual components of the destination, and (iii)
organizational elements of the destination. The physical components of destination
include all the buildings, infrastructures, etc. which are visible to the tourists and can
create a direct impression on tourist’s mind. The individual components of the city
include people, citizen, and tourists which can create different values, beliefs, and
social/personal factors. The third important element involves organizational elements
consisting of individuals (s) or group (s) sharing the same beliefs or interests.
Customer-based brand equity measures two wide aspects of a destination from visitor’s
point of view. Firstly the measurement of tourist’s perceptions of brand image, brand
awareness, and brand associations. Secondly, it investigates tourist behavior which
considers loyalty aspect for the destination in question (Baker & Cameron, 2008).
Keller (1998) was the one who conceptualized the concept of customer-based brand
equity and defines it as “the differential effect that brand knowledge has on consumer
response to the marketing of that brand”.
Tourism and Hospitality Management, Vol. 23, No. 2, pp. 251-266, 2017
A. Yousaf, I. Amin: CAN CUSTOMER BASED BRAND EQUITY HELP DESTINATIONS TO STAY ...
255
The concept of destination based brand-equity was first put forth by Konecnik (2005)
to measure the concept of brand equity for tourists in Slovenia using four dimensions:
awareness, image, perceived quality and loyalty and argued that the concept and
principals of the product can be transferred and applied to destinations as well. A
decade has passed since then and the concept has only grown more popular and has
found its acceptability among destination brands giving rise to the concept of CBBETD
defined by different researchers in a different way (please refer Table 1).
Pike (2007) introduced the concept of CBBETD to measure the efficacy of a
destination brand based on the brand values to the consumer, thus, bridging the gap
between past marketing efforts and future sales performance conceptualizing CBBE for
a destination as the hierarchy of brand salience, brand associations, brand resonance
and brand loyalty. Pike (2007) described brand salience as more than customers’
general awareness of a brand. It affects how customers build their decision set. Pike
(2007) also explained brand associations (brand image), cognitive and affective
perceptions, as the memories of the destination. Pike (2007) described brand resonance
as a willingness to engage with the destination and brand loyalty represented by repeat
visitation and word of mouth recommendations as the highest level of the hierarchy.
Through the study, it was concluded that the prospect of brand resonance and loyalty
can be enlarged by high levels of brand awareness (salience) and brand image
(associations).
The concept of CBBETD was further elevated by Konecnik & Gartner (2007) who
called awareness, image, quality and loyalty dimensions of destination as antecedents
to CBBETD arguing that tourists from different backgrounds perceive various
dimensions of destination differently. Konecnik (2010) found the dimension of brand
quality as the most important component of CBBETD in terms of customer preference
of a travel destination and define quality dimension as “tourists’ perception of quality
related to the overall environment surrounding the destination (e.g., the quality of the
accommodations, food, atmosphere, personal safety, services and value for money)”.
Kladou and Kehagias (2014) recently included a new dimension named cultural assets
in CBBETD which is considered to influence familiarity and also consumer’s ability to
recall and recognize a destination.
3. RESEARCH METHODOLOGY
3.1. Instrument Designing
The CBBETD for the select destination was measured using the scale developed by
Man (2010) and was defined as consisting of destination brand awareness (3 items),
destination brand image (11 items), destination perceived quality (7 items), and
destination brand loyalty (3 items).
Destination brand awareness is the strength of the brand’s presence in tourist mind
(Konecnik & Gartner, 2007; Boo et al., 2009). Destination brand image was defined as
tourist’s mental depiction of knowledge (beliefs), feelings, and overall thought about an
object or destination (Myagmarsuren & Chen, 2011). It is important that destination
Tourism and Hospitality Management, Vol. 23, No. 2, pp. 251-266, 2017
A. Yousaf, I. Amin: CAN CUSTOMER BASED BRAND EQUITY HELP DESTINATIONS TO STAY ...
256
brand image should be an included experience, i.e., a brand image will be outstanding
once the relations are well planned and the uniqueness is clear to destination brand
marketers prior to being passed on to visitors (Qu et al., 2011). Destination perceived
quality is seen as tourist’s perceptions about quality of a destination’s overall
development (Pike et al., 2010) and it is the key constituent of customer-based brand
equity when applied to a destination (Konecnik & Gartner, 2007). Destination brand
loyalty has been defined as “the connection that a tourist has towards a destination”
(Aaker, 1991). In tourism, attitudinal loyalty refers to a tourist’s intention to return the
destination and referring it to others (Pike & Bianchi, 2013) attitudinal loyalty can also
be regarded as cognitive attitudes toward a specific destination brand (Back & Parks,
2003).
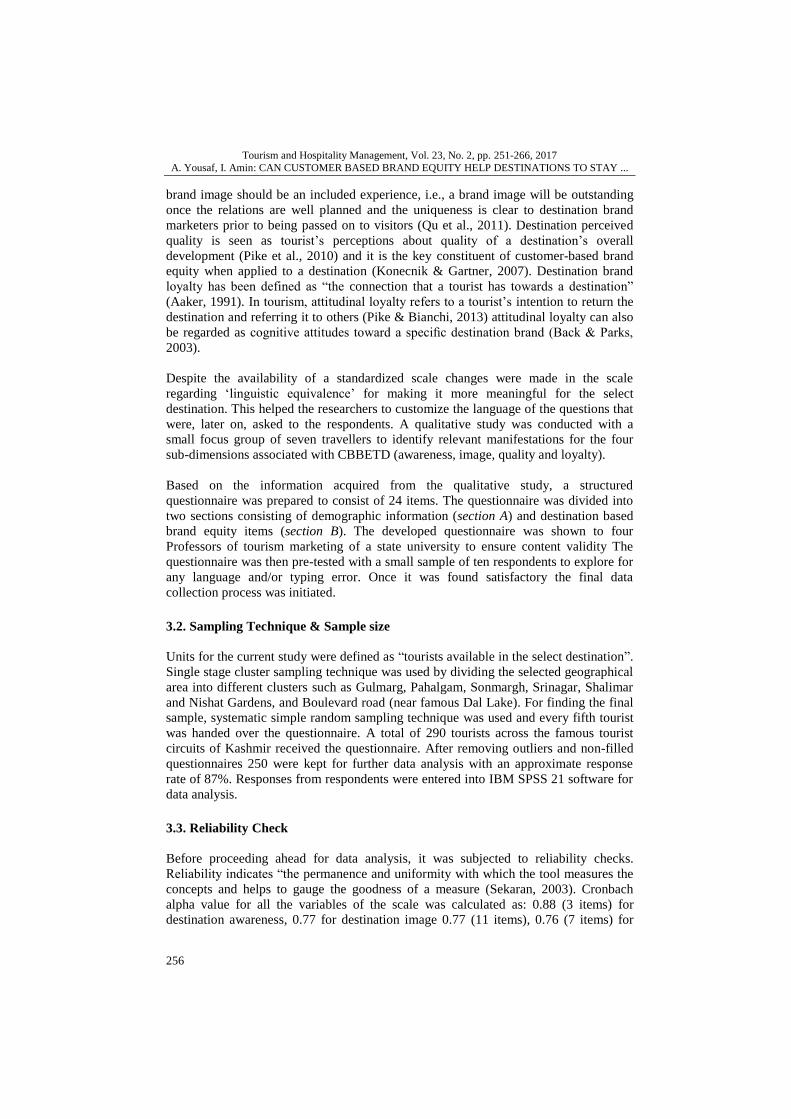
Despite the availability of a standardized scale changes were made in the scale
regarding ‘linguistic equivalence’ for making it more meaningful for the select
destination. This helped the researchers to customize the language of the questions that
were, later on, asked to the respondents. A qualitative study was conducted with a
small focus group of seven travellers to identify relevant manifestations for the four
sub-dimensions associated with CBBETD (awareness, image, quality and loyalty).
Based on the information acquired from the qualitative study, a structured
questionnaire was prepared to consist of 24 items. The questionnaire was divided into
two sections consisting of demographic information (section A) and destination based
brand equity items (section B). The developed questionnaire was shown to four
Professors of tourism marketing of a state university to ensure content validity The
questionnaire was then pre-tested with a small sample of ten respondents to explore for
any language and/or typing error. Once it was found satisfactory the final data
collection process was initiated.
3.2. Sampling Technique & Sample size
Units for the current study were defined as “tourists available in the select destination”.
Single stage cluster sampling technique was used by dividing the selected geographical
area into different clusters such as Gulmarg, Pahalgam, Sonmargh, Srinagar, Shalimar
and Nishat Gardens, and Boulevard road (near famous Dal Lake). For finding the final
sample, systematic simple random sampling technique was used and every fifth tourist
was handed over the questionnaire. A total of 290 tourists across the famous tourist
circuits of Kashmir received the questionnaire. After removing outliers and non-filled
questionnaires 250 were kept for further data analysis with an approximate response
rate of 87%. Responses from respondents were entered into IBM SPSS 21 software for
data analysis.
3.3. Reliability Check
Before proceeding ahead for data analysis, it was subjected to reliability checks.
Reliability indicates “the permanence and uniformity with which the tool measures the
concepts and helps to gauge the goodness of a measure (Sekaran, 2003). Cronbach
alpha value for all the variables of the scale was calculated as: 0.88 (3 items) for
destination awareness, 0.77 for destination image 0.77 (11 items), 0.76 (7 items) for
Tourism and Hospitality Management, Vol. 23, No. 2, pp. 251-266, 2017
A. Yousaf, I. Amin: CAN CUSTOMER BASED BRAND EQUITY HELP DESTINATIONS TO STAY ...
257
destination perceived quality and 0.75 for destination loyalty (3 items) which was well
above the required cut-off value of 0.70 indicating that the scale was reliable and can
be exposed further to appropriate statistical analysis (refer Table 2 for cronbach alpha
values).
4. DATA ANALYSIS AND DISCUSSION
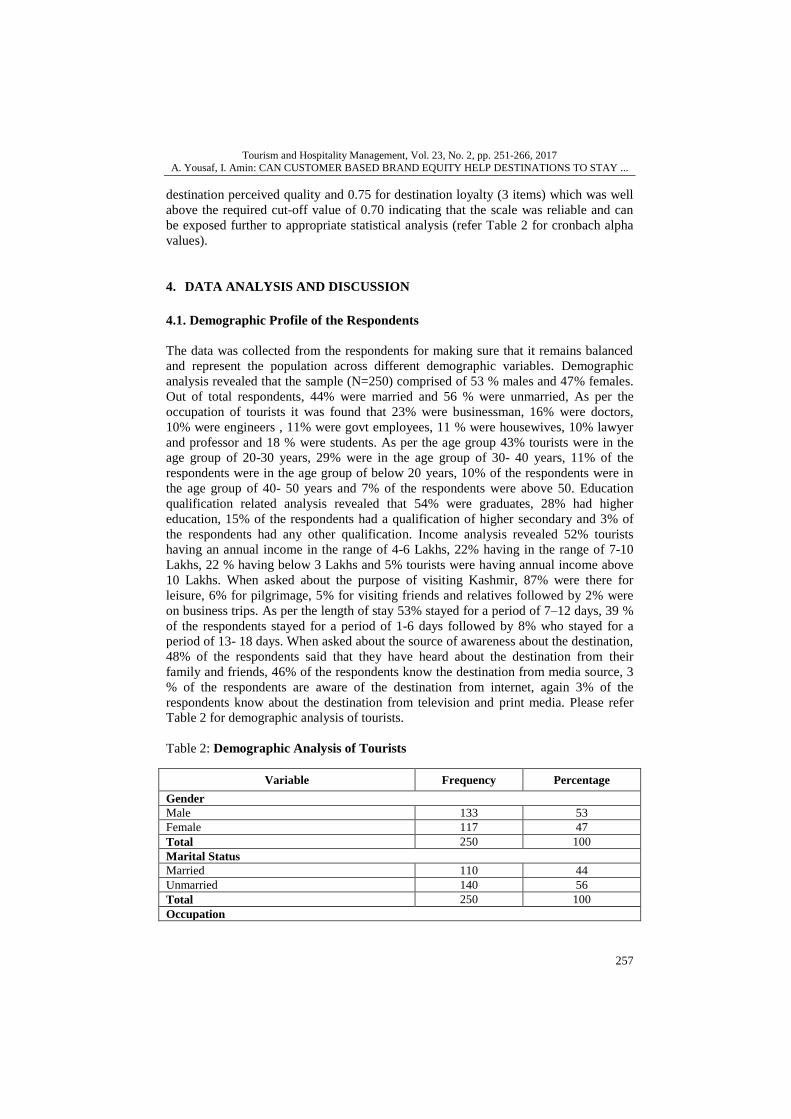
4.1. Demographic Profile of the Respondents
The data was collected from the respondents for making sure that it remains balanced
and represent the population across different demographic variables. Demographic
analysis revealed that the sample (N=250) comprised of 53 % males and 47% females.
Out of total respondents, 44% were married and 56 % were unmarried, As per the
occupation of tourists it was found that 23% were businessman, 16% were doctors,
10% were engineers , 11% were govt employees, 11 % were housewives, 10% lawyer
and professor and 18 % were students. As per the age group 43% tourists were in the
age group of 20-30 years, 29% were in the age group of 30- 40 years, 11% of the
respondents were in the age group of below 20 years, 10% of the respondents were in
the age group of 40- 50 years and 7% of the respondents were above 50. Education
qualification related analysis revealed that 54% were graduates, 28% had higher
education, 15% of the respondents had a qualification of higher secondary and 3% of
the respondents had any other qualification. Income analysis revealed 52% tourists
having an annual income in the range of 4-6 Lakhs, 22% having in the range of 7-10
Lakhs, 22 % having below 3 Lakhs and 5% tourists were having annual income above
10 Lakhs. When asked about the purpose of visiting Kashmir, 87% were there for
leisure, 6% for pilgrimage, 5% for visiting friends and relatives followed by 2% were
on business trips. As per the length of stay 53% stayed for a period of 7–12 days, 39 %
of the respondents stayed for a period of 1-6 days followed by 8% who stayed for a
period of 13- 18 days. When asked about the source of awareness about the destination,
48% of the respondents said that they have heard about the destination from their
family and friends, 46% of the respondents know the destination from media source, 3
% of the respondents are aware of the destination from internet, again 3% of the
respondents know about the destination from television and print media. Please refer
Table 2 for demographic analysis of tourists.
Table 2: Demographic Analysis of Tourists
Variable Frequency Percentage
Gender
Male 133 53
Female 117 47
Total 250 100
Marital Status
Married 110 44
Unmarried 140 56
Total 250 100
Occupation
Tourism and Hospitality Management, Vol. 23, No. 2, pp. 251-266, 2017
A. Yousaf, I. Amin: CAN CUSTOMER BASED BRAND EQUITY HELP DESTINATIONS TO STAY ...
258
Variable Frequency Percentage
Businessman 60 23
Doctor 42 16
Engineer 22 10
Govt Employee 29 11
Housewife 25 11
Lawyer & Professor 25 10
Student 47 18
Total 250 100
Age (in Years)
Below 20 28 11
20-30 108 43
30-40 72 29
40-50 24 10
Above 50 18 7
Total 250 100
Educational Qualification
Higher Secondary 37 15
Graduate 136 54
Higher Education 70 28
Others 7 3
Total 250 100
Annual Household Income (in INR)
Below 3 Lakhs 54 22
4-6 Lakh 129 52
7-10 Lakh 54 22
Above 10 Lakh 13 5
Total 250 100
Purpose of Visit
Business 5 2
Leisure 218 87
Pilgrimage 14 6
Visiting Friends / Relatives 13 5
Total 250 100
Length of Stay
1-6 days 96 39
7-12 days 133 53
13-18 days 21 8
Total 250 100
Source of Awareness
Family and Friends 120 48
Internet 8 3
Media Source 114 46
Television & Print Media 8 3
Total 250 100
Source: Created by Authors using SPSS and MS Excel
Tourism and Hospitality Management, Vol. 23, No. 2, pp. 251-266, 2017
A. Yousaf, I. Amin: CAN CUSTOMER BASED BRAND EQUITY HELP DESTINATIONS TO STAY ...
259
4.2. Measuring CBBETD of Kashmir Destination & Exploring inter Variable
Differences
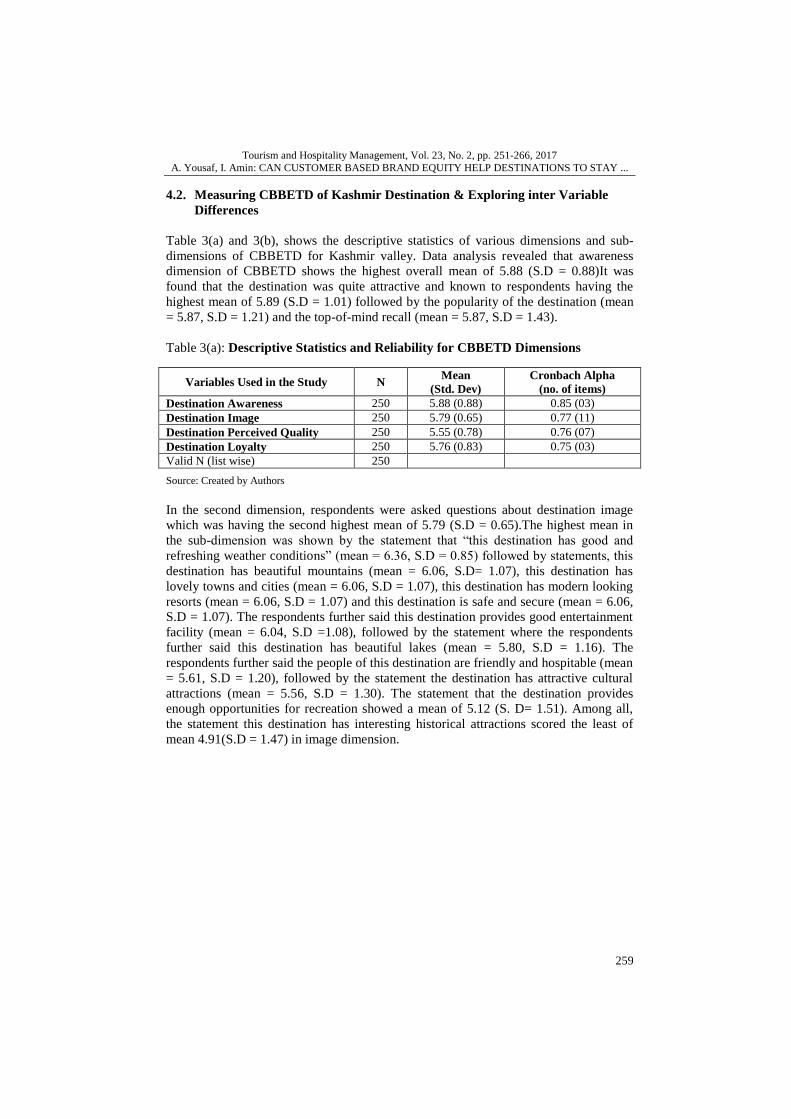
Table 3(a) and 3(b), shows the descriptive statistics of various dimensions and sub-
dimensions of CBBETD for Kashmir valley. Data analysis revealed that awareness
dimension of CBBETD shows the highest overall mean of 5.88 (S.D = 0.88)It was
found that the destination was quite attractive and known to respondents having the
highest mean of 5.89 (S.D = 1.01) followed by the popularity of the destination (mean
= 5.87, S.D = 1.21) and the top-of-mind recall (mean = 5.87, S.D = 1.43).
Table 3(a): Descriptive Statistics and Reliability for CBBETD Dimensions
Variables Used in the Study N Mean
(Std. Dev)
Cronbach Alpha
(no. of items)
Destination Awareness 250 5.88 (0.88) 0.85 (03)
Destination Image 250 5.79 (0.65) 0.77 (11)
Destination Perceived Quality 250 5.55 (0.78) 0.76 (07)
Destination Loyalty 250 5.76 (0.83) 0.75 (03)
Valid N (list wise) 250
Source: Created by Authors
In the second dimension, respondents were asked questions about destination image
which was having the second highest mean of 5.79 (S.D = 0.65).The highest mean in
the sub-dimension was shown by the statement that “this destination has good and
refreshing weather conditions” (mean = 6.36, S.D = 0.85) followed by statements, this
destination has beautiful mountains (mean = 6.06, S.D= 1.07), this destination has
lovely towns and cities (mean = 6.06, S.D = 1.07), this destination has modern looking
resorts (mean = 6.06, S.D = 1.07) and this destination is safe and secure (mean = 6.06,
S.D = 1.07). The respondents further said this destination provides good entertainment
facility (mean = 6.04, S.D =1.08), followed by the statement where the respondents
further said this destination has beautiful lakes (mean = 5.80, S.D = 1.16). The
respondents further said the people of this destination are friendly and hospitable (mean
= 5.61, S.D = 1.20), followed by the statement the destination has attractive cultural
attractions (mean = 5.56, S.D = 1.30). The statement that the destination provides
enough opportunities for recreation showed a mean of 5.12 (S. D= 1.51). Among all,
the statement this destination has interesting historical attractions scored the least of
mean 4.91(S.D = 1.47) in image dimension.
Tourism and Hospitality Management, Vol. 23, No. 2, pp. 251-266, 2017
A. Yousaf, I. Amin: CAN CUSTOMER BASED BRAND EQUITY HELP DESTINATIONS TO STAY ...
260
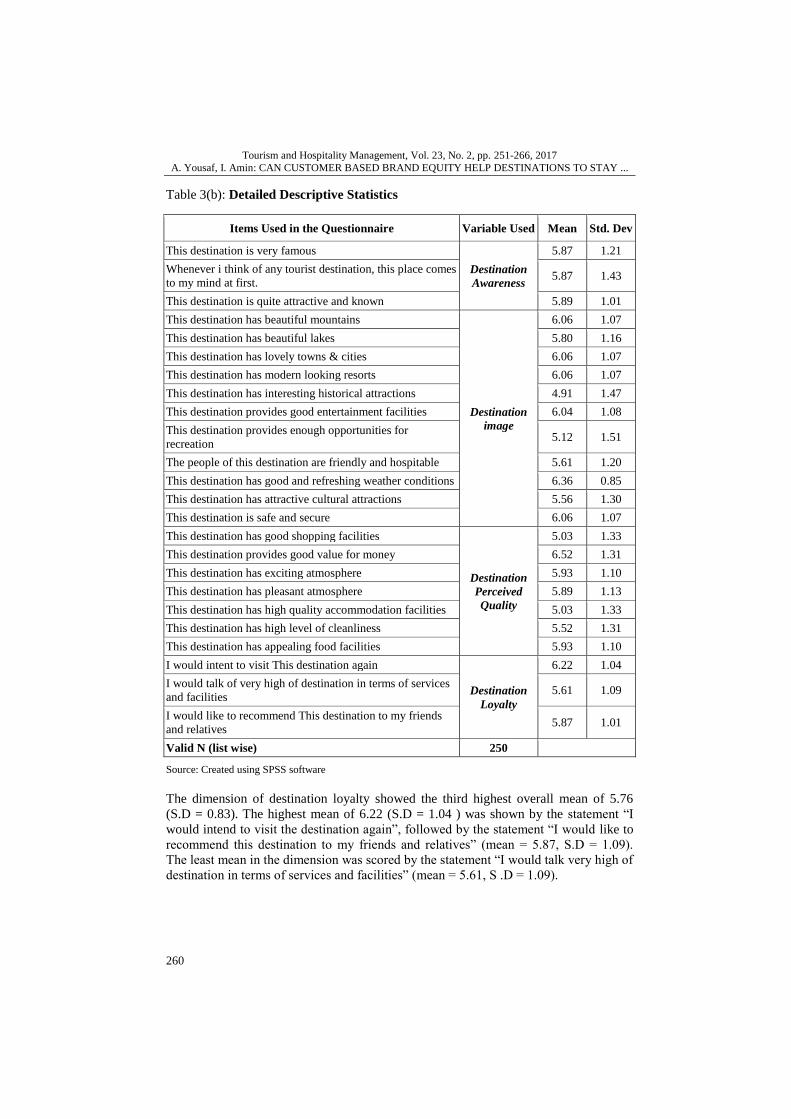
Table 3(b): Detailed Descriptive Statistics
Items Used in the Questionnaire Variable Used Mean Std. Dev
This destination is very famous
Destination
Awareness
5.87 1.21
Whenever i think of any tourist destination, this place comes
to my mind at first. 5.87 1.43
This destination is quite attractive and known 5.89 1.01
This destination has beautiful mountains
Destination
image
6.06 1.07
This destination has beautiful lakes 5.80 1.16
This destination has lovely towns & cities 6.06 1.07
This destination has modern looking resorts 6.06 1.07
This destination has interesting historical attractions 4.91 1.47
This destination provides good entertainment facilities 6.04 1.08
This destination provides enough opportunities for
recreation 5.12 1.51
The people of this destination are friendly and hospitable 5.61 1.20
This destination has good and refreshing weather conditions 6.36 0.85
This destination has attractive cultural attractions 5.56 1.30
This destination is safe and secure 6.06 1.07
This destination has good shopping facilities
Destination
Perceived
Quality
5.03 1.33
This destination provides good value for money 6.52 1.31
This destination has exciting atmosphere 5.93 1.10
This destination has pleasant atmosphere 5.89 1.13
This destination has high quality accommodation facilities 5.03 1.33
This destination has high level of cleanliness 5.52 1.31
This destination has appealing food facilities 5.93 1.10
I would intent to visit This destination again
Destination
Loyalty
6.22 1.04
I would talk of very high of destination in terms of services
and facilities 5.61 1.09
I would like to recommend This destination to my friends
and relatives 5.87 1.01
Valid N (list wise) 250
Source: Created using SPSS software
The dimension of destination loyalty showed the third highest overall mean of 5.76
(S.D = 0.83). The highest mean of 6.22 (S.D = 1.04 ) was shown by the statement “I
would intend to visit the destination again”, followed by the statement “I would like to
recommend this destination to my friends and relatives” (mean = 5.87, S.D = 1.09).
The least mean in the dimension was scored by the statement “I would talk very high of
destination in terms of services and facilities” (mean = 5.61, S .D = 1.09).
Tourism and Hospitality Management, Vol. 23, No. 2, pp. 251-266, 2017
A. Yousaf, I. Amin: CAN CUSTOMER BASED BRAND EQUITY HELP DESTINATIONS TO STAY ...
261
As per the results the dimension of destination perceived quality showed the least
overall mean of 5.55 (S.D = 0.78). In this dimension the statement this destination
provides good value for money showed the highest mean of 6.52 (S.D = 1.31),
followed by the statement this destination has exciting atmosphere (mean = 5.93, S .D
= 1.10) and this destination has appealing food facilities (mean = 5.93, S.D = 1.10).
The third highest mean of 5.89 (S.D = 1.13) was shown by the statement this
destination has a pleasant atmosphere, followed by the statement the destination has a
high level of cleanliness (mean = 5. 52, S.D = 1.31). The least mean in the dimension
was scored by the statements this destination has good shopping facilities (mean =
5.03, S.D = 1.33) and this destination has high-quality accommodation facilities
respectively.
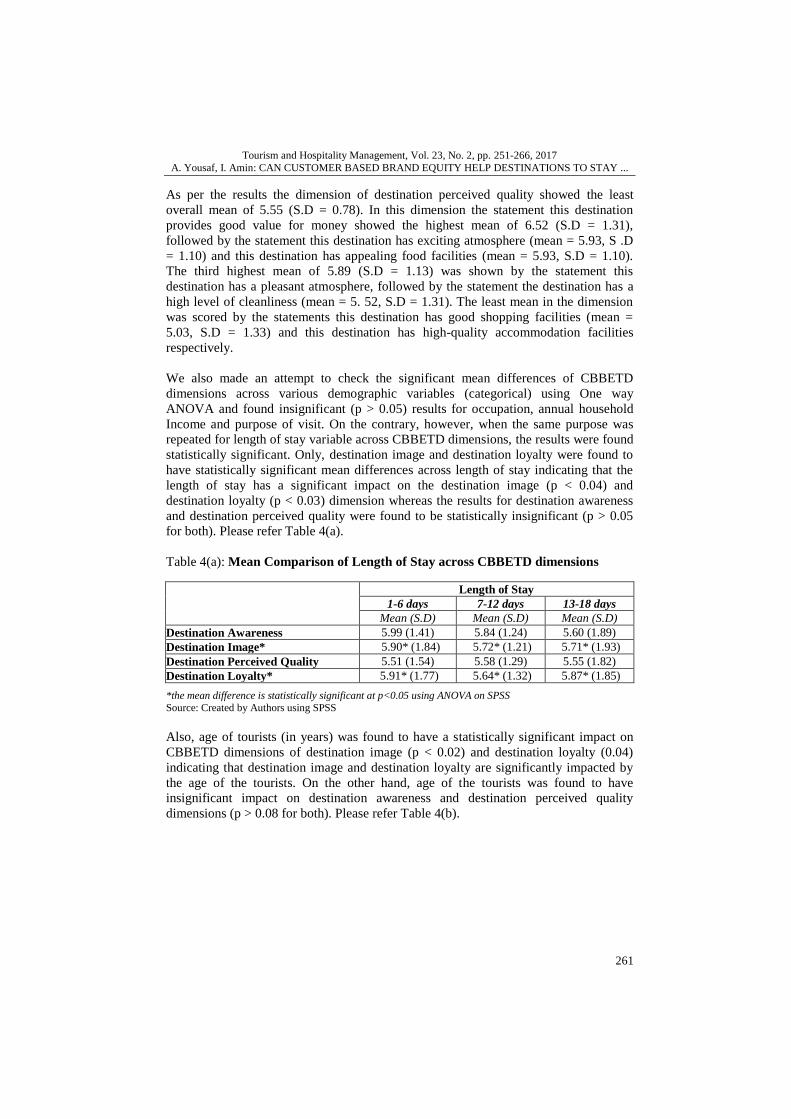
We also made an attempt to check the significant mean differences of CBBETD
dimensions across various demographic variables (categorical) using One way
ANOVA and found insignificant (p > 0.05) results for occupation, annual household
Income and purpose of visit. On the contrary, however, when the same purpose was
repeated for length of stay variable across CBBETD dimensions, the results were found
statistically significant. Only, destination image and destination loyalty were found to
have statistically significant mean differences across length of stay indicating that the
length of stay has a significant impact on the destination image (p < 0.04) and
destination loyalty (p < 0.03) dimension whereas the results for destination awareness
and destination perceived quality were found to be statistically insignificant (p > 0.05
for both). Please refer Table 4(a).
Table 4(a): Mean Comparison of Length of Stay across CBBETD dimensions
Length of Stay
1-6 days 7-12 days 13-18 days
Mean (S.D) Mean (S.D) Mean (S.D)
Destination Awareness 5.99 (1.41) 5.84 (1.24) 5.60 (1.89)
Destination Image* 5.90* (1.84) 5.72* (1.21) 5.71* (1.93)
Destination Perceived Quality 5.51 (1.54) 5.58 (1.29) 5.55 (1.82)
Destination Loyalty* 5.91* (1.77) 5.64* (1.32) 5.87* (1.85)
*the mean difference is statistically significant at p<0.05 using ANOVA on SPSS
Source: Created by Authors using SPSS
Also, age of tourists (in years) was found to have a statistically significant impact on
CBBETD dimensions of destination image (p < 0.02) and destination loyalty (0.04)
indicating that destination image and destination loyalty are significantly impacted by
the age of the tourists. On the other hand, age of the tourists was found to have
insignificant impact on destination awareness and destination perceived quality
dimensions (p > 0.08 for both). Please refer Table 4(b).
Tourism and Hospitality Management, Vol. 23, No. 2, pp. 251-266, 2017
A. Yousaf, I. Amin: CAN CUSTOMER BASED BRAND EQUITY HELP DESTINATIONS TO STAY ...
262
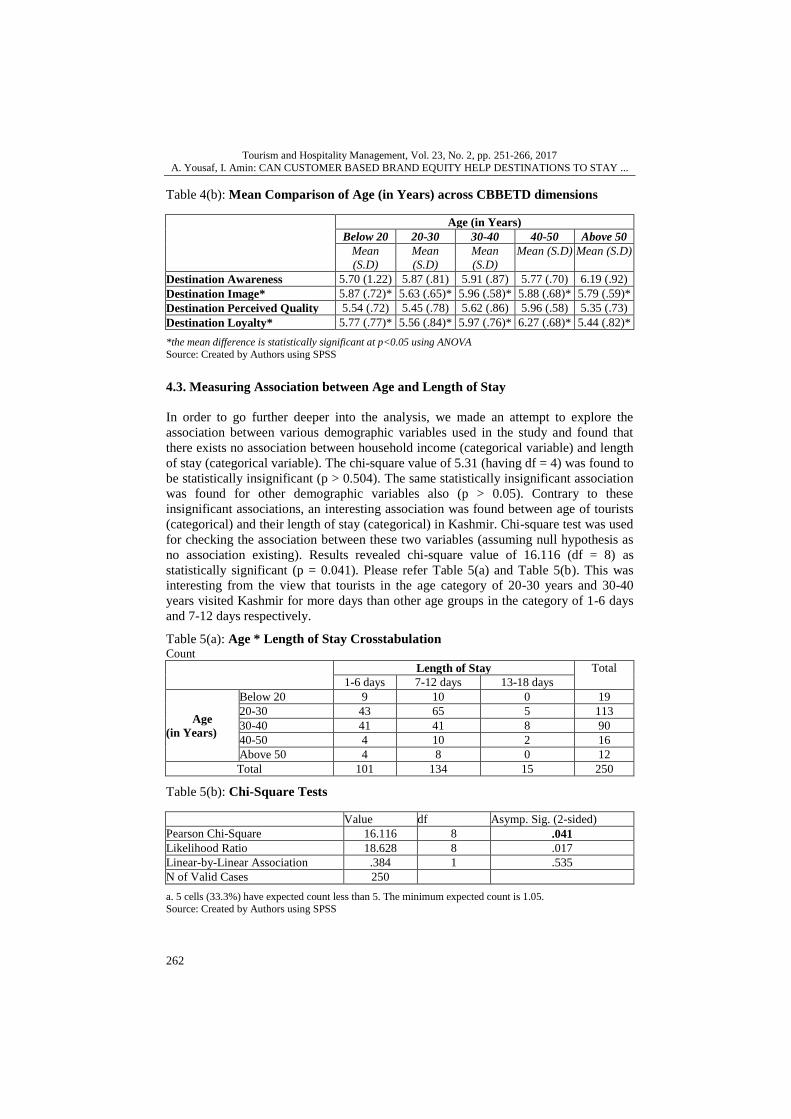
Table 4(b): Mean Comparison of Age (in Years) across CBBETD dimensions
Age (in Years)
Below 20 20-30 30-40 40-50 Above 50
Mean
(S.D)
Mean
(S.D)
Mean
(S.D)
Mean (S.D) Mean (S.D)
Destination Awareness 5.70 (1.22) 5.87 (.81) 5.91 (.87) 5.77 (.70) 6.19 (.92)
Destination Image* 5.87 (.72)* 5.63 (.65)* 5.96 (.58)* 5.88 (.68)* 5.79 (.59)*
Destination Perceived Quality 5.54 (.72) 5.45 (.78) 5.62 (.86) 5.96 (.58) 5.35 (.73)
Destination Loyalty* 5.77 (.77)* 5.56 (.84)* 5.97 (.76)* 6.27 (.68)* 5.44 (.82)*
*the mean difference is statistically significant at p<0.05 using ANOVA
Source: Created by Authors using SPSS
4.3. Measuring Association between Age and Length of Stay
In order to go further deeper into the analysis, we made an attempt to explore the
association between various demographic variables used in the study and found that
there exists no association between household income (categorical variable) and length
of stay (categorical variable). The chi-square value of 5.31 (having df = 4) was found to
be statistically insignificant (p > 0.504). The same statistically insignificant association
was found for other demographic variables also (p > 0.05). Contrary to these
insignificant associations, an interesting association was found between age of tourists
(categorical) and their length of stay (categorical) in Kashmir. Chi-square test was used
for checking the association between these two variables (assuming null hypothesis as
no association existing). Results revealed chi-square value of 16.116 (df = 8) as
statistically significant (p = 0.041). Please refer Table 5(a) and Table 5(b). This was
interesting from the view that tourists in the age category of 20-30 years and 30-40
years visited Kashmir for more days than other age groups in the category of 1-6 days
and 7-12 days respectively.
Table 5(a): Age * Length of Stay Crosstabulation Count
Length of Stay Total
1-6 days 7-12 days 13-18 days
Age
(in Years)
Below 20 9 10 0 19
20-30 43 65 5 113
30-40 41 41 8 90
40-50 4 10 2 16
Above 50 4 8 0 12
Total 101 134 15 250
Table 5(b): Chi-Square Tests
Value df Asymp. Sig. (2-sided)
Pearson Chi-Square 16.116 8 .041
Likelihood Ratio 18.628 8 .017
Linear-by-Linear Association .384 1 .535
N of Valid Cases 250
a. 5 cells (33.3%) have expected count less than 5. The minimum expected count is 1.05.
Source: Created by Authors using SPSS
Tourism and Hospitality Management, Vol. 23, No. 2, pp. 251-266, 2017
A. Yousaf, I. Amin: CAN CUSTOMER BASED BRAND EQUITY HELP DESTINATIONS TO STAY ...
263
4. CONCLUSION
Due to current global economic environment, competition between global destinations
is increasing forcing policy makers and stakeholders to better understand the
significance of destination’s brand equity as an important predecessor of tourist’s
satisfaction, moreover, overseeing the factors linked with destination brand equity and
addressing the destination brand equity in endorsement campaigns. By observing
various brand equity dimensions and their inter-relationships is a vital activity that
must be considered by destination management, practitioners, and even researchers, in
applying appropriate strategies to catch the attention of tourists to a destination. In a
number of studies (refer Table 1), the concept of CBBETD has been employed by
various researchers to investigate into destinations brand-equity.
Kashmir as a destination is famous for its tourist circuits globally but CBBETD
instrument has not been applied till date to measure its brand equity from the
perspective of tourists actually visiting the destination. The major contribution of the
present research lies in the fact that a brand equity measurement of Kashmir valley as a
destination brand has been conducted for the first time with an empirical evidence
supporting the findings. It is evident from the study that Kashmir as a destination is
very popular among travelers and destination image dimension for Kashmir has a
strong and positive influence on the overall development of the destination equity
suggesting that Kashmir enjoys a good brand image among visiting tourists.
Despite global brand image and high destination awareness there are certain loopholes
that needs to be timely taken care of to establish Kashmir valley as a global destination
brand. Results revealed that the perceived quality of the destination needs to be
overlooked in every aspect so as to ensure strong brand equity of Kashmir valley. The
destination, further, needs to enhance in terms of the shopping facilities, by providing
the tourists with a range where they can look for something that suits their purpose
apart from the traditional souvenirs. It has been further observed that the destination
lacks in terms of cultural and historical attractions. This has implications for policy
makers and various tourism development agencies as well. They need to understand
that there is a need where various DMO’S can address the need by exploring
destination that are rich in cultural heritage and upgrading the overall infrastructure at
the existing ones. Destination planner needs to focus on such dimensions that are
critical in the overall positioning of the Kashmir as a brand. Also, different tourism
agencies and involved stakeholders of Kashmir need to focus on how they can make it
more popular and spread more awareness by integrating different promotional
techniques like digital marketing, social media, and other platforms. Developing
Kashmir valley as a strong destination brand can only help it to attain a sustainable
place in the market and survive longer.
To conclude with it was observed through data analysis that the dimension of
destination awareness showed a highest mean of 5.88 (S.D = 0.88), depicting that the
destination is well known and quite familiar to the tourists visiting Kashmir while as
the dimension of perceived service quality showed a lowest mean of 5.55 (0.78), thus
making it very imperative for various destination management originations and
stakeholder to make an effort to comprehend the over service quality of the destination
Tourism and Hospitality Management, Vol. 23, No. 2, pp. 251-266, 2017
A. Yousaf, I. Amin: CAN CUSTOMER BASED BRAND EQUITY HELP DESTINATIONS TO STAY ...
264
through various tangible and intangibles clues. The further effort of the destination
mangers should be to raise overall standard of services provided by them in terms of
various facilities and overall infrastructure as well, so as to compete with other
destinations in the same arena.
The researcher further moved ahead by exploring the association between various
demographic profiles and CBBETD dimensions for tourist destinations. It was
observed that there exists no association between household income (categorical
variable) and length of stay (categorical variable). The same statistically insignificant
association was found for other demographic variables also (p > 0.05). While as a
strong association was found between age of tourists (categorical) and their length of
stay (categorical) in Kashmir. Thus in context of the same destination mangers need to
market their products as such that it can attract each and every segment.
5. LIMITATIONS AND DIRECTIONS FOR FUTURE RESEARCH
This study has certain limitations that need to be considered for future research. The
first limitation being that the study was conducted only in a particular part of the state
of Jammu and Kashmir. Thus, generalizations drawn from the findings of the study are
limited. In order to enhance the study in the same context, future researchers may
repeat a similar study focusing on different parts of the Jammu and Kashmir,
considering the division of Jammu and Ladakh as well. While conducting the research,
it came to light that international tourists were very less in number and tourists’ were
having different motivations for visiting the destination. Thus future research can
explore nationality and motivational effect on CBBETD. The study was taken
considering the tourist's point of view only, thus not taking care of all the stakeholders
in forming the CBBETD. To comprehend the same, future research can work in the
same direction that would add a holistic view of CBBETD to the literature. Another
limitation of the current study was that the respondents (tourists) were mostly youth,
thus, not taking into account all the age groups equally. Future research can be directed
towards having a equal representation from each age group, thus widening the scope of
the study to all age groups. The study further limits itself by not exploring nationality
differences across the CBBETD dimensions. To overcome these short falling or
limitations of the research, future studies can be directed towards the same direction
where they can try to explore the new avenues where CBBETD can be looked into and
empirically tested considering various dimensions.
Moving forward. Future studies also need to explore more practical issues. The results
of the study showed dependence relation between perceived destination image and
length of stay as well as between age and perceived destination image. In the current
study, it was answered why this dependence exists and future studies can focus on
answering these questions: Does perceived destination image improves with increase in
length of stay and If so then why this is happening? Also, another question that future
researchers need to address is does middle age people stay longer perhaps because they
travel with the family or is it like that Kashmir as a destination is more appealing for
family tourists and leisure travellers? This can be done by using an exploratory
approach to explore these reasons to contribute to the literature.
Tourism and Hospitality Management, Vol. 23, No. 2, pp. 251-266, 2017
A. Yousaf, I. Amin: CAN CUSTOMER BASED BRAND EQUITY HELP DESTINATIONS TO STAY ...
265
REFERENCES
Amin, I. Yousaf, A. and Gupta, A. (2016), “Destination Branding & Social Media: Developing Theoretical Propositions for the State of Jammu & Kashmir”, .International Journal of Applied Business and
Economic Research, Vol. 14, No. 5, pp. 119-130.
Anholt, S. (2004). Branding Places and Nations. In Clifton, R., Simmons, J. & Ahmad, S. (eds), Brands and Branding. Princeton, NJ, Bloomberg Press, London.
Atadil, H.A. Sirakaya, T.E. and Altintas, V. (2015), “An analysis of destination image for emerging markets
of Turkey”, Journal of vacation marketing, Vol. 20, No. 3, pp. 195-210. doi: 10.1177/1356766712449366.
Baker, M. and Cameron, E. (2008), “ Critical success factors in destination marketing”, Tourism and
Hospitality Research, Vol. 8, No. 2, pp. 79-95. Boo, S. Busser, J. and Baloglu, S. (2009), “ A Model of Customer- Based Brand Equity and Its Application
to Multiple Destinations”, Tourism Management, Vol. 30, No. 2, pp. 219-231.
doi: 10.1002/jtr.2093. Chigora, F. and Zvavahera, P. (2015), “ Awareness Completes Brand Loyalty: Reality of Zimbabwe Tourism
Destination”, Business and Management Horizons, Vol. 3, No. 2, pp. 60-69.
doi:10.5296/bmh.v3i2.7974. Gartner, W. (2014), “Brand Equity in a tourism destination”, Place Branding and Public Diplomacy, Vol. 10,
No. 2, pp. 108-116. doi:10.1068/a46191.
Gartner, W. C.and Ruzzier, M. K. (2011), “Tourism destination brand equity dimensions: Renewal versus repeat market”, Journal of Travel Research, Vol. 50, No. 5, pp. 471-481.
doi:10.1177/0047287515601253.
Hankinson, G. (2010), “Place branding research: a cross-disciplinary agenda and the views of practitioners”, Place Branding and Public Democracy, Vol. 6 ,No. 4, pp. 300-315. doi: 10.1057/pb.2011.28
Hardikurnia, V.Z. (2011), “Surabaya City Branding Strategies Based on Public Perceptions”, Published
Undergraduate Final Project, School of Business and Management – Bandung Institute of Technology.
Hemmonsbey, J. and Knott, B. (2016), “Branding an African city through sport: the role of stakeholder
engagement”, African Journal of Hospitality, Tourism and Leisure, Vol. 5, No. 3, pp. 1-14. doi: 10.1002/jtr.2036
Im, H.H. Kim, S.S. Elliot, S. and Han, H. (2012), “Conceptualizing destination brand equity dimensions from
a consumer-based brand equity perspective”, Journal of Travel & Tourism Marketing, Vol. 29, No. 4,pp. 385-403. doi.org/10.1080/10548408.2013.750916.
Kashif, M. Samsi, M.Z.S. and Sarifuddin, S. (2014), “Brand Equity of Lahore Fort as a tourism Brand”,
Revista de Administração de Empress’s, Vol. 55, No. 4, pp. 432-443. Keller. K.L. (1998), Brand Equity. in the Handbook of Technology Management,.(ed) Richard Dorf, CRC
Press Inc.
Keller, K.L. (2008), Strategic Brand Management, Building, Measuring, and Managing Brand Equity (3rd Edition ed.). (D. Parker, Ed.) Upper Saddle River, New Jersey, Pearson Education, Inc.
Keller, K.L. (2001), “Building Customer-Based Brand Equity: A Blueprint for Creating Strong Brands”, Marketing Management, July/ August, pp. 15-19.
Kerr, G. (2006), “From Destination Brand to Location Brand”, Journal of Brand Management, Vol. 13, No.
4/5, pp. 276-283. doi:10.1057/palgrave.bm.2540076. Kladou, S.and Kehgias, J. (2014), “Developing a structural brand equity model for cultural destinations”,
Journal of Place Management and Development, Vol. 7, No. 2, pp. 112-125.
doi:http://dx.doi.org/10.1108/17538330910942799. Konecnik, M. (2005), “Customer-Based Brand Equity for Tourism Destination: Conceptual Model and Its
Empirical Verification”, (Published Ph.D. Dissertation, University of Ljubljana, Slovenia).
Konecnik, M. (2010), “Extending the Tourism Destination Image Concept Into Customer-Based Brand Equity for A Tourism Destination”, Ekonomska istraživanja, Vol. 23, No. 3, pp. 24-42.
doi.org/10.1080/1331677X.2014.994274
Konecnik, M. (2005), “Slovenia as a tourism destination: Differences in image evaluations perceived by tourism representatives from closer and more distant markets”, Economic and Business Review
for Central and South-Eastern Europe, Vol. 7, No. 3, pp. 261-282. doi:10.1002/(SICI)
Konecnik, M. and Gartner, W.C. (2007), “Customer-Based Brand Equity for a Destination” , Annals of Tourism Research, Vol. 34, No. 2, pp. 400-421. doi:10.1016/ $0160-7383(97)80009-6 Liu
McIntosh, R.J., Tainter, A.J., & McIntosh, K.S. (2000), The way the wind blows: climate, history, and human
action, NY, USA, Columbia University Press. doi.org/10.1098/rstb.2010.0306.
Tourism and Hospitality Management, Vol. 23, No. 2, pp. 251-266, 2017
A. Yousaf, I. Amin: CAN CUSTOMER BASED BRAND EQUITY HELP DESTINATIONS TO STAY ...
266
Mok Kim Man, M. (2010), “Developing a Brand for the Sabah State in Malaysia: Empirical Research
Among its Tourists”, e-Journal of American Academy of Business, Cambridge.
Nigel, M., Annette, P. & Roger, P. (2002), Destination Branding: Creating the Unique Destination Proposition. UK, Oxford, Butterworth-Heinemann.
Pike, S. (2007), “Customer-based brand equity for destinations. Practical DMO performance measures”,
Journal of travel and tourism marketing, Vol. 22, No. 1, pp. 51-56. doi.org/10.1080/10548408.2015.1063796
Pike, S. and Bianchi, C. (2016), “Destination brand equity for Australia: testing a model of CBBE in short
haul and long haul markets”, Journal of Hospitality and Tourism Research, Vol. 40, No. 1, pp. 114-134. doi:10.1177/1096348015619411.
Pike, S. Dawley, S. and Tomaney, J. (2010), “Resilience, adaptation, and adaptability”, Cambridge Journal
of Regions, Economy, and Society, Vol. 3, No. 1, pp. 59-70. doi:10.1093/cjres/rsw027 Qu, H. Kim, L.H. and Im, H.H. (2011), “ A model of destination branding: integrating the concepts of the
branding and destination image”, Tourism Management, Vol. 32, No. 3, pp. 465-476. Rico, G.M. Lopez, C. and Collado, M.A. (2015), “A model of tourism destination brand equity: The case of
wine tourism destinations in Spain”, Journal of Tourism Management, Vol. 51, pp. 210-222.
Same, S. and Solarte-Vasquez, C.M. (2014), “Country Branding and country Image: Insights, Challenges, and Prospectus. The case of Estonia”, Baltic journal of European studies, Vol. 4, No.1, pp. 137-
165.
UNWTO (2016), United Nations World Tourism Organisation, Trends. White, R. (2013), “Destination Branding: A Snapshot “, Journal of undergraduate research, XVI, pp. 1-10.
doi:10.1187/cbe.04-01-0022
Yuwo, H. Ford, B.J. and Purwanegara, S.M. (2014), “Customer-based brand equity for a tourism destination (a cbbetda): the specific case of Bandung city, Indonesia”, Organizations and Markets in
Emerging Economies, Vol. 4, No. 1, pp. 8-22.
Anish Yousaf, PhD, Assistant Professor
Rajalakshmi School of Business
Chennai, Tamil Nadu (India) - 600119
Ph: +91- 81464-53583
E-mail: [email protected]
Insha Amin, Teaching Assistant
Center of Hospitality & Tourism
Baba Ghulam Shah Badshah University Rajouri, J&K
Ph: +91-9086714567
E-mail: [email protected]
Please cite this article as: Yousaf, A., Amin, I. (2017), Can Customer Based Brand Equity Help
Destinations to Stay in Race? An Empirical Study of Kashmir Valley, Vol. 23, No. 2, pp. 251-
266, https://doi.org/10.20867/thm.23.2.4
Creative Commons Attribution – Non Commercial – Share Alike 4.0 International