Embed Size (px)
Citation preview
Can competition reduce quality?∗
Kurt R. Brekke† Luigi Siciliani‡ Odd Rune Straume§
18 December 2016
Abstract
We analyse the effect of competition on quality provision in spatial markets such as health
care, long-term care, child care and education, where providers compete on both price and
quality. By making two key assumptions about the providers in such markets, namely that
they are (partly) motivated and have decreasing marginal utility of income, we find, contrary
to the existing literature, an unambiguously negative relationship between competition in-
tensity and quality provision. This relationship holds regardless of whether quality and price
decisions are made simultaneously or sequentially. However, even if competition reduces
quality, it does not necessarily follow that social welfare is reduced.
Keywords: Quality and price competition; Motivated providers; Decreasing marginal util-
ity of income.
JEL classification: D21, D43, L13, L30
∗Odd Rune Straume acknowledges the financial support provided by the European Regional DevelopmentFund (ERDF) through the Operational Program Factors of Competitiveness (COMPETE); and by nationalfunds received through the Portuguese Foundation for Science and Technology (FCT) under the research grantPEst-C/EGE/UI3182/2013.†Corresponding author. Department of Economics, Norwegian School of Economics (NHH), Helleveien 30,
N-5045 Bergen, Norway. E-mail: [email protected].‡Department of Economics and Related Studies, University of York, Heslington, York YO10 5DD, UK; and
C.E.P.R., 90-98 Goswell Street, London EC1V 7DB, UK. E-mail: [email protected].§Department of Economics/NIPE, University of Minho, Campus de Gualtar, 4710-057 Braga, Portugal; and
Department of Economics, University of Bergen, Norway. E-mail: [email protected].
1
1 Introduction
Quality is a key concern for consumers in many sectors such as health care, long-term care, child
care and education. Hospitals, nursing homes, schools and universities compete on quality to
attract patients, residents and students. While in some countries prices are typically regulated,
in other countries they are not. In this study we focus on institutional settings where providers
compete both on quality and price. For example, prices are variable in the hospital sector in
the US for patients who are not part of public programmes such as Medicare (for the elderly) or
Medicaid (for the poor). In England, the government recently discussed whether public insurers
should be able to negotiate prices with public hospitals, so that they would compete not only
on quality but also on price. It was ultimately decided not to allow competition on prices due
to concerns that quality may suffer (Kmietowicz, 2011). In the UK, France and the US, long-
term care institutions (e.g., nursing homes, residential homes) compete on prices in addition to
quality to attract residents. Universities in the US, and from 2012 in the UK, compete on prices
in addition to quality. In the UK nurseries offer different services in combination with different
prices for child care, and therefore also compete on price and quality.
The relationship between competition and quality is hotly debated in several countries. Un-
derstanding such relationship is therefore important to design future policies, and to decide
whether competition should be encouraged or eliminated. As reviewed below, there are several
empirical studies that have found a negative relationship between competition and quality in
these sectors. The theoretical literature is however lacking in terms of offering precise mecha-
nisms that can explain these findings. This paper fills this gap in knowledge. We investigate
whether competition can lead to a reduction in quality when providers compete on both price
and quality. We use a spatial competition framework where consumers trade off travelling dis-
tance relative to price and quality offered by the providers in the market. This framework is
widely used and well-suited for studying competition in markets such as health care, education,
long-term care, etc., where consumers usually have a preference for the closest provider unless
more distant providers offer a better quality and/or lower price.
We show that more competition reduces quality (and price) when two plausible assumptions
hold: i) the providers are motivated, i.e., have a genuine concern for quality; ii) the providers face
2
decreasing marginal utility from profits. We think both assumptions are highly relevant for the
providers in the type of sectors we have in mind. Provider motivation is widely recognised in the
health economics and motivated agents literature (see Section 2.1). The assumption of decreasing
marginal utility of profits is plausible for small organisations with sole or concentrated ownership
(e.g., care and nursing homes, family doctors working in solo practices, and in some countries
hospitals, specialists, dentists, and child care providers; see Section 2.2 for full discussion).
Therefore, our model can rationalise the empirical evidence by drawing attention to two
assumptions (provider motivation and decreasing marginal utility of profits) which are relevant
for the sectors, such as health care, long-term care, child care and education, where the role of
competition is currently being discussed. The existing theoretical literature offers limited insight
with respect to a potential negative relationship between competition and quality (when prices
are flexible). A notable exception is Economides (1993) who applies a Salop model with n firms
and shows that a higher number of firms leads to lower equilibrium quality under price-quality
competition. However, this results from a pure demand effect (a higher number of firms implies
that each firm faces less demand) and the analysis therefore only addresses a limited aspect of
competition. Intuitively, a key implication of increased competition is that each firm’s demand
becomes more responsive to changes in quality and/or price. In a spatial competition framework
with inelastic total demand, this effect is perfectly captured by measuring competition as the
equivalent of lower transportation costs, which is a standard practice in the literature.
When increased competition makes demand more responsive to price/quality changes, there
are two counteracting effects with respect to firms’incentives for quality provision. While more
competition increases the incentives to supply high quality for given prices, more competition
also reduces the price-cost margin, which, in turn, reduces the incentives to invest in quality. Ma
and Burgess (1993) report that the direct effect of more competition on quality is exactly offset
by the indirect effect via lower prices so that overall there is no effect of more competition on
quality. The same result is reported by Gravelle (1999). However, Brekke, Siciliani and Straume
(2010) show that the two above-mentioned effects do not cancel when allowing for income effects
in consumer utility. They find that more competition tends to increase quality when consumers
have decreasing marginal utility of income. The reason is a price reduction reduces consumers’
marginal utility of income, making demand less sensitive to price, which in turn dampens the
3
price reduction due to fiercer competition. In contrast, in this study the reduction in price
induced by competition generates a reduction in revenues and profits by the firm, which in turn
affects the supply incentives to provide quality.
The above-mentioned papers find that competition has either zero or positive effects on
quality provision. To our knowledge, the existing literature does not offer any plausible theo-
retical mechanisms that make the indirect effect outweigh the direct one, thereby establishing a
negative relationship between competition and quality. The present paper fills this gap in the
literature by showing that if providers are motivated and have decreasing marginal utility of
profits, a third effect emerges and competition actually reduces quality. The intuition is that
more competition leads to lower prices, which in turn reduces profits and increases the marginal
utility from profits. Being motivated, the provider works at a negative marginal profits and will
therefore respond optimally to fiercer competition by reducing quality in order to recover some
of the profit losses generated by the price reduction.
We show that our key result that competition reduces quality is robust to two different
modifications of the standard set-up. First, we extend our basic set-up to more than two
firms (n ≥ 2) using a Salop model, and show that both lower transportation costs and more
firms leads to lower quality. While the first result relies exclusively on the assumptions that
providers are motivated and face decreasing marginal utility of profits, the latter does not but
is reinforced by decreasing marginal utility since more firms reduce profits. Second, we allow for
sequential quality and price decisions, reflecting that quality often is a more long-term decision
than price. We show that the timing of decisions do not qualitatively change our main result.
When providers can commit to a given quality level before competing in prices, we also show
that this softens quality competition as providers take into account how quality affects own and
rival pricing decisions in the subsequent stage. This result is in line with previous findings by
Ma and Burgess (1993).1
We also investigate the welfare implications of more competition. We define welfare as the
sum of consumers’ and providers’ utility (therefore explicitly taking into account providers’
preferences). More competition reduces quality but also reduces prices. If the marginal util-
ity of income is higher for consumers than for providers, then we show that the price effect,
1See also Economides (1993) for a similar result in the context of a Salop model.
4
which increases welfare, dominates the quality effect, which reduces welfare, implying that more
competition always increases social welfare.2
Our proposed mechanism might rationalise some of the empirical evidence which finds a
negative relationship between quality and competition in health care markets. In the health
economics literature, quality is often proxied with health outcomes in the form of risk-adjusted
mortality rates.3 The recent literature on competition has favoured the use of mortality rates
for heart attack patients in particular, which appear to respond and correlate with management
quality (see Bloom et al. for a fuller discussion). Mukamel et al. (2001) find that hospital
competition increased mortality from 1982 to 1989 in California; Volpp et al. (2003) investigate
the effect of price deregulation in New Jersey from 1990 to 1996 and find an increase in mortality;
Propper et al. (2004) and Burgess et al. (2008) find a positive relation between competition
and mortality rates for patients with heart attack in England when price regulation was not yet
introduced and prices were allowed to vary.4 Grabowski (2004) finds that competition reduces
the quality of nursing homes in the US. Forder and Allan (2014) find a similar result for care
homes for the elderly in England.
There exists some related theoretical papers that find an adverse effect of competition on
quality using quite different approaches. Assuming monopolistic competition, imperfect in-
formation and consumer search, Dranove and Satterthwaite (1992) show that improved price
information might reduce quality provision, possibly to the extent that welfare is reduced. Using
a principal-agent framework, Golan, Parlour and Rajan (2011) find that stronger competition
may increase the costs for the principal (shareholders) to incentivise effort by the agent (man-
ager), which reduces the quality of the products offered.5 However, our paper differ from these
2The question of socially optimal quality provision was first analysed by Spence (1975), who showed that amonopolist will provide the socially optimal level of quality only if the willingness to pay for quality is equal for theaverage and for the marginal consumer. As shown by Ma and Burgess (1993), this equality holds in equilibriumin the Hotelling model with profit-maximising providers and constant marginal utility of profits, but only if theproviders make price and quality decisions simultaneously. In our model, with motivated providers and decreasingmarginal utility of profits, socially optimal quality provision is generally not obtained in equilibrium and, even ifmore competition always reduces quality, the welfare effect of more competition is ambiguous.
3Although mortality rates are a rather crude way of measuring health, it has the advantage of being routinelymeasured in administrative databases. Moreover, it can be interpreted unambiguously (in contrast for exampleto some older measures, such as patient length of stay, which could reflect both quality and effi ciency).
4See Gaynor (2006) for survey on the effects of competion on quality in hospital markets.5This paper builds on the seminal contributions of Hart (1983) and Schmidt (1997) on the impact of product
market competition on managerial incentives. Benabou and Tirole (2014) show that competition may inducefirms to adopt excessively high powered incentive schemes (e.g., bonus culture) inducing the most talented agentsto reduce unobserved dimensions of quality (which in turn can reduce welfare).
5
studies in that we allow for motivated providers and explicit strategic interaction between firms.
The rest of the paper is organised as follows. In Section 2 we discuss the rationale for our
key assumptions. In Section 3 we present our basic model, and derive our main result that
competition reduces quality. In Section 4 we check the robustness of this result by modifying
our basic model along two dimensions: (i) more than two firms; (ii) sequential quality and price
decisions. In Section 5 we conduct a welfare analysis, while in Section 6 we offer some concluding
remarks.
2 Key assumptions
In this section, we discuss the rationale for our two key assumptions, i.e., that providers are
motivated and have decreasing marginal utility of income.
2.1 Motivated providers
We assume that providers are motivated and have genuine concern about the quality offered
to their consumers. Provider motivation is highly relevant in the health, long-term care and
education sectors, as well as other public sector industries. In the theoretical health economics
literature, it has long been recognised that providers (doctors, nurses, health care managers) are
concerned about the quality of care provided to patients (Ellis and McGuire, 1986; Chalkley and
Malcomson, 1998; Eggleston, 2005; Choné and Ma, 2011; Kaarbøe and Siciliani, 2011; Brekke,
Siciliani and Straume, 2011, 2012).
This assumption is also made in the recent literature on motivated agents in the broader
public sector, where the agent is assumed to share, to some extent, the objective function of the
principal (Francois, 2000; Glazer, 2004; Besley and Ghatak, 2005; Dixit, 2005; Lakdawalla and
Philipson, 2006; Delfgaauw and Dur, 2008; Makris, 2009; Makris and Siciliani, 2013; Siciliani,
Straume and Cellini, 2013). The main idea is that organisations that provide publicly-provided
private (or public) goods have a mission, and individuals who work in such organisations are
‘mission-oriented’or ‘motivated’. Examples given in this literature include doctors and nurses
who are committed to improve health, teachers who care about good learning, and researchers
who are committed to expanding knowledge.
6
The assumption that providers are, at least to a certain extent, motivated or altruistic seems
plausible and accepted in the theoretical literature. There is also a growing empirical literature
which suggests that motivation and pro-social motivation are important components of certain
sectors. For example, there is evidence that motivation is key for health care workers’job (Page,
1996; Le Grand, 2003, chapter 2), and Godager and Wiesen (2013) provide evidence of altruistic
physician preferences.
2.2 Decreasing marginal utility of income
The assumption of decreasing marginal utility of income is plausible for small organisations with
sole or concentrated ownership. This is the case for example of (residential) care homes for the
elderly in England. In 2010, there were about 9920 for-profit care homes (and only about 1830
not-for-profit ones) and for 58% the owner had either one or two care homes. Moreover, care
homes tend to be small organisations with on average 37 beds. In the US, care homes for the
elderly are also numerous (at least 85000) and small, often with ten or fewer beds. About 80%
of licensed homes are for-profit facilities (Norton, 2000).
Nurseries providing child care also tend to be small organisations. For example, in Eng-
land in 1999 there were 9257 providers covering 217239 places. Each nursery had therefore on
average 23 children. These tend to be for-profit and are subject to regular inspections from
a regulator, known as OFSTED (Bertram and Pascal, 2000). Nurseries tend to be local and
highly decentralised. They compete on both quality (type of services provides, green space,
play area, quality of food, activities) and price. Across several European countries, the group
size is regulated and is around 20-30 children (Austria, Ireland, France, Hungary, Netherlands,
Portugal; see European Commission, 2009). Average group size is 16 in day care centres in the
US (Blau and Currie, 2006).
Family doctors in some countries are also highly decentralised with doctors working in solo
practices. This is the case for example in Germany where more than 50% (out of 132400
providing ambulatory care) have a solo practice and 25% share a practice; practices are generally
for-profit (Busse and Riesberg, 2004). In France, more than half of doctors (both generalists
and specialists) are self-employed and work in their own practice (about 122500 in 2009). They
compete on both the quality of care and the prices charged (Chevreul et al., 2010).
7
Dentists also tend to work in small practices and on their own in several countries. 90% of
dentists in France are self-employed. In England, most dentists work in small private practices.
Moreover, dental services tends to be only partially covered by mandated health insurance with
significant out-of-pockets payments in most OECD countries, and is not covered at all in some
countries such as Australia, Canada and Ireland (Health at a Glance, 2011).
So far, we have focussed on small organisations with sole or highly concentrated ownership.
There may be other reasons why large firms or organisations, such as hospitals (in particular
private ones, like in the US) might also display decreasing marginal utility of income (Banal-
Estañol and Ottaviani, 2006). Large firms may have ownership concentrated in few individuals
(e.g., family ownership; LaPorta et al, 1999) and this implies that they may be more sensitive to
income effects. Even if ownership is dispersed, the decision making is delegated to professional
managers with incentive schemes increasingly linked to profit (Hall and Lirbman, 1998). If
management is concentrated, then variations in profit will affect managers individually (Asplund,
2002). As individuals they may exhibit decreasing marginal utility. A firm’s payoff function
might also be concave in profit due to liquidity constraints and costly financial distress.6 If
external financing is more costly than internal financing, the firm’s marginal value of profits will
decrease with the profit level. Thus, the assumption of decreasing marginal utility of profits
might be particularly relevant for organisations that have small profit margins or that are close
to breaking even (Banal-Estañol and Ottaviani, 2006).7 Furthermore, empirical studies tend to
find that liquidity constraints affect the decision of self-employment. For instance, Lindh and
Ohlsson (1996) find a quadratic relationship for some regressions between personal inheritance
and the probability of becoming self-employed, and Holtz-Eakin et al. (1994) find a quadratic
relationship for personal assets and the likelihood of staying self-employed over wage earning.
These findings support our assumption of decreasing marginal utility of profits.
6 In the UK, several hospital managers have been fired or threaten to be fired by the NHS trust boards dueto bad performance such as large hospital deficits.
7 In health economics, the analytically similar assumption of risk-aversion has been used by, e.g., Mougeotand Naegelen (2008) and Felder (2009). In the broader IO literature, see, e.g., Wambach (1999), Asplund (2002),Banal-Estañol and Ottaviani (2006), Janssen and Karamychev (2009), Barreda-Tarrazone et al (2011) for analysesof firms in oligopoly settings.
8
3 Price and quality competition in a Hotelling model
Our main analysis is conducted using a Hotelling framework. Consider a market with two
providers, denoted by i = 1, 2, located at each endpoint of the line segment S = [0, 1]. Consumers
are uniformly located on S with a total mass of one, and each consumer demands one unit from
the most preferred provider. The utility of a consumer located at x ∈ S and buying from
provider i is given by
ui (x) = r + βqi − pi − t |x− zi| , (1)
where qi and pi are the quality and price, respectively, of product i, r is the gross consumer
surplus, β is the marginal utility of quality, and t is the transport cost per unit of distance to
the provider located at zi, where z1 = 0 and z2 = 1. We assume r is suffi ciently high, so that
all consumers buy either product 1 or 2 (full market coverage).8
Each consumer makes a utility-maximising choice of provider, which gives the demand for
provider 1 as
D1 (q1, q2, p1, p2) =1
2+
1
2t(β (q1 − q2)− p1 + p2) , (2)
while demand for provider 2 is D2 (q1, q2, p1, p2) = 1 −D1 (q1, q2, p1, p2). Lower transportation
costs make demand for each provider more price- and quality-elastic. Thus, following the stan-
dard practice in the literature, we will measure the degree of competition in the market by
t−1.
We assume providers derive utility from profits but also from the quality offered to consumers.
To keep the analysis simple, the objective function of each provider is assumed to be separable
in quality and profits.9 The objective function of provider i is given by
Ui (πi, qi) = u (πi) + v (qi) , (3)
8Market coverage requires non-negative utility to the indifferent consumer. A suffi cient condition for this tohold in the symmetric equilibrium is that
r ≥ c+3t
2.
9This assumption does not qualitatively affect our main result unless U iπiqi < 0 and this effect is suffi cientlylarge in magnitude.
9
where
πi (qi, qj , pi, pj) = (pi − c)Di (qi, qj , pi, pj)− g (qi) , (4)
is the profits of provider i with c denoting the marginal production cost and g (qi) the fixed cost
of quality. The fixed quality costs are increasing and convex; i.e., g′ (qi) > 0 and g′′ (qi) > 0.10
We make two critical assumptions on the shape of the objective function of the providers.
First, we consider providers that are motivated by assuming that v′ (qi) > 0 and v′′ (qi) ≤ 0.
Second, we allow for decreasing marginal utility of profits by assuming that u′ (πi) > 0 and
u′′ (πi) < 0. As discussed in the previous section, both these assumptions are relevant for
providers in many markets such as health care, long-term care, child care and education.
3.1 Simultaneous quality and price decisions
Suppose that the two providers choose price and quality simultaneously. The first-order condi-
tions for the optimal quality and price for provider i are, respectively,11
∂Ui (qi, qj , pi, pj)
∂qi= u′ (πi (qi, qj , pi, pj))
[(pi − c)β
2t− g′ (qi)
]+ v′ (qi) = 0 (5)
and∂Ui (qi, qj , pi, pj)
∂pi= u′ (πi (qi, qj , pi, pj))
[Di (qi, qj , pi, pj)−
(pi − c)2t
]= 0. (6)
The symmetric Nash equilibrium, denoted by q∗ and p∗, has quality and price given by
v′(q∗) + u′(π(q∗, p∗))
[(p∗ − c)β
2t− g′(q∗)
]= 0 (7)
and
u′(π(q∗, p∗))
[1
2− (p∗ − c)
2t
]= 0. (8)
10For simplicity, we ignore variable quality costs. However, it can easily be shown that the results are qualita-tively the same. The computations can be provided to interested readers upon request.
11The second-order conditions are: i) ∂2Ui/∂q2i = v′′(qi) − u′(πi)g′′(qi) + u′′(πi)
((pi−c)β
2t− g(qi)
)2< 0, ii)
∂2Ui/∂p2i = u′′(πi)
(Di(.)− pi−c
2t
)2 − u′(πi)t
= −u′(πi)t
< 0; iii)(∂2Ui/∂q
2i
) (∂2Ui/∂p
2i
)−(∂2Ui/∂qi∂pi
)2> 0,
where ∂2Ui/∂qi∂pi =βu′′(πi)
2t.
10
From the optimality condition on price we obtain
p∗ = c+ t. (9)
Thus, more competition, in the form of lower transportation costs, reduces the price.
Equilibrium profit is given by
π∗ := π(q∗, p∗) = (p∗ − c)1
2− g (q∗) =
t
2− g (q∗) . (10)
Substituting (9) into (7), we get the following equilibrium quality condition:
v′(q∗) + u′(π∗)
[β
2− g′(q∗)
]= 0. (11)
What is the effect of more competition on quality? Differentiating (11) with respect to q∗ and
t, we derive
[u′′(π∗)
∂π∗
∂t
(β
2− g′(q∗)
)]dt (12)
= −[v′′(q∗)− u′(π∗)g′′(q∗) + u′′(π∗)
∂π∗
∂q∗
(β
2− g′(q∗)
)]dq∗
Substituting for ∂π∗
∂t = 12 and
∂π∗
∂q∗ = −g′ (q∗), we obtain
∂q∗
∂t= − u′′(π∗)
2V ′′(q∗)
(β
2− g′(q∗)
)> 0, (13)
where V ′′(q∗) := v′′(q∗) − u′(π∗)g′′(q∗) − u′′(π∗)g′ (q∗)(β2 − g
′(q∗))< 0. From the equilibrium
quality condition (11), notice that
β
2− g′(q∗) = − v
′(q∗)
u′(π∗)< 0, (14)
which suggests that the profit margin of quality is negative at equilibrium. We therefore obtain
the following result:
Proposition 1 In a Hotelling model where providers set price and quality simultaneously, more
11
competition, measured by lower transportation costs, leads to lower quality when providers are
motivated (v′(q) > 0) and have decreasing marginal utility of profits (u′′ (π) < 0). More com-
petition (lower transportation costs) has no effect on quality when (i) providers are motivated
(v′(q) > 0) and marginal utility of profit is constant (u′′ (π) = 0), and (ii) providers are not
motivated (v′(q) = 0) and marginal utility of profit is decreasing (u′′ (π) < 0).
This proposition describes the main results of the paper. The intuition for these results rely
on three different effects generated by more competition. First, competition makes the demand
more responsive to a marginal increase in quality. For a given mark-up (p∗−c = t > 0), this effect
tends to increase quality. However, more competition also reduces the mark-up, which reduces
the marginal profit from an increase in quality. These two effects offset each other completely.12
Under our two critical assumptions, there is however a third effect. More competition reduces the
price, which in turn reduces profit and increases the marginal utility from profit. Since providers
are motivated, the marginal profit of quality is negative in equilibrium (β/2 − g′(q∗) < 0).
Therefore, each provider responds optimally to more competition by reducing quality in order
to recover some of the profit losses generated by the price reduction.
Notice the criticality of our two key assumptions. If the marginal utility does not decrease
with higher profits, then u′′(π) = 0 and ∂q∗/∂t = 0. If the marginal utility is constant, variations
in profits do not affect the relative willingness to provide quality. If the provider is not motivated,
then v′(q) = 0, 12 − g′(q∗) = 0 and ∂q∗/∂t = 0. In this case, quality is set to maximise profits so
that, by the Envelope Theorem, a marginal reduction in quality has no effect on profits.
3.2 Sequential quality and price decisions
The above analysed simultaneous-move game implicitly relies on the assumption that quality
and price are more or less equally flexible decision variables. However, in many applications
this might be an unrealistic assumption. Many dimensions of quality are such that the choice
of quality should be seen more as a long-term decision than price setting, which suggests that
quality and price competition is more appropriately modelled as a two-stage game with quality
choices being made at the first stage. In some context, though, the opposite is also conceivable,
12This is why there is no (net) effect of competition (measured by transportation cost) on quality in many ofthe spatial competition studies; see e.g., Ma and Burgess (1993) and Gravelle (1999).
12
where the main dimensions of quality are of a short-term nature and can easily be adjusted. In
this subsection we will consider both possibilities.
3.2.1 Quality-then-price competition
Consider a two-stage game in which the providers set quality at stage 1 before they compete
in prices at stage 2. The subgame perfect Nash equilibrium of such a game is derived through
backward induction.
The price subgame. At stage 2 provider i sets a price that maximises utility given by (3).
Using (2) and (4), we obtain the following first-order conditions:
∂Ui (qi, qj , pi, pj)
∂pi= u′(πi)
[1
2+β (qi − qj)− 2pi + pj + c
2t
]= 0, (15)
where i, j = 1, 2 and i 6= j. For a given pair of quality levels, (q1, q2), the equilibrium in the
price subgame is characterised by the first-order conditions from which we obtain
pi (qi, qj) = c+ t+β (qi − qj)
3. (16)
From (16) we can easily derive the relationships between quality and prices: ∂pi/∂qi = β/3 and
∂pi/∂qj = −β/3.
Quality choices. Inserting the equilibrium values from the price subgame given by (16) into
(4), we can express provider i’s profits as a function of qualities only.
πi (qi, qj) =
(t+
β (qi − qj)3
)(1
2+β (qi − qj)
6t
)− g (qi) . (17)
Assuming each provider sets quality simultaneously to maximise utility given by (3), provider
i’s optimal quality is given by the following first-order condition:
∂Ui (qi, qj)
∂qi= v′(qi) + u(πi (qi, qj))
[β
(1
3+β (qi − qj)
9t
)− g′(qi)
]= 0. (18)
13
Applying symmetry, equilibrium quality is characterised by
v′(q∗) + u′(π∗)
(β
3− g′(q∗)
)= 0, (19)
with
p∗ = c+ t and π∗ =t
2− g (q∗) . (20)
What is the effect of more competition on quality? Differentiating (19) with respect to q∗ and
t we obtain∂q∗
∂t=
u′′(π∗)
−2Z ′′(q∗)
(β
3− g′(q∗)
)> 0, (21)
where Z ′′(q∗) := v′′(q∗)− u′(π∗)g′′ (q∗)− u′′(π∗)(β3 − g
′(q∗))g′(q∗) < 0. From (19), notice that
(β/3− g′(q∗)) < 0. Thus, we have the following result:
Proposition 2 In a Hotelling model where providers set quality before price, all results in
Proposition 1 still hold.
Our key result that more competition reduces quality is therefore robust to whether quality
decisions are made prior to or simultaneously with the price decisions. The effect of lower
transportation costs on quality is qualitatively similar, though the magnitude differs.
Comparing the equilibrium outcomes of the sequential quality-price game in (19)-(20) with
the simultaneous quality-price game in (9)-(11), we observe that the equilibrium prices are identi-
cal, while equilibrium quality is lower and thus equilibrium profits higher in the sequential game.
Thus, quality competition is softer when providers can commit to quality before competing in
prices. The reason is that, in the sequential game, provider i takes into account the (negative)
effect a higher quality has on provider j’s pricing in the following stage. If one provider has lower
quality than the other, this provider will be more aggressive in the price game and undercut
its rival to compensate for the quality difference. This is exactly the result found by Ma and
Burgess (1993). Here, we show that this result is also valid when providers are motivated and
have decreasing marginal utility of profit.
14
3.2.2 Price-then-quality competition
Suppose instead that the firms commit to prices at the first stage of a two-stage game where
qualities are set at the second stage. This assumption may hold if the price is paid prior to
getting the service and the quality can be controlled during the service period. The first-order
condition for the optimal choice of quality for provider i is given by (5), with a similar condition
for provider j. These two conditions implicitly define the Nash equilibrium in the second-stage
subgame which is given by the functions qi (pi, pj) and qj (pi, pj).
The first-stage problem for provider i is then given by
maxpi
Ui (πi, qi) = u (πi (qi (pi, pj) , qj (pi, pj) , pi, pj)) + v (qi (pi, pj)) . (22)
By the Envelope Theorem, the effect of pi on Ui that go through qi (pi, pj) vanishes, implying
that the first-order condition for the optimal price at the first stage of the game is
u′ (πi)
[Di −
(pi − c)2t
(1 + β
∂qj∂pi
)]= 0. (23)
In the symmetric Nash equilibrium, the price is given by
p∗ = c+t
1 + β∂qj∂pi
∣∣∣qj=q∗,pi=p∗
(24)
If we once more use the simultaneous-move game as a benchmark, a comparison of (23)-(24)
with (6) and (9) reveals that sequential decision making, with prices being set first, introduces
an extra strategic effect at the price-setting stage, since the price set by provider i will affect
quality choices by the competing provider j at the second stage. Suppose that a price increase by
provider i reduces (increases) the quality offered by provider j. This would dampen (reinforce)
the demand loss of a price increase and would give both providers a stronger (weaker) incentive
to increase the price. As a result, the equilibrium price would be higher (lower) than in the
simultaneous-move game.13 Equilibrium quality is then implicitly given by (7), but where p∗ is
defined by (24) instead of (9).
13The expression for ∂qj∂pi
∣∣∣qj=q∗,pi=p∗
, which has an ambiguous sign, is given in Appendix A.1.
15
Regarding the effect of increased competition (lower transportation costs) on equilibrium
quality, the mechanisms are the same as in the simultaneous-move game with added effect of
t on ∂qj∂pi, which is generally ambiguous. It is straightforward to verify (see Appendix A.1)
that ∂qj∂pi
∣∣∣qj=q∗,pi=p∗
= 0 if the marginal utility of profit is constant or if providers are not
motivated. In this case, the degree of competition has no effect on quality provision even if
prices are set before quality. With decreasing marginal utility of profits and provider motivation
(u′′ (π) < 0 and v′ (q) > 0), the negative relationship between competition and quality reported
in Proposition 1 holds also in this version of the game if the second-order effects of t on ∂qj∂pi
are
suffi ciently small in magnitude.
3.3 Fixed (regulated) prices
Our key result that competition reduces quality depends crucially on the assumption that prices
are endogenous and chosen by the firm. To emphasise this point, suppose that prices are fixed
at pi = pj = p. The first-order condition for the optimal quality for provider i is14
∂Ui (qi, qj)
∂qi= u′ (πi (qi, qj))
[(p− c)β
2t− g′ (qi)
]+ v′ (qi) = 0 (25)
The symmetric Nash equilibrium, denoted by q∗, has quality given by
v′(q∗) + u′(π(q∗))
[(p− c)β
2t− g′(q∗)
]= 0 (26)
Equilibrium profit is given by π∗ := π(q∗) = (p − c)12 − g (q∗) . What is the effect of more
competition on quality? Differentiating (26) with respect to q∗ and t, we derive
−u′(π∗)(p− c)β2t2
dt = −[v′′(q∗)− u′(π∗)g′′(q∗)− u′′(π∗)g′ (q∗)
((p− c)β
2t− g′(q∗)
)]dq∗, (27)
from which we obtain∂q∗
∂t=
u′(π∗)
2V ′′(q∗)
(p− c)βt2
< 0, (28)
14The second-order condition is ∂2Ui/∂q2i = v′′(qi)− u′(πi)g′′(qi) + u′′(πi)
((p−c)β2t
− g(qi))2
< 0.
16
where V ′′(q∗) := v′′(q∗)−u′(π∗)g′′(q∗)−u′′(π∗)g′ (q∗)((p−c)β2t − g′(q∗)
)< 0. We therefore obtain
the following result:
Proposition 3 In a Hotelling model where providers set quality and prices are fixed, more
competition, measured by lower transportation costs, increases quality whenever the fixed price
is above the marginal treatment cost.
This result is in stark contrast with those obtained above. It is only when prices are endoge-
nous that competition reduces quality. If prices are fixed by a regulator, the opposite hold. More
competition makes the demand more responsive to quality and increases the marginal benefit
from raising quality.
4 Price and quality competition in a Salop model
In this section we consider price and quality competition in the context of a Salop model where
n ≥ 2 providers are symmetrically (equidistantly) located on a circumference equal to 1. On
the circle there is a uniform distribution of consumers with density normalised to 1. Consumer
utility is given by (1) with the only modification that i = 1, ..., n.
This framework gives us one additional measure of competition, namely the number of
providers in the market. Additionally, it allows us to consider entry. More specifically, we
can use this framework to study how an increase in competition intensity —measured by a
reduction in transportation costs —affects quality provision in a free entry equilibrium.
4.1 Simultaneous quality and price decisions
Since the model is symmetric, all providers will set the same price and quality in equilibrium.
If provider i’s neighbours (competitors) set equal price and quality, i.e., pi−1 = pi+1 = pj and
qi−1 = qi+1 = qj , the demand for provider i is given by
Di (qi, qj , pi, pj) =1
n+
1
t(β (qi − qj)− pi + pj) . (29)
The profits and utility to provider i are given by (4) and (3). Using (29) and assuming that
all providers simultaneously choose prices and qualities to maximise utility in (3), we obtain the
17
following symmetric Nash equilibrium:
p∗ = c+t
n, (30)
v′(q∗) + u′(π∗)
[β
n− g′(q∗)
]= 0, (31)
with equilibrium profits given by π∗ = π(q∗, p∗) = t/n2 − g (q∗) . As usual, a larger number of
providers (higher n) reduces price and profits. Differentiating (31) with respect to q∗, t and n,
we obtain∂q∗
∂t= − u′′(π∗)
n2G′′(q∗)
[β
n− g′(q∗)
]> 0, (32)
∂q∗
∂n=
1
n2G′′(q∗)
[βu′(π∗) +
2t
n
(β
n− g′(q∗)
)u′′(π∗)
]< 0, (33)
where G′′(q∗) := v′′(q∗) − u′(π∗)g′′(q∗) − u′′(π∗)g′(q∗)(βn − g
′(q∗))< 0. See Appendix A.2 for
details. Notice again that βn − g
′(q∗) < 0. Thus, we have the following result:
Proposition 4 In a Salop model where providers set price and quality simultaneously, all results
in Proposition 1 still hold. Additionally, if competition is measured by the number of providers
in the market, more competition leads to lower quality in all cases (for u′′(π) ≤ 0 and v′(q) ≥ 0).
The effect of lower transportation costs on quality is analogous to the equivalent Hotelling
analysis (see Proposition 1). A larger number of providers also leads to lower quality in equilib-
rium. This relationship relies on two different effects that work in the same direction:
(i) More providers in the market lead to lower demand for each provider, which makes
demand more elastic and implies a lower optimal price. This reduces the profit margin of each
provider and therefore weakens incentives to invest in quality. Thus, if providers are pure profit
maximisers, more competition (due to a larger number of providers) leads to lower quality. This
is precisely the effect identified by Economides (1993) and is captured by the first term in the
square brackets in (33).
(ii) This effect is reinforced by allowing for provider motivation and decreasing marginal
utility of profit. A higher number of providers leads to lower prices and profits. With decreasing
marginal utility of profit this implies that the marginal utility of profit increases in the number of
providers. Since providers are motivated, the marginal profit of quality is negative in equilibrium.
18
Therefore, each provider responds optimally to a larger number of providers by reducing quality
in order to recover some of the profit losses generated by the price reduction. This effect is
captured by the second term in the square brackets in (33).
4.2 Sequential quality and price decisions
Suppose instead that price is a more flexible decision variable such that the providers play a
two-stage game where they commit to a quality level prior to price setting.15 Generalising (29)
by allowing the neighbours of provider i to set different prices and qualities, demand for provider
i is given by
Di =1
n+
1
t
(βqi −
β
2(qi−1 + qi+1)− pi +
1
2(pi−1 + pi+1)
). (34)
The first-order condition for the optimal price of provider i in the second-stage subgame is given
by
u′ (πi)
[Di −
(pi − c)t
]= 0, i = 1, ..., n. (35)
The set of n first-order conditions define a set of price functions pi (qi,qj), where∂pi∂qi
> 0 and
∂pi∂qj
< 0, for all j 6= i.
At the first stage of the game, the maximisation problem of provider i is given by
maxqi
Ui = u (πi (qi,qj , pi (qi, ·) ,pj (qi, ·))) + v (qi) . (36)
By the Envelope Theorem, the effect of qi on Ui that goes through pi vanishes and the first-order
condition is given by
u′ (πi)
∂πi∂qi
+∑j 6=i
∂πi∂pj
∂pj∂qi
+ v′ (qi) = 0, (37)
or, more extensively,
u′ (πi)
(pi − c)t
β +1
2
∑j 6=i
∂pj∂qi
− g′ (qi)+ v′ (qi) = 0. (38)
15The opposite order of moves, defining a price-then-quality competition game, would have an equilibrium inthe second-stage subgame characterised by a non-linear system of n equations, which makes it impossible to applylinear algebra methods to characterised the full equilibrium. This particular version of the game is therefore notconsidered here.
19
As in the Hotelling model, sequential decision making creates an incentive to reduce quality
provision in the first stage in order to dampen price competition in the second stage. This effect
is captured by the term 12
∑j 6=i
∂pj∂qi, which is negative. Evaluated at the symmetric equilibrium,
where p∗ = c+ tn , the equilibrium quality level, q∗, is implicitly given by
v′ (q∗) + u′ (π∗)
βn
+1
2n
∑j 6=i
∂pj∂qi− g′ (q∗)
= 0, (39)
where π∗ = tn2− g (q∗). It is straightforward to see that the only difference between (39) and
(31) is the second term in the square brackets of (39), which captures the effect of quality on
rival providers’price setting. However, it can be shown (see Appendix A.3) that this term does
not depend on t, which implies that differentiation of (39) with respect to q∗ and t yields an
expression for ∂q∗/∂t that is equivalent to (32), with the only difference that βn − g
′ (q∗) < 0 is
replaced with βn + 1
2n
∑j 6=i
∂pj∂qi−g′ (q∗) < 0. Thus, the relationship between transportation costs
and equilibrium quality provision is unaffected.
Proposition 5 In a Salop model where providers set quality before price, all results in Propo-
sition 1 still hold.
However, when using the number of providers as competition measure, the relationship
between competition and quality provision is somewhat more complicated to derive. Based on
experimentation with specific values of n, it is possible to show (see Appendix A.3 for details)
that the second term in the square brackets of (39) is increasing in n (i.e., it becomes less
negative as n increases). This means that more competition, measured by an increase in the
number of providers, introduces a third effect that counteracts the two negative effects detailed
in the previous subsection. As n increases, the incentive to reduce quality at the first stage in
order to dampen price competition at the second stage weakens, which —all else equal —leads to
higher quality provision. However, it is also possible to show, again based on specific values of n,
that this effect is outweighed by the quality-reducing effect of lower demand when n increases.
Thus, although, it is not possible to show this generally, numerical simulations suggest that
a higher number of providers lead to lower equilibrium quality provision also in the two-stage
game where quality is chosen before price. Details are given in Appendix A.3.
20
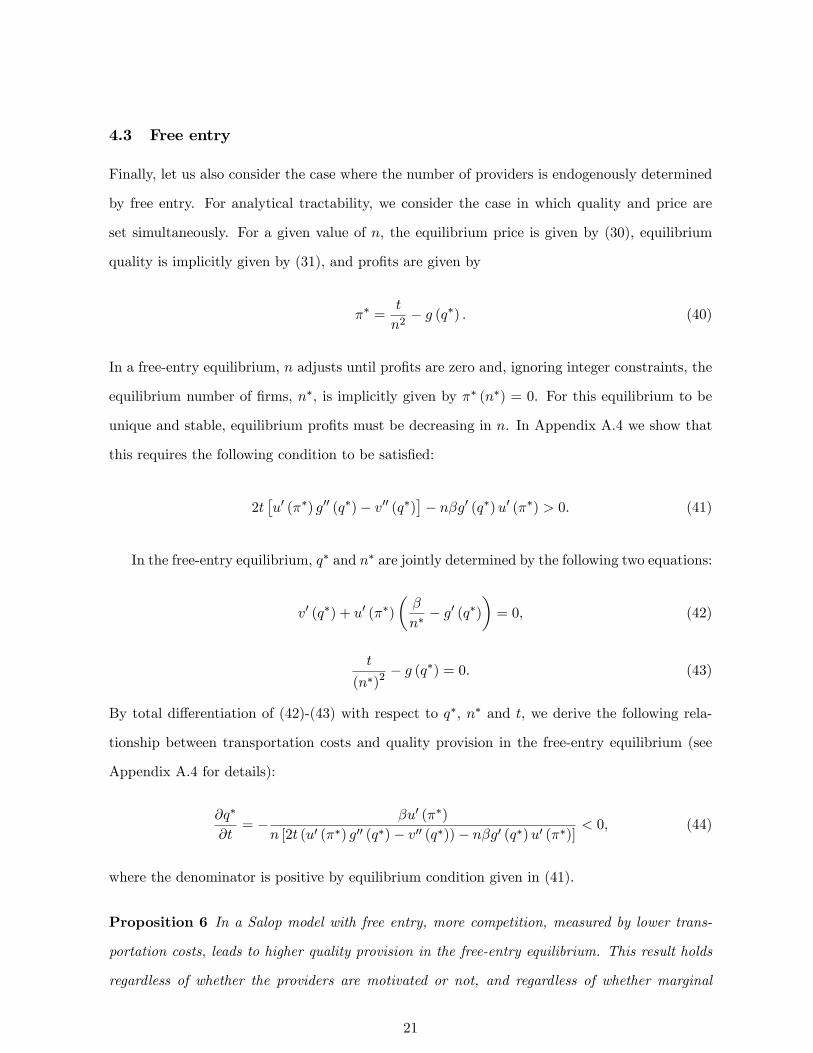
4.3 Free entry
Finally, let us also consider the case where the number of providers is endogenously determined
by free entry. For analytical tractability, we consider the case in which quality and price are
set simultaneously. For a given value of n, the equilibrium price is given by (30), equilibrium
quality is implicitly given by (31), and profits are given by
π∗ =t
n2− g (q∗) . (40)
In a free-entry equilibrium, n adjusts until profits are zero and, ignoring integer constraints, the
equilibrium number of firms, n∗, is implicitly given by π∗ (n∗) = 0. For this equilibrium to be
unique and stable, equilibrium profits must be decreasing in n. In Appendix A.4 we show that
this requires the following condition to be satisfied:
2t[u′ (π∗) g′′ (q∗)− v′′ (q∗)
]− nβg′ (q∗)u′ (π∗) > 0. (41)
In the free-entry equilibrium, q∗ and n∗ are jointly determined by the following two equations:
v′ (q∗) + u′ (π∗)
(β
n∗− g′ (q∗)
)= 0, (42)
t
(n∗)2− g (q∗) = 0. (43)
By total differentiation of (42)-(43) with respect to q∗, n∗ and t, we derive the following rela-
tionship between transportation costs and quality provision in the free-entry equilibrium (see
Appendix A.4 for details):
∂q∗
∂t= − βu′ (π∗)
n [2t (u′ (π∗) g′′ (q∗)− v′′ (q∗))− nβg′ (q∗)u′ (π∗)] < 0, (44)
where the denominator is positive by equilibrium condition given in (41).
Proposition 6 In a Salop model with free entry, more competition, measured by lower trans-
portation costs, leads to higher quality provision in the free-entry equilibrium. This result holds
regardless of whether the providers are motivated or not, and regardless of whether marginal
21
utility of profits is decreasing or constant.
Thus, Propositions 3 and 5 show that, compared with the case of restricted entry, free
entry reverses the relationship between transportation costs and quality provision. For a given
number of firms, a transportation cost reduction lowers both price and quality. The overall
effect on profits is negative (see Appendix A.4). This leads to exit from the industry, which
in turn stimulates quality provision. It appears that the latter effect dominates, leading to
an overall reduction in equilibrium quality provision. Notice that this result does not rely on
provider motivation or decreasing marginal utility of profits. If v′ (q) = u′′ (π) = 0, a reduction
of transportation costs leads to a lower price and no effect on quality for a given number of
firms. However, the price reduction implies lower profits and therefore exit of providers from
the market. The resulting reduction in n leads to higher demand for each remaining firm, which
stimulates quality provision.
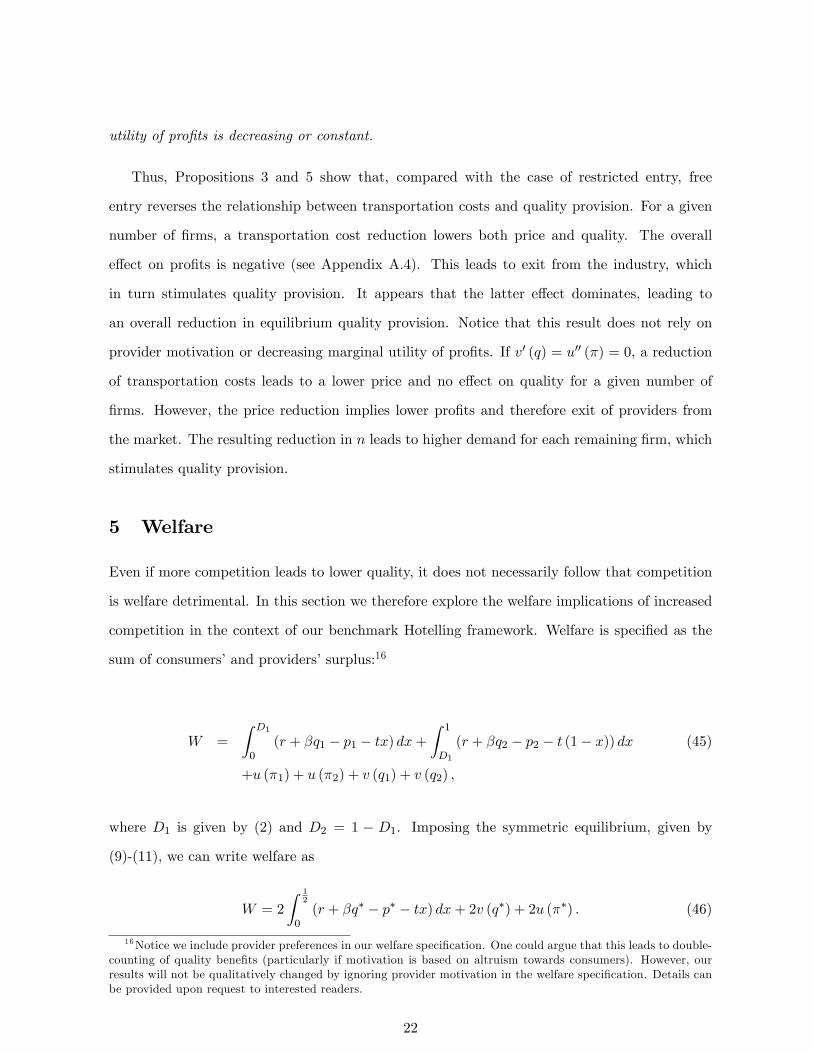
5 Welfare
Even if more competition leads to lower quality, it does not necessarily follow that competition
is welfare detrimental. In this section we therefore explore the welfare implications of increased
competition in the context of our benchmark Hotelling framework. Welfare is specified as the
sum of consumers’and providers’surplus:16
W =
∫ D1
0(r + βq1 − p1 − tx) dx+
∫ 1
D1
(r + βq2 − p2 − t (1− x)) dx (45)
+u (π1) + u (π2) + v (q1) + v (q2) ,
where D1 is given by (2) and D2 = 1 − D1. Imposing the symmetric equilibrium, given by
(9)-(11), we can write welfare as
W = 2
∫ 12
0(r + βq∗ − p∗ − tx) dx+ 2v (q∗) + 2u (π∗) . (46)
16Notice we include provider preferences in our welfare specification. One could argue that this leads to double-counting of quality benefits (particularly if motivation is based on altruism towards consumers). However, ourresults will not be qualitatively changed by ignoring provider motivation in the welfare specification. Details canbe provided upon request to interested readers.
22
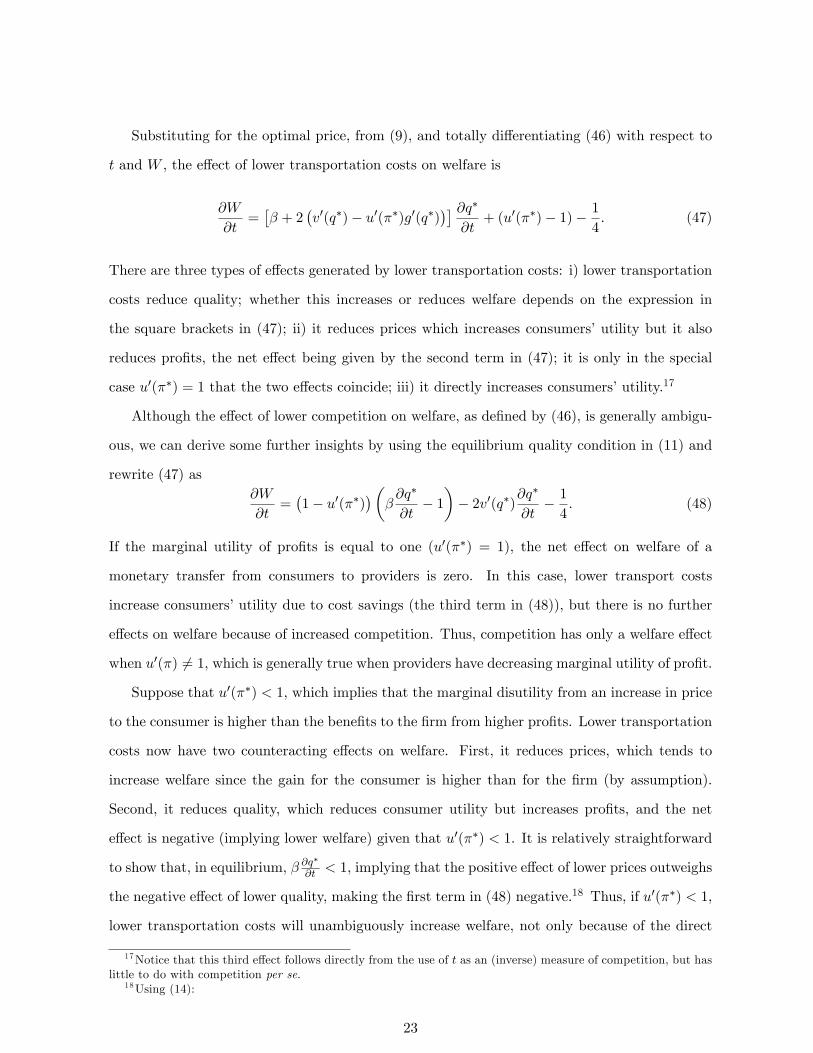
Substituting for the optimal price, from (9), and totally differentiating (46) with respect to
t and W , the effect of lower transportation costs on welfare is
∂W
∂t=[β + 2
(v′(q∗)− u′(π∗)g′(q∗)
)] ∂q∗∂t
+ (u′(π∗)− 1)− 1
4. (47)
There are three types of effects generated by lower transportation costs: i) lower transportation
costs reduce quality; whether this increases or reduces welfare depends on the expression in
the square brackets in (47); ii) it reduces prices which increases consumers’utility but it also
reduces profits, the net effect being given by the second term in (47); it is only in the special
case u′(π∗) = 1 that the two effects coincide; iii) it directly increases consumers’utility.17
Although the effect of lower competition on welfare, as defined by (46), is generally ambigu-
ous, we can derive some further insights by using the equilibrium quality condition in (11) and
rewrite (47) as∂W
∂t=(1− u′(π∗)
)(β∂q∗
∂t− 1
)− 2v′(q∗)
∂q∗
∂t− 1
4. (48)
If the marginal utility of profits is equal to one (u′(π∗) = 1), the net effect on welfare of a
monetary transfer from consumers to providers is zero. In this case, lower transport costs
increase consumers’utility due to cost savings (the third term in (48)), but there is no further
effects on welfare because of increased competition. Thus, competition has only a welfare effect
when u′(π) 6= 1, which is generally true when providers have decreasing marginal utility of profit.
Suppose that u′(π∗) < 1, which implies that the marginal disutility from an increase in price
to the consumer is higher than the benefits to the firm from higher profits. Lower transportation
costs now have two counteracting effects on welfare. First, it reduces prices, which tends to
increase welfare since the gain for the consumer is higher than for the firm (by assumption).
Second, it reduces quality, which reduces consumer utility but increases profits, and the net
effect is negative (implying lower welfare) given that u′(π∗) < 1. It is relatively straightforward
to show that, in equilibrium, β ∂q∗
∂t < 1, implying that the positive effect of lower prices outweighs
the negative effect of lower quality, making the first term in (48) negative.18 Thus, if u′(π∗) < 1,
lower transportation costs will unambiguously increase welfare, not only because of the direct
17Notice that this third effect follows directly from the use of t as an (inverse) measure of competition, but haslittle to do with competition per se.
18Using (14):
23
cost savings but also because of increased competition.
Proposition 7 If the marginal utility of income is higher for consumers than for providers
(u′(π∗) < 1), then increased competition unambiguously increases welfare.
However, if the marginal utility of income is lower for consumers than for providers, i.e.,
u′(π∗) > 1, then the first term in (48) is positive and the overall welfare effect of increased
competition is ambiguous. In this case increased competition will have a negative (positive)
welfare effect if provider motivation is suffi ciently low (high).
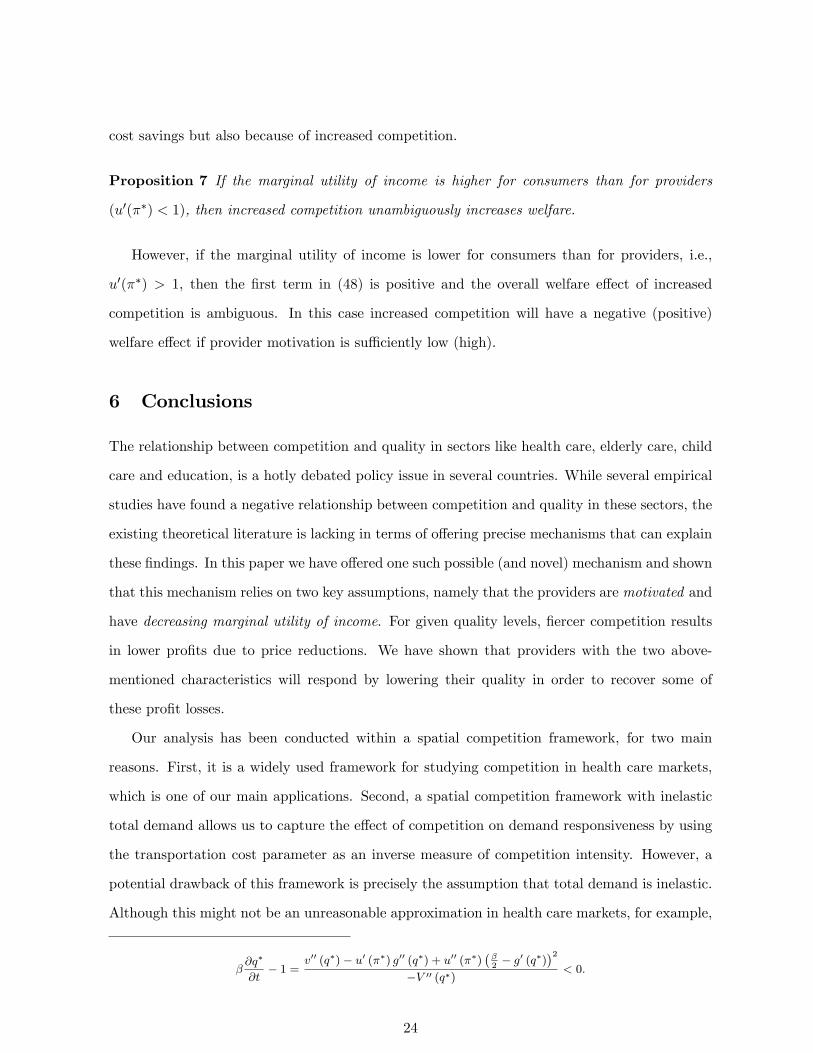
6 Conclusions
The relationship between competition and quality in sectors like health care, elderly care, child
care and education, is a hotly debated policy issue in several countries. While several empirical
studies have found a negative relationship between competition and quality in these sectors, the
existing theoretical literature is lacking in terms of offering precise mechanisms that can explain
these findings. In this paper we have offered one such possible (and novel) mechanism and shown
that this mechanism relies on two key assumptions, namely that the providers are motivated and
have decreasing marginal utility of income. For given quality levels, fiercer competition results
in lower profits due to price reductions. We have shown that providers with the two above-
mentioned characteristics will respond by lowering their quality in order to recover some of
these profit losses.
Our analysis has been conducted within a spatial competition framework, for two main
reasons. First, it is a widely used framework for studying competition in health care markets,
which is one of our main applications. Second, a spatial competition framework with inelastic
total demand allows us to capture the effect of competition on demand responsiveness by using
the transportation cost parameter as an inverse measure of competition intensity. However, a
potential drawback of this framework is precisely the assumption that total demand is inelastic.
Although this might not be an unreasonable approximation in health care markets, for example,
β∂q∗
∂t− 1 =
v′′ (q∗)− u′ (π∗) g′′ (q∗) + u′′ (π∗)(β2− g′ (q∗)
)2−V ′′ (q∗) < 0.
24
it is still a quite strong assumption. One way to relax this assumption is to introduce a monopoly
segment of consumers who only decide whether or not to buy from the closest provider (because
of lower willingness-to-pay), as in Brekke et al. (2008, 2011). It is relatively straightforward to
show that this would not affect our main result as long as the monopoly segment is suffi ciently
small relative to the competitive segment. However, this approach involves another drawback,
namely that the transportation cost parameter ceases to be a precise measure of competition
intensity, since lower transportation costs also lead to higher total demand from the monopoly
segment.
Finally, as we have shown in our welfare analysis, we would like to stress that a negative
relationship between competition and quality does not necessarily imply that competition is
welfare detrimental.
Appendix
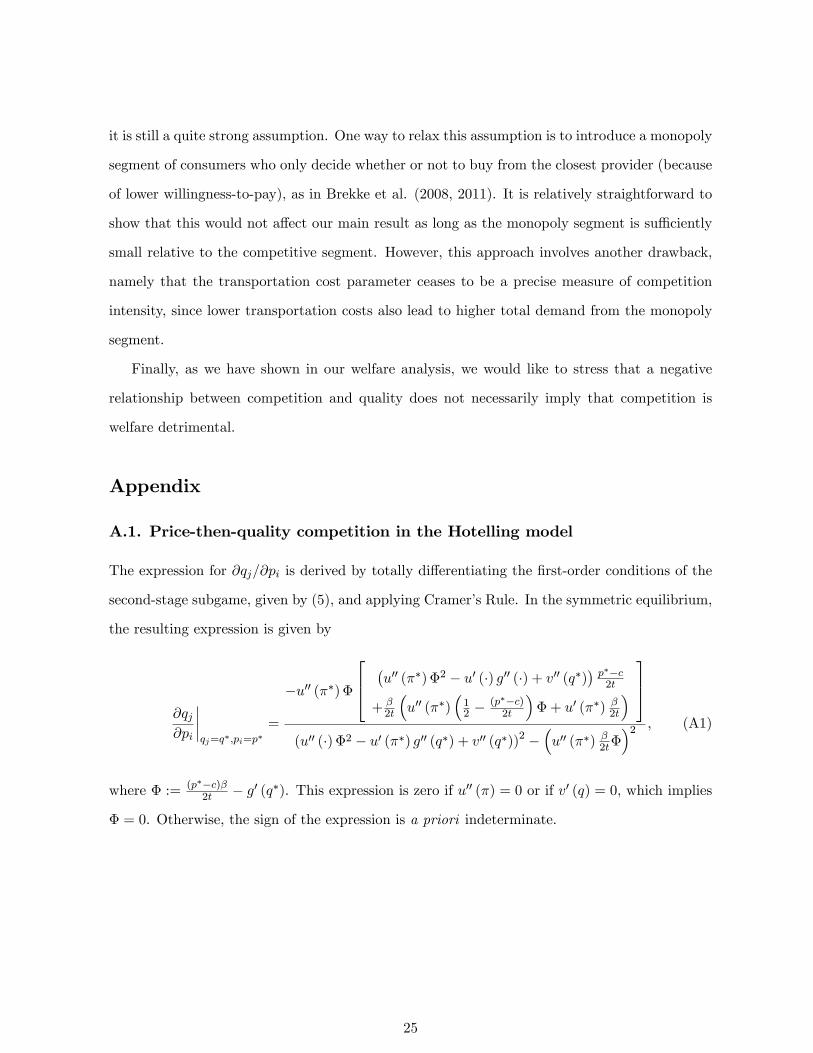
A.1. Price-then-quality competition in the Hotelling model
The expression for ∂qj/∂pi is derived by totally differentiating the first-order conditions of the
second-stage subgame, given by (5), and applying Cramer’s Rule. In the symmetric equilibrium,
the resulting expression is given by
∂qj∂pi
∣∣∣∣qj=q∗,pi=p∗
=
−u′′ (π∗) Φ
(u′′ (π∗) Φ2 − u′ (·) g′′ (·) + v′′ (q∗)
) p∗−c2t
+ β2t
(u′′ (π∗)
(12 −
(p∗−c)2t
)Φ + u′ (π∗) β
2t
)
(u′′ (·) Φ2 − u′ (π∗) g′′ (q∗) + v′′ (q∗))2 −(u′′ (π∗) β
2tΦ)2 , (A1)
where Φ := (p∗−c)β2t − g′ (q∗). This expression is zero if u′′ (π) = 0 or if v′ (q) = 0, which implies
Φ = 0. Otherwise, the sign of the expression is a priori indeterminate.
25
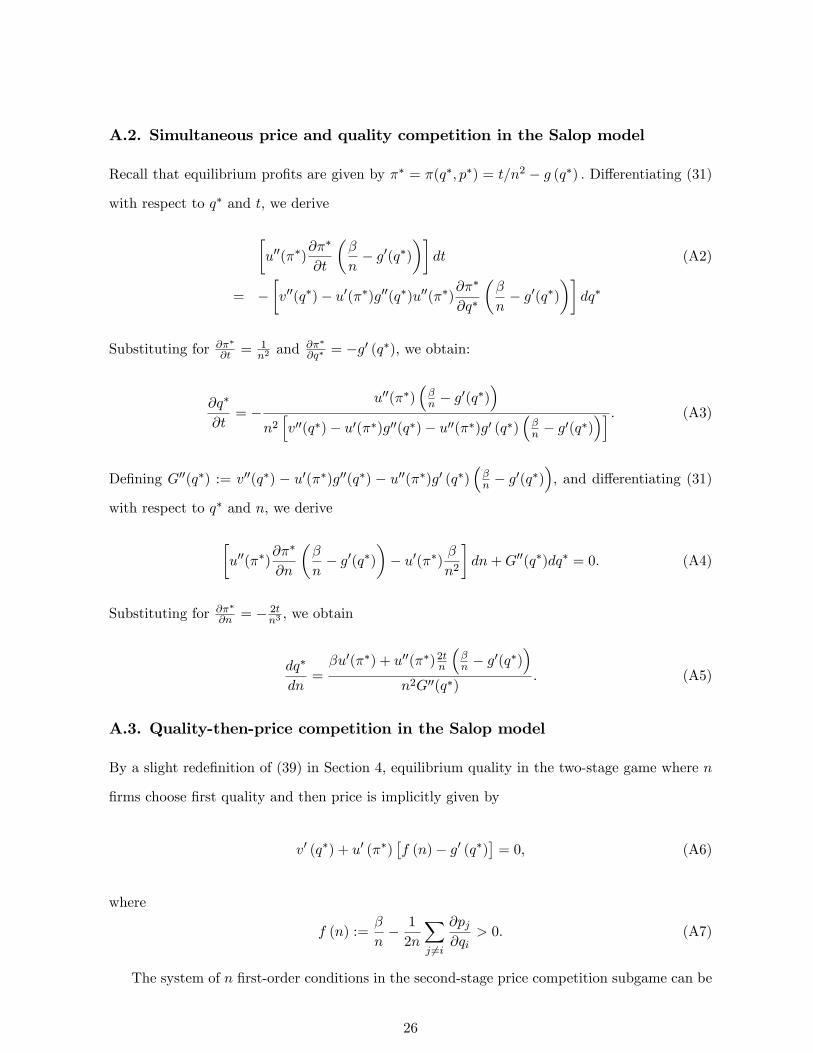
A.2. Simultaneous price and quality competition in the Salop model
Recall that equilibrium profits are given by π∗ = π(q∗, p∗) = t/n2 − g (q∗) . Differentiating (31)
with respect to q∗ and t, we derive
[u′′(π∗)
∂π∗
∂t
(β
n− g′(q∗)
)]dt (A2)
= −[v′′(q∗)− u′(π∗)g′′(q∗)u′′(π∗)∂π
∗
∂q∗
(β
n− g′(q∗)
)]dq∗
Substituting for ∂π∗
∂t = 1n2and ∂π∗
∂q∗ = −g′ (q∗), we obtain:
∂q∗
∂t= −
u′′(π∗)(βn − g
′(q∗))
n2[v′′(q∗)− u′(π∗)g′′(q∗)− u′′(π∗)g′ (q∗)
(βn − g′(q∗)
)] . (A3)
Defining G′′(q∗) := v′′(q∗) − u′(π∗)g′′(q∗) − u′′(π∗)g′ (q∗)(βn − g
′(q∗)), and differentiating (31)
with respect to q∗ and n, we derive
[u′′(π∗)
∂π∗
∂n
(β
n− g′(q∗)
)− u′(π∗) β
n2
]dn+G′′(q∗)dq∗ = 0. (A4)
Substituting for ∂π∗
∂n = − 2tn3, we obtain
dq∗
dn=βu′(π∗) + u′′(π∗)2tn
(βn − g
′(q∗))
n2G′′(q∗). (A5)
A.3. Quality-then-price competition in the Salop model
By a slight redefinition of (39) in Section 4, equilibrium quality in the two-stage game where n
firms choose first quality and then price is implicitly given by
v′ (q∗) + u′ (π∗)[f (n)− g′ (q∗)
]= 0, (A6)
where
f (n) :=β
n− 1
2n
∑j 6=i
∂pj∂qi
> 0. (A7)
The system of n first-order conditions in the second-stage price competition subgame can be
26
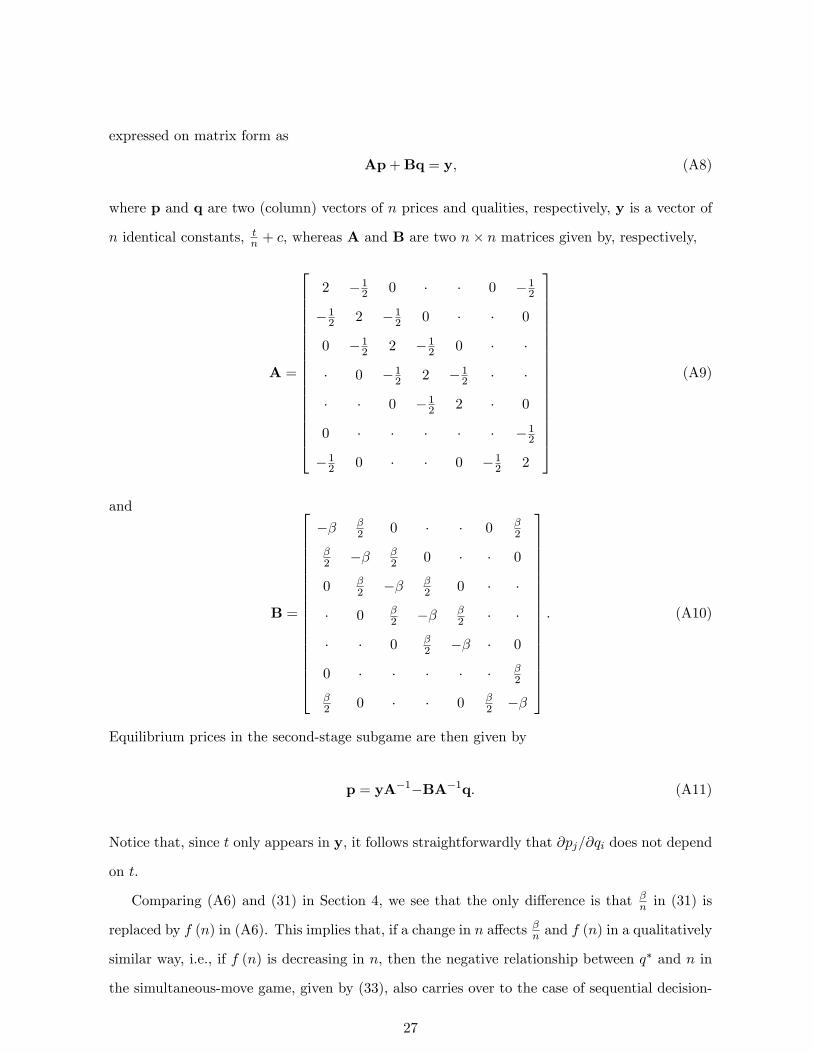
expressed on matrix form as
Ap+Bq = y, (A8)
where p and q are two (column) vectors of n prices and qualities, respectively, y is a vector of
n identical constants, tn + c, whereas A and B are two n× n matrices given by, respectively,
A =
2 −12 0 · · 0 −12−12 2 −12 0 · · 0
0 −12 2 −12 0 · ·
· 0 −12 2 −12 · ·
· · 0 −12 2 · 0
0 · · · · · −12−12 0 · · 0 −12 2
(A9)
and
B =
−β β2 0 · · 0 β
2
β2 −β β
2 0 · · 0
0 β2 −β β
2 0 · ·
· 0 β2 −β β
2 · ·
· · 0 β2 −β · 0
0 · · · · · β2
β2 0 · · 0 β
2 −β
. (A10)
Equilibrium prices in the second-stage subgame are then given by
p = yA−1−BA−1q. (A11)
Notice that, since t only appears in y, it follows straightforwardly that ∂pj/∂qi does not depend
on t.
Comparing (A6) and (31) in Section 4, we see that the only difference is that βn in (31) is
replaced by f (n) in (A6). This implies that, if a change in n affects βn and f (n) in a qualitatively
similar way, i.e., if f (n) is decreasing in n, then the negative relationship between q∗ and n in
the simultaneous-move game, given by (33), also carries over to the case of sequential decision-
27

making. Since we are able to invert A only for specific values of n, our strategy is to calculate
f (n) for n = 2, ..., 10 and make inferences based on this. These calculations are reported in
Table A1.
Table A1: Quality-then-price competition in the Salop model
Number of providers f (n) := βn −
12n
∑j 6=i
∂pj∂qi
n = 2 f (n) = 512β = 0.416 67β
n = 3 f (n) = 415β = 0.266 67β
n = 4 f (n) = 1996β = 0.197 92β
n = 5 f (n) = 319β = 0.157 89β
n = 6 f (n) = 71540β = 0.131 48β
n = 7 f (n) = 871β = 0.112 68β
n = 8 f (n) = 2652688β = 0.09859β
n = 9 f (n) = 2092385β = 0.08763β
n = 10 f (n) = 98912 540β = 0.07887β
These calculations confirm that, at least for the range of n considered, f (n) is decreasing in n,
implying ∂q∗/∂n < 0.
A.4. Free-entry equilibrium in the Salop model
A unique and stable free-entry equilibrium requires
dπ∗
dn=∂π∗
∂n+∂π∗
∂q
∂q∗
∂n< 0. (A12)
Using (33) and (40) from Section 4, we have
dπ∗
dn= − 2t
n3−
g′ (q∗)(βu′ (π∗) + t
n
(βn − g
′ (q∗))u′′ (π∗)
)n2(v′′ (q∗)− u′′ (π∗) g′ (q∗)
(βn − g′ (q∗)
)− u′ (π∗) g′′ (q∗)
) , (A13)
28
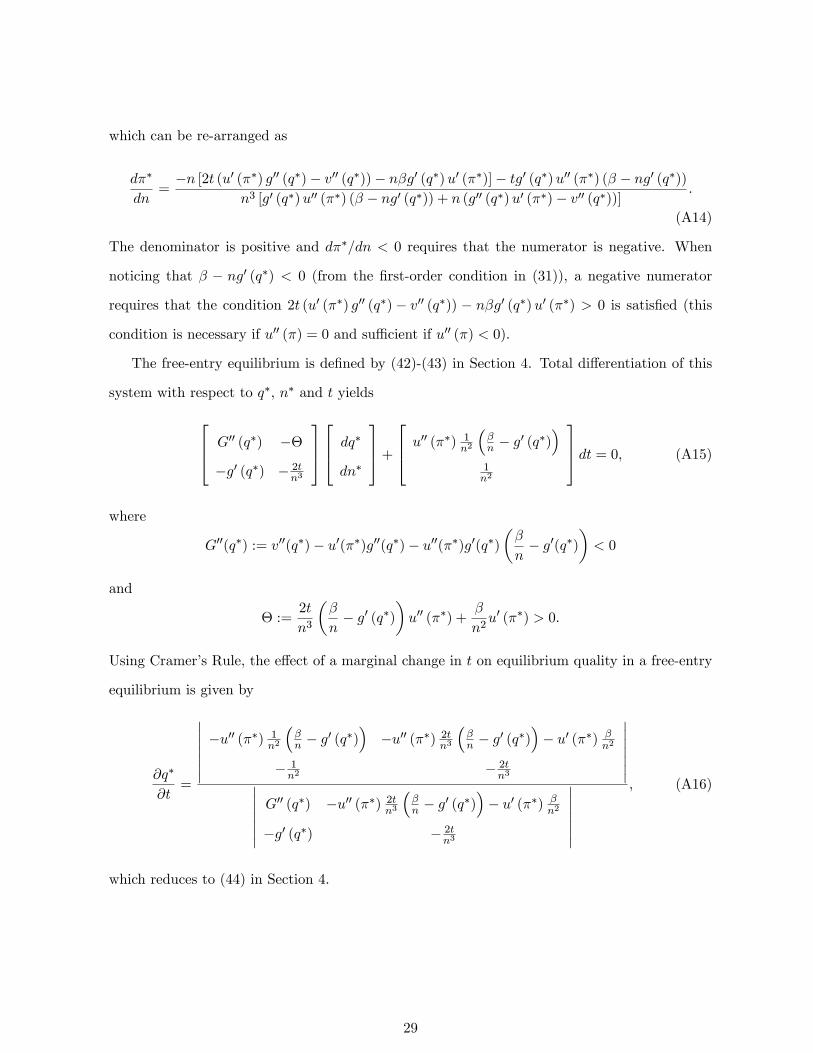
which can be re-arranged as
dπ∗
dn=−n [2t (u′ (π∗) g′′ (q∗)− v′′ (q∗))− nβg′ (q∗)u′ (π∗)]− tg′ (q∗)u′′ (π∗) (β − ng′ (q∗))
n3 [g′ (q∗)u′′ (π∗) (β − ng′ (q∗)) + n (g′′ (q∗)u′ (π∗)− v′′ (q∗))] .
(A14)
The denominator is positive and dπ∗/dn < 0 requires that the numerator is negative. When
noticing that β − ng′ (q∗) < 0 (from the first-order condition in (31)), a negative numerator
requires that the condition 2t (u′ (π∗) g′′ (q∗)− v′′ (q∗)) − nβg′ (q∗)u′ (π∗) > 0 is satisfied (this
condition is necessary if u′′ (π) = 0 and suffi cient if u′′ (π) < 0).
The free-entry equilibrium is defined by (42)-(43) in Section 4. Total differentiation of this
system with respect to q∗, n∗ and t yields
G′′ (q∗) −Θ
−g′ (q∗) − 2tn3
dq∗
dn∗
+
u′′ (π∗) 1n2
(βn − g
′ (q∗))
1n2
dt = 0, (A15)
where
G′′(q∗) := v′′(q∗)− u′(π∗)g′′(q∗)− u′′(π∗)g′(q∗)(β
n− g′(q∗)
)< 0
and
Θ :=2t
n3
(β
n− g′ (q∗)
)u′′ (π∗) +
β
n2u′ (π∗) > 0.
Using Cramer’s Rule, the effect of a marginal change in t on equilibrium quality in a free-entry
equilibrium is given by
∂q∗
∂t=
∣∣∣∣∣∣∣−u′′ (π∗) 1
n2
(βn − g
′ (q∗))−u′′ (π∗) 2t
n3
(βn − g
′ (q∗))− u′ (π∗) β
n2
− 1n2
− 2tn3
∣∣∣∣∣∣∣∣∣∣∣∣∣∣G′′ (q∗) −u′′ (π∗) 2t
n3
(βn − g
′ (q∗))− u′ (π∗) β
n2
−g′ (q∗) − 2tn3
∣∣∣∣∣∣∣, (A16)
which reduces to (44) in Section 4.
29
References
[1] Asplund, M., 2002. Risk-averse firms in oligopoly. International Journal of Industrial Or-
ganization, 20, 995—1012.
[2] Banal-Estañol, A., Ottaviani, M., 2006. Mergers with product market risk. Journal of Eco-
nomics and Management Strategy, 15, 577—608.
[3] Barreda-Tarrazona, I., García-Gallego, A., Georgantzís, N., Andaluz-Funcia, J., Gil-Sanz,
A., 2011. An experiment on spatial competition with endogenous pricing. International
Journal of Industrial Organization, 29, 74-83.
[4] Benabou, R., Tirole, J., 2014. Bonus Culture: Competitive Pay, Screening and Multitasking
(Version: May 2014), mimeo.
[5] Bertram, T., Pascal, C., 2000. Early Childhood Education and Care Policy in the United
Kingdom, OECD Country Note, www.oecd.org/unitedkingdom/2535034.pdf
[6] Besley, T., Ghatak, M., 2005. Competition and incentives with motivated agents. American
Economic Review, 95, 616—636.
[7] Blau, S., Currie, J., 2006. Pre-school, Day Care, and After-School Care: Who is Minding
the Kids? Handbook of the Economics of Education (Edited by E. Hanushek and F. Welch),
Volume 2, Chapter 20, 1163-1278.
[8] Bloom, N., Propper, C., Seiler, S., Van Reenen, J., 2015. The impact of competition on
management quality: evidence from public hospitals. The Review of Economic Studies, 82,
457-489.
[9] Brekke, K.R., Siciliani, L., Straume, O.R., 2010. Price and quality in spatial competition.
Regional Science and Urban Economics, 40, 471—480.
[10] Brekke, K.R., Siciliani, L., Straume, O.R., 2011. Hospital competition and quality with
regulated prices. Scandinavian Journal of Economics, 113, 444—469.
[11] Brekke, K.R., Siciliani, L., Straume, O.R., 2012. Quality competition with profit con-
straints, Journal of Economic Behaviour & Organization, 84, 642-659.
30
[12] Burgess, S., Propper, C., Gossage, D., 2008. Competition and quality: evidence from the
NHS internal market 1991-9. Economic Journal, 118, 138—170.
[13] Busse, R., Riesberg, A., 2004. Health care systems in transition: Germany. Copenhagen,
WHO Regional Offi ce for Europe on behalf of the European Observatory on Health Systems
and Policies.
[14] Chalkley, M., Malcomson, J.M., 1998. Contracting for health services when patient demand
does not reflect quality. Journal of Health Economics, 17, 1—19.
[15] Choné, P., Ma, C.A., 2011. Optimal health care contracts under physician agency. Annales
d’Economie et de Statistique, 101/102, 229-256.
[16] Chevreul, K., Durand-Zaleski, I., Bahrami, S., Hernández-Quevedo, C., Mladovsky, P.,
2010. France: Health system review. Health Systems in Transition, 12, 1—291.
[17] Dranove, D., Satterthwaite, M.A., 1992. Monopolistic competition when price and quality
are imperfectly observable. RAND Journal of Economics, 23, 518—534.
[18] Delfgaauw, J., Dur, R., 2008. Incentives and workers’ motivation in the public sector.
Economic Journal, 118, 171—191.
[19] Dixit, A., 2005. Incentive contracts for faith-based organisations to deliver social services;
in: Economic Theory in a Changing World: Policy Modelling for Growth. Eds. Sajal Lahiri
and Pradip Maiti. New Delhi: Oxford University Press.
[20] Economides, N., 1993. Quality variations in the circular model of variety-differentiated
products. Regional Science and Urban Economics 23, 235—257.
[21] Eggleston, K., 2005. Multitasking and mixed systems for provider payment. Journal of
Health Economics, 24, 211—223.
[22] Ellis, R.P., McGuire, T., 1986. Provider behavior under prospective reimbursement: Cost
sharing and supply. Journal of Health Economics, 5, 129—151.
[23] Felder, S., 2009. The variance of length of stay and the optimal DRG outlier payments.
International Journal of Health Care Finance and Economics, 9, 279—289.
31
[24] Forder, J., Allan, S., 2014. The impact of competition on quality and prices in the English
care homes market. Journal of Health Economics, 34, 73-83.
[25] Francois, P., 2000. ‘Public service motivation’as an argument for government provision.
Journal of Public Economics, 78, 275—299.
[26] Gaynor, M., 2006. What do we know about competition and quality in health care markets?
Foundations and Trends in Microeconomics, Vol. 2, Issue 6.
[27] Glazer, A., 2004. Motivating devoted workers. International Journal of Industrial Organi-
zation, 22, 427—440.
[28] Godager, G., Wiesen, D., 2013. Profit or patients’health benefit? Exploring the hetero-
geneity in physician altruism. Journal of Health Economics, 32, 1105-1116.
[29] Golan, L., Parlour, C.A., Rajan, U., 2011. Competition, quality and managerial slack.
Mimeo.
[30] Gravelle, H., 1999. Capitation contracts: access and quality. Journal of Health Economics,
18, 3, 315—340.
[31] Grabowski, D.C. 2004. A longitudinal study of Medicaid payment, private-pay price and
nursing home quality. International Journal Health Care Finance and Economics, 4, 5-26.
[32] Hall, B.J., Liebman, J.B., 1998. Are CEOs Really Paid Like Bureaucrats? Quarterly Jour-
nal of Economics, 113, 653—691.
[33] Hart, O., 1983. The market as an incentive mechanism. Bell Journal of Economics, 14,
366-382.
[34] Holtz-Eakin, D., Joulfaian, D., Rosen, H.S., 1994. Sticking it out: entrepreneurial survival
and liquidity constraints. Journal of Political Economy, 102, 53-75.
[35] Janssen, M.C.W., Karamychev, V.A., 2009. Auctions, aftermarket competition, and risk
attitudes. International Journal of Industrial Organization, 27, 274-285.
[36] Kaarboe, O., Siciliani, L., 2011. Quality, Multitasking and Pay for Performance. Health
Economics, 2, 225-238.
32
[37] Kmietowicz, Z., 2011. Lansley writes price competition out of the health bill. British Medical
Journal, 342:d1481.
[38] Lakdawalla, D., Philipson, T., 2006. The nonprofit sector and industry performance. Journal
of Public Economics, 90, 1681—1698.
[39] La Porta, R., Lopez-de-Silanes, F., Shleifer, A., 1999 Corporate Ownership around the
World, Journal of Finance, 54, 471—517.
[40] Le Grand, J., 2003. Motivation, Agency and Public Policy: of Knights and Knaves, Pawns
and Queens. Oxford University Press, Oxford.
[41] Lindh, T., Ohlsson, H., 1996. Self-employment and windfall gains: evidence from the
Swedish lottery. The Economic Journal, 106, 1515-1516.
[42] Ma, C.A., Burgess, J.F., 1993. Quality competition, welfare, and regulation. Journal of
Economics, 58, 153—173.
[43] Makris, M., 2009. Incentives for motivated agents under an administrative constraint. Jour-
nal of Economic Behavior and Organization, 71, 428—440.
[44] Makris, M., Siciliani, L., 2013. Optimal Incentive Schemes for Altruistic Providers. Journal
of Public Economic Theory, 15(5), 675—699.
[45] Mougeot, M., Naegelen, F., 2008. Supply-side risk adjustment and outlier payment policy.
Journal of Health Economics, 27, 1196—2000.
[46] Mukamel, D., Zwanziger, J., Tomaszewski, K.J., 2001. HMO penetration, competition and
risk-adjusted hospital mortality. Health Services Research, 36, 1019—1035.
[47] Norton, E., 2000. Long-term Care. In AJ Culyer and JP Newhouse (eds) Handbook of
Health Economics, volume 1, chapter 17, Elsevier Science.
[48] OECD, 2011. Health at a Glance 2011: OECD Indicators, OECD Publishing.
http://dx.doi.org/10.1787/health_glance-2011-en
[49] Page, R.M., 1996. Altruism and the British welfare state. Aldershot: Avebury.
33
[50] Propper, C., Burgess, S., Green, K., 2004. Does competition between hospitals improve
the quality of care? Hospital death rates and the NHS internal market. Journal of Public
Economics, 88, 1247—1272.
[51] Schmidt, K.M., 1997. Managerial incentives and product market competition. Review of
Economic Studies, 64, 191-213.
[52] Siciliani, L., Straume, O.R., Cellini, R., 2013. Quality competition with motivated providers
and sluggish demand, Journal of Economic Dynamics and Control, 37, 2041-2061.
[53] Spence, M., 1975. Monopoly, quality and regulation. Bell Journal of Economics 6, 417—429.
[54] Volpp, K.G.M., Waldfogel, J., Williams, S.V., Silber, J.H., Schwartz, J.S., Pauly, M.V.,
2003. The effect of the New Jersey Health Care Reform Act on mortality from acute my-
ocardial infarction. Health Services Research, 38, 515—533.
[55] Wambach, A., 1999. Bertrand competition under cost uncertainty. International Journal of
Industrial Organization, 17, 941—951.
34