Embed Size (px)
Citation preview
Lean engineering logistics: load leveling ofdesign jobs with capacity considerations
Yvan Beauregard, Vincent Thomson, and Nadia Bhuiyan
Abstract. Achieving productivity improvement in engineering organizations involved in product development can be adaunting and complex task, commensurate with the complexity of the products being designed. The goal of this paper is toexpand on the notions involved in the lean engineering body of knowledge as currently implemented in a major aerospacefirm. Relying on key notions developed in a novel lean engineering financial performance model, the authors integrate leanmanufacturing theories, inventory management, production planning and scheduling, improved value stream mapping, projectportfolio management, and linear optimization to offer a coherent global logistics approach supporting lean promises of a moreefficient engineering organization with reduced lead time and waste and improved customer and shareholder value.
Résumé. L’amélioration de la productivité peut s’avérer une tâche redoutable et complexe, à la mesure de la complexité desproduits en développement, pour les entreprises d’ingénierie engagées dans le développement de produits. L’objectif de cetarticle est d’élaborer sur les principes actuels mis de l’avant dans le domaine des connaissances relatives à l’ingénierieallégée telle que pratiquée dans une importante firme de l’aérospatial. Basé sur les notions-clés développées dans le contexted’un modèle novateur de performance financière d’ingénierie allégée, les auteurs intègrent les théories de la productionallégée, la gestion des inventaires, la planification et l’ordonnancement de la production, la cartographie améliorée de lachaîne de valeur, la gestion du portefeuille de projets et l’optimisation linéaire pour offrir une approche logistique globalecohérente en soutien aux promesses de la théorie allégée visant à assurer une organisation plus efficace des procédésd’ingénierie avec une réduction du temps d’exécution et du gaspillage, et une amélioration de la valeur client ainsi que de lavaleur pour les actionnaires.[Traduit par la Rédaction]
Beauregard et al. 30Introduction
Achieving new product development (NPD) objectives onbudget is still a dream for some organizations, as pointed out byBashir and Thomson (2004). Meeting budgets is becomingincreasingly important in civil aerospace, given the intensifyingcompetitive pressure firms face and shareholders expectationsfor return. Current profitability and net cash flow of aerospaceengine manufacturers may be affected in the short term by theuncertain research and development expense inherent in thesecomplex development programs, and future cash flow andprofitability depend on an uncertain initial sales volumeestimate. Fortunately, academics, industries, and governmentshave joined efforts in the last few years and produced anabundant set of ideas, tools, and approaches to help provide themuch needed improvements in this exciting field, such as thosefrom the Massachusetts Institute of Technology LeanAerospace Institute (LAI) (http://lean.mit.edu/). This paperbriefly introduces the concept of lean engineering in the field ofNPD as a methodology that achieves the goals of “better, fastercheaper” (McManus et al., 2005). We briefly review the main
dimensions of lean engineering in three key areas, namely,creating the right product with efficient engineering processesand with effective life cycle and enterprise integration.
Taylor (2005) pointed out one of the weaknesses of leantechniques as being the “lack of a clear and workable financialmodel to measure cost of current operations and potentialfinancial benefit of lean improvements across the value chain.”We thus briefly review a novel lean engineering financial modelthat has been developed and has been used for 2 years now tomeasure progress and justify further work on lean in a majoraerospace engineering firm. We focus on some of the mostimportant attributes that can help to improve the productivity ofthe engineering NPD system and related processes.
From experience, the difficulty in introducing changes tocomplex engineering and design systems such as thosediscussed earlier resides less with the understanding andintegration of the concepts themselves, but rather with theiracceptance and use in an optimal manner. We thus exploresome of the factors that can help support the successfulimplementation of those changes through a discussion of acurrent implementation.
© 2008 CASI 19
Can. Aeronaut. Space J., Vol. 54, No. 2, pp. 19–30, 2008
Received 11 June 2007. Published on the Web at http://pubs.nrc-cnrc.gc.ca/casj on 12 December 2008.
Y. Beauregard.1 Pratt & Whitney Canada Corp., 1000 Marie-Victorin (01BY4), Longueuil, QC J4G 1A1, Canada.
V. Thomson. Faculty of Engineering, McGill University, 845 Sherbrooke St. W., Montréal, QC H3A 2T5, Canada.
N. Bhuiyan. Department of Mechanical and Industrial Engineering, Concordia University, 1455 de Maisonneuve Blvd. West, Montréal, QCH3G 1M8, Canada.
1Corresponding author (e-mail: [email protected]).

Drawing from observations from the aforementionedimplementation from the actual design system efficiencymeasurements in an aerospace company, and from the work byBraglia et al. (2006) on critical path value stream mapping, wepostulate that the next level of improvement in the system canbe achieved by better coordination of jobs and requiredresources in this complex design value stream.
More specifically, we discuss the current proposal for theestablishment of a high-level engineering demand management,load leveling, and engineering job scheduling practice in a majoraerospace firm in Canada, building on equivalent concepts fromtheir manufacturing counterparts (Silver et al., 1998). Updatedplans from various projects are aggregated at the enterprise level,and various algorithms and heuristics are presented andevaluated against key performance dimensions.
Lastly, using the theory of constraints by Goldratt and Cox(2004), we focus on a bottleneck of the engineering process andshow how key controllable factors can support businessobjectives of managing a portfolio of jobs at minimum costwith maximum throughput. Linear programming andoptimization techniques applied in the field of job schedulingcan effectively support the managerial decision makinginvolved in the logistical allocation of resources in a matrix-based multiproject environment together with appropriate leanvisual communication techniques.
Overall, a new framework for implementing lean engineeringis presented, and the implications for practical application areexplained. Improved engineering logistics is enabled byadequate planning and estimating ability. Our proposedapproach should also result in better execution; a pilot projectshould be established to confirm this postulate. According toBashir and Thomson (2004), only 26% of projects in the UnitedStates are completed on time and within budget. Improvedengineering logistics should reduce the level of surprises,helping to ensure that the expected economic return of theproject is in line with the original business objective.
Previous work on lean engineeringlogistics
Logistics is commonly understood to be the “the time relatedpositioning of resources” (http://en.wikipedia.org/wiki/Logistics).One key related theme within lean is achieving flow; in the leanengineering context this means ensuring that the positioning ofengineering resources is appropriate to support the flow ofintellectual work in progress. Oppenheim (2004) discussed theapplication of lean product development flow (LPDF) andsuggested using weekly deliverables and review meetings toachieve flow. He suggests that the best area to apply LPDF is incomplex legacy-based systems or simpler systems, since thesewould typically involve mature technologies and exhibit timestability. On the other hand, complex large integrated opensystems (CLIOS) or complex frontier systems (“very large andcomplex systems either exceeding the boundaries of traditionalsystem engineering, or complex multi-year space or defence
systems seen in space and defence”) would exhibit a high level ofuncertainty and time delay associated with fundamental researchand are thus not likely candidates for lean engineering.
Oppenheim (2004) proposed using a value stream mapping(Rother et al., 2003) (VSM) approach at the project level toidentify key project deliverables in time and to identify thewaste that can be eliminated from product developmentprojects. He suggests that the reduction of throughput time (i.e.,product development lead time) is one key benefit resultingfrom the application of LPDF. His main ideas are theapplication of VSM techniques in the definition of the projectdeliverables, the establishment of a weekly takt time period,and frequent integrative events for the project. He advocatedthe use of a varying workload over time to meet weeklydeliverables and schedule estimates.
MacKenzie (2006) confirmed the applicability andusefulness of VSM principles in a program office type oforganization.
The approach to scheduling advocated by lean proponents isone where, rather that providing multiple discrete schedules forevery work centre that quickly become obsolete once a changeoccurs in plans, the only schedule provided is for thepacemaking work process (McManus, 2005) with the otherwork centres linked to it in various ways (first-in first-out(FIFO) lanes, supermarkets and pull systems, etc.).
Chan et al. (2006) have proposed a model to optimize thescheduling of employees with multiple skills using mixedinteger programming. Their proposed approach integratescapacity planning over a given horizon with a scheduling modelthat details the assignment of employees to activities or skills.They discuss the usefulness of employee proficiency level byskill. Bashir and Thomson (2004), on the other hand, identify adifficulty to expertise factor to be used in adjusting the effortprediction for an engineering job.
In the next section we provide some basic explanations of thelean approach and elaborate further on the lean engineeringmodel and key metrics of the lean engineering business model.
Lean approachAs discussed by Womack and Jones (2003), lean is a
systematic approach that essentially strives to continuouslyimprove the flow of value and reduce nonvalue-addedactivities. From the standpoint of a recent lean engineeringimplementation, the basic elements of lean include thedefinition of value, identification of the value stream,identification and elimination of barriers to increase flow,evolution towards customer pull, and continuous improvementor evolution towards perfection (http://www.isixsigma.com/dictionary/Littles_Law-690.htm).
According to Womack and Jones (2003), all work can beclassified as either value added (VA), nonvalue added (NVA),or required nonvalue added (RNVA) (the latter two being calledeither waste or “muda”).
Walton (1999) defines value in product development as “theright information product delivered at the right time to
20 © 2008 CASI
Vol. 54, No. 2, June/juin 2008

downstream processes/customers.” Walton indicates thatopportunities for improvement exist in cycle time, degree ofproduct satisfying customer requirements, and ease ofproduction, and he quotes benefits such as new productintroduction cycle time down 30%, postcertificationengineering change percent down 75%–96%, parts reduction,and first article inspection passed increased from 35% to 72%resulting from lean engineering implementation.
Walton (1999) discussed the product development process,particularly the requirements generation and needs identifiedthrough marketing, and the ensuing required resourceprioritization. He points out that requirements generation is themost influential step of development with respect to theeventual success of the program, as 85% of life cycle cost iscommitted before the product analyzed entered full-scaledevelopment.
McManus (2005) proposed the following high-levelobjectives for lean engineering: creating the right product withefficient engineering processes and with effective life cycle andenterprise integration.
Right product/job
Developing the right product is a basic requirement to startwith, as all engineering and development efforts that end up notanswering customer needs or creating attractive marketopportunities in the right products can be considered waste.
Wirthlin (2000) discusses improvements required in thefuzzy front end of product development, in the period duringwhich requirements are captured and alternative conceptsgenerated. He suggests an idealized set of best practices andproposes a set of over 40 questions centred around the notionsof requirements identification, concept development, enablers,process, and business case to compare the current practice of anengineering organization involved in development activitiesversus best in class organizations.
Efficient engineering processes
As McManus (2005) highlights, LAI research suggests that tosatisfy regulatory, safety, and quality concerns and allow for themanagement of complex aerospace systems, formal processesare required for almost all aerospace engineering activities.However, such processes are generally poorly defined, refer toobsolete practices that are not relevant to most jobs, miss keypractices, and contain practices that have become irrelevant overtime, and as a result are inconsistently followed.
McManus (2005) indicates that an assessment of engineeringtime card hours results in a whopping 40% pure waste, 29%necessary waste (i.e., setup or regulatory requirements), andonly 31% added value. Interestingly, he then states that tracked,work package jobs are idle 62% of the time and active only38% of the time. The combined value-added and job activepercentage is thus about only 12%. He then discusses Kaizenimprovement events, showing that 75%–90% of job idle time isspent at the bottleneck process, hence the focus of this paper onscheduling the bottleneck resources. Indirect measurements of
job idle time though a metric called touch time ratio (TTR)(ratio of touch days divided by lead time) in company Xsupports the findings of McManus, as the average TTR variesin the range between 10% and 25%.
Effective life cycle integration
As stated earlier, in the lean enterprise, value is specified bythe customer (usually captured through job tickets, voice of thecustomer approach, and quality function deployment (QFD) andflowed down using high-level program deliverable objectives).
Thus, the enterprise, as a going concern, must develop andoffer in the marketplace products and (or) services of sufficientvalue (www.scav-csva.org) or features to justify their price.Given that 60%–80% of value is outsourced to various supplychain partners (McManus, 2005), these firms must be involvedearly in the engineering of the product in a concurrent fashionso as to leverage their experience and ideas, given costlychanges that might be required otherwise, if key aspects ofmanufacturability or testability have been overlooked.
Production planning preparation (3P) events, involvingrepresentatives from all members of the supply chain involved inthe coordination and delivery of value in new productdevelopment, have been used successfully in simulating thephysical flow of goods and information. These 3P events havebecome an instrumental tool in enabling an unprecedented levelof production in the assembly of aircraft engines(www.eclipseaviation.com/index.php?option=com_newsroom&task=viewarticle&id=1023&Itemid=51).
As the concepts that best meet customer needs are graduallydefined, there is a need for conducting tradeoff studies togradually refine and optimize the value proposition.
Lean business model
Let us now examine a lean engineering business modeldeveloped over the course of 2 years at a major aerospaceengine manufacturer. The model compares key dimensions ofengineering jobs outputted either in aggregate or at theindividual level to some previously established baseline, atspecific points in their life cycle in the engineering system.
As pointed out by Taylor (2005), it is difficult to assess thebenefits of lean without such models, as the changes takingplace are more of an evolutionary and gradual nature than thoseresulting from a drastic reengineering of operations. Forexample, waste reduction of 5% could hardly be felt by anyone.As it represents 5% of a 40 h week, this would only be 2 h of aperson’s time for that week.
This type of model, like any regular enterprise accountingsystem, is run every month to capture previous engineeringsystem status and provide a high-level view of the progressachieved towards throughput improvement, waste elimination,and lead-time reduction. It starts by capturing the number ofjobs completed at some predetermined stage of their life cyclein a given time frame (n). Job completion is determined throughconfirmation of specific activities in the work breakdownstructure (WBS). For each such completed job, the evaluation
© 2008 CASI 21
Canadian Aeronautics and Space Journal / Journal aéronautique et spatial du Canada

of job lead time is performed by comparing the date of the firsthour charged to the date of the last hour charged. In a similarfashion, the total amount of hours charged on each completedjob is the sum of charged hours within that activity. Theevaluation of average job lead time is performed together withthe average charged hours using the previous values. Averagejob lead time is calculated as
LT jobs= − ==∑ ( ) / . , ,i
n
i iF S n i n1
14 1 �
where LT is the average lead time; Fi is the date of the last hourcharged; Si is the date of the first hour charged; and i = 1, …, nrepresents the number of completed jobs during the period ofinterest. The factor of 1.4 is required to convert lead timedurations from a 7 days per calendar week basis to a 5 days perworking week basis. Average charged hours is calculated as
CHRS CHRS days= ===∑∑ ijj
m
i
n
n j m11
1/ , ,�
where CHRSij represents the hours charged on job i during leadtime by any node (or employee) k.
Based on an assessment of whether anyone has beencharging more than a given threshold of hours on a given day ona specific job, each lead time day of a given design job is codedas either a touch day or alternatively a nontouch day. Thismeans that if according to the rule given as follows, sufficientfocus has been put on the job to have it progress, that day can beconsidered a day that helped progress the job towardscompletion. A predetermined threshold is such that more than2 h must be spent during a day by at least one employee for thatday to become a touch day for that job. The average number oftouch days is calculated as
TD TD===∑∑ ijj
m
i
n
n11
/
where TDij is a boolean variable representing touch days on jobi on day j (TDij = 1 if CHRSij ≥2 for any node k; otherwise, TDij
= 0). The average number of nontouch days is calculated as
NTD LT TD= −
where NTD represents the average number of nontouch days.The average number of nodes is simply the average of the
number of employees that have been charging each design job:
N N nii
n
==∑
1
/
where Ni represents the number of employees that have beencharging to job i.
The number of hours delivered corresponds to the averagehours previously discussed multiplied by the number of jobscompleted in the chosen period:
HRD CHRS= × n
where HRD represents the number of hours delivered.The touch time ratio is the ratio of touch days to lead time
and effectively enables an evaluation of the effectiveness withwhich the lead time is used, with a low touch time ratiopotentially indicating possible improvements in the flow ofinformation and resulting reduction of waste:
TTR TD LT= /
where TTR is the touch time ratio metric discussed previously.The intellectual work in progress (IWIP) provides a snapshot
of the level of intellectual inventory for jobs that have not yetbeen incorporated into a product (i.e., active jobs). As anexample, the longer the lead time period during which theaverage engineering job is progressing, but not yet completed,the larger the amount of IWIP.
As for a regular supply chain, the following relationshipholds:
WIP = TL
where WIP is the work in progress, T is the throughput, and L isthe lead time (www.isixsigma.com/dictionary/Littles_Law-690.htm). Commonly called Little’s Law, we can see that a largerlead time L will be generating a larger amount of WIP. From thismodel it is obvious that to reduce the amount of WIP, one has todecrease the average job lead time (or increase the TTR).
As in the case of production, reducing levels of inventory inthe intellectual engineering process is important, as the fundsreleased from inventory reduction can be used in a much moreprofitable manner delivering additional value to customers andshareholders. The total amount of intellectual work in progressis calculated as
IWIP WHRS= ′ ′′=
′
′=
′
∑∑ i jj
m
i
n
11
where IWIP represents the total amount of intellectual work inprogress at the end of a given period; and WHRSi′j′ gives thework in progress hours for an active, noncompleted job ′iprovided by employee ′j .
Next, the calculation of the percentage of wasteimprovement is performed. Based on a subjective evaluation,2 h of setup are allocated to each person that charges to the job(nodes):
SETUP = 2N
22 © 2008 CASI
Vol. 54, No. 2, June/juin 2008

where SETUP represents the average setup time, and Nrepresents the average number of nodes that have been chargingto the job.
Another 2 h of restart is added for each person that had aperiod of more than 2 weeks of inactivity on a given job andcomes back charged to the job after this period. The averagerestart time is calculated as
RSTRT RSTRT===
∑∑211
ijj
m
i
n
n/
where RSTRTij = 1 for any non-overlapping period of 10 daysor more without charges from node k on job i; otherwise,RSTRTij = 0.
Lastly, the sum of hours charged on nontouch days isaggregated and averaged under the nomenclature of wastedsetup (in the sense that these were not sufficient hours tosignificantly advance the job; thus, the time charged wasprobably wasted):
WSETUP CHRS TD= −==∑∑ ijj
m
iji
n
n11
1( ) /
where WSETUP represents the average wasted setup.Adding the three categories of waste given previously and
dividing by the average charged hours provides for thepercentage waste:
WPCY SETUP RSTRT WSETUP CHRS= + +100( ) /
The percentage waste improvement is simply the differencebetween the baseline and year-to-date (YTD) percent wastevalues:
WPCI WPCY WPCB= −
where WPCBis the waste percentage baseline, a value that hasbeen established through analysis of the engineering systemover previous periods; and WPCI is the waste percentageimprovement.
YTD throughput improvement hours result from thecomparison of prorated baseline throughput hours to a year-to-date cumulative value:
TI = TY – TB(M/12)
where TY is the year-to-date throughput, TB is the baselinethroughput, M is the month, and TI is the throughputimprovement.
The main dimensions of lean engineering savings includelead time reduction, throughput improvement, waste reduction,and reduction of inventory of intellectual work in progress(IWIP). All savings calculations use a notional hourlyengineering rate R.
Lead time reduction is composed of two main components,the first one being a reduction in carrying cost for intellectualinventory resulting from the reduction in nontouch days, andthe second resulting from a lead time delta from a proratedbaseline.
As indicated previously, carrying intellectual inventoryrequires financing, as the potential revenues from selling theinventory will not be generated until some later time period,although employees are getting paid every 2 weeks. Thus, theconcept of weighted average cost of capital (WACC), or moresimply carrying cost (cc), can be used to determine themagnitude of the financing required for the intellectualinventory. Components of WACC include items such as cost ofequity, cost of borrowing, risk levels, and the firm’s beta. Thereduction in carrying cost for intellectual inventory resultingfrom the reduction in nontouch days is calculated as
LTR cc NTD NTD IWIPNTD B Y= × − ×M R( ) /12
where NTDB and NTDY represent the non-touch days for thebaseline and year-to-date periods, respectively; R is the hourlyrate over which the carrying cost cc is applied; and M is thenumber of time periods for the year to date.
The second component of the saving results in the value of aone-time output differential resulting from a lead time deltafrom a prorated baseline:
LTR LT LT TILT B Y= −R( )
where LT B and LT Y represent the baseline and year-to-datelead time, respectively; LTRLT is the saving associated with areduction in lead time; and TI is the throughput improvementcalculated earlier.
As mentioned earlier, the lead time reduction (LTR) is madeup of two components, a reduction arising from a decrease innontouch days and a reduction arising due to a reduction of leadtime impacting throughput:
LTR = LTRNTD + LTRLT
Intellectual inventory reduction is carried on a 3 monthrolling average basis with the reduction arising from thedifferential of carrying cost between baseline and year-to-dateIWIP figures:
IR = cc × R[(IWIPB × M/12) – IWIPY]
where IR is the value of the inventory reduction; and IWIPB andIWIPY represent the baseline and year-to-date amount ofintellectual inventory, respectively.
Waste reduction is calculated as
WR WPCI HRDy= × × R
© 2008 CASI 23
Canadian Aeronautics and Space Journal / Journal aéronautique et spatial du Canada
where WR is the waste reduction calculated as the wastepercent improvement times the hours delivered to date (HRDy)times the applicable hourly rate.
Lastly, throughput improvement is calculated as 50% of thedifference between a prorated baseline throughput and the year-to-date throughput:
TS = 0.5TI × R
Lean savings (LS) is simply the sum of the lead timereduction, inventory reduction, and throughput improvementsavings:
LS = LTR + IR + WR + TS
Lean logistics methodologyOnce the engineering value stream has been identified, using
the approach outlined in Braglia et al. (2006) and Rother et al.(2003), the proposed lean logistics methodology is performedin five steps: (i) identify demand, (ii) determine the valuestream of the bottleneck and perform current and future statevalue stream mapping, (iii) plan and schedule jobs at thebottleneck operation, (iv) coordinate job release with thebottleneck, and (v) measure performance at the bottleneck andimplement improvements as required.
Identify demand
The first step is to identify demand. The engineeringplanning organization must take into consideration theupcoming identified demand, budgeted or not, originating fromdifferent organizations, for either support to other organizations(i.e., operations, marketing, customer service, etc.), post-engine certification activities, or new product developmentjobs, and aggregate it for various skill types.
Some of these jobs may have been known in advance andthus may have been forecasted. Some may already have beenworked on and possess an estimate to completion (ETC)together with a forecasted completion date, whereas otherscalled “walk-ins” may be more difficult to predict in advance interms of magnitude and timing of occurrence (i.e., safety andreliability, aircraft on ground, etc.). It is also possible to have aforecasted demand still at a planning stage, i.e., higher levelthan job level. Obviously, as indicated by Silver et al. (1998) ina production environment, one would expect that in the shortterm the level of released orders would account for a biggerproportion of the demand than planned orders, and for asignificant proportion of the overall bottleneck capacity. Thesame rationale would apply here for engineering jobs.
To account for unforeseen demand, a good practice is toreserve capacity by specifying in a corporate policy a plannedmaximum utilization percentage of resources consistent withexpected walk-in levels, service level expectations, job leadtime, and intellectual inventory objectives. This practiceeffectively allows for a certain percentage of resources being
available for unplanned tasks and can also cover activities of amore recurrent nature (i.e., daily investigation of qualitynotifications, etc.).
Determination and improvement of thebottleneck value stream
The second step is the determination of the engineering valuestream bottleneck and performance of current and future statemapping. The bottleneck determination is for the time horizonunder consideration. The Goldratt and Cox (2004) theory ofconstraints approach and value stream mapping (VSM) currentpractice (Rother et al., 2003) suggest focusing on thepacemaking operation both in terms of scheduling and in termsof improvements. Value stream mapping workshops in whichKaizen burst type activities are performed have repeatedlyshown excellent results when using group decision makingtechniques, such as Open Space, as suggested by Owen (1997).Cooperrider et al. (2008) developed an approach calledappreciative inquiry, and its four steps of discovery, dream,define, and destiny can be used to generate the vision of theideal state and the steps towards achieving it.
As indicated by Silver et al. (1998), in a typical productionjob shop, bottlenecks are frequently shifting, and the same isassumed for the engineering system, due to the changing mixand maturity of projects and other activities. Care must thus beexercised to confirm that for the next iteration of the aggregateplanning process the location of the maximum demand overcapacity ratio (i.e., the bottleneck) remained where it wasbelieved to be located:
MaxDEM
RESj
i
∑∑
where j = 1, …, n jobs; i = 1, …, e employees; DEMj is thedemand of design job j denominated in the base period; andRESi is the capacity of employee i of critical skill in terms ofthe base period. The base period can be days, weeks, or months,with the algorithm being reproduced at every n periods (sayevery 1–4 weeks) over a rolling horizon of m periods (say 3–6 months).
The determination of the bottleneck skill is performedoutside of the optimization model referred to in this paper. Thisdetermination can be easily performed on a spreadsheet or viaproject management software.
Note that in the model provided, dummy resources are addedto the model to account for the likely scenario that higherdemand than available capacity exists for the bottleneck skill.
Proactive logistics: plan and schedule jobs
The third step is the planning and scheduling of jobsconsidering bottleneck skills. During planning, the assigning ofscarce resources needs to be performed in a manner that willensure the completion of a maximum of high-priority jobs (i.e.,no remaining forecast or ETC at the end of the planning
24 © 2008 CASI
Vol. 54, No. 2, June/juin 2008
horizon). Higher costs are incurred if a complex job is handedover to a lower skilled employee or if the job cannot becompleted within the current period. For each person (node)touching the job, there is also an assumed setup cost of 2 hadded to the total cost, as assumed in the lean engineeringbusiness model. The model attempts to maximize the numberof jobs completed, given priorities and other considerations.
Job scheduling over the planning horizon is performed next.Shortest processing time (SPT) sequencing for the singlemachine case has been shown to minimize a number ofinteresting characteristics from a lean standpoint, such as thetotal and mean flow time, the mean waiting time, and the meanand total lateness. Earliest due date (EDD) heuristics onlyminimize maximum lateness, and as such are less attractivefrom a lean standpoint where the one objective is to reduceIWIP.
Some logistical issues may arise, however, as the bottleneckmay not be located at the first operation of the value stream. Inaddition, forecast accuracy and firm forecast visibility need tobe at sufficient levels to sequence jobs properly (Van Koten andGray, 2005) so that the planning and scheduling systemgenerates a sufficient degree of confidence in users and gainsadequate acceptance.
Reactive logistic: coordinate job startswith the bottleneck
The fourth step relates to the coordination of the value streamup to the bottleneck skill area. Given the discrete nature ofdesign jobs, a synchronization mechanism must be establishedto help ensure that the started jobs requiring the bottleneck areaexpertise will have access to the required resources in theappropriate time frame. At the same time, coordinateddecisions from the planning organization about the nature ofjobs started at the beginning of the engineering value streamcan improve flow, reduce average job lead time, and ensure amore effective use of other than the bottleneck resource byensuring that jobs requiring other than the bottleneck resourceare scheduled.
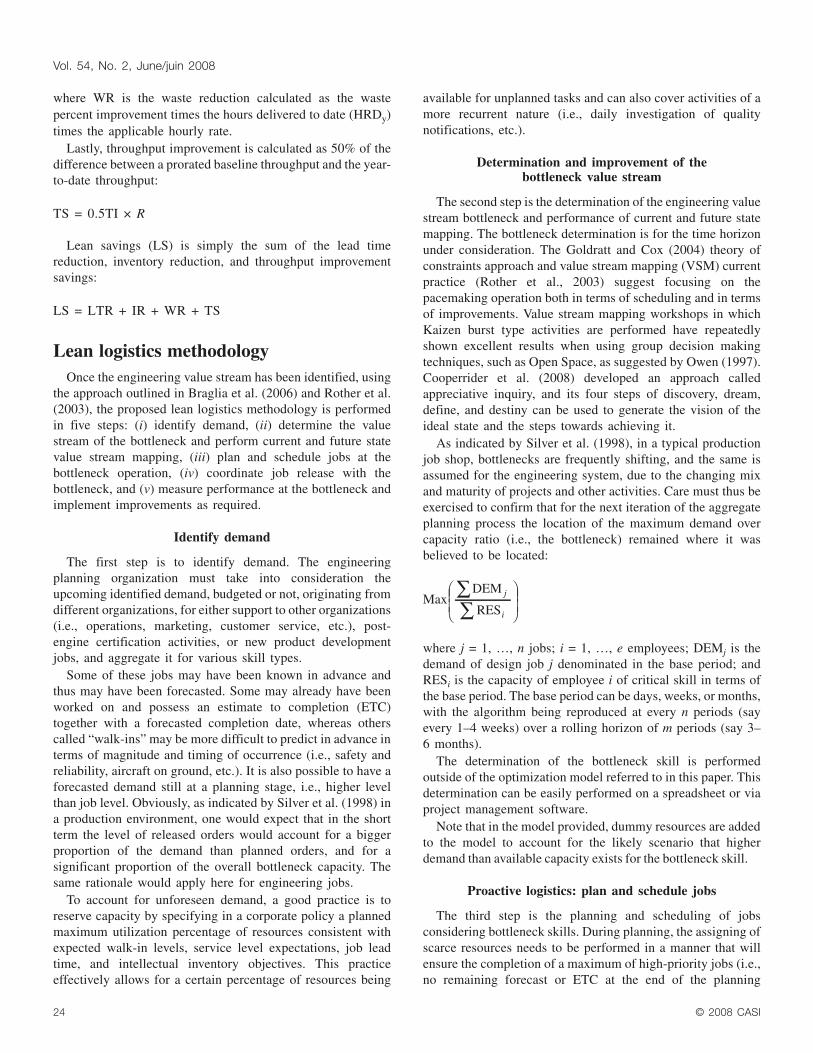
Techniques such as Heijunka boxes and signal Kanban canbe used in the physical implementation of the lean engineering
logistical rules to support the aforementioned objectives in anoperational manner. Figure 1 illustrates the use of Heijunkaboxes.
Measure value stream performance
The fifth and last step involves the measurement ofperformance of the value stream on the dimensions previouslydiscussed in the lean business model.
Proactive lean logistics modelAs indicated earlier, a variety of models can be designed to
help achieve a number of different objectives. In this section wepresent a model that enhances management decision makingeffectiveness, helping to decide which job to allocate to whatresources, given the complexity inherent in managing in anoptimal manner the allocation of scarce engineering resourcesto design jobs of varying nature, complexity, and priority.
The demand is conveyed through a number of jobs. For someof these jobs of interest here, scarce value stream bottleneckresources must be assigned. The key assumptions are asfollows: (i) engineers (e) work sequentially, one design job (j)at a time; (ii) vacation time is considered for employees, suchthat their capacity is reduced for a given time horizon;(iii) scheduling is conducted over a rolling 3 months timeperiod; (iv) applicable regulation must be considered in theassignment of jobs to engineers, to determine among otherswhether employees have adequate clearance given the nature ofthe design job (i.e., military); (v) job complexity versusemployee proficiency is considered and used to modulate theinitial estimate of resource required (forecast); (vi) differentlevels of job priority must be considered from field issues tooperational priorities, cost reduction opportunities, newprogram development, and technology or processimprovement; (vii) each engineer working on the design jobincurs setup; and (viii) demand exceeds capacity.
The lean engineering logistics model variables are asfollows: j is the design job; e is the engineer; xje is the numberof weeks spent by engineer e on design job j; yje = 1 if x > 0,otherwise, yje = 0; PRj is the priority of job j; Dj is the demand
© 2008 CASI 25
Canadian Aeronautics and Space Journal / Journal aéronautique et spatial du Canada
Figure 1. Reactive logistics: pacemaking, synchronized engineering value stream.
of job j; Ce is the capacity of engineer e in the time horizon; COj
is the complexity of job j (for low complexity, COj = 1; for highcomplexity, COj = 2); Pe is the proficiency of engineer e (forlow proficiency, Pe = 1; for high proficiency, Pe = 2); Vje is theforecasted effort adjustment factor to consider an engineer’sproficiency and the job complexity (= Pexje/COj) (note how theinitial estimate is influenced by a ratio of difficulty to expertise)(Bashir and Thomson, 2004); Sj is the setup time for design jobj; if job is military, Zj = 1, otherwise, Zj = 1; if employee iscleared, CAe = 1, otherwise, CAe = 0; and if the job j iscompleted, OUTj = 1, otherwise, OUTj = 0.
The objective of the lean logistic model is to support the leanengineering objective by maximizing the number of jobscompleted (throughput) with priorities via scheduling of themost appropriate resources to jobs:
Max Out PRjj
j∑ ×
The following constraint is required to ensure that demand ismet:
V D y Sjee
j j jee
j∑ ∑= +Out
The jobs being touched are identified as
xje ≤ Myje
Regulation must be complied with:
yje ≤ 1 – Zj + CAe
Lastly, capacity restriction must be considered:
( )j
je je j ex y S C∑ + ≤
Results and analysisIn this section we review the results and learning from an
ongoing implementation of the five steps in lean logisticsmethodology described previously.
Identify demand
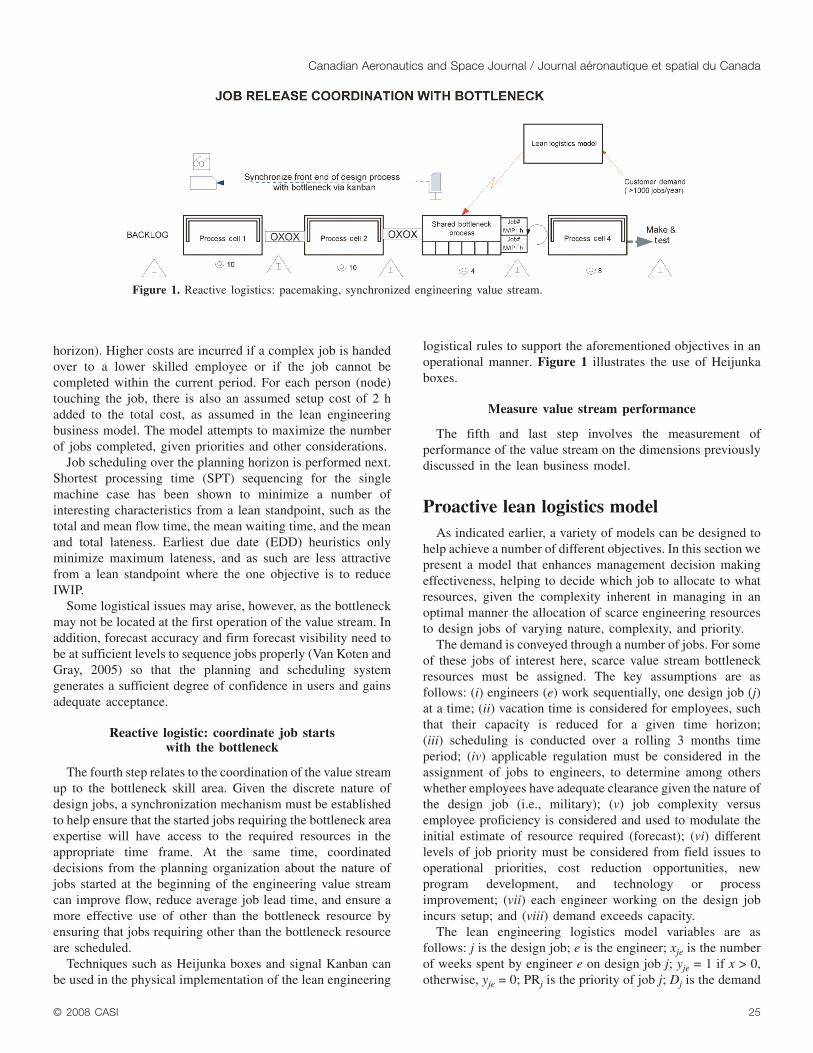
Demand for engineering resources is captured via the P/Smodule of SAP, the enterprise resource planning system usedby the engineering organization. Demand is initially capturedfor high-level planning packages following engineering costestimation exercises. As detailed design activities are launched,further details are specified at the job level. A graphicalinterface to SAP P/S has been created to display demand,capacity, and utilization level for various engineering activities(organization breakdown structure, OBS). Figure 2 provides anillustration of the approach that was implemented foridentifying demand. Data have been masked to preserveconfidentiality. For the engineering organization called OBS1,there is a monthly engineering capacity of about 6000 h. Duringyear 1, the aggregated monthly demand arising from planningpackages and jobs is well below the available capacity,resulting in a utilization level that does not exceed 100%, thusproviding sufficient capacity to respond to unplanned events.During year 2, however, monthly utilization levels in excess of120% indicate that this OBS could become a bottleneck if noimprovements are made.
26 © 2008 CASI
Vol. 54, No. 2, June/juin 2008
Figure 2. Identify demand.
Determination and improvement of thebottleneck value stream
Value stream mapping is an important task within leanengineering. It enables not only the mapping of the presentstate, but also the determination of what the future state shouldbe and the steps required to make it happen. However, definingand mapping the key engineering value stream is a difficulttask. Extensive data analysis of the engineering jobs routing,sequence, effort, and lead time on key bottlenecks wasperformed. Available data show that routing, sequence,duration, and effort vary to a great extent among jobs. Thenature of the engineering activities in product developmentrequires improved value stream mapping techniques.
Leveraging the work from Braglia et al. (2006) on complexmanufacturing systems, a matrix of n jobs known to haverequired the bottleneck resources identified in the previous stepand m available engineering resource types (OBS) is formed,with a value of one indicating a given job using a givenresource, and a value of zero indicating otherwise. Next, an n ×n diagonal matrix of similarity values is created using thefollowing equation:
Sx x y
x x x x yij
ij ij ij
ij i j ij ij
=+
+ + +
where 0 ≤ Sij ≤ 1 are pairwise similarity coefficients, xij is thenumber of OBS used by both job i and job j, xi is the number ofOBS used by job i only, xj is the number of OBS used by job jonly, and yij is the number of OBS not used by job i or job j.Clustering is then performed on the jobs that have similarityvalues above a given threshold. Out of the initial 225 jobsconsidered, the majority ended up being allocated to a short listof five families.
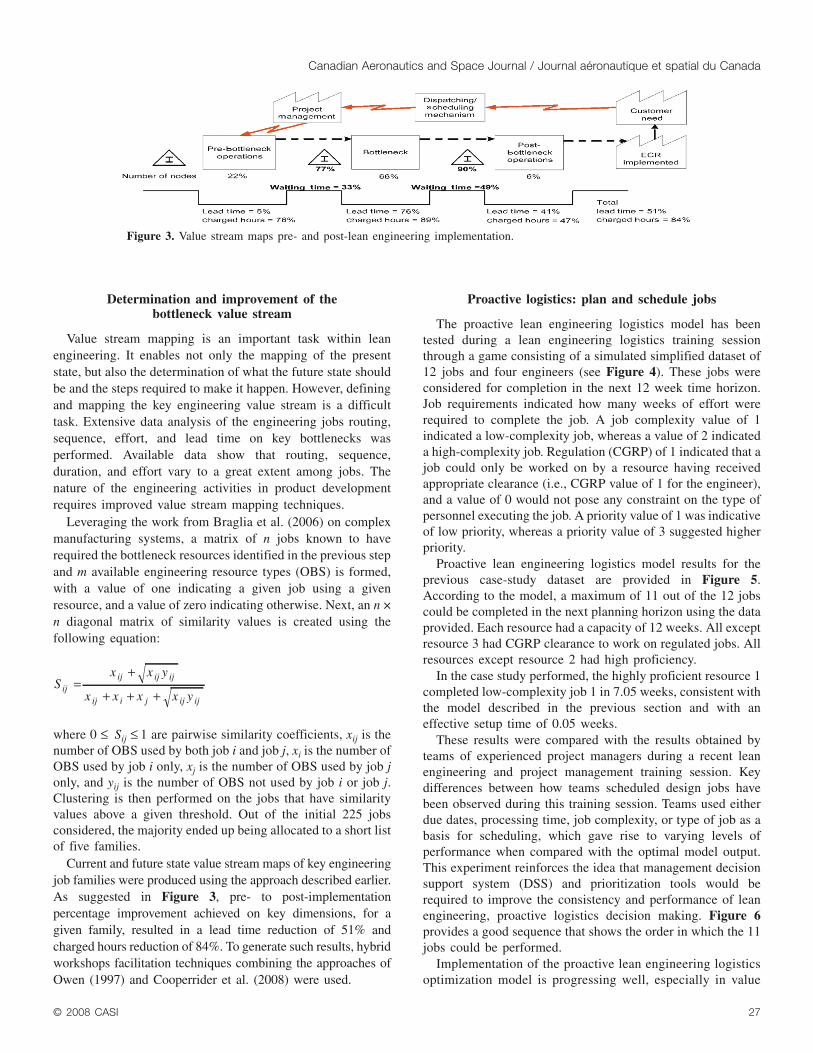
Current and future state value stream maps of key engineeringjob families were produced using the approach described earlier.As suggested in Figure 3, pre- to post-implementationpercentage improvement achieved on key dimensions, for agiven family, resulted in a lead time reduction of 51% andcharged hours reduction of 84%. To generate such results, hybridworkshops facilitation techniques combining the approaches ofOwen (1997) and Cooperrider et al. (2008) were used.
Proactive logistics: plan and schedule jobs
The proactive lean engineering logistics model has beentested during a lean engineering logistics training sessionthrough a game consisting of a simulated simplified dataset of12 jobs and four engineers (see Figure 4). These jobs wereconsidered for completion in the next 12 week time horizon.Job requirements indicated how many weeks of effort wererequired to complete the job. A job complexity value of 1indicated a low-complexity job, whereas a value of 2 indicateda high-complexity job. Regulation (CGRP) of 1 indicated that ajob could only be worked on by a resource having receivedappropriate clearance (i.e., CGRP value of 1 for the engineer),and a value of 0 would not pose any constraint on the type ofpersonnel executing the job. A priority value of 1 was indicativeof low priority, whereas a priority value of 3 suggested higherpriority.
Proactive lean engineering logistics model results for theprevious case-study dataset are provided in Figure 5.According to the model, a maximum of 11 out of the 12 jobscould be completed in the next planning horizon using the dataprovided. Each resource had a capacity of 12 weeks. All exceptresource 3 had CGRP clearance to work on regulated jobs. Allresources except resource 2 had high proficiency.
In the case study performed, the highly proficient resource 1completed low-complexity job 1 in 7.05 weeks, consistent withthe model described in the previous section and with aneffective setup time of 0.05 weeks.
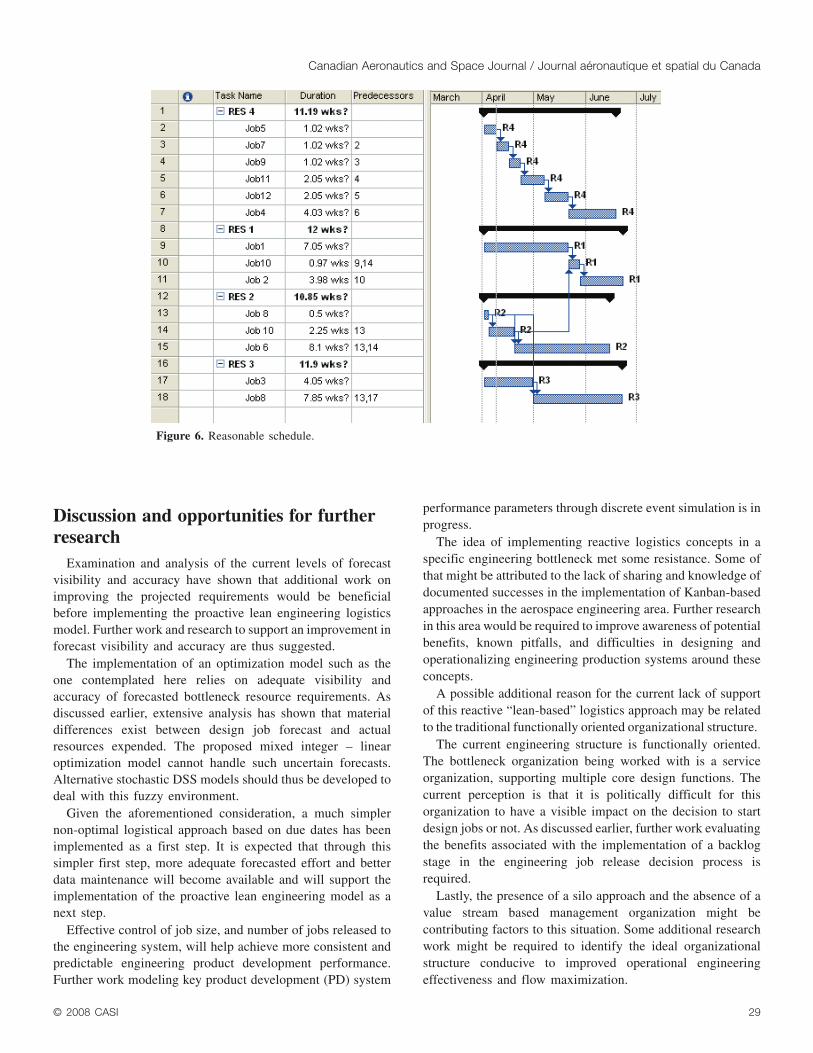
These results were compared with the results obtained byteams of experienced project managers during a recent leanengineering and project management training session. Keydifferences between how teams scheduled design jobs havebeen observed during this training session. Teams used eitherdue dates, processing time, job complexity, or type of job as abasis for scheduling, which gave rise to varying levels ofperformance when compared with the optimal model output.This experiment reinforces the idea that management decisionsupport system (DSS) and prioritization tools would berequired to improve the consistency and performance of leanengineering, proactive logistics decision making. Figure 6provides a good sequence that shows the order in which the 11jobs could be performed.
Implementation of the proactive lean engineering logisticsoptimization model is progressing well, especially in value
© 2008 CASI 27
Canadian Aeronautics and Space Journal / Journal aéronautique et spatial du Canada
Figure 3. Value stream maps pre- and post-lean engineering implementation.

streams where the quality of data, as measured by a six sigmametric called defects per million opportunities (DPMO), isless than 80 000. Recommendations from Sipper and Bulfin(1997) suggest a minimum of 92% accuracy in enterpriseresource planning (ERP) records such as bill of materials andinventory values for manufacturing implementations, suchthat the system produces believable and useful information. Ina similar fashion, data from engineering value streamscontaining bottlenecks must possess a high level of accurateinformation before implementing the proactive engineeringlogistics approach. Potential items to consider for enabling theimplementation of lean engineering logistics includeaddressing data defects, such as “missing ownership –projects or design,” “invalid forecast finish date – date in thepast,” “no ETC in the resource screen,” and “no baseline”situations.
Reactive logistic: coordinate job startswith the bottleneck
Job- and resource-related coordination work to ensure theavailability of bottleneck resources and align other OBSresources is currently taking place during weekly value streamreview meetings. Through these reviews, much progress hasbeen made improving information accuracy. The job startdecision making via the single-stage Kanban pull system is notimplemented yet. A potential reason for this is that as a need forengineering work is recognized, and relevant engineering jobsare created, these jobs get released and become available forengineers to work on immediately, i.e., they are de facto alreadyreleased on the floor. The absence of a “backlog” place holderwhere engineering jobs would reside until a decision to havethem pulled to be worked on next likely constitutes a key reasonfor this absence of job start coordination decision making.
28 © 2008 CASI
Vol. 54, No. 2, June/juin 2008
Figure 4. Lean engineering logistics game dataset.
Figure 5. Optimal lean engineering logistics model results.
Discussion and opportunities for furtherresearch
Examination and analysis of the current levels of forecastvisibility and accuracy have shown that additional work onimproving the projected requirements would be beneficialbefore implementing the proactive lean engineering logisticsmodel. Further work and research to support an improvement inforecast visibility and accuracy are thus suggested.
The implementation of an optimization model such as theone contemplated here relies on adequate visibility andaccuracy of forecasted bottleneck resource requirements. Asdiscussed earlier, extensive analysis has shown that materialdifferences exist between design job forecast and actualresources expended. The proposed mixed integer – linearoptimization model cannot handle such uncertain forecasts.Alternative stochastic DSS models should thus be developed todeal with this fuzzy environment.
Given the aforementioned consideration, a much simplernon-optimal logistical approach based on due dates has beenimplemented as a first step. It is expected that through thissimpler first step, more adequate forecasted effort and betterdata maintenance will become available and will support theimplementation of the proactive lean engineering model as anext step.
Effective control of job size, and number of jobs released tothe engineering system, will help achieve more consistent andpredictable engineering product development performance.Further work modeling key product development (PD) system
performance parameters through discrete event simulation is inprogress.
The idea of implementing reactive logistics concepts in aspecific engineering bottleneck met some resistance. Some ofthat might be attributed to the lack of sharing and knowledge ofdocumented successes in the implementation of Kanban-basedapproaches in the aerospace engineering area. Further researchin this area would be required to improve awareness of potentialbenefits, known pitfalls, and difficulties in designing andoperationalizing engineering production systems around theseconcepts.
A possible additional reason for the current lack of supportof this reactive “lean-based” logistics approach may be relatedto the traditional functionally oriented organizational structure.
The current engineering structure is functionally oriented.The bottleneck organization being worked with is a serviceorganization, supporting multiple core design functions. Thecurrent perception is that it is politically difficult for thisorganization to have a visible impact on the decision to startdesign jobs or not. As discussed earlier, further work evaluatingthe benefits associated with the implementation of a backlogstage in the engineering job release decision process isrequired.
Lastly, the presence of a silo approach and the absence of avalue stream based management organization might becontributing factors to this situation. Some additional researchwork might be required to identify the ideal organizationalstructure conducive to improved operational engineeringeffectiveness and flow maximization.
© 2008 CASI 29
Canadian Aeronautics and Space Journal / Journal aéronautique et spatial du Canada
Figure 6. Reasonable schedule.
ConclusionDeveloping and implementing a methodology to optimize
throughput in a bottleneck engineering operation, scheduling awork process downstream in the value chain to drive the start ofresource expenditure upstream, and considering the availabilityof critical resources in time at the bottleneck operation todetermine whether, when, and how to start jobs are worthwhileexercises that support customer satisfaction and increaseshareholder value and employee satisfaction.
In this paper we reviewed the main dimensions of lean inengineering and provided a clear and workable financial modelto demonstrate the benefits.
A new framework for implementing lean engineering in fivesteps has been presented, and the implications for practicalapplication have been explained. Our work assumed thatimproved engineering logistics is made possible by an adequateplanning and estimating ability.
We discussed proactive and reactive lean engineeringlogistics approaches. Lastly, we discussed various aspects of anongoing implementation and reviewed key areas for furtherresearch.
Our work indicated the need for additional coordination inthe engineering value stream and for support in decisionmaking about which job to execute, given the complexity of thedecisions to be made.
Building a more efficient and proactive engineeringorganization is possible. By integrating notions of productionand inventory management with lean, we have offered acoherent logistics approach to support lean promises.
ReferencesBashir, H.A., and Thomson, V. 2004. Estimating design effort for GE hydro
projects. Computers and Industrial Engineering, Vol. 46, pp. 195–204.
Braglia, M., Carmignani, G., and Zammori, F. 2006. A new value streammapping approach for complex production systems. International Journalof Production Research, Vol. 44, No. 18/19, pp. 3929–3952.
Chan, P., Hiroux, M., and Weil, G. 2003. Strategic employee scheduling. InPATAT 2006, Proceedings of the 6th International Conference on thePractice and Theory of Automated Timetabling, 30 August – 1 September2006, Brno, Czech Republic. Edited by E. Burke and H. Rudova. Springer,Berlin. pp. 157–166.
Cooperrider, D.L., Whitney, D., and Stavros, J.M. 2008. Appreciativeinquiry handbook. 2nd ed. Crown Custom Publishing Inc., Brunswick,Ohio. 454 pp.
Goldratt, E.M., and Cox, J. 2004. The goal: a process of ongoingimprovement. Baker & Taylor Inc., Charlotte, N.C.]
MacKenzie, S.A. 2006. Utilizing value stream mapping in air forceacquisition program offices. Master thesis, Massachusetts Institute ofTechnology (MIT), Cambridge, Mass.
McManus, H.L. 2005. Product development value stream mapping (PDVSM)manual, release 1.0. Lean Aerospace Initiative (LAI), MassachusettsInstitute of Technology, Cambridge, Mass.
McManus, H., Haggerty, A., and Murman, A. 2005. Lean engineering:doing the right thing right. In Proceedings of the 1st InternationalConference on Innovation and Integration in Aerospace Sciences, 4–5 August 2005, Belfast, North Ireland.
Oppenheim, B.W. 2004. Lean product development flow. SystemsEngineering, Vol. 7, No. 4.
Owen, H. 1997. Open space technology: a user’s guide. Berrett-Koehler, SanFrancisco, Calif.
Rother, M., Shook, D., and Womack, J. 2003. Learning to see. The LeanEnterprise Institute, Cambridge, Mass.
Silver, E.A., Pyke, D.F., and Peterson, R. 1998. Inventory management andproduction planning and scheduling. John Wiley & Sons, New York.
Sipper, D., and Bulfin, R. 1997. Production planning control and integration.McGraw Hill, New York.
Taylor, D.H. 2005. Value chain analysis: an approach to supply chainimprovements in the agri-food chain. International Journal of PhysicalDistribution and Logistics Management, Vol. 35, No. 10, pp. 744–761.
Van Koten, C., and Gray, A.R. 2005. Bayesian statistical effort predictionmodels for data centered 4GL software development. Elsevier Science,New York.
Walton, M.A. 1999. Identifying the impact of modeling and simulation in thedetermination of system level requirements. Master thesis, MassachusettsInstitute of Technology (MIT), Cambridge, Mass.
Wirthlin, J.R. 2000. Best practices in user needs/requirements generation.Master thesis, Massachusetts Institute of Technology (MIT), Cambridge,Mass.
Womack, J.P., and Jones, D. 2003. Lean thinking. ACT.
30 © 2008 CASI
Vol. 54, No. 2, June/juin 2008