Embed Size (px)
DESCRIPTION
CAMx SIMULATIONS OF MIDDLE-EAST TRANSBOUNDARY TRANSPORT BY USE OF RAMS AND MM5 INPUT. Erez Weinroth 1,2 , Shoukri Kasakseh 1,3 Robert Bornstein 1 ( [email protected] ) 1 San Jose State Univ. (SJSU), San Jose, CA 2 Hebrew Univ. Jerusalem, Israel (HUJI) - PowerPoint PPT Presentation
Citation preview
CAMx SIMULATIONS OF MIDDLE-EAST TRANSBOUNDARY
TRANSPORT BY USE OF RAMS AND MM5 INPUT
Erez WeinrothErez Weinroth1,21,2, Shoukri Kasakseh, Shoukri Kasakseh1,31,3
Robert BornsteinRobert Bornstein11 (([email protected]@hotmail.com))
11San Jose State Univ. (SJSU), San Jose, CASan Jose State Univ. (SJSU), San Jose, CA22Hebrew Univ. Jerusalem, Israel (HUJI)Hebrew Univ. Jerusalem, Israel (HUJI)
33Applied Research Institute Jerusalem (ARIJ), Applied Research Institute Jerusalem (ARIJ),
Bethlehem, West Bank Bethlehem, West Bank
presented at the presented at the
GMU Modeling Conference, July 2007GMU Modeling Conference, July 2007
OutlineOutline
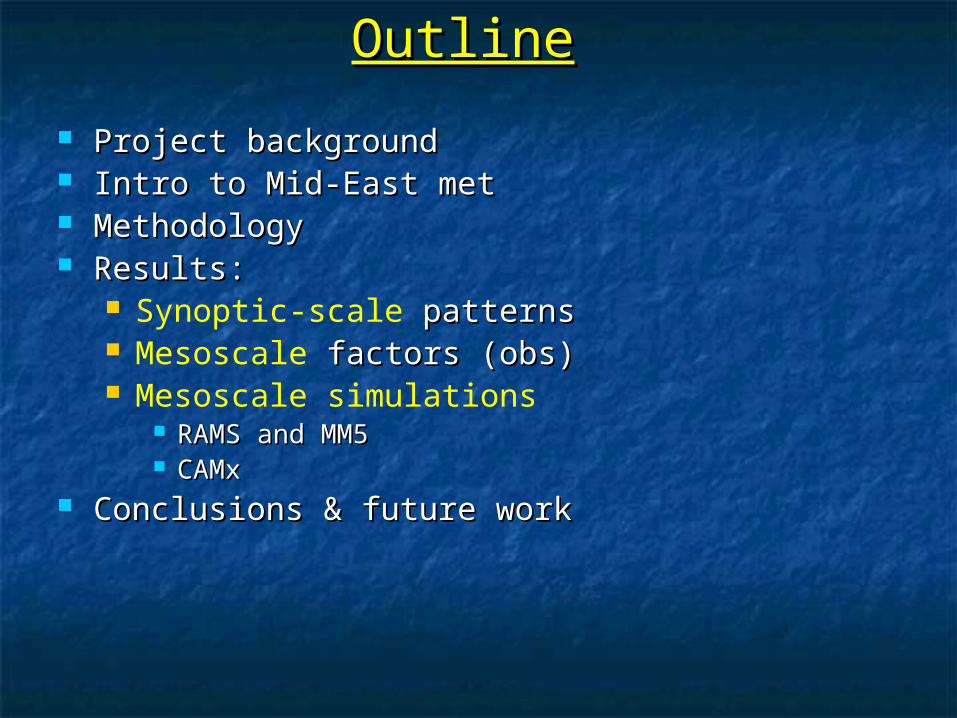
Project backgroundProject background Intro to Mid-East metIntro to Mid-East met MethodologyMethodology Results:Results:
Synoptic-scale patterns patterns Mesoscale factors (obs) factors (obs) Mesoscale simulations
RAMS and MM5RAMS and MM5 CAMxCAMx
Conclusions & future workConclusions & future work
BackgroundBackground
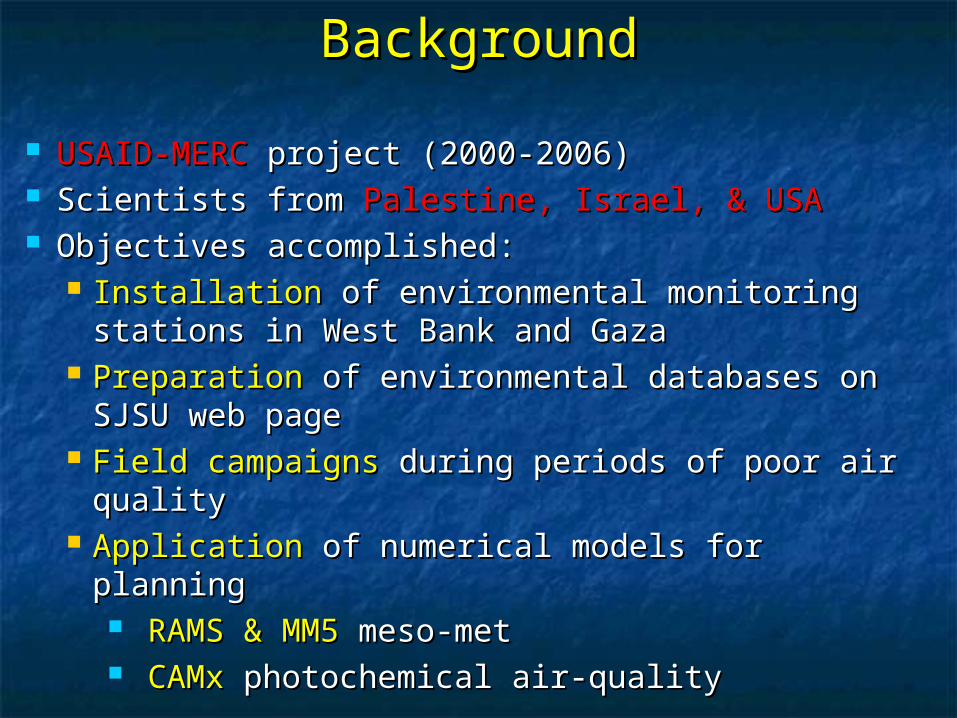
USAID-MERCUSAID-MERC project (2000-2006) project (2000-2006) Scientists Scientists from from Palestine, Israel, &Palestine, Israel, & USAUSA Objectives accomplished:Objectives accomplished:
InstallationInstallation of environmental monitoring stations in of environmental monitoring stations in West Bank and GazaWest Bank and Gaza
PreparationPreparation of environmental databases on SJSU web of environmental databases on SJSU web page page
Field campaignsField campaigns during periods of poor air quality during periods of poor air quality Application Application of numerical models for planningof numerical models for planning
RAMS & MM5RAMS & MM5 meso-met meso-met CAMxCAMx photochemical air-quality photochemical air-quality

3 4 .5 3 4 .8 3 5 .1 3 5 .4
L O N G IT U D E (D eg E )
O 3 s ta tio n lo ca tio n s
3 1 .1
3 1 .4
3 1 .7
3 2 .0
3 2 .3
3 2 .6
3 2 .9
LA
TIT
UD
E (
Deg
N)
12 3
4
56
7
8
9
1 0
11 1 21 31 4
1 5
1 6
5 0 m2 5 0 m7 5 0 m1 0 0 0 m
Topo-heights & O3 sitesMeso-met sites
3 4 .2 3 4 .6 3 5 .0 3 5 .4 3 5 .8
L O N G IT U D E (D eg E )
3 0 .2
3 0 .6
3 1 .0
3 1 .4
3 1 .8
3 2 .2
3 2 .6
3 3 .0
LA
TIT
UD
E (
Deg
N)
W est Bank
G aza
Tel Aviv
Jerusalem
H aifa
S inai
Jordan
Carmel and Galil
Sh
om
ron
an
d J
ud
ea
Israel
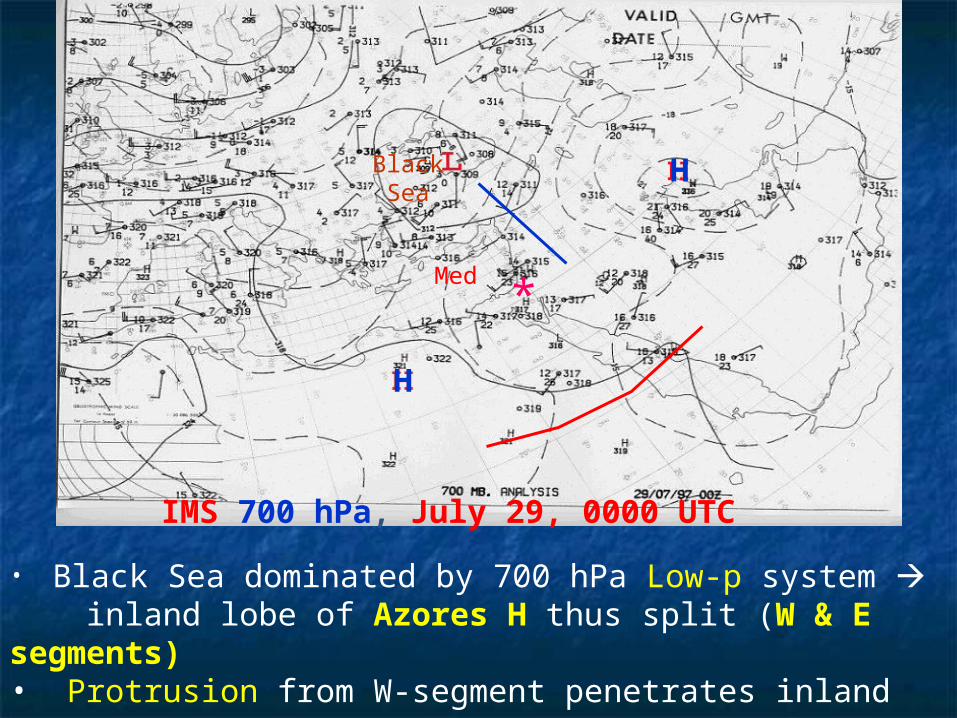
• Black Sea dominated by 700 hPa Low-p system inland lobe of Azores H thus split (W & E segments) • Protrusion from W-segment penetrates inland to
Western Saudi Arabia
IMS 700 hPa, July 29, 0000 UTC
*
H
H
Med
BlackSea
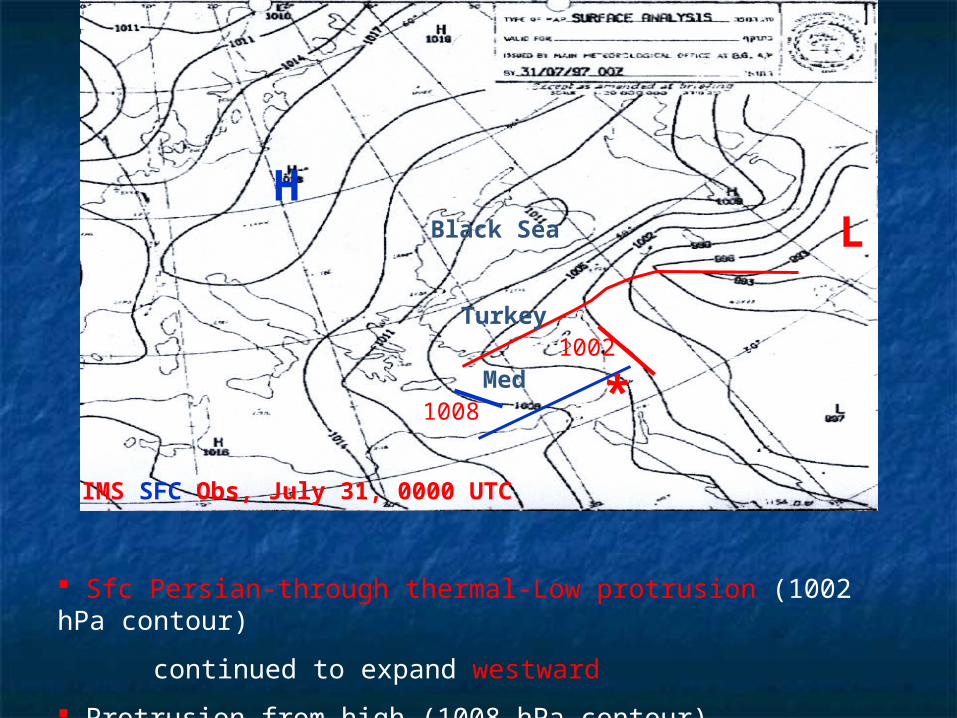
Sfc Persian-through thermal-Low protrusion (1002 hPa contour)
continued to expand westward
Protrusion from high (1008 hPa contour) retreated
IMS SFC Obs, July 31, 0000 UTC
LH
*Med1002
1008
Black Sea
Turkey
3 m /s
5 0 m2 5 0 m7 5 0 m1 0 0 0 m
Med
iterr
anea
n S e
a
3 4 .5 3 4 .8 3 5 .1 3 5 .4
L O N G IT U D E (D eg E )
1 0 m o b s sp eed (m /s) & O 3 a t 0 3 0 0 L S T o r 0 0 0 0 U T C o n 1 A u g
3 1 .5
3 1 .8
3 2 .1
3 2 .4
3 2 .7
3 3L
AT
ITU
DE
(D
eg N
)
H
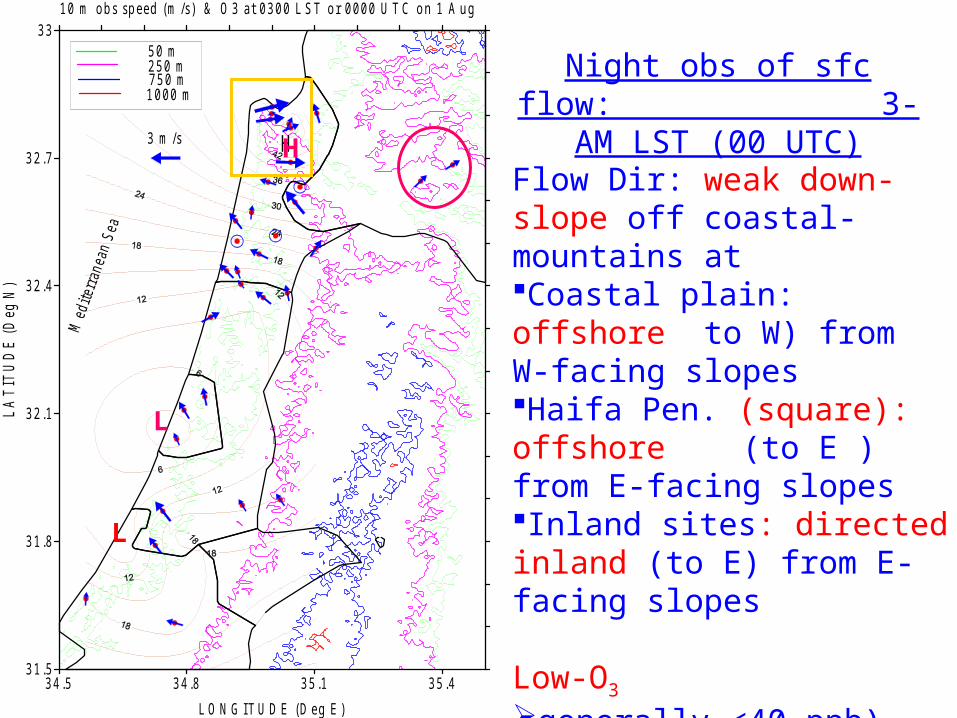
Flow Dir: weak down-slope off coastal-mountains atCoastal plain: offshore (to W) from W-facing slopesHaifa Pen. (square): offshore (to E ) from E-facing slopesInland sites: directed inland (to E) from E-facing slopes
Low-O3 generally <40 ppb)Haifa still at 51 ppb
Night obs of sfc flow: 3-AM LST (00 UTC)
L
L
H
3 4 .5 3 4 .8 3 5 .1 3 5 .4
L O N G IT U D E (D eg E )
1 0 m o b s sp eed (m /s) a t 1 2 0 0 L S T o r 0 9 0 0 U T C o n 1 A u g
3 1 .5
3 1 .8
3 2 .1
3 2 .4
3 2 .7
3 3L
AT
ITU
DE
(D
eg N
)
3 m /s
5 0 m2 5 0 m7 5 0 m1 0 0 0 m
Med
iterr
anea
n S e
a
H
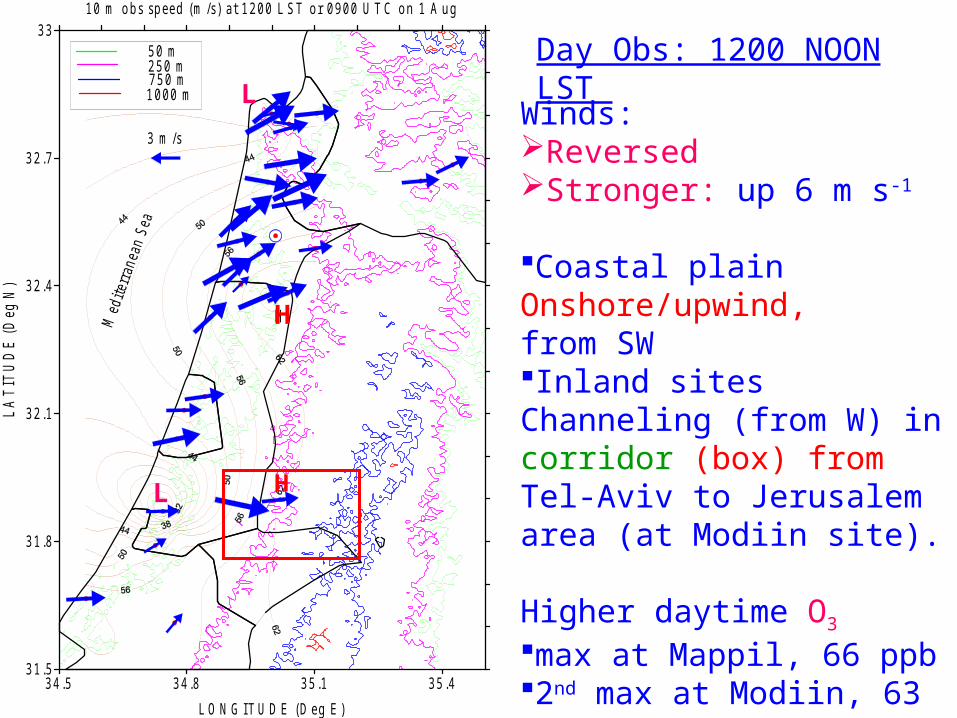
Winds: Reversed Stronger: up 6 m s-1
Coastal plain: Onshore/upwind, from SWInland sites: Channeling (from W) in corridor (box) from Tel-Aviv to Jerusalem area (at Modiin site). Higher daytime O3
max at Mappil, 66 ppb 2nd max at Modiin, 63 ppb
Day Obs: 1200 NOON LST
L
H
H
L
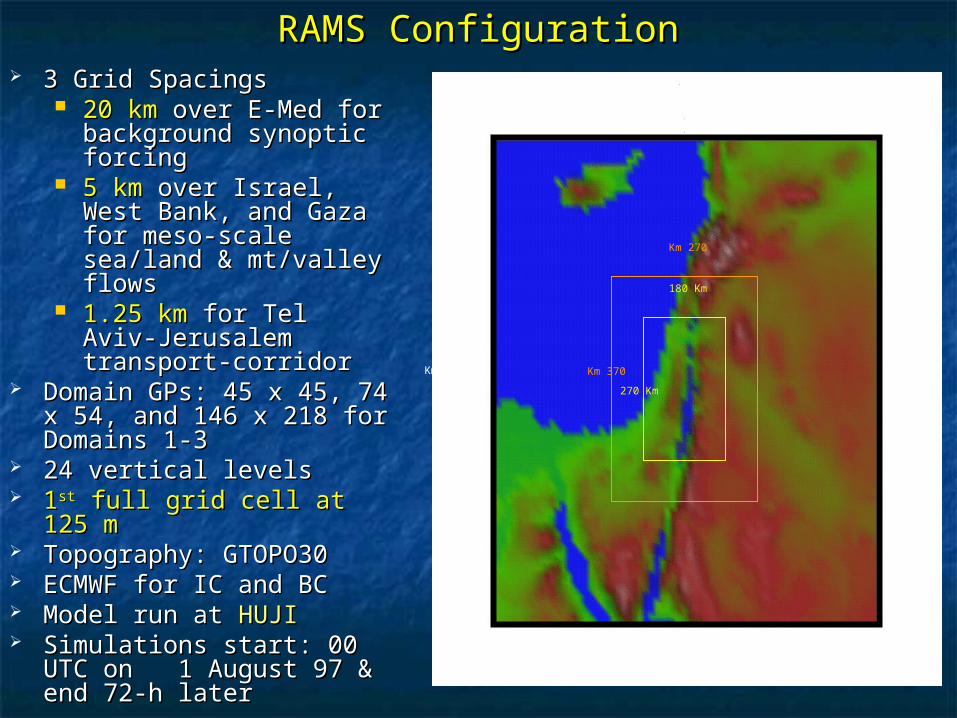
RAMSRAMS ConfigurationConfiguration 3 Grid Spacings3 Grid Spacings
20 km20 km over E-Med for over E-Med for background synoptic background synoptic forcingforcing
5 km5 km over Israel, West over Israel, West Bank, and Gaza for meso-Bank, and Gaza for meso-scale sea/land & mt/valley scale sea/land & mt/valley flowsflows
1.25 km1.25 km for Tel Aviv- for Tel Aviv-Jerusalem transport-Jerusalem transport-corridorcorridor
Domain GPs: 45 x 45, 74 x 54, Domain GPs: 45 x 45, 74 x 54, and 146 x 218 for Domains 1-3and 146 x 218 for Domains 1-3
24 vertical levels24 vertical levels 11stst full grid cell at 125 m full grid cell at 125 m Topography: GTOPO30 Topography: GTOPO30 ECMWF for IC and BCECMWF for IC and BC Model run at Model run at HUJIHUJI Simulations start: 00 UTC on Simulations start: 00 UTC on
1 August 97 & end 72-h later1 August 97 & end 72-h later
900 Km
270 Km
370 Km
180 Km
270 Km
900 Km
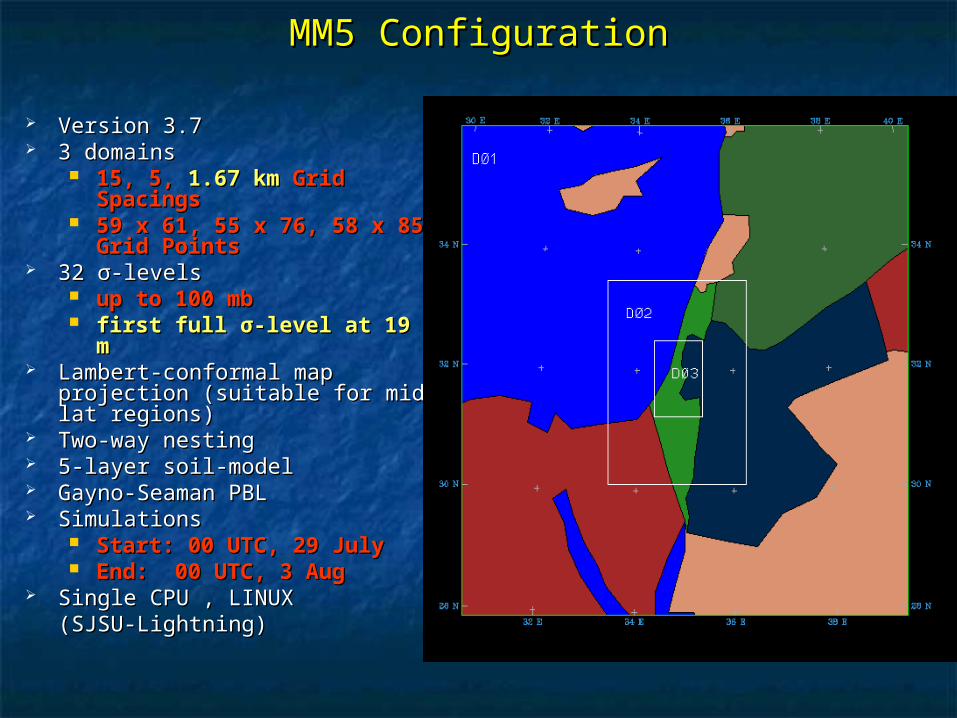
MM5 ConfigurationMM5 Configuration
Version 3.7Version 3.7 3 domains 3 domains
15, 5, 15, 5, 1.67 km1.67 km Grid Spacings Grid Spacings 59 x 61, 55 x 76, 58 x 85 Grid 59 x 61, 55 x 76, 58 x 85 Grid
PointsPoints 32 32 σσ--levelslevels
up to 100 mbup to 100 mb first full first full σσ--level at 19 mlevel at 19 m
Lambert-conformal map projection Lambert-conformal map projection (suitable for mid lat regions) (suitable for mid lat regions)
Two-way nesting Two-way nesting 5-layer soil-model5-layer soil-model Gayno-Seaman PBLGayno-Seaman PBL Simulations Simulations
Start: 00 UTC, 29 JulyStart: 00 UTC, 29 July End: 00 UTC, 3 Aug End: 00 UTC, 3 Aug
Single CPU , LINUX Single CPU , LINUX (SJSU-Lightning)(SJSU-Lightning)
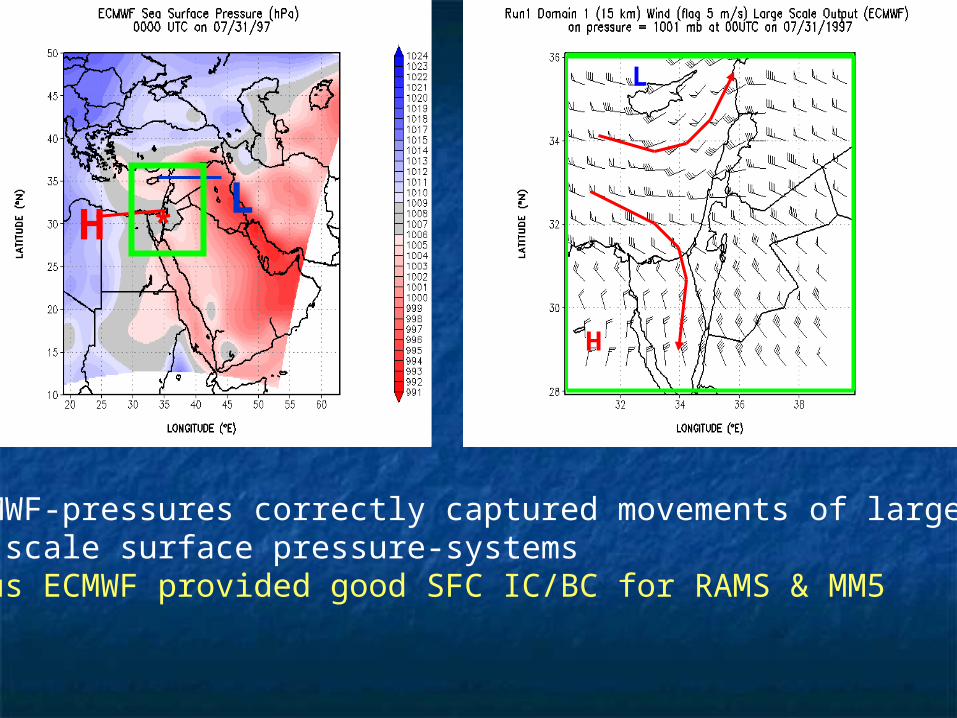
• ECMWF-pressures correctly captured movements of large- scale surface pressure-systems
• Thus ECMWF provided good SFC IC/BC for RAMS & MM5
LH *
L
H
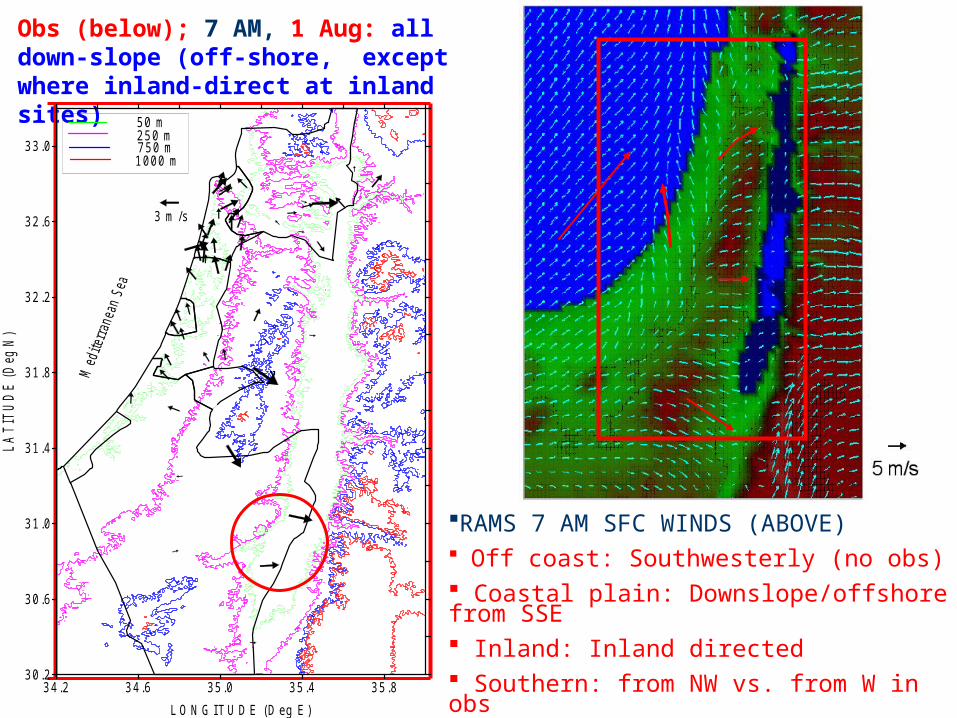
Obs (below); 7 AM, 1 Aug: all down-slope (off-shore, except where inland-direct at inland sites)
RAMS 7 AM SFC WINDS (ABOVE) Off coast: Southwesterly (no obs) Coastal plain: Downslope/offshore from SSE Inland: Inland directed Southern: from NW vs. from W in obs
RAMS
3 4 .2 3 4 .6 3 5 .0 3 5 .4 3 5 .8
L O N G IT U D E (D eg E )
3 0 .2
3 0 .6
3 1 .0
3 1 .4
3 1 .8
3 2 .2
3 2 .6
3 3 .0
LA
TIT
UD
E (
Deg
N)
3 m /s
5 0 m2 5 0 m7 5 0 m1 0 0 0 m
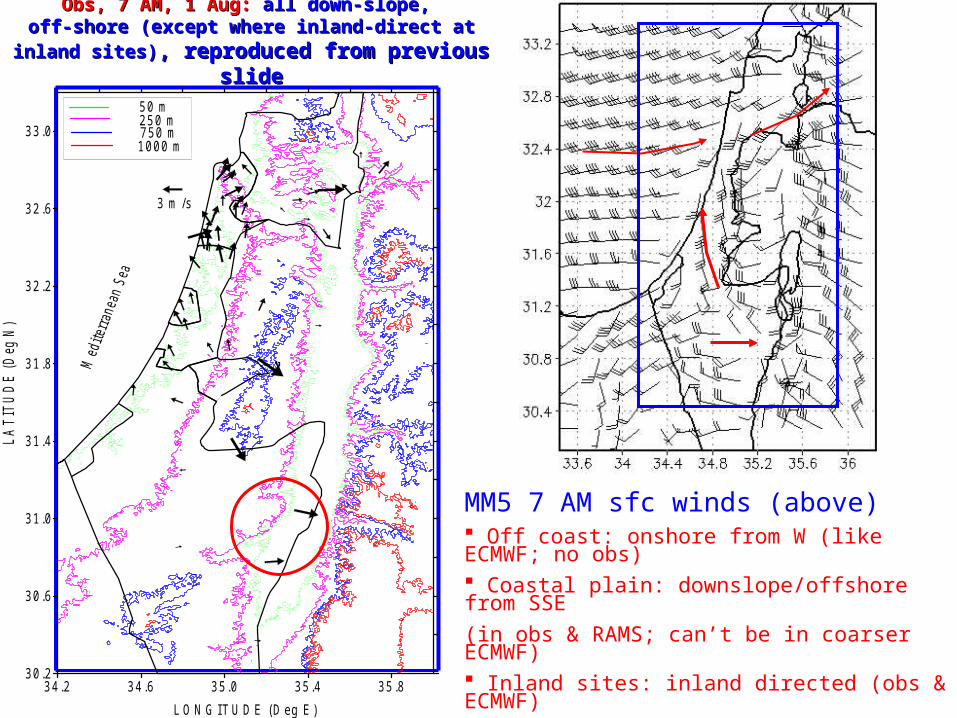
Obs, 7 AM, 1 Aug:Obs, 7 AM, 1 Aug: all down-slope, all down-slope, off-shore (except where inland-direct at off-shore (except where inland-direct at
inland sites)inland sites), reproduced from previous , reproduced from previous slideslide
MM5 7 AM sfc winds (above) Off coast: onshore from W (like ECMWF; no obs) Coastal plain: downslope/offshore from SSE
(in obs & RAMS; can’t be in coarser ECMWF) Inland sites: inland directed (obs & ECMWF) Southern: obs&MM5 are westerly; RAMS was NW
3 4 .2 3 4 .6 3 5 .0 3 5 .4 3 5 .8
L O N G IT U D E (D eg E )
3 0 .2
3 0 .6
3 1 .0
3 1 .4
3 1 .8
3 2 .2
3 2 .6
3 3 .0
LA
TIT
UD
E (
Deg
N)
3 m /s
5 0 m2 5 0 m7 5 0 m1 0 0 0 m
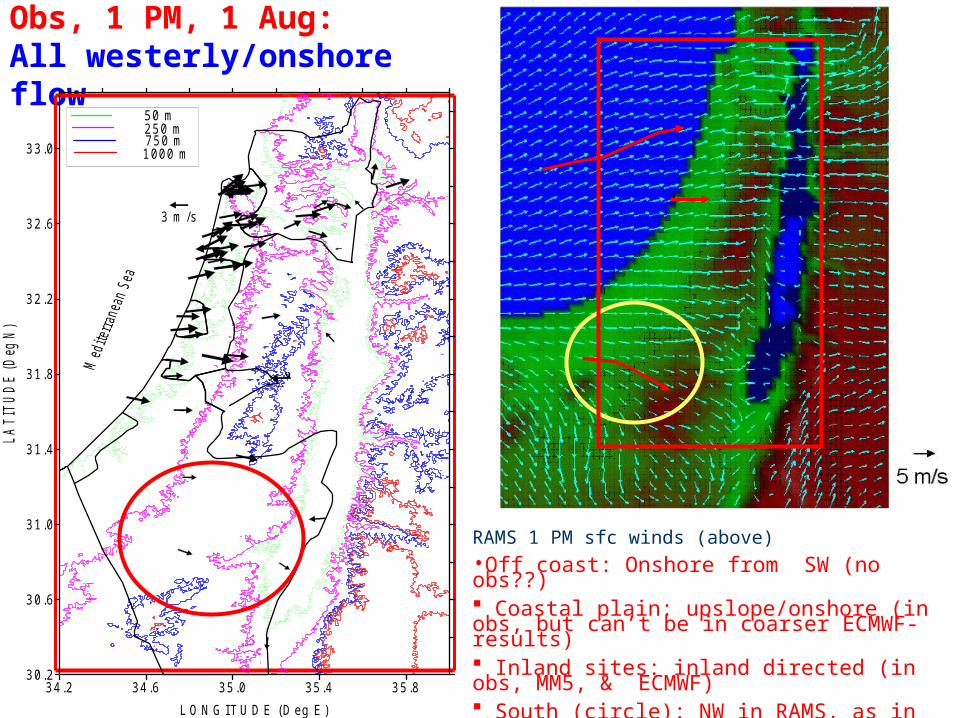
Obs, 1 PM, 1 Aug: All westerly/onshore flow
RAMS 1 PM sfc winds (above)•Off coast: Onshore from SW (no obs??) Coastal plain: upslope/onshore (in obs, but can’t be in coarser ECMWF-results) Inland sites: inland directed (in obs, MM5, & ECMWF) South (circle): NW in RAMS, as in obs
RAMS
3 4 .2 3 4 .6 3 5 .0 3 5 .4 3 5 .8
L O N G IT U D E (D eg E )
3 0 .2
3 0 .6
3 1 .0
3 1 .4
3 1 .8
3 2 .2
3 2 .6
3 3 .0
LA
TIT
UD
E (
Deg
N)
3 m /s
5 0 m2 5 0 m7 5 0 m1 0 0 0 m
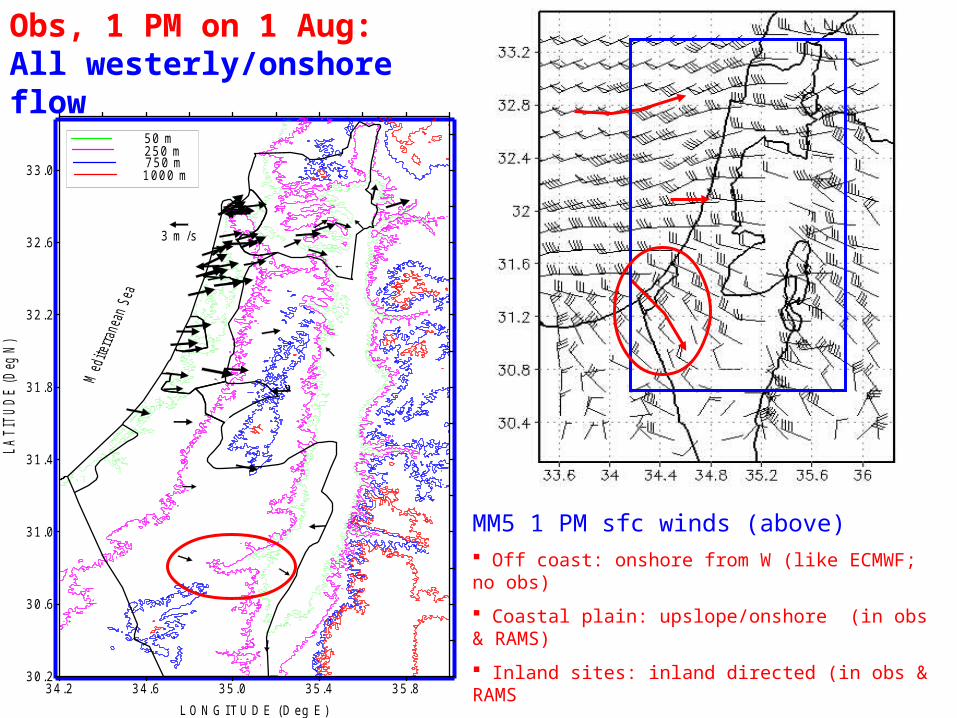
Obs, 1 PM on 1 Aug: All westerly/onshore flow
MM5 1 PM sfc winds (above) Off coast: onshore from W (like ECMWF; no obs)
Coastal plain: upslope/onshore (in obs & RAMS)
Inland sites: inland directed (in obs & RAMS
South (circle): NW (in RAMS & Obs)3 4 .2 3 4 .6 3 5 .0 3 5 .4 3 5 .8
L O N G IT U D E (D eg E )
3 0 .2
3 0 .6
3 1 .0
3 1 .4
3 1 .8
3 2 .2
3 2 .6
3 3 .0
LA
TIT
UD
E (
Deg
N)
3 m /s
5 0 m2 5 0 m7 5 0 m1 0 0 0 m
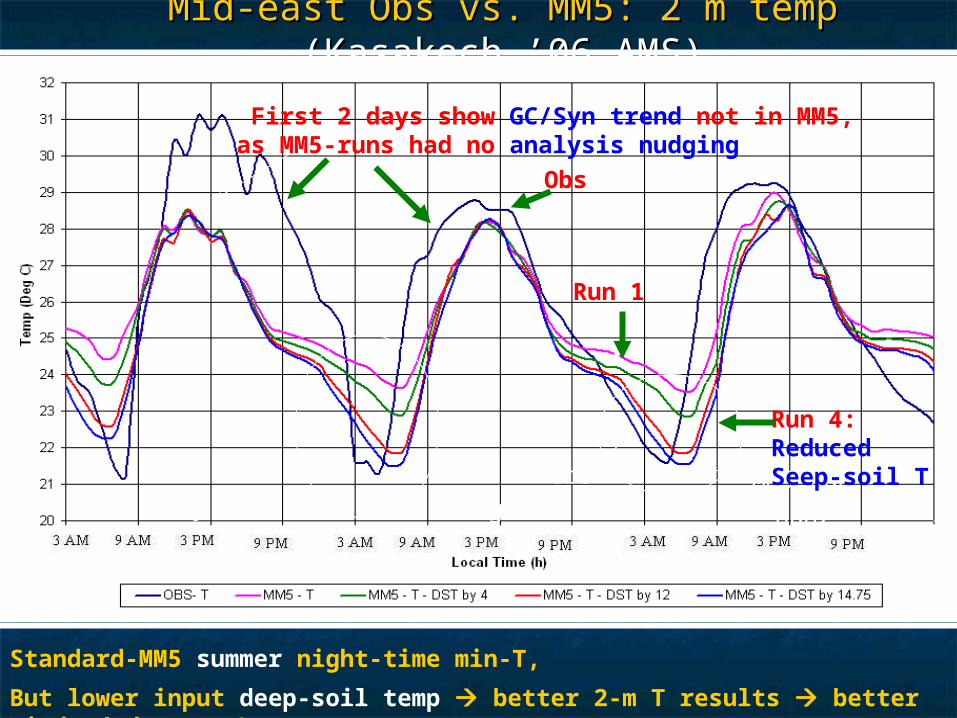
Mid-east Obs vs. MM5: 2 m tempMid-east Obs vs. MM5: 2 m temp (Kasakech ’06 (Kasakech ’06 AMS)AMS)
July 29 August 1 August 2
July 31 Aug 1 Aug2
Standard-MM5 summer night-time min-T,
But lower input deep-soil temp better 2-m T results better winds better O3
obs
Run 1
MM5:Run 4
Obs
Run 4:ReducedSeep-soil T
First 2 days show GC/Syn trend not in MM5, as MM5-runs had no analysis nudging
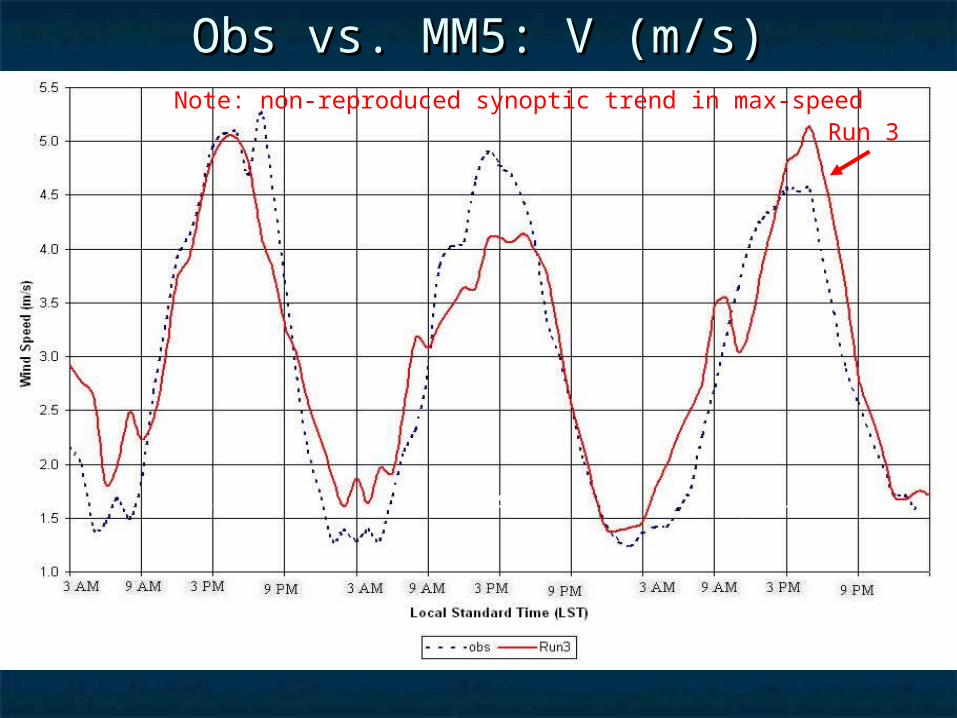
Obs vs. MM5: V (m/s)Obs vs. MM5: V (m/s)
July 31 August 1 August 2
OBS
Run 3Note: non-reproduced synoptic trend in max-speed

Emission Inventory: 1997-8Emission Inventory: 1997-8
1515 Large StationaryLarge Stationary (point) sources (58% (point) sources (58% fuel consumption)fuel consumption)
400400 Medium StationaryMedium Stationary (point) sources (point) sources (7%)(7%)
Small StationarySmall Stationary (area) sources (12%) (area) sources (12%) SolventsSolvents (area) sources (area) sources Biogenic StationaryBiogenic Stationary (area) sources (area) sources
(isoprene and monoterpene)(isoprene and monoterpene) Mobile (area) sourcesMobile (area) sources, both ground based , both ground based
and aerial (22%)and aerial (22%)

Jerusalem
Flight Path
0
0-20
20-40
40-60
60-70
70-80
80-90
90-95
95-105
105-120
O3 ppb
1 Aug, 1500 LST
RAMS/CAMx (left) ORAMS/CAMx (left) O33 vs. airborne Obs (right) at 300 m: vs. airborne Obs (right) at 300 m:
> Secondary-max: over Jerusalem; in obs (but underestimated by 15%) > Secondary-max: over Jerusalem; in obs (but underestimated by 15%) from coastal N-S highway sources from coastal N-S highway sources
> Primary-max: found in Jordan (no obs) from Hadera power-plant > Primary-max: found in Jordan (no obs) from Hadera power-plant
Irbid,Jordan
Hadera Power Plant
.

All emission sources
1.8.97 15:00
0
0-20
20-40
40-60
60-70
70-80
80-90
90-95
95-105
105-120
LegendO3 ppb
All industry sources Without industry sources
1.8.97 15:00 1.8.97 15:00
> All emission sources (see below, left & previous slide)> All emission sources (see below, left & previous slide)
> All industry sources (see below center)> All industry sources (see below center)
> Main (tall-stack) industry sources> Main (tall-stack) industry sources
> Medium and small (low-stack) industry> Medium and small (low-stack) industry
> Without Industry (only Vehicles, Solvents & Vegetation) (below > Without Industry (only Vehicles, Solvents & Vegetation) (below right)right)
> Vehicles only > Vehicles only
> Without vehicles (only all-Industry, Solvents & Vegetation)> Without vehicles (only all-Industry, Solvents & Vegetation)
> Without emissions (only IC and BC)> Without emissions (only IC and BC)
300 m CAMx ozone from 3 of the 8Emission Input Scenarios (below)
1.8.97 15:00
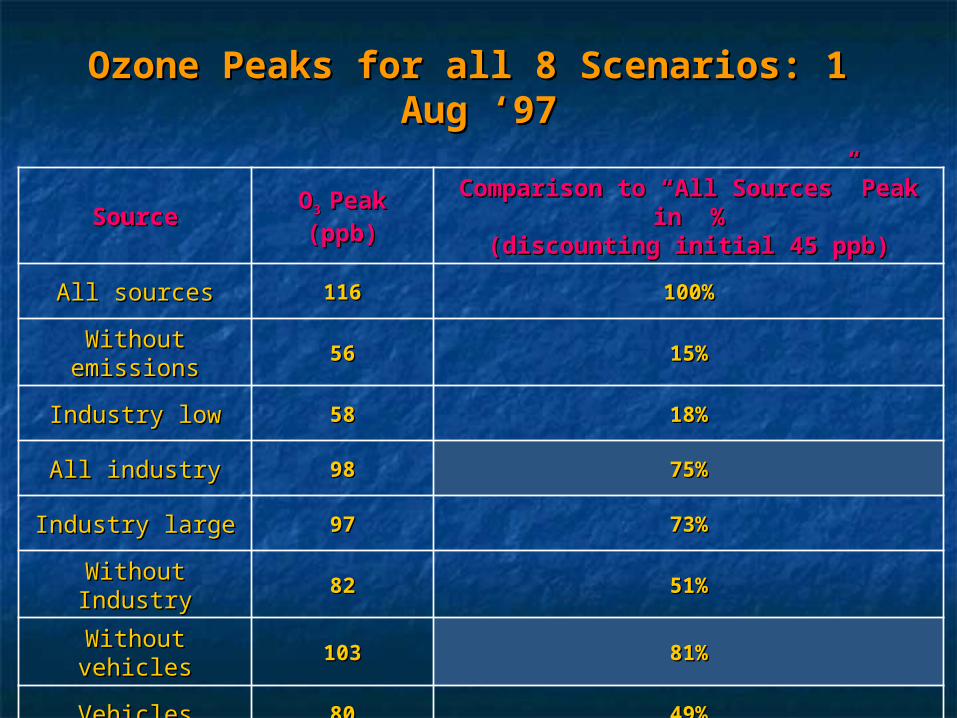
Ozone Peaks for all 8 Scenarios: 1 Aug Ozone Peaks for all 8 Scenarios: 1 Aug ‘97‘97
SourceSourceOO3 3 PeakPeak(ppb)(ppb)
Comparison to “All Sources” Peak Comparison to “All Sources” Peak in %in %
(discounting initial 45 ppb)(discounting initial 45 ppb)
All sourcesAll sources 116116 100%100%
Without Without emissionsemissions
5656 15%15%
Industry lowIndustry low 5858 18%18%
All industryAll industry 9898 75%75%
Industry largeIndustry large 9797 73%73%
Without IndustryWithout Industry 8282 51%51%
Without vehiclesWithout vehicles 103103 81%81%
VehiclesVehicles 8080 49%49%

SUMMARY (1 of 2)SUMMARY (1 of 2) Synoptic-obs during a summer sfc Persian-Trough period Synoptic-obs during a summer sfc Persian-Trough period
700 hPa 700 hPa LL moved moved southwardsouthward over area over area
Azores High retreatedAzores High retreated Sfc-LSfc-L moved to moved to WW reduced-subsidence from high reduced-subsidence from high
inversion-base raised inversion-base raised Persian sfc-L was Persian sfc-L was N of (not over) areaN of (not over) area
typical (but, not episode) sfc Otypical (but, not episode) sfc O33-levels -levels Meso-obs showedMeso-obs showed
Meso (daytime Mt/sea + nighttime valley/land) Meso (daytime Mt/sea + nighttime valley/land) breezes breezes JerusalemJerusalem OO33-max: from inland-transport of coastal -max: from inland-transport of coastal
auto-emissionsauto-emissions
SUMMARY (cont.)SUMMARY (cont.)
Model-results showedModel-results showed RAMS & MM5RAMS & MM5 reproduced surface-flows reproduced surface-flows
Daytime sea breeze and upslope flowsDaytime sea breeze and upslope flows Nighttime land breeze and downslope flowsNighttime land breeze and downslope flows
CAMx/RAMSCAMx/RAMS Reproduced obs Reproduced obs JerusalemJerusalem OO33-max (due to coastal-autos)-max (due to coastal-autos) Showed even larger (previously-unknown) max over Showed even larger (previously-unknown) max over
Jordan Jordan (due to Hadera power-plant emissions) (due to Hadera power-plant emissions)
CURRENT & FUTURE WORKCURRENT & FUTURE WORK
Improved MM5-simulationsImproved MM5-simulations FDDA analysis nudging to better FDDA analysis nudging to better
capture synoptic trendscapture synoptic trends Move to urbanized (next talk): uMM5 & uWRF Move to urbanized (next talk): uMM5 & uWRF
Compare RAMS & MM5Compare RAMS & MM5 Inputs to CAMxInputs to CAMx Verify sfc & PBL transport-patternsVerify sfc & PBL transport-patterns
New USAID/MERC obs & modeling projects withNew USAID/MERC obs & modeling projects with Jordan (started June 2007)Jordan (started June 2007) Lebanon (pre-proposal invited for Dec 2007)Lebanon (pre-proposal invited for Dec 2007)
Key ReferencesKey References Matveev, V., et al.,Matveev, V., et al., 2002: Long-range trans-portation of 2002: Long-range trans-portation of
air pollutants from Europe to Israel. air pollutants from Europe to Israel. Isr. J. Earth Sci.Isr. J. Earth Sci., , 5151, , 17-28.17-28.
Doron, E., and J. Neumann,Doron, E., and J. Neumann, 1977: Land and mountain 1977: Land and mountain breezes with special attention to breezes with special attention to Israel’s Mediterranean Israel’s Mediterranean coastal plain. coastal plain. Israel Meteor. Israel Meteor. Res. PapersRes. Papers, , 11, 109-122., 109-122.
Dayan, U., and L. Koch,Dayan, U., and L. Koch, 1996: Ozone concentration 1996: Ozone concentration profiles in the LA Basin – A possible similarity in the profiles in the LA Basin – A possible similarity in the build-up mechanism of inland surface ozone in Israel. build-up mechanism of inland surface ozone in Israel. JAMJAM, , 3535, 1085-90., 1085-90.
Ranmar, D., et al.,Ranmar, D., et al., 2002: Impact of coastal 2002: Impact of coastal transportation emissions on inland air pollution over transportation emissions on inland air pollution over Israel: utilizing numerical simulations, airborne Israel: utilizing numerical simulations, airborne measurements, and synoptic analyses. measurements, and synoptic analyses. JGRJGR, , 107107..
Weinroth, E.,Weinroth, E., 2004: RAMS/CAMx modeling. Ph.D. 2004: RAMS/CAMx modeling. Ph.D. dissertation, HUJI, 127 pp.dissertation, HUJI, 127 pp.

Thanks… Thanks…
Questions ?Questions ?