Embed Size (px)
Citation preview

VOLUME 9
SECTION 6: SUMMARY OF CAMPP RESULTS
SECTION 7: REFERENCES
Reference listing:
Coordinated Aquatic Monitoring Program (CAMP). 2014. Three Year Summary Report (2008-2010). Report prepared for the Manitoba/Manitoba Hydro MOU Working Group by North/South Consultants Inc., Winnipeg, MB.

SECTION 6: SUMMARY OF CAMPP RESULTS

CAMPP Three Year Summary Report Volume 9
6-i
TABLE OF CONTENTS
Page 6-x
6.0 SUMMARY OF CAMPP RESULTS ...........................................................1
6.1 HYDROLOGY ..................................................................................................1
6.2 WATER QUALITY...........................................................................................3
6.2.1 On-System Waterbodies ........................................................................3
6.2.1.1 Limnology ...............................................................................3
6.2.1.2 Routine Parameters .................................................................4
6.2.1.3 Trophic Status .........................................................................6
6.2.1.4 Escherichia coli ......................................................................8
6.2.1.5 Metals and Major Ions ............................................................8
6.2.2 Off-System Waterbodies ......................................................................10
6.2.2.1 Limnology .............................................................................10
6.2.2.2 Routine Parameters ...............................................................11
6.2.2.3 Trophic Status .......................................................................11
6.2.2.4 Escherichia coli ....................................................................12
6.2.2.5 Metals and Major Ions ..........................................................12
6.3 PHYTOPLANKTON .......................................................................................55
6.3.1 Chlorophyll a .......................................................................................55
6.3.2 Taxonomic Composition and Biomass ................................................56
6.3.3 Phytoplankton Blooms .........................................................................57
6.3.4 Microcystin ..........................................................................................57
6.3.5 Trophic Status ......................................................................................58
6.4 BENTHIC MACROINVERTEBRATES ........................................................71
6.4.1 On-System Waterbodies ......................................................................71
6.4.1.1 Intermittently Wetted Nearshore Aquatic Habitat ................71
6.4.1.2 Predominantly Wetted Nearshore Aquatic Habitat ..............75
6.4.1.3 Offshore Aquatic Habitat ......................................................77
6.4.2 Off-system Waterbodies ......................................................................79
6.5 FISH COMMUNITIES ..................................................................................109
6.5.1 Species Composition ..........................................................................109
6.5.2 Catch Per Unit Effort .........................................................................110
CAMPP Three Year Summary Report Volume 9
6-ii
Page 6-x
6.5.3 Fork Length Variation........................................................................112
6.5.4 Growth ...............................................................................................113
6.5.5 Deformities, Erosion, Lesions, and Tumours (DELTs) .....................114
6.5.6 Index of Biotic Integrity.....................................................................115
6.5.7 Off-system Waterbodies ....................................................................116
6.6 FISH MERCURY ..........................................................................................133
6.6.1 Relationship Between Mercury Concentration and Fish Size ...........133
6.6.2 Comparisons of Mercury Concentrations Between Waterbodies
Within Species ...................................................................................134
6.6.2.1 Lake Whitefish ....................................................................134
6.6.2.2 Northern Pike ......................................................................135
6.6.2.3 Walleye ...............................................................................136
6.6.2.4 Yellow Perch.......................................................................137
6.6.2.5 Lake Sturgeon .....................................................................137
6.6.3 Comparisons Between Regions and Between On-System and Off-
System Waterbodies...........................................................................138
6.6.3.1 Comparisons Between Regions ..........................................138
6.6.3.2 Comparison Between On- and Off-System Waterbodies ...139
6.6.4 Comparison of Mercury Concentrations to Consumption
Guidelines ..........................................................................................140
CAMPP Three Year Summary Report Volume 9
6-iii
LIST OF TABLES
Page 6-x
Table 6.2-1. Water quality summary: Winnipeg River Region. ....................................14
Table 6.2-2. Water quality summary: Saskatchewan River Region...............................15
Table 6.2-3. Water quality summary: Upper Churchill River Region. ..........................16
Table 6.2-4. Water quality summary: Lower Churchill River Region. ..........................17
Table 6.2-5. Water quality summary: Churchill River Diversion Region. ....................18
Table 6.2-6. Water quality summary: Upper Nelson River Region. ..............................19
Table 6.2-7. Water quality summary: Lower Nelson River Region. .............................20
Table 6.2-8. Trophic categorization schemes applied for lakes and reservoirs. ............21
Table 6.2-9. Trophic status of CAMPP lakes and reservoirs based on mean open-
water season total phosphorus (TP), total nitrogen (TN), and
chlorophyll a concentrations and Secchi disk depth. .................................22
Table 6.2-10. Trophic categorization schemes applied for CAMPP river sites. ..............23
Table 6.2-11. Trophic status of CAMPP rivers based on mean open-water season
total phosphorus (TP), total nitrogen (TN), and chlorophyll a
concentrations. ...........................................................................................24
Table 6.3-1. Phytoplankton summary: Winnipeg River Region. ...................................59
Table 6.3-2. Phytoplankton summary: Saskatchewan River Region. ............................59
Table 6.3-3. Phytoplankton summary: Upper Churchill River Region. .........................60
Table 6.3-4. Phytoplankton summary: Lower Churchill River Region. ........................60
Table 6.3-5. Phytoplankton summary: Churchill River Diversion Region. ...................61
Table 6.3-6. Phytoplankton summary: Upper Nelson River Region. ............................61
Table 6.3-7. Phytoplankton summary: Lower Nelson River Region. ............................62
Table 6.4-1. Benthic macroinvertebrate summary: Winnipeg River Region. ................82
Table 6.4-2. Benthic macroinvertebrate summary: Saskatchewan River Region. .........83
Table 6.4-3. Benthic macroinvertebrate summary: Upper Churchill River Region. .....84
CAMPP Three Year Summary Report Volume 9
6-iv
Page 6-x
Table 6.4-4. Benthic macroinvertebrate summary: Lower Churchill River Region. .....85
Table 6.4-5. Benthic macroinvertebrate summary: Churchill River Diversion
Region. .......................................................................................................87
Table 6.4-6. Benthic macroinvertebrate summary: Upper Nelson River Region. .........88
Table 6.4-7. Benthic macroinvertebrate summary: Lower Nelson River Region. .........89
Table 6.5-1. Average metric scores and total IBI scores for CAMPP waterbodies
grouped by region and system status (on- versus off- system
waterbodies). ............................................................................................117
Table 6.6-1. Numbers (n) and percentages (%) of fish exceeding mercury
concentration guideline values and standards regarding human
consumption or the protection of wildlife consumers of aquatic biota. ...142
LIST OF FIGURES
Page 6-x
Figure 6.2-1. Mean (±SE) of Secchi disk depths measured across the seven sampling
regions (Lake Winnipeg Region excluded) for the open-water season. ....25
Figure 6.2-2. Mean (±SE) total suspended solids (TSS) concentrations measured in
the Winnipeg River (WRR), Saskatchewan River (SRR), Upper
Churchill River (UCRR), Lower Churchill River (LCRR), Churchill
River Diversion (CRDR), Upper Nelson River (UNRR), and Lower
Nelson River regions (LNRR). ..................................................................26
Figure 6.2-3. Mean (±SE) turbidity measured in the Winnipeg River (WRR),
Saskatchewan River (SRR), Upper Churchill River (UCRR), Lower
Churchill River (LCRR), Churchill River Diversion (CRDR), Upper
Nelson River (UNRR), and Lower Nelson River regions (LNRR). ..........27
Figure 6.2-4. Linear regressions between total suspended solids (TSS) and
laboratory turbidity in: (A) on-system lakes, reservoirs, and rivers
across the seven sampling regions (Lake Winnipeg Region excluded),
excluding two outliers; and (B) off-system lakes and rivers. ....................28
CAMPP Three Year Summary Report Volume 9
6-v
Page 6-x
Figure 6.2-5. Mean (±SE) true colour levels measured in the Winnipeg River
(WRR), Saskatchewan River (SRR), Upper Churchill River (UCRR),
Lower Churchill River (LCRR), Churchill River Diversion (CRDR),
Upper Nelson River (UNRR), and Lower Nelson River regions
(LNRR). .....................................................................................................29
Figure 6.2-6. Mean (±SE) dissolved organic carbon concentrations measured in the
Winnipeg River (WRR), Saskatchewan River (SRR), Upper Churchill
River (UCRR), Lower Churchill River (LCRR), Churchill River
Diversion (CRDR), Upper Nelson River (UNRR), and Lower Nelson
River regions (LNRR)................................................................................30
Figure 6.2-7. Mean (±SE) hardness measured in the Winnipeg River (WRR),
Saskatchewan River (SRR), Upper Churchill River (UCRR), Lower
Churchill River (LCRR), Churchill River Diversion (CRDR), Upper
Nelson River (UNRR), and Lower Nelson River regions (LNRR). ..........31
Figure 6.2-8. Mean (±SE) pH (laboratory) measured in the Winnipeg River (WRR),
Saskatchewan River (SRR), Upper Churchill River (UCRR), Lower
Churchill River (LCRR), Churchill River Diversion (CRDR), Upper
Nelson River (UNRR), and Lower Nelson River regions (LNRR).. .........32
Figure 6.2-9. Mean (±SE) conductivity (laboratory) measured in the Winnipeg River
(WRR), Saskatchewan River (SRR), Upper Churchill River (UCRR),
Lower Churchill River (LCRR), Churchill River Diversion (CRDR),
Upper Nelson River (UNRR), and Lower Nelson River regions
(LNRR). .....................................................................................................33
Figure 6.2-10. Mean (±SE) total phosphorus (all sampling periods) in the Winnipeg
River (WRR), Saskatchewan River (SRR), Upper Churchill River
(UCRR), Lower Churchill River (LCRR), Churchill River Diversion
(CRDR), Upper Nelson River (UNRR), and Lower Nelson River
regions (LNRR) .........................................................................................34
Figure 6.2-11. Mean (±SE) total nitrogen (all sampling periods) in the Winnipeg
River (WRR), Saskatchewan River (SRR), Upper Churchill River
(UCRR), Lower Churchill River (LCRR), Churchill River Diversion
(CRDR), Upper Nelson River (UNRR), and Lower Nelson River
regions (LNRR). ........................................................................................35
Figure 6.2-12. Mean (±SE) total nitrogen to total phosphorus molar ratios in the
Winnipeg River (WRR), Saskatchewan River (SRR), Upper Churchill
River (UCRR), Lower Churchill River (LCRR), Churchill River
Diversion (CRDR), Upper Nelson River (UNRR), and Lower Nelson
River regions (LNRR)................................................................................36
CAMPP Three Year Summary Report Volume 9
6-vi
Page 6-x
Figure 6.2-13. Mean (±SE) total phosphorus measured in the open-water seasons in
the Winnipeg River (WRR), Saskatchewan River (SRR), Upper
Churchill River (UCRR), Lower Churchill River (LCRR), Churchill
River Diversion (CRDR), Upper Nelson River (UNRR), and Lower
Nelson River regions (LNRR).. .................................................................37
Figure 6.2-14. Trophic status of lakes and rivers based on mean total phosphorus
concentrations (open-water seasons) from 2008/2009 through
2010/2011. .................................................................................................38
Figure 6.2-15. Mean (±SE) chlorophyll a measured in the open-water seasons in lakes
and reservoirs in the Winnipeg River (WRR), Saskatchewan River
(SRR), Upper Churchill River (UCRR), Lower Churchill River
(LCRR), Churchill River Diversion (CRDR), Upper Nelson River
(UNRR), and Lower Nelson River regions (LNRR). ................................39
Figure 6.2-16. Trophic status of lakes based on mean chlorophyll a concentrations
(open-water seasons) from 2008/2009 through 2010/2011. ......................40
Figure 6.2-17. Linear regressions between (A) total phosphorus (TP) and chlorophyll
a, and (B) total suspended solids (TSS) and TP for on-system lakes
and reservoirs across the seven sampling regions (Lake Winnipeg
Region excluded).. .....................................................................................41
Figure 6.2-18. Mean (±SE) total nitrogen measured in the open-water seasons in lakes
and reservoirs in the Winnipeg River (WRR), Saskatchewan River
(SRR), Upper Churchill River (UCRR), Lower Churchill River
(LCRR), Churchill River Diversion (CRDR), Upper Nelson River
(UNRR), and Lower Nelson River regions (LNRR). ................................42
Figure 6.2-19. Trophic status of lakes based on mean total nitrogen concentrations
(open-water seasons) from 2008/2009 through 2010/2011. ......................43
Figure 6.2-20. Linear regression between open-water season total nitrogen and
chlorophyll a from on-system lakes and reservoirs across the seven
sampling regions (Lake Winnipeg Region excluded). ...............................44
Figure 6.2-21. Linear regressions between (A) Secchi disk depth and chlorophyll a,
(B) total suspended solids and Secchi disk depth, and (C) turbidity and
Secchi disk depth. ......................................................................................45
Figure 6.2-22. Mean (±SE) concentrations of calcium (Ca), magnesium (Mg),
potassium (K), and sodium (Na) in the Winnipeg River (WRR),
Saskatchewan River (SRR), Upper Churchill River (UCRR), Lower
Churchill River (LCRR), Churchill River Diversion (CRDR), Upper
Nelson River (UNRR), and Lower Nelson River regions (LNRR). ..........46
CAMPP Three Year Summary Report Volume 9
6-vii
Page 6-x
Figure 6.2-23. Mean (±SE) chloride concentrations in the Winnipeg River (WRR),
Saskatchewan River (SRR), Upper Churchill River (UCRR), Lower
Churchill River (LCRR), Churchill River Diversion (CRDR), Upper
Nelson River (UNRR), and Lower Nelson River regions (LNRR). ..........47
Figure 6.2-24. Mean (±SE) sulphate concentrations in the Winnipeg River (WRR),
Saskatchewan River (SRR), Upper Churchill River (UCRR), Lower
Churchill River (LCRR), Churchill River Diversion (CRDR), Upper
Nelson River (UNRR), and Lower Nelson River regions (LNRR). ..........48
Figure 6.2-25. Mean (±SE) aluminum concentrations measured in the Winnipeg
River (WRR), Saskatchewan River (SRR), Upper Churchill River
(UCRR), Lower Churchill River (LCRR), Churchill River Diversion
(CRDR), Upper Nelson River (UNRR), and Lower Nelson River
regions (LNRR). ........................................................................................49
Figure 6.2-26. Mean (±SE) iron concentrations measured in the Winnipeg River
(WRR), Saskatchewan River (SRR), Upper Churchill River (UCRR),
Lower Churchill River (LCRR), Churchill River Diversion (CRDR),
Upper Nelson River (UNRR), and Lower Nelson River regions
(LNRR). .....................................................................................................50
Figure 6.2-27. Linear regressions between (A) Secchi disk depth and chlorophyll a,
(B) TSS and Secchi disk depth, and (C) turbidity and Secchi disk
depth for off-system lakes across the seven sampling regions (Lake
Winnipeg Region excluded). .....................................................................51
Figure 6.2-28. Linear regressions between (A) total phosphorus (TP) and chlorophyll
a, and (B) total suspended solids (TSS) and TP for off-system lakes
across the seven sampling regions (Lake Winnipeg Region excluded). ....52
Figure 6.2-29. Linear regression between open-water season total nitrogen and
chlorophyll a from off-system lakes across the seven sampling regions
(Lake Winnipeg Region excluded). ...........................................................53
Figure 6.3-1. Mean (±SE) chlorophyll a (annual) measured in waterbodies in the
Winnipeg River (WRR), Saskatchewan River (SRR), Upper Churchill
River (UCRR), Lower Churchill River (LCRR), Churchill River
Diversion (CRDR), Upper Nelson River (UNRR), and Lower Nelson
River regions (LNRR)................................................................................63
Figure 6.3-2. Linear regressions between chlorophyll a and phytoplankton biomass
in: (A) on-system lakes and reservoirs across the seven sampling
regions (Lake Winnipeg Region excluded); and, (B) off-system lakes. ....64
CAMPP Three Year Summary Report Volume 9
6-viii
Page 6-x
Figure 6.3-3. Mean (±SE) phytoplankton biomass (open-water season) measured in
waterbodies in the Winnipeg River (WRR), Saskatchewan River
(SRR), Upper Churchill River (UCRR), Lower Churchill River
(LCRR), Churchill River Diversion (CRDR), Upper Nelson River
(UNRR), and Lower Nelson River regions (LNRR). ................................65
Figure 6.3-4. Mean relative biomass (open-water season) of phytoplankton groups
measured in waterbodies in the Winnipeg River (WRR), Saskatchewan
River (SRR), Upper Churchill River (UCRR), Lower Churchill River
(LCRR), Churchill River Diversion (CRDR), Upper Nelson River
(UNRR), and Lower Nelson River regions (LNRR). ................................66
Figure 6.3-5. Mean diversity of phytoplankton communities in waterbodies in the
Winnipeg River (WRR), Saskatchewan River (SRR), Upper Churchill
River (UCRR), Lower Churchill River (LCRR), Churchill River
Diversion (CRDR), Upper Nelson River (UNRR), and Lower Nelson
River regions (LNRR)................................................................................67
Figure 6.3-6. Mean effective richness of phytoplankton communities in waterbodies
in the Winnipeg River (WRR), Saskatchewan River (SRR), Upper
Churchill River (UCRR), Lower Churchill River (LCRR), Churchill
River Diversion (CRDR), Upper Nelson River (UNRR), and Lower
Nelson River regions (LNRR). ..................................................................68
Figure 6.3-7. Relative biomass (%) and total biomass (mg/m3) of phytoplankton
groups measured during bloom conditions (i.e., when chlorophyll a >
10 µg/L) in CAMPP waterbodies. .............................................................69
Figure 6.4-1. Mean (±SE) total number of macroinvertebrates from nearshore
kicknet samples collected across the seven sampling regions (Lake
Winnipeg excluded). ..................................................................................91
Figure 6.4-2. Mean (±SE) total number of EPT (Ephemeroptera, Trichoptera, and
Plecoptera) from nearshore kicknet samples collected across the seven
sampling regions (Lake Winnipeg excluded). ...........................................92
Figure 6.4-3. Mean (±SE) EPT:C (ratio of Ephemeroptera, Trichoptera, and
Plecoptera to Chironomidae) from nearshore kicknet samples collected
across the seven sampling regions (Lake Winnipeg excluded). ................93
Figure 6.4-4. Mean (±SE) taxonomic richness (number of families) from nearshore
kicknet samples collected across the seven sampling regions (Lake
Winnipeg excluded). ..................................................................................94
CAMPP Three Year Summary Report Volume 9
6-ix
Page 6-x
Figure 6.4-5. Mean (±SE) Simpson’s diversity index from nearshore kicknet
samples collected across the seven sampling regions (Lake Winnipeg
excluded) ....................................................................................................95
Figure 6.4-6. Mean (±SE) Hill’s effective richness from nearshore kicknet samples
collected across the seven sampling regions (Lake Winnipeg excluded) ..96
Figure 6.4-7. Mean (±SE) total number of macroinvertebrates from nearshore grab
samples collected across the seven sampling regions (Lake Winnipeg
excluded). ...................................................................................................97
Figure 6.4-8. Mean (±SE) total number of EPT (Ephemeroptera, Trichoptera, and
Plecoptera) from nearshore grab samples collected across the seven
sampling regions (Lake Winnipeg excluded). ...........................................98
Figure 6.4-9. Mean (±SE) EPT:C (ratio of Ephemeroptera, Trichoptera, and
Plecoptera to Chironomidae) from nearshore grab samples collected
across the seven sampling regions (Lake Winnipeg excluded). ................99
Figure 6.4-10. Mean (±SE) taxonomic richness (number of families) from nearshore
grab samples collected across the seven sampling regions (Lake
Winnipeg excluded). ................................................................................100
Figure 6.4-11. Mean (±SE) Simpson’s diversity index from nearshore grab samples
collected across the seven sampling regions (Lake Winnipeg
excluded). .................................................................................................101
Figure 6.4-12. Mean (±SE) Hill’s effective richness from nearshore grab samples
collected across the seven sampling regions (Lake Winnipeg
excluded). Off-system waterbodies are indicated in green. WRR =
Winnipeg River Region; SRR = Saskatchewan River Region; UCRR =
Upper Churchill River Region; CRDR = Churchill River Diversion
Region; UNRR = Upper Nelson River Region; and LNRR = Lower
Nelson River Region. ...............................................................................102
Figure 6.4-13. Mean (±SE) total number of macroinvertebrates from offshore grab
samples collected across the seven sampling regions (Lake Winnipeg
excluded). .................................................................................................103
Figure 6.4-14. Mean (±SE) total number of EPT (Ephemeroptera, Trichoptera, and
Plecoptera) from offshore grab samples collected across the seven
sampling regions (Lake Winnipeg excluded).. ........................................104
Figure 6.4-15. Mean (±SE) EPT:C (ratio of Ephemeroptera, Trichoptera, and
Plecoptera to Chironomidae) from offshore grab samples collected
across the seven sampling regions (Lake Winnipeg excluded). ..............105
CAMPP Three Year Summary Report Volume 9
6-x
Page 6-x
Figure 6.4-16. Mean (±SE) taxonomic richness (number of families) from offshore
grab samples collected across the seven sampling regions (Lake
Winnipeg excluded). ................................................................................106
Figure 6.4-17. Mean (±SE) Simpson’s diversity index from offshore grab samples
collected across the seven sampling regions (Lake Winnipeg
excluded). .................................................................................................107
Figure 6.4-18. Mean (±SE) Hill’s effective richness from offshore grab samples
collected across the seven sampling regions (Lake Winnipeg
excluded). .................................................................................................108
Figure 6.5-1. Total number of fish species captured by standard index and small
mesh gang gillnet from CAMP waterbodies, 2008 – 2010.. ....................118
Figure 6.5-2. Relative abundance of Northern Pike (NRPK), Lake Whitefish
(LKWH), Sauger (SAUG) and Walleye (WALL) captured by standard
gang index gillnets from the Winnipeg River (WRR), Saskatchewan
River (SRR), Upper Churchill River (UCRR), Lower Churchill River
(LCRR), Churchill River Diversion (CRDR), Upper Nelson River
(UNRR), and Lower Nelson River regions (LNRR), 2008 - 2010. .........119
Figure 6.5-3. Mean total CPUE for all fish captured by standard index gillnets in the
Winnipeg River (WRR), Saskatchewan River (SRR), Upper Churchill
River (UCRR), Lower Churchill River (LCRR), Churchill River
Diversion (CRDR), Upper Nelson River (UNRR), and Lower Nelson
River regions (LNRR), 2008 - 2010. .......................................................120
Figure 6.5-4. Mean total CPUE for Northern Pike captured by standard index
gillnets in the Winnipeg River (WRR), Saskatchewan River (SRR),
Upper Churchill River (UCRR), Lower Churchill River (LCRR),
Churchill River Diversion (CRDR), Upper Nelson River (UNRR), and
Lower Nelson River regions (LNRR), 2008 - 2010. ...............................121
Figure 6.5-5. Mean total CPUE for Lake Whitefish captured by standard gang index
gillnets in the Winnipeg River (WRR), Saskatchewan River (SRR),
Upper Churchill River (UCRR), Lower Churchill River (LCRR),
Churchill River Diversion (CRDR), Upper Nelson River (UNRR), and
Lower Nelson River regions (LNRR), 2008 - 2010. ...............................122
Figure 6.5-6. Mean total CPUE for Sauger captured by standard index gillnets in the
Winnipeg River (WRR), Saskatchewan River (SRR), Upper Churchill
River (UCRR), Lower Churchill River (LCRR), Churchill River
Diversion (CRDR), Upper Nelson River (UNRR), and Lower Nelson
River regions (LNRR), 2008 - 2010. .......................................................123
CAMPP Three Year Summary Report Volume 9
6-xi
Page 6-x
Figure 6.5-7. Mean total CPUE for Walleye captured by standard index gillnets in
the Winnipeg River (WRR), Saskatchewan River (SRR), Upper
Churchill River (UCRR), Lower Churchill River (LCRR), Churchill
River Diversion (CRDR), Upper Nelson River (UNRR), and Lower
Nelson River regions (LNRR), 2008 - 2010. ...........................................124
Figure 6.5-8. Mean fork length for Northern Pike captured by standard index gillnets
in the Winnipeg River (WRR), Saskatchewan River (SRR), Upper
Churchill River (UCRR), Lower Churchill River (LCRR), Churchill
River Diversion (CRDR), Upper Nelson River (UNRR), and Lower
Nelson River regions (LNRR), 2008 - 2010. ...........................................125
Figure 6.5-9. Mean fork length for Lake Whitefish captured by standard index
gillnets in the Winnipeg River (WRR), Saskatchewan River (SRR),
Upper Churchill River (UCRR), Lower Churchill River (LCRR),
Churchill River Diversion (CRDR), Upper Nelson River (UNRR), and
Lower Nelson River regions (LNRR), 2008 - 2010 ................................126
Figure 6.5-10. Mean fork length for Walleye captured by standard index gillnets in
the Winnipeg River (WRR), Saskatchewan River (SRR), Upper
Churchill River (UCRR), Lower Churchill River (LCRR), Churchill
River Diversion (CRDR), Upper Nelson River (UNRR), and Lower
Nelson River regions (LNRR), 2008 - 2010. ...........................................127
Figure 6.5-11. Von Bertalanffy growth models for all Northern Pike captured in
standard gang index gill nets....................................................................128
Figure 6.5-12. Von Bertalanffy growth models for all Lake Whitefish captured in
standard gang index gill nets....................................................................129
Figure 6.5-13. Von Bertalanffy growth models for all Walleye captured in standard
gang index gill nets. .................................................................................130
Figure 6.5-14. Mean Index of Biotic Integrity (IBI) scores based on 11 fish
community metrics calculated from the Winnipeg River (WRR),
Saskatchewan River (SRR), Upper Churchill River (UCRR), Lower
Churchill River (LCRR), Churchill River Diversion (CRDR), Upper
Nelson River (UNRR), and Lower Nelson River regions (LNRR),
2008 - 2010. .............................................................................................131
Figure 6.6-1. Relationship between mercury concentration and fork length for
Yellow Perch from Cedar Lake-Southeast, Cross Lake-West,
Cormorant, Northern Indian, Leftrook, Little Playgreen, and Setting
lakes in 2010. ...........................................................................................143
CAMPP Three Year Summary Report Volume 9
6-xii
Page 6-x
Figure 6.6-2. Length-standardized mean (+95% CL) mercury concentrations of Lake
Whitefish from CAMPP waterbodies in 2009-2010. ...............................144
Figure 6.6-3. Length-standardized mean (+95% CL) mercury concentrations of
Northern Pike from CAMPP waterbodies in 2009-2010. ........................145
Figure 6.6-4. Length-standardized mean (+95% CL) mercury concentrations of
Walleye from CAMPP waterbodies in 2009-2010. .................................146
Figure 6.6-5. Mean (+SE) arithmetic mercury concentrations of Yellow Perch from
CAMPP waterbodies in 2009-2010. ........................................................147
CAMPP Three Year Summary Report Volume 9
6-1
6.0 SUMMARY OF CAMPP RESULTS
The following discussion provides an overview of key results of CAMPP for each of the
monitoring components. This discussion is focussed on a subset of metrics (i.e., parameters)
within each of the monitoring components, but includes discussion of results for all the CAMPP
waterbodies sampled in Years 1-3 of the pilot program. This overview is intended to provide a
broad description of key metrics across the study regions (excluding the Lake Winnipeg Region)
and to explore general patterns on a larger geographic scale. This analysis was also undertaken to
inform the overall design of CAMP and facilitate discussion of potential modifications to the
program in the future. As such, this discussion is not intended to be comprehensive and the
reader is referred to discussions presented in Section 5 of this report for a detailed description of
results of CAMPP.
For the purposes of exploring larger geographical patterns, sites located along the main river
systems were grouped and considered separately from off-system sites. Although Granville and
Eaglenest lakes are located upstream of Manitoba Hydro’s hydraulic system and are designated
as off-system waterbodies, they have been included in the on-system waterbody discussions
presented below, because they are physically located on the main flow of the upper Churchill and
Winnipeg rivers, respectively. These groups were identified to facilitate exploration of trends or
relationships in conditions between waterbodies located on the major rivers relative to those
uninfluenced by the major rivers.
6.1 HYDROLOGY
The following discussion provides a broad overview of the hydrological conditions that occurred
during CAMPP monitoring between 2008 and 2010. The discussion focuses on on-system
waterbodies and is intended to summarize the hydrologic conditions within each river system
and any effects of Manitoba Hydro’s hydroelectric system operations. This analysis was
undertaken to assist in drawing relationships between hydrological conditions and observed
water quality metrics and biological parameters.
Above average summer precipitation in the Winnipeg River drainage basin in 2008 led to record
high Winnipeg River flows in late summer. With near average conditions on the Saskatchewan
River also contributing to Lake Winnipeg inflows, the Jenpeg Generating Station (GS) was
operated to maximize discharge out of Lake Winnipeg as required by licence. As a result, upper
and lower Nelson River flows were well above average in late summer through fall 2008.
In 2008, upper Churchill River flows also peaked well above average in late summer. With the
Nelson River already in flood because of a flood on the Winnipeg River, Churchill River
CAMPP Three Year Summary Report Volume 9
6-2
Diversion (CRD) flows were reduced to below average and excess water was spilled at Missi
Falls throughout most of August to prevent Southern Indian Lake from exceeding its upper
licence limit. As a result, lower Churchill River flows, which were generally slightly below
average in 2008, also peaked to well above average in late summer.
An above average snowpack in the Winnipeg River basin in the winter of 2008/2009, combined
with wet conditions from the previous summer, led to Winnipeg River flows being well above
average to near record highs for much of 2009. Despite below average flows from the
Saskatchewan River, Lake Winnipeg water levels rose to the point that the Jenpeg GS had to be
operated to maximize discharge out of Lake Winnipeg as required by licence. This led to near
record flows on the Nelson River for much of 2009. Similar to conditions in 2008, an above
average snowpack led to upper Churchill River flows also peaking in later summer through fall
to near record highs. This led to near record high Missi Falls outflows and flows on the lower
Churchill River in the second half of 2009 as CRD was again operated at well below average
discharges for the summer to avoid accentuating flood conditions on the Nelson River.
A below average snowpack in the winter of 2009/2010 led to below average flows on both the
Winnipeg and Saskatchewan Rivers in the spring of 2010. However, persistent rainfall
throughout the summer pushed flows to well above average by August on the Winnipeg River
and by late September on the Saskatchewan River. These late summer inflow increases raised the
level of Lake Winnipeg above the licensed upper regulation limit requiring the Jenpeg GS to
maximize discharge out of the lake. Accordingly, the Nelson River followed a similar pattern
with below average discharge in the spring followed by a steady rise to well above average by
fall and reaching record highs flows entering the winter of 2010/2011.
On the upper Churchill River, a below average snow-pack followed by average levels of
precipitation kept flows slightly below average for most of 2010. However, because of high
flows in the winter of 2009/2010, which occurred as a result of conditions in 2009, Southern
Indian Lake remained near its upper licence limit throughout the winter and as a result there was
excess water to be released from the lake during the summer of 2010 despite below average 2010
inflows. For the third year in a row, CRD flows were reduced to below average for part of the
summer to alleviate flood conditions on the Nelson River. These events also led to above average
discharge from Missi Falls from late summer to early fall resulting in a period of above average
flow along lower Churchill River which otherwise experienced below average flow conditions
from spring to mid-summer.
CAMPP Three Year Summary Report Volume 9
6-3
6.2 WATER QUALITY
The following discussion provides an overview of water quality results based on a subset of
water quality metrics (i.e., parameters) for all the CAMPP waterbodies sampled in Years 1-3 of
the pilot program. This overview is intended to provide a broad description of key metrics across
the study regions (excluding the Lake Winnipeg Region) and to explore general patterns
respecting water quality on a larger geographic scale. This analysis was also undertaken to
inform the overall design of the CAMP water quality monitoring program and facilitate
discussion of potential modifications to the program in the future. As such, this discussion is not
intended to be comprehensive and the reader is referred to discussions presented in Section 5 of
this report for a detailed description of results of the CAMPP water quality program.
Summaries of water quality results for each of the regions are presented in Tables 6.2-1 to 6.2-7
and Figures 6.2-1 to 6.2-29. The discussion focuses upon results for on-system waterbodies,
which are defined here as waterbodies located along the flow of the major river in each region,
and off-system waterbodies, which include Manigotagan, Leftrook, Gauer, Setting, Assean,
Walker, and Cormorant lakes and the Hayes River. Although Granville and Eaglenest lakes are
designated as off-system waterbodies, they have been included in the on-system waterbody
discussion presented below because they are physically located on the main flow of the upper
Churchill and Winnipeg rivers, respectively. These groups were identified to facilitate
exploration of trends or relationships in water quality conditions between waterbodies located on
the major rivers relative to those uninfluenced or less influenced by the major rivers. Walker
Lake, an off-system lake monitored under CAMPP, is also considered within the discussion of
on-system waterbodies because it is affected by a backwater effect from Cross Lake under
certain water levels.
6.2.1 On-System Waterbodies
6.2.1.1 Limnology
Most of the on-system lakes and reservoirs did not stratify or only periodically stratified in the
open-water or ice-cover seasons of 2008/2009 to 2010/2011 (Tables 6.2-1 to 6.2-7). On-system
waterbodies that exhibited thermal stratification during at least one sampling period included
Eaglenest Lake (spring 2010), Cedar Lake (spring 2010), South Moose Lake (winter 2010),
Granville Lake (spring 2008), Southern Indian Lake Area 6 (spring 2010), Southern Indian Lake
Area 4 (spring and summer 2008/2009), Northern Indian Lake (spring 2008), Notigi Lake-West
(spring and summer 2009), Notigi Lake-East (spring 2009), Footprint Lake (spring 2010), and
Walker Lake (spring 2010). Where thermal stratification occurred at on-system waterbodies, it
was most common in spring, was generally shallow (i.e., close to the water surface), and had
CAMPP Three Year Summary Report Volume 9
6-4
typically broken down by the summer sampling period. The exceptions occurred in Notigi,
Southern Indian, and Walker lakes, where the depth of the thermocline was high when
stratification occurred and/or stratification occasionally persisted into summer.
Most of the on-system waterbodies were well-oxygenated across seasons and dissolved oxygen
(DO) concentrations were generally above Manitoba Water Quality Standards, Objectives, and
Guidelines (MWQSOGs) for the protection of aquatic life (PAL) throughout the sampling
periods. However, several waterbodies developed lower DO concentrations at depth in the ice-
cover season. Although DO depletion is generally more pronounced in aquatic systems that are
thermally stratified, decreases in DO across depth are not uncommon in north temperate systems
that experience long periods of ice cover, even in the absence of thermal stratification, and
reflects the lack of atmospheric reaeration due to the physical presence of ice. On-system
waterbodies where DO concentrations were below one or more of the MWQSOG PALs during
one or more winter sampling periods in 2008/2009 – 2010/2011 included South Moose Lake,
Cedar Lake, Footprint Lake, Cross Lake, and Walker Lake1 (Tables 6.2-1 to 6.2-7). On-system
waterbodies maintained DO concentrations above MWQSOG PALs in the open-water seasons
across depth even when thermally stratified.
Water clarity, as estimated from Secchi disk depth, of most waterbodies was very low to low
based on the Swedish Environmental Protection Agency (Swedish EPA 2000) categorization
scheme for lakes (Figure 6.2-1). In situ turbidity, specific conductance, and pH were generally
similar across depth at the on-system waterbodies over the monitoring period.
6.2.1.2 Routine Parameters
Key routine water quality variables for the seven CAMPP regions (Lake Winnipeg Region is
excluded as noted above) are presented in Figures 6.2-2 to 6.2-12 and include total suspended
solids (TSS), turbidity, pH, conductivity, true colour, dissolved organic carbon (DOC), hardness,
and nitrogen and phosphorus. With the exception of the Saskatchewan River, all waterbodies
sampled under CAMPP contained less than 20 mg/L of TSS on average, and most waterbodies
had average TSS concentrations less than 10 mg/L (Figure 6.2-2). Patterns for turbidity were
similar to those observed for TSS (Figure 6.2-3). Turbidity is typically correlated to TSS, though
the specific relationship between these parameters can vary regionally or even among
waterbodies. Linear regression analysis between TSS and laboratory turbidity for all on-system
waterbodies indicated a significant correlation in general (Figure 6.2-4); however, it is noted that
1One anomalous measurement of DO (4.1 mg/L) collected in Split Lake in summer 2009 was also below MWQSOGs
for the protection of aquatic life. This value is considered to be a potential measurement error.
CAMPP Three Year Summary Report Volume 9
6-5
relationships likely vary amongst the regions and correlations should be explored on a regional
basis upon acquisition of additional data.
True colour was highest in the Winnipeg River Region; lakes on the Canadian Shield typically
are more coloured than lakes in other regions (Mitchell and Prepas 1990; Figure 6.2-5).
Similarly, DOC (i.e., a variable that contributes to water colour) was on average slightly higher
in the Winnipeg River Region than other CAMPP regions (Figure 6.2-6).
Waterbodies ranged from soft (Winnipeg River system, lakes on the upper Rat/Burntwood River
system, and lakes on the upper Churchill River system) to very hard (Saskatchewan River and
South Moose Lake; Figure 6.2-7). Waterbodies sampled under CAMPP were slightly alkaline,
with an average pH near 8 (Figure 6.2-8) and pH, was on average, within the MWQSOG PAL
(range of 6.5-9.0) at all sites. Laboratory conductivity was higher in waterbodies located along
the main flow of the upper and lower Nelson River and along the Saskatchewan River than the
other regions (Figure 6.2-9). Conductivity measured along the Nelson River was similar to or
lower than the mean level measured in the north basin of Lake Winnipeg (313 mg/L) over the
period of 1999-2007 (Environment Canada [EC] and Manitoba Water Stewardship [MWS]
2011).
The highest total phosphorus (TP) concentrations occurred in the Saskatchewan River, the Lake
Winnipeg outlet lakes (Playgreen, Little Playgreen, and Cross lakes), the Burntwood River (at
the inlet to Split Lake), and sites located along the main flow of the lower Nelson River (Figure
6.2-10). The average phosphorus concentrations exceeded the Manitoba narrative guideline for
lakes, ponds, and reservoirs and streams near to the point of entry to these waterbodies (0.025
mg/L) at the on-system sites along the Winnipeg River, the upper and lower Nelson River, and
the Burntwood River from Threepoint Lake to Split Lake. The Saskatchewan River was also
phosphorus-rich but concentrations of TP decreased downstream in Cedar Lake. Spatial patterns
were less clear for total nitrogen (TN), though the lowest average concentrations occurred along
the upper and lower Churchill River and along the upper stretches of the Rat/Burntwood River
system (Figure 6.2-11). Molar total nitrogen:total phosphorus (TN:TP) ratios indicate all on-
system waterbodies were, on average, phosphorus limited (Figure 6.2-12).
Other routine water quality variables for which there are MWQSOGs for PAL, including
nitrate/nitrite and ammonia, were consistently within the objectives or guidelines across the
CAMPP regions in 2008/2009 through 2010/2011.
Water quality of waterbodies that are more removed from the main flow of the major rivers (i.e.,
South Moose, Footprint, and Walker lakes and the north basin of Stephens Lake) differed from
waterbodies located along the main river flow paths for some parameters. South Moose and
CAMPP Three Year Summary Report Volume 9
6-6
Walker lakes and the north basin of Stephens Lake were characterized by lower concentrations
of TSS (Figure 6.2-2), turbidity (Figure 6.2-3), and TP (Figure 6.2-10) and had higher TN:TP
ratios (Figure 6.2-12) and Secchi disk depths (Figure 6.2-1) than sites located directly on the
main flow of the major rivers. Footprint Lake was harder (Figure 6.2-7), had a higher
conductivity (Figure 6.2-9) and TN:TP ratio (Figure 6.2-12) than sites located along the main
flow of the Rat/Burntwood River system. For some parameters, water quality of these
waterbodies was more similar to off-system waterbodies than those located along the main flow
of the major rivers. Overall, these off-current waterbodies have greater water clarity and lower
concentrations of substances present in total or in a particulate form.
6.2.1.3 Trophic Status
There are numerous trophic categorization schemes that have been developed for lakes,
including those presented in Canadian Council of Ministers of the Environment (CCME 1999;
updated to 2013), Organization for Economic Cooperation and Development (OECD 1982),
Nürnberg (1996), and Carlson (1977). Trophic categorization schemes vary in terms of the
thresholds applied as well as the water quality parameters included in the categorization;
parameters that are frequently included are TP, TN, chlorophyll a, and Secchi disk depth. Lakes
and reservoirs sampled under CAMPP were compared to the trophic categorization schemes
indicated in Table 6.2-8.
Trophic status of on-system waterbodies, based on mean open-water season TP concentrations,
ranged from mesotrophic to eutrophic (Figures 6.2-13 and 6.2-14). Trophic status of on-system
lakes based on chlorophyll a as the indicator ranged from oligotrophic to eutrophic (Figures 6.2-
15 and 6.2-16). The ranking of trophic status for on-system lakes was somewhat lower using
chlorophyll a instead of TP as the indicator (Table 6.2-9). Several lakes/reservoirs (Southern
Indian Lake – areas 6 and 4, and Partridge Breast, Rat, Notigi East, Threepoint, Playgreen, Little
Playgreen, Split and Stephens Lakes and the Limestone Forebay) were ranked with a higher
trophic category on the basis of TP than using chlorophyll a. Conversely, Cross Lake ranked as
eutrophic on the basis of chlorophyll a but was categorized as meso-eutrophic on the basis of TP
concentration. The latter observation may relate to a particularly high concentration of
chlorophyll a measured in Cross Lake in September 2008. Collectively, this information suggests
that phytoplankton may be more limited or co-limited by factors other than TP (e.g., light,
temperature). Regression analysis indicates TP is more closely related to TSS concentrations
than to chlorophyll a when considering all on-system lakes collectively (Figure 6.2-17).
Trophic categorization of lakes and reservoirs based on TN indicates most on-system lakes rank
as mesotrophic, though some lakes fall into the oligotrophic category (i.e., those in the
CAMPP Three Year Summary Report Volume 9
6-7
northwestern portion of the province) and one lake (Little Playgreen Lake) ranked as eutrophic
(Figures 6.2-18 and 6.2-19). Similar to chlorophyll a, trophic categorization based on TN was
similar to or lower than the ranking when using TP as the indicator (Table 6.2-9).
Lakes/reservoirs located on the upper and lower Churchill River and on the Rat/upper
Burntwood River ranked as oligotrophic based on TN, but were ranked as mesotrophic or meso-
eutrophic based on TP. Similarly, Playgreen, Split and Stephens (south) Lakes and the Limestone
Forebay ranked as eutrophic on the basis of TP but only mesotrophic based on TN. The latter
sites also ranked lower using chlorophyll a as the indicator. Like TP, TN was only weakly
correlated to chlorophyll a in on-system lakes and reservoirs (Figure 6.2-20).
There are numerous trophic categorization schemes for lakes which employ Secchi disk depth as
a metric (e.g., OECD 1982, Nurnberg 1996, Carlson 1977). These classic trophic categorization
schemes are based on the conventional lake paradigm where water clarity is inversely related to
trophic status and are founded on the principle that water clarity in lakes is largely a reflection of
organic materials, such as phytoplankton, rather than inorganic turbidity. However, relationships
between water clarity and productivity or trophic status of riverine lakes and reservoirs typically
differ from natural lakes with longer residence times and these conventional categorization
schemes do not necessarily apply.
As expected, the use of Secchi disk depth as an indicator of trophic status of on-system lakes and
reservoirs was deemed to be inappropriate due to the lack of a relationship between Secchi disk
depth and chlorophyll a (Figure 6.2-21). Secchi disk depth trophic categorization generally
resulted in a higher ranking than generated based on TP, TN, or chlorophyll a (Table 6.2-9). On
system lakes/reservoirs have relatively low water clarity which is largely a result of inorganic
turbidity rather than phytoplankton (Figure 6.2-21) and the application of Secchi disk depth as an
indicator of trophic status is inappropriate for these waterbodies.
There are fewer trophic categorization schemes for rivers and streams, though the CCME (1999,
updated to 2013) TP trophic categorization scheme is intended to be applied to all freshwater
ecosystems, including rivers and streams. Comparison of TP, TN, and chlorophyll a
concentrations (open-water season means) measured at CAMPP river sites to the trophic
categorization schemes presented in Table 6.20-10, indicates that all sites ranked as oligotrophic
on the basis of TN and chlorophyll a (Table 6.2-11). Conversely, river sites ranked from
mesotrophic (lower Churchill River) to eutrophic (Burntwood and Saskatchewan rivers) on the
basis of TP (Table 6.2-11).
CAMPP Three Year Summary Report Volume 9
6-8
6.2.1.4 Escherichia coli
E. coli was detected at least once in most on-system waterbodies; exceptions occurred in Cedar,
South Moose, Walker, and Rat lakes where no detections occurred. When detected,
concentrations were generally low and below the Manitoba water quality objective for primary
recreation (200 colony forming units [CFU]/100 mL). High concentrations of E. coli (i.e.,
reported as “overgrown”) were detected in March 2010 from two sites located along the
Burntwood River (Apussigamasi Lake and the Burntwood River at the inlet to Split Lake). As
these samples were measured in winter, the Manitoba recreational guideline is not applicable.
6.2.1.5 Metals and Major Ions
The dominant major cation in all CAMPP waterbodies was calcium (Figure 6.2-22). The second
most abundant major cation varied between the regions; magnesium was the next most abundant
major cation in the Winnipeg River Region, the Upper and Lower Churchill River regions, and
the Churchill River Diversion Region. With the exceptions of South Moose and Walker lakes,
where magnesium was the second most abundant cation, sodium was the second most abundant
major cation at on-system waterbodies located on the Saskatchewan River and upper and lower
Nelson River. In addition, the latter waterbodies contained higher concentrations of the four
major cations (calcium, magnesium, potassium, and sodium).
Chloride and sulphate varied across the CAMPP sampling regions. Chloride was highest in
waterbodies located on the main flow of the Saskatchewan River (i.e., Saskatchewan River and
Cedar Lake sites) and the main flow of the upper and lower Nelson River (Figure 6.2-23).
Concentrations of chloride measured along the Nelson River system are similar to the mean
concentration measured in the north basin of Lake Winnipeg from 1999-2007 (19 mg/L; EC and
MWS 2011), indicating the source is primarily the outflow of Lake Winnipeg. Mean
concentrations for all other regions were less than 5 mg/L of chloride. All concentrations of
chloride were well below the CCME (1999, updated to 2013) long-term PAL water quality
guideline (120 mg/L) in waterbodies of these seven regions (there is no Manitoba PAL guideline
for chloride). Chloride is a naturally occurring substance but may be anthropogenically increased
in aquatic environments through activities such as logging, de-icing of roadways and
infrastructure, and from wastewaters. The CCME (1999; updated to 2013) reported that chloride
concentrations are typically < 5 mg/L in northern lakes of the Canadian prairie provinces but
high levels occur in some southern areas of these provinces.
Sulphate was also highest in the Saskatchewan River and Upper and Lower Nelson River regions
(Figure 6.2-24). However, unlike chloride, sulphate was also higher in lakes located off the main
flow of the Saskatchewan and lower Nelson rivers (i.e., South Moose Lake and Stephens Lake-
CAMPP Three Year Summary Report Volume 9
6-9
North) than in waterbodies from other CAMPP regions. Like chloride, sulphate concentrations
measured along the Nelson River are similar to those measured recently in the north basin of
Lake Winnipeg (28 mg/L; EC and MWS 2011), indicating the lake outflow rather than local
inputs is the primary source of this compound. Although there is currently no Manitoba or
CCME PAL guideline for sulphate, all measurements of sulphate were below the British
Columbia Ministry of Environment (BCMOE) guidelines which range from 128 to 429 mg/L for
waters ranging from soft to very hard (Meays and Nordin 2013).
Up to 38 metals were analysed in water samples collected under CAMPP over the three year
pilot program. Metals that were never detected at any of the on-system CAMPP waterbodies
were beryllium, bismuth, and tellurium. Most metals for which there are MWQSOGs for PAL,
including arsenic, boron, cadmium, chromium, copper, molybdenum, nickel, thallium, uranium,
and zinc, were within the objectives or guidelines at all on-system sites during all sampling
periods.
Two metals, aluminum and iron, were above the MWQSOGs for PAL in most on-system
waterbodies during at least one sampling period; the exceptions were South Moose and Walker
lakes, where there were no exceedances of MWQSOGs for PAL for any metal (Tables 6.2-1 to
6.2-7). The mean concentration of aluminum measured in most on-system waterbodies was more
than twice the MWQSOG for PAL (0.1 mg/L) and, in some waterbodies (Apussigamasi Lake
and the Burntwood River at Split Lake), mean concentrations were an order of magnitude or
more above the PAL guideline (Figure 6.2-25). The mean concentrations of iron exceeded the
PAL guideline (0.3 mg/L) in the Saskatchewan River, Southern Indian Lake (areas 1 and 6),
several sites along the Churchill River Diversion (Rat, Threepoint, Footprint, and Apussigamasi
lakes), and all sites sampled in the Lower Nelson River Region (Figure 6.2-26). Both aluminum
and iron are relatively abundant elements (iron and aluminum are the third and fourth most
abundant elements in the earth’s crust, respectively) and elevated concentrations have been
reported in ‘pristine’ environments, including waterbodies in Manitoba (e.g., Ramsey 1991).
Other metals for which there are MWQSOGs for PAL, including lead, mercury, selenium, and
silver exceeded the PAL objectives or guidelines in at least one waterbody and one sampling
period. Lead slightly exceeded the chronic PAL objective in Southern Indian Lake (area 1) in
spring and summer 2009, though was consistently within PAL objectives in the other two
sampling areas of the lake (areas 4 and 6). Selenium and silver were occasionally at or slightly
higher than the PAL guidelines in several on-system waterbodies. Specifically, selenium was at
or higher than the guideline (0.001 mg/L) in Lac du Bonnet (8% of samples), the lower Churchill
River (9% of samples), Northern Indian Lake (8% of samples), the lower Nelson River (8% of
samples), Granville Lake (25% of samples), Partridge Breast Lake (25% of samples), and
CAMPP Three Year Summary Report Volume 9
6-10
Southern Indian Lake Area 4 (17% of samples). Similarly, silver was at or slightly above the
PAL guideline (0.0001 mg/L) in the Burntwood River (13% of samples), Lac du Bonnet (25% of
samples), and Notigi Lake East and West (25% of samples at each site). However, the analytical
DLs for silver and selenium are equivalent to the PAL guidelines. As noted in Section 5,
measurements that are at or near analytical detection limits (DLs) are associated with relatively
high uncertainty and there is low confidence that an actual exceedance of a PAL guideline has
occurred when the measurement is at or near the DL.
Mercury was above the current MWQSOG for PAL (0.000026 mg/L) in a single sample
collected in the Burntwood River. However, as previously discussed (see Section 5), the
Manitoba water quality guideline for mercury was revised in 2011 and most samples collected
under CAMPP in 2008/2009 through 2010/2011 were analysed using an analytical DL that was
higher than the new PAL guideline. Therefore, most of the results could not be compared to the
current PAL guideline.
Concentrations of metals were generally lower in South Moose and Walker lakes, and the north
basin of Stephens Lake, than in waterbodies located along the main flow of the rivers. These
waterbodies/areas are more removed from the main flow of the Saskatchewan, upper Nelson, and
lower Nelson rivers, respectively, and contained lower concentrations of TSS; in general,
waterbodies with higher concentrations of TSS contain higher concentrations of metals that are
bound to or contained in suspended materials.
6.2.2 Off-system Waterbodies
Off-system waterbodies monitored under CAMPP are inherently different from on-system
waterbodies due to differences in lake morphometry, drainage basin size, hydrology, etc. Thus,
differences in the water quality and limnology of off-system and on-system waterbodies were
anticipated.
6.2.2.1 Limnology
With the exception of Assean Lake, all off-system lakes developed thermal stratification and
exhibited DO concentrations below one or more of the MWQSOGs for PAL during at least one
sampling period. These lower DO events generally occurred under ice-cover conditions, though
DO concentrations occasionally dropped below MWQSOGs for PAL in some open-water
periods when thermal stratification occurred.
CAMPP Three Year Summary Report Volume 9
6-11
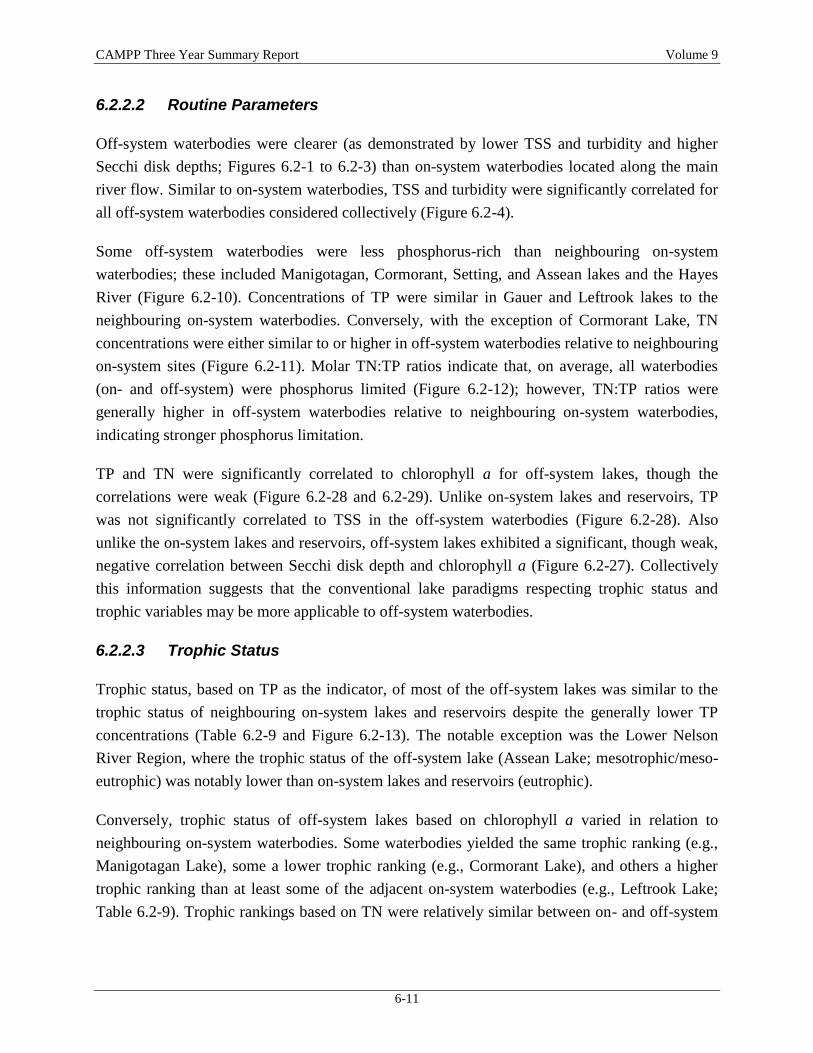
6.2.2.2 Routine Parameters
Off-system waterbodies were clearer (as demonstrated by lower TSS and turbidity and higher
Secchi disk depths; Figures 6.2-1 to 6.2-3) than on-system waterbodies located along the main
river flow. Similar to on-system waterbodies, TSS and turbidity were significantly correlated for
all off-system waterbodies considered collectively (Figure 6.2-4).
Some off-system waterbodies were less phosphorus-rich than neighbouring on-system
waterbodies; these included Manigotagan, Cormorant, Setting, and Assean lakes and the Hayes
River (Figure 6.2-10). Concentrations of TP were similar in Gauer and Leftrook lakes to the
neighbouring on-system waterbodies. Conversely, with the exception of Cormorant Lake, TN
concentrations were either similar to or higher in off-system waterbodies relative to neighbouring
on-system sites (Figure 6.2-11). Molar TN:TP ratios indicate that, on average, all waterbodies
(on- and off-system) were phosphorus limited (Figure 6.2-12); however, TN:TP ratios were
generally higher in off-system waterbodies relative to neighbouring on-system waterbodies,
indicating stronger phosphorus limitation.
TP and TN were significantly correlated to chlorophyll a for off-system lakes, though the
correlations were weak (Figure 6.2-28 and 6.2-29). Unlike on-system lakes and reservoirs, TP
was not significantly correlated to TSS in the off-system waterbodies (Figure 6.2-28). Also
unlike the on-system lakes and reservoirs, off-system lakes exhibited a significant, though weak,
negative correlation between Secchi disk depth and chlorophyll a (Figure 6.2-27). Collectively
this information suggests that the conventional lake paradigms respecting trophic status and
trophic variables may be more applicable to off-system waterbodies.
6.2.2.3 Trophic Status
Trophic status, based on TP as the indicator, of most of the off-system lakes was similar to the
trophic status of neighbouring on-system lakes and reservoirs despite the generally lower TP
concentrations (Table 6.2-9 and Figure 6.2-13). The notable exception was the Lower Nelson
River Region, where the trophic status of the off-system lake (Assean Lake; mesotrophic/meso-
eutrophic) was notably lower than on-system lakes and reservoirs (eutrophic).
Conversely, trophic status of off-system lakes based on chlorophyll a varied in relation to
neighbouring on-system waterbodies. Some waterbodies yielded the same trophic ranking (e.g.,
Manigotagan Lake), some a lower trophic ranking (e.g., Cormorant Lake), and others a higher
trophic ranking than at least some of the adjacent on-system waterbodies (e.g., Leftrook Lake;
Table 6.2-9). Trophic rankings based on TN were relatively similar between on- and off-system
CAMPP Three Year Summary Report Volume 9
6-12
waterbodies (Tables 6.2-9 and 6.2-11), though Gauer Lake was ranked higher (mesotrophic) than
on-system waterbodies of the Upper or Lower Churchill River regions.
The trophic status of the single off-system river included in CAMPP (Hayes River) was
consistent with the neighbouring lower Nelson River based on TP, TN, and chlorophyll a (Table
6.2-11).
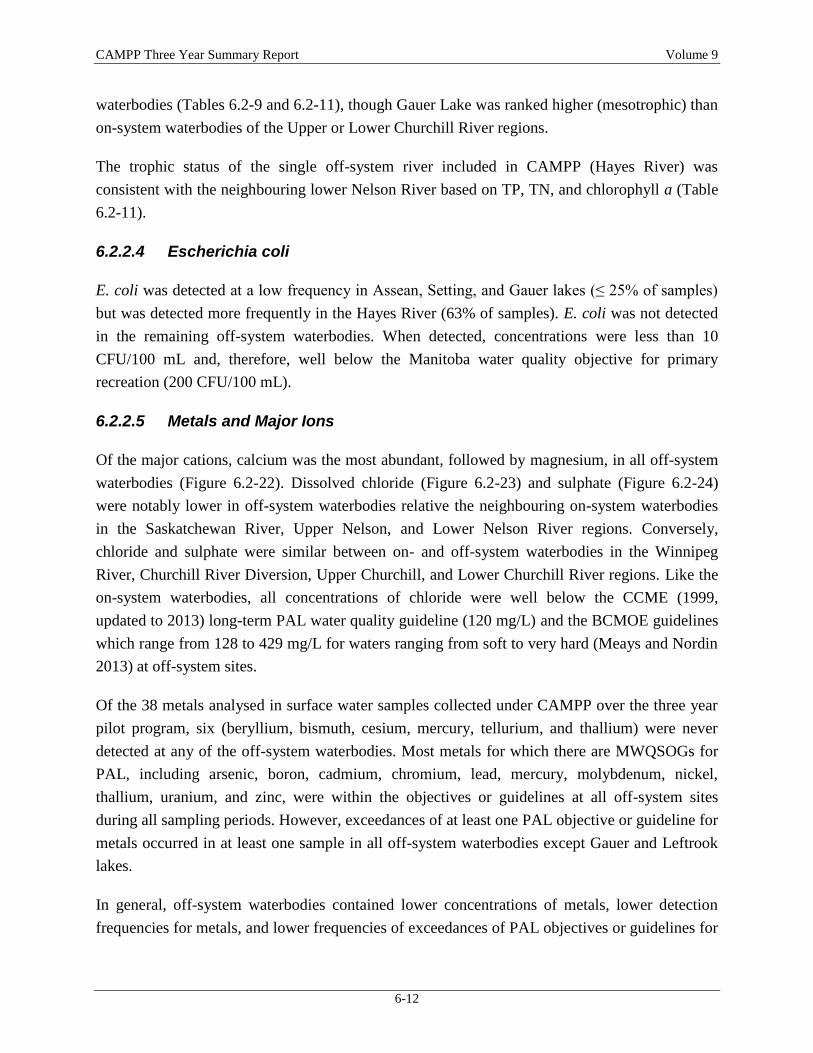
6.2.2.4 Escherichia coli
E. coli was detected at a low frequency in Assean, Setting, and Gauer lakes (≤ 25% of samples)
but was detected more frequently in the Hayes River (63% of samples). E. coli was not detected
in the remaining off-system waterbodies. When detected, concentrations were less than 10
CFU/100 mL and, therefore, well below the Manitoba water quality objective for primary
recreation (200 CFU/100 mL).
6.2.2.5 Metals and Major Ions
Of the major cations, calcium was the most abundant, followed by magnesium, in all off-system
waterbodies (Figure 6.2-22). Dissolved chloride (Figure 6.2-23) and sulphate (Figure 6.2-24)
were notably lower in off-system waterbodies relative the neighbouring on-system waterbodies
in the Saskatchewan River, Upper Nelson, and Lower Nelson River regions. Conversely,
chloride and sulphate were similar between on- and off-system waterbodies in the Winnipeg
River, Churchill River Diversion, Upper Churchill, and Lower Churchill River regions. Like the
on-system waterbodies, all concentrations of chloride were well below the CCME (1999,
updated to 2013) long-term PAL water quality guideline (120 mg/L) and the BCMOE guidelines
which range from 128 to 429 mg/L for waters ranging from soft to very hard (Meays and Nordin
2013) at off-system sites.
Of the 38 metals analysed in surface water samples collected under CAMPP over the three year
pilot program, six (beryllium, bismuth, cesium, mercury, tellurium, and thallium) were never
detected at any of the off-system waterbodies. Most metals for which there are MWQSOGs for
PAL, including arsenic, boron, cadmium, chromium, lead, mercury, molybdenum, nickel,
thallium, uranium, and zinc, were within the objectives or guidelines at all off-system sites
during all sampling periods. However, exceedances of at least one PAL objective or guideline for
metals occurred in at least one sample in all off-system waterbodies except Gauer and Leftrook
lakes.
In general, off-system waterbodies contained lower concentrations of metals, lower detection
frequencies for metals, and lower frequencies of exceedances of PAL objectives or guidelines for
CAMPP Three Year Summary Report Volume 9
6-13
metals than on-system waterbodies. However, aluminum and iron were above guidelines in some
off-system waterbodies, as typically observed at on-system sites. Aluminum exceeded the PAL
guideline (0.1 mg/L) in some samples from the Hayes River (55%), Setting Lake (83%), Assean
Lake (88%), and Manigotagan Lake (42%) and the mean concentrations in Setting and Assean
lakes and the Hayes River were above the PAL guideline (Figure 6.2-25). Iron only exceeded the
PAL guideline in the Hayes River (36%) and Assean Lake (50%), and mean concentrations were
below the PAL guideline in all off-system waterbodies (Figure 6.2-26).
Other metals for which there are MWQSOGs for PAL, including copper, selenium, and silver,
exceeded the PAL objectives or guidelines in at least one waterbody and one sampling period.
Copper exceeded the PAL chronic objective in one sample collected from the Hayes River in fall
2010 and selenium and silver were occasionally at or slightly higher than the PAL guidelines in
several off-system waterbodies. Specifically, selenium was higher than the guideline (0.001
mg/L) in Manigotagan Lake (8% of samples) and the Hayes River (9% of samples), and silver
was at the guideline (0.0001 mg/L) in one sample from Setting Lake (8% of samples) and was
approximately four times the guideline in one sample from the Hayes River (9% of samples). As
noted in Section 6.2.1.5, the analytical DLs for these metals are equivalent to the PAL guidelines
and these exceedances may reflect analytical limitations.
CAMPP Three Year Summary Report Volume 9
6-14
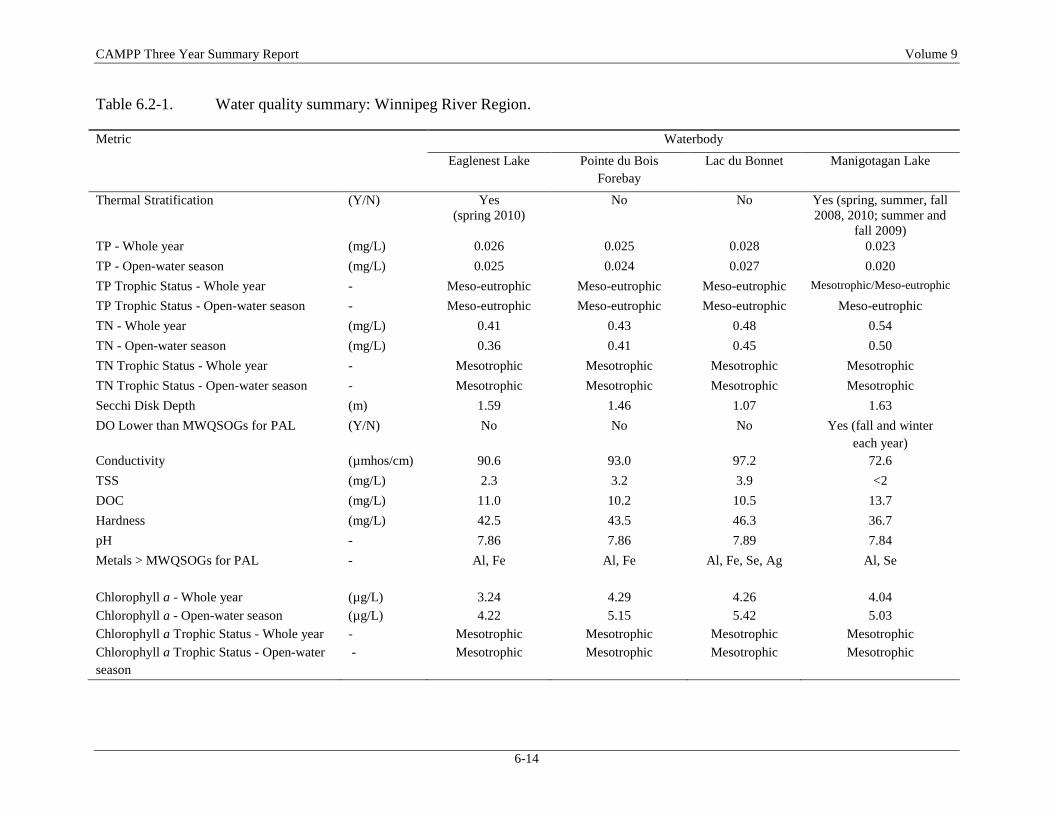
Table 6.2-1. Water quality summary: Winnipeg River Region.
Metric
Waterbody
Eaglenest Lake Pointe du Bois
Forebay
Lac du Bonnet Manigotagan Lake
Thermal Stratification (Y/N) Yes
(spring 2010)
No No Yes (spring, summer, fall
2008, 2010; summer and
fall 2009)
TP - Whole year (mg/L) 0.026 0.025 0.028 0.023
TP - Open-water season (mg/L) 0.025 0.024 0.027 0.020
TP Trophic Status - Whole year - Meso-eutrophic Meso-eutrophic Meso-eutrophic Mesotrophic/Meso-eutrophic
TP Trophic Status - Open-water season - Meso-eutrophic Meso-eutrophic Meso-eutrophic Meso-eutrophic
TN - Whole year (mg/L) 0.41 0.43 0.48 0.54
TN - Open-water season (mg/L) 0.36 0.41 0.45 0.50
TN Trophic Status - Whole year - Mesotrophic Mesotrophic Mesotrophic Mesotrophic
TN Trophic Status - Open-water season - Mesotrophic Mesotrophic Mesotrophic Mesotrophic
Secchi Disk Depth (m) 1.59 1.46 1.07 1.63
DO Lower than MWQSOGs for PAL (Y/N) No No No Yes (fall and winter
each year)
Conductivity (µmhos/cm) 90.6 93.0 97.2 72.6
TSS (mg/L) 2.3 3.2 3.9 <2
DOC (mg/L) 11.0 10.2 10.5 13.7
Hardness (mg/L) 42.5 43.5 46.3 36.7
pH - 7.86 7.86 7.89 7.84
Metals > MWQSOGs for PAL - Al, Fe Al, Fe Al, Fe, Se, Ag Al, Se
Chlorophyll a - Whole year (µg/L) 3.24 4.29 4.26 4.04
Chlorophyll a - Open-water season (µg/L) 4.22 5.15 5.42 5.03
Chlorophyll a Trophic Status - Whole year - Mesotrophic Mesotrophic Mesotrophic Mesotrophic
Chlorophyll a Trophic Status - Open-water
season
- Mesotrophic Mesotrophic Mesotrophic Mesotrophic
CAMPP Three Year Summary Report Volume 9
6-15
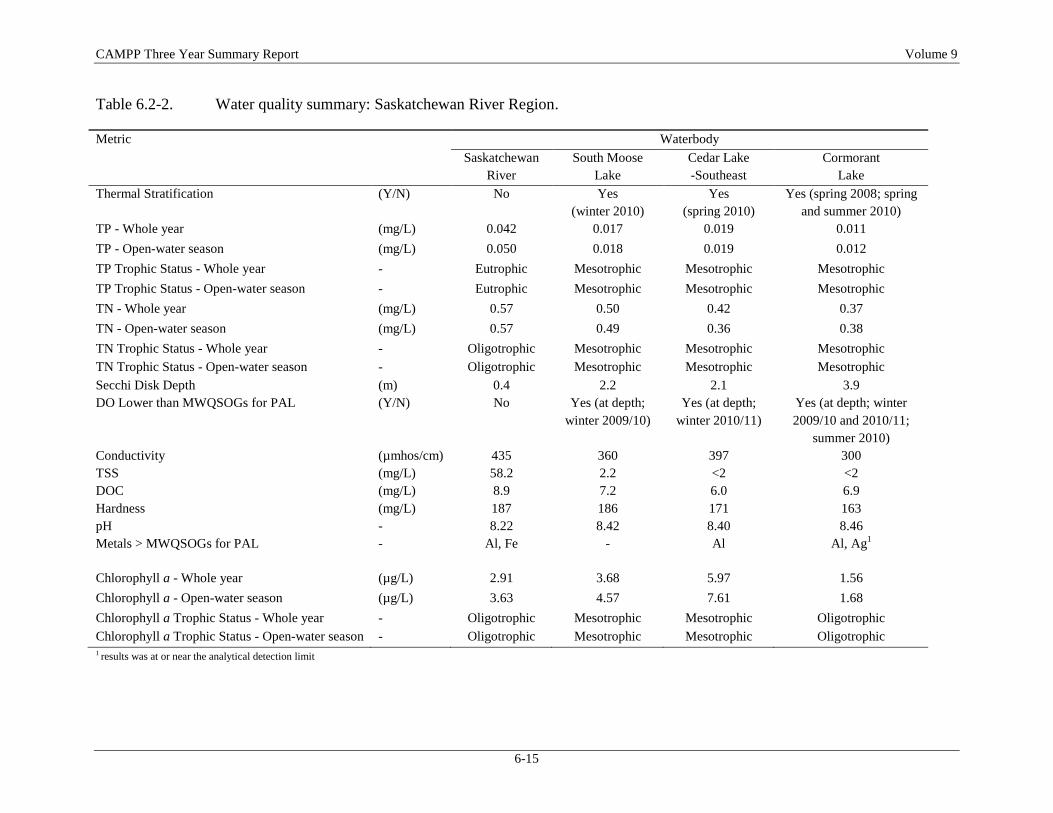
Table 6.2-2. Water quality summary: Saskatchewan River Region.
Metric
Waterbody
Saskatchewan
River
South Moose
Lake
Cedar Lake
-Southeast
Cormorant
Lake
Thermal Stratification (Y/N) No Yes
(winter 2010)
Yes
(spring 2010)
Yes (spring 2008; spring
and summer 2010)
TP - Whole year (mg/L) 0.042 0.017 0.019 0.011
TP - Open-water season (mg/L) 0.050 0.018 0.019 0.012
TP Trophic Status - Whole year - Eutrophic Mesotrophic Mesotrophic Mesotrophic
TP Trophic Status - Open-water season - Eutrophic Mesotrophic Mesotrophic Mesotrophic
TN - Whole year (mg/L) 0.57 0.50 0.42 0.37
TN - Open-water season (mg/L) 0.57 0.49 0.36 0.38
TN Trophic Status - Whole year - Oligotrophic Mesotrophic Mesotrophic Mesotrophic
TN Trophic Status - Open-water season - Oligotrophic Mesotrophic Mesotrophic Mesotrophic
Secchi Disk Depth (m) 0.4 2.2 2.1 3.9
DO Lower than MWQSOGs for PAL (Y/N) No Yes (at depth;
winter 2009/10)
Yes (at depth;
winter 2010/11)
Yes (at depth; winter
2009/10 and 2010/11;
summer 2010)
Conductivity (µmhos/cm) 435 360 397 300
TSS (mg/L) 58.2 2.2 <2 <2
DOC (mg/L) 8.9 7.2 6.0 6.9
Hardness (mg/L) 187 186 171 163
pH - 8.22 8.42 8.40 8.46
Metals > MWQSOGs for PAL - Al, Fe - Al Al, Ag1
Chlorophyll a - Whole year (µg/L) 2.91 3.68 5.97 1.56
Chlorophyll a - Open-water season (µg/L) 3.63 4.57 7.61 1.68
Chlorophyll a Trophic Status - Whole year - Oligotrophic Mesotrophic Mesotrophic Oligotrophic
Chlorophyll a Trophic Status - Open-water season - Oligotrophic Mesotrophic Mesotrophic Oligotrophic 1 results was at or near the analytical detection limit
CAMPP Three Year Summary Report Volume 9
6-16
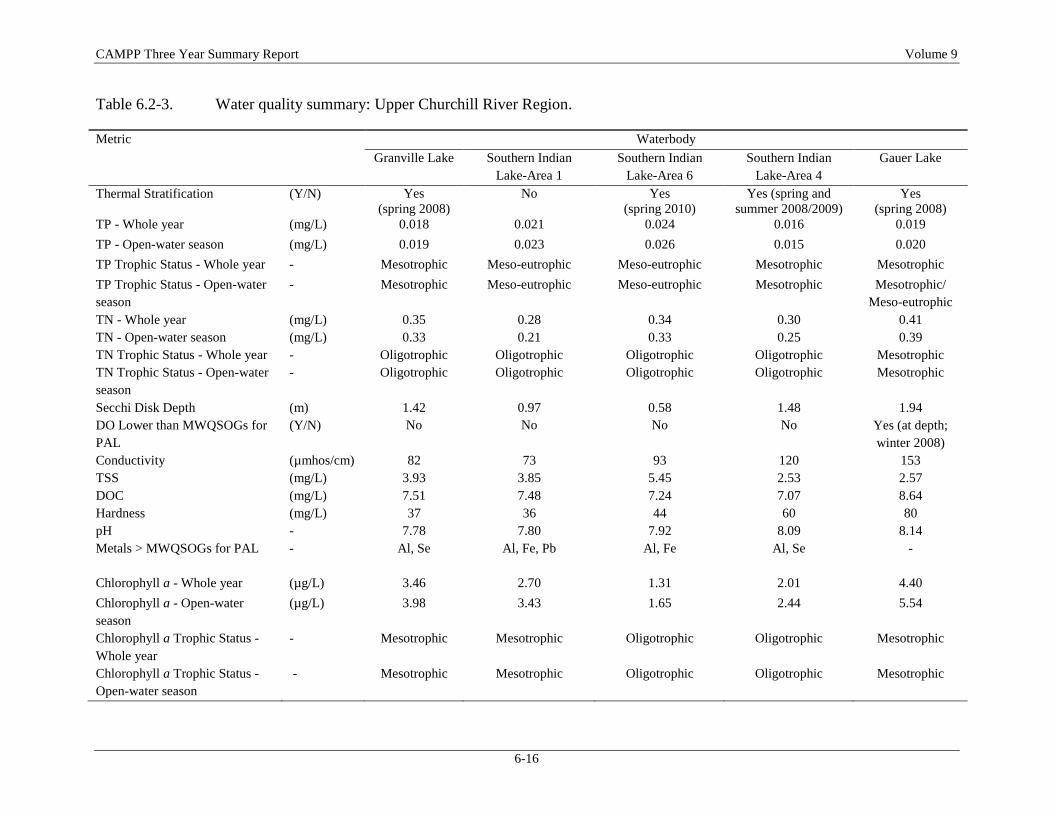
Table 6.2-3. Water quality summary: Upper Churchill River Region.
Metric
Waterbody
Granville Lake Southern Indian
Lake-Area 1
Southern Indian
Lake-Area 6
Southern Indian
Lake-Area 4
Gauer Lake
Thermal Stratification (Y/N) Yes
(spring 2008)
No Yes
(spring 2010)
Yes (spring and
summer 2008/2009)
Yes
(spring 2008)
TP - Whole year (mg/L) 0.018 0.021 0.024 0.016 0.019
TP - Open-water season (mg/L) 0.019 0.023 0.026 0.015 0.020
TP Trophic Status - Whole year - Mesotrophic Meso-eutrophic Meso-eutrophic Mesotrophic Mesotrophic
TP Trophic Status - Open-water
season
- Mesotrophic Meso-eutrophic Meso-eutrophic Mesotrophic Mesotrophic/
Meso-eutrophic
TN - Whole year (mg/L) 0.35 0.28 0.34 0.30 0.41
TN - Open-water season (mg/L) 0.33 0.21 0.33 0.25 0.39
TN Trophic Status - Whole year - Oligotrophic Oligotrophic Oligotrophic Oligotrophic Mesotrophic
TN Trophic Status - Open-water
season
- Oligotrophic Oligotrophic Oligotrophic Oligotrophic Mesotrophic
Secchi Disk Depth (m) 1.42 0.97 0.58 1.48 1.94
DO Lower than MWQSOGs for
PAL
(Y/N) No No No No Yes (at depth;
winter 2008)
Conductivity (µmhos/cm) 82 73 93 120 153
TSS (mg/L) 3.93 3.85 5.45 2.53 2.57
DOC (mg/L) 7.51 7.48 7.24 7.07 8.64
Hardness (mg/L) 37 36 44 60 80
pH - 7.78 7.80 7.92 8.09 8.14
Metals > MWQSOGs for PAL - Al, Se Al, Fe, Pb Al, Fe Al, Se -
Chlorophyll a - Whole year (µg/L) 3.46 2.70 1.31 2.01 4.40
Chlorophyll a - Open-water
season
(µg/L) 3.98 3.43 1.65 2.44 5.54
Chlorophyll a Trophic Status -
Whole year
- Mesotrophic Mesotrophic Oligotrophic Oligotrophic Mesotrophic
Chlorophyll a Trophic Status -
Open-water season
- Mesotrophic Mesotrophic Oligotrophic Oligotrophic Mesotrophic
CAMPP Three Year Summary Report Volume 9
6-17
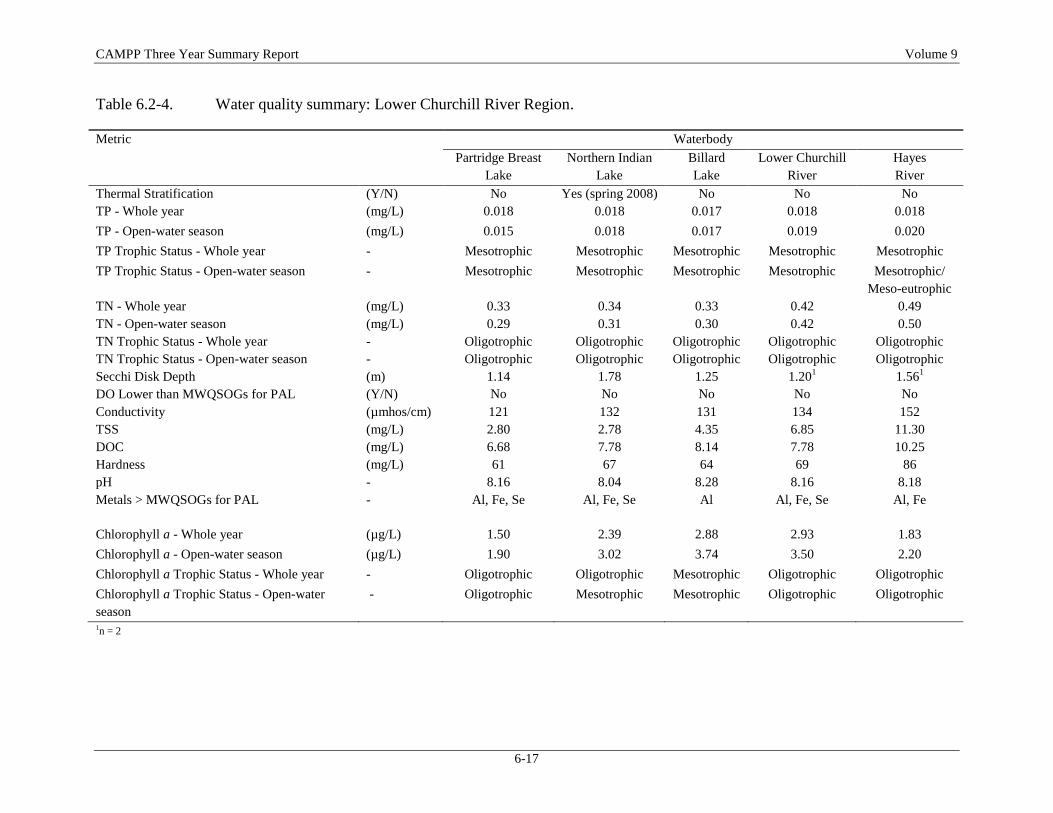
Table 6.2-4. Water quality summary: Lower Churchill River Region.
Metric
Waterbody
Partridge Breast
Lake
Northern Indian
Lake
Billard
Lake
Lower Churchill
River
Hayes
River
Thermal Stratification (Y/N) No Yes (spring 2008) No No No
TP - Whole year (mg/L) 0.018 0.018 0.017 0.018 0.018
TP - Open-water season (mg/L) 0.015 0.018 0.017 0.019 0.020
TP Trophic Status - Whole year - Mesotrophic Mesotrophic Mesotrophic Mesotrophic Mesotrophic
TP Trophic Status - Open-water season - Mesotrophic Mesotrophic Mesotrophic Mesotrophic Mesotrophic/
Meso-eutrophic
TN - Whole year (mg/L) 0.33 0.34 0.33 0.42 0.49
TN - Open-water season (mg/L) 0.29 0.31 0.30 0.42 0.50
TN Trophic Status - Whole year - Oligotrophic Oligotrophic Oligotrophic Oligotrophic Oligotrophic
TN Trophic Status - Open-water season - Oligotrophic Oligotrophic Oligotrophic Oligotrophic Oligotrophic
Secchi Disk Depth (m) 1.14 1.78 1.25 1.201 1.56
1
DO Lower than MWQSOGs for PAL (Y/N) No No No No No Conductivity (µmhos/cm) 121 132 131 134 152
TSS (mg/L) 2.80 2.78 4.35 6.85 11.30
DOC (mg/L) 6.68 7.78 8.14 7.78 10.25
Hardness (mg/L) 61 67 64 69 86
pH - 8.16 8.04 8.28 8.16 8.18
Metals > MWQSOGs for PAL - Al, Fe, Se Al, Fe, Se Al Al, Fe, Se Al, Fe
Chlorophyll a - Whole year (µg/L) 1.50 2.39 2.88 2.93 1.83
Chlorophyll a - Open-water season (µg/L) 1.90 3.02 3.74 3.50 2.20
Chlorophyll a Trophic Status - Whole year - Oligotrophic Oligotrophic Mesotrophic Oligotrophic Oligotrophic
Chlorophyll a Trophic Status - Open-water
season
- Oligotrophic Mesotrophic Mesotrophic Oligotrophic Oligotrophic
1n = 2
CAMPP Three Year Summary Report Volume 9
6-18
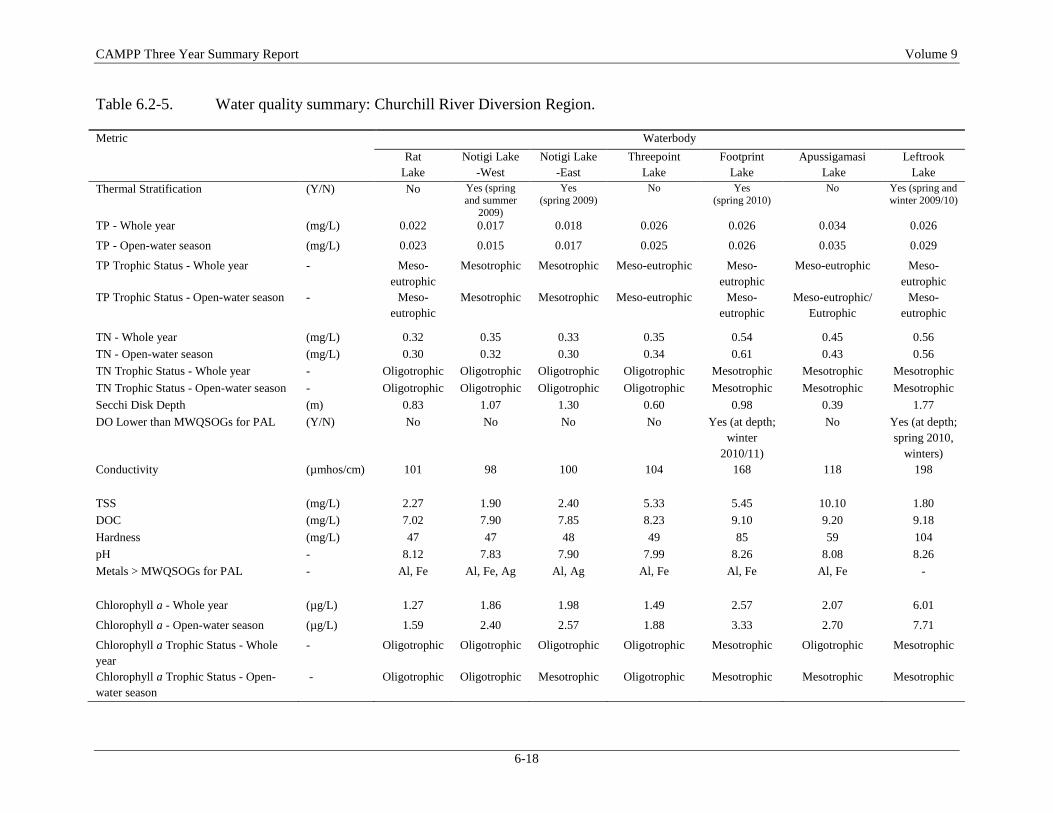
Table 6.2-5. Water quality summary: Churchill River Diversion Region.
Metric
Waterbody
Rat
Lake
Notigi Lake
-West
Notigi Lake
-East
Threepoint
Lake
Footprint
Lake
Apussigamasi
Lake
Leftrook
Lake
Thermal Stratification (Y/N) No Yes (spring
and summer
2009)
Yes
(spring 2009)
No Yes
(spring 2010)
No Yes (spring and
winter 2009/10)
TP - Whole year (mg/L) 0.022 0.017 0.018 0.026 0.026 0.034 0.026
TP - Open-water season (mg/L) 0.023 0.015 0.017 0.025 0.026 0.035 0.029
TP Trophic Status - Whole year - Meso-
eutrophic
Mesotrophic Mesotrophic Meso-eutrophic Meso-
eutrophic
Meso-eutrophic Meso-
eutrophic
TP Trophic Status - Open-water season - Meso-
eutrophic
Mesotrophic Mesotrophic Meso-eutrophic Meso-
eutrophic
Meso-eutrophic/
Eutrophic
Meso-
eutrophic
TN - Whole year (mg/L) 0.32 0.35 0.33 0.35 0.54 0.45 0.56
TN - Open-water season (mg/L) 0.30 0.32 0.30 0.34 0.61 0.43 0.56
TN Trophic Status - Whole year - Oligotrophic Oligotrophic Oligotrophic Oligotrophic Mesotrophic Mesotrophic Mesotrophic
TN Trophic Status - Open-water season - Oligotrophic Oligotrophic Oligotrophic Oligotrophic Mesotrophic Mesotrophic Mesotrophic
Secchi Disk Depth (m) 0.83 1.07 1.30 0.60 0.98 0.39 1.77
DO Lower than MWQSOGs for PAL (Y/N) No No No No Yes (at depth;
winter
2010/11)
No Yes (at depth;
spring 2010,
winters)
Conductivity (µmhos/cm) 101 98 100 104 168 118 198
TSS (mg/L) 2.27 1.90 2.40 5.33 5.45 10.10 1.80
DOC (mg/L) 7.02 7.90 7.85 8.23 9.10 9.20 9.18
Hardness (mg/L) 47 47 48 49 85 59 104
pH - 8.12 7.83 7.90 7.99 8.26 8.08 8.26
Metals > MWQSOGs for PAL - Al, Fe Al, Fe, Ag Al, Ag Al, Fe Al, Fe Al, Fe -
Chlorophyll a - Whole year (µg/L) 1.27 1.86 1.98 1.49 2.57 2.07 6.01
Chlorophyll a - Open-water season (µg/L) 1.59 2.40 2.57 1.88 3.33 2.70 7.71
Chlorophyll a Trophic Status - Whole
year
- Oligotrophic Oligotrophic Oligotrophic Oligotrophic Mesotrophic Oligotrophic Mesotrophic
Chlorophyll a Trophic Status - Open-
water season
- Oligotrophic Oligotrophic Mesotrophic Oligotrophic Mesotrophic Mesotrophic Mesotrophic
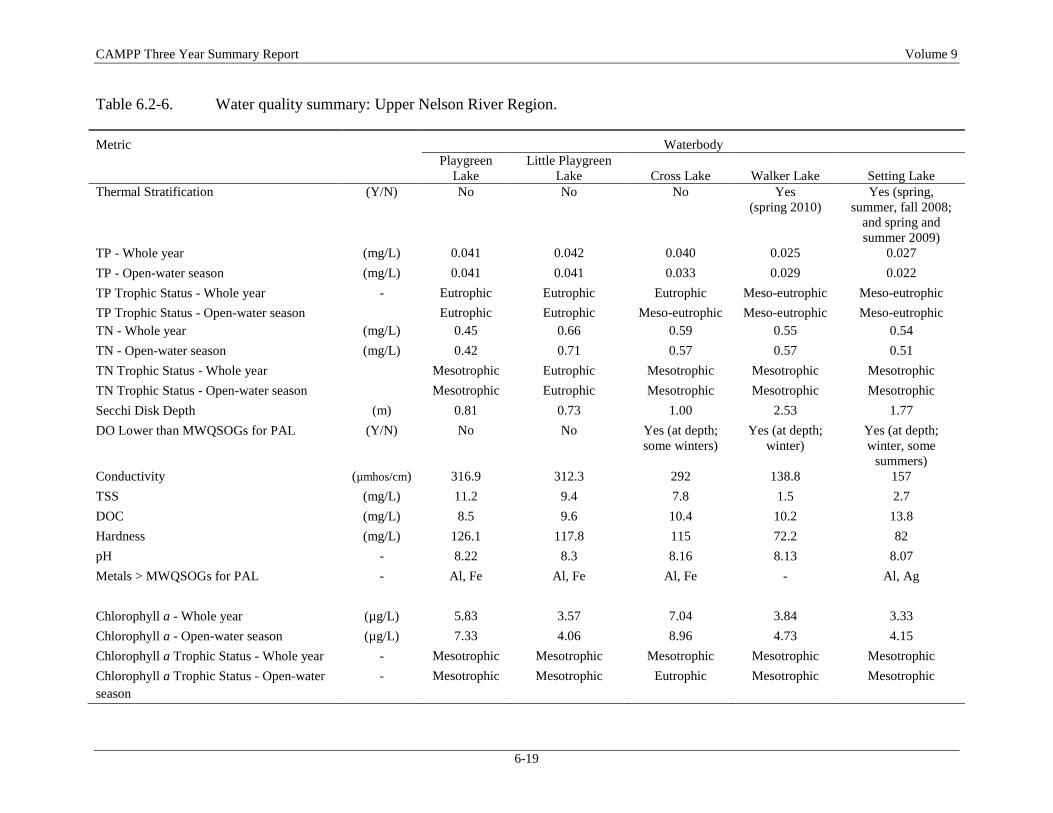
CAMPP Three Year Summary Report Volume 9
6-19
Table 6.2-6. Water quality summary: Upper Nelson River Region.
Metric
Waterbody
Playgreen
Lake
Little Playgreen
Lake Cross Lake Walker Lake Setting Lake
Thermal Stratification (Y/N) No No No Yes
(spring 2010)
Yes (spring,
summer, fall 2008;
and spring and
summer 2009)
TP - Whole year (mg/L) 0.041 0.042 0.040 0.025 0.027
TP - Open-water season (mg/L) 0.041 0.041 0.033 0.029 0.022
TP Trophic Status - Whole year - Eutrophic Eutrophic Eutrophic Meso-eutrophic Meso-eutrophic
TP Trophic Status - Open-water season Eutrophic Eutrophic Meso-eutrophic Meso-eutrophic Meso-eutrophic
TN - Whole year (mg/L) 0.45 0.66 0.59 0.55 0.54
TN - Open-water season (mg/L) 0.42 0.71 0.57 0.57 0.51
TN Trophic Status - Whole year Mesotrophic Eutrophic Mesotrophic Mesotrophic Mesotrophic
TN Trophic Status - Open-water season Mesotrophic Eutrophic Mesotrophic Mesotrophic Mesotrophic
Secchi Disk Depth (m) 0.81 0.73 1.00 2.53 1.77
DO Lower than MWQSOGs for PAL (Y/N) No No Yes (at depth;
some winters)
Yes (at depth;
winter)
Yes (at depth;
winter, some
summers)
Conductivity (µmhos/cm) 316.9 312.3 292 138.8 157
TSS (mg/L) 11.2 9.4 7.8 1.5 2.7
DOC (mg/L) 8.5 9.6 10.4 10.2 13.8
Hardness (mg/L) 126.1 117.8 115 72.2 82
pH - 8.22 8.3 8.16 8.13 8.07
Metals > MWQSOGs for PAL - Al, Fe Al, Fe Al, Fe - Al, Ag
Chlorophyll a - Whole year (µg/L) 5.83 3.57 7.04 3.84 3.33
Chlorophyll a - Open-water season (µg/L) 7.33 4.06 8.96 4.73 4.15
Chlorophyll a Trophic Status - Whole year - Mesotrophic Mesotrophic Mesotrophic Mesotrophic Mesotrophic
Chlorophyll a Trophic Status - Open-water
season
- Mesotrophic Mesotrophic Eutrophic Mesotrophic Mesotrophic
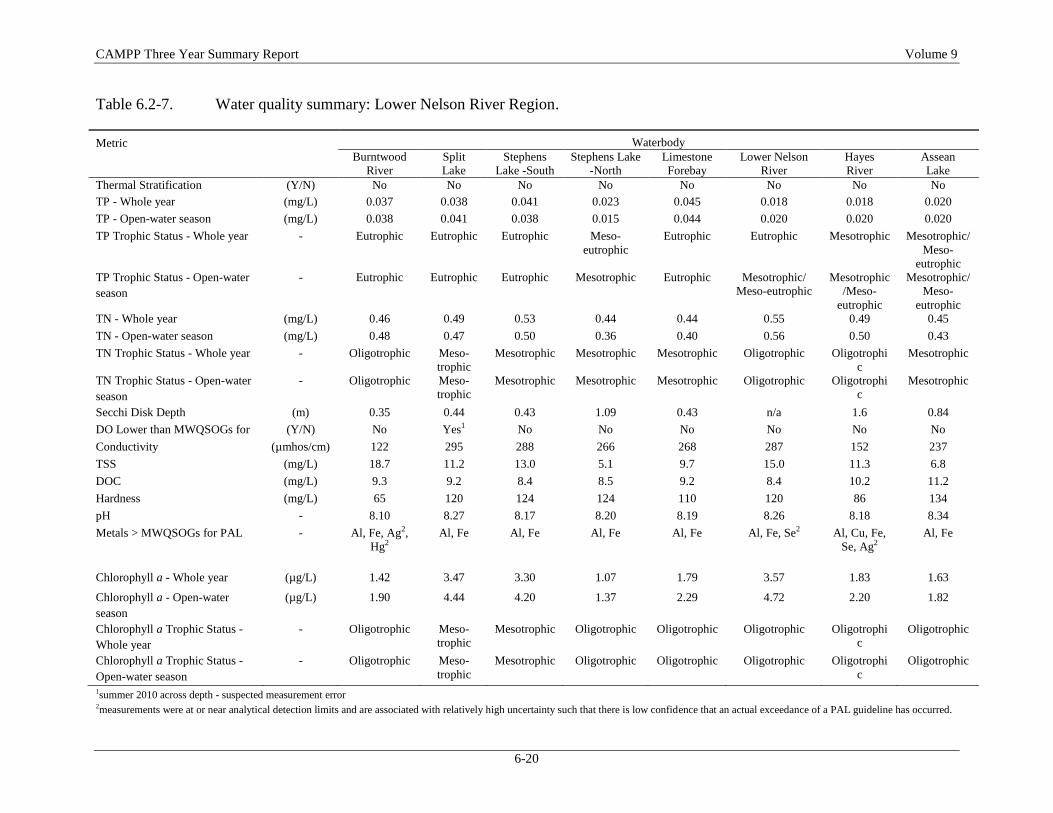
CAMPP Three Year Summary Report Volume 9
6-20
Table 6.2-7. Water quality summary: Lower Nelson River Region.
Metric
Waterbody
Burntwood
River
Split
Lake
Stephens
Lake -South
Stephens Lake
-North
Limestone
Forebay
Lower Nelson
River
Hayes
River
Assean
Lake
Thermal Stratification (Y/N) No No No No No No No No
TP - Whole year (mg/L) 0.037 0.038 0.041 0.023 0.045 0.018 0.018 0.020
TP - Open-water season (mg/L) 0.038 0.041 0.038 0.015 0.044 0.020 0.020 0.020
TP Trophic Status - Whole year - Eutrophic Eutrophic Eutrophic Meso-
eutrophic
Eutrophic Eutrophic Mesotrophic Mesotrophic/
Meso-
eutrophic
TP Trophic Status - Open-water
season
- Eutrophic Eutrophic Eutrophic Mesotrophic Eutrophic Mesotrophic/
Meso-eutrophic
Mesotrophic
/Meso-
eutrophic
Mesotrophic/
Meso-
eutrophic
TN - Whole year (mg/L) 0.46 0.49 0.53 0.44 0.44 0.55 0.49 0.45
TN - Open-water season (mg/L) 0.48 0.47 0.50 0.36 0.40 0.56 0.50 0.43
TN Trophic Status - Whole year - Oligotrophic Meso-
trophic
Mesotrophic Mesotrophic Mesotrophic Oligotrophic Oligotrophi
c
Mesotrophic
TN Trophic Status - Open-water
season
- Oligotrophic Meso-
trophic
Mesotrophic Mesotrophic Mesotrophic Oligotrophic Oligotrophi
c
Mesotrophic
Secchi Disk Depth (m) 0.35 0.44 0.43 1.09 0.43 n/a 1.6 0.84
DO Lower than MWQSOGs for
PAL
(Y/N) No Yes1 No No No No No No
Conductivity (µmhos/cm) 122 295 288 266 268 287 152 237
TSS (mg/L) 18.7 11.2 13.0 5.1 9.7 15.0 11.3 6.8
DOC (mg/L) 9.3 9.2 8.4 8.5 9.2 8.4 10.2 11.2
Hardness (mg/L) 65 120 124 124 110 120 86 134
pH - 8.10 8.27 8.17 8.20 8.19 8.26 8.18 8.34
Metals > MWQSOGs for PAL - Al, Fe, Ag2,
Hg2
Al, Fe Al, Fe Al, Fe Al, Fe Al, Fe, Se2 Al, Cu, Fe,
Se, Ag2
Al, Fe
Chlorophyll a - Whole year (µg/L) 1.42 3.47 3.30 1.07 1.79 3.57 1.83 1.63
Chlorophyll a - Open-water
season
(µg/L) 1.90 4.44 4.20 1.37 2.29 4.72 2.20 1.82
Chlorophyll a Trophic Status -
Whole year
- Oligotrophic Meso-
trophic
Mesotrophic Oligotrophic Oligotrophic Oligotrophic Oligotrophi
c
Oligotrophic
Chlorophyll a Trophic Status -
Open-water season
- Oligotrophic Meso-
trophic
Mesotrophic Oligotrophic Oligotrophic Oligotrophic Oligotrophi
c
Oligotrophic
1summer 2010 across depth - suspected measurement error 2measurements were at or near analytical detection limits and are associated with relatively high uncertainty such that there is low confidence that an actual exceedance of a PAL guideline has occurred.
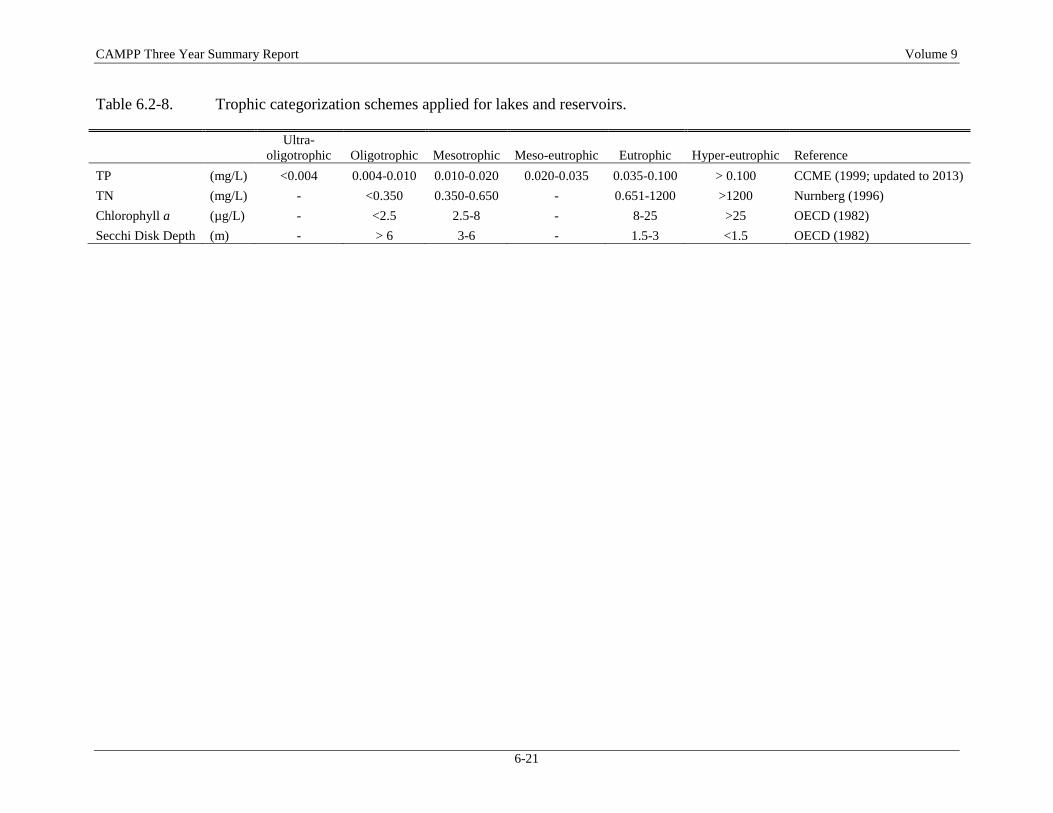
CAMPP Three Year Summary Report Volume 9
6-21
Table 6.2-8. Trophic categorization schemes applied for lakes and reservoirs.
Ultra-
oligotrophic Oligotrophic Mesotrophic Meso-eutrophic Eutrophic Hyper-eutrophic Reference
TP (mg/L) <0.004 0.004-0.010 0.010-0.020 0.020-0.035 0.035-0.100 > 0.100 CCME (1999; updated to 2013)
TN (mg/L) - <0.350 0.350-0.650 - 0.651-1200 >1200 Nurnberg (1996)
Chlorophyll a (µg/L) - <2.5 2.5-8 - 8-25 >25 OECD (1982)
Secchi Disk Depth (m) - > 6 3-6 - 1.5-3 <1.5 OECD (1982)
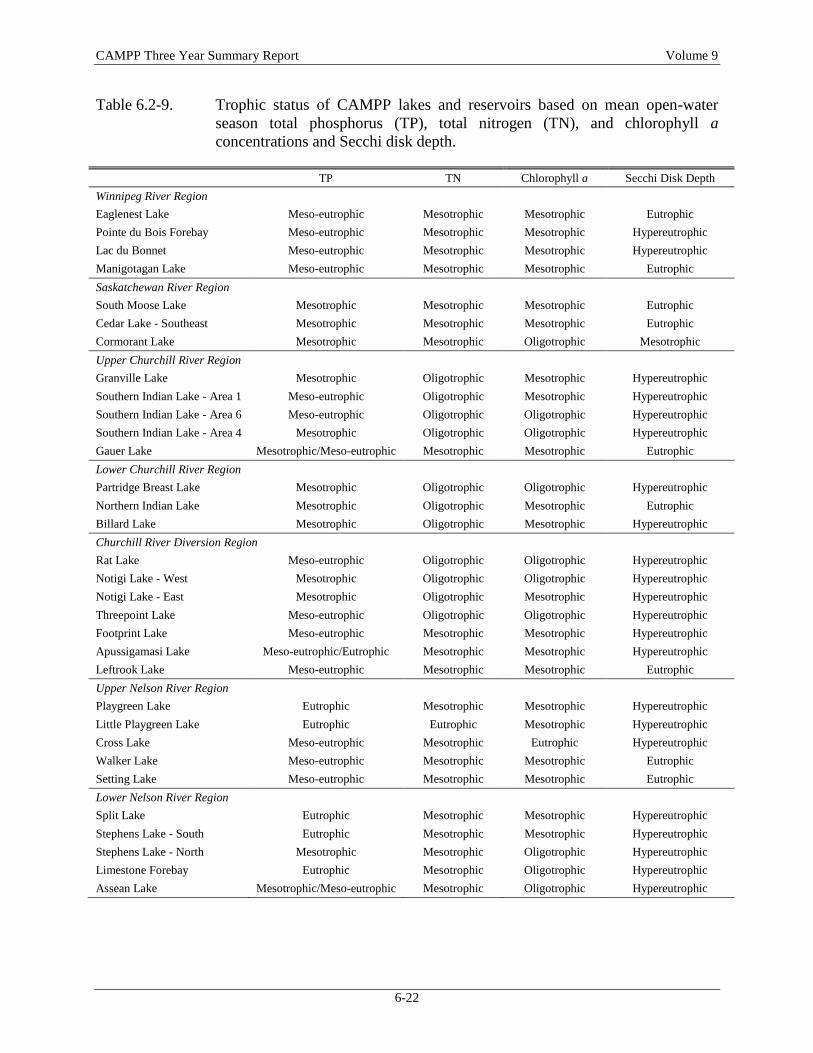
CAMPP Three Year Summary Report Volume 9
6-22
Table 6.2-9. Trophic status of CAMPP lakes and reservoirs based on mean open-water
season total phosphorus (TP), total nitrogen (TN), and chlorophyll a
concentrations and Secchi disk depth.
TP TN Chlorophyll a Secchi Disk Depth
Winnipeg River Region
Eaglenest Lake Meso-eutrophic Mesotrophic Mesotrophic Eutrophic
Pointe du Bois Forebay Meso-eutrophic Mesotrophic Mesotrophic Hypereutrophic
Lac du Bonnet Meso-eutrophic Mesotrophic Mesotrophic Hypereutrophic
Manigotagan Lake Meso-eutrophic Mesotrophic Mesotrophic Eutrophic
Saskatchewan River Region
South Moose Lake Mesotrophic Mesotrophic Mesotrophic Eutrophic
Cedar Lake - Southeast Mesotrophic Mesotrophic Mesotrophic Eutrophic
Cormorant Lake Mesotrophic Mesotrophic Oligotrophic Mesotrophic
Upper Churchill River Region
Granville Lake Mesotrophic Oligotrophic Mesotrophic Hypereutrophic
Southern Indian Lake - Area 1 Meso-eutrophic Oligotrophic Mesotrophic Hypereutrophic
Southern Indian Lake - Area 6 Meso-eutrophic Oligotrophic Oligotrophic Hypereutrophic
Southern Indian Lake - Area 4 Mesotrophic Oligotrophic Oligotrophic Hypereutrophic
Gauer Lake Mesotrophic/Meso-eutrophic Mesotrophic Mesotrophic Eutrophic
Lower Churchill River Region
Partridge Breast Lake Mesotrophic Oligotrophic Oligotrophic Hypereutrophic
Northern Indian Lake Mesotrophic Oligotrophic Mesotrophic Eutrophic
Billard Lake Mesotrophic Oligotrophic Mesotrophic Hypereutrophic
Churchill River Diversion Region
Rat Lake Meso-eutrophic Oligotrophic Oligotrophic Hypereutrophic
Notigi Lake - West Mesotrophic Oligotrophic Oligotrophic Hypereutrophic
Notigi Lake - East Mesotrophic Oligotrophic Mesotrophic Hypereutrophic
Threepoint Lake Meso-eutrophic Oligotrophic Oligotrophic Hypereutrophic
Footprint Lake Meso-eutrophic Mesotrophic Mesotrophic Hypereutrophic
Apussigamasi Lake Meso-eutrophic/Eutrophic Mesotrophic Mesotrophic Hypereutrophic
Leftrook Lake Meso-eutrophic Mesotrophic Mesotrophic Eutrophic
Upper Nelson River Region
Playgreen Lake Eutrophic Mesotrophic Mesotrophic Hypereutrophic
Little Playgreen Lake Eutrophic Eutrophic Mesotrophic Hypereutrophic
Cross Lake Meso-eutrophic Mesotrophic Eutrophic Hypereutrophic
Walker Lake Meso-eutrophic Mesotrophic Mesotrophic Eutrophic
Setting Lake Meso-eutrophic Mesotrophic Mesotrophic Eutrophic
Lower Nelson River Region
Split Lake Eutrophic Mesotrophic Mesotrophic Hypereutrophic
Stephens Lake - South Eutrophic Mesotrophic Mesotrophic Hypereutrophic
Stephens Lake - North Mesotrophic Mesotrophic Oligotrophic Hypereutrophic
Limestone Forebay Eutrophic Mesotrophic Oligotrophic Hypereutrophic
Assean Lake Mesotrophic/Meso-eutrophic Mesotrophic Oligotrophic Hypereutrophic
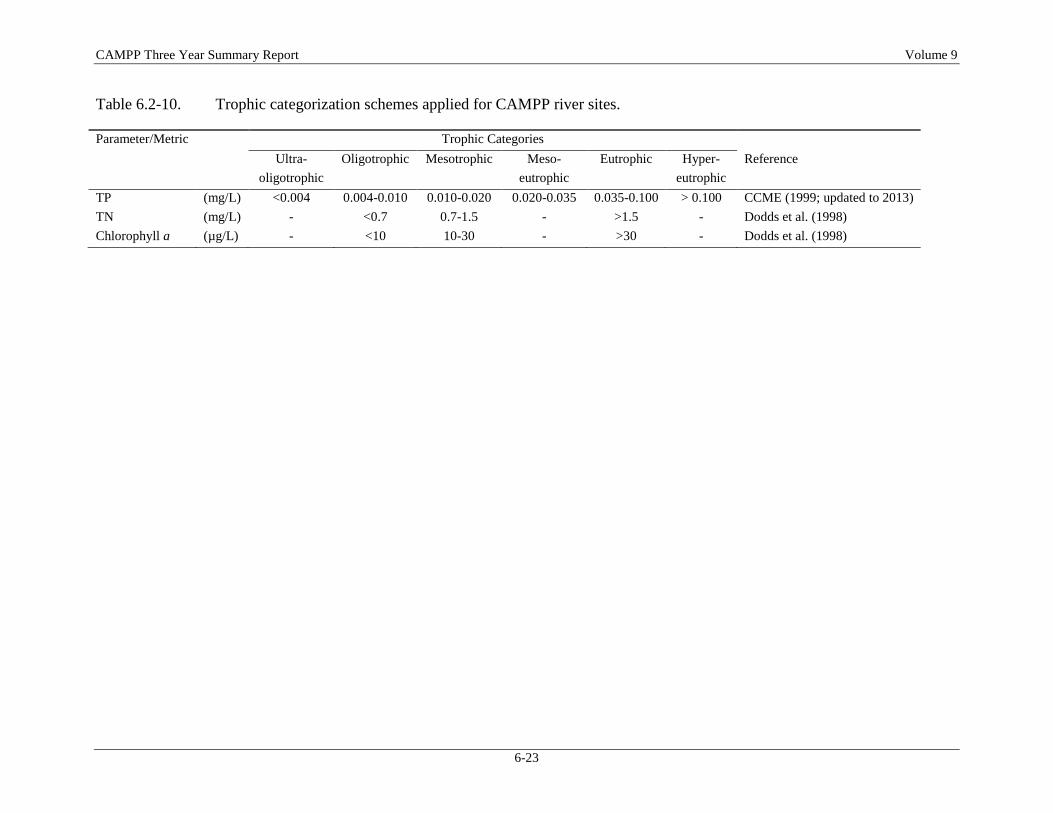
CAMPP Three Year Summary Report Volume 9
6-23
Table 6.2-10. Trophic categorization schemes applied for CAMPP river sites.
Parameter/Metric
Trophic Categories
Ultra-
oligotrophic
Oligotrophic Mesotrophic Meso-
eutrophic
Eutrophic Hyper-
eutrophic
Reference
TP (mg/L) <0.004 0.004-0.010 0.010-0.020 0.020-0.035 0.035-0.100 > 0.100 CCME (1999; updated to 2013)
TN (mg/L) - <0.7 0.7-1.5 - >1.5 - Dodds et al. (1998)
Chlorophyll a (µg/L) - <10 10-30 - >30 - Dodds et al. (1998)
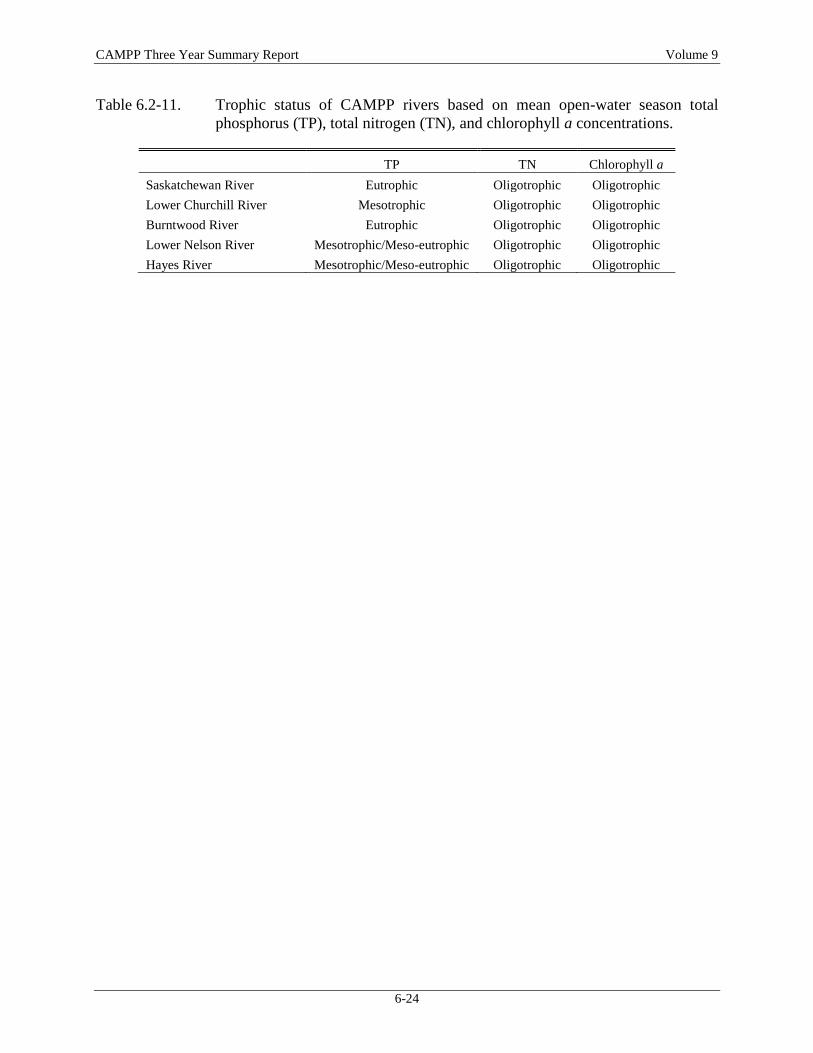
CAMPP Three Year Summary Report Volume 9
6-24
Table 6.2-11. Trophic status of CAMPP rivers based on mean open-water season total
phosphorus (TP), total nitrogen (TN), and chlorophyll a concentrations.
TP TN Chlorophyll a
Saskatchewan River Eutrophic Oligotrophic Oligotrophic
Lower Churchill River Mesotrophic Oligotrophic Oligotrophic
Burntwood River Eutrophic Oligotrophic Oligotrophic
Lower Nelson River Mesotrophic/Meso-eutrophic Oligotrophic Oligotrophic
Hayes River Mesotrophic/Meso-eutrophic Oligotrophic Oligotrophic
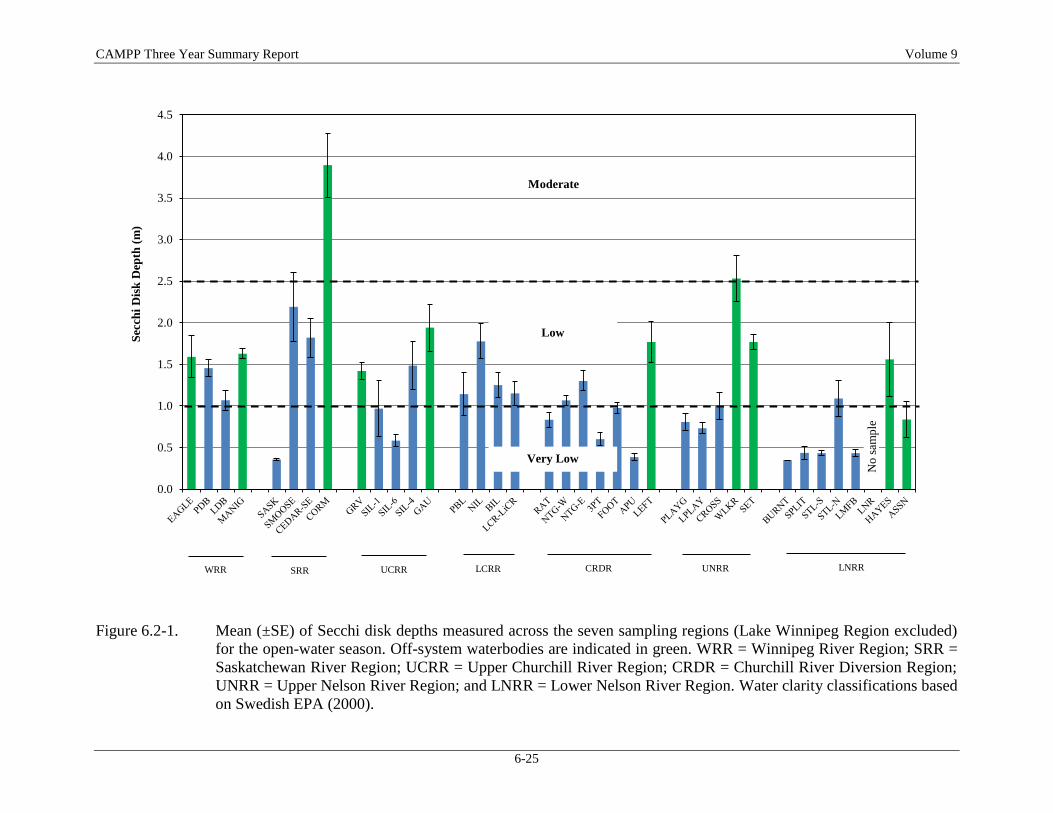
CAMPP Three Year Summary Report Volume 9
6-25
Figure 6.2-1. Mean (±SE) of Secchi disk depths measured across the seven sampling regions (Lake Winnipeg Region excluded)
for the open-water season. Off-system waterbodies are indicated in green. WRR = Winnipeg River Region; SRR =
Saskatchewan River Region; UCRR = Upper Churchill River Region; CRDR = Churchill River Diversion Region;
UNRR = Upper Nelson River Region; and LNRR = Lower Nelson River Region. Water clarity classifications based
on Swedish EPA (2000).
0.0
0.5
1.0
1.5
2.0
2.5
3.0
3.5
4.0
4.5
Secc
hi
Dis
k D
epth
(m
)
CRDRWRR SRR UCRR LCRR UNRR LNRR
No
sam
ple
Very Low
Low
Moderate
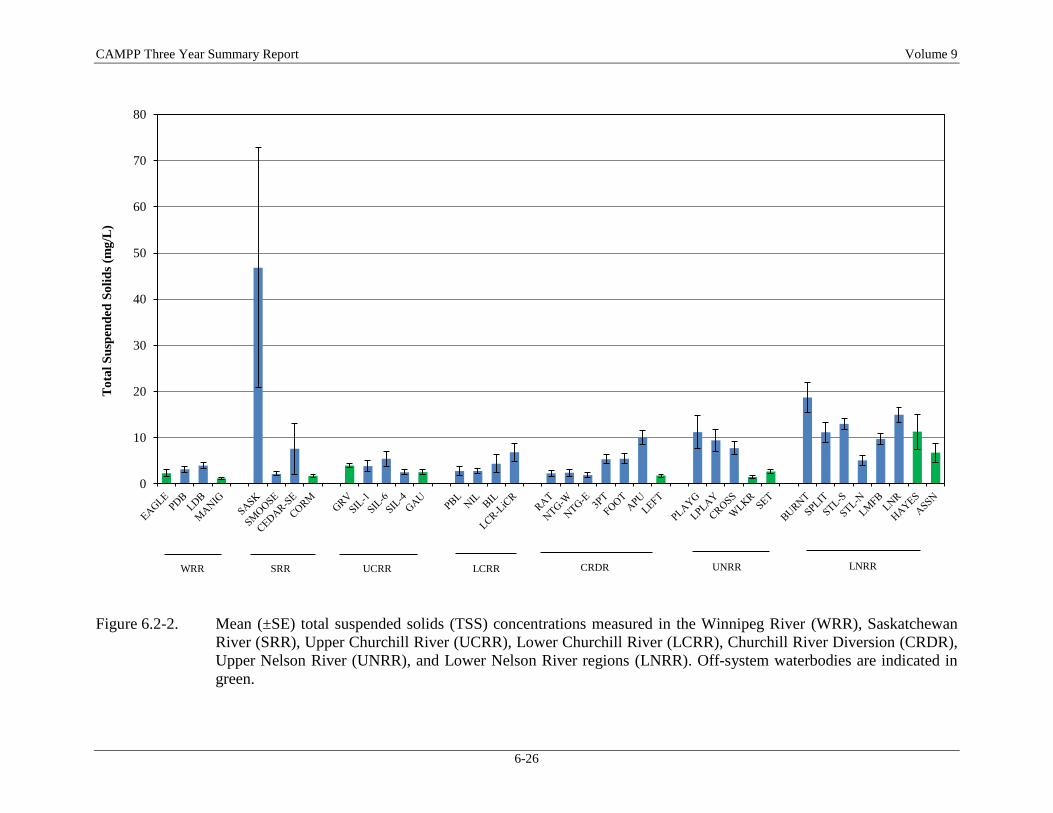
CAMPP Three Year Summary Report Volume 9
6-26
Figure 6.2-2. Mean (±SE) total suspended solids (TSS) concentrations measured in the Winnipeg River (WRR), Saskatchewan
River (SRR), Upper Churchill River (UCRR), Lower Churchill River (LCRR), Churchill River Diversion (CRDR),
Upper Nelson River (UNRR), and Lower Nelson River regions (LNRR). Off-system waterbodies are indicated in
green.
0
10
20
30
40
50
60
70
80T
ota
l S
usp
end
ed S
oli
ds
(mg
/L)
CRDR UNRR LNRRLCRRUCRRSRRWRR
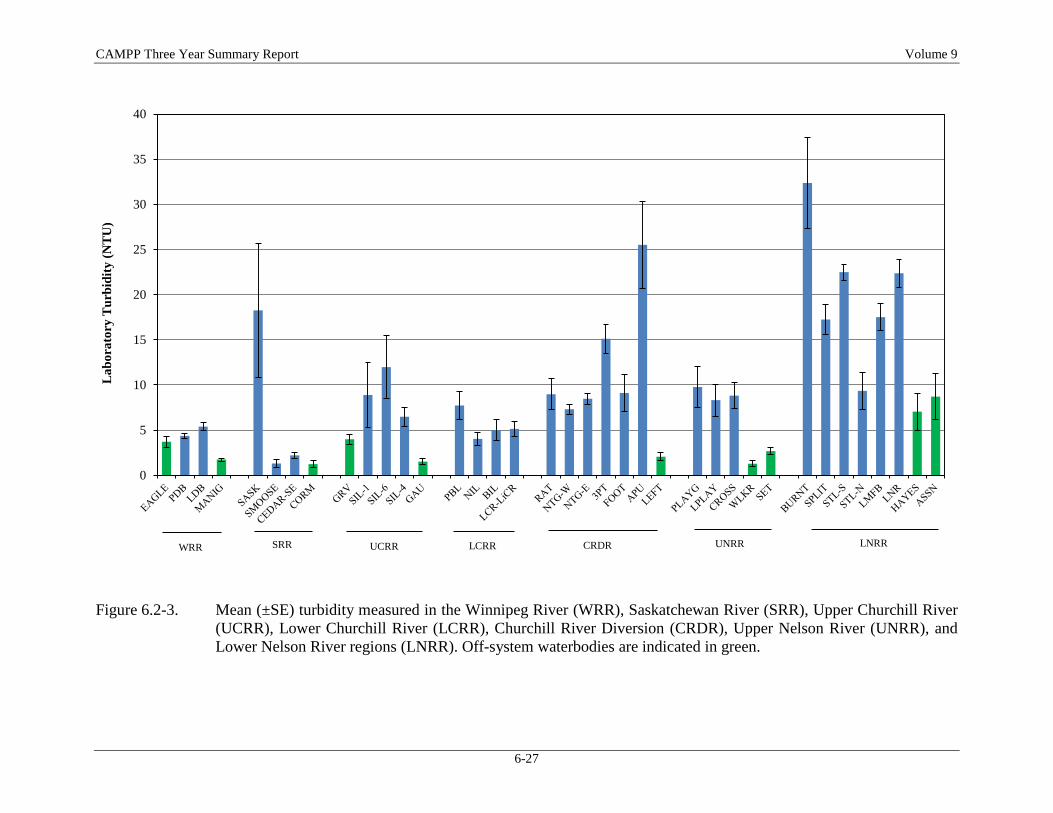
CAMPP Three Year Summary Report Volume 9
6-27
Figure 6.2-3. Mean (±SE) turbidity measured in the Winnipeg River (WRR), Saskatchewan River (SRR), Upper Churchill River
(UCRR), Lower Churchill River (LCRR), Churchill River Diversion (CRDR), Upper Nelson River (UNRR), and
Lower Nelson River regions (LNRR). Off-system waterbodies are indicated in green.
0
5
10
15
20
25
30
35
40L
ab
ora
tory
Tu
rbid
ity
(N
TU
)
LNRRUNRRCRDRLCRRUCRRSRRWRR
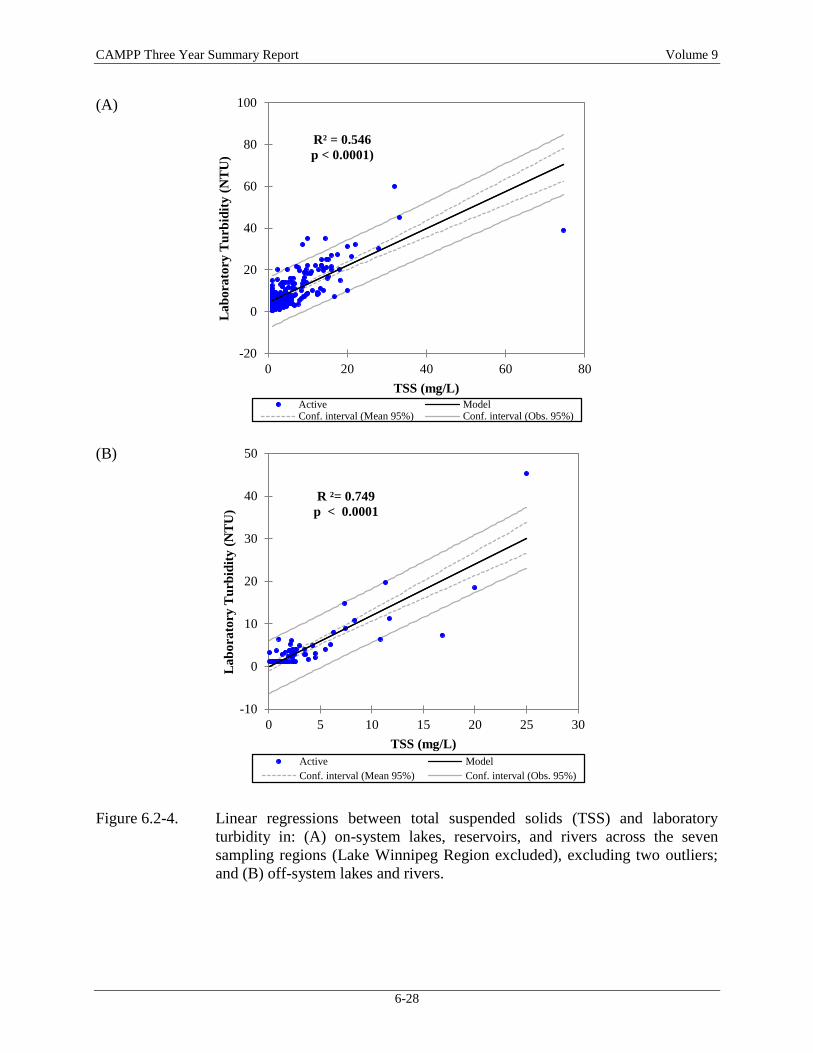
CAMPP Three Year Summary Report Volume 9
6-28
(A)
(B)
Figure 6.2-4. Linear regressions between total suspended solids (TSS) and laboratory
turbidity in: (A) on-system lakes, reservoirs, and rivers across the seven
sampling regions (Lake Winnipeg Region excluded), excluding two outliers;
and (B) off-system lakes and rivers.
-20
0
20
40
60
80
100
0 20 40 60 80
La
bo
rato
ry T
urb
idit
y (
NT
U)
TSS (mg/L)
R² = 0.546
p < 0.0001)
Active ModelConf. interval (Mean 95%) Conf. interval (Obs. 95%)
-10
0
10
20
30
40
50
0 5 10 15 20 25 30
La
bo
rato
ry T
urb
idit
y (
NT
U)
TSS (mg/L)
R ²= 0.749
p < 0.0001
Active Model
Conf. interval (Mean 95%) Conf. interval (Obs. 95%)
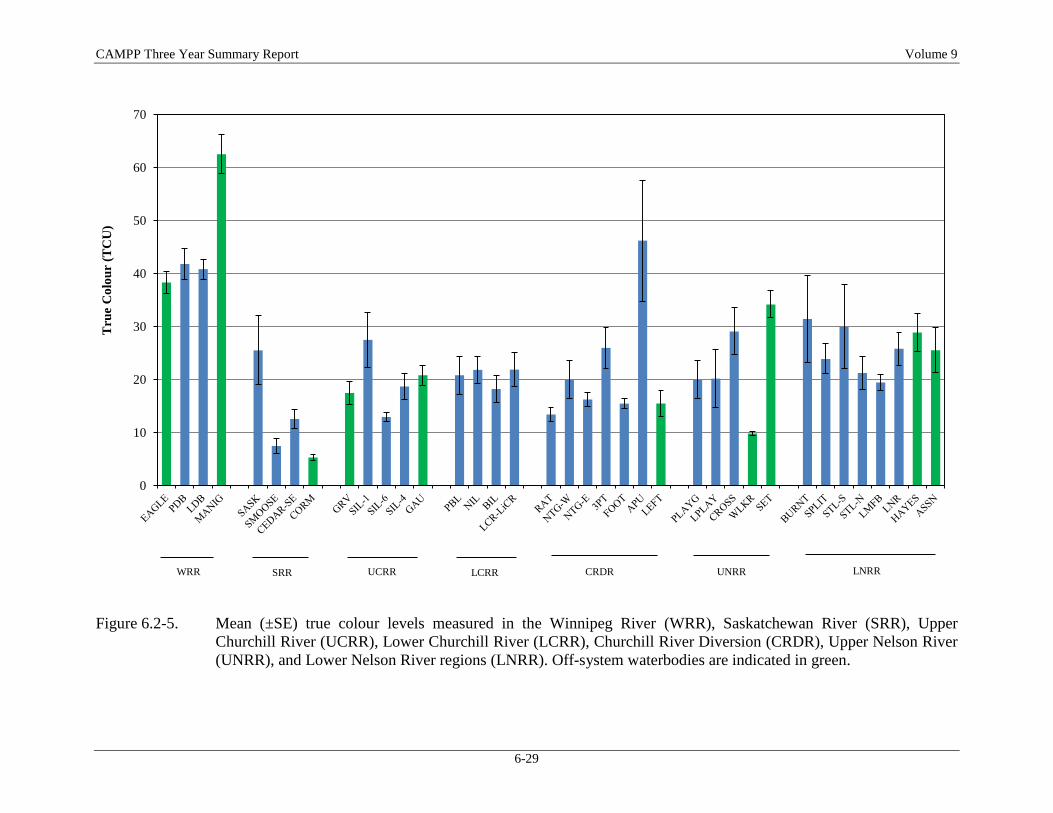
CAMPP Three Year Summary Report Volume 9
6-29
Figure 6.2-5. Mean (±SE) true colour levels measured in the Winnipeg River (WRR), Saskatchewan River (SRR), Upper
Churchill River (UCRR), Lower Churchill River (LCRR), Churchill River Diversion (CRDR), Upper Nelson River
(UNRR), and Lower Nelson River regions (LNRR). Off-system waterbodies are indicated in green.
0
10
20
30
40
50
60
70T
rue
Co
lou
r (T
CU
)
LCRR CRDR UNRR LNRRUCRRSRRWRR
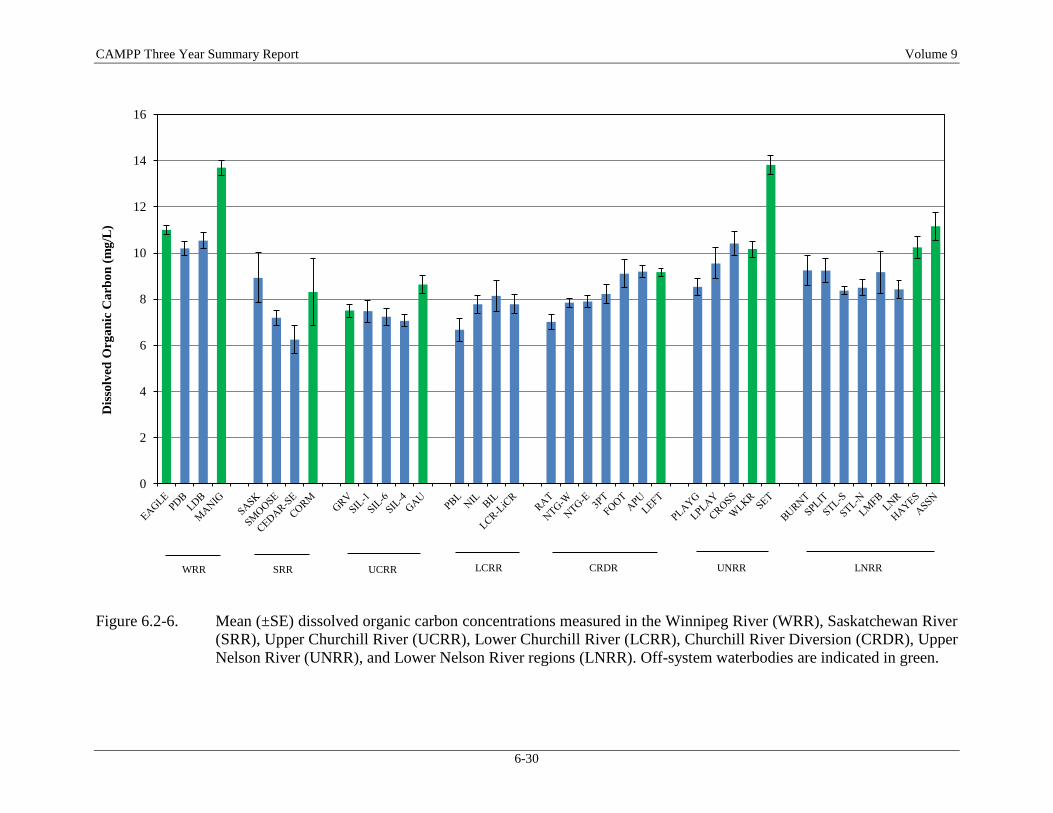
CAMPP Three Year Summary Report Volume 9
6-30
Figure 6.2-6. Mean (±SE) dissolved organic carbon concentrations measured in the Winnipeg River (WRR), Saskatchewan River
(SRR), Upper Churchill River (UCRR), Lower Churchill River (LCRR), Churchill River Diversion (CRDR), Upper
Nelson River (UNRR), and Lower Nelson River regions (LNRR). Off-system waterbodies are indicated in green.
0
2
4
6
8
10
12
14
16D
isso
lved
Org
an
ic C
arb
on
(m
g/L
)
CRDR UNRR LNRRLCRRUCRRSRRWRR
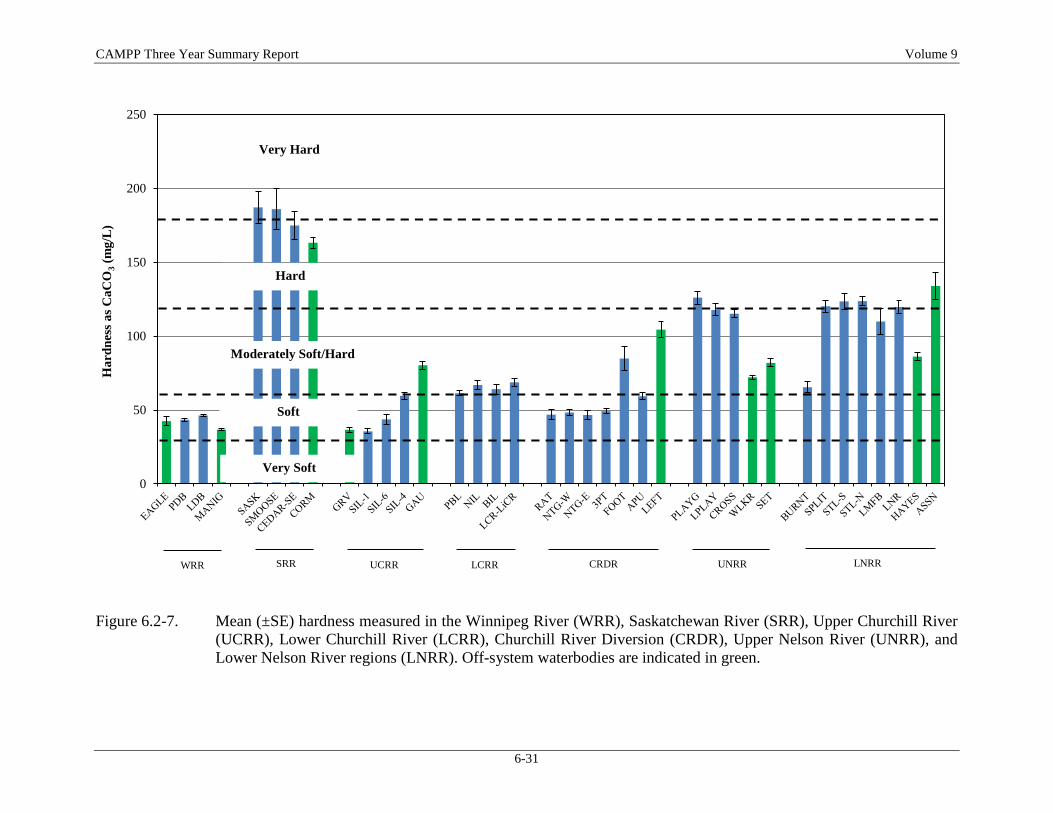
CAMPP Three Year Summary Report Volume 9
6-31
Figure 6.2-7. Mean (±SE) hardness measured in the Winnipeg River (WRR), Saskatchewan River (SRR), Upper Churchill River
(UCRR), Lower Churchill River (LCRR), Churchill River Diversion (CRDR), Upper Nelson River (UNRR), and
Lower Nelson River regions (LNRR). Off-system waterbodies are indicated in green.
0
50
100
150
200
250H
ard
nes
s a
s C
aC
O3
(mg
/L)
Very Hard
Hard
Moderately Soft/Hard
Very Soft
Soft
CRDRLCRR UNRR LNRRUCRRSRRWRR
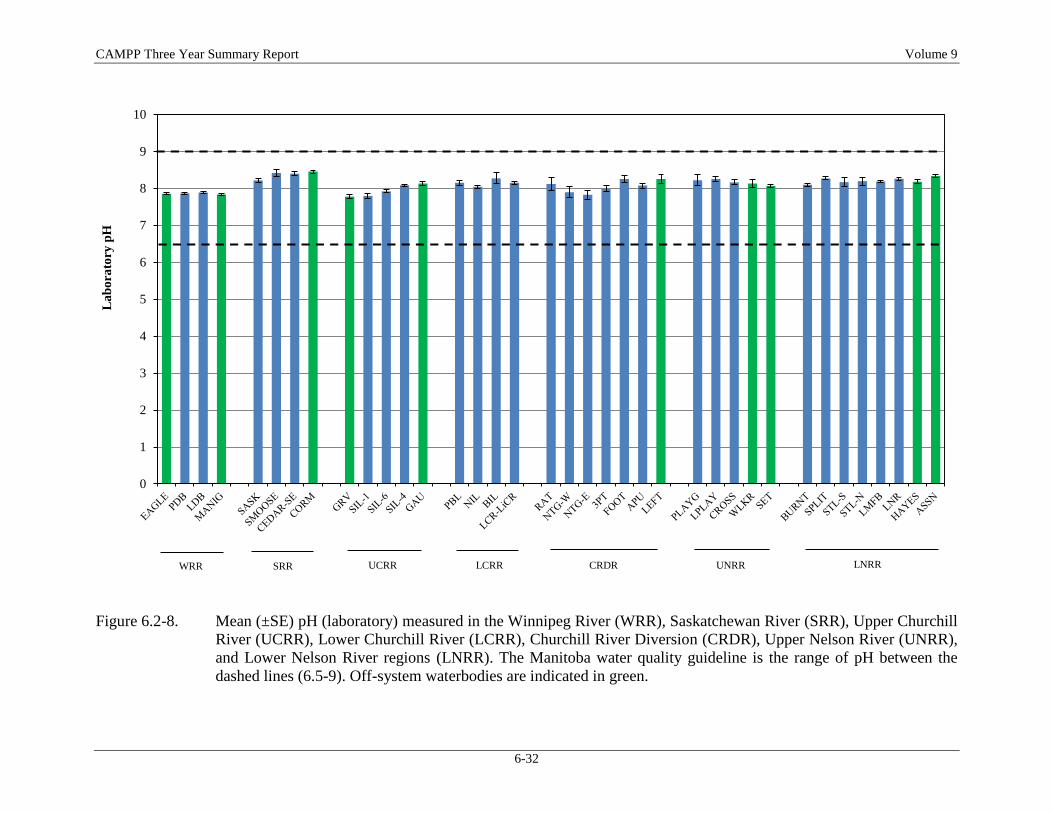
CAMPP Three Year Summary Report Volume 9
6-32
Figure 6.2-8. Mean (±SE) pH (laboratory) measured in the Winnipeg River (WRR), Saskatchewan River (SRR), Upper Churchill
River (UCRR), Lower Churchill River (LCRR), Churchill River Diversion (CRDR), Upper Nelson River (UNRR),
and Lower Nelson River regions (LNRR). The Manitoba water quality guideline is the range of pH between the
dashed lines (6.5-9). Off-system waterbodies are indicated in green.
0
1
2
3
4
5
6
7
8
9
10L
ab
ora
tory
pH
CRDR UNRR LNRRLCRRUCRRSRRWRR

CAMPP Three Year Summary Report Volume 9
6-33
Figure 6.2-9. Mean (±SE) conductivity (laboratory) measured in the Winnipeg River (WRR), Saskatchewan River (SRR), Upper
Churchill River (UCRR), Lower Churchill River (LCRR), Churchill River Diversion (CRDR), Upper Nelson River
(UNRR), and Lower Nelson River regions (LNRR). Off-system waterbodies are indicated in green.
0
50
100
150
200
250
300
350
400
450
500L
ab
ora
tory
Co
nd
uct
ivit
y (
µm
ho
s/cm
)
CRDR UNRR LNRRLCRRUCRRSRRWRR
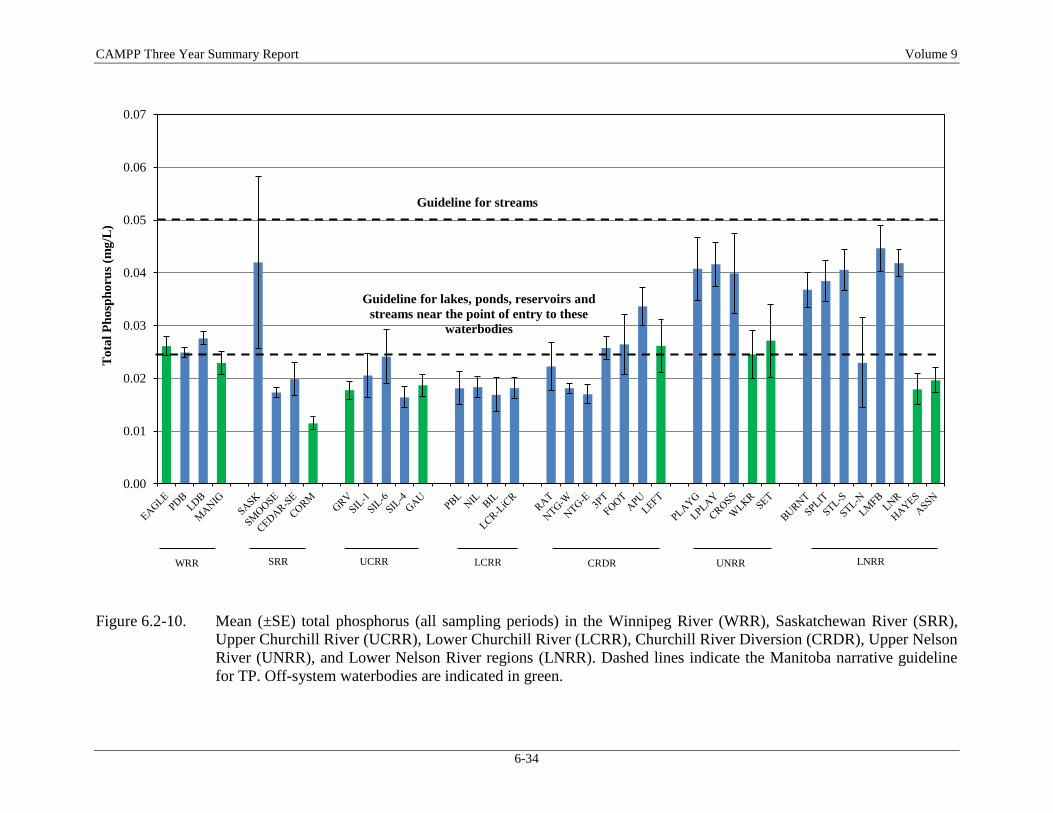
CAMPP Three Year Summary Report Volume 9
6-34
Figure 6.2-10. Mean (±SE) total phosphorus (all sampling periods) in the Winnipeg River (WRR), Saskatchewan River (SRR),
Upper Churchill River (UCRR), Lower Churchill River (LCRR), Churchill River Diversion (CRDR), Upper Nelson
River (UNRR), and Lower Nelson River regions (LNRR). Dashed lines indicate the Manitoba narrative guideline
for TP. Off-system waterbodies are indicated in green.
0.00
0.01
0.02
0.03
0.04
0.05
0.06
0.07T
ota
l P
ho
sph
oru
s (m
g/L
)
Guideline for streams
CRDR UNRR LNRRLCRRUCRRSRRWRR
Guideline for lakes, ponds, reservoirs and
streams near the point of entry to these
waterbodies
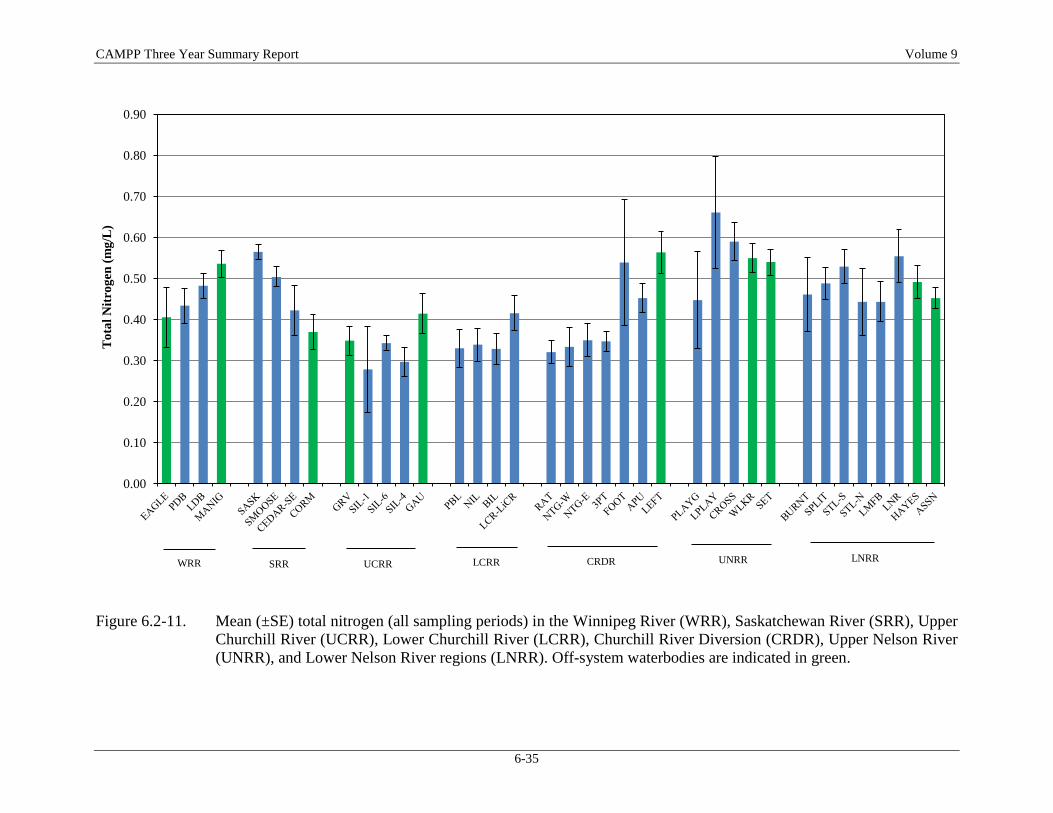
CAMPP Three Year Summary Report Volume 9
6-35
Figure 6.2-11. Mean (±SE) total nitrogen (all sampling periods) in the Winnipeg River (WRR), Saskatchewan River (SRR), Upper
Churchill River (UCRR), Lower Churchill River (LCRR), Churchill River Diversion (CRDR), Upper Nelson River
(UNRR), and Lower Nelson River regions (LNRR). Off-system waterbodies are indicated in green.
0.00
0.10
0.20
0.30
0.40
0.50
0.60
0.70
0.80
0.90T
ota
l N
itro
gen
(m
g/L
)
CRDR UNRR LNRRWRR LCRRUCRRSRR
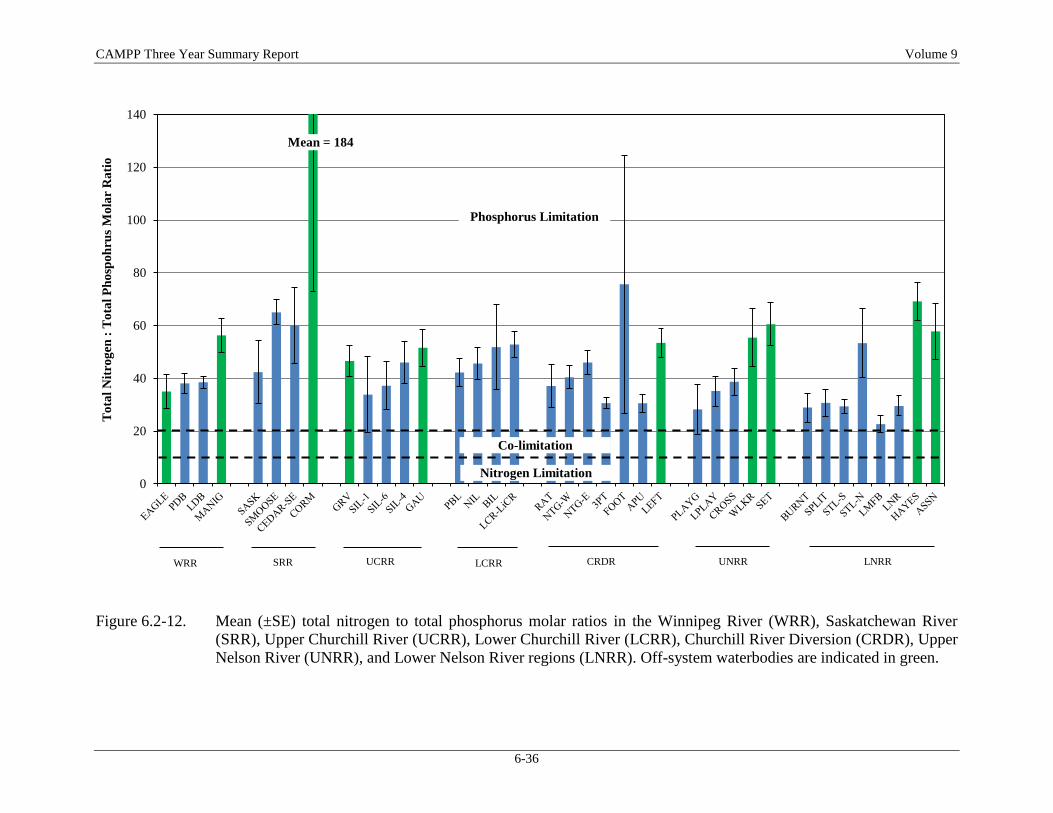
CAMPP Three Year Summary Report Volume 9
6-36
Figure 6.2-12. Mean (±SE) total nitrogen to total phosphorus molar ratios in the Winnipeg River (WRR), Saskatchewan River
(SRR), Upper Churchill River (UCRR), Lower Churchill River (LCRR), Churchill River Diversion (CRDR), Upper
Nelson River (UNRR), and Lower Nelson River regions (LNRR). Off-system waterbodies are indicated in green.
0
20
40
60
80
100
120
140T
ota
l N
itro
gen
: T
ota
l P
ho
spo
hru
s M
ola
r R
ati
o
Phosphorus Limitation
Co-limitation
Nitrogen Limitation
CRDR UNRR LNRRLCRRUCRRSRRWRR
Mean = 184
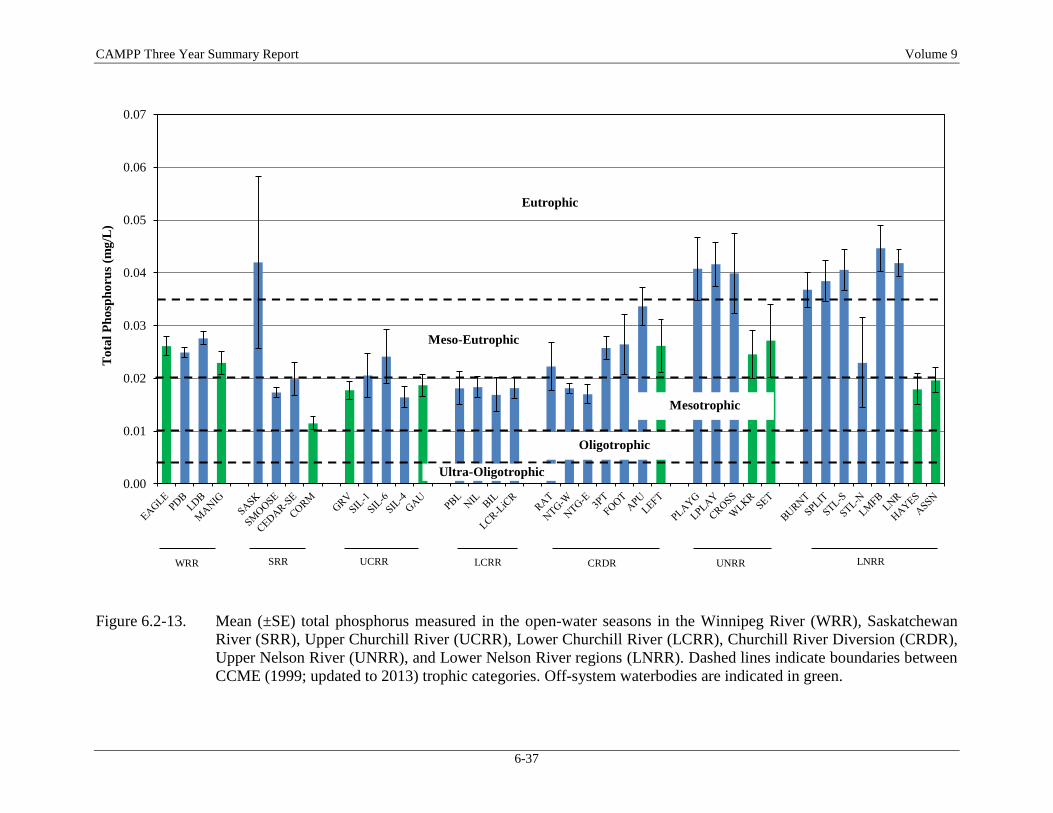
CAMPP Three Year Summary Report Volume 9
6-37
Figure 6.2-13. Mean (±SE) total phosphorus measured in the open-water seasons in the Winnipeg River (WRR), Saskatchewan
River (SRR), Upper Churchill River (UCRR), Lower Churchill River (LCRR), Churchill River Diversion (CRDR),
Upper Nelson River (UNRR), and Lower Nelson River regions (LNRR). Dashed lines indicate boundaries between
CCME (1999; updated to 2013) trophic categories. Off-system waterbodies are indicated in green.
0.00
0.01
0.02
0.03
0.04
0.05
0.06
0.07T
ota
l P
ho
sph
oru
s (m
g/L
)
Eutrophic
Meso-Eutrophic
Mesotrophic
Oligotrophic
Ultra-Oligotrophic
CRDR UNRR LNRRLCRRUCRRSRRWRR
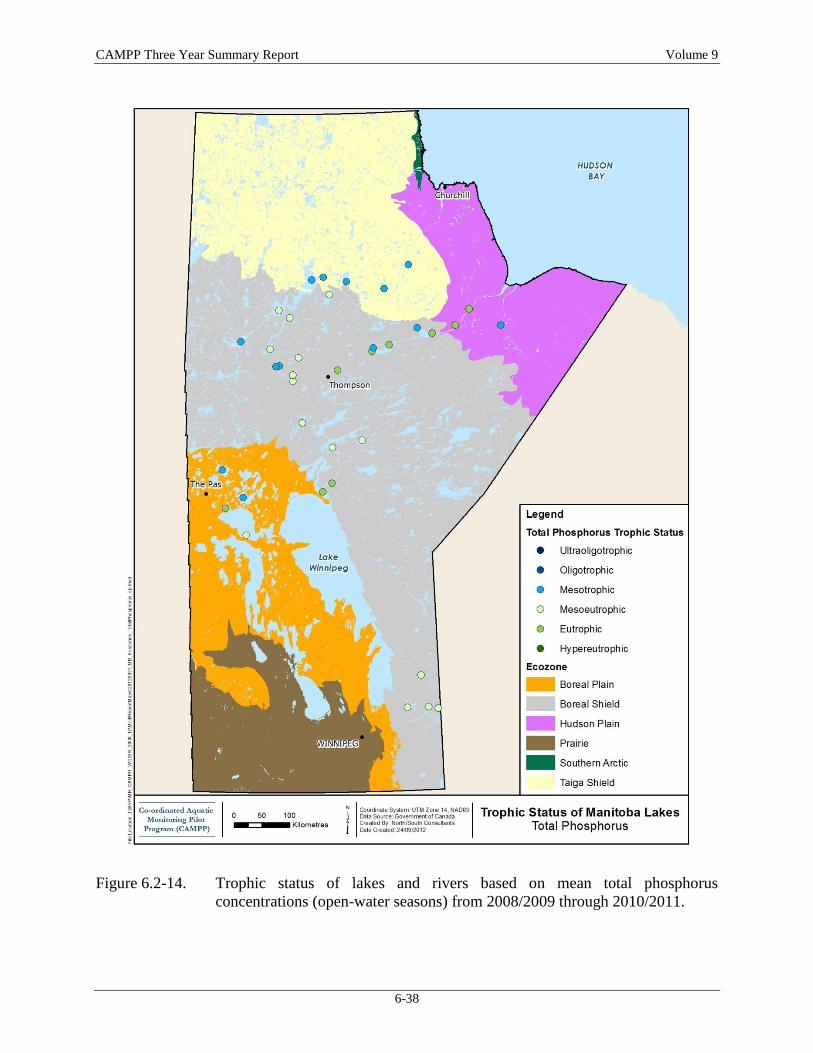
CAMPP Three Year Summary Report Volume 9
6-38
Figure 6.2-14. Trophic status of lakes and rivers based on mean total phosphorus
concentrations (open-water seasons) from 2008/2009 through 2010/2011.
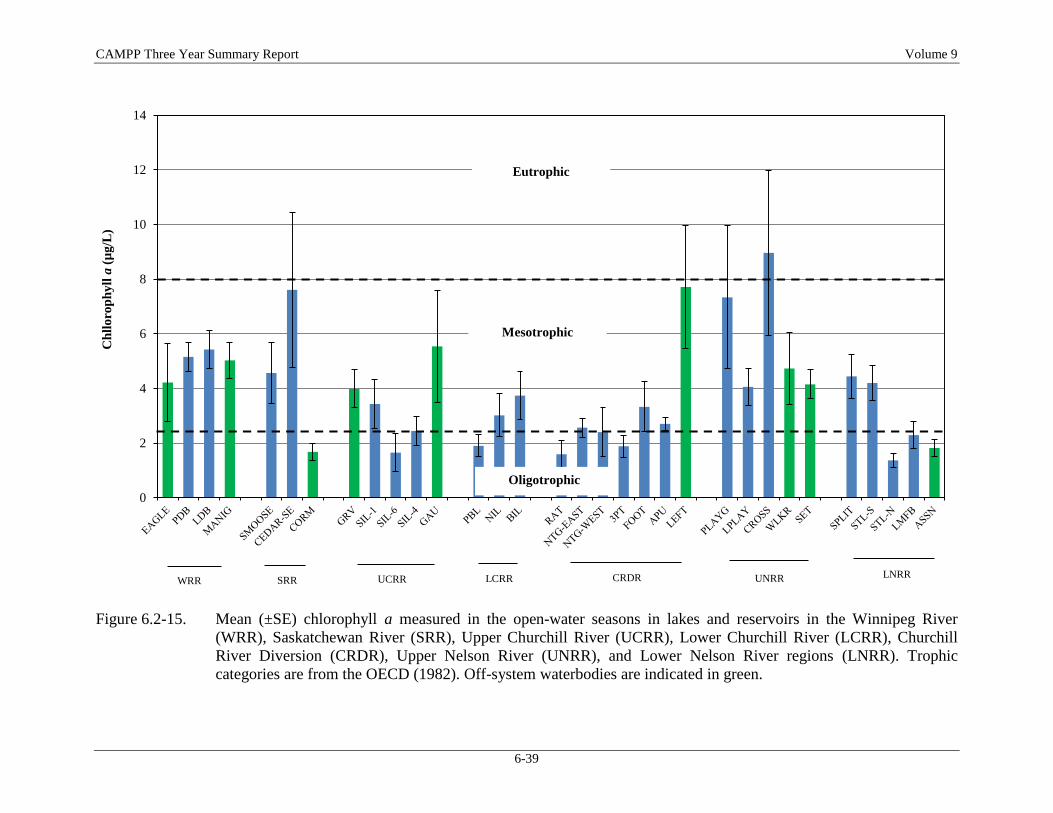
CAMPP Three Year Summary Report Volume 9
6-39
Figure 6.2-15. Mean (±SE) chlorophyll a measured in the open-water seasons in lakes and reservoirs in the Winnipeg River
(WRR), Saskatchewan River (SRR), Upper Churchill River (UCRR), Lower Churchill River (LCRR), Churchill
River Diversion (CRDR), Upper Nelson River (UNRR), and Lower Nelson River regions (LNRR). Trophic
categories are from the OECD (1982). Off-system waterbodies are indicated in green.
0
2
4
6
8
10
12
14C
hll
oro
ph
yll
a (
µg
/L)
CRDR UNRR LNRRWRR LCRRUCRRSRR
Oligotrophic
Mesotrophic
Eutrophic
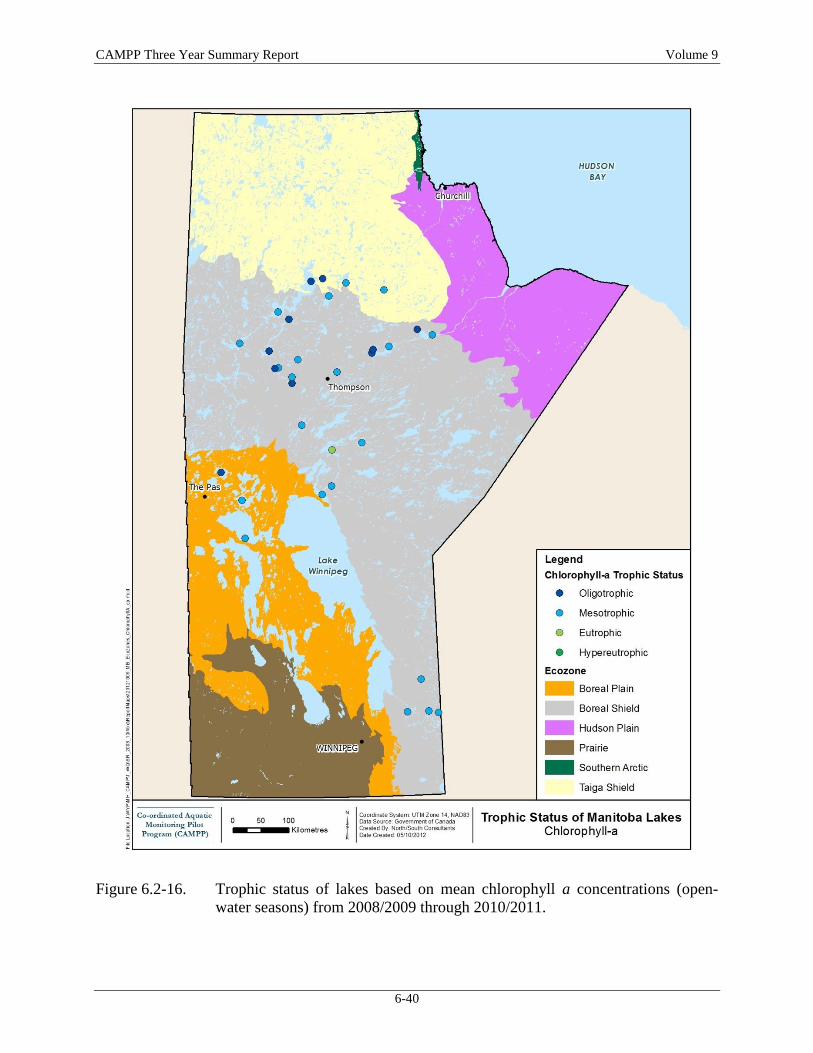
CAMPP Three Year Summary Report Volume 9
6-40
Figure 6.2-16. Trophic status of lakes based on mean chlorophyll a concentrations (open-
water seasons) from 2008/2009 through 2010/2011.
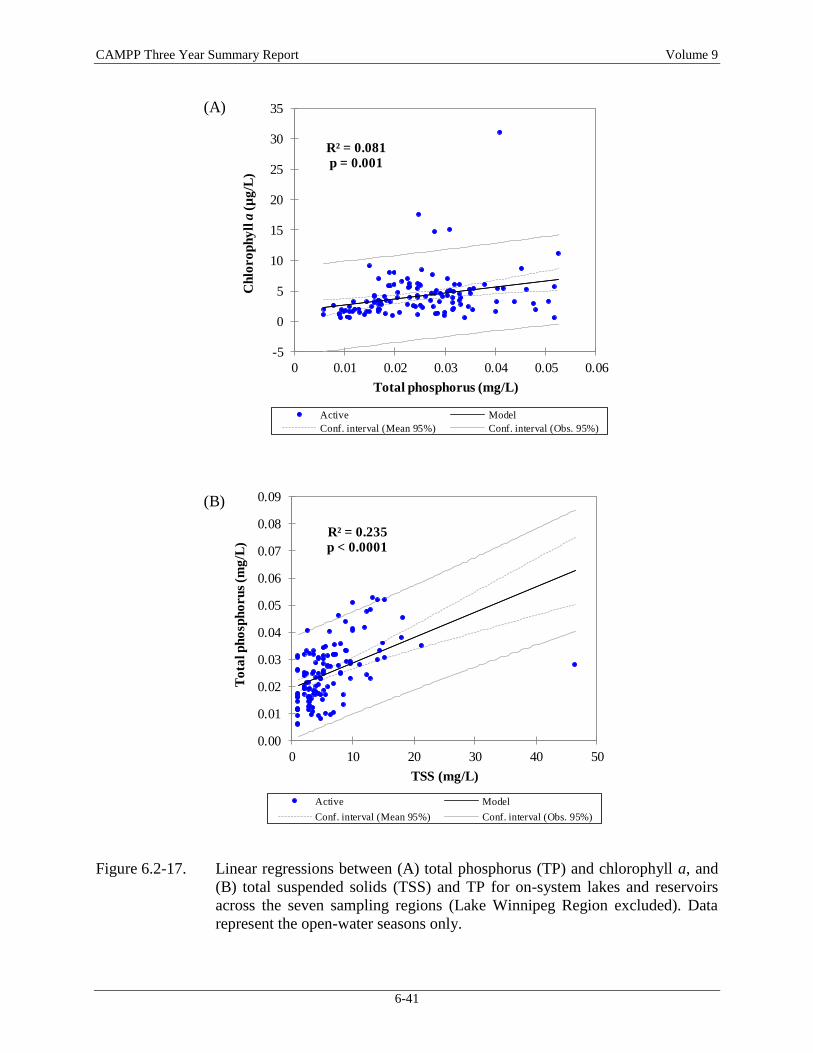
CAMPP Three Year Summary Report Volume 9
6-41
Figure 6.2-17. Linear regressions between (A) total phosphorus (TP) and chlorophyll a, and
(B) total suspended solids (TSS) and TP for on-system lakes and reservoirs
across the seven sampling regions (Lake Winnipeg Region excluded). Data
represent the open-water seasons only.
(A)
(B)
-5
0
5
10
15
20
25
30
35
0 0.01 0.02 0.03 0.04 0.05 0.06
Ch
loro
ph
yll
a(µ
g/L
)
Total phosphorus (mg/L)
R² = 0.081p = 0.001
Active Model
Conf. interval (Mean 95%) Conf. interval (Obs. 95%)
0.00
0.01
0.02
0.03
0.04
0.05
0.06
0.07
0.08
0.09
0 10 20 30 40 50
To
tal p
ho
sph
oru
s (m
g/L
)
TSS (mg/L)
R² = 0.235p < 0.0001
Active Model
Conf. interval (Mean 95%) Conf. interval (Obs. 95%)
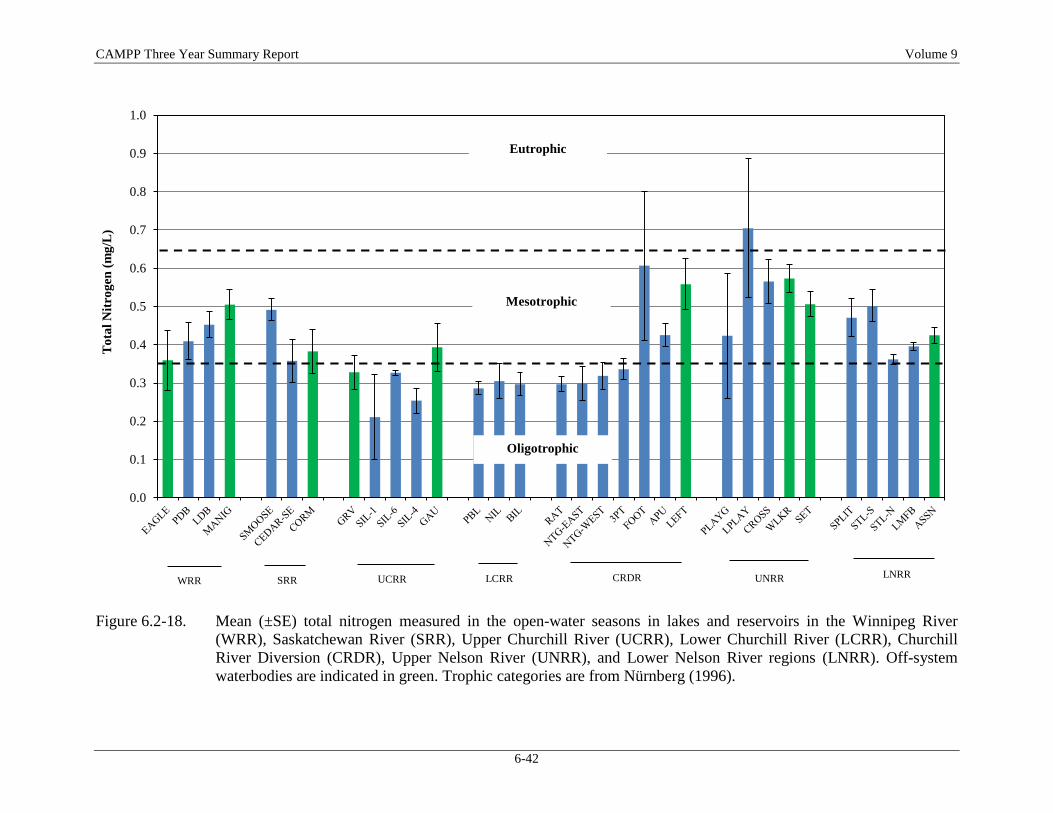
CAMPP Three Year Summary Report Volume 9
6-42
Figure 6.2-18. Mean (±SE) total nitrogen measured in the open-water seasons in lakes and reservoirs in the Winnipeg River
(WRR), Saskatchewan River (SRR), Upper Churchill River (UCRR), Lower Churchill River (LCRR), Churchill
River Diversion (CRDR), Upper Nelson River (UNRR), and Lower Nelson River regions (LNRR). Off-system
waterbodies are indicated in green. Trophic categories are from Nürnberg (1996).
0.0
0.1
0.2
0.3
0.4
0.5
0.6
0.7
0.8
0.9
1.0T
ota
l N
itro
gen
(m
g/L
)
CRDR UNRR LNRRWRR LCRRUCRRSRR
Oligotrophic
Mesotrophic
Eutrophic
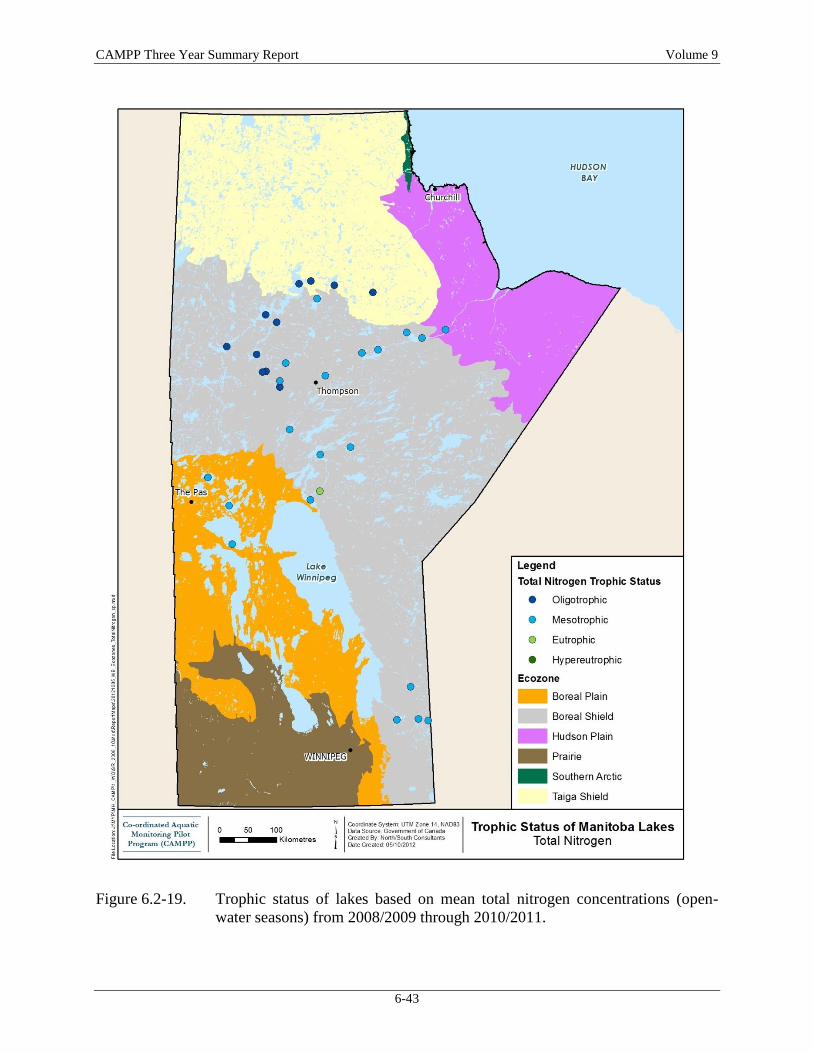
CAMPP Three Year Summary Report Volume 9
6-43
Figure 6.2-19. Trophic status of lakes based on mean total nitrogen concentrations (open-
water seasons) from 2008/2009 through 2010/2011.
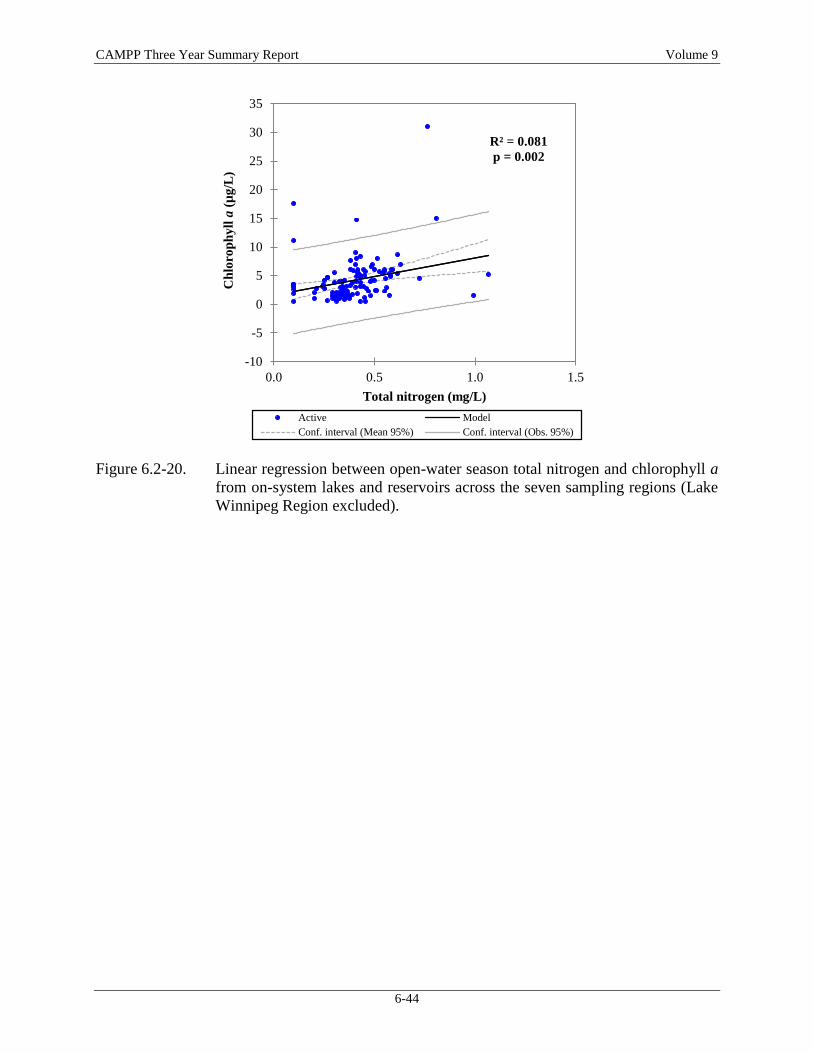
CAMPP Three Year Summary Report Volume 9
6-44
Figure 6.2-20. Linear regression between open-water season total nitrogen and chlorophyll a
from on-system lakes and reservoirs across the seven sampling regions (Lake
Winnipeg Region excluded).
-10
-5
0
5
10
15
20
25
30
35
0.0 0.5 1.0 1.5
Ch
loro
ph
yll
a (
µg
/L)
Total nitrogen (mg/L)
R² = 0.081
p = 0.002
Active Model
Conf. interval (Mean 95%) Conf. interval (Obs. 95%)
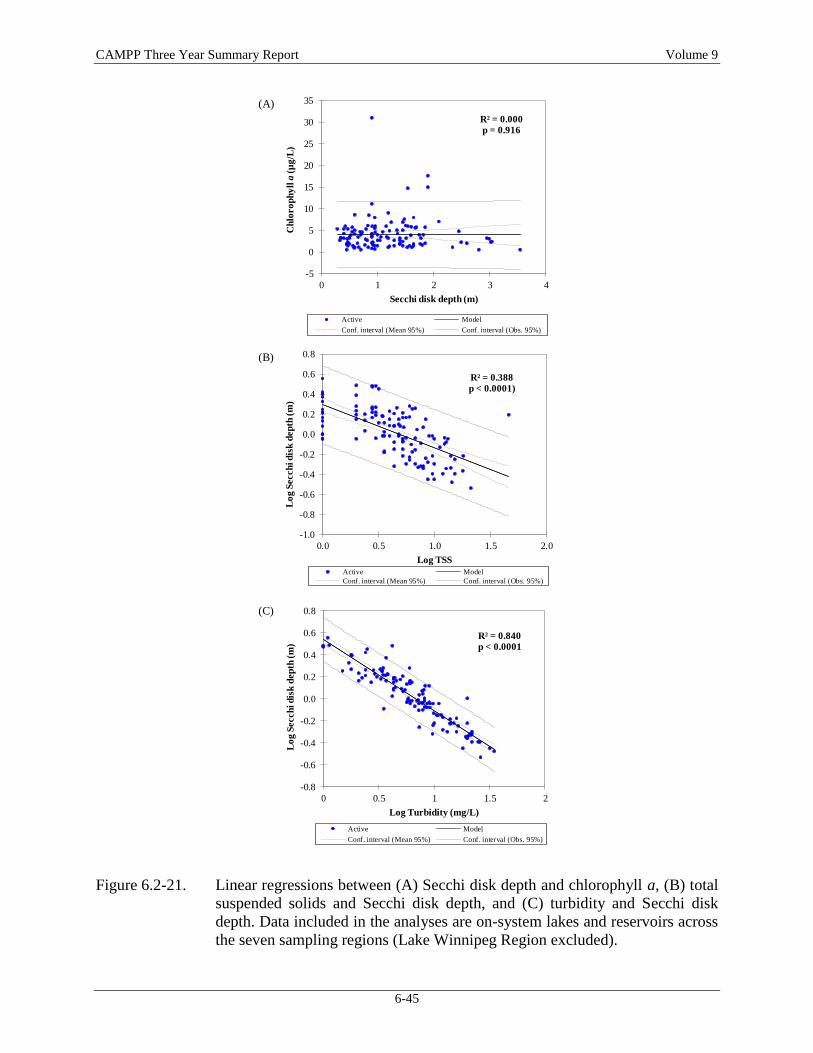
CAMPP Three Year Summary Report Volume 9
6-45
Figure 6.2-21. Linear regressions between (A) Secchi disk depth and chlorophyll a, (B) total
suspended solids and Secchi disk depth, and (C) turbidity and Secchi disk
depth. Data included in the analyses are on-system lakes and reservoirs across
the seven sampling regions (Lake Winnipeg Region excluded).
(A)
(B)
(C)
-0.8
-0.6
-0.4
-0.2
0.0
0.2
0.4
0.6
0.8
0 0.5 1 1.5 2
Lo
g S
ecch
i d
isk
dep
th (
m)
Log Turbidity (mg/L)
R² = 0.840
p < 0.0001
Active Model
Conf. interval (Mean 95%) Conf. interval (Obs. 95%)
-1.0
-0.8
-0.6
-0.4
-0.2
0.0
0.2
0.4
0.6
0.8
0.0 0.5 1.0 1.5 2.0
Lo
g S
ecch
i d
isk
dep
th (
m)
Log TSS
R² = 0.388
p < 0.0001)
Active Model
Conf. interval (Mean 95%) Conf. interval (Obs. 95%)
-5
0
5
10
15
20
25
30
35
0 1 2 3 4C
hlo
ro
ph
yll
a (
µg
/L)
Secchi disk depth (m)
R² = 0.000p = 0.916
Active Model
Conf. interval (Mean 95%) Conf. interval (Obs. 95%)
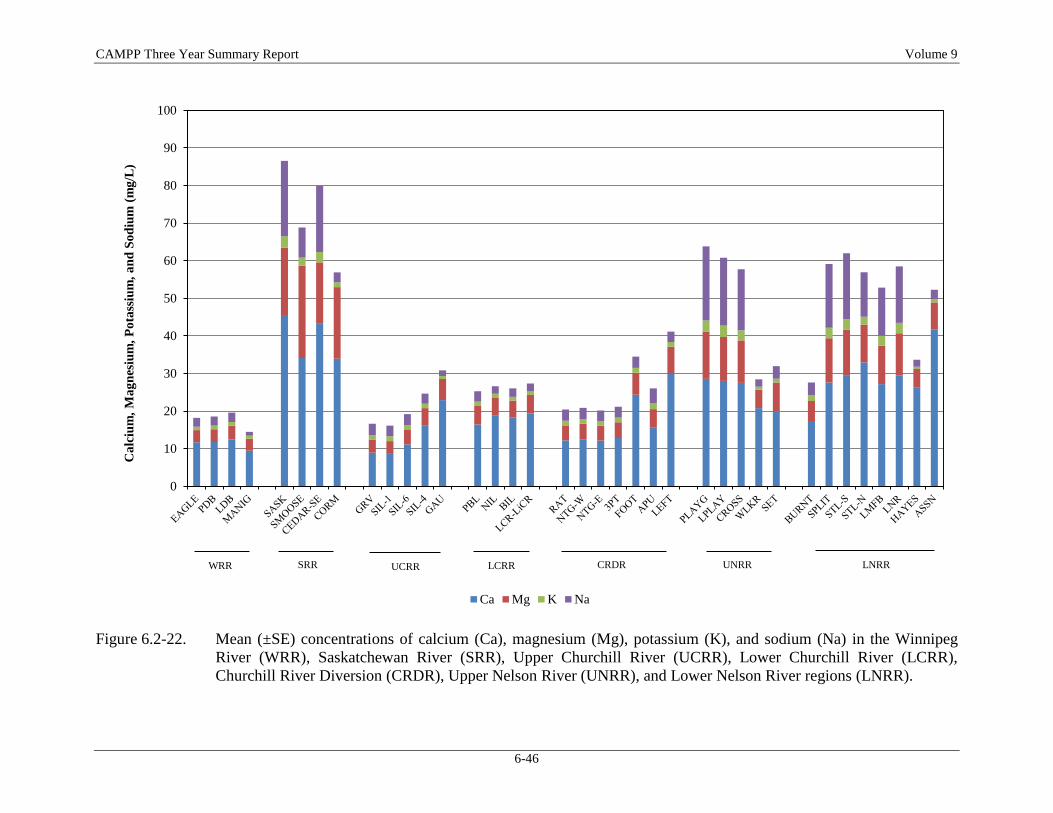
CAMPP Three Year Summary Report Volume 9
6-46
Figure 6.2-22. Mean (±SE) concentrations of calcium (Ca), magnesium (Mg), potassium (K), and sodium (Na) in the Winnipeg
River (WRR), Saskatchewan River (SRR), Upper Churchill River (UCRR), Lower Churchill River (LCRR),
Churchill River Diversion (CRDR), Upper Nelson River (UNRR), and Lower Nelson River regions (LNRR).
0
10
20
30
40
50
60
70
80
90
100
Ca
lciu
m,
Ma
gn
esiu
m,
Po
tass
ium
, a
nd
So
diu
m (
mg
/L)
Ca Mg K Na
LCRR CRDR UNRR LNRRUCRRSRRWRR
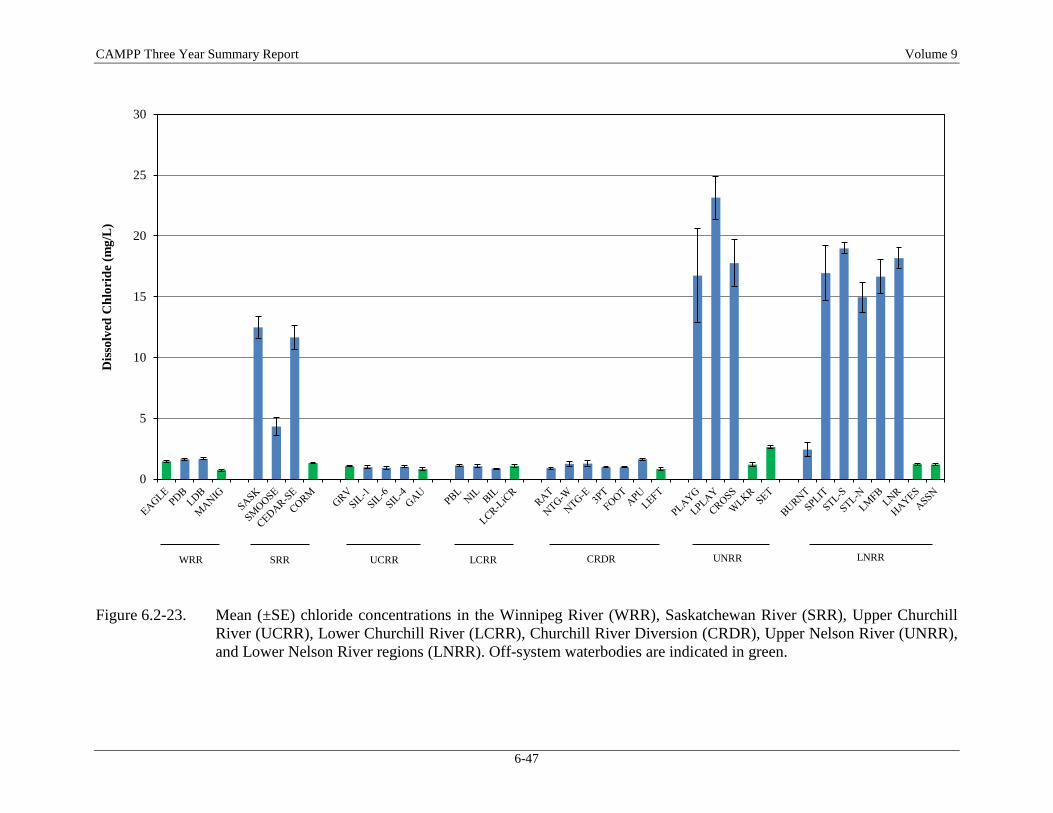
CAMPP Three Year Summary Report Volume 9
6-47
Figure 6.2-23. Mean (±SE) chloride concentrations in the Winnipeg River (WRR), Saskatchewan River (SRR), Upper Churchill
River (UCRR), Lower Churchill River (LCRR), Churchill River Diversion (CRDR), Upper Nelson River (UNRR),
and Lower Nelson River regions (LNRR). Off-system waterbodies are indicated in green.
0
5
10
15
20
25
30D
isso
lved
Ch
lori
de
(mg
/L)
WRR SRR UCRR LCRR CRDR UNRR LNRR
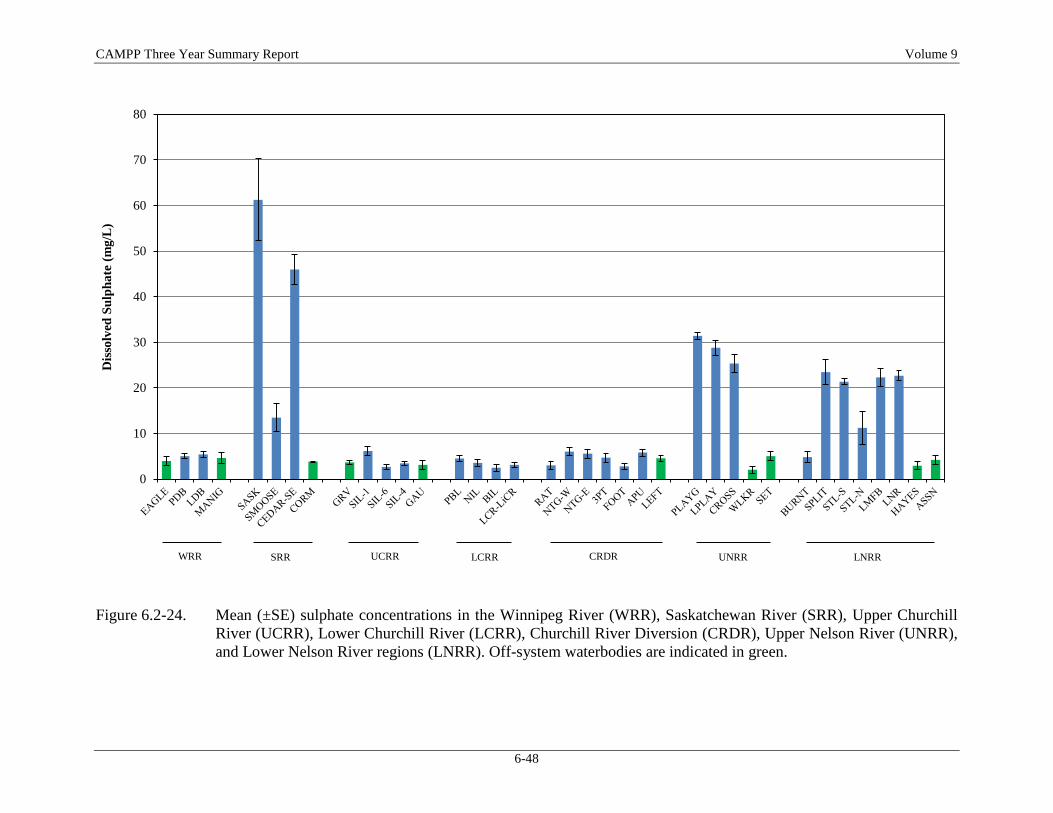
CAMPP Three Year Summary Report Volume 9
6-48
Figure 6.2-24. Mean (±SE) sulphate concentrations in the Winnipeg River (WRR), Saskatchewan River (SRR), Upper Churchill
River (UCRR), Lower Churchill River (LCRR), Churchill River Diversion (CRDR), Upper Nelson River (UNRR),
and Lower Nelson River regions (LNRR). Off-system waterbodies are indicated in green.
0
10
20
30
40
50
60
70
80D
isso
lved
Su
lph
ate
(m
g/L
)
WRR SRR UCRR LCRR CRDR UNRR LNRR
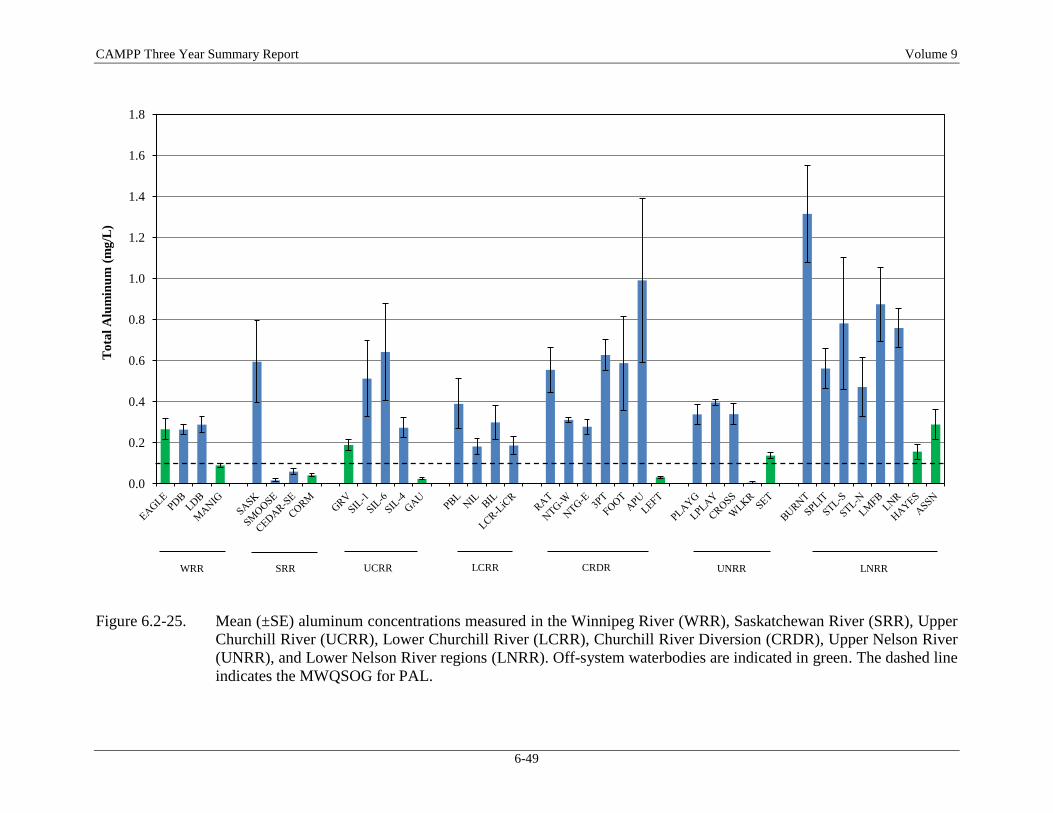
CAMPP Three Year Summary Report Volume 9
6-49
Figure 6.2-25. Mean (±SE) aluminum concentrations measured in the Winnipeg River (WRR), Saskatchewan River (SRR), Upper
Churchill River (UCRR), Lower Churchill River (LCRR), Churchill River Diversion (CRDR), Upper Nelson River
(UNRR), and Lower Nelson River regions (LNRR). Off-system waterbodies are indicated in green. The dashed line
indicates the MWQSOG for PAL.
0.0
0.2
0.4
0.6
0.8
1.0
1.2
1.4
1.6
1.8T
ota
l A
lum
inu
m (
mg
/L)
UCRR LCRR CRDR UNRR LNRRWRR SRR
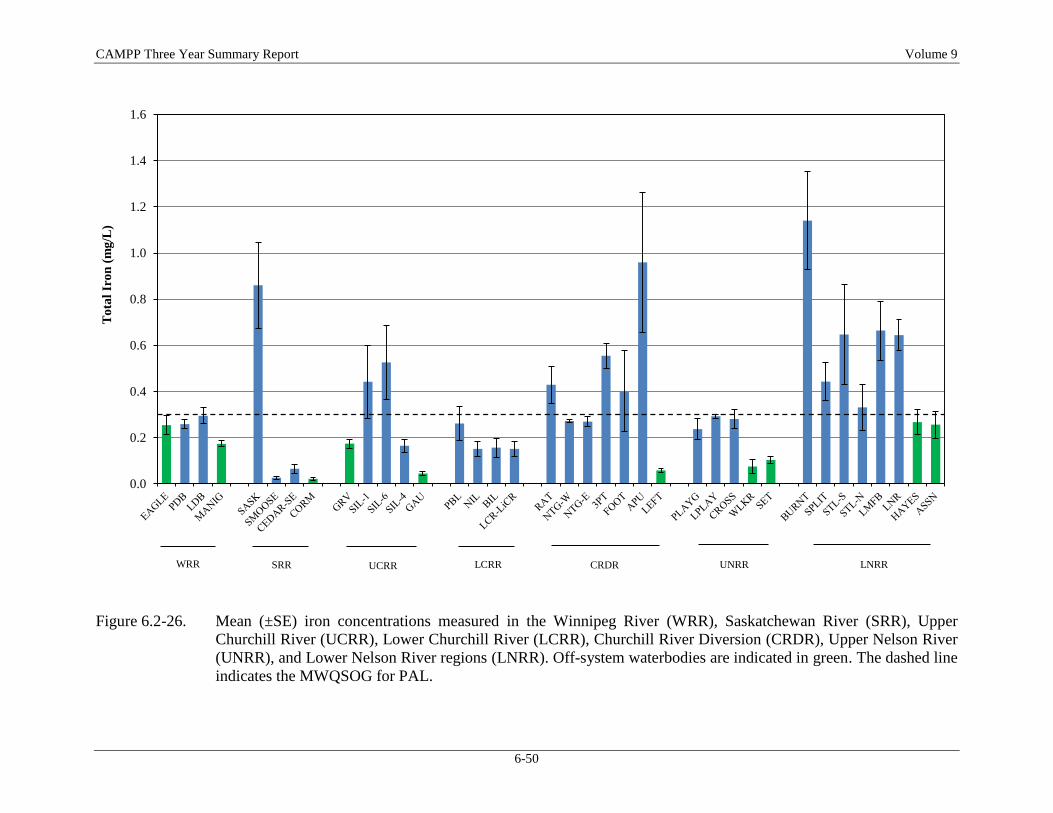
CAMPP Three Year Summary Report Volume 9
6-50
Figure 6.2-26. Mean (±SE) iron concentrations measured in the Winnipeg River (WRR), Saskatchewan River (SRR), Upper
Churchill River (UCRR), Lower Churchill River (LCRR), Churchill River Diversion (CRDR), Upper Nelson River
(UNRR), and Lower Nelson River regions (LNRR). Off-system waterbodies are indicated in green. The dashed line
indicates the MWQSOG for PAL.
0.0
0.2
0.4
0.6
0.8
1.0
1.2
1.4
1.6T
ota
l Ir
on
(m
g/L
)
WRR SRR UCRR LCRR CRDR UNRR LNRR
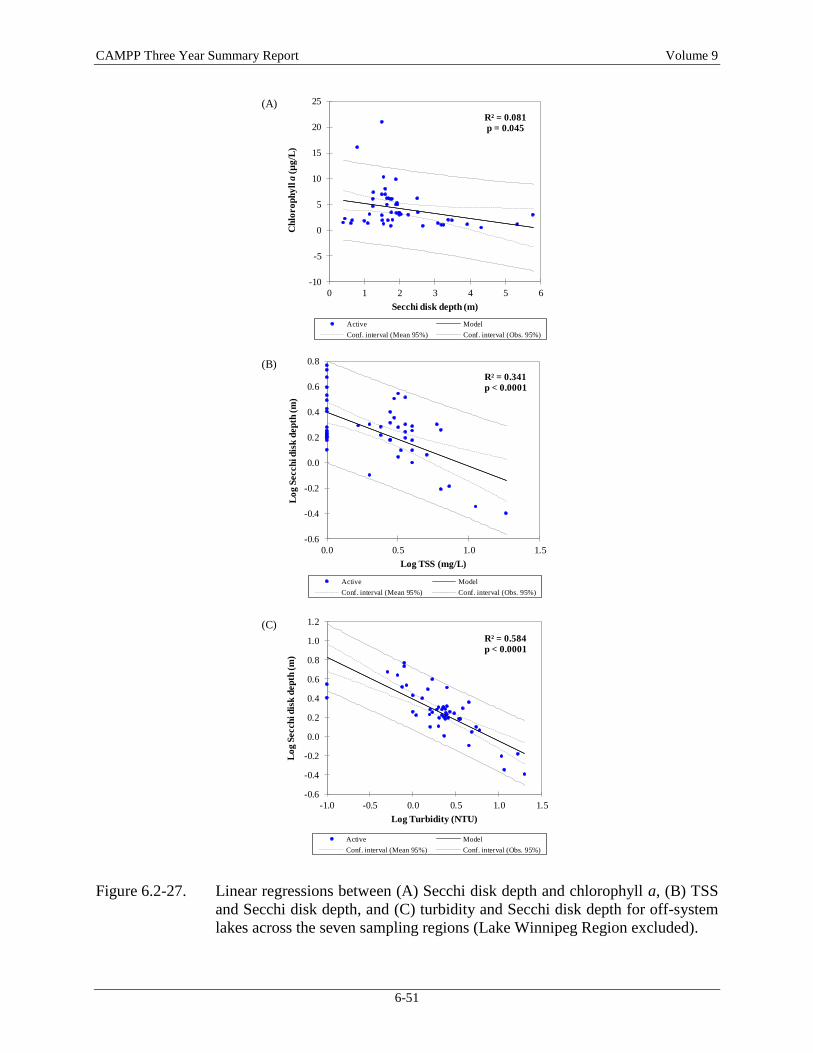
CAMPP Three Year Summary Report Volume 9
6-51
Figure 6.2-27. Linear regressions between (A) Secchi disk depth and chlorophyll a, (B) TSS
and Secchi disk depth, and (C) turbidity and Secchi disk depth for off-system
lakes across the seven sampling regions (Lake Winnipeg Region excluded).
(A)
(B)
(C)
-0.6
-0.4
-0.2
0.0
0.2
0.4
0.6
0.8
1.0
1.2
-1.0 -0.5 0.0 0.5 1.0 1.5
Lo
g S
ecch
i d
isk
dep
th (
m)
Log Turbidity (NTU)
R² = 0.584
p < 0.0001
Active Model
Conf. interval (Mean 95%) Conf. interval (Obs. 95%)
-0.6
-0.4
-0.2
0.0
0.2
0.4
0.6
0.8
0.0 0.5 1.0 1.5
Lo
g S
ecch
i d
isk
dep
th (
m)
Log TSS (mg/L)
R² = 0.341p < 0.0001
Active Model
Conf. interval (Mean 95%) Conf. interval (Obs. 95%)
-10
-5
0
5
10
15
20
25
0 1 2 3 4 5 6C
hlo
ro
ph
yll
a(µ
g/L
)
Secchi disk depth (m)
R² = 0.081
p = 0.045
Active Model
Conf. interval (Mean 95%) Conf. interval (Obs. 95%)
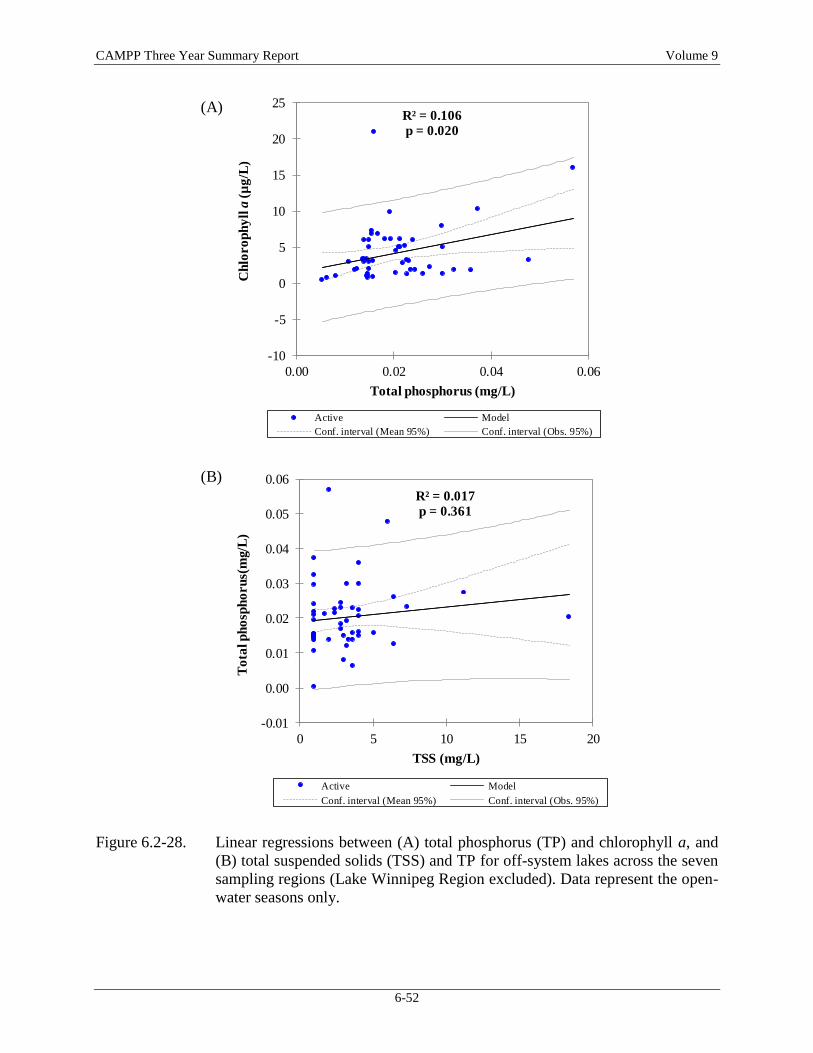
CAMPP Three Year Summary Report Volume 9
6-52
Figure 6.2-28. Linear regressions between (A) total phosphorus (TP) and chlorophyll a, and
(B) total suspended solids (TSS) and TP for off-system lakes across the seven
sampling regions (Lake Winnipeg Region excluded). Data represent the open-
water seasons only.
(A)
(B)
-10
-5
0
5
10
15
20
25
0.00 0.02 0.04 0.06
Ch
loro
ph
yll
a(µ
g/L
)
Total phosphorus (mg/L)
R² = 0.106
p = 0.020
Active Model
Conf. interval (Mean 95%) Conf. interval (Obs. 95%)
-0.01
0.00
0.01
0.02
0.03
0.04
0.05
0.06
0 5 10 15 20
To
tal p
ho
sph
oru
s(m
g/L
)
TSS (mg/L)
R² = 0.017 p = 0.361
Active Model
Conf. interval (Mean 95%) Conf. interval (Obs. 95%)
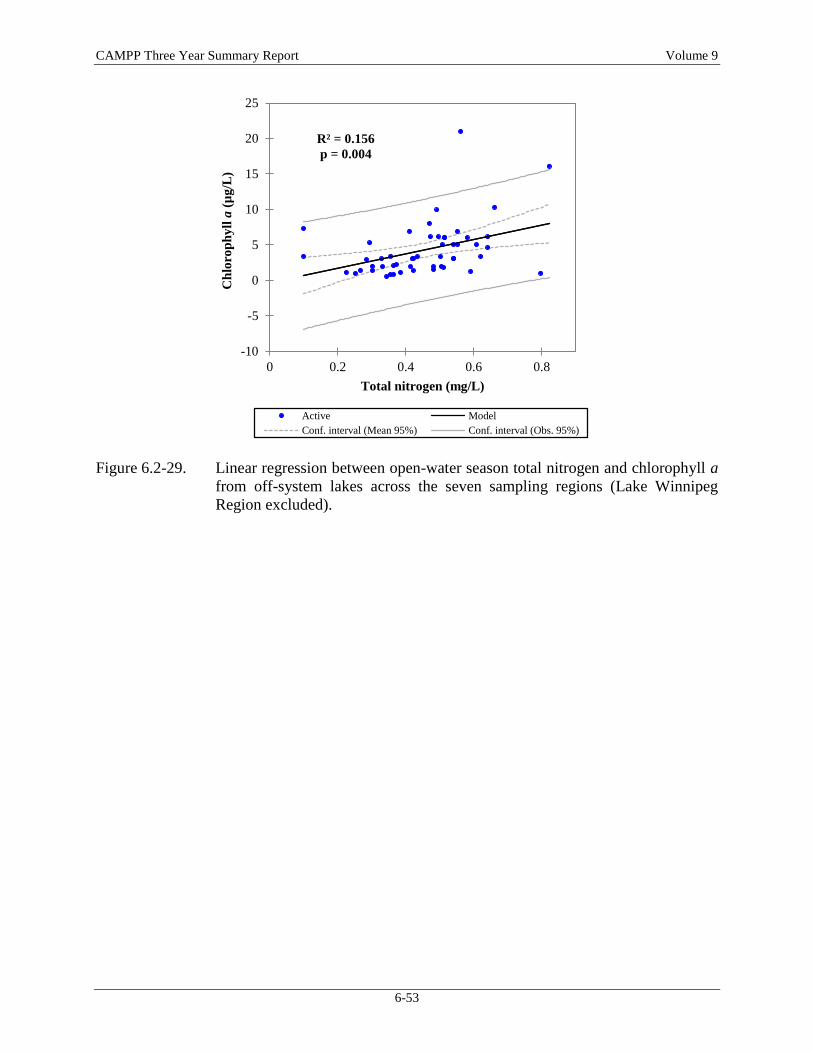
CAMPP Three Year Summary Report Volume 9
6-53
Figure 6.2-29. Linear regression between open-water season total nitrogen and chlorophyll a
from off-system lakes across the seven sampling regions (Lake Winnipeg
Region excluded).
-10
-5
0
5
10
15
20
25
0 0.2 0.4 0.6 0.8
Ch
loro
ph
yll
a (
µg
/L)
Total nitrogen (mg/L)
R² = 0.156
p = 0.004
Active Model
Conf. interval (Mean 95%) Conf. interval (Obs. 95%)

CAMPP Three Year Summary Report Volume 9
6-55
6.3 PHYTOPLANKTON
The following discussion provides an overview of key phytoplankton results for all the CAMPP
waterbodies sampled in Years 1-3 of the Pilot Program. This overview is intended to provide a
broad description of key metrics across the study regions (excluding the Lake Winnipeg Region)
and to explore general patterns respecting phytoplankton on a larger geographic scale. This
analysis was also undertaken to inform the overall design of the CAMPP phytoplankton
monitoring program and facilitate discussion of potential modifications to the program in the
future. As such, this discussion is not intended to be comprehensive and the reader is referred to
discussions presented in Section 5 of this report for a detailed description of results of the
CAMPP phytoplankton program.
Results of key phytoplankton metrics measured in each region are presented in Tables 6.3-1 to
6.3-7 and Figures 6.3-1 to 6.3-7. As described for water quality (see Section 6.2 for a detailed
discussion), Granville, Eaglenest and Walker lakes have been grouped with the on-system
waterbodies in the discussion presented below. Although these waterbodies are designated as
off-system under CAMP, this grouping was made in order to facilitate exploration of trends or
relationships in phytoplankton between waterbodies located on or influenced by (i.e., Walker
Lake via Cross Lake) the major rivers relative to those uninfluenced by the major rivers or
waterbodies associated with them.
6.3.1 Chlorophyll a
Mean chlorophyll a concentrations measured in CAMPP waterbodies during the three year Pilot
Program ranged from 1.1 µg/L (Stephens Lake-North) to 7.0 µg/L (Cross Lake; Figure 6.3-1 and
Tables 6.3-1 to 6.3-7). On average, chlorophyll a was highest in the Lake Winnipeg outlet lakes
(particularly Playgreen and Cross lakes) and lowest in Partridge Breast Lake, the on-system
waterbodies of the Churchill River Diversion Region, the Burntwood River, and Stephens Lake-
North. Off-system waterbodies generally had mean chlorophyll a concentrations similar to or
higher than concentrations measured in neighbouring on-system waterbodies; the exception was
Cormorant Lake, where chlorophyll a was notably lower than in on-system waterbodies in the
Saskatchewan River Region.
As discussed in Section 6.2, chlorophyll a was weakly correlated with total phosphorus (TP;
Figures 6.2-17 and 6.2-28) and total nitrogen (TN; Figures 6.2-20 and 6.2-29) in both the on- and
off-system water bodies but the relationships were stronger in off-system waterbodies than in on-
system ones. Secchi disk depth was also correlated with chlorophyll a concentrations in off-
system lakes and rivers but not in on-system waterbodies. Additionally, TP in on-system
waterbodies was more strongly correlated with TSS than chlorophyll a (Figure 6.2-17).
CAMPP Three Year Summary Report Volume 9
6-56
Collectively, these results indicate that productivity in off-system lakes is limited by nutrient
concentrations but other factors, such as light and temperature, limit or co-limit phytoplankton
productivity in on-system lakes and reservoirs.
Linear regression analysis also indicated that chlorophyll a was generally a good indicator of
phytoplankton biomass, but that its usefulness as a predictor was stronger for the off-system sites
(Figure 6.3-2). Specifically, although the relationship between chlorophyll a concentrations and
phytoplankton biomass was significant for both the on-system and off-system waterbodies, the
relationship is weaker in the on-system waterbodies. It is noted that relationships likely vary
amongst the regions and correlations should be explored on a regional basis after acquisition of
additional data.
6.3.2 Taxonomic Composition and Biomass
Mean phytoplankton biomass measured in CAMPP waterbodies typically ranged from 294
mg/m3 (Notigi Lake-East) to 5,601 mg/m
3 (Cedar Lake; Figure 6.3-3 and Tables 6.3-1 to 6.3-7);
however, the mean biomass at Walker Lake was unusually high at 15,503 mg/m3. Biomass was
generally low in waterbodies influenced by the major river in most regions, although higher
biomass was measured in Eaglenest Lake, the Saskatchewan River, Cedar Lake, Footprint Lake,
waterbodies of the Upper Nelson River Region, and Split Lake. Similar to chlorophyll a, mean
phytoplankton biomass was generally higher in Leftrook and Gauer lakes, and lower at
Cormorant and Assean lakes and the Hayes River, when compared to neighbouring on-system
waterbodies. As with a number of water quality parameters, phytoplankton biomass measured in
South Moose and Footprint lakes was also more similar to that measured in the neighbouring off-
system waterbody than to the sites located on the main flow of the Saskatchewan and
Rat/Burntwood rivers, respectively.
Although phytoplankton biomass was not measured during winter, the low chlorophyll a
concentrations during this period suggest that phytoplankton biomass was also typically lower in
the ice-cover season than the open-water season.
Although there was considerable variation both seasonally and spatially, the phytoplankton
communities of CAMPP waterbodies were, on average, typically dominated by diatoms with
either blue-green algae and/or cryptophytes as the second most abundant group(s) (Figure 6.3-4
and Tables 6.3-1 to 6.3-7). Green algae, chrysophytes, dinoflagelates and euglenoids generally
comprised a relatively small proportion of each phytoplankton community. The exceptions to
these patterns were as follows: diatoms and blue-green algae were on average co-dominant at
Billard and Walker lakes; blue-green algae dominated on average at South Moose Lake;
cryptophytes dominated the phytoplankton assemblage at Southern Indian Lake-Area 6, Rat
CAMPP Three Year Summary Report Volume 9
6-57
Lake and the Burntwood River; and, at Notigi Lake-East and the two off-system waterbodies in
the Lower Nelson River Region (i.e., Hayes River and Assean Lake) the phytoplankton biomass
was fairly evenly distributed amongst several groups.
Phytoplankton community complexity varied between waterbodies, seasons, and metrics
considered, with no obvious regional patterns (Figures 6.3-5 and 6.3-6). The average Simpson’s
Diversity Index ranged from 0.40 to 0.88 across CAMPP waterbodies, and the average Hill’s
effective richness ranged from 3 to 13 (Tables 6.3-1 to 6.3-7). South Moose Lake had the highest
mean diversity and effective richness of all CAMPP waterbodies whereas Rat Lake had the
lowest. Off-system waterbodies consistently showed high effective richness and diversity.
6.3.3 Phytoplankton Blooms
Phytoplankton blooms (i.e., operationally defined as periods when chlorophyll a concentrations
exceeded 10 µg/L) were periodically observed at Cedar, Gauer, Leftrook, Playgreen and Cross
lakes, and all blooms occurred during either the summer or fall sampling periods. During the
blooms, phytoplankton biomass ranged between 1,762 mg/m3 and 15,238 mg/m
3. Blue-green
algae typically dominated each phytoplankton community at these times (Figure 6.3-7);
however, diatoms and blue-green algae were co-dominant at Cedar Lake in summer 2010, and
diatoms were dominant at Cedar, Leftrook, and Playgreen lakes in fall 2009.
6.3.4 Microcystin
Some forms of blue-green algae are capable of producing microcystins (liver toxins), including
species of Anabaena, Aphanizomenon, Microcystis¸ Nostoc and Planktothrix (a.k.a. Oscillatoria;
Zurawell et al. 2005). Although not completely understood, several factors such as species,
bacterial strain, and environmental conditions appear to influence production of microcystins.
Phytoplankton species capable of producing microcystin were identified in all CAMPP
waterbodies. Anabaena and Aphanizomenon were ubiquitous in samples collected from the
CAMPP waterbodies. Planktothrix/Oscillatoria was also found at most waterbodies; exceptions
were Footprint, Rat, Split, Little Playgreen, Walker and Eaglenest lakes, the Saskatchewan
River, and Southern Indian Lake-Area 6. Microcystis was only found in Leftrook and Walker
lakes and Nostoc was not identified in any samples.
During the three-year Pilot Program, microcystin-LR was analysed in eight samples collected
from four waterbodies (Cedar, South Moose, Leftrook and Cross lakes), when chlorophyll a
exceeded the trigger of 10 µg/L. Despite the presence of algae capable of producing
microcystins, microcystin-LR but was not detected (<0.2 µg/L) in any of these samples.
CAMPP Three Year Summary Report Volume 9
6-58
6.3.5 Trophic Status
Several trophic categorization schemes have been developed for lakes and reservoirs, as well as
rivers, on the basis of TP, TN, and chlorophyll a concentrations. Waterbodies sampled under
CAMPP are compared to several of these schemes in Section 6.2; the discussion here focuses on
trophic categorization schemes based on chlorophyll a.
Trophic status of CAMPP lakes and reservoirs, using mean open-water season chlorophyll a as
the indicator, ranged from oligotrophic to eutrophic (Table 6.2-9 and Figures 6.2-15 and 6.2-16).
Specifically, on-system waterbodies within the Upper and Lower Churchill River, Churchill
River Diversion, and Lower Nelson River regions ranged from oligotrophic to mesotrophic, on-
system waterbodies within the Winnipeg River and Saskatchewan River regions were classified
as mesotrophic, and on-system lakes within the Upper Nelson River Region ranged from
mesotrophic to eutrophic. The off-system lakes were typically of similar trophic status as some
or all of the neighbouring on-system waterbodies; the two exceptions were that Cormorant Lake
ranked lower (oligotrophic) and Leftrook Lake higher (mesotrophic) compared to the
neighbouring on-system waterbodies.
Trophic status of all CAMPP rivers based on mean chlorophyll a was oligotrophic (Table 6.2-11
and Figure 6.2-16).
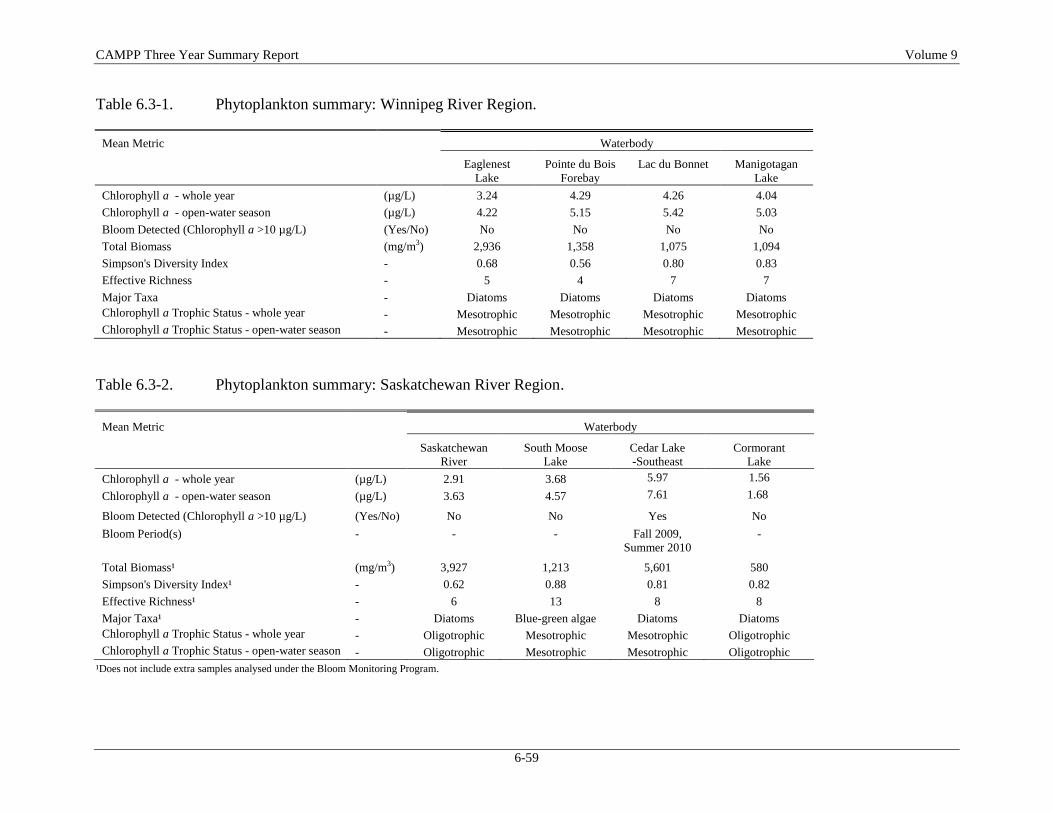
CAMPP Three Year Summary Report Volume 9
6-59
Table 6.3-1. Phytoplankton summary: Winnipeg River Region.
Mean Metric
Waterbody
Eaglenest
Lake
Pointe du Bois
Forebay
Lac du Bonnet
Manigotagan
Lake
Chlorophyll a - whole year (µg/L) 3.24 4.29 4.26 4.04
Chlorophyll a - open-water season (µg/L) 4.22 5.15 5.42 5.03
Bloom Detected (Chlorophyll a >10 µg/L) (Yes/No) No No No No
Total Biomass (mg/m3) 2,936 1,358 1,075 1,094
Simpson's Diversity Index - 0.68 0.56 0.80 0.83
Effective Richness - 5 4 7 7
Major Taxa - Diatoms Diatoms Diatoms Diatoms
Chlorophyll a Trophic Status - whole year - Mesotrophic Mesotrophic Mesotrophic Mesotrophic
Chlorophyll a Trophic Status - open-water season - Mesotrophic Mesotrophic Mesotrophic Mesotrophic
Table 6.3-2. Phytoplankton summary: Saskatchewan River Region.
Mean Metric
Waterbody
Saskatchewan
River
South Moose
Lake
Cedar Lake
-Southeast
Cormorant
Lake
Chlorophyll a - whole year (µg/L) 2.91 3.68 5.97 1.56
Chlorophyll a - open-water season (µg/L) 3.63 4.57 7.61 1.68
Bloom Detected (Chlorophyll a >10 µg/L) (Yes/No) No No Yes No
Bloom Period(s) - - - Fall 2009,
Summer 2010
-
Total Biomass¹ (mg/m3) 3,927 1,213 5,601 580
Simpson's Diversity Index¹ - 0.62 0.88 0.81 0.82
Effective Richness¹ - 6 13 8 8
Major Taxa¹ - Diatoms Blue-green algae Diatoms Diatoms
Chlorophyll a Trophic Status - whole year - Oligotrophic Mesotrophic Mesotrophic Oligotrophic
Chlorophyll a Trophic Status - open-water season - Oligotrophic Mesotrophic Mesotrophic Oligotrophic
¹Does not include extra samples analysed under the Bloom Monitoring Program.
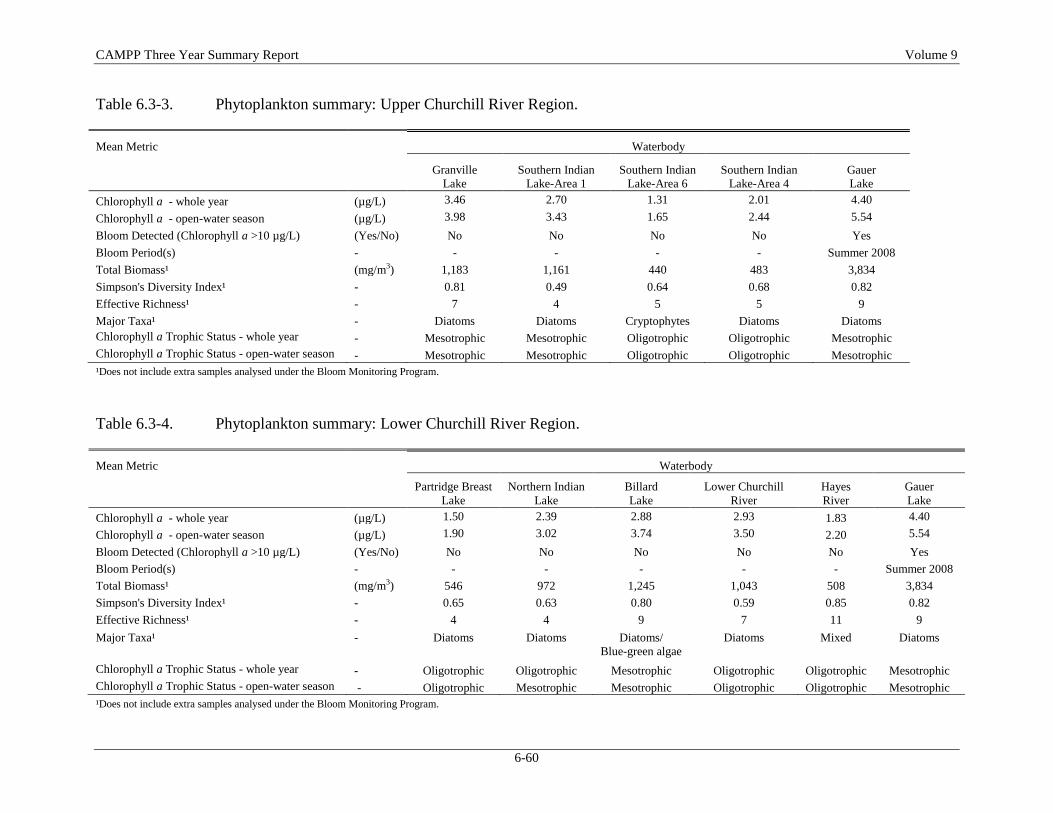
CAMPP Three Year Summary Report Volume 9
6-60
Table 6.3-3. Phytoplankton summary: Upper Churchill River Region.
Mean Metric
Waterbody
Granville
Lake
Southern Indian
Lake-Area 1
Southern Indian
Lake-Area 6
Southern Indian
Lake-Area 4
Gauer
Lake
Chlorophyll a - whole year (µg/L) 3.46 2.70 1.31 2.01 4.40
Chlorophyll a - open-water season (µg/L) 3.98 3.43 1.65 2.44 5.54
Bloom Detected (Chlorophyll a >10 µg/L) (Yes/No) No No No No Yes
Bloom Period(s) - - - - - Summer 2008
Total Biomass¹ (mg/m3) 1,183 1,161 440 483 3,834
Simpson's Diversity Index¹ - 0.81 0.49 0.64 0.68 0.82
Effective Richness¹ - 7 4 5 5 9
Major Taxa¹ - Diatoms Diatoms Cryptophytes Diatoms Diatoms
Chlorophyll a Trophic Status - whole year - Mesotrophic Mesotrophic Oligotrophic Oligotrophic Mesotrophic
Chlorophyll a Trophic Status - open-water season - Mesotrophic Mesotrophic Oligotrophic Oligotrophic Mesotrophic
¹Does not include extra samples analysed under the Bloom Monitoring Program.
Table 6.3-4. Phytoplankton summary: Lower Churchill River Region.
Mean Metric
Waterbody
Partridge Breast
Lake
Northern Indian
Lake
Billard
Lake
Lower Churchill
River
Hayes
River
Gauer
Lake
Chlorophyll a - whole year (µg/L) 1.50 2.39 2.88 2.93 1.83 4.40
Chlorophyll a - open-water season (µg/L) 1.90 3.02 3.74 3.50 2.20 5.54
Bloom Detected (Chlorophyll a >10 µg/L) (Yes/No) No No No No No Yes
Bloom Period(s) - - - - - - Summer 2008
Total Biomass¹ (mg/m3) 546 972 1,245 1,043 508 3,834
Simpson's Diversity Index¹ - 0.65 0.63 0.80 0.59 0.85 0.82
Effective Richness¹ - 4 4 9 7 11 9
Major Taxa¹ - Diatoms Diatoms Diatoms/
Blue-green algae
Diatoms Mixed Diatoms
Chlorophyll a Trophic Status - whole year - Oligotrophic Oligotrophic Mesotrophic Oligotrophic Oligotrophic Mesotrophic
Chlorophyll a Trophic Status - open-water season - Oligotrophic Mesotrophic Mesotrophic Oligotrophic Oligotrophic Mesotrophic
¹Does not include extra samples analysed under the Bloom Monitoring Program.
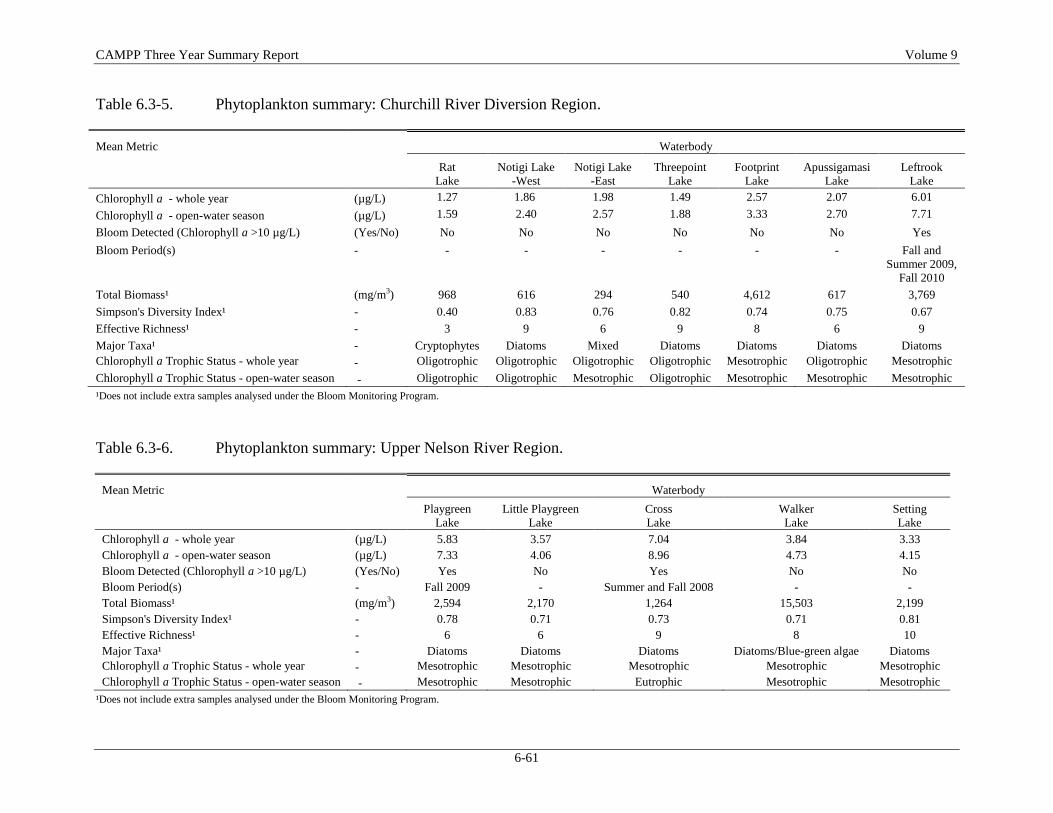
CAMPP Three Year Summary Report Volume 9
6-61
Table 6.3-5. Phytoplankton summary: Churchill River Diversion Region.
Mean Metric
Waterbody
Rat
Lake
Notigi Lake
-West
Notigi Lake
-East
Threepoint
Lake
Footprint
Lake
Apussigamasi
Lake
Leftrook
Lake
Chlorophyll a - whole year (µg/L) 1.27 1.86 1.98 1.49 2.57 2.07 6.01
Chlorophyll a - open-water season (µg/L) 1.59 2.40 2.57 1.88 3.33 2.70 7.71
Bloom Detected (Chlorophyll a >10 µg/L) (Yes/No) No No No No No No Yes
Bloom Period(s) - - - - - - - Fall and
Summer 2009,
Fall 2010
Total Biomass¹ (mg/m3) 968 616 294 540 4,612 617 3,769
Simpson's Diversity Index¹ - 0.40 0.83 0.76 0.82 0.74 0.75 0.67
Effective Richness¹ - 3 9 6 9 8 6 9
Major Taxa¹ - Cryptophytes Diatoms Mixed Diatoms Diatoms Diatoms Diatoms
Chlorophyll a Trophic Status - whole year - Oligotrophic Oligotrophic Oligotrophic Oligotrophic Mesotrophic Oligotrophic Mesotrophic
Chlorophyll a Trophic Status - open-water season - Oligotrophic Oligotrophic Mesotrophic Oligotrophic Mesotrophic Mesotrophic Mesotrophic
¹Does not include extra samples analysed under the Bloom Monitoring Program.
Table 6.3-6. Phytoplankton summary: Upper Nelson River Region.
Mean Metric
Waterbody
Playgreen
Lake
Little Playgreen
Lake
Cross
Lake
Walker
Lake
Setting
Lake
Chlorophyll a - whole year (µg/L) 5.83 3.57 7.04 3.84 3.33
Chlorophyll a - open-water season (µg/L) 7.33 4.06 8.96 4.73 4.15
Bloom Detected (Chlorophyll a >10 µg/L) (Yes/No) Yes No Yes No No
Bloom Period(s) - Fall 2009 - Summer and Fall 2008 - -
Total Biomass¹ (mg/m3) 2,594 2,170 1,264 15,503 2,199
Simpson's Diversity Index¹ - 0.78 0.71 0.73 0.71 0.81
Effective Richness¹ - 6 6 9 8 10
Major Taxa¹ - Diatoms Diatoms Diatoms Diatoms/Blue-green algae Diatoms
Chlorophyll a Trophic Status - whole year - Mesotrophic Mesotrophic Mesotrophic Mesotrophic Mesotrophic
Chlorophyll a Trophic Status - open-water season - Mesotrophic Mesotrophic Eutrophic Mesotrophic Mesotrophic
¹Does not include extra samples analysed under the Bloom Monitoring Program.
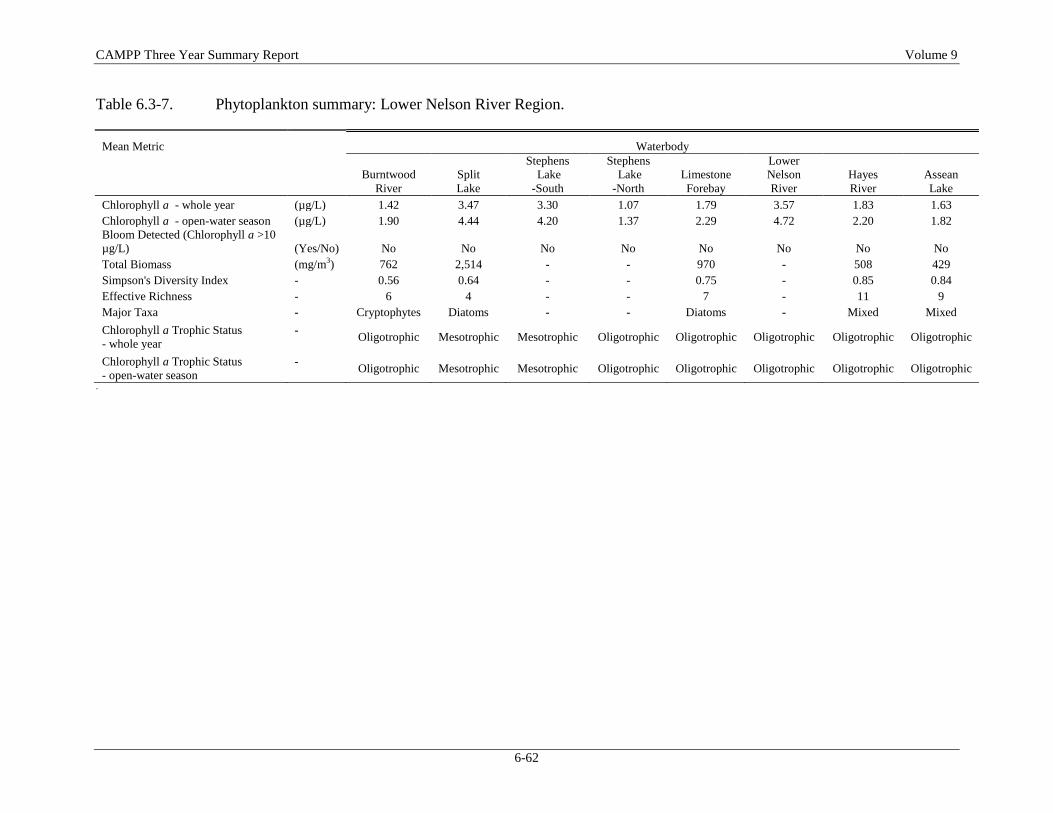
CAMPP Three Year Summary Report Volume 9
6-62
Table 6.3-7. Phytoplankton summary: Lower Nelson River Region.
Mean Metric
Waterbody
Burntwood
River
Split
Lake
Stephens
Lake
-South
Stephens
Lake
-North
Limestone
Forebay
Lower
Nelson
River
Hayes
River
Assean
Lake
Chlorophyll a - whole year (µg/L) 1.42 3.47 3.30 1.07 1.79 3.57 1.83 1.63
Chlorophyll a - open-water season (µg/L) 1.90 4.44 4.20 1.37 2.29 4.72 2.20 1.82
Bloom Detected (Chlorophyll a >10
µg/L) (Yes/No) No No No No No No No No
Total Biomass (mg/m3) 762 2,514 - - 970 - 508 429
Simpson's Diversity Index - 0.56 0.64 - - 0.75 - 0.85 0.84
Effective Richness - 6 4 - - 7 - 11 9
Major Taxa - Cryptophytes Diatoms - - Diatoms - Mixed Mixed
Chlorophyll a Trophic Status
- whole year
- Oligotrophic Mesotrophic Mesotrophic Oligotrophic Oligotrophic Oligotrophic Oligotrophic Oligotrophic
Chlorophyll a Trophic Status
- open-water season
- Oligotrophic Mesotrophic Mesotrophic Oligotrophic Oligotrophic Oligotrophic Oligotrophic Oligotrophic
-
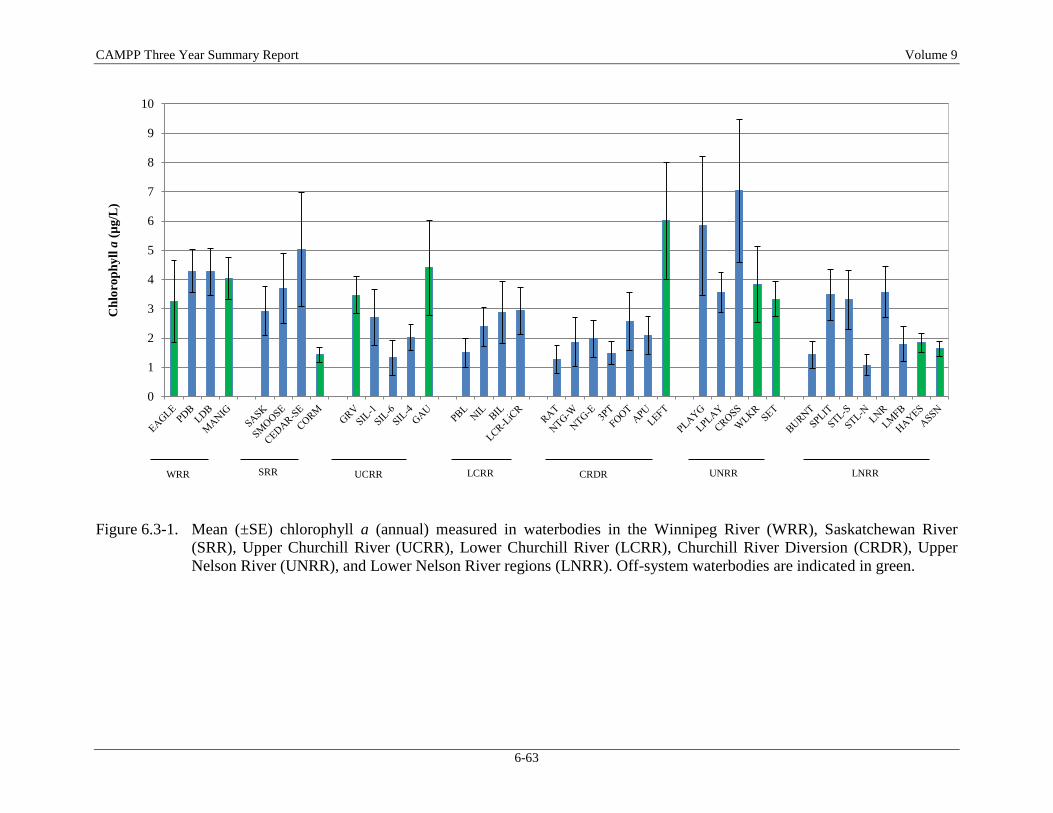
CAMPP Three Year Summary Report Volume 9
6-63
Figure 6.3-1. Mean (±SE) chlorophyll a (annual) measured in waterbodies in the Winnipeg River (WRR), Saskatchewan River
(SRR), Upper Churchill River (UCRR), Lower Churchill River (LCRR), Churchill River Diversion (CRDR), Upper
Nelson River (UNRR), and Lower Nelson River regions (LNRR). Off-system waterbodies are indicated in green.
0
1
2
3
4
5
6
7
8
9
10C
hlo
rop
hy
ll a
(µ
g/L
)
UCRRSRRWRR LNRRUNRRCRDRLCRR
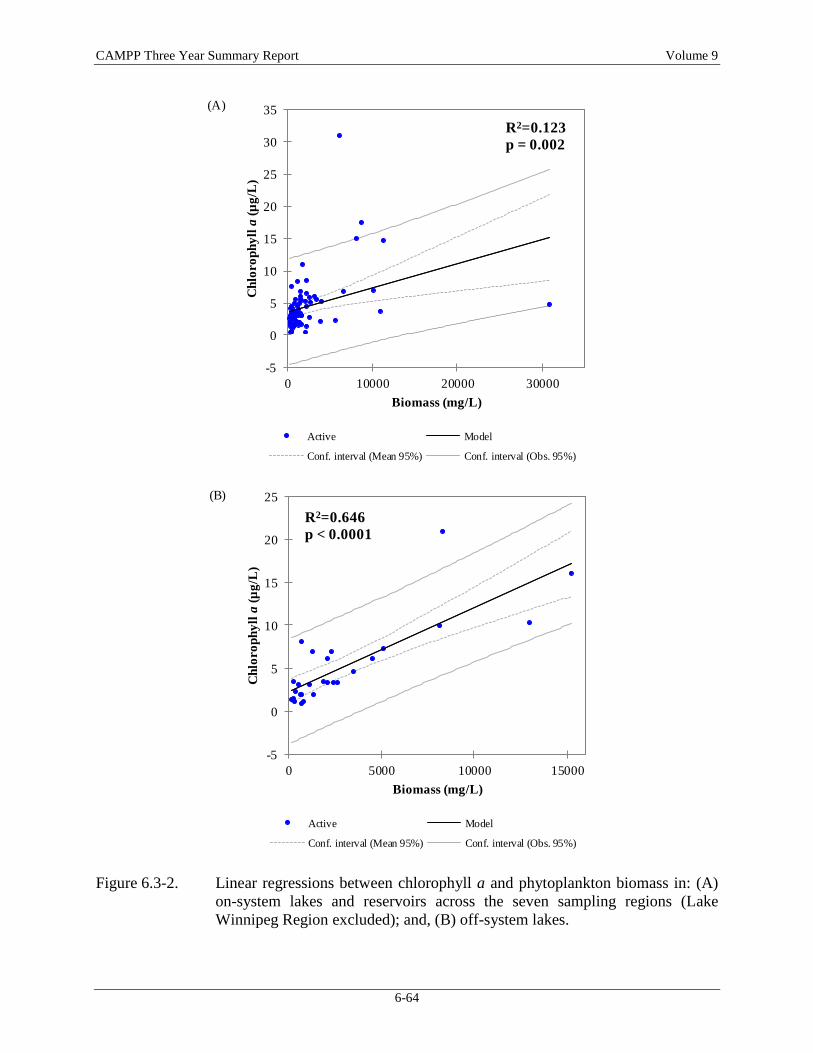
CAMPP Three Year Summary Report Volume 9
6-64
Figure 6.3-2. Linear regressions between chlorophyll a and phytoplankton biomass in: (A)
on-system lakes and reservoirs across the seven sampling regions (Lake
Winnipeg Region excluded); and, (B) off-system lakes.
(A)
(B)
-5
0
5
10
15
20
25
30
35
0 10000 20000 30000
Ch
loro
ph
yll
a (
µg
/L)
Biomass (mg/L)
Active Model
Conf. interval (Mean 95%) Conf. interval (Obs. 95%)
R2=0.123
p = 0.002
-5
0
5
10
15
20
25
0 5000 10000 15000
Ch
loro
ph
yll
a (
µg
/L)
Biomass (mg/L)
Active Model
Conf. interval (Mean 95%) Conf. interval (Obs. 95%)
R2=0.646
p < 0.0001
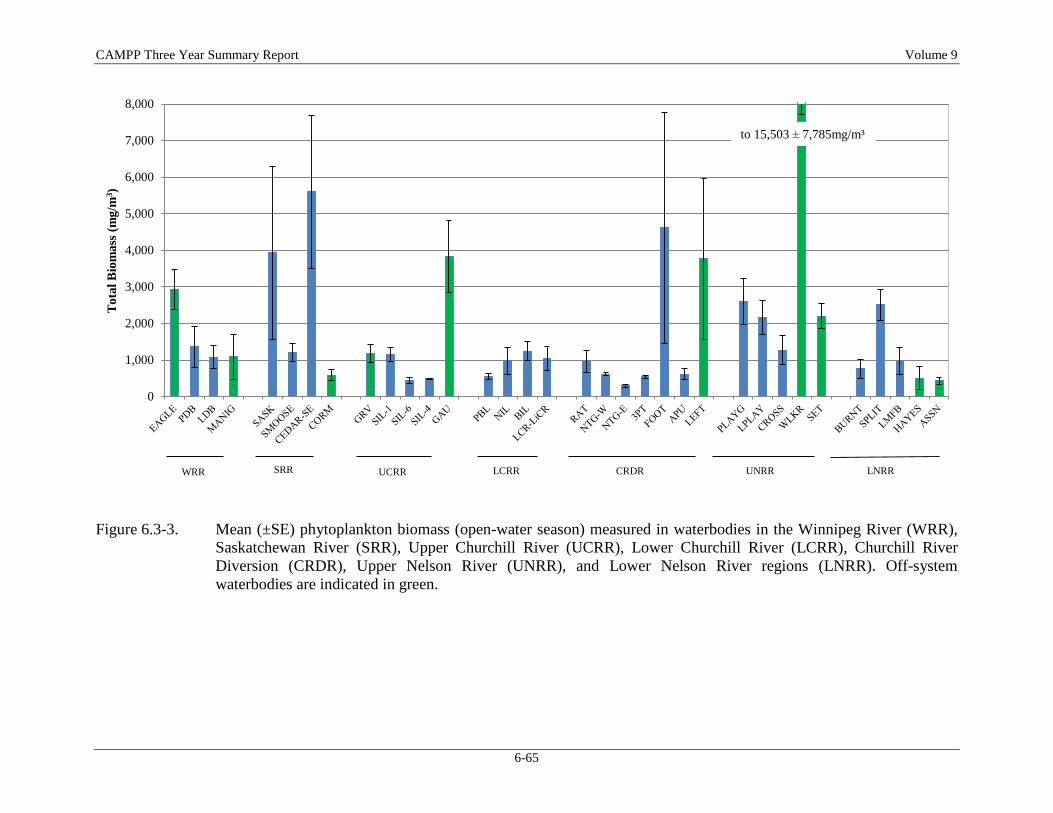
CAMPP Three Year Summary Report Volume 9
6-65
Figure 6.3-3. Mean (±SE) phytoplankton biomass (open-water season) measured in waterbodies in the Winnipeg River (WRR),
Saskatchewan River (SRR), Upper Churchill River (UCRR), Lower Churchill River (LCRR), Churchill River
Diversion (CRDR), Upper Nelson River (UNRR), and Lower Nelson River regions (LNRR). Off-system
waterbodies are indicated in green.
0
1,000
2,000
3,000
4,000
5,000
6,000
7,000
8,000T
ota
l B
iom
ass
(m
g/m
3)
UCRRSRRWRR LNRRUNRRCRDRLCRR
to 15,503 ± 7,785mg/m³
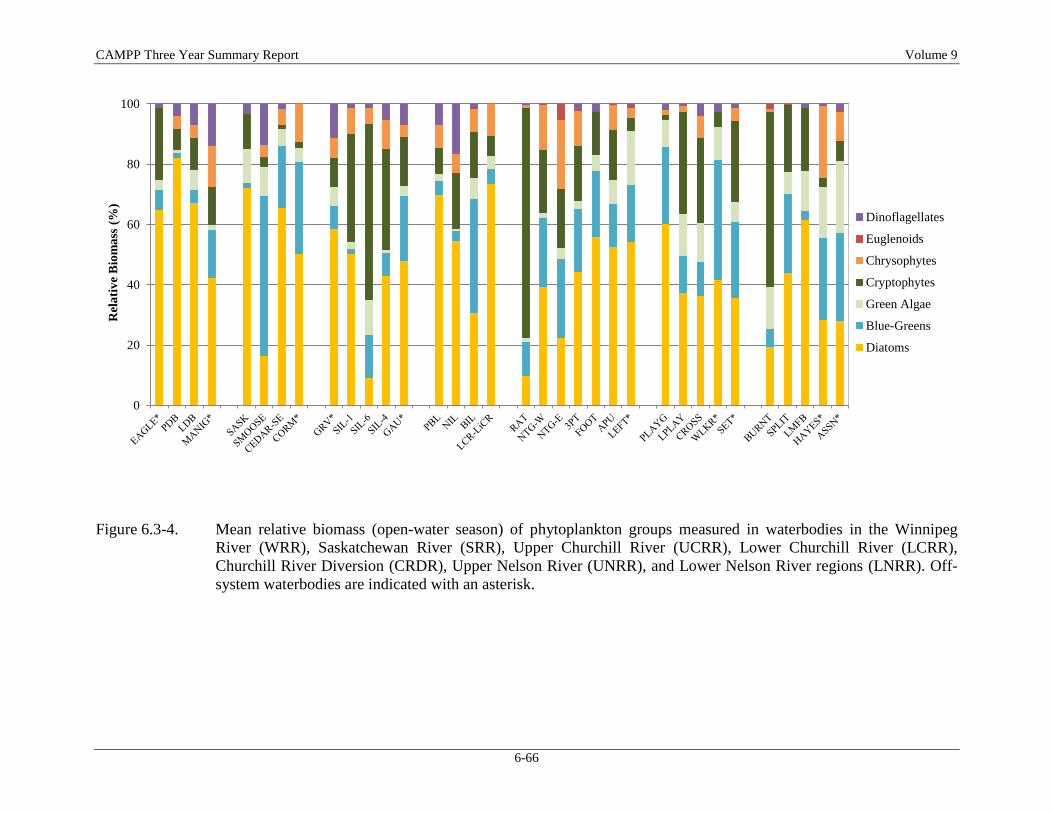
CAMPP Three Year Summary Report Volume 9
6-66
Figure 6.3-4. Mean relative biomass (open-water season) of phytoplankton groups measured in waterbodies in the Winnipeg
River (WRR), Saskatchewan River (SRR), Upper Churchill River (UCRR), Lower Churchill River (LCRR),
Churchill River Diversion (CRDR), Upper Nelson River (UNRR), and Lower Nelson River regions (LNRR). Off-
system waterbodies are indicated with an asterisk.
0
20
40
60
80
100R
ela
tiv
e B
iom
ass
(%
)
Dinoflagellates
Euglenoids
Chrysophytes
Cryptophytes
Green Algae
Blue-Greens
Diatoms
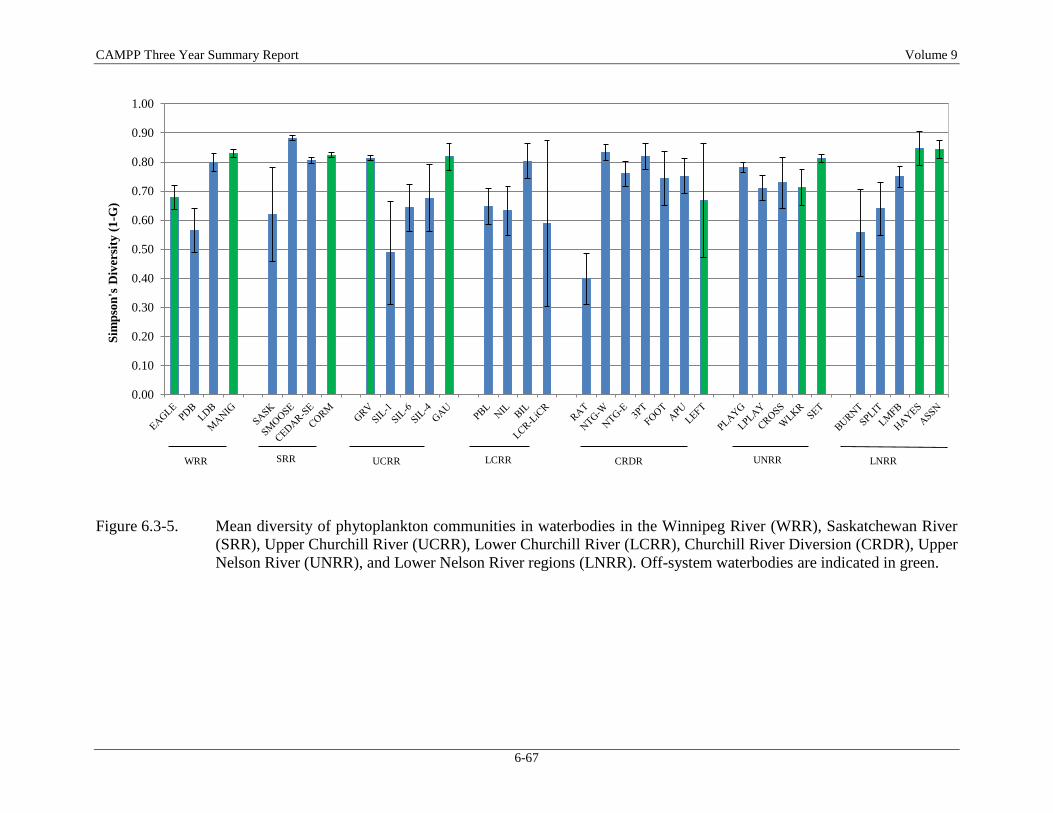
CAMPP Three Year Summary Report Volume 9
6-67
Figure 6.3-5. Mean diversity of phytoplankton communities in waterbodies in the Winnipeg River (WRR), Saskatchewan River
(SRR), Upper Churchill River (UCRR), Lower Churchill River (LCRR), Churchill River Diversion (CRDR), Upper
Nelson River (UNRR), and Lower Nelson River regions (LNRR). Off-system waterbodies are indicated in green.
0.00
0.10
0.20
0.30
0.40
0.50
0.60
0.70
0.80
0.90
1.00S
imp
son
's D
iver
sity
(1
-G)
LNRRUCRRSRRWRR UNRRCRDRLCRR
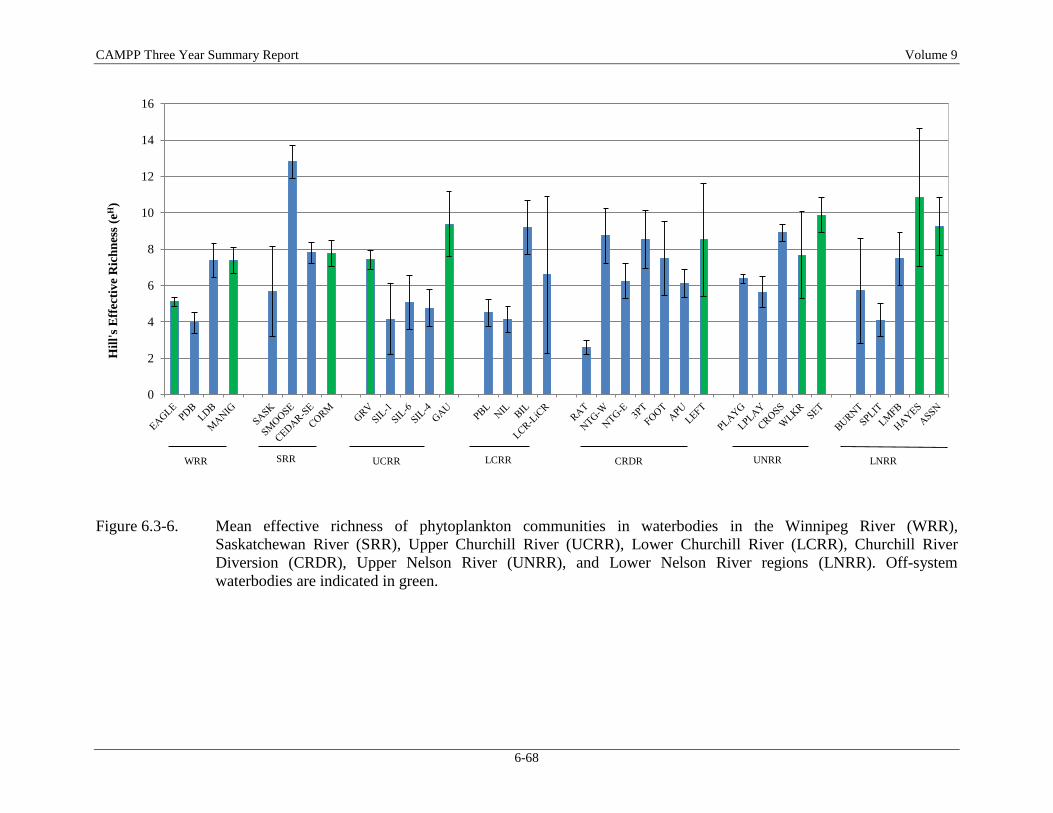
CAMPP Three Year Summary Report Volume 9
6-68
Figure 6.3-6. Mean effective richness of phytoplankton communities in waterbodies in the Winnipeg River (WRR),
Saskatchewan River (SRR), Upper Churchill River (UCRR), Lower Churchill River (LCRR), Churchill River
Diversion (CRDR), Upper Nelson River (UNRR), and Lower Nelson River regions (LNRR). Off-system
waterbodies are indicated in green.
0
2
4
6
8
10
12
14
16H
ill'
s E
ffec
tiv
e R
ich
nes
s (e
H)
LNRRUCRRSRRWRR UNRRCRDRLCRR
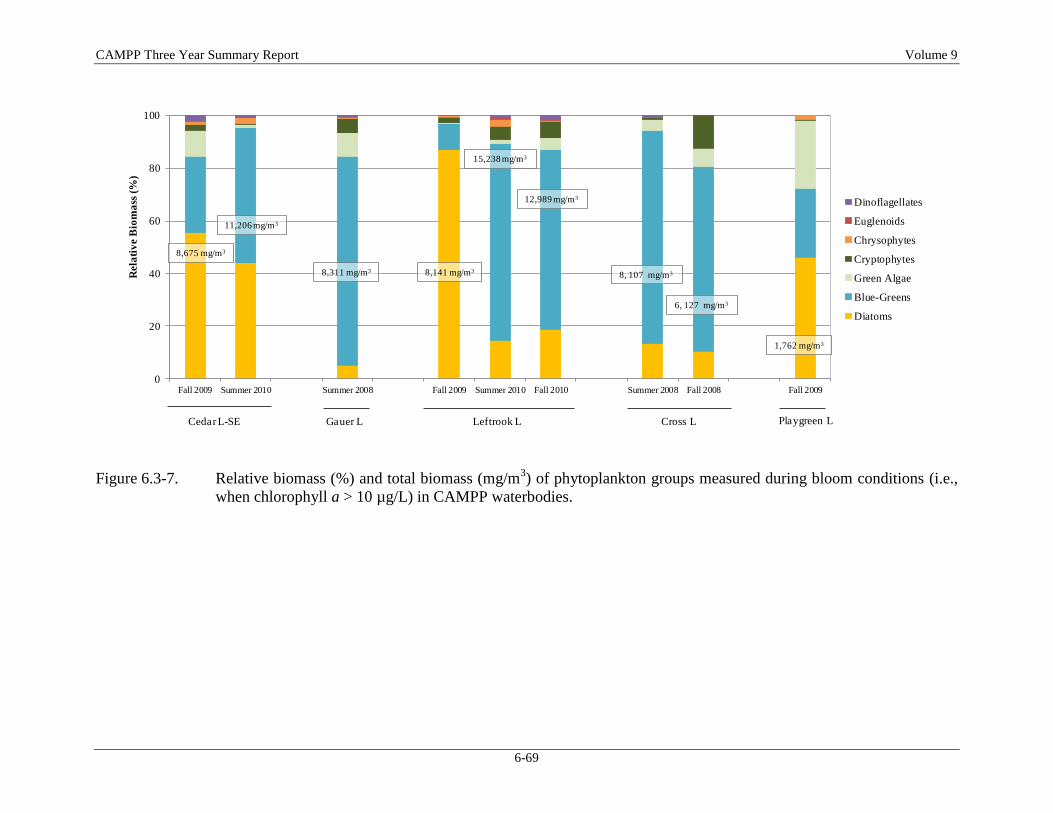
CAMPP Three Year Summary Report Volume 9
6-69
Figure 6.3-7. Relative biomass (%) and total biomass (mg/m3) of phytoplankton groups measured during bloom conditions (i.e.,
when chlorophyll a > 10 µg/L) in CAMPP waterbodies.
0
20
40
60
80
100
Fall 2009 Summer 2010 Summer 2008 Fall 2009 Summer 2010 Fall 2010 Summer 2008 Fall 2008 Fall 2009
Rela
tiv
e B
iom
ass
(%
)
Dinoflagellates
Euglenoids
Chrysophytes
Cryptophytes
Green Algae
Blue-Greens
Diatoms
Cedar L-SE Gauer L Leftrook L Cross L Playgreen L
11,206 mg/m3
8,311 mg/m3
15,238 mg/m3
12,989 mg/m3
8, 107 mg/m3
6, 127 mg/m3
1,762 mg/m3
8,675 mg/m3
8,141 mg/m3

CAMPP Three Year Summary Report Volume 9
6-71
6.4 BENTHIC MACROINVERTEBRATES
The following discussion provides an overview of key benthic macroinvertebrate (BMI)
community results based on selected BMI community metrics (community descriptors or
parameters) for all the CAMPP waterbodies sampled in Years 1-3 of the pilot program. This
overview is intended to provide a broad description of key results for nearshore and offshore
habitats sampled across the study regions (excluding the Lake Winnipeg Region), and to
comment on general differences and similarities in the BMI communities between on- and off-
system waterbodies. Additionally, this review was undertaken to help assess the overall design of
the CAMPP BMI community monitoring program and facilitate discussion of potential
modifications to the program in the future. As such, the following sections are not intended to
provide a comprehensive discussion and the reader is referred to Section 5 of this report for a
detailed description of results of the CAMPP BMI community program.
For the purposes of exploring larger geographical patterns, sites located along the main river
systems were grouped (on-system) and considered separately from off-system sites. Although
Granville lake is located upstream of Manitoba Hydro’s hydraulic system, it has been included in
the on-system waterbody discussions presented below as it is physically located on the main flow
of the upper Churchill River. These two major groups of waterbodies were identified to facilitate
exploration of patterns or relationships in BMI community metrics among waterbodies located
along the major rivers in comparison to those uninfluenced by the major rivers.
Summaries of key BMI community results for each of the regions are presented in Tables 6.4-1
to 6.4-7 and Figures 6.4-1 to 6.4-18. In Years 1 and 2, nearshore aquatic habitat at water depths
between 3 and 5 m (i.e., predominantly wetted) was sampled with a grab device. However, in
Year 3, nearshore habitat at water depths less than or equal to 1 m (i.e., intermittently wetted and
wadeable) was sampled with a kicknet. Due to this change in sampling methodology, Year 3
nearshore results are not directly comparable to Years 1 and 2 and are discussed separately.
6.4.1 On-System Waterbodies
6.4.1.1 Intermittently Wetted Nearshore Aquatic Habitat
Differences in the numbers of organisms are influenced by a variety of physical (e.g., substrate
type, flow conditions), biological (e.g., benthic algal biomass), and chemical (e.g., dissolved
oxygen and nutrient concentrations) factors. As such, the mean total BMI abundance measured
in a waterbody is a reflection of numerous aquatic habitat variables that have been integrated by
the community over time. The mean total BMI abundance measured in intermittently wetted
nearshore habitat varied among on-system waterbodies and ranged widely between 35
CAMPP Three Year Summary Report Volume 9
6-72
individuals/kicknet (Footprint Lake – Churchill River Diversion Region) and 7,816
individuals/kicknet (Little Playgreen Lake – Upper Nelson River Region) (Tables 6.4-1 to 6.4-7;
Figure 6.4-1). Variability within and among waterbodies may be elevated as only one year of
data were available for this aquatic habitat type. The highest mean total abundances occurred
within the Winnipeg River, Lower Churchill River, and Upper Nelson River regions, while the
lowest occurred within the Saskatchewan River, Churchill River Diversion and Lower Nelson
River regions. Within a given region, on-system waterbodies tended to have notably different
mean total BMI abundances. Differences were less pronounced among waterbodies within the
Upper Churchill River, Churchill River Diversion, and Lower Nelson River regions, where
abundances ranged from 35 individuals/kicknet to 323 individuals/kicknet (Tables 6.4-3, 6.4-5,
and 6.4-7).
The mean total abundance of Ephemeroptera, Plecoptera, and Trichoptera (EPT) among
waterbodies within a region tended to follow a pattern similar to the one observed for mean total
BMI abundance (Figures 6.4-1 and 6.4-2), with the exception of waterbodies within the
Saskatchewan River, Upper Churchill River and Lower Churchill River regions where order of
EPT abundance between lakes was reversed in comparison to total abundance. The highest mean
total abundance of EPT occurred within Little Playgreen Lake (552 individuals/kicknet: Upper
Nelson River Region), followed by Lac du Bonnet (42 individuals/kicknet: Winnipeg River
Region) (Figure 6.4-2). The lowest abundance of EPT occurred in Northern Indian Lake (Lower
Churchill River Region) and Limestone Forebay (lower Nelson River) (less than 1 and 1
individual/kicknet, respectively: Tables 6.4-4 and 6.4-7; Figure 6.4-2). EPT comprised between
less than 0.1% (Northern Indian Lake) and 59% (Saskatchewan River) of the macroinvertebrate
community sampled in intermittently wetted nearshore habitat (see Section 5).
Genus analysis of the Ephemeroptera indicated that the following eight species were dominant or
co-dominant in this type of habitat across the regions: Caenis sp. (Caenidae), Ephemera sp.
(Ephemeridae), Hexagenia sp. (Ephemeridae), Procoleon sp. (Baetidae), Stenonema sp.
(Heptageniidae), Callibaetis sp. (Baetidae), and Parameletus (Siphlonuridae). The
Ephemeroptera community in waterbodies of the Winnipeg River Region was dominated by
Caenis sp. or Ephemera sp., both of which are similar in their general aquatic habitat preferences
in that they prefer fine bottom sediments (silt-clay, silt-sand); however, they may also be
representative of heterogeneous bottom sediments (e.g., silt-clay, boulder-cobble mixture) (Table
6.4-1). In the Saskatchewan River Region, Caenis sp. and Hexagenia sp. were dominant (Table
6.4-2). In Southern Indian Lake within the Upper Churchill River Region, Caenis sp. continued
to be a dominant genera in Area 4, however, Procoleon sp. was dominant in Area 6; Procoleon
sp. also has the same general aquatic habitat preferences as Caenis sp. (Table 6.4-3). Caenis sp.
was again the dominant genera identified in waterbodies of the Lower Churchill River Region,
CAMPP Three Year Summary Report Volume 9
6-73
with the exception of the lower Churchill River at Little Churchill River where Parameletus sp.
was dominant (Table 6.4-4). Parameletus sp. differs in its general aquatic habitat preferences in
that they tend to prefer rooted vascular plants; they are swimmers and climbers that associate
with plants as collector-gatherers. In the Churchill River Diversion Region, Hexagenia sp. was
dominant in the intermittently wetted nearshore of Threepoint and Footprint lakes, whereas
Callibaetis sp. was dominant in Rat Lake (Table 6.4-5). Hexagenia sp. has the same general
aquatic habitat preferences as Caenis sp. Similar to Parameletus sp., Callibaetis sp. generally
prefers rooted vascular plants. The Ephemeroptera community in waterbodies of the Upper
Nelson River Region was dominated by Caenis sp. (Table 6.4-6). Waterbodies within the Lower
Nelson River region were somewhat more variable in terms of the dominant Ephemeroptera
genera in comparison to other regions, particularly the Limestone Forebay. In Split Lake, Caenis
sp. was dominant, while Procloeon sp. was dominant in the lower Nelson River; however, in the
Limestone Forebay, Caenis sp., Procloeon sp., and Stenonema sp. were co-dominant (Table 6.4-
7). Stenonema sp. differs in it general aquatic habitat preferences from Caenis sp. and Procloeon
sp. in that they tend to prefer coarse bottom sediments, such as boulder-cobble, and are typically
found in waters with some flow (Merritt and Cummins 1996). Overall, the greater variety of
dominant genera observed in the intermittently wetted nearshore habitat across the regions and
within a region in comparison to the predominantly wetted nearshore likely reflects the increased
variability of this intermittently wetted habitat; this type of habitat is more strongly affected by
water level fluctuations and wave energy, increased substrate heterogeneity, and potentially by
anthropogenic factors (e.g., water level regulation; shoreline development, etc.).
EPT are generally considered to be more sensitive and Chironomidae less sensitive to
environmental stress (e.g., nutrient enrichment, low dissolved oxygen concentrations). A
community considered to be in good biotic condition may display an even distribution among
these groups, while communities with disproportionately high numbers of chironomids may
indicate environmental stress, either natural or anthropogenic. Although chironomids are often
described as being tolerant to adverse conditions, many taxa belong to this group and the
perceived tolerance of the group as a whole may be attributable to only a few taxa. The mean
ratio of EPT:C was less than 1 for 9 of the 18 on-system waterbodies sampled across the regions,
indicative of an insect community typically dominated by Chironomidae in intermittently wetted
nearshore habitat (Figure 6.4-3). Waterbodies with an EPT:C ratio greater than 1 included Pointe
du Bois Forebay and Lac du Bonnet in the Winnipeg River Region (1.48 and 1.42, respectively:
Table 6.4-1), Saskatchewan River and Cedar Lake-Southeast in the Saskatchewan River Region
(10.73 and 2.04, respectively: Table 6.4-2), Southern Indian Lake-Area 6 in the Upper Churchill
River Region (8.73: Table 6.4-3), Billard Lake and lower Churchill River at Little Churchill
River in the Lower Churchill River Region (1.36 and 5.75, respectively: Table 6.4-4), Rat Lake
in the Churchill River Diversion Region (1.04: Table 6.4-5), and Split Lake in the Lower Nelson
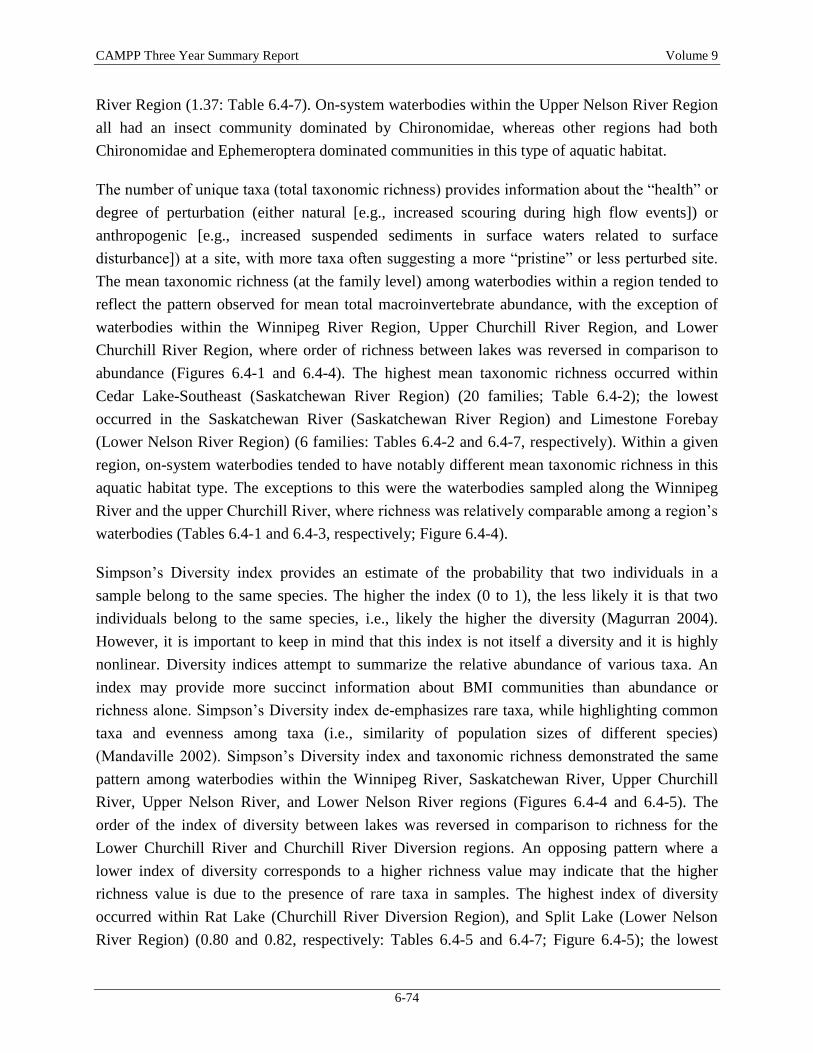
CAMPP Three Year Summary Report Volume 9
6-74
River Region (1.37: Table 6.4-7). On-system waterbodies within the Upper Nelson River Region
all had an insect community dominated by Chironomidae, whereas other regions had both
Chironomidae and Ephemeroptera dominated communities in this type of aquatic habitat.
The number of unique taxa (total taxonomic richness) provides information about the “health” or
degree of perturbation (either natural [e.g., increased scouring during high flow events]) or
anthropogenic [e.g., increased suspended sediments in surface waters related to surface
disturbance]) at a site, with more taxa often suggesting a more “pristine” or less perturbed site.
The mean taxonomic richness (at the family level) among waterbodies within a region tended to
reflect the pattern observed for mean total macroinvertebrate abundance, with the exception of
waterbodies within the Winnipeg River Region, Upper Churchill River Region, and Lower
Churchill River Region, where order of richness between lakes was reversed in comparison to
abundance (Figures 6.4-1 and 6.4-4). The highest mean taxonomic richness occurred within
Cedar Lake-Southeast (Saskatchewan River Region) (20 families; Table 6.4-2); the lowest
occurred in the Saskatchewan River (Saskatchewan River Region) and Limestone Forebay
(Lower Nelson River Region) (6 families: Tables 6.4-2 and 6.4-7, respectively). Within a given
region, on-system waterbodies tended to have notably different mean taxonomic richness in this
aquatic habitat type. The exceptions to this were the waterbodies sampled along the Winnipeg
River and the upper Churchill River, where richness was relatively comparable among a region’s
waterbodies (Tables 6.4-1 and 6.4-3, respectively; Figure 6.4-4).
Simpson’s Diversity index provides an estimate of the probability that two individuals in a
sample belong to the same species. The higher the index (0 to 1), the less likely it is that two
individuals belong to the same species, i.e., likely the higher the diversity (Magurran 2004).
However, it is important to keep in mind that this index is not itself a diversity and it is highly
nonlinear. Diversity indices attempt to summarize the relative abundance of various taxa. An
index may provide more succinct information about BMI communities than abundance or
richness alone. Simpson’s Diversity index de-emphasizes rare taxa, while highlighting common
taxa and evenness among taxa (i.e., similarity of population sizes of different species)
(Mandaville 2002). Simpson’s Diversity index and taxonomic richness demonstrated the same
pattern among waterbodies within the Winnipeg River, Saskatchewan River, Upper Churchill
River, Upper Nelson River, and Lower Nelson River regions (Figures 6.4-4 and 6.4-5). The
order of the index of diversity between lakes was reversed in comparison to richness for the
Lower Churchill River and Churchill River Diversion regions. An opposing pattern where a
lower index of diversity corresponds to a higher richness value may indicate that the higher
richness value is due to the presence of rare taxa in samples. The highest index of diversity
occurred within Rat Lake (Churchill River Diversion Region), and Split Lake (Lower Nelson
River Region) (0.80 and 0.82, respectively: Tables 6.4-5 and 6.4-7; Figure 6.4-5); the lowest
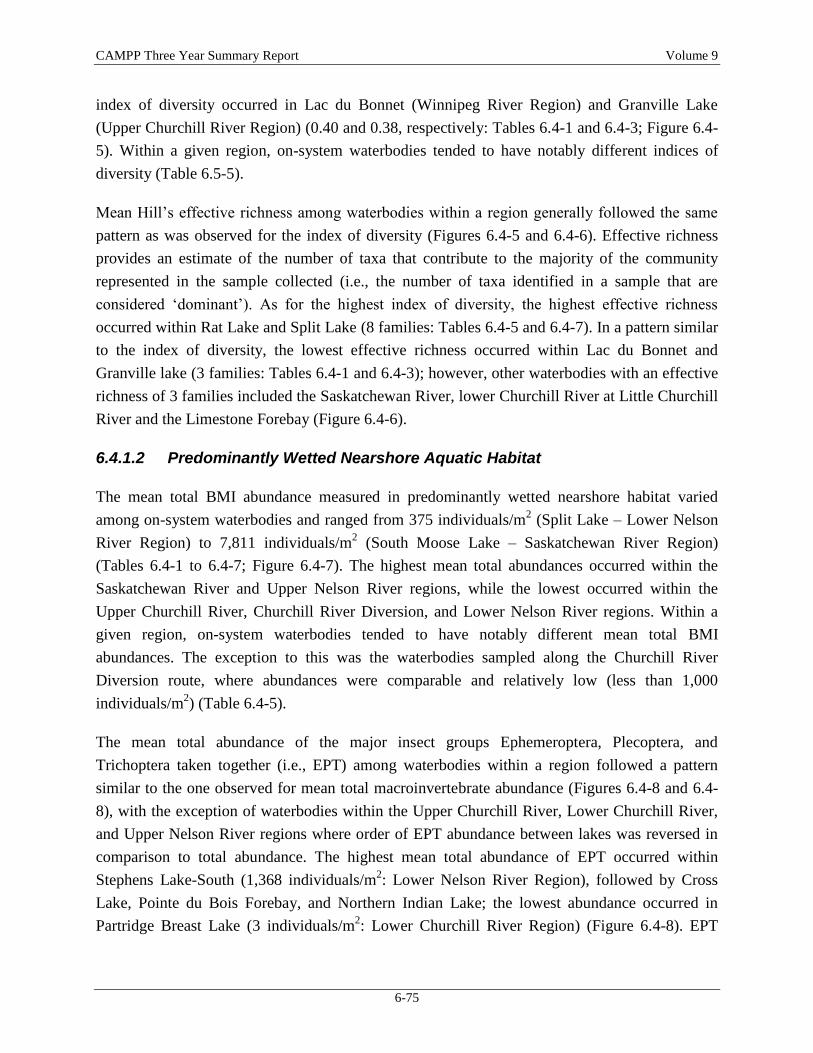
CAMPP Three Year Summary Report Volume 9
6-75
index of diversity occurred in Lac du Bonnet (Winnipeg River Region) and Granville Lake
(Upper Churchill River Region) (0.40 and 0.38, respectively: Tables 6.4-1 and 6.4-3; Figure 6.4-
5). Within a given region, on-system waterbodies tended to have notably different indices of
diversity (Table 6.5-5).
Mean Hill’s effective richness among waterbodies within a region generally followed the same
pattern as was observed for the index of diversity (Figures 6.4-5 and 6.4-6). Effective richness
provides an estimate of the number of taxa that contribute to the majority of the community
represented in the sample collected (i.e., the number of taxa identified in a sample that are
considered ‘dominant’). As for the highest index of diversity, the highest effective richness
occurred within Rat Lake and Split Lake (8 families: Tables 6.4-5 and 6.4-7). In a pattern similar
to the index of diversity, the lowest effective richness occurred within Lac du Bonnet and
Granville lake (3 families: Tables 6.4-1 and 6.4-3); however, other waterbodies with an effective
richness of 3 families included the Saskatchewan River, lower Churchill River at Little Churchill
River and the Limestone Forebay (Figure 6.4-6).
6.4.1.2 Predominantly Wetted Nearshore Aquatic Habitat
The mean total BMI abundance measured in predominantly wetted nearshore habitat varied
among on-system waterbodies and ranged from 375 individuals/m2 (Split Lake – Lower Nelson
River Region) to 7,811 individuals/m2 (South Moose Lake – Saskatchewan River Region)
(Tables 6.4-1 to 6.4-7; Figure 6.4-7). The highest mean total abundances occurred within the
Saskatchewan River and Upper Nelson River regions, while the lowest occurred within the
Upper Churchill River, Churchill River Diversion, and Lower Nelson River regions. Within a
given region, on-system waterbodies tended to have notably different mean total BMI
abundances. The exception to this was the waterbodies sampled along the Churchill River
Diversion route, where abundances were comparable and relatively low (less than 1,000
individuals/m2) (Table 6.4-5).
The mean total abundance of the major insect groups Ephemeroptera, Plecoptera, and
Trichoptera taken together (i.e., EPT) among waterbodies within a region followed a pattern
similar to the one observed for mean total macroinvertebrate abundance (Figures 6.4-8 and 6.4-
8), with the exception of waterbodies within the Upper Churchill River, Lower Churchill River,
and Upper Nelson River regions where order of EPT abundance between lakes was reversed in
comparison to total abundance. The highest mean total abundance of EPT occurred within
Stephens Lake-South (1,368 individuals/m2: Lower Nelson River Region), followed by Cross
Lake, Pointe du Bois Forebay, and Northern Indian Lake; the lowest abundance occurred in
Partridge Breast Lake (3 individuals/m2: Lower Churchill River Region) (Figure 6.4-8). EPT
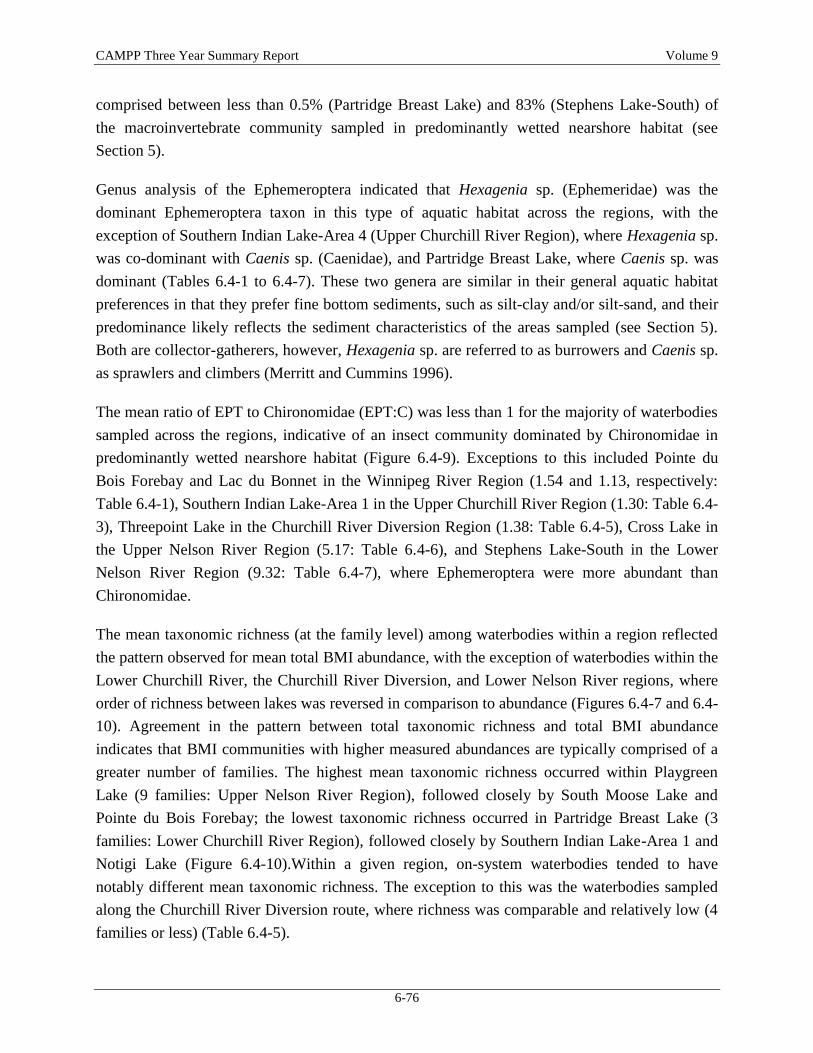
CAMPP Three Year Summary Report Volume 9
6-76
comprised between less than 0.5% (Partridge Breast Lake) and 83% (Stephens Lake-South) of
the macroinvertebrate community sampled in predominantly wetted nearshore habitat (see
Section 5).
Genus analysis of the Ephemeroptera indicated that Hexagenia sp. (Ephemeridae) was the
dominant Ephemeroptera taxon in this type of aquatic habitat across the regions, with the
exception of Southern Indian Lake-Area 4 (Upper Churchill River Region), where Hexagenia sp.
was co-dominant with Caenis sp. (Caenidae), and Partridge Breast Lake, where Caenis sp. was
dominant (Tables 6.4-1 to 6.4-7). These two genera are similar in their general aquatic habitat
preferences in that they prefer fine bottom sediments, such as silt-clay and/or silt-sand, and their
predominance likely reflects the sediment characteristics of the areas sampled (see Section 5).
Both are collector-gatherers, however, Hexagenia sp. are referred to as burrowers and Caenis sp.
as sprawlers and climbers (Merritt and Cummins 1996).
The mean ratio of EPT to Chironomidae (EPT:C) was less than 1 for the majority of waterbodies
sampled across the regions, indicative of an insect community dominated by Chironomidae in
predominantly wetted nearshore habitat (Figure 6.4-9). Exceptions to this included Pointe du
Bois Forebay and Lac du Bonnet in the Winnipeg River Region (1.54 and 1.13, respectively:
Table 6.4-1), Southern Indian Lake-Area 1 in the Upper Churchill River Region (1.30: Table 6.4-
3), Threepoint Lake in the Churchill River Diversion Region (1.38: Table 6.4-5), Cross Lake in
the Upper Nelson River Region (5.17: Table 6.4-6), and Stephens Lake-South in the Lower
Nelson River Region (9.32: Table 6.4-7), where Ephemeroptera were more abundant than
Chironomidae.
The mean taxonomic richness (at the family level) among waterbodies within a region reflected
the pattern observed for mean total BMI abundance, with the exception of waterbodies within the
Lower Churchill River, the Churchill River Diversion, and Lower Nelson River regions, where
order of richness between lakes was reversed in comparison to abundance (Figures 6.4-7 and 6.4-
10). Agreement in the pattern between total taxonomic richness and total BMI abundance
indicates that BMI communities with higher measured abundances are typically comprised of a
greater number of families. The highest mean taxonomic richness occurred within Playgreen
Lake (9 families: Upper Nelson River Region), followed closely by South Moose Lake and
Pointe du Bois Forebay; the lowest taxonomic richness occurred in Partridge Breast Lake (3
families: Lower Churchill River Region), followed closely by Southern Indian Lake-Area 1 and
Notigi Lake (Figure 6.4-10).Within a given region, on-system waterbodies tended to have
notably different mean taxonomic richness. The exception to this was the waterbodies sampled
along the Churchill River Diversion route, where richness was comparable and relatively low (4
families or less) (Table 6.4-5).
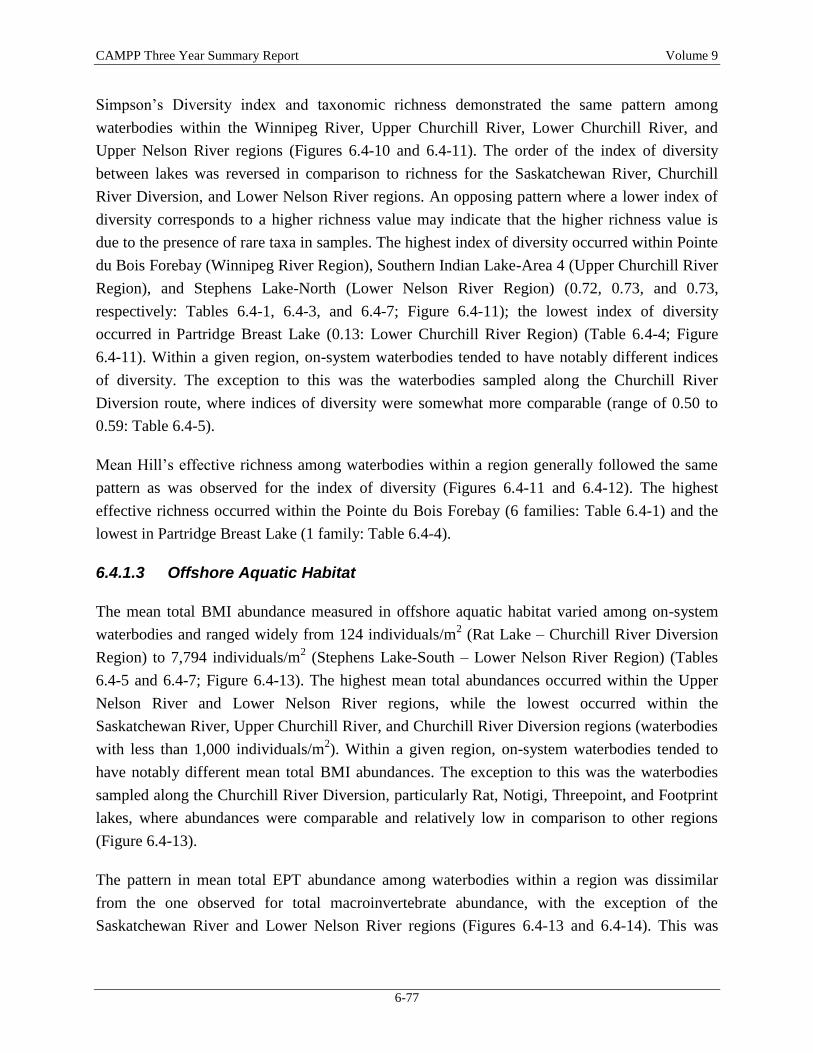
CAMPP Three Year Summary Report Volume 9
6-77
Simpson’s Diversity index and taxonomic richness demonstrated the same pattern among
waterbodies within the Winnipeg River, Upper Churchill River, Lower Churchill River, and
Upper Nelson River regions (Figures 6.4-10 and 6.4-11). The order of the index of diversity
between lakes was reversed in comparison to richness for the Saskatchewan River, Churchill
River Diversion, and Lower Nelson River regions. An opposing pattern where a lower index of
diversity corresponds to a higher richness value may indicate that the higher richness value is
due to the presence of rare taxa in samples. The highest index of diversity occurred within Pointe
du Bois Forebay (Winnipeg River Region), Southern Indian Lake-Area 4 (Upper Churchill River
Region), and Stephens Lake-North (Lower Nelson River Region) (0.72, 0.73, and 0.73,
respectively: Tables 6.4-1, 6.4-3, and 6.4-7; Figure 6.4-11); the lowest index of diversity
occurred in Partridge Breast Lake (0.13: Lower Churchill River Region) (Table 6.4-4; Figure
6.4-11). Within a given region, on-system waterbodies tended to have notably different indices
of diversity. The exception to this was the waterbodies sampled along the Churchill River
Diversion route, where indices of diversity were somewhat more comparable (range of 0.50 to
0.59: Table 6.4-5).
Mean Hill’s effective richness among waterbodies within a region generally followed the same
pattern as was observed for the index of diversity (Figures 6.4-11 and 6.4-12). The highest
effective richness occurred within the Pointe du Bois Forebay (6 families: Table 6.4-1) and the
lowest in Partridge Breast Lake (1 family: Table 6.4-4).
6.4.1.3 Offshore Aquatic Habitat
The mean total BMI abundance measured in offshore aquatic habitat varied among on-system
waterbodies and ranged widely from 124 individuals/m2 (Rat Lake – Churchill River Diversion
Region) to 7,794 individuals/m2 (Stephens Lake-South – Lower Nelson River Region) (Tables
6.4-5 and 6.4-7; Figure 6.4-13). The highest mean total abundances occurred within the Upper
Nelson River and Lower Nelson River regions, while the lowest occurred within the
Saskatchewan River, Upper Churchill River, and Churchill River Diversion regions (waterbodies
with less than 1,000 individuals/m2). Within a given region, on-system waterbodies tended to
have notably different mean total BMI abundances. The exception to this was the waterbodies
sampled along the Churchill River Diversion, particularly Rat, Notigi, Threepoint, and Footprint
lakes, where abundances were comparable and relatively low in comparison to other regions
(Figure 6.4-13).
The pattern in mean total EPT abundance among waterbodies within a region was dissimilar
from the one observed for total macroinvertebrate abundance, with the exception of the
Saskatchewan River and Lower Nelson River regions (Figures 6.4-13 and 6.4-14). This was
CAMPP Three Year Summary Report Volume 9
6-78
likely due in part to the very low EPT abundances that obscured the development of clear
patterns of abundances among waterbodies in offshore aquatic habitat. Additionally, it is also
likely indicative of a BMI community that is comprised of taxa that are proportionately more
abundant in comparison to EPT. The highest mean total abundance of EPT in offshore habitat
occurred in Stephens Lake-South, followed by Split Lake (1,818 and 1,392 individuals/m2,
respectively: Lower Nelson River Region) (Figure 6.4-14). Numerous waterbodies across the
regions had comparatively low abundances of EPT (less than 150 individuals/m2); South Moose
Lake and Cedar Lake-Southeast in the Saskatchewan River Region (6 and 30 individuals/m2,
respectively: Table 6.4-2), Granville Lake, Southern Indian Lake-Area 1, Southern Indian Lake-
Area 6, Southern Indian Lake-Area 4 in the Upper Churchill River Region (120, 32, 61, and 0
individuals/m2, respectively: Table 6.4-3), Partridge Breast Lake, Billard Lake, and lower
Churchill River at Little Churchill River in the Lower Churchill River Region (20, 12, and 133
individuals/m2, respectively: Table 6.4-4), Rat, Notigi, Threepoint, Footprint, and Apussigamasi
lakes in the Churchill River Diversion Region (38, 0, 60, 32, and 63 individuals/m2: Table 6.4-5),
and Stephens Lake-North in the Lower Nelson River Region (23 individuals/m2: Table 6.4-7).
EPT comprised between 0% (Southern Indian Lake-Area 4 and Notigi Lake) and 52% (Pointe du
Bois Forebay and Cross Lake) of the BMI community sampled in offshore habitat (see Section
5).
Genus analysis of the Ephemeroptera indicated that Hexagenia sp. (Ephemeridae: burrowing
Ephemeroptera that prefer fine bottom sediments such as silt-clay and/or silt-sand) was the
dominant Ephemeroptera taxon in this type of aquatic habitat across the regions (Tables 6.4-1 to
6.4-7). The three exceptions to this were Southern Indian Lake-Area 4 and Notigi Lake, where
no EPT were captured, and the lower Nelson River, where no Ephemeroptera were captured. The
EPT community sampled in the lower Nelson River consisted exclusively of Trichoptera with
Hydropsychidae being the dominant family encountered. Hydrospsychidae generally prefer
coarse bottom sediments, such as boulder-cobble, and are found in waters with some flow
(Merritt and Cummins 1996).
The mean ratio of EPT:C was less than 1 for the majority of waterbodies sampled across regions,
indicating an insect community that was dominated by Chironomidae in offshore habitat (Figure
6.4-15). Notable exceptions to this included Pointe du Bois Forebay in the Winnipeg River
Region (4.34: Table 6.4-1), Cross Lake in the Upper Nelson River Region (3.69: Table 6.4-6),
and Split Lake in the Lower Nelson River Region (10.52: Table 6.4-7), where Ephemeroptera
were considerably more abundant than Chironomidae.
The pattern in mean taxonomic richness (at the family level) among waterbodies within a region
was generally dissimilar from the one observed for total BMI abundance, with the exception of
CAMPP Three Year Summary Report Volume 9
6-79
the Winnipeg River and Saskatchewan River regions (Figures 6.4-13 and 6.4-16). Disagreement
in the pattern between total taxonomic richness and total macroinvertebrate abundance indicates
that BMI communities with higher measured abundances are typically comprised of a fewer
number of families. However, Playgreen Lake did exhibit one of the higher mean total
macroinvertebrate abundances and one of the highest mean taxonomic richness values, and Rat
Lake the lowest total abundance and one of the lowest richness values, which indicates that
abundance and richness may reflect the same pattern in offshore habitat for a sub-set of
waterbodies. The highest taxonomic richness occurred within the Limestone Forebay (Lower
Nelson River Region) (10 families: Table 6.4-7), followed by Little Playgreen Lake (Upper
Nelson River Region) (9 families: Table 6.4-6); the lowest occurred in Rat and Notigi lakes
within the Churchill River Diversion Region (2 families: Table 6.4-5). Within a given region, on-
system waterbodies tended to have notably different taxonomic richness values in offshore
habitat (Figure 6.4-16).
Simpson’s Diversity index and taxonomic richness demonstrated a very similar pattern among
waterbodies within the majority of regions sampled (Figures 6.4-16 and 6.4-17). The highest
index of diversity for on-system waterbodies occurred in the Limestone Forebay (0.82: Table
6.4-7), the waterbody with the correspondingly highest taxonomic richness value of 10 families.
The on-system water body with the lowest index diversity was Partridge Breast Lake (0.26:
Table 6.4-4); however, Partridge Breast Lake did not have the lowest taxonomic richness value,
which suggests that its comparatively higher richness value was due to the presence of rare taxa
in samples. Within a given region, offshore aquatic habitat sampled in on-system waterbodies
tended to have notably different indices of diversity, with the exception of waterbodies sampled
along the Winnipeg River where indices of diversity were both 0.58 (Table 6.4-1).
Mean Hill’s effective richness among waterbodies within a region typically followed the same
pattern as was observed for the index of diversity (Figures 6.4-17 and 6.4-18). As for the highest
index of diversity, the highest effective richness occurred in the Limestone Forebay (7 families:
Table 6.4-7). In a pattern similar to the index of diversity, the lowest effective richness occurred
in Partridge Breast Lake (2 families: Table 6.4-4). However, other waterbodies with comparably
higher indices of diversity also had effective richness values of 2 families; these included,
Southern Indian Lake-Area 1 (0.31 index of diversity: Table 6.4-3), Southern Indian Lake-Area 4
(0.41: Table 6.4-3), Rat Lake (0.33: Table 6.4-5), Notigi Lake (0.31: Table 6.4-5), and Stephens
Lake-North (0.40: Table 6.4-7) (Figure 6.4-18).
6.4.2 Off-system Waterbodies
Off-system waterbodies monitored under CAMPP are inherently different from on-system
waterbodies due to differences in lake morphometry, drainage basin size (particularly in
CAMPP Three Year Summary Report Volume 9
6-80
proportion to waterbody size), hydrology, etc. (see Section 3). Thus, differences in the BMI
community of on-system and off-system waterbodies were anticipated.
In intermittently wetted nearshore and offshore aquatic habitat, off-system waterbodies often fell
within the range of or were higher than total BMI abundances observed for neighbouring on-
system waterbodies (Figures 6.4-1 and 6.4-13). For the predominantly wetted nearshore aquatic
habitat type, total abundance measured in off-system waterbodies was often notably higher than
the range of abundances observed for corresponding on-system waterbodies (Figure 6.4-7).
Intermittently wetted nearshore habitat in Manigotagan Lake, and offshore habitat in Eaglenest
Lake and Assean Lake were notable exceptions to the above, as each had the lowest total
abundance in their respective regions.
The mean total abundance of EPT in off-system waterbodies often fell within the range observed
for on-system waterbodies within the same region, particularly for predominantly wetted
nearshore and offshore aquatic habitat types (Figures 6.4-8 and 6.4-14). In intermittently wetted
nearshore habitat, off-system waterbody Manigotagan Lake had an EPT abundance that was
lower in comparison to its on-system counterparts, while Eaglenest, Cormorant, and Assean
lakes had notably higher abundances of EPT (Figure 6.4-2). As for on-system waterbodies,
Hexagenia sp. was the dominant type of Ephemeroptera taxon in off-system waterbodies for both
predominantly wetted nearshore and offshore habitat (Tables 6.4-1 to 6.4-7). Similar to the
intermittently wetted nearshore habitat sampled in on-system waterbodies, there was a greater
variety of dominant genera observed in the off-system waterbodies that likely reflected the
increased variability or heterogeneity of this habitat type. Genera encountered in this type of
habitat in off-system waterbodies were also captured on-system, with the exception of Baetisca
sp. (Baetiscidae) that was only observed in the off-system Hayes River. Baetisca sp. prefers
sandy bottom sediments, often with detritus, and are typically found in depositional areas of
flowing waters (Merritt and Cummins 1996).
The EPT:C ratio in off-system waterbodies were typically within the range of ratios observed for
predominantly wetted nearshore and offshore habitat types in adjacent on-system waterbodies
(Figures 6.4-9 and 6.4-15), but comparatively less so for intermittently wetted nearshore habitat
(Figure 6.4-3). Intermittently wetted nearshore habitat in Manigotagan and Cormorant lakes had
EPT:C ratios that were lower than the range exhibited for on-system waterbodies in the same
region, whereas Leftrook, Setting, and Assean lakes, and the Hayes River had ratios that were
higher.
Mean taxonomic richness values of off-system waterbodies were somewhat less likely to be
encompassed by the range of values for neighbouring on-system waterbodies in intermittently
CAMPP Three Year Summary Report Volume 9
6-81
wetted nearshore habitat in comparison to predominantly wetted nearshore and offshore habitats
(Figures 6.4-4, 6.4-10, and 6.4-16). Intermittently wetted nearshore habitat in Manigotagan Lake
had richness values that were lower than the range exhibited for adjacent on-system waterbodies,
whereas Walker, Setting, and Assean lakes had richness values that were higher.
Similar to other BMI community metrics, diversity index values in off-system waterbodies were
less likely to be encompassed by the range of values for adjacent on-system waterbodies in
intermittently wetted nearshore habitat in comparison to predominantly wetted nearshore and
offshore habitat (Figures 6.4-5, 6.4-11, and 6.4-17). Intermittently wetted nearshore habitat in
Gauer Lake and the Hayes River had diversity index values that were lower than the range of on-
system waterbodies in the same region; Eaglenest, Cormorant, and Setting lakes had diversity
index values that were higher. Hill’s effective richness in off-system waterbodies reflected a
pattern similar to Simpson’s Diversity index (Figures 6.4-6, 6.4-12, and 6.4-18).
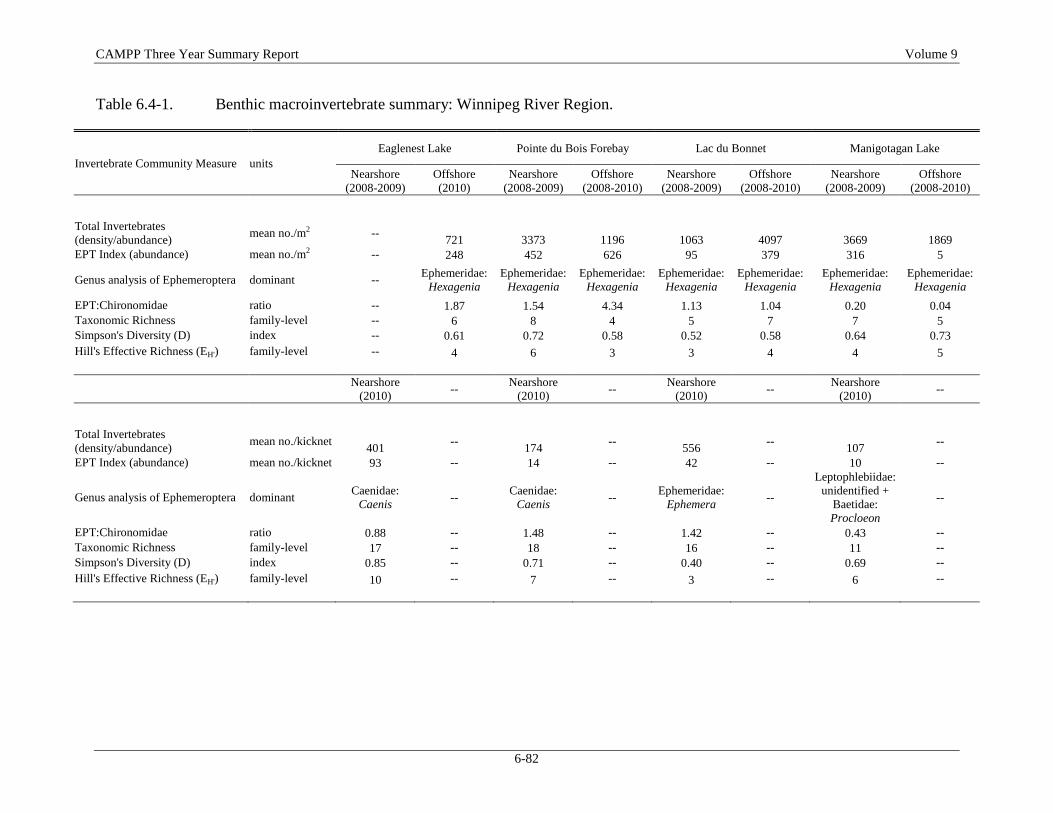
CAMPP Three Year Summary Report Volume 9
6-82
Table 6.4-1. Benthic macroinvertebrate summary: Winnipeg River Region.
Invertebrate Community Measure units
Eaglenest Lake Pointe du Bois Forebay Lac du Bonnet Manigotagan Lake
Nearshore
(2008-2009)
Offshore
(2010)
Nearshore
(2008-2009)
Offshore
(2008-2010)
Nearshore
(2008-2009)
Offshore
(2008-2010)
Nearshore
(2008-2009)
Offshore
(2008-2010)
Total Invertebrates
(density/abundance) mean no./m2 --
721 3373 1196 1063 4097 3669 1869
EPT Index (abundance) mean no./m2 -- 248 452 626 95 379 316 5
Genus analysis of Ephemeroptera dominant -- Ephemeridae:
Hexagenia
Ephemeridae:
Hexagenia
Ephemeridae:
Hexagenia
Ephemeridae:
Hexagenia
Ephemeridae:
Hexagenia
Ephemeridae:
Hexagenia
Ephemeridae:
Hexagenia
EPT:Chironomidae ratio -- 1.87 1.54 4.34 1.13 1.04 0.20 0.04
Taxonomic Richness family-level -- 6 8 4 5 7 7 5
Simpson's Diversity (D) index -- 0.61 0.72 0.58 0.52 0.58 0.64 0.73
Hill's Effective Richness (EH') family-level -- 4 6 3 3 4 4 5
Nearshore
(2010) --
Nearshore
(2010) --
Nearshore
(2010) --
Nearshore
(2010) --
Total Invertebrates
(density/abundance) mean no./kicknet
401 --
174 --
556 --
107 --
EPT Index (abundance) mean no./kicknet 93 -- 14 -- 42 -- 10 --
Genus analysis of Ephemeroptera dominant Caenidae:
Caenis --
Caenidae:
Caenis --
Ephemeridae:
Ephemera --
Leptophlebiidae:
unidentified +
Baetidae:
Procloeon
--
EPT:Chironomidae ratio 0.88 -- 1.48 -- 1.42 -- 0.43 --
Taxonomic Richness family-level 17 -- 18 -- 16 -- 11 --
Simpson's Diversity (D) index 0.85 -- 0.71 -- 0.40 -- 0.69 --
Hill's Effective Richness (EH') family-level 10 -- 7 -- 3 -- 6 --
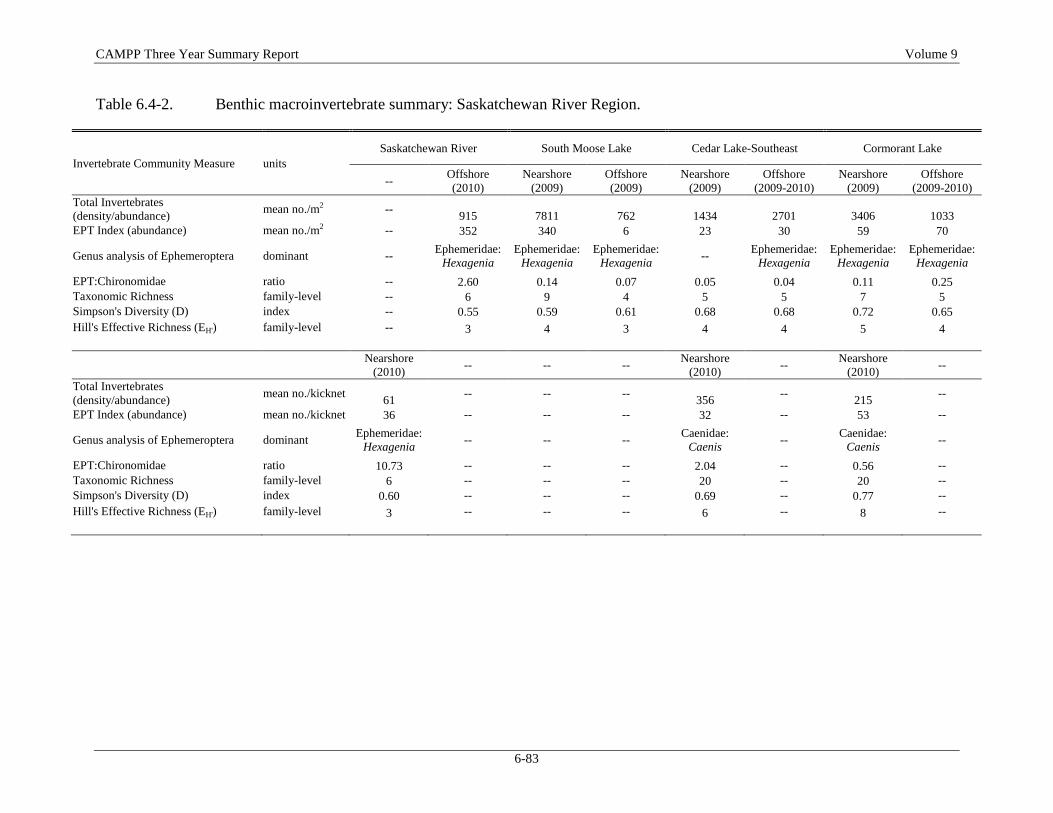
CAMPP Three Year Summary Report Volume 9
6-83
Table 6.4-2. Benthic macroinvertebrate summary: Saskatchewan River Region.
Invertebrate Community Measure units
Saskatchewan River South Moose Lake Cedar Lake-Southeast Cormorant Lake
-- Offshore
(2010)
Nearshore
(2009)
Offshore
(2009)
Nearshore
(2009)
Offshore
(2009-2010)
Nearshore
(2009)
Offshore
(2009-2010)
Total Invertebrates
(density/abundance) mean no./m2 --
915 7811 762 1434 2701 3406 1033
EPT Index (abundance) mean no./m2 -- 352 340 6 23 30 59 70
Genus analysis of Ephemeroptera dominant -- Ephemeridae:
Hexagenia
Ephemeridae:
Hexagenia
Ephemeridae:
Hexagenia --
Ephemeridae:
Hexagenia
Ephemeridae:
Hexagenia
Ephemeridae:
Hexagenia
EPT:Chironomidae ratio -- 2.60 0.14 0.07 0.05 0.04 0.11 0.25
Taxonomic Richness family-level -- 6 9 4 5 5 7 5
Simpson's Diversity (D) index -- 0.55 0.59 0.61 0.68 0.68 0.72 0.65
Hill's Effective Richness (EH') family-level -- 3 4 3 4 4 5 4
Nearshore
(2010) -- -- --
Nearshore
(2010) --
Nearshore
(2010) --
Total Invertebrates
(density/abundance) mean no./kicknet
61 -- -- --
356 --
215 --
EPT Index (abundance) mean no./kicknet 36 -- -- -- 32 -- 53 --
Genus analysis of Ephemeroptera dominant Ephemeridae:
Hexagenia -- -- --
Caenidae:
Caenis --
Caenidae:
Caenis --
EPT:Chironomidae ratio 10.73 -- -- -- 2.04 -- 0.56 --
Taxonomic Richness family-level 6 -- -- -- 20 -- 20 --
Simpson's Diversity (D) index 0.60 -- -- -- 0.69 -- 0.77 --
Hill's Effective Richness (EH') family-level 3 -- -- -- 6 -- 8 --
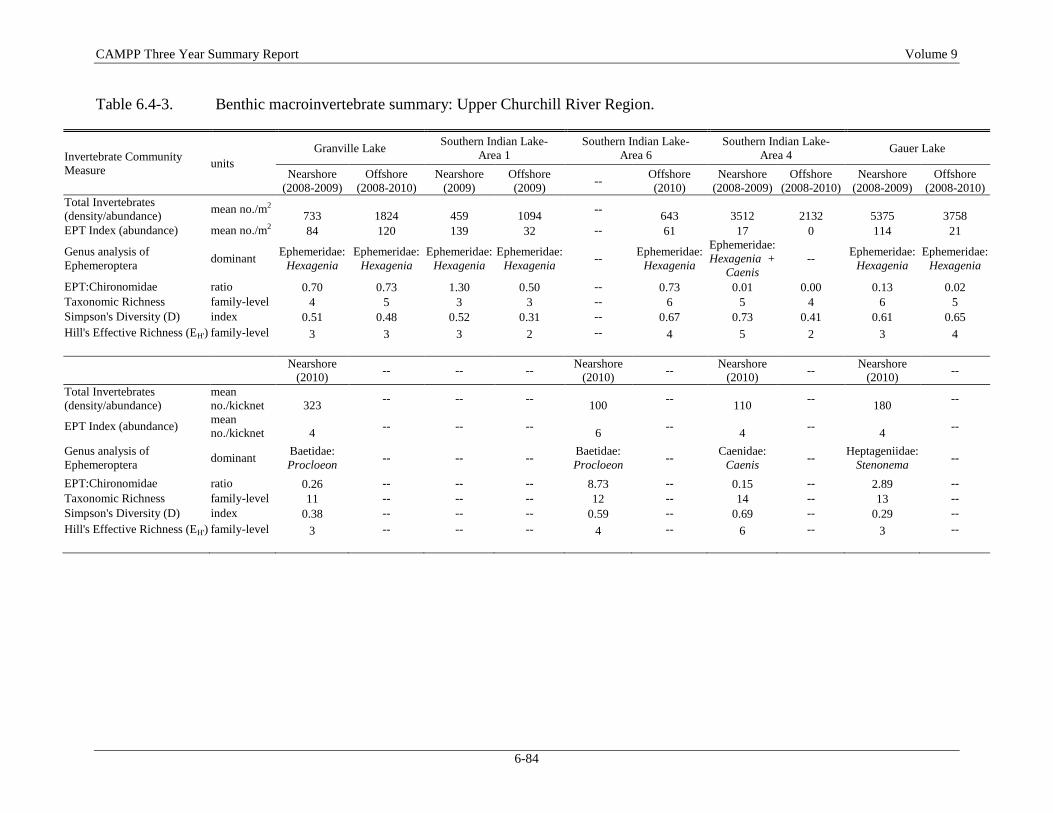
CAMPP Three Year Summary Report Volume 9
6-84
Table 6.4-3. Benthic macroinvertebrate summary: Upper Churchill River Region.
Invertebrate Community
Measure units
Granville Lake Southern Indian Lake-
Area 1
Southern Indian Lake-
Area 6
Southern Indian Lake-
Area 4 Gauer Lake
Nearshore
(2008-2009)
Offshore
(2008-2010)
Nearshore
(2009)
Offshore
(2009) --
Offshore
(2010)
Nearshore
(2008-2009)
Offshore
(2008-2010)
Nearshore
(2008-2009)
Offshore
(2008-2010)
Total Invertebrates
(density/abundance) mean no./m2
733 1824 459 1094 --
643 3512 2132 5375 3758
EPT Index (abundance) mean no./m2 84 120 139 32 -- 61 17 0 114 21
Genus analysis of
Ephemeroptera dominant
Ephemeridae:
Hexagenia
Ephemeridae:
Hexagenia
Ephemeridae:
Hexagenia
Ephemeridae:
Hexagenia --
Ephemeridae:
Hexagenia
Ephemeridae:
Hexagenia +
Caenis
-- Ephemeridae:
Hexagenia
Ephemeridae:
Hexagenia
EPT:Chironomidae ratio 0.70 0.73 1.30 0.50 -- 0.73 0.01 0.00 0.13 0.02
Taxonomic Richness family-level 4 5 3 3 -- 6 5 4 6 5
Simpson's Diversity (D) index 0.51 0.48 0.52 0.31 -- 0.67 0.73 0.41 0.61 0.65
Hill's Effective Richness (EH') family-level 3 3 3 2 -- 4 5 2 3 4
Nearshore
(2010) -- -- --
Nearshore
(2010) --
Nearshore
(2010) --
Nearshore
(2010) --
Total Invertebrates
(density/abundance)
mean
no./kicknet 323 -- -- --
100 --
110 --
180 --
EPT Index (abundance) mean
no./kicknet 4 -- -- --
6 --
4 --
4 --
Genus analysis of
Ephemeroptera dominant
Baetidae:
Procloeon -- -- --
Baetidae:
Procloeon --
Caenidae:
Caenis --
Heptageniidae:
Stenonema --
EPT:Chironomidae ratio 0.26 -- -- -- 8.73 -- 0.15 -- 2.89 --
Taxonomic Richness family-level 11 -- -- -- 12 -- 14 -- 13 --
Simpson's Diversity (D) index 0.38 -- -- -- 0.59 -- 0.69 -- 0.29 --
Hill's Effective Richness (EH') family-level 3 -- -- -- 4 -- 6 -- 3 --
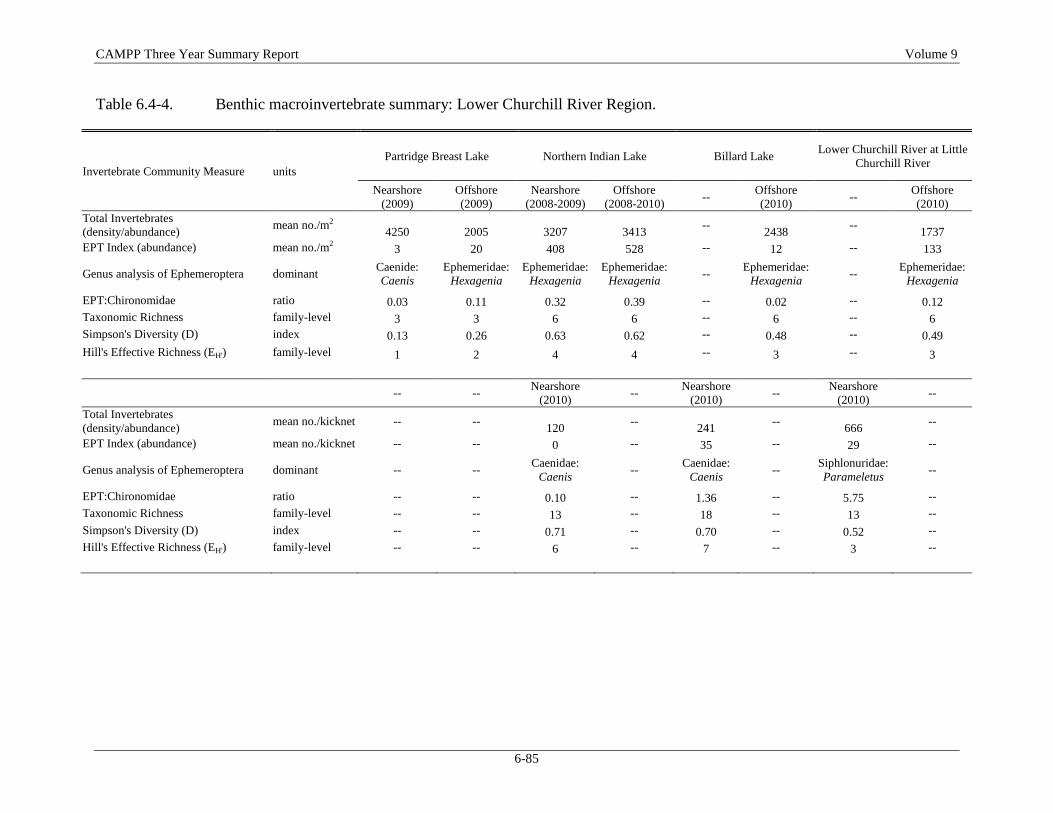
CAMPP Three Year Summary Report Volume 9
6-85
Table 6.4-4. Benthic macroinvertebrate summary: Lower Churchill River Region.
Invertebrate Community Measure units
Partridge Breast Lake Northern Indian Lake Billard Lake Lower Churchill River at Little
Churchill River
Nearshore
(2009)
Offshore
(2009)
Nearshore
(2008-2009)
Offshore
(2008-2010) --
Offshore
(2010) --
Offshore
(2010)
Total Invertebrates
(density/abundance) mean no./m2
4250 2005 3207 3413 --
2438 --
1737
EPT Index (abundance) mean no./m2 3 20 408 528 -- 12 -- 133
Genus analysis of Ephemeroptera dominant Caenide:
Caenis
Ephemeridae:
Hexagenia
Ephemeridae:
Hexagenia
Ephemeridae:
Hexagenia --
Ephemeridae:
Hexagenia --
Ephemeridae:
Hexagenia
EPT:Chironomidae ratio 0.03 0.11 0.32 0.39 -- 0.02 -- 0.12
Taxonomic Richness family-level 3 3 6 6 -- 6 -- 6
Simpson's Diversity (D) index 0.13 0.26 0.63 0.62 -- 0.48 -- 0.49
Hill's Effective Richness (EH') family-level 1 2 4 4 -- 3 -- 3
-- -- Nearshore
(2010) --
Nearshore
(2010) --
Nearshore
(2010) --
Total Invertebrates
(density/abundance) mean no./kicknet -- --
120 --
241 --
666 --
EPT Index (abundance) mean no./kicknet -- -- 0 -- 35 -- 29 --
Genus analysis of Ephemeroptera dominant -- -- Caenidae:
Caenis --
Caenidae:
Caenis --
Siphlonuridae:
Parameletus --
EPT:Chironomidae ratio -- -- 0.10 -- 1.36 -- 5.75 --
Taxonomic Richness family-level -- -- 13 -- 18 -- 13 --
Simpson's Diversity (D) index -- -- 0.71 -- 0.70 -- 0.52 --
Hill's Effective Richness (EH') family-level -- -- 6 -- 7 -- 3 --

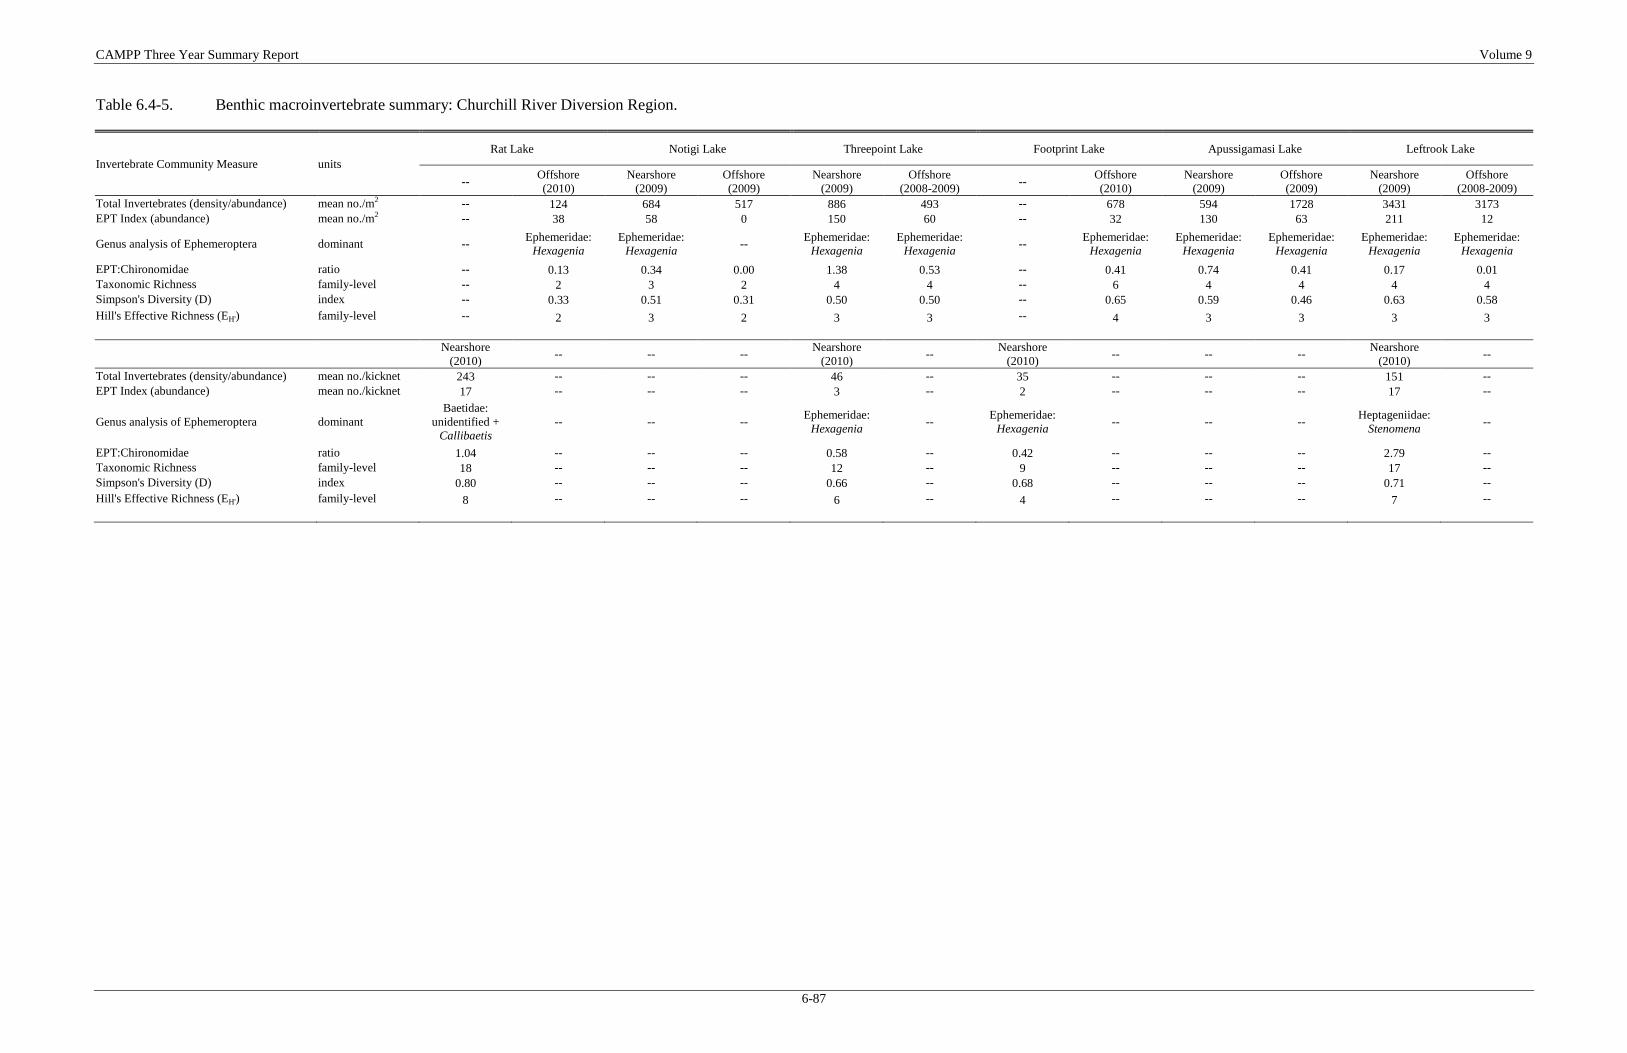
CAMPP Three Year Summary Report Volume 9
6-87
Table 6.4-5. Benthic macroinvertebrate summary: Churchill River Diversion Region.
Invertebrate Community Measure units
Rat Lake Notigi Lake Threepoint Lake Footprint Lake Apussigamasi Lake Leftrook Lake
-- Offshore
(2010)
Nearshore
(2009)
Offshore
(2009)
Nearshore
(2009)
Offshore
(2008-2009) --
Offshore
(2010)
Nearshore
(2009)
Offshore
(2009)
Nearshore
(2009)
Offshore
(2008-2009)
Total Invertebrates (density/abundance) mean no./m2 -- 124 684 517 886 493 -- 678 594 1728 3431 3173
EPT Index (abundance) mean no./m2 -- 38 58 0 150 60 -- 32 130 63 211 12
Genus analysis of Ephemeroptera dominant -- Ephemeridae:
Hexagenia
Ephemeridae:
Hexagenia --
Ephemeridae:
Hexagenia
Ephemeridae:
Hexagenia --
Ephemeridae:
Hexagenia
Ephemeridae:
Hexagenia
Ephemeridae:
Hexagenia
Ephemeridae:
Hexagenia
Ephemeridae:
Hexagenia
EPT:Chironomidae ratio -- 0.13 0.34 0.00 1.38 0.53 -- 0.41 0.74 0.41 0.17 0.01
Taxonomic Richness family-level -- 2 3 2 4 4 -- 6 4 4 4 4
Simpson's Diversity (D) index -- 0.33 0.51 0.31 0.50 0.50 -- 0.65 0.59 0.46 0.63 0.58
Hill's Effective Richness (EH') family-level -- 2 3 2 3 3 -- 4 3 3 3 3
Nearshore
(2010) -- -- --
Nearshore
(2010) --
Nearshore
(2010) -- -- --
Nearshore
(2010) --
Total Invertebrates (density/abundance) mean no./kicknet 243 -- -- -- 46 -- 35 -- -- -- 151 --
EPT Index (abundance) mean no./kicknet 17 -- -- -- 3 -- 2 -- -- -- 17 --
Genus analysis of Ephemeroptera dominant
Baetidae:
unidentified +
Callibaetis
-- -- -- Ephemeridae:
Hexagenia --
Ephemeridae:
Hexagenia -- -- --
Heptageniidae:
Stenomena --
EPT:Chironomidae ratio 1.04 -- -- -- 0.58 -- 0.42 -- -- -- 2.79 --
Taxonomic Richness family-level 18 -- -- -- 12 -- 9 -- -- -- 17 --
Simpson's Diversity (D) index 0.80 -- -- -- 0.66 -- 0.68 -- -- -- 0.71 --
Hill's Effective Richness (EH') family-level 8 -- -- -- 6 -- 4 -- -- -- 7 --
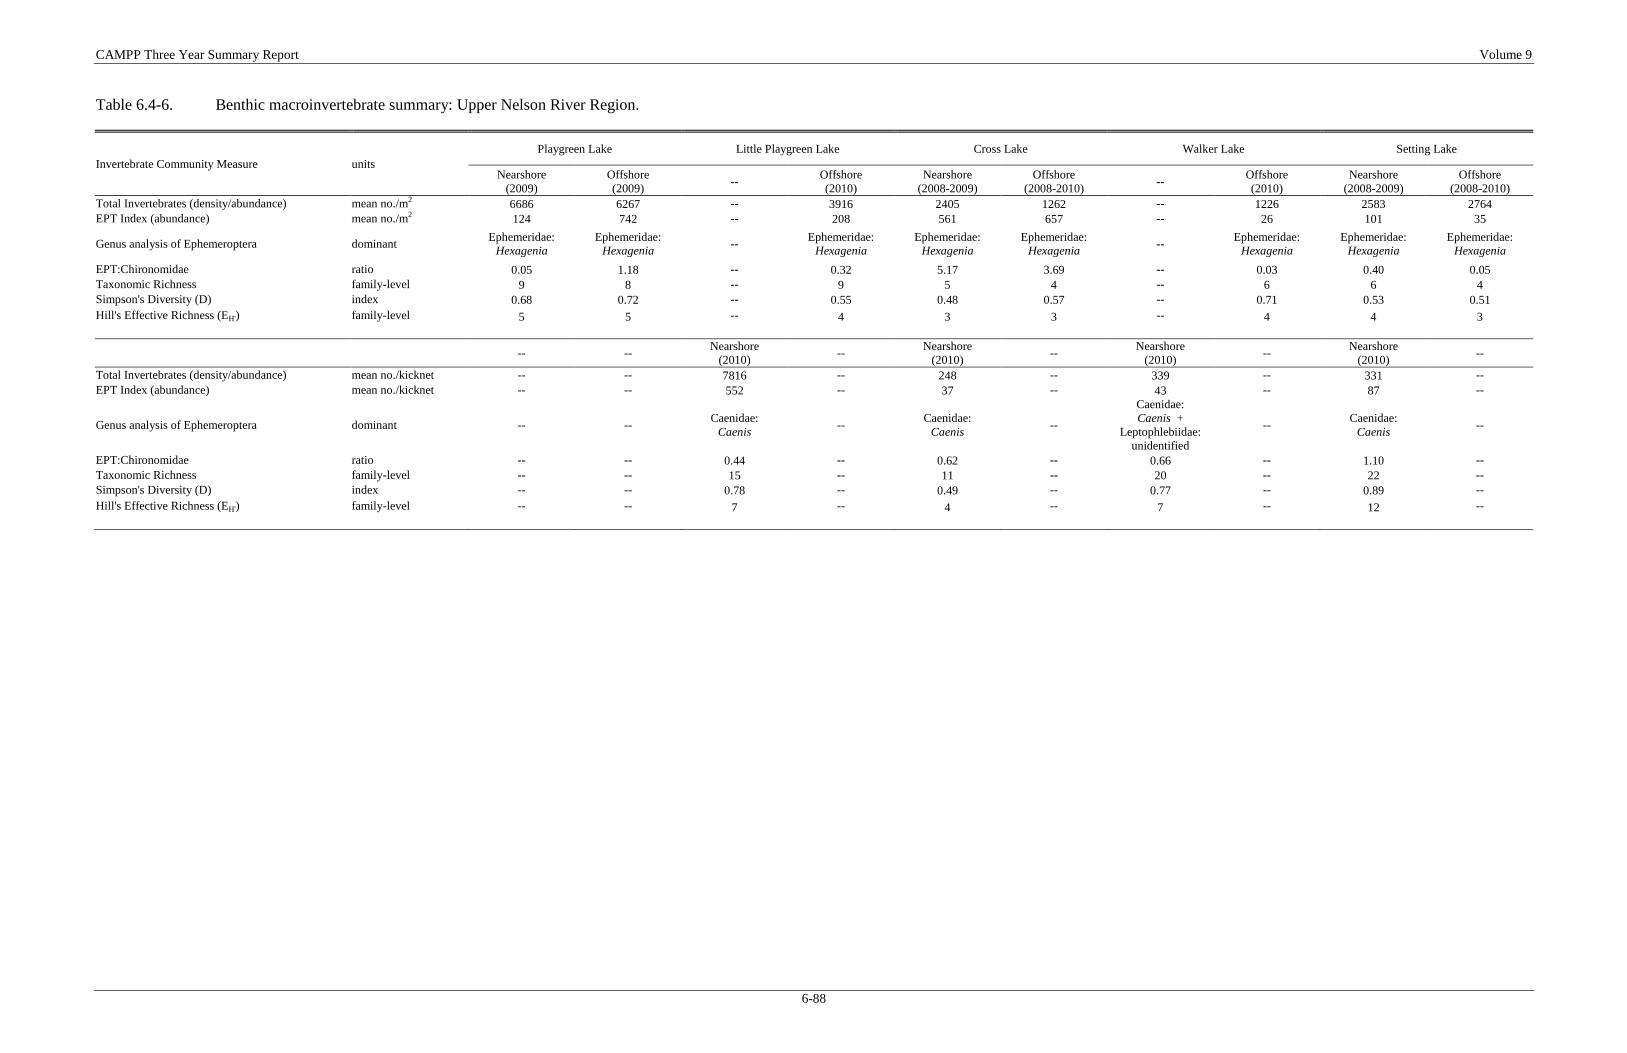
CAMPP Three Year Summary Report Volume 9
6-88
Table 6.4-6. Benthic macroinvertebrate summary: Upper Nelson River Region.
Invertebrate Community Measure units
Playgreen Lake Little Playgreen Lake Cross Lake Walker Lake Setting Lake
Nearshore
(2009)
Offshore
(2009) --
Offshore
(2010)
Nearshore
(2008-2009)
Offshore
(2008-2010) --
Offshore
(2010)
Nearshore
(2008-2009)
Offshore
(2008-2010)
Total Invertebrates (density/abundance) mean no./m2 6686 6267 -- 3916 2405 1262 -- 1226 2583 2764
EPT Index (abundance) mean no./m2 124 742 -- 208 561 657 -- 26 101 35
Genus analysis of Ephemeroptera dominant Ephemeridae:
Hexagenia
Ephemeridae:
Hexagenia --
Ephemeridae:
Hexagenia
Ephemeridae:
Hexagenia
Ephemeridae:
Hexagenia --
Ephemeridae:
Hexagenia
Ephemeridae:
Hexagenia
Ephemeridae:
Hexagenia
EPT:Chironomidae ratio 0.05 1.18 -- 0.32 5.17 3.69 -- 0.03 0.40 0.05
Taxonomic Richness family-level 9 8 -- 9 5 4 -- 6 6 4
Simpson's Diversity (D) index 0.68 0.72 -- 0.55 0.48 0.57 -- 0.71 0.53 0.51
Hill's Effective Richness (EH') family-level 5 5 -- 4 3 3 -- 4 4 3
-- -- Nearshore
(2010) --
Nearshore
(2010) --
Nearshore
(2010) --
Nearshore
(2010) --
Total Invertebrates (density/abundance) mean no./kicknet -- -- 7816 -- 248 -- 339 -- 331 --
EPT Index (abundance) mean no./kicknet -- -- 552 -- 37 -- 43 -- 87 --
Genus analysis of Ephemeroptera dominant -- -- Caenidae:
Caenis --
Caenidae:
Caenis --
Caenidae:
Caenis +
Leptophlebiidae:
unidentified
-- Caenidae:
Caenis --
EPT:Chironomidae ratio -- -- 0.44 -- 0.62 -- 0.66 -- 1.10 --
Taxonomic Richness family-level -- -- 15 -- 11 -- 20 -- 22 --
Simpson's Diversity (D) index -- -- 0.78 -- 0.49 -- 0.77 -- 0.89 --
Hill's Effective Richness (EH') family-level -- -- 7 -- 4 -- 7 -- 12 --
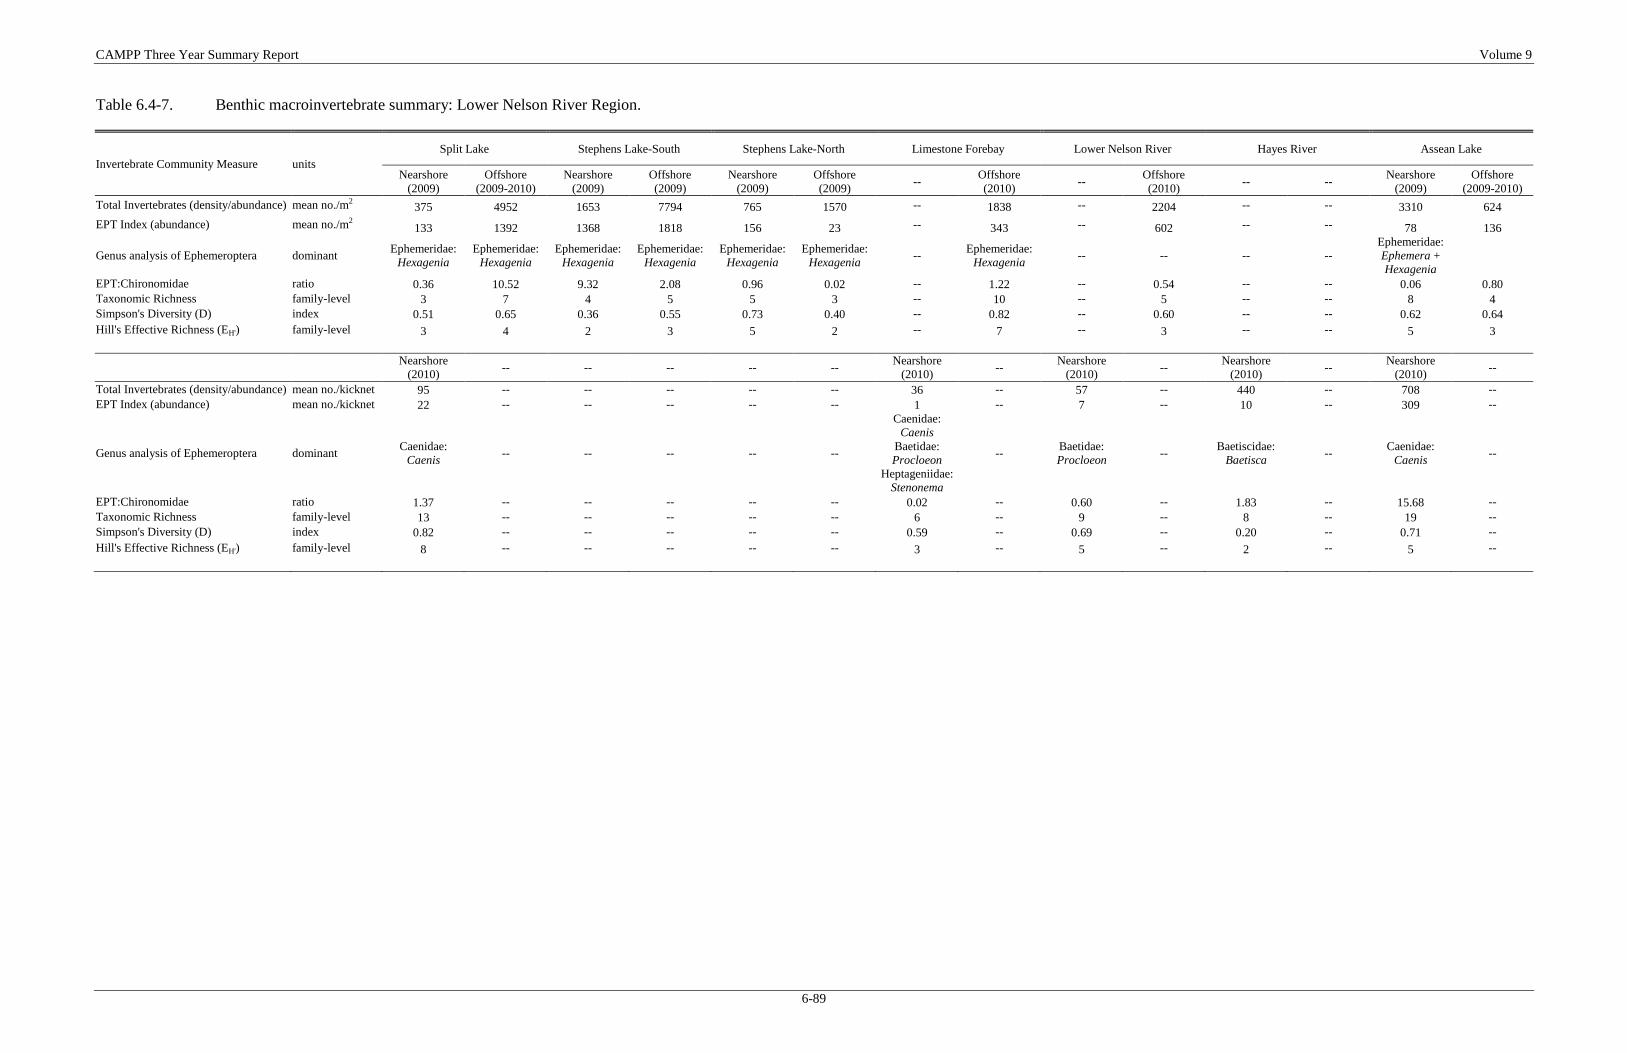
CAMPP Three Year Summary Report Volume 9
6-89
Table 6.4-7. Benthic macroinvertebrate summary: Lower Nelson River Region.
Invertebrate Community Measure units
Split Lake Stephens Lake-South Stephens Lake-North Limestone Forebay Lower Nelson River Hayes River Assean Lake
Nearshore
(2009)
Offshore
(2009-2010)
Nearshore
(2009)
Offshore
(2009)
Nearshore
(2009)
Offshore
(2009) --
Offshore
(2010) --
Offshore
(2010) -- --
Nearshore
(2009)
Offshore
(2009-2010)
Total Invertebrates (density/abundance) mean no./m2 375 4952 1653 7794 765 1570 -- 1838 -- 2204 -- -- 3310 624
EPT Index (abundance) mean no./m2 133 1392 1368 1818 156 23 -- 343 -- 602 -- -- 78 136
Genus analysis of Ephemeroptera dominant Ephemeridae:
Hexagenia
Ephemeridae:
Hexagenia
Ephemeridae:
Hexagenia
Ephemeridae:
Hexagenia
Ephemeridae:
Hexagenia
Ephemeridae:
Hexagenia --
Ephemeridae:
Hexagenia -- -- -- --
Ephemeridae:
Ephemera +
Hexagenia
EPT:Chironomidae ratio 0.36 10.52 9.32 2.08 0.96 0.02 -- 1.22 -- 0.54 -- -- 0.06 0.80
Taxonomic Richness family-level 3 7 4 5 5 3 -- 10 -- 5 -- -- 8 4
Simpson's Diversity (D) index 0.51 0.65 0.36 0.55 0.73 0.40 -- 0.82 -- 0.60 -- -- 0.62 0.64
Hill's Effective Richness (EH') family-level 3 4 2 3 5 2 -- 7 -- 3 -- -- 5 3
Nearshore
(2010) -- -- -- -- --
Nearshore
(2010) --
Nearshore
(2010) --
Nearshore
(2010) --
Nearshore
(2010) --
Total Invertebrates (density/abundance) mean no./kicknet 95 -- -- -- -- -- 36 -- 57 -- 440 -- 708 --
EPT Index (abundance) mean no./kicknet 22 -- -- -- -- -- 1 -- 7 -- 10 -- 309 --
Genus analysis of Ephemeroptera dominant Caenidae:
Caenis -- -- -- -- --
Caenidae:
Caenis
Baetidae:
Procloeon
Heptageniidae:
Stenonema
-- Baetidae:
Procloeon --
Baetiscidae:
Baetisca --
Caenidae:
Caenis --
EPT:Chironomidae ratio 1.37 -- -- -- -- -- 0.02 -- 0.60 -- 1.83 -- 15.68 --
Taxonomic Richness family-level 13 -- -- -- -- -- 6 -- 9 -- 8 -- 19 --
Simpson's Diversity (D) index 0.82 -- -- -- -- -- 0.59 -- 0.69 -- 0.20 -- 0.71 --
Hill's Effective Richness (EH') family-level 8 -- -- -- -- -- 3 -- 5 -- 2 -- 5 --

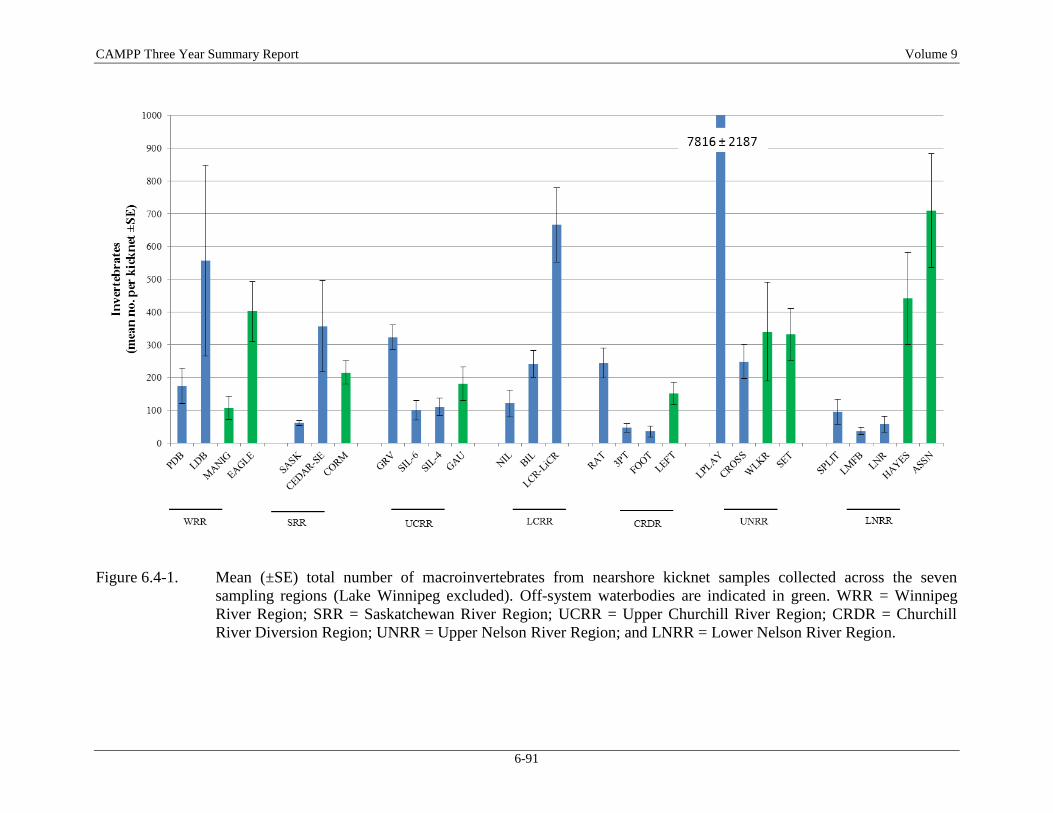
CAMPP Three Year Summary Report Volume 9
6-91
Figure 6.4-1. Mean (±SE) total number of macroinvertebrates from nearshore kicknet samples collected across the seven
sampling regions (Lake Winnipeg excluded). Off-system waterbodies are indicated in green. WRR = Winnipeg
River Region; SRR = Saskatchewan River Region; UCRR = Upper Churchill River Region; CRDR = Churchill
River Diversion Region; UNRR = Upper Nelson River Region; and LNRR = Lower Nelson River Region.
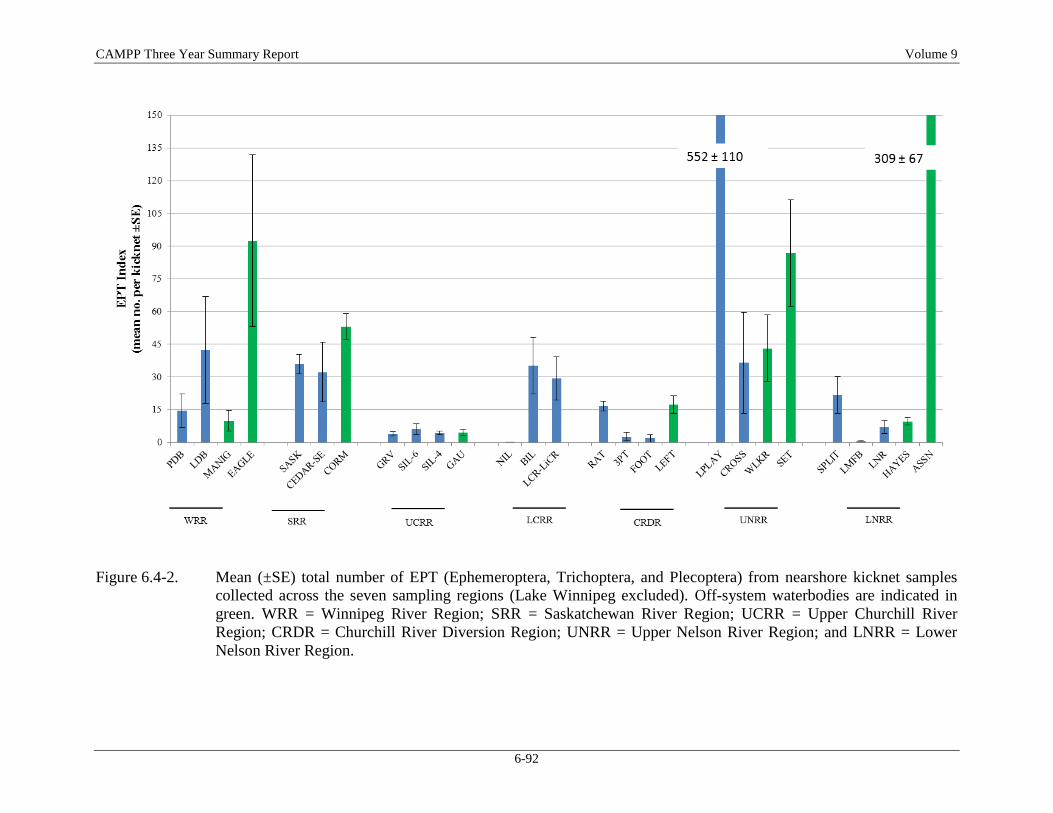
CAMPP Three Year Summary Report Volume 9
6-92
Figure 6.4-2. Mean (±SE) total number of EPT (Ephemeroptera, Trichoptera, and Plecoptera) from nearshore kicknet samples
collected across the seven sampling regions (Lake Winnipeg excluded). Off-system waterbodies are indicated in
green. WRR = Winnipeg River Region; SRR = Saskatchewan River Region; UCRR = Upper Churchill River
Region; CRDR = Churchill River Diversion Region; UNRR = Upper Nelson River Region; and LNRR = Lower
Nelson River Region.
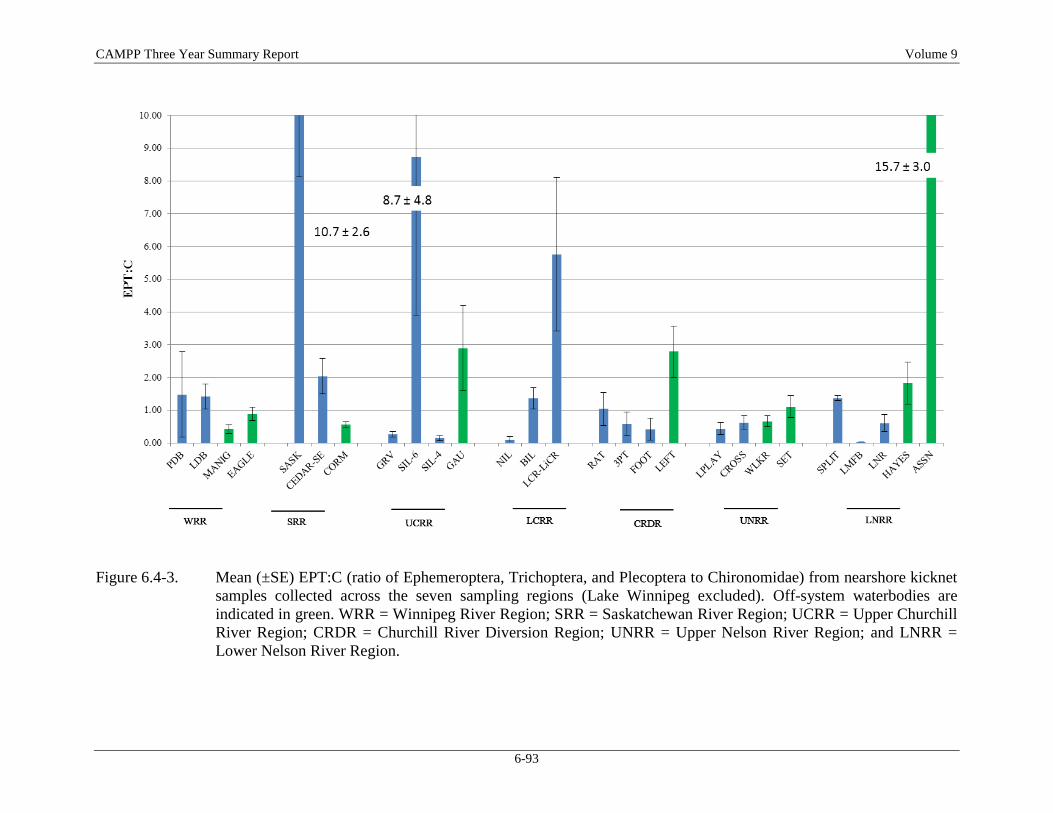
CAMPP Three Year Summary Report Volume 9
6-93
Figure 6.4-3. Mean (±SE) EPT:C (ratio of Ephemeroptera, Trichoptera, and Plecoptera to Chironomidae) from nearshore kicknet
samples collected across the seven sampling regions (Lake Winnipeg excluded). Off-system waterbodies are
indicated in green. WRR = Winnipeg River Region; SRR = Saskatchewan River Region; UCRR = Upper Churchill
River Region; CRDR = Churchill River Diversion Region; UNRR = Upper Nelson River Region; and LNRR =
Lower Nelson River Region.
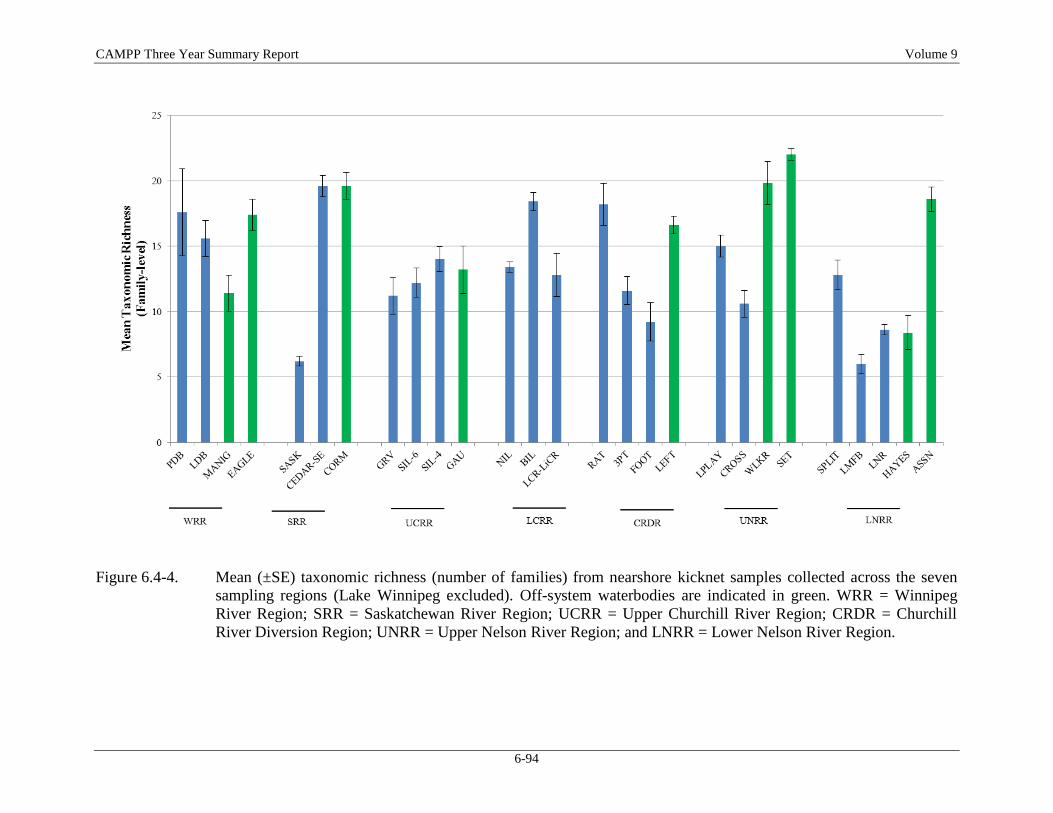
CAMPP Three Year Summary Report Volume 9
6-94
Figure 6.4-4. Mean (±SE) taxonomic richness (number of families) from nearshore kicknet samples collected across the seven
sampling regions (Lake Winnipeg excluded). Off-system waterbodies are indicated in green. WRR = Winnipeg
River Region; SRR = Saskatchewan River Region; UCRR = Upper Churchill River Region; CRDR = Churchill
River Diversion Region; UNRR = Upper Nelson River Region; and LNRR = Lower Nelson River Region.
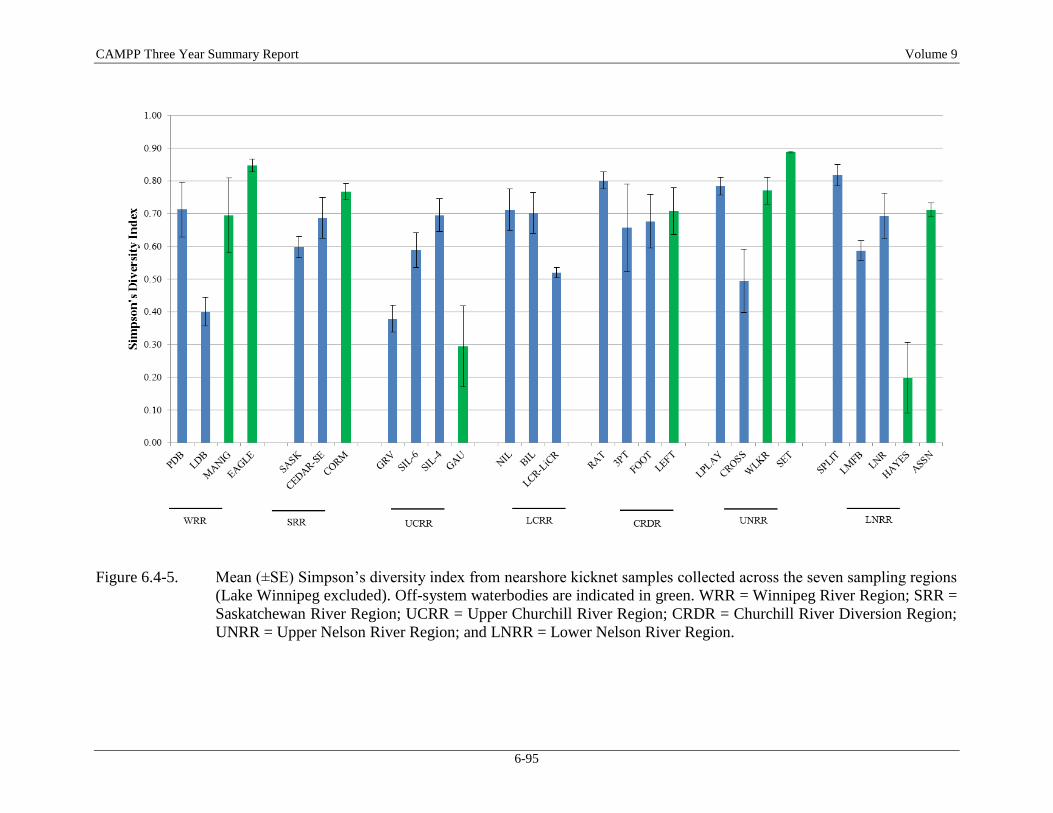
CAMPP Three Year Summary Report Volume 9
6-95
Figure 6.4-5. Mean (±SE) Simpson’s diversity index from nearshore kicknet samples collected across the seven sampling regions
(Lake Winnipeg excluded). Off-system waterbodies are indicated in green. WRR = Winnipeg River Region; SRR =
Saskatchewan River Region; UCRR = Upper Churchill River Region; CRDR = Churchill River Diversion Region;
UNRR = Upper Nelson River Region; and LNRR = Lower Nelson River Region.
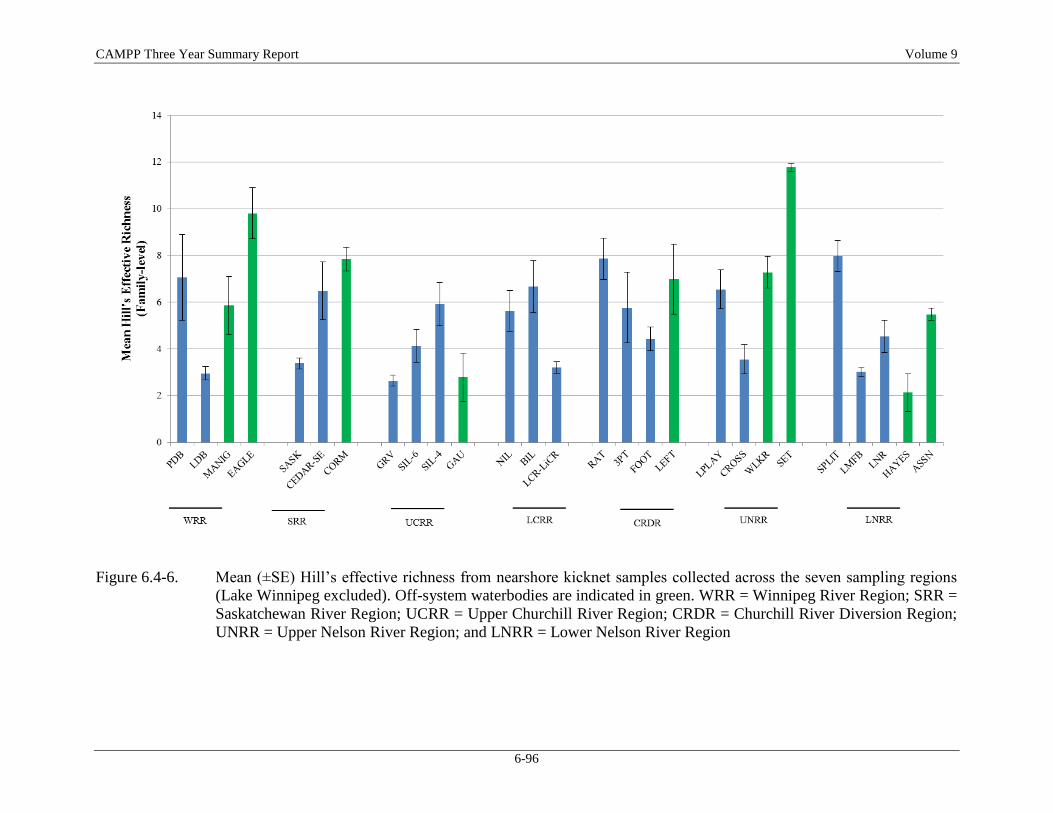
CAMPP Three Year Summary Report Volume 9
6-96
Figure 6.4-6. Mean (±SE) Hill’s effective richness from nearshore kicknet samples collected across the seven sampling regions
(Lake Winnipeg excluded). Off-system waterbodies are indicated in green. WRR = Winnipeg River Region; SRR =
Saskatchewan River Region; UCRR = Upper Churchill River Region; CRDR = Churchill River Diversion Region;
UNRR = Upper Nelson River Region; and LNRR = Lower Nelson River Region
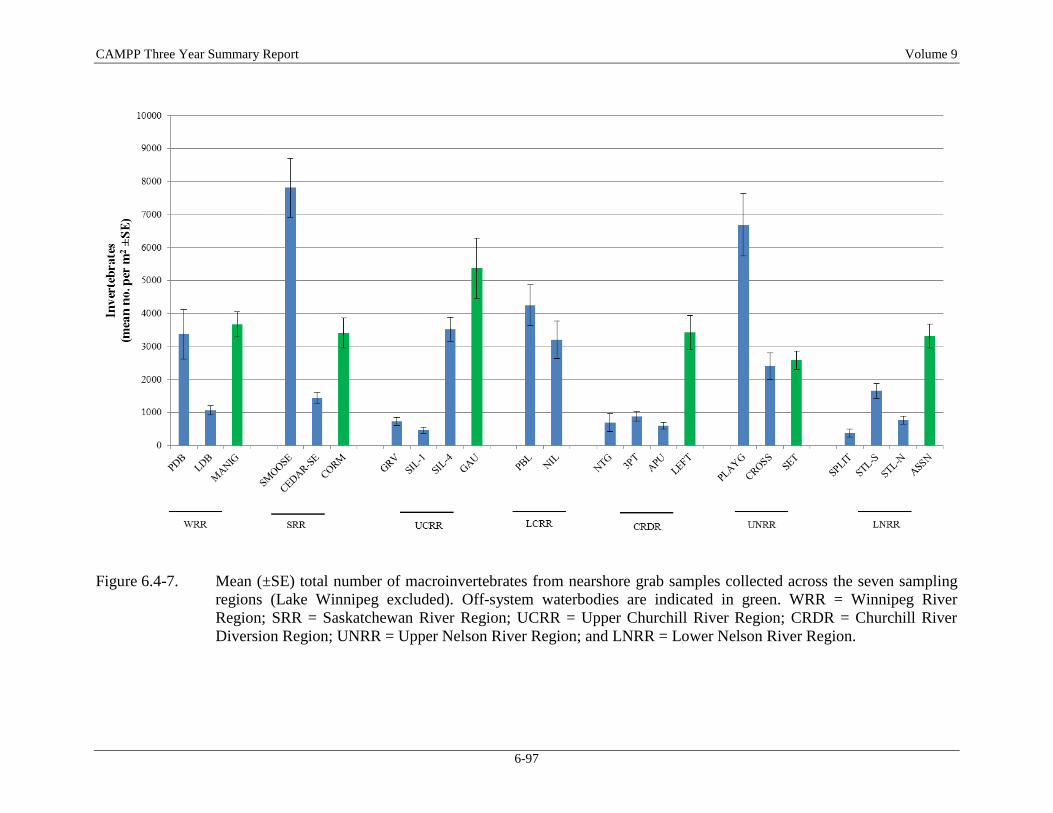
CAMPP Three Year Summary Report Volume 9
6-97
Figure 6.4-7. Mean (±SE) total number of macroinvertebrates from nearshore grab samples collected across the seven sampling
regions (Lake Winnipeg excluded). Off-system waterbodies are indicated in green. WRR = Winnipeg River
Region; SRR = Saskatchewan River Region; UCRR = Upper Churchill River Region; CRDR = Churchill River
Diversion Region; UNRR = Upper Nelson River Region; and LNRR = Lower Nelson River Region.
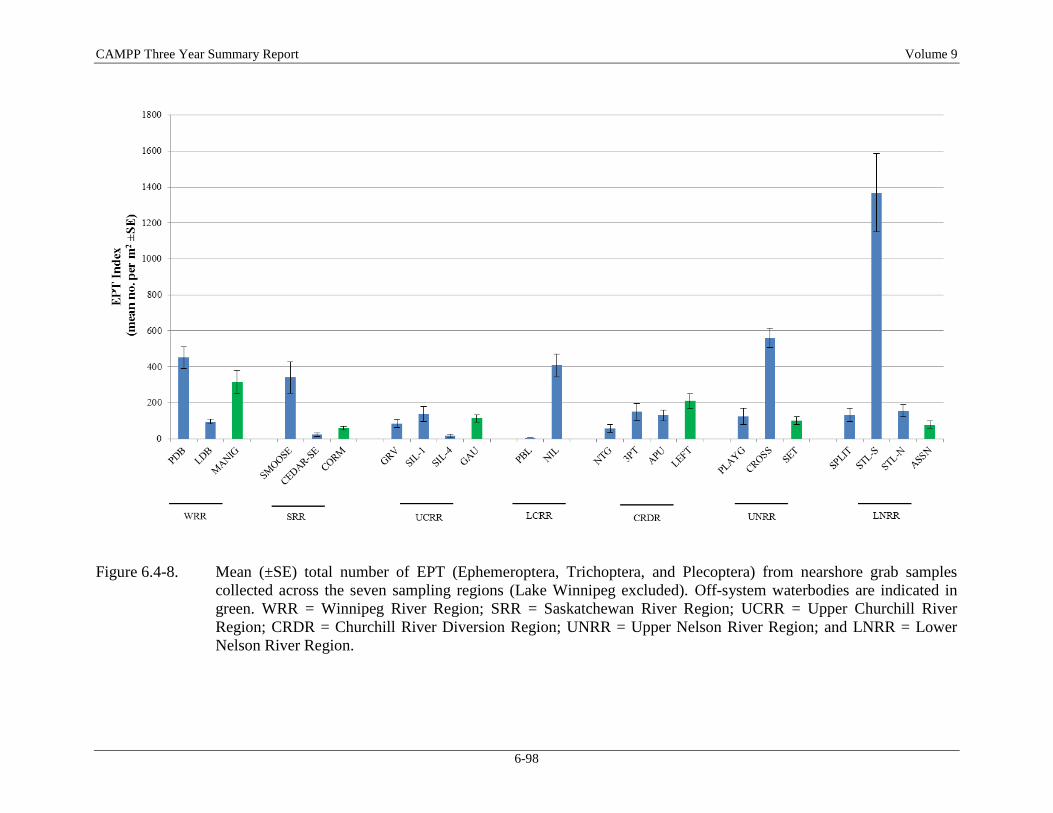
CAMPP Three Year Summary Report Volume 9
6-98
Figure 6.4-8. Mean (±SE) total number of EPT (Ephemeroptera, Trichoptera, and Plecoptera) from nearshore grab samples
collected across the seven sampling regions (Lake Winnipeg excluded). Off-system waterbodies are indicated in
green. WRR = Winnipeg River Region; SRR = Saskatchewan River Region; UCRR = Upper Churchill River
Region; CRDR = Churchill River Diversion Region; UNRR = Upper Nelson River Region; and LNRR = Lower
Nelson River Region.
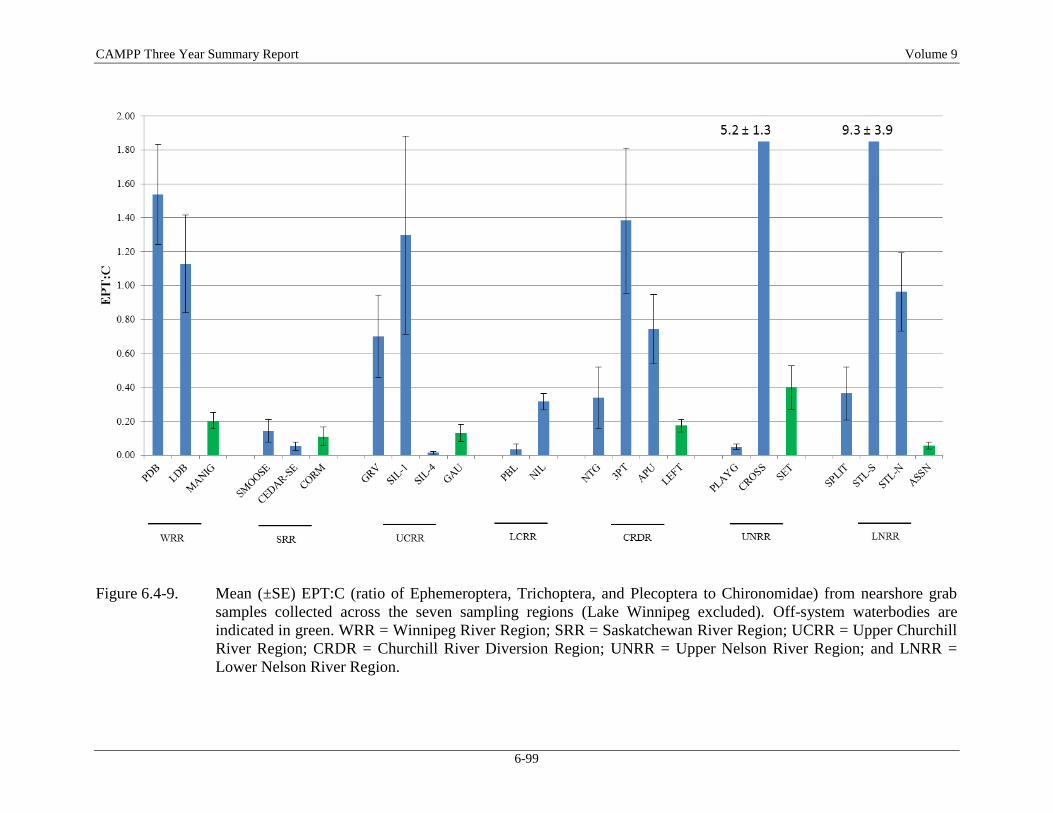
CAMPP Three Year Summary Report Volume 9
6-99
Figure 6.4-9. Mean (±SE) EPT:C (ratio of Ephemeroptera, Trichoptera, and Plecoptera to Chironomidae) from nearshore grab
samples collected across the seven sampling regions (Lake Winnipeg excluded). Off-system waterbodies are
indicated in green. WRR = Winnipeg River Region; SRR = Saskatchewan River Region; UCRR = Upper Churchill
River Region; CRDR = Churchill River Diversion Region; UNRR = Upper Nelson River Region; and LNRR =
Lower Nelson River Region.
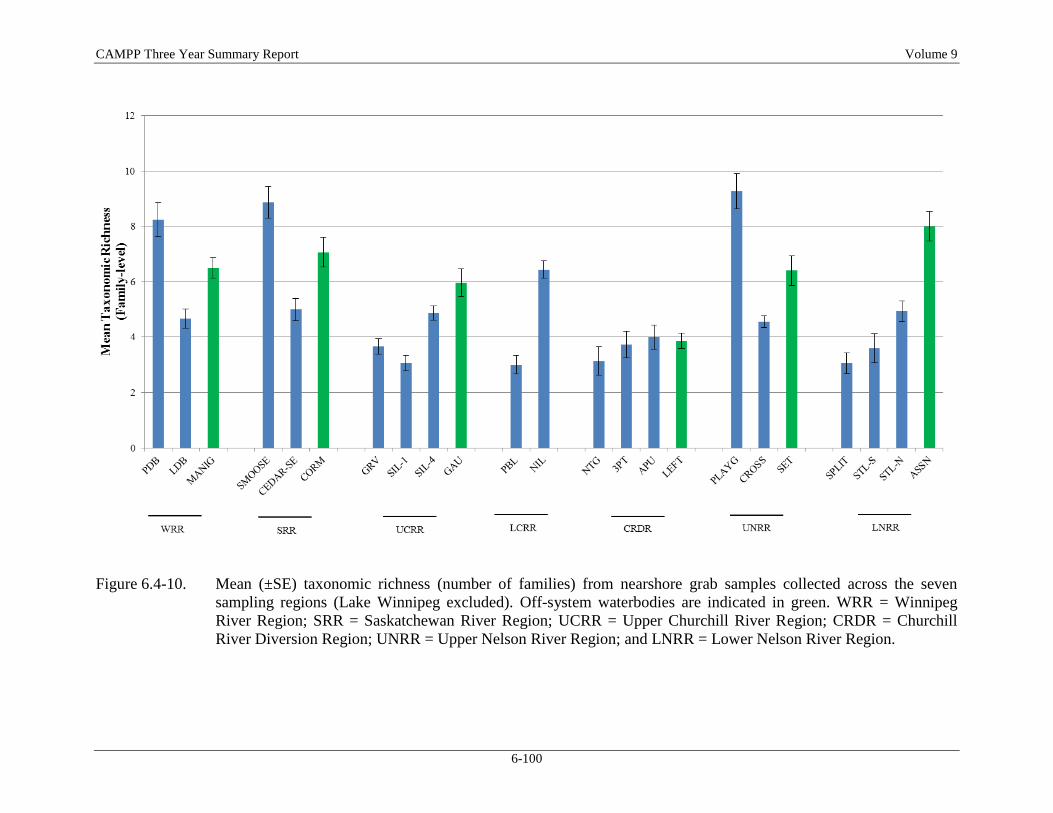
CAMPP Three Year Summary Report Volume 9
6-100
Figure 6.4-10. Mean (±SE) taxonomic richness (number of families) from nearshore grab samples collected across the seven
sampling regions (Lake Winnipeg excluded). Off-system waterbodies are indicated in green. WRR = Winnipeg
River Region; SRR = Saskatchewan River Region; UCRR = Upper Churchill River Region; CRDR = Churchill
River Diversion Region; UNRR = Upper Nelson River Region; and LNRR = Lower Nelson River Region.
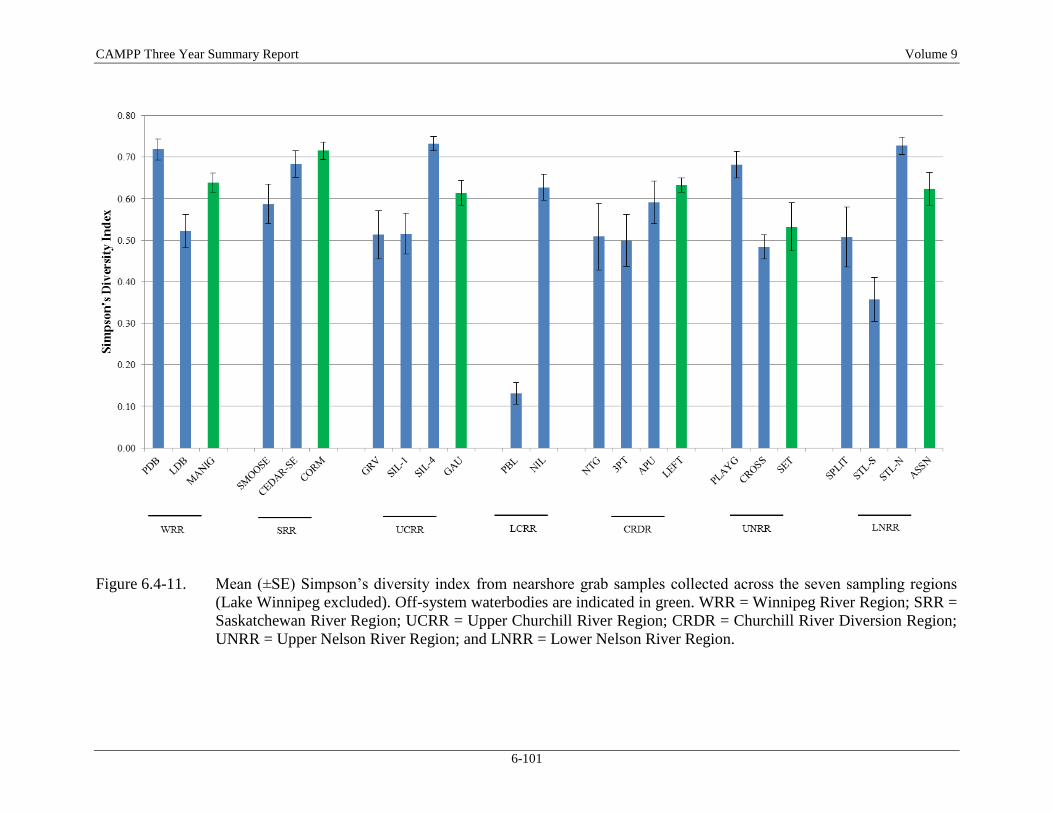
CAMPP Three Year Summary Report Volume 9
6-101
Figure 6.4-11. Mean (±SE) Simpson’s diversity index from nearshore grab samples collected across the seven sampling regions
(Lake Winnipeg excluded). Off-system waterbodies are indicated in green. WRR = Winnipeg River Region; SRR =
Saskatchewan River Region; UCRR = Upper Churchill River Region; CRDR = Churchill River Diversion Region;
UNRR = Upper Nelson River Region; and LNRR = Lower Nelson River Region.
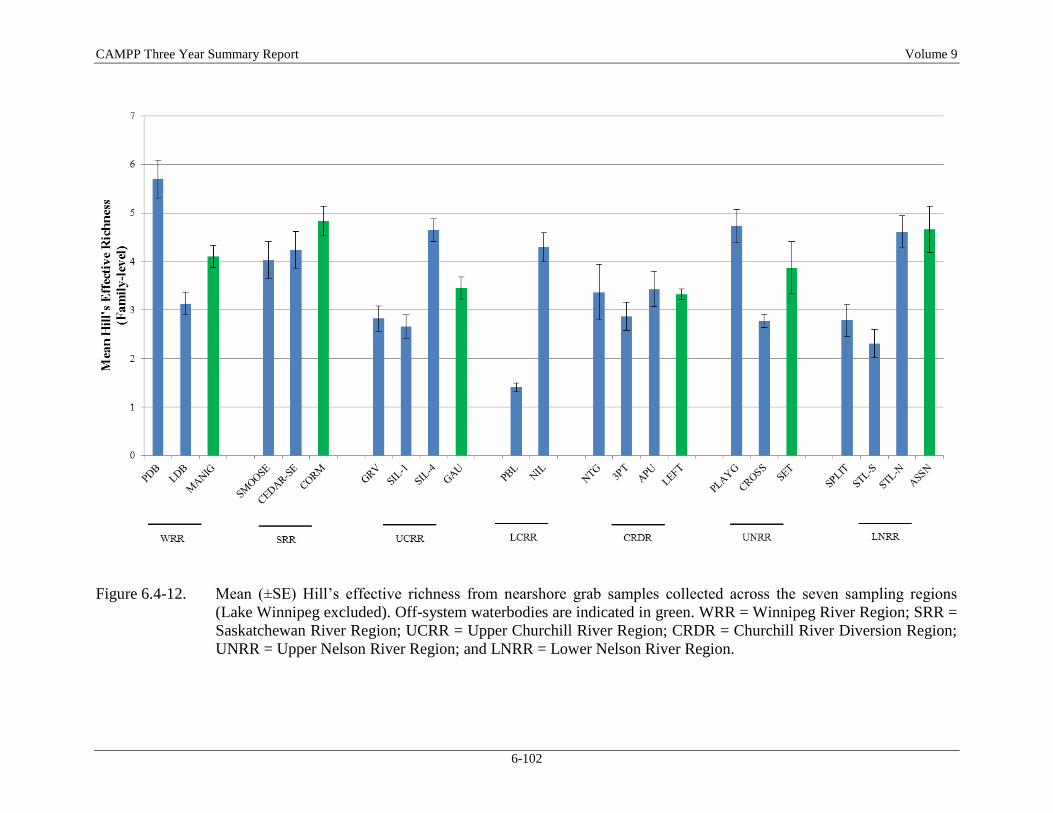
CAMPP Three Year Summary Report Volume 9
6-102
Figure 6.4-12. Mean (±SE) Hill’s effective richness from nearshore grab samples collected across the seven sampling regions
(Lake Winnipeg excluded). Off-system waterbodies are indicated in green. WRR = Winnipeg River Region; SRR =
Saskatchewan River Region; UCRR = Upper Churchill River Region; CRDR = Churchill River Diversion Region;
UNRR = Upper Nelson River Region; and LNRR = Lower Nelson River Region.
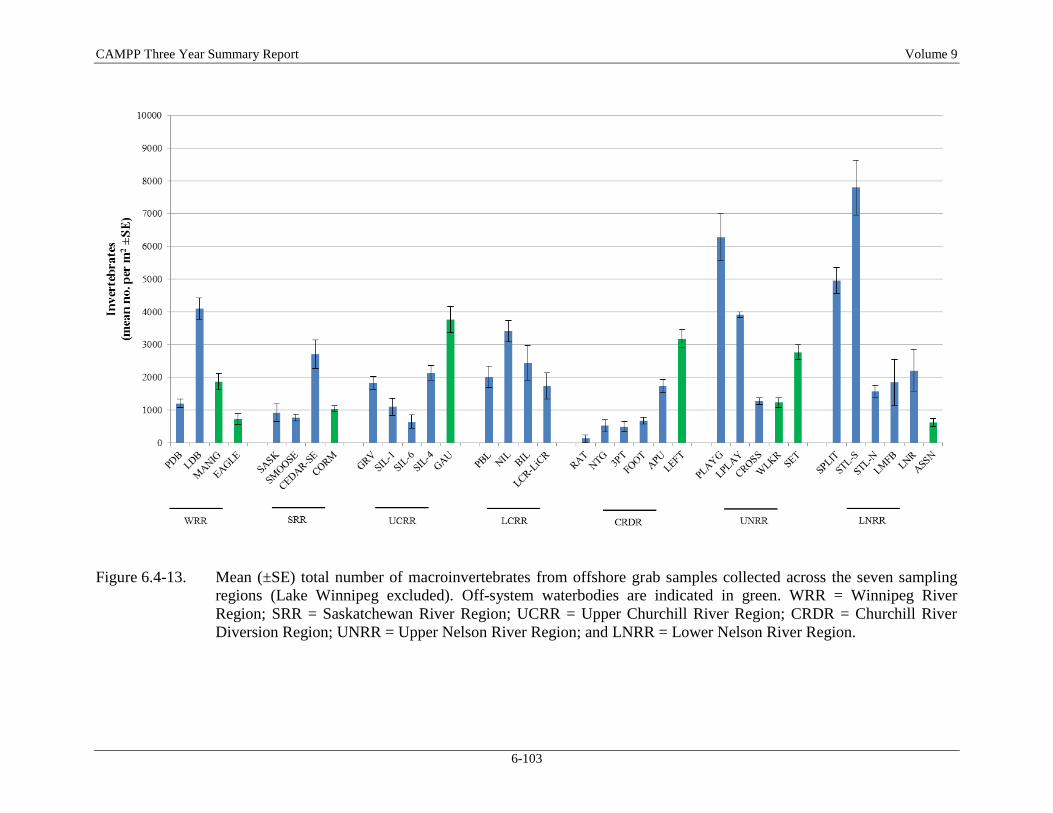
CAMPP Three Year Summary Report Volume 9
6-103
Figure 6.4-13. Mean (±SE) total number of macroinvertebrates from offshore grab samples collected across the seven sampling
regions (Lake Winnipeg excluded). Off-system waterbodies are indicated in green. WRR = Winnipeg River
Region; SRR = Saskatchewan River Region; UCRR = Upper Churchill River Region; CRDR = Churchill River
Diversion Region; UNRR = Upper Nelson River Region; and LNRR = Lower Nelson River Region.
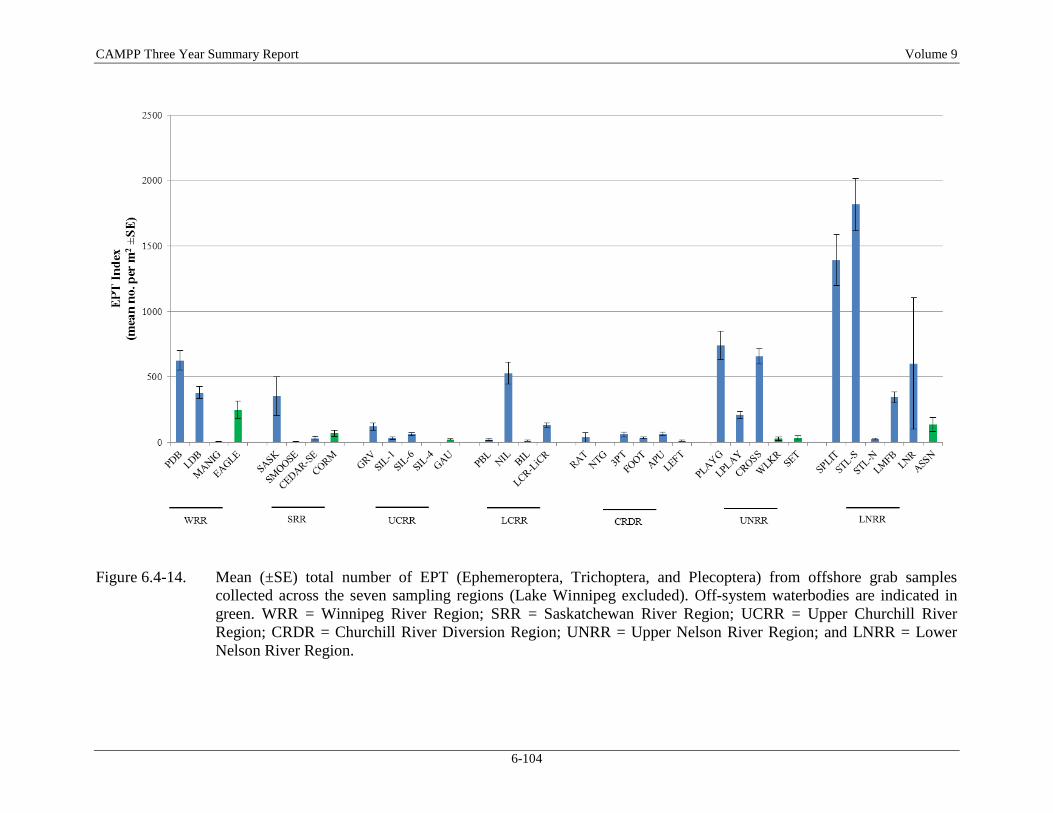
CAMPP Three Year Summary Report Volume 9
6-104
Figure 6.4-14. Mean (±SE) total number of EPT (Ephemeroptera, Trichoptera, and Plecoptera) from offshore grab samples
collected across the seven sampling regions (Lake Winnipeg excluded). Off-system waterbodies are indicated in
green. WRR = Winnipeg River Region; SRR = Saskatchewan River Region; UCRR = Upper Churchill River
Region; CRDR = Churchill River Diversion Region; UNRR = Upper Nelson River Region; and LNRR = Lower
Nelson River Region.
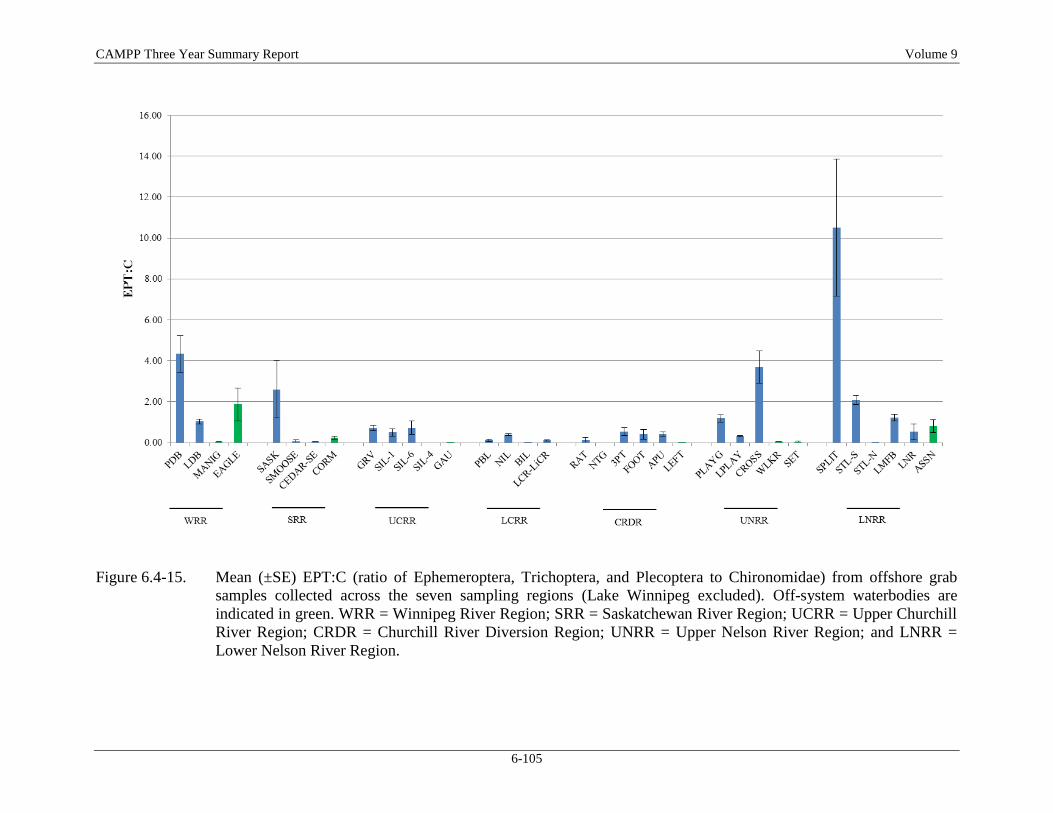
CAMPP Three Year Summary Report Volume 9
6-105
Figure 6.4-15. Mean (±SE) EPT:C (ratio of Ephemeroptera, Trichoptera, and Plecoptera to Chironomidae) from offshore grab
samples collected across the seven sampling regions (Lake Winnipeg excluded). Off-system waterbodies are
indicated in green. WRR = Winnipeg River Region; SRR = Saskatchewan River Region; UCRR = Upper Churchill
River Region; CRDR = Churchill River Diversion Region; UNRR = Upper Nelson River Region; and LNRR =
Lower Nelson River Region.
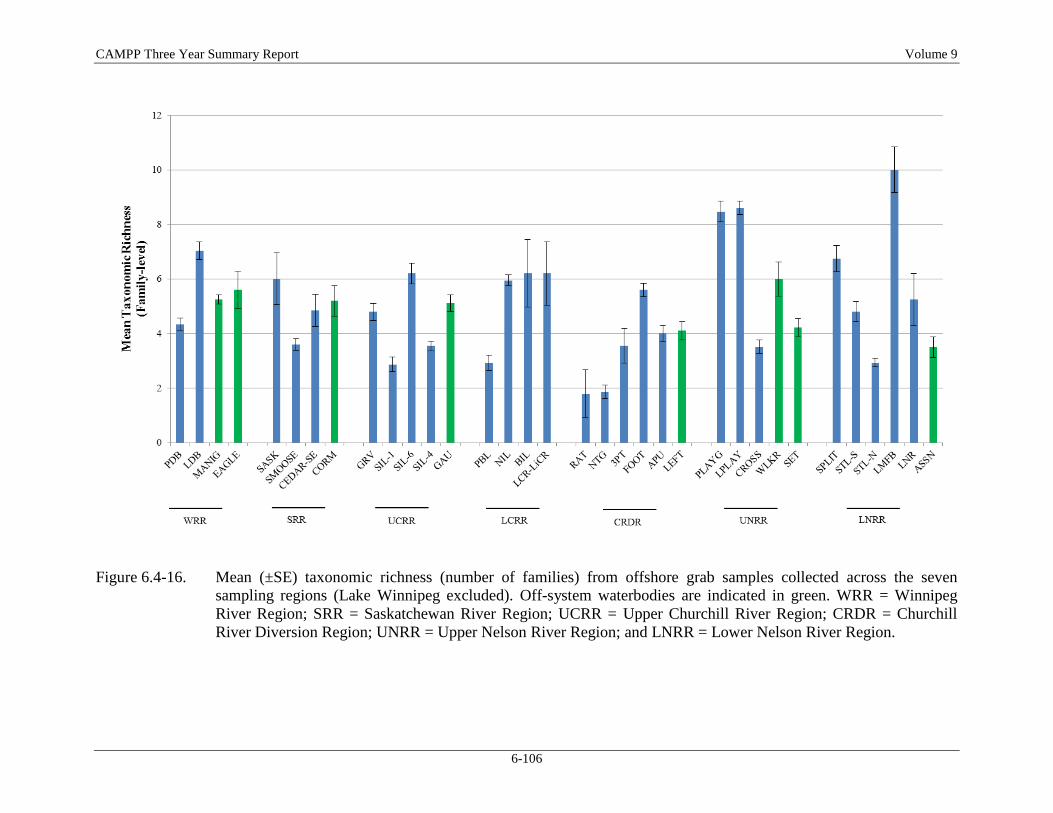
CAMPP Three Year Summary Report Volume 9
6-106
Figure 6.4-16. Mean (±SE) taxonomic richness (number of families) from offshore grab samples collected across the seven
sampling regions (Lake Winnipeg excluded). Off-system waterbodies are indicated in green. WRR = Winnipeg
River Region; SRR = Saskatchewan River Region; UCRR = Upper Churchill River Region; CRDR = Churchill
River Diversion Region; UNRR = Upper Nelson River Region; and LNRR = Lower Nelson River Region.
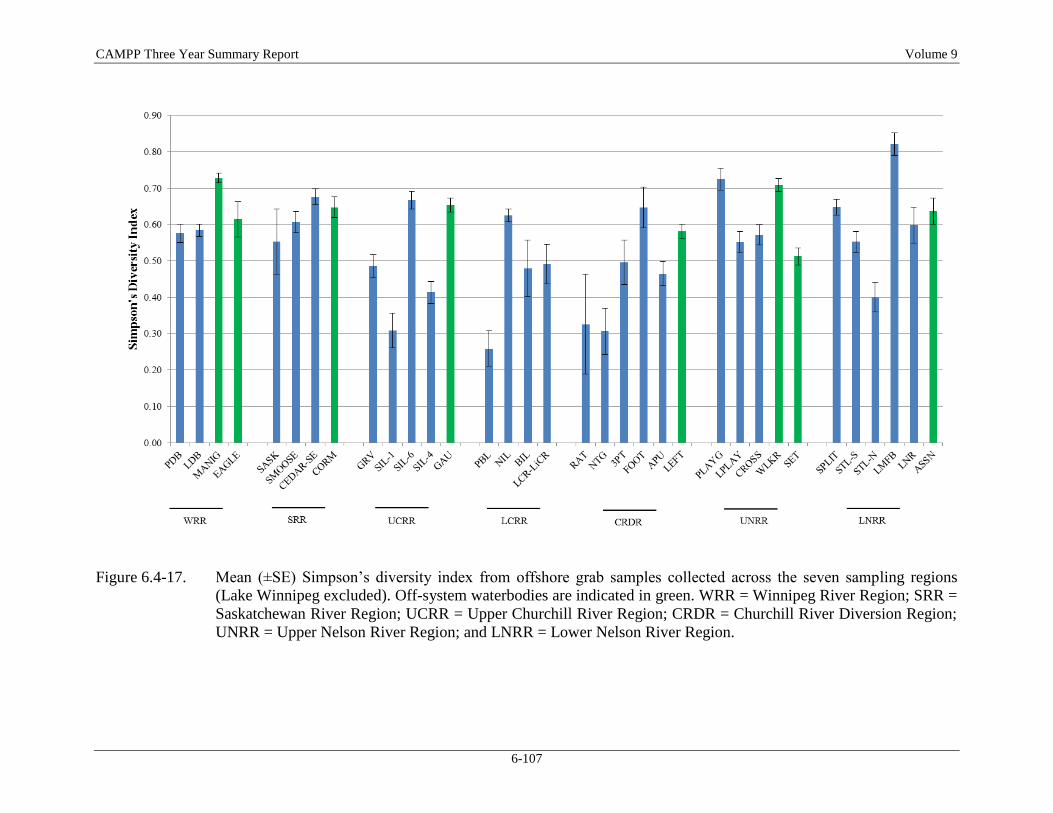
CAMPP Three Year Summary Report Volume 9
6-107
Figure 6.4-17. Mean (±SE) Simpson’s diversity index from offshore grab samples collected across the seven sampling regions
(Lake Winnipeg excluded). Off-system waterbodies are indicated in green. WRR = Winnipeg River Region; SRR =
Saskatchewan River Region; UCRR = Upper Churchill River Region; CRDR = Churchill River Diversion Region;
UNRR = Upper Nelson River Region; and LNRR = Lower Nelson River Region.
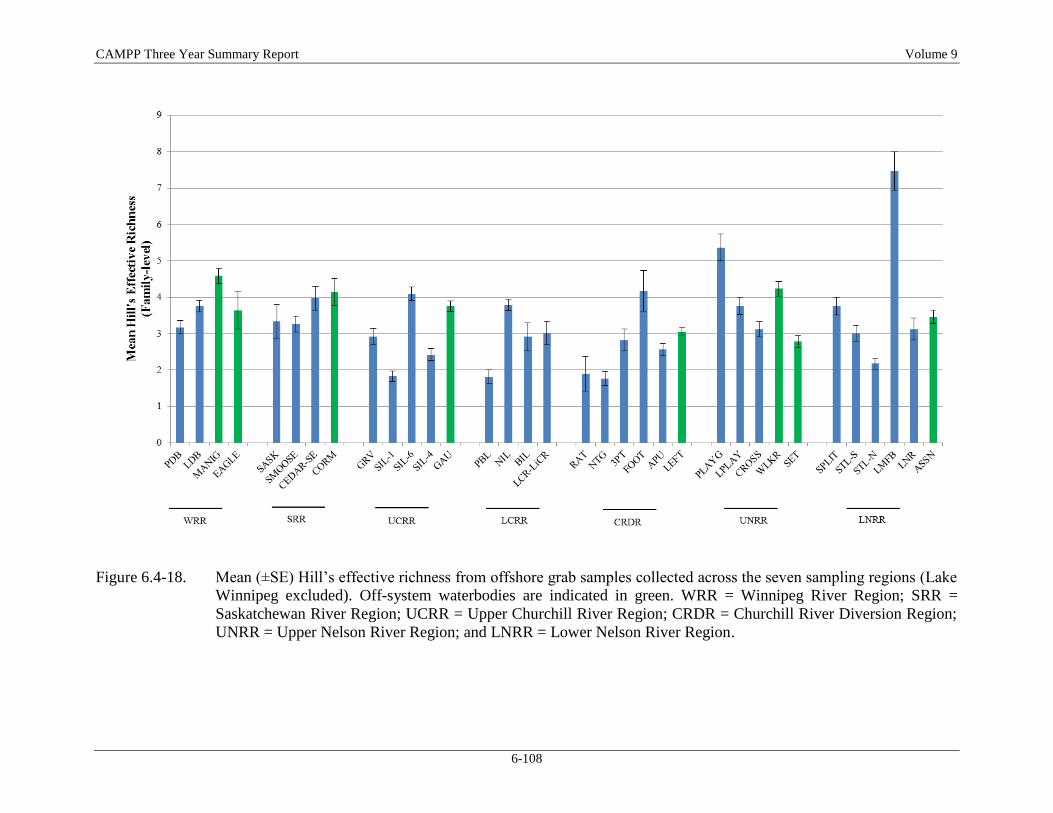
CAMPP Three Year Summary Report Volume 9
6-108
Figure 6.4-18. Mean (±SE) Hill’s effective richness from offshore grab samples collected across the seven sampling regions (Lake
Winnipeg excluded). Off-system waterbodies are indicated in green. WRR = Winnipeg River Region; SRR =
Saskatchewan River Region; UCRR = Upper Churchill River Region; CRDR = Churchill River Diversion Region;
UNRR = Upper Nelson River Region; and LNRR = Lower Nelson River Region.
CAMPP Three Year Summary Report Volume 9
6-109
6.5 FISH COMMUNITIES
The following discussion provides an overview of key fish community results based on selected
fish community metrics (parameters) for the CAMPP waterbodies sampled in Years 1-3 of the
pilot program. This overview is intended to provide a broad description of key results across the
study regions (excluding the Lake Winnipeg Region). This analysis was also undertaken to
assess the overall design of the CAMPP fish community monitoring program and facilitate
discussion of potential modifications to the program in the future. As such, the summary
provided in this section is not intended to be comprehensive and the reader is referred to
information presented in Section 5 of this report for a detailed description of results of the
CAMPP fish community program. It should also be noted that the total number of species
presented in this data set in no way suggests that this represents the extent of species present in
any CAMPP waterbody. These numbers are merely the total number of species captured by the
specific methods outlined for the program (standard and small mesh index nets). However,
because similar methodology and effort was utilized to obtain these results within each
waterbody it was considered reasonable to compare the total number of species captured.
6.5.1 Species Composition
For the overview section species composition was examined by looking at the total number of
species captured in each waterbody (Figure 6.5-1) and the relative abundance of the four species
of interest selected for the program, Northern Pike (Esox lucius), Lake Whitefish (Coregonus
clupeaformis), Sauger (Sander canadensis) and Walleye (Sander vitreus) (Figure 6.5-2).
In terms of the total number of species captured in on-system waterbodies within the CAMPP
regions, the Winnipeg River Region had the most species (Pointe du Bois n=21) while the fewest
number of species were captured in the Lower Churchill River Region (Billard Lake n = 9). Most
regions tended to have 10 to 15 species present within each of the waterbodies that were sampled
within the region; however, several had 18 or more species (e.g., Playgreen and Cross lakes in
the Upper Nelson River Region, Split Lake and the lower Nelson River downstream of
Limestone GS in the Lower Nelson River Region). The off-system waterbodies for each region
tended to have a similar total number of species present with the notable exception of
Manigotagan Lake in the Winnipeg River Region which only had nine species while the on-
system waterbodies within the region had 19 to 21species and the other off-system waterbody,
Eaglenest Lake, had 18 species. It should be noted that some waterbodies were sampled on an
annual basis (3 years of data) while others were only sampled for one or two years which would
affect the total number of species captured as it would be more likely to increase over time as
more sampling is conducted.
CAMPP Three Year Summary Report Volume 9
6-110
The proportion of Northern Pike in the total catch of a given region ranged from a low of
approximately 6% in the Winnipeg River Region to a high of approximately 25% of the total
catch from the Lower Nelson River Region (Figure 6.5-2). Relative abundance of Northern Pike
within most other regions ranged from 8 to 20% of the catch. Waterbodies where Northern Pike
relative abundances exceeded 25% included Partridge Breast Lake in the Lower Churchill River
Region (28.8%), Cross Lake in the Upper Nelson River Region (25.9%), Stephens Lake-North
(38.9%) and the Limestone Forebay (29.1%) both in the Lower Nelson River Region.
Lake Whitefish were present in all the CAMPP regions but overall relative abundance differed
among regions, with the Lower Churchill River Region having approximately 25% of the
standard index gill net catch made up of Lake Whitefish (nearly 50% for Billard Lake) (Figure
6.5-2). The Upper Churchill River Region had around 15% of the catch made up by Lake
Whitefish. In the Upper Nelson River Region Lake Whitefish made up less than 2% of the catch
for Playgreen Lake and less than 1% for the remaining waterbodies in the region. Lake Whitefish
were found to account for less than 10% of the catch for all other regions.
Relative abundance of Sauger was highest in the Winnipeg River Region where it accounted for
nearly 20% of the catch for on-system waterbodies (Figure 6.5-2). The lowest abundance was
found for the Lower Churchill River Region where no Sauger were reported. The remaining
regions had relative abundances for Sauger ranging from less than 5% to approximately 14% of
the catch.
Walleye were abundant throughout all of the CAMPP regions usually being the most abundant of
the four species of interest (Figure 6.5-2). The Lower Nelson River, Saskatchewan River, Lower
Churchill River, and Upper Churchill River regions had the highest Walleye abundances with
regional on-system waterbody averages above 25%. The highest Walleye relative abundance was
recorded in Stephens Lake-South (54%) followed by the Saskatchewan River (51%), and
Stephens Lake-North (49%). The lowest recorded relative abundance was for Southern Indian
Lake where Walleye relative abundance for all three areas (1, 4, and 6) was under 4% of the total
catch. The Winnipeg River and Upper Nelson River regions had similar regional Walleye
relative abundances (16 – 17%); however, Cross Lake in the Upper Nelson River Region had a
comparatively high Walleye abundance (31.4%).
6.5.2 Catch Per Unit Effort
Mean total catch per unit effort using standard gang index gillnets was examined for all fish
species as well as for the four species of interest. Playgreen and Little Playgreen lakes, two on-
system waterbodies in the Upper Nelson River Region, were found to have the highest CPUEs
for all on-system waterbodies (approximately 70 and 80 fish/100 m/24 hr, respectively) (Figure
CAMPP Three Year Summary Report Volume 9
6-111
6.5-3). The mean total CPUE for on-system waterbodies the Upper Nelson River Region was
higher than that of the Lower Churchill River Region (62.8 and 53.9 fish, respectively). The
Upper Churchill River Region had a total CPUE of 41.9 fish due to low values for Southern
Indian Lake areas 1 and 6. The Lower Nelson River Region had the lowest total CPUE for on-
system waterbodies at 24 fish while the remaining four regions ranged from approximately 34 to
45 fish. The most consistent CPUE values among waterbodies within a single region were found
for the Winnipeg River Region where the two on-system waterbodies and Eaglenest Lake, an
off-system Winnipeg River mainstem waterbody, ranged from 33.3 to 34.2 fish. Within a given
region, the highest CPUE was typically found within an off-system waterbody, although some
off-system waterbodies had the lowest total CPUE within a given region (i.e., Eaglenest Lake in
the Winnipeg River Region and Hayes River within the Lower Nelson River and Lower
Churchill River regions; Figure 6.5-3).
For Northern Pike the mean total CPUE values for on-system waterbodies within all regions
ranged from 2.0 fish (Winnipeg River Region) to 10.8 fish (Upper Nelson River Region) (Figure
6.5-4). The Upper Nelson River Region had high CPUE values for all three on-system
waterbodies (Playgreen Lake [8.9 fish], Little Playgreen Lake [13.6 fish], and Cross Lake [9.8
fish]). Partridge Breast Lake had the highest overall CPUE for Northern Pike for all waterbodies
at 16.7 fish.
The Lower Churchill River Region had the highest mean total CPUE for Lake Whitefish
captured within on-system waterbodies (13.5 fish) followed by the Upper Churchill River
Region (8.4 fish) (Figure 6.5-5). A major contributor to the high CPUE value for the Lower
Churchill River Region was the CPUE for Lake Whitefish from Billard Lake which had the
highest of all CAMPP waterbodies at approximately 26 fish. The remaining five regions had
extremely low CPUE values ranging from 0.2 to 1.1 fish.
Sauger were completely absent from the Lower Churchill River Region and from half of the
waterbodies examined in the Lower Nelson River Region (Figure 6.5-6). Sauger had low CPUE
values for most on-system CAMPP waterbodies. Some notable exceptions were South Indian
Lake – Area 6 (12.8 fish), Lac Du Bonnet (8.9 fish) and Apussigamasi Lake (7.6 fish).
The Lower Churchill River Region had the highest mean total CPUE for Walleye captured
within on-system waterbodies (14.4 fish) followed closely by the Upper Nelson River Region
(11.0 fish) and the Saskatchewan River Region (11.5) (Figure 6.5-7). The Churchill River
Diversion and Lower Nelson River regions had very similar Walleye CPUE values ranging from
8.5 to 8.9 fish. The Upper Churchill River Region had the lowest overall mean Walleye CPUE at
only 0.6 fish while the Winnipeg River Region was second lowest at 4.7 fish. It should be noted
CAMPP Three Year Summary Report Volume 9
6-112
that for many regions the off-system waterbodies had higher Walleye CPUE values, with the
exceptions of Cormorant Lake in the Saskatchewan River Region, Walker Lake in the Upper
Nelson River Region, and the Hayes River in the Lower Nelson River and Lower Churchill
River regions.
6.5.3 Fork Length Variation
Mean fork lengths were examined for Northern Pike, Lake Whitefish, and Walleye within each
region in Section 5. In this section the focus is an examination of regional differences in mean
fork length of the three species looking only at on-system and off-system waterbodies.
The highest mean Northern Pike fork lengths for on-system waterbodies were recorded for the
Winnipeg River (616 mm) and Lower Churchill River (606 mm) regions (Figure 6.5-8).
Apussigamasi Lake in the Churchill River Diversion Region had the highest mean fork length for
all CAMPP waterbodies (684 mm) while the other waterbodies in the same region had values
less than 450 mm giving the region the lowest overall mean fork length for Northern Pike. The
mean fork length for Northern Pike from the remaining regions ranged from 541 mm (Upper
Churchill River Region) to 577 mm (Lower Nelson River Region). Within each region the off-
system mean fork lengths for Northern Pike were within the range of or slightly higher than
those for the on-system waterbodies.
For Lake Whitefish, mean fork length for on-system waterbodies ranged from 341 mm in the
Upper Churchill River Region to 459 mm in the Lower Nelson River Region for on-system
waterbodies (Figure 6.5-9). The Lower Churchill River Region had the second lowest mean fork
length (373 mm) while the Winnipeg River, Churchill River Diversion, and Upper Nelson River
regions had similar mean fork lengths. Fork lengths for off-system waterbodies were found to
have similar mean total fork lengths to the on-system waterbodies.
Two regions, the Lower Churchill River and Lower Nelson River regions, had the same and
overall highest mean fork lengths for Walleye captured in on-system waterbodies at 433 mm
followed closely by the Upper Nelson River Region at 421 mm (Figure 6.5-10). The lowest
mean fork length was recorded for the Upper Churchill River Region (343 mm), only slightly
lower than the values recorded for the Winnipeg River (354 mm) and Churchill River Diversion
(356 mm) regions. In general, the fork lengths measured for Walleye tended to vary less among
waterbodies in a given region than those measured for either Lake Whitefish or Northern Pike.
Off-system mean fork lengths for walleye were similar to those for the on-system waterbodies.
CAMPP Three Year Summary Report Volume 9
6-113
6.5.4 Growth
Age composition and growth have previously been discussed in Section 5 for each region. In this
section the focus is on the examination of the Von Bertalanffy growth curves that were fit for
each waterbody for Northern Pike, Lake Whitefish, and Walleye. Several things must be noted.
First, the growth curves presented in Figures 6.5-11, 6.5-12, and 6.5-13 are extrapolated outside
of the data range for most waterbodies. Second, the Brody growth coefficient (K) was used to
compare growth rates between waterbodies and/or regions. Although the Brody growth
coefficient is not a growth rate per se (its units are yr-1
) (Ricker 1975 In Ogle 2013), it does
measure the exponential rate of approach to the asymptotic average length (L∞) (Schnute and
Fournier 1980 In Ogle 2013). L∞ is somewhat sensitive to the number and composition of
large/old individuals in the population, and is generally negatively correlated with K (i.e., the
lower L∞, the higher the value of K and vice versa). Only more data from a greater range of ages,
and/or exploring other versions of the Von Bertalanffy growth model (i.e., that proposed by
Gallucci and Quinn 1979) can increase model interpretability and improve comparisons between
waterbodies and regions.
Growth for Northern Pike, as measured by the Brody growth coefficient (K), varied both within
and among the regions (Figure 6.5-11). Within the Winnipeg River Region, the off-system
waterbody, Eaglenest Lake, had the highest growth coefficient followed closely by Lac du
Bonnet, then Pointe du Bois. Although Pointe du Bois Northern Pike appeared to be the fastest
growing in the region, a linear trajectory caused by a lack of individuals older than 11 years-of-
age in the Pointe du Bois data set resulted in an extremely high asymptotic average length (L∞)
and as a result, a low growth coefficient (K). In the Saskatchewan River Region two waterbodies
had similar growth rates, South Moose and Cedar Lake, while Cormorant Lake and
Saskatchewan River, had extremely high asymptotic average lengths (L∞) and as a result, low
growth coefficients (K). In the Upper Churchill River Region Granville Lake, one of the off-
system waterbodies, had the highest Northern Pike growth coefficient. The growth coefficient for
Gauer Lake, the other off-system waterbody, was similar to both Southern Indian Lake areas.
The Lower Churchill River Region had no difference between the growth coefficients estimated
for Partridge Breast Lake, Northern Indian Lake and the lower Churchill River. The Churchill
River Diversion Region showed little variation in growth for all waterbodies; however, the
Brody growth coefficients and the asymptotic average lengths varied considerably for Notigi and
Footprint lakes, primarily due to a lack of larger bodied individuals. Leftrook Lake had, on
average, the smallest asymptotic average length (≈585 mm) in the region. Within the Upper
Nelson River Region, three waterbodies (Playgreen Lake, Little Playgreen Lake and Walker
Lake [off-system]), had similar growth curves while Cross Lake and Setting Lake (off-system)
differed from these three lakes. The lower Nelson River waterbodies were all very similar in
CAMPP Three Year Summary Report Volume 9
6-114
terms of Northern Pike growth, with only one waterbody, Hayes River, having a low sample
size, making inference difficult. Due to the variability present within each region it is difficult to
make comparisons between regions using Northern Pike growth rate curves.
Within each region, both the on- and off-system waterbodies had fairly similar growth curves for
Lake Whitefish (Figure 6.5-12). Only two waterbodies were represented in the Winnipeg River
Region, Lac Du Bonnet and Manigotagan Lake, and they had relatively similar rates of growth.
However, Lac Du Bonnet Lake Whitefish obtained an overall larger size than those from
Manigotagan Lake and at an earlier age. The greatest difference in the Upper Churchill River
Region was noted for areas 1 and 4 in Southern Indian Lake where Area 1 Lake Whitefish
obtained an overall larger size and Area 4 Lake Whitefish had a slower growth rate than Lake
Whitefish for all other waterbodies in the region. The remaining regions did not show much
difference in the growth rate of Lake Whitefish among waterbodies. Across all regions the
growth curves for Lake Whitefish also varied very little with similar rates of growth and overall
maximum sizes.
The growth rates for Walleye were found to be similar both within and between regions (Figure
6.5-13). Of all the regions, Walleye within the Lower Churchill River Region appeared to have
the slowest growth followed by those in the Winnipeg River Region. The remaining regions
exhibited similar growth patterns. The Winnipeg River Region appeared to have walleye that
obtained the highest asymptotic average length at around 700 to 800 mm, with the exception of
Eaglenest Lake where average asymptotic length was approximately 500 mm. The remaining
regions ranged from 400 to 600 mm with the exception of Cross Lake in the Upper Nelson River
Region which was closer to 700 mm).
6.5.5 Deformities, Erosion, Lesions, and Tumours (DELTs)
The frequency of deformities, erosion, lesions and tumours (DELTs) was considered to be low
for all regions. One of the metrics used in calculating the Index of Biotic Integrity (IBI) scores
for each region in the section below was based on the frequency of DELTs. Table 6.5-1 shows
the average scores for on- and off-system waterbodies for all metrics including DELTs. Unlike
the other metrics used in calculating the overall IBI scores, DELTs were scored between five and
zero, with five indicating no reported DELTs and 0 indicating all individuals had DELTs present.
Both on- and off-system waterbodies within the Saskatchewan River Region had no reported
DELTs while the Winnipeg River, Upper Churchill River, Churchill River Diversion, and Upper
Nelson River regions all had calculated scores above four. The Lower Nelson River Region had
the greatest frequency of DELTs with scores of 3.7 for both the on- and off-system waterbodies.
As previously noted in Section 4, the value given to the DELTs metric in the overall calculation
of IBI scores was less than that of the other metrics due to differences in how agencies and
CAMPP Three Year Summary Report Volume 9
6-115
individuals identified DELTs in the field early on in the program. A more clearly defined
protocol for determining DELTs was established and incorporated into the field collection
manual to address the issue.
6.5.6 Index of Biotic Integrity
For the overview section mean IBI scores were calculated for both on- and off-system
waterbodies within each region as well as IBI scores for individual waterbodies with all years
combined (Table 6.5-1 and Figure 6.5-14). The highest regional IBI score for on-system
waterbodies was calculated for the Winnipeg River Region (65.8) followed closely by the Lower
Churchill River Region (62.4). The remaining regions had very similar overall mean IBI scores
ranging from 52.2 (Churchill River Diversion Region) to 56.1 (Upper Nelson River Region). In
terms of individual on-system waterbodies, the highest IBI scores were calculated for Lac Du
Bonnet (72.9), Apussigamasi Lake (67.9), and the Churchill River at Little Churchill River
(67.9). The on-system waterbodies with the lowest IBI scores were the Limestone Forebay in the
Lower Nelson River Region (36.9), Notigi Lake in the Churchill River Diversion Region (42.4),
and South Moose Lake in the Saskatchewan River Region (43.5). Off-system waterbodies also
showed considerable variability in IBI scores, with a high of 65.8 for Eaglenest Lake in the
Winnipeg River Region and a low of 41.8 for Walker Lake in the Upper Nelson River Region.
An examination of the average metric scores for each region and system presented in Table 6.5-1
provides information about how individual metrics contributed to the total IBI scores. For the
Winnipeg River Region on-system, which had the highest total IBI score, the metrics that
contributed most were the total number of species present, the number of sensitive species
present, the number of insectivore species present, and evenness. The proportion of tolerant
individuals metric also scored high meaning that they made up a small proportion of the overall
fish community present. The Winnipeg River Region off-system consisting of Eaglenest and
Manigotogan lakes had a slightly lower IBI score. Although the total number of species, number
of sensitive species, and number of insectivore species scored low, several other metrics had high
values (proportion of lithophilic spawners, proportion of tolerant individuals, and omnivore
biomass) contributing to the total IBI score. Within the Saskatchewan River Region the on- and
off-system IBI scores were very similar (53.5 for on-system and 50.5 for off-system) as were the
metrics contributing to them. No particular metric scored highly, however several extremely low
scores were calculated for the proportion of insectivore biomass, total number of sensitive
species, and proportion of omnivore biomass. Within the Upper Churchill River Region, most
metrics scored slightly higher for off-system than on-system with neither scoring very high for
any metric with the exception of the proportion of lithophilic spawners, which scored 8.9 for on-
system and only 6.9 for off-system. The Lower Churchill River Region on-system had the third
CAMPP Three Year Summary Report Volume 9
6-116
highest total IBI score of any group. Despite having relatively low scores for the total number of
species, sensitive species, and CPUE, it had high scores for proportion of tolerant individuals and
for proportion of omnivore biomass indicating that both of the waterbodies in the region tended
to have low proportions of both. Within the Churchill River Diversion Region the on- and off-
system waterbodies had similar total IBI scores and also similar individual metric scores. Most
metric scores were relatively low with the exception of CPUE, which scored much higher for the
off-system than the on-system, and the proportion of lithophilic spawners which was high for
both. The Upper Nelson River Region on-system had a slightly higher IBI score than the off-
system waterbodies due mostly to a higher number of total species and piscivore biomass. Both
on- and off-system had relatively high metric scores for total number of species, proportion of
tolerant individuals, and the number of insectivore species present. The Lower Nelson River
Region on- and off-system total IBI scores were similar with the off-system having higher scores
for the proportion of tolerant individuals, proportion of omnivore biomass, and the proportion of
lithophilic spawners while the on-system had higher scores for total number of species, number
of insectivore species, and evenness.
6.5.7 Off-system Waterbodies
Off-system waterbodies monitored under CAMPP are inherently different from on-system
waterbodies due to differences in lake morphometry, drainage basin size, hydrology etc. Thus,
differences in the fish community of off-system and on-system waterbodies were anticipated.
Despite those anticipated differences some aspects of the off-system waterbodies were similar to
those of the on-system waterbodies. The total number of species was not considerably different
within each region for on- versus off-system waterbodies with the exception of the previously
noted variation between Manigotagan Lake and the other Winnipeg River Region waterbodies.
Relative abundance of the four species of interest was also similar within each region again with
the notable exception of Manigotagan Lake where Sauger was absent. One of the key metrics
that was found to be different between on- and off-system waterbodies was CPUE, particularly
for mean total CPUE for all species as well as for Northern Pike and Walleye, where the off-
system waterbodies were often considerably higher than the on-system ones. Mean fork lengths
for Lake Whitefish, Northern Pike, and Walleye were similar between on- and off-system
waterbodies. The overall IBI scores were very similar between on- and off-system waterbodies
within each region.
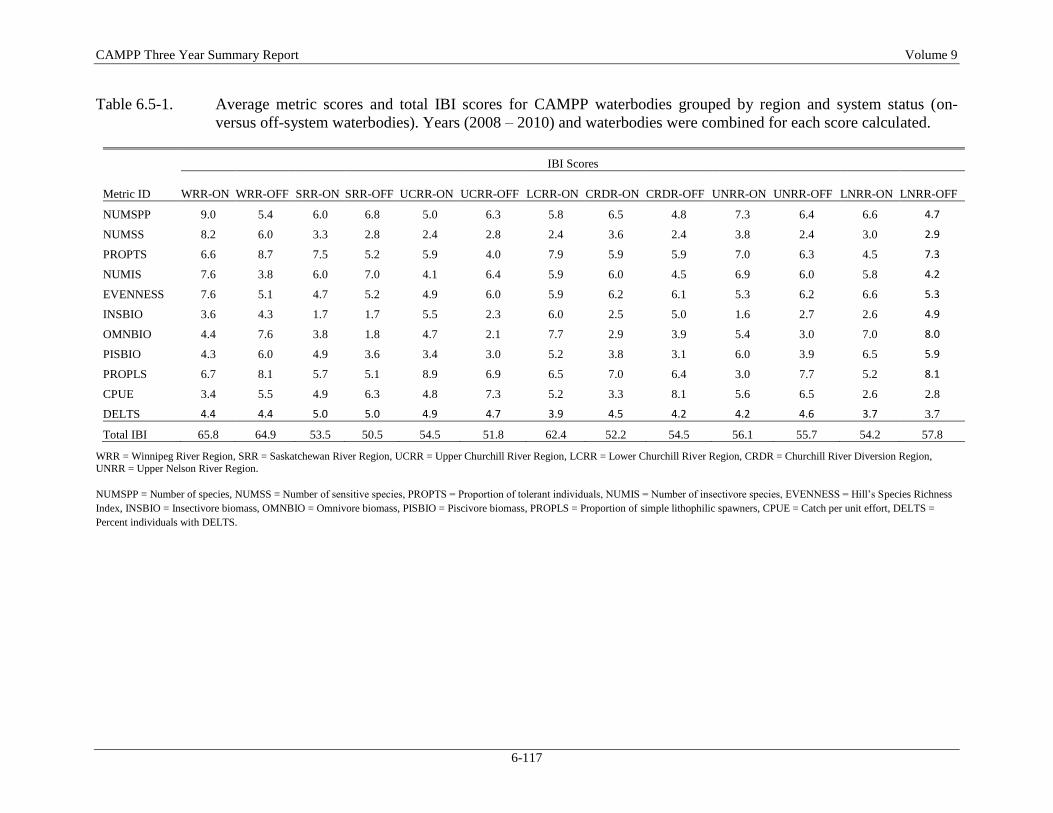
CAMPP Three Year Summary Report Volume 9
6-117
Table 6.5-1. Average metric scores and total IBI scores for CAMPP waterbodies grouped by region and system status (on-
versus off-system waterbodies). Years (2008 – 2010) and waterbodies were combined for each score calculated.
IBI Scores
Metric ID WRR-ON WRR-OFF SRR-ON SRR-OFF UCRR-ON UCRR-OFF LCRR-ON CRDR-ON CRDR-OFF UNRR-ON UNRR-OFF LNRR-ON LNRR-OFF
NUMSPP 9.0 5.4 6.0 6.8 5.0 6.3 5.8 6.5 4.8 7.3 6.4 6.6 4.7
NUMSS 8.2 6.0 3.3 2.8 2.4 2.8 2.4 3.6 2.4 3.8 2.4 3.0 2.9
PROPTS 6.6 8.7 7.5 5.2 5.9 4.0 7.9 5.9 5.9 7.0 6.3 4.5 7.3
NUMIS 7.6 3.8 6.0 7.0 4.1 6.4 5.9 6.0 4.5 6.9 6.0 5.8 4.2
EVENNESS 7.6 5.1 4.7 5.2 4.9 6.0 5.9 6.2 6.1 5.3 6.2 6.6 5.3
INSBIO 3.6 4.3 1.7 1.7 5.5 2.3 6.0 2.5 5.0 1.6 2.7 2.6 4.9
OMNBIO 4.4 7.6 3.8 1.8 4.7 2.1 7.7 2.9 3.9 5.4 3.0 7.0 8.0
PISBIO 4.3 6.0 4.9 3.6 3.4 3.0 5.2 3.8 3.1 6.0 3.9 6.5 5.9
PROPLS 6.7 8.1 5.7 5.1 8.9 6.9 6.5 7.0 6.4 3.0 7.7 5.2 8.1
CPUE 3.4 5.5 4.9 6.3 4.8 7.3 5.2 3.3 8.1 5.6 6.5 2.6 2.8
DELTS 4.4 4.4 5.0 5.0 4.9 4.7 3.9 4.5 4.2 4.2 4.6 3.7 3.7
Total IBI 65.8 64.9 53.5 50.5 54.5 51.8 62.4 52.2 54.5 56.1 55.7 54.2 57.8
WRR = Winnipeg River Region, SRR = Saskatchewan River Region, UCRR = Upper Churchill River Region, LCRR = Lower Churchill River Region, CRDR = Churchill River Diversion Region,
UNRR = Upper Nelson River Region.
NUMSPP = Number of species, NUMSS = Number of sensitive species, PROPTS = Proportion of tolerant individuals, NUMIS = Number of insectivore species, EVENNESS = Hill’s Species Richness
Index, INSBIO = Insectivore biomass, OMNBIO = Omnivore biomass, PISBIO = Piscivore biomass, PROPLS = Proportion of simple lithophilic spawners, CPUE = Catch per unit effort, DELTS =
Percent individuals with DELTS.
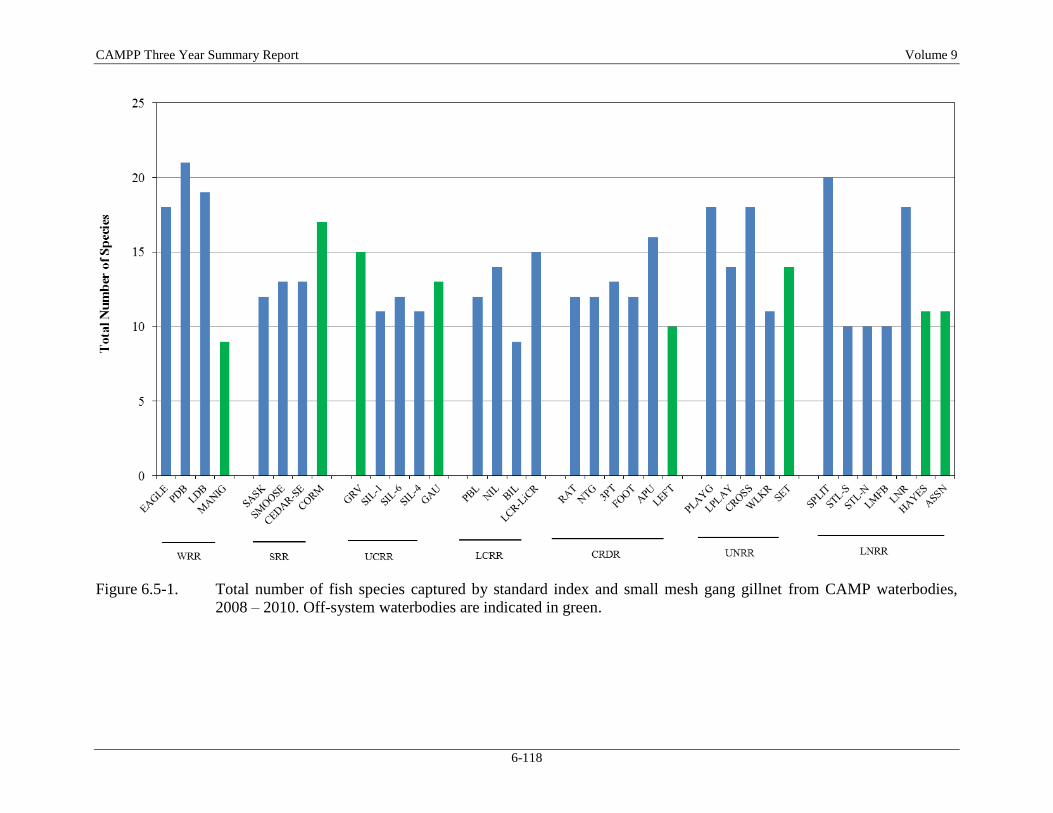
CAMPP Three Year Summary Report Volume 9
6-118
Figure 6.5-1. Total number of fish species captured by standard index and small mesh gang gillnet from CAMP waterbodies,
2008 – 2010. Off-system waterbodies are indicated in green.
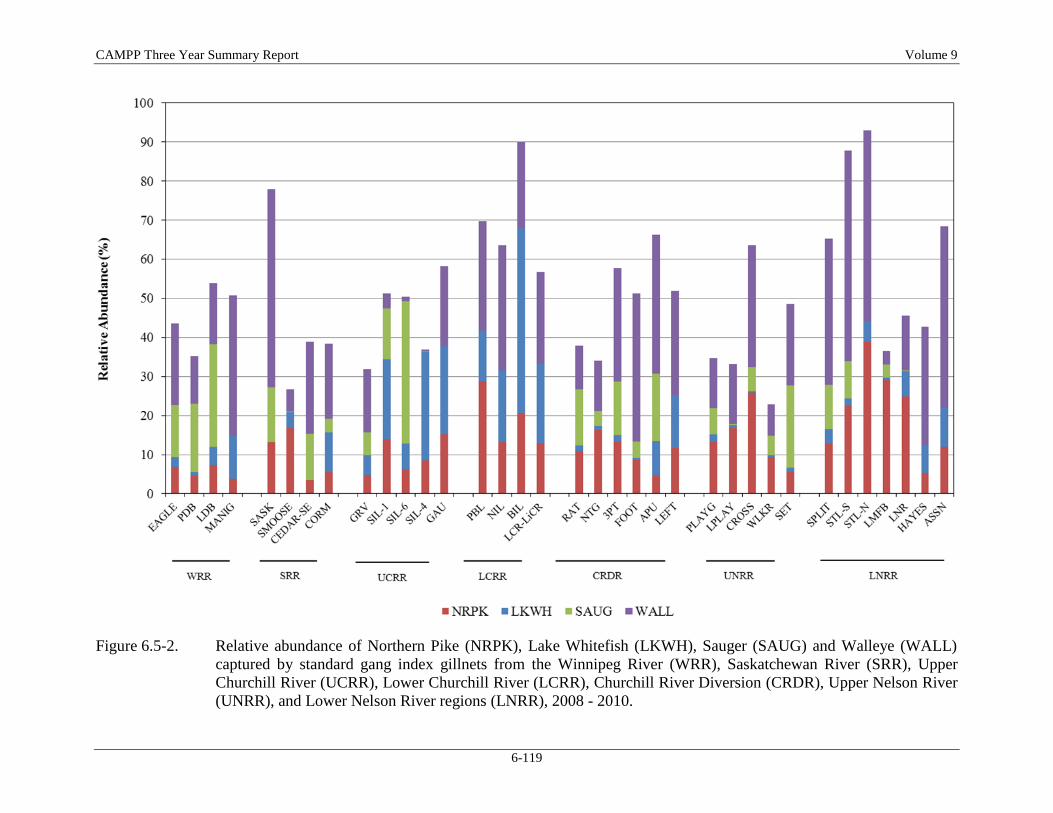
CAMPP Three Year Summary Report Volume 9
6-119
Figure 6.5-2. Relative abundance of Northern Pike (NRPK), Lake Whitefish (LKWH), Sauger (SAUG) and Walleye (WALL)
captured by standard gang index gillnets from the Winnipeg River (WRR), Saskatchewan River (SRR), Upper
Churchill River (UCRR), Lower Churchill River (LCRR), Churchill River Diversion (CRDR), Upper Nelson River
(UNRR), and Lower Nelson River regions (LNRR), 2008 - 2010.
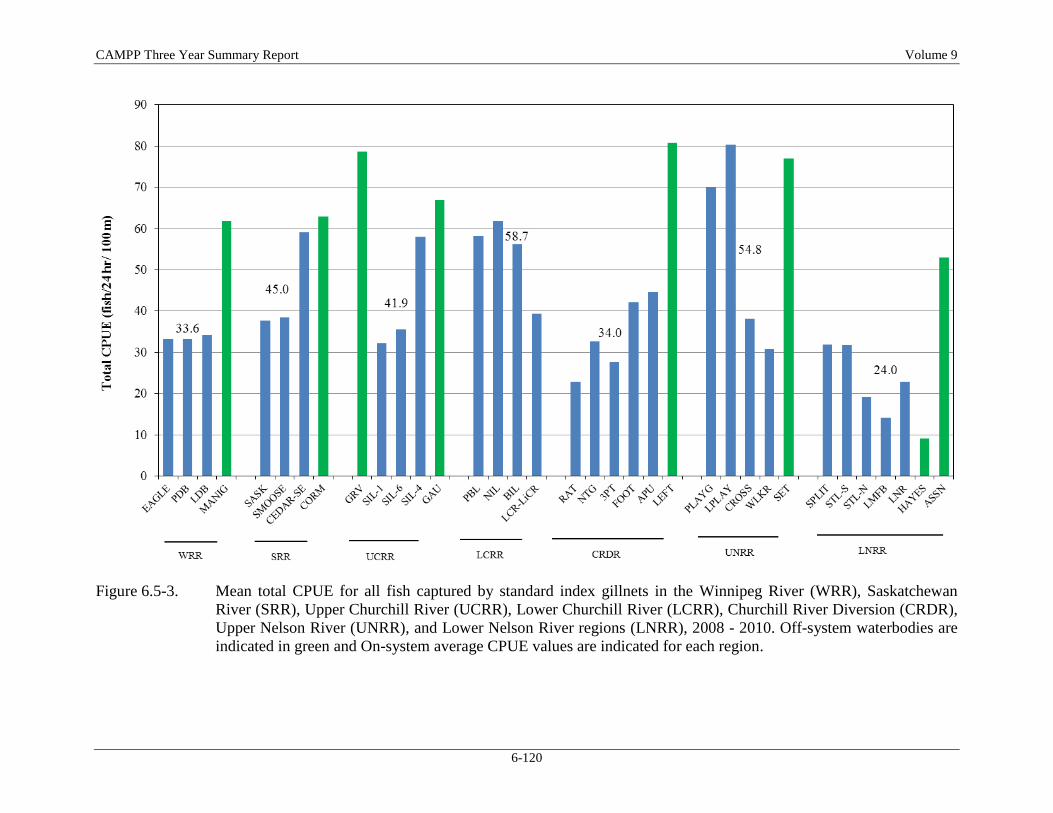
CAMPP Three Year Summary Report Volume 9
6-120
Figure 6.5-3. Mean total CPUE for all fish captured by standard index gillnets in the Winnipeg River (WRR), Saskatchewan
River (SRR), Upper Churchill River (UCRR), Lower Churchill River (LCRR), Churchill River Diversion (CRDR),
Upper Nelson River (UNRR), and Lower Nelson River regions (LNRR), 2008 - 2010. Off-system waterbodies are
indicated in green and On-system average CPUE values are indicated for each region.
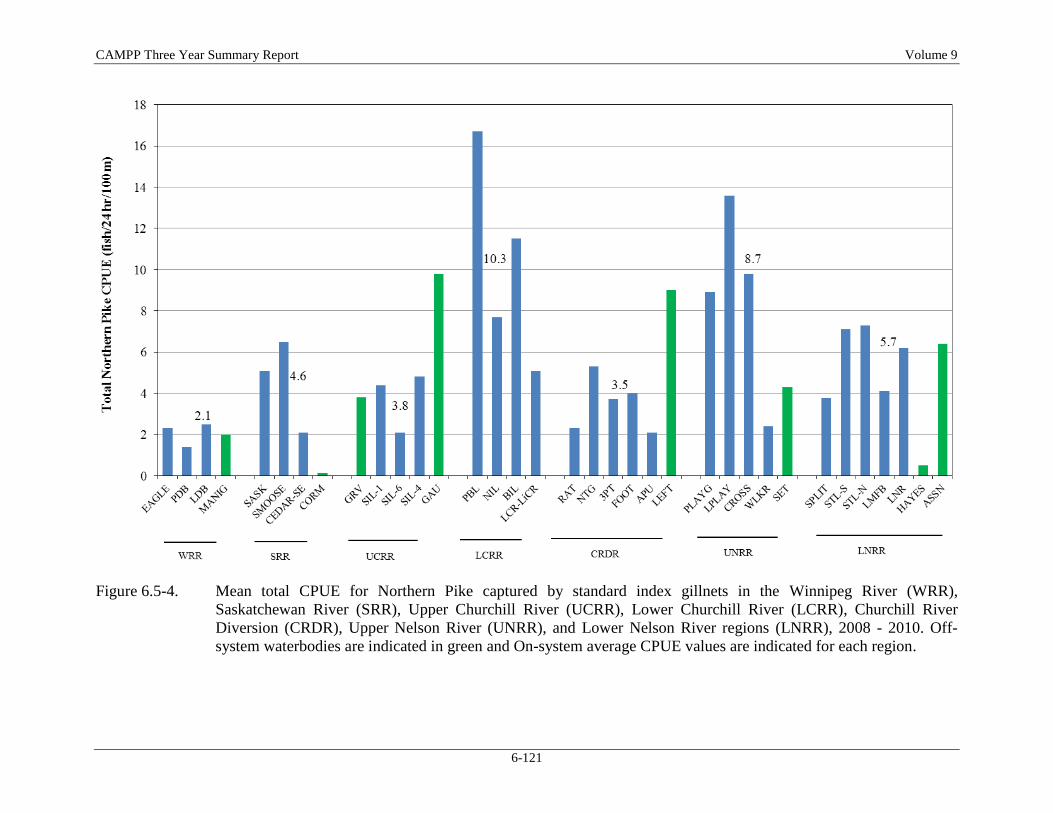
CAMPP Three Year Summary Report Volume 9
6-121
Figure 6.5-4. Mean total CPUE for Northern Pike captured by standard index gillnets in the Winnipeg River (WRR),
Saskatchewan River (SRR), Upper Churchill River (UCRR), Lower Churchill River (LCRR), Churchill River
Diversion (CRDR), Upper Nelson River (UNRR), and Lower Nelson River regions (LNRR), 2008 - 2010. Off-
system waterbodies are indicated in green and On-system average CPUE values are indicated for each region.
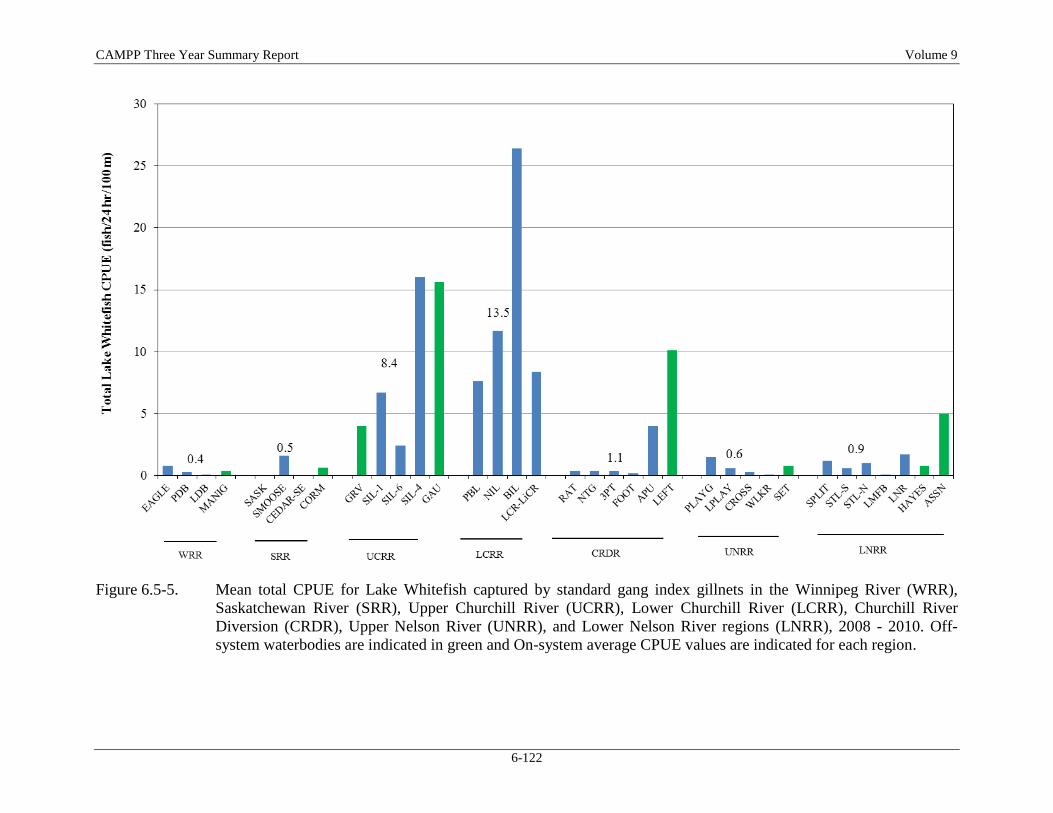
CAMPP Three Year Summary Report Volume 9
6-122
Figure 6.5-5. Mean total CPUE for Lake Whitefish captured by standard gang index gillnets in the Winnipeg River (WRR),
Saskatchewan River (SRR), Upper Churchill River (UCRR), Lower Churchill River (LCRR), Churchill River
Diversion (CRDR), Upper Nelson River (UNRR), and Lower Nelson River regions (LNRR), 2008 - 2010. Off-
system waterbodies are indicated in green and On-system average CPUE values are indicated for each region.
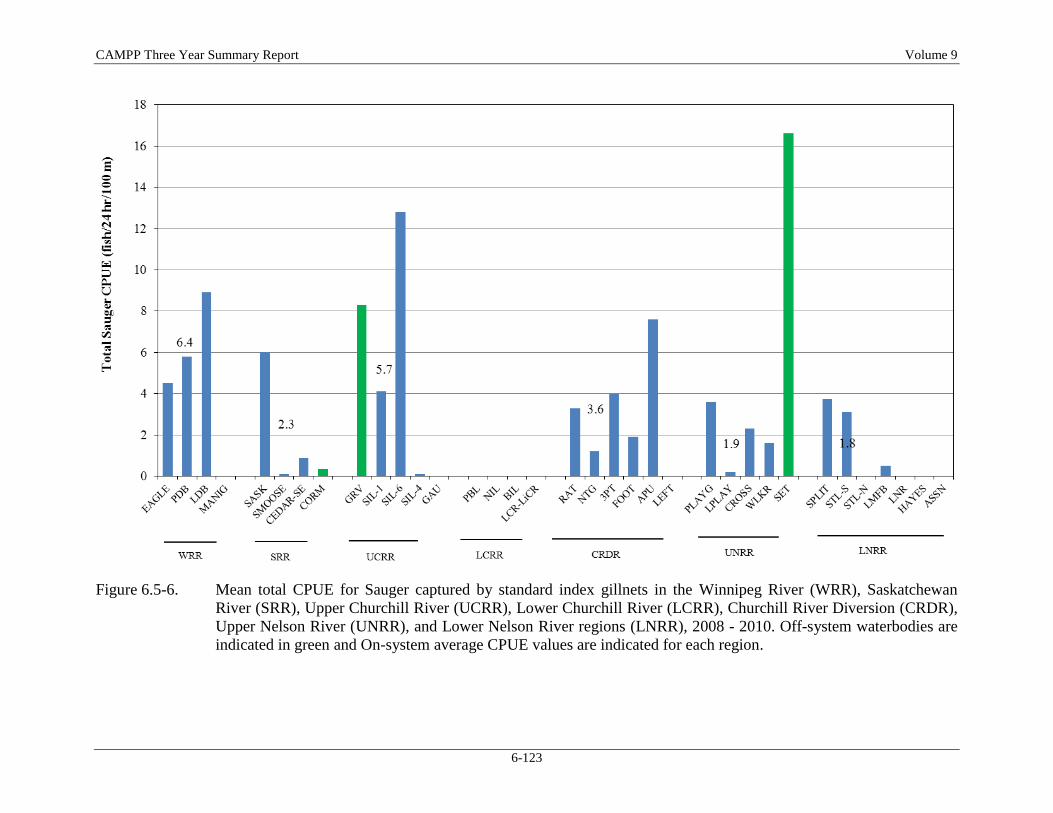
CAMPP Three Year Summary Report Volume 9
6-123
Figure 6.5-6. Mean total CPUE for Sauger captured by standard index gillnets in the Winnipeg River (WRR), Saskatchewan
River (SRR), Upper Churchill River (UCRR), Lower Churchill River (LCRR), Churchill River Diversion (CRDR),
Upper Nelson River (UNRR), and Lower Nelson River regions (LNRR), 2008 - 2010. Off-system waterbodies are
indicated in green and On-system average CPUE values are indicated for each region.
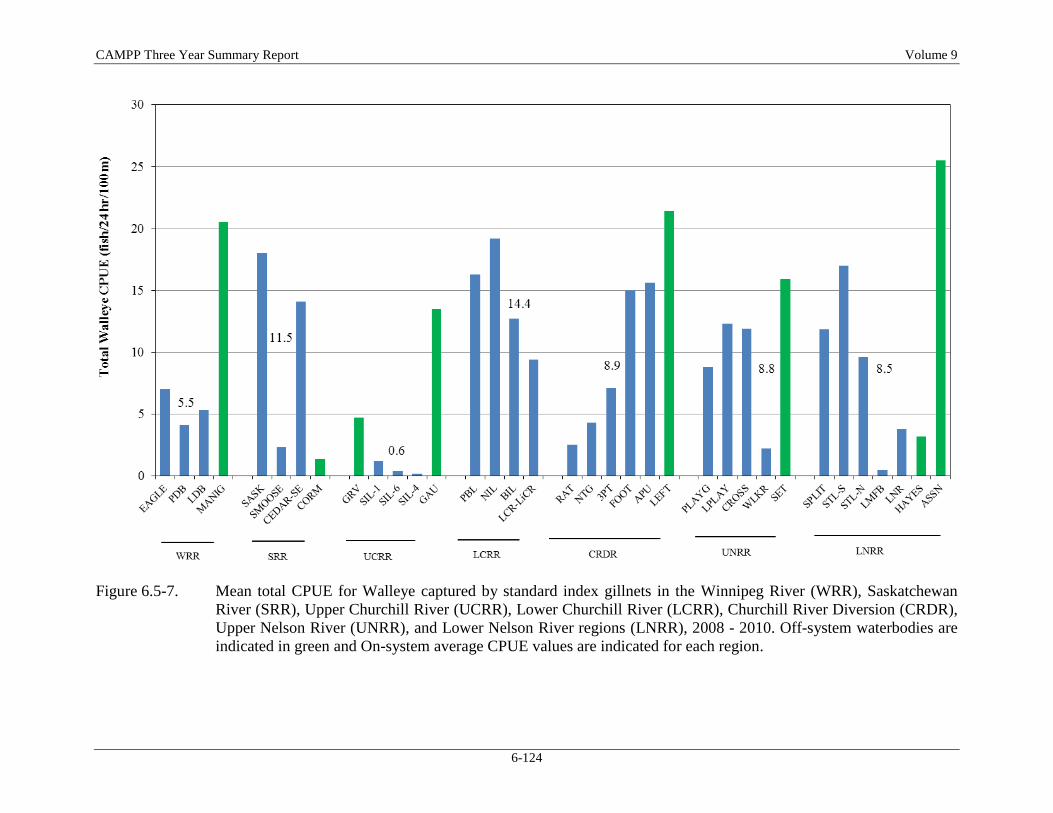
CAMPP Three Year Summary Report Volume 9
6-124
Figure 6.5-7. Mean total CPUE for Walleye captured by standard index gillnets in the Winnipeg River (WRR), Saskatchewan
River (SRR), Upper Churchill River (UCRR), Lower Churchill River (LCRR), Churchill River Diversion (CRDR),
Upper Nelson River (UNRR), and Lower Nelson River regions (LNRR), 2008 - 2010. Off-system waterbodies are
indicated in green and On-system average CPUE values are indicated for each region.
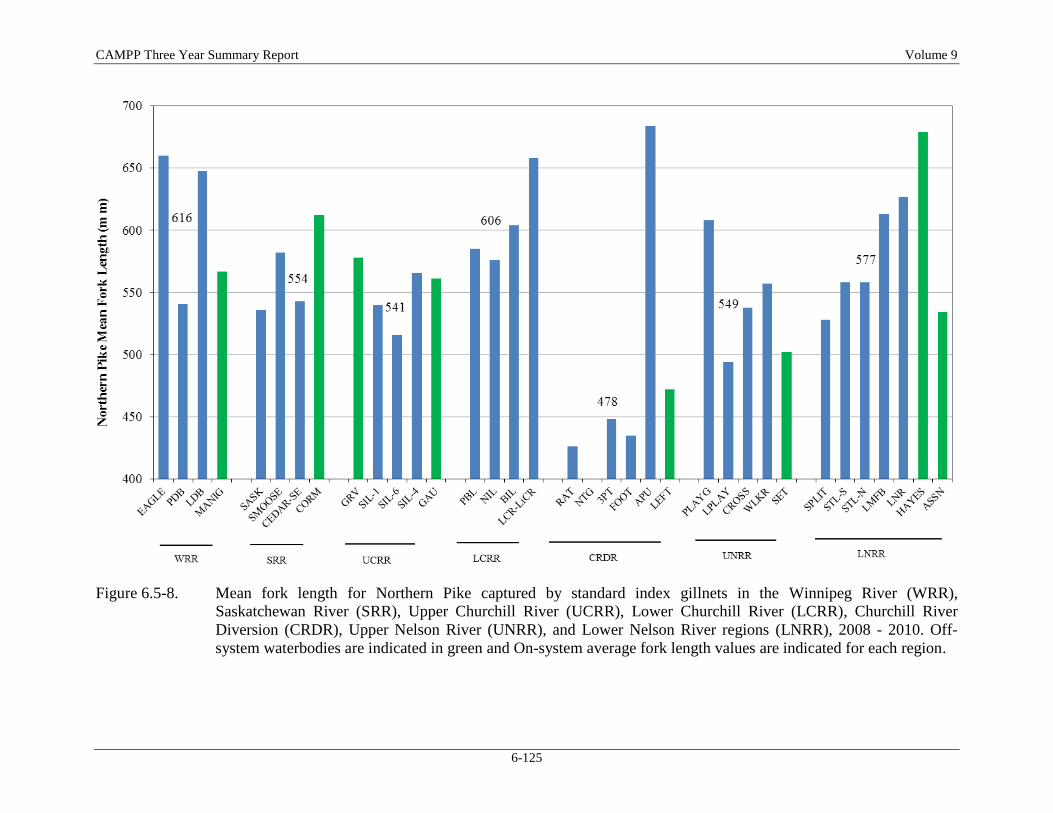
CAMPP Three Year Summary Report Volume 9
6-125
Figure 6.5-8. Mean fork length for Northern Pike captured by standard index gillnets in the Winnipeg River (WRR),
Saskatchewan River (SRR), Upper Churchill River (UCRR), Lower Churchill River (LCRR), Churchill River
Diversion (CRDR), Upper Nelson River (UNRR), and Lower Nelson River regions (LNRR), 2008 - 2010. Off-
system waterbodies are indicated in green and On-system average fork length values are indicated for each region.
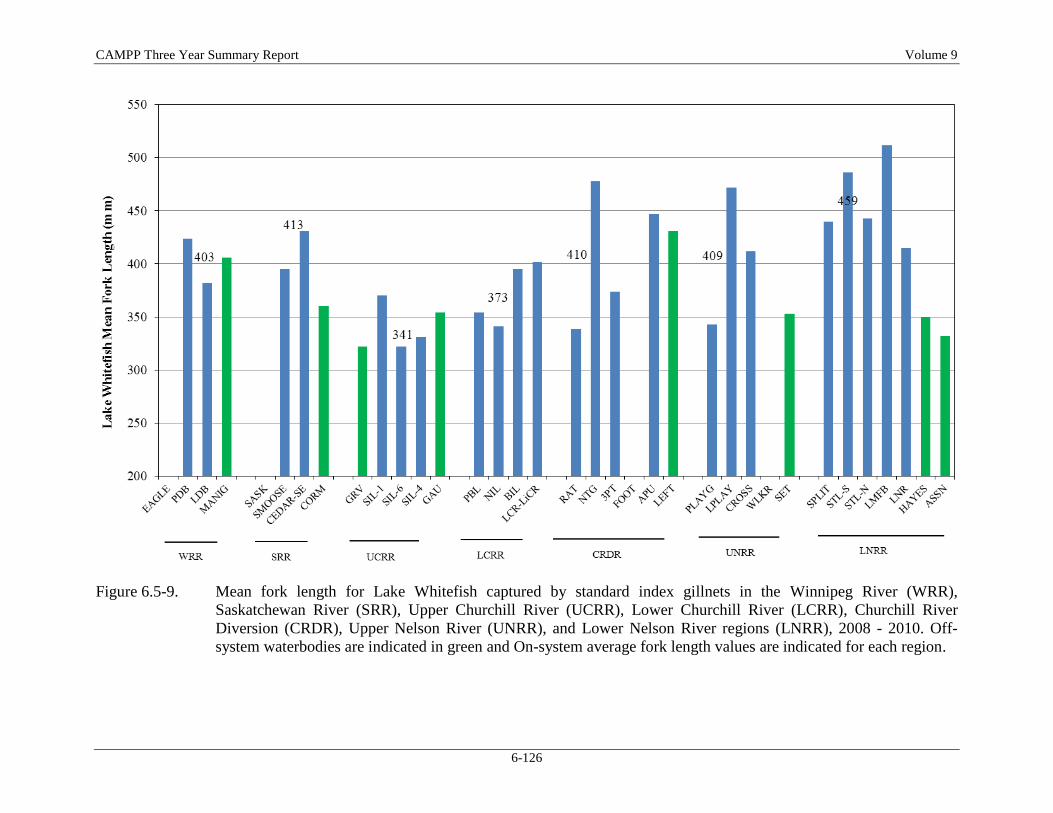
CAMPP Three Year Summary Report Volume 9
6-126
Figure 6.5-9. Mean fork length for Lake Whitefish captured by standard index gillnets in the Winnipeg River (WRR),
Saskatchewan River (SRR), Upper Churchill River (UCRR), Lower Churchill River (LCRR), Churchill River
Diversion (CRDR), Upper Nelson River (UNRR), and Lower Nelson River regions (LNRR), 2008 - 2010. Off-
system waterbodies are indicated in green and On-system average fork length values are indicated for each region.
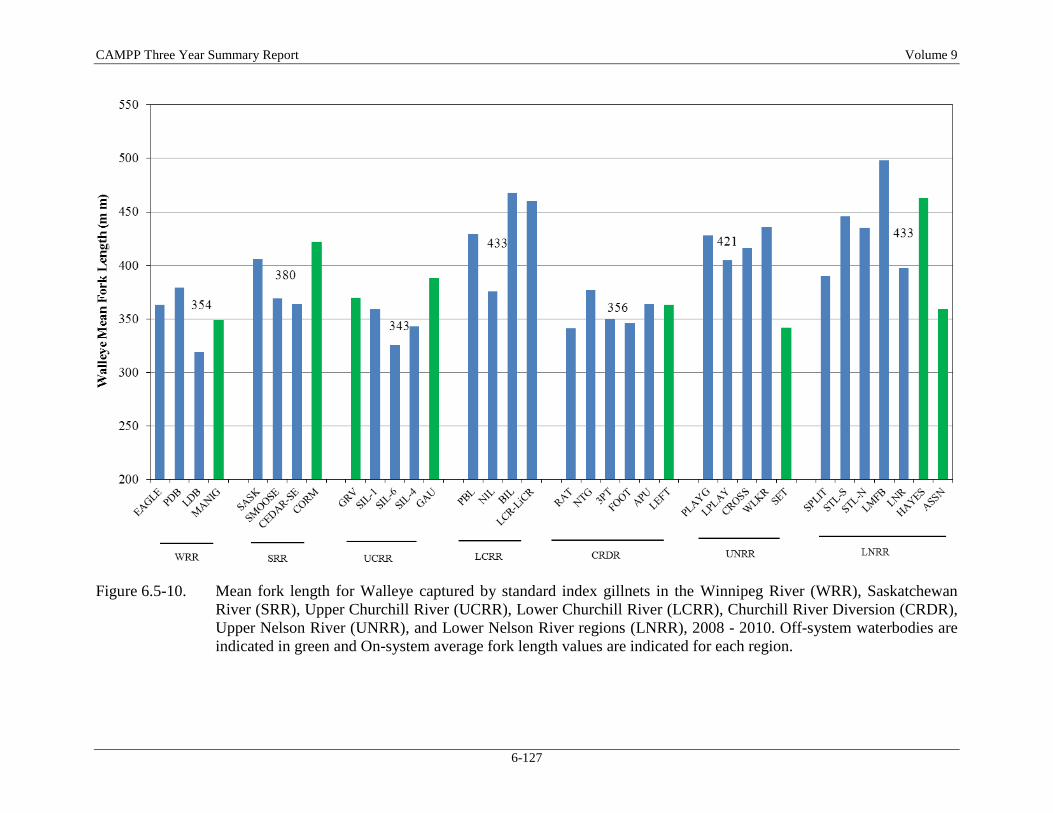
CAMPP Three Year Summary Report Volume 9
6-127
Figure 6.5-10. Mean fork length for Walleye captured by standard index gillnets in the Winnipeg River (WRR), Saskatchewan
River (SRR), Upper Churchill River (UCRR), Lower Churchill River (LCRR), Churchill River Diversion (CRDR),
Upper Nelson River (UNRR), and Lower Nelson River regions (LNRR), 2008 - 2010. Off-system waterbodies are
indicated in green and On-system average fork length values are indicated for each region.
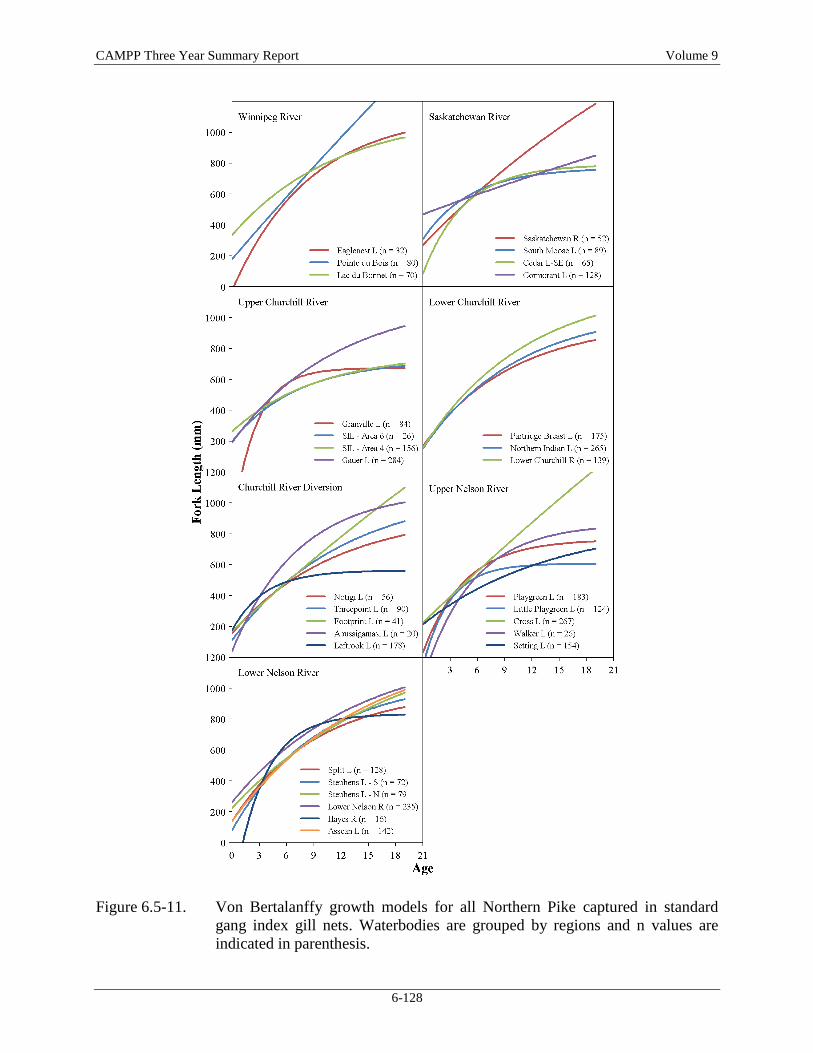
CAMPP Three Year Summary Report Volume 9
6-128
Figure 6.5-11. Von Bertalanffy growth models for all Northern Pike captured in standard
gang index gill nets. Waterbodies are grouped by regions and n values are
indicated in parenthesis.
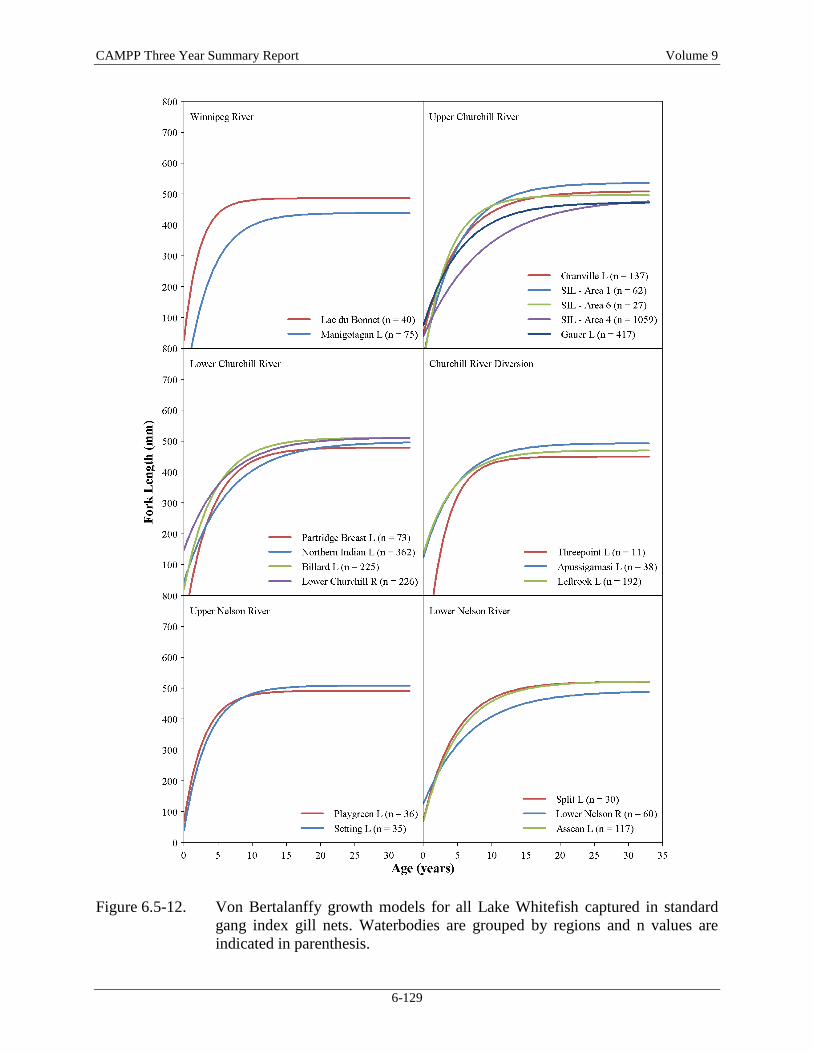
CAMPP Three Year Summary Report Volume 9
6-129
Figure 6.5-12. Von Bertalanffy growth models for all Lake Whitefish captured in standard
gang index gill nets. Waterbodies are grouped by regions and n values are
indicated in parenthesis.
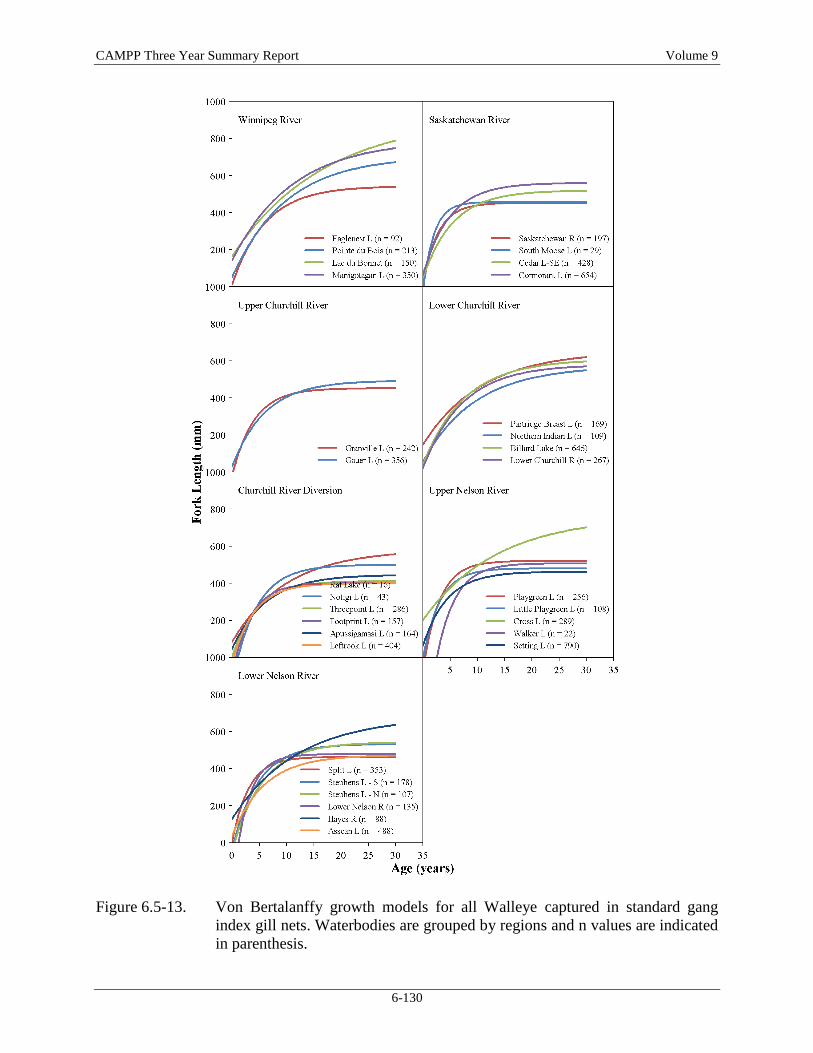
CAMPP Three Year Summary Report Volume 9
6-130
Figure 6.5-13. Von Bertalanffy growth models for all Walleye captured in standard gang
index gill nets. Waterbodies are grouped by regions and n values are indicated
in parenthesis.
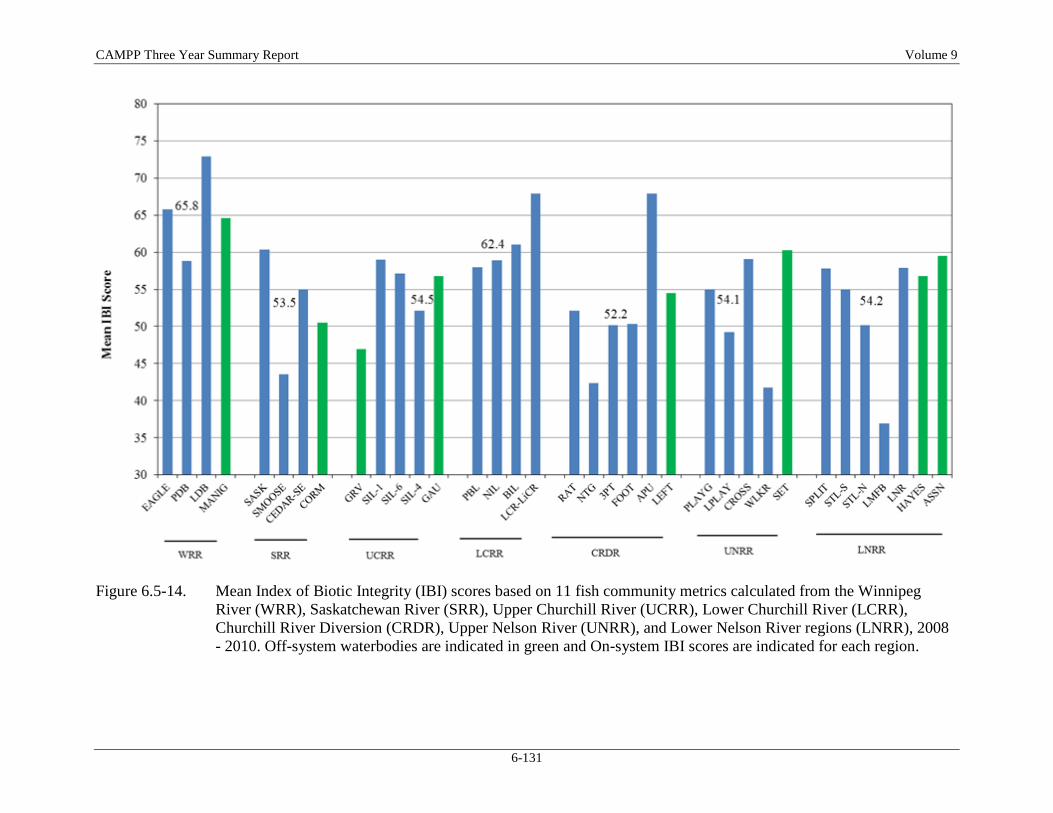
CAMPP Three Year Summary Report Volume 9
6-131
Figure 6.5-14. Mean Index of Biotic Integrity (IBI) scores based on 11 fish community metrics calculated from the Winnipeg
River (WRR), Saskatchewan River (SRR), Upper Churchill River (UCRR), Lower Churchill River (LCRR),
Churchill River Diversion (CRDR), Upper Nelson River (UNRR), and Lower Nelson River regions (LNRR), 2008
- 2010. Off-system waterbodies are indicated in green and On-system IBI scores are indicated for each region.

CAMPP Three Year Summary Report Volume 9
6-133
6.6 FISH MERCURY
As outlined in Section 4.8, fish mercury monitoring was conducted during one year under
CAMPP (largely completed in 2010); most waterbodies continue to be monitored under the
current CAMP on a three-year rotational basis, though annual monitoring was initiated in Year 4
of CAMP at two waterbodies. As only one year of data were collected under CAMPP, temporal
comparisons of fish mercury concentrations could not be conducted. The following discussion
focusses on spatial comparisons of mercury concentrations between waterbodies and regions,
comparisons between species, relationships between mercury concentrations and fish length, and
comparisons to mercury standards and guidelines. Because mercury data are available for
relatively few populations of Yellow Perch, and because Yellow Perch size ranges sometimes
differed substantially between waterbodies, spatial comparisons of mercury concentrations for
this species could not be undertaken for this report, but will be incorporated into future reporting
with acquisition of additional data.
6.6.1 Relationship between Mercury Concentration and Fish Size
The relationship between total mercury concentrations in muscle and fish fork length was
consistently highly significant and positive for all three large-bodied species (Lake Whitefish,
Northern Pike, and Walleye), when sample sizes corresponded to at least 70% or higher of the
target size of 36 fish. Only the 12 Walleye from SIL - Area 4 and the 24 Lake Whitefish from
Setting Lake showed no significant correlation between mercury concentration and fish size. The
generally significant relationship between these two parameters indicated that length
standardization of mercury concentrations was necessary for spatial (and future temporal)
comparisons within species.
In contrast to the large-bodied species, the relationship between mercury concentration and fish
size was not significant for five of the seven waterbodies where 1-year-old Yellow Perch were
collected (Figure 6.6-1). The lack of a significant correlation between these parameters may be
partially explained by the relatively small sample sizes obtained from Cedar, Setting, Leftrook,
and Little Playgreen lakes. However, no significant relationship was found for this species where
larger sample sizes were obtained (i.e., Cross, Cormorant, and Northern Indian lakes), suggesting
for at least some waterbodies, that the typically positive correlation between mercury
concentration and fish length may not apply for young Yellow Perch (see discussion below).
Further, where significant correlations were found between mercury concentrations and Yellow
Perch length, the relationship was negative (Cedar and Setting lakes; p<0.01; Figure 6.6-1). In
addition, though not significant, the relationship between these parameters was negative for two
other waterbodies (Northern Indian and Cross lakes).
CAMPP Three Year Summary Report Volume 9
6-134
Yellow Perch from Setting Lake represented the smallest fish caught from any of the CAMPP
waterbodies (fork lengths of 60-70 mm), whereas their conspecifics from Cedar Lake spanned
the largest size range of all Yellow Perch collected for mercury analysis (75-133 mm). Yellow
Perch from Little Playgreen Lake were by far the largest analyzed for mercury in 2010 (Figure
6.6-1). Though these fish were not aged, their lengths (158-182 mm) indicated ages of greater
than 1 year. An older age of these fish was also indicated by the fact that Little Playgreen Lake
was sampled early in the season of 2010 (June 11-12) when water temperatures ranged from 11-
14ºC. At this time growth of Yellow Perch may have just started.
The predominantly negative correlation between mercury concentration and Yellow Perch size is
in contrast to the general paradigm in which mercury concentrations in fish are positively
correlated to fish length/age (Green 1986; Evans et al. 2005), and which is supported by the
results for the older, mainly mature Lake Whitefish, Northern Pike, and Walleye analyzed for
mercury under CAMPP. This difference in the way mercury concentrations change with body
size in the young, mainly immature Yellow Perch could be the result of growth dilution of
mercury concentrations (Ward et al. 2010; Essington and Hauser 2003). The ratio of new to
existing muscle mass increases rapidly during the growing-season of young Yellow Perch and
these fish accumulate more biomass relative to mercury if food mercury concentrations are
stable. This process is most pronounced for the fastest-growing and, consequently, largest
individuals of a cohort, resulting in a negative correlation between mercury concentration and
fish length. Emperical evidence for an age-related shift from a negative to a positive relationship
between muscle mercury concentration and fish length has previously been reported by Braune
(1987).
6.6.2 Comparisons of Mercury Concentrations between Waterbodies within Species
Mean length-standardized mercury concentrations in Lake Whitefish, Northern Pike, and
Walleye ranged several fold between waterbodies sampled under CAMPP. Similar relative
differences in arithmetic mean concentrations were found for Yellow Perch between waterbodies
(comparison for this species could not be based on length-standardized means). The following
provides an overview of differences observed between waterbodies for each of the fish species.
Unless otherwise indicated, mean mercury concentrations refer to length-standardized
concentrations.
6.6.2.1 Lake Whitefish
Mean mercury concentrations in Lake Whitefish varied approximately five fold, from 0.022 parts
per million (ppm) for Playgreen Lake to 0.112 ppm for Northern Indian Lake (Figure 6.6-2).
CAMPP Three Year Summary Report Volume 9
6-135
Irrespective of CAMPP Region and excluding all samples with seven or less fish, three groups of
waterbodies were found to have statistically significantly different mercury concentrations.
Specifically, Lake Whitefish from Northern Indian Lake had higher concentrations than their
conspecifics from all other waterbodies. Furthermore, Lake Whitefish from Playgreen Lake,
Setting Lake, Southern Indian Lake-Area 6, and Leftrook Lake were distinct from all other
waterbodies and, as a group, had the lowest mercury concentrations. All other waterbodies made
up the third group. Although statistical differences in Lake Whitefish mercury concentrations
existed between some waterbodies of this group (e.g., fish from Gauer Lake had lower
concentrations compared to all other waterbodies except Assean Lake), no single waterbody was
statistically distinct from all other waterbodies in terms of Lake Whitefish mercury
concentrations. Within Southern Indian Lake, the only CAMPP waterbody where fish mercury
data were collected from two distinctly separate areas, Lake Whitefish mercury concentrations
were significantly different between the areas sampled (i.e., higher in Area 4 than in Area 6).
Considering lakes and rivers separately, Lake Whitefish mercury concentrations varied widely
among lakes, whereas they were relatively uniform (i.e., not significantly different) and moderate
to high across the four rivers (three on-system and one off-system) sampled under CAMPP
(Figure 6.6-2). This pattern may reflect the more constant and uniform conditions in
biogeochemical and broad ecological conditions in these rivers which were all sampled in similar
(downstream) reaches within the river continuum (Vannote et al. 1980). In contrast the CAMPP
lakes are quite heterogeneous, particularly in size, morphometry, and degree of riverine
influence.
Based on individual fish, mercury concentrations of the 432 Lake Whitefish analyzed across
regions ranged from 0.008 ppm (i.e., below detection limit) for several 1-year old fish from
Playgreen Lake to 0.51 ppm measured in a 458 mm-long, 18 year old fish from the lower Nelson
River. The arithmetic mean concentration of mercury measured in all Lake Whitefish was 0.067
ppm.
6.6.2.2 Northern Pike
Mean mercury concentrations in Northern Pike varied by almost an order of magnitude (0.105-
1.012 ppm) between waterbodies (Figure 6.6-3). The two lakes representing with the minimum
and maximum mean mercury concentrations were statistically distinct; Northern Pike from
Cedar Lake-SE contained significantly lower concentrations, and Northern Pike from
Manigotagan Lake contained significantly higher concentrations, than their conspecifics from all
other waterbodies. Northern Pike from the remaining waterbodies showed a fairly even gradient
of lower to higher mercury concentrations, and although statistical differences in mercury
CAMPP Three Year Summary Report Volume 9
6-136
concentrations existed between waterbodies, these were largely related to regional differences or
off-system versus on-system conditions (see Section 6.6.3 for a discussion). Similar to Lake
Whitefish, mercury concentrations in Northern Pike collected from Areas 4 and 6 of Southern
Indian Lake differed significantly; but unlike Lake Whitefish, Northern Pike contained higher
concentrations in Area 6 (Figure 6.6-3).
Similar to Lake Whitefish, mercury concentrations of Northern Pike inhabiting rivers were
generally more uniform than their conspecifics captured from lakes. However, unlike Lake
Whitefish, significant differences in mercury concentrations of Northern Pike from different
rivers were observed. Concentrations in Northern Pike from the Winnipeg River at Pointe du
Bois were significantly higher compared to their conspecifics from all other rivers, and Northern
Pike from the Churchill River at the Little Churchill River exceeded concentrations in fish from
the remaining three rivers (Figure 6.6-3).
Based on individual fish, mercury concentrations of the 751 Northern Pike analyzed across
regions ranged from 0.011 ppm measured in a 153 mm long, 1-year old fish from Assean Lake to
1.69 ppm (770 mm long, 10 year old fish from Manigotagan Lake). The arithmetic mean
concentration of all Northern Pike was 0.37 ppm.
6.6.2.3 Walleye
Mean mercury concentrations in Walleye varied approximately six fold (from 0.107 ppm in
Cedar Lake-SE to 0.648 ppm in the Winnipeg River at Pointe du Bois) across waterbodies
(Figure 6.6-4). Concentrations in Walleye from Cedar Lake were significantly lower compared
to their conspecifics from all other waterbodies. Spatial patterns regarding mercury
concentrations in this species appear to be mainly related to regional and on-system/off-system
differences (see Section 6.6.3 below). Similar to Northern Pike, concentrations of mercury were
higher in Walleye from Area 6 than Area 4 of Southern Indian Lake. However, these arithmetic
mean concentrations (the relationship between mercury concentration and fish length for
Walleye from Area 4 was non-significant) did not differ statistically, possibly due to the small
numbers of Walleye collected from both areas.
In contrast to Northern Pike, and particularly Lake Whitefish, mercury concentrations measured
in Walleye from rivers were almost equally variable compared to their conspecifics from lakes.
This was largely a result of the high concentrations in fish from the Winnipeg River, which
represented the highest mean concentration for any Walleye population analyzed and was
significantly different from those of all other river locations. Furthermore, Walleye from the
Hayes River had a significantly higher mean concentration than their conspecifics from the
Churchill, Nelson, and Saskatchewan rivers. Although mercury concentrations in Walleye from
CAMPP Three Year Summary Report Volume 9
6-137
the Saskatchewan River were significantly lower than in Walleye from all other river locations,
this is not relevant for a comparison of fish mercury in rivers because the sampling sites for the
Saskatchewan River were all located in the west basin of Cedar Lake (see Section 5.2.8).
Based on individual fish, mercury concentrations of the 778 Walleye analyzed ranged from
0.024 ppm for a 98 mm long, un-aged fish (likely age 0+) from Playgreen Lake to 1.92 ppm for a
710 mm long, 27 year old fish from the Winnipeg River at Pointe du Bois. The mean
concentration of all Walleye was 0.34 ppm.
6.6.2.4 Yellow Perch
Because the relationship between mercury concentration and fish length was not significant for
the majority of Yellow Perch samples, arithmetic means were used for the comparison of
mercury concentrations between populations. Mean concentrations in Yellow Perch varied
almost five fold, from 0.016 ppm for Cedar Lake-SE to 0.075 ppm for Cross and Northern Indian
lakes (Figure 6.6-5). Two groups of means were statistically different: Yellow Perch from Little
Playgreen, Cross, Setting, and Northern Indian lakes had similar and significantly higher
mercury concentrations than their conspecifics from Cedar, Cormorant, and Leftrook lakes.
Individual mercury concentrations of the 120 Yellow Perch analyzed ranged from 0.011 ppm for
two 115 and 118 mm-long individuals from Cedar Lake that were aged as 2+ to 0.134 ppm for a
164 mm long, un-aged fish from Little Playgreen Lake. The third highest overall concentrations
and the highest concentration for a confirmed 1-year-old fish was 0.102 ppm, which was
measured in an 85-mm long Yellow Perch from Cross Lake. The arithmetic mean concentration
of the 120 Yellow Perch analysed was 0.05 ppm.
6.6.2.5 Lake Sturgeon
Of the 34 Lake Sturgeon analyzed for mercury, 32 were captured from the Churchill River. The
single Lake Sturgeon caught in each of the lower Nelson River and the Hayes River contained
concentrations of 0.18 ppm (fork length 690 mm) and 0.19 ppm (fork length 664 mm),
respectively. These values fitted well with the distributions of fish lengths and mercury
concentrations obtained from the larger sample of Lake Sturgeon from the Churchill River.
Mercury concentrations ranged from 0.03 ppm for a 221 mm long, un-aged fish to 0.65 ppm for
a 1,207 mm long, un-aged fish (both collected from the Churchill River). The arithmetic mean
concentration of all 34 Lake Sturgeon was 0.16 ppm.
CAMPP Three Year Summary Report Volume 9
6-138
6.6.3 Comparisons Between Regions and Between On-System and Off-System Waterbodies
Comparisons of fish mercury concentrations between CAMPP regions or between on- and off-
system waterbodies indicated some general spatial patterns, even with the single year of data
collected under CAMPP. The following provides an overview of spatial differences observed
with the CAMPP fish mercury dataset.
6.6.3.1 Comparisons Between Regions
The seven CAMPP regions can be broadly grouped into four classes in terms of fish mercury
concentrations. This classification is mainly based on data collected for Northern Pike and
Walleye from on-system waterbodies. Regions with relatively low fish mercury concentrations in
2009-2010 were the Saskatchewan River and the lower and upper Nelson River. Higher mercury
concentrations were found in fish from the Winnipeg River Region, the Lower and Upper
Churchill River Regions, and the CRD Region. The inclusion of the Lower Churchill River
Region in the latter group is primarily a function of data from one lake (Northern Indian Lake).
Mercury concentrations in all species from Northern Indian Lake, including Lake Whitefish and
Yellow Perch, consistently ranked among the highest of all waterbodies sampled under CAMPP
(Figures 6.6-2 to 6.6-5).
The highest mercury concentrations for both Walleye and Northern Pike were observed in the
Winnipeg River Region (Figures 6.6-3 and 6.6-4). The highest mean concentration measured for
Northern Pike in any of the CAMPP waterbodies occurred in fish collected from the off-system
Manigotagan Lake (see below). Another region in which relatively high mercury concentrations
were observed in Northern Pike and Walleye was the CRD Region. Concentrations in these two
piscivors from the two on-system waterbodies Rat and Threepoint lakes, consistently ranked
second or third highest among all waterbodies (Figures 6.6-3 and 6.6-4).
Most Northern Pike and Walleye populations from on-system lakes of the Saskatchewan River
and Upper Nelson River Regions contained significantly lower mercury concentrations
compared to on-system lakes of the lower Nelson River (Figures 6.6-3 and 6.6-4). However, the
relatively high mercury concentrations in the two piscivores from the off-system lakes of the
former two Regions, Cormorant and Setting lakes (see below), balanced the overall mercury
concentration in the comparison of the three Regions.
Mercury concentrations in Yellow Perch from two of the three waterbodies sampled in the
Saskatchewan River Region and three of the four waterbodies sampled in the Upper Nelson
CAMPP Three Year Summary Report Volume 9
6-139
River Region, indicated that Yellow Perch from the latter Region had significantly higher
concentrations (Figure 6.6-5).
Significant differences in mercury concentrations of large-bodied fish species also existed
between the off-system waterbodies of the different regions. Mercury concentrations in Northern
Pike from Manigotagan Lake were significantly higher than in Northern Pike from off-system
lakes of all other regions (Figure 6.6-3). Walleye from Manigotagan and Granville lakes had
similar mercury concentrations, which were significantly higher compared to those in their
conspecifics from the remaining off-system lakes (Figure 6.6-4). All three large-bodied species
from Gauer and Granville lakes, the two off-system lakes from the Lower and Upper Churchill
River regions, respectively, had significantly different mercury concentrations, with
concentrations in fish from Gauer Lake being lower (Figures 6.6-2 to 6.6-4).
6.6.3.2 Comparison Between On- and Off-System Waterbodies
Differences in mercury concentrations of fish between on-system and off-system waterbodies
within regions were not consistent. Mean mercury concentrations in fish from the off-system
lakes in the Lower Churchill River and Churchill River Diversion regions (Gauer and Leftrook
lakes, respectively) were consistently (i.e., for all three large-bodied species) and significantly
lower than concentrations measured in the same species from on-system lakes in their respective
regions (Figures 6.6-2 to 6.6-4). In contrast, mean concentrations in Walleye, Northern Pike, and
Yellow Perch from the off-system lake (Cormorant Lake) were significantly higher than their
conspecifics from the on-system waterbody Cedar Lake-SE) in the Saskatchewan River Region
(Figures 6.6-3 to 6.6-5). Similarly, mercury concentrations in Walleye and Northern Pike from
the off-system lake in the Upper Nelson River Region (Setting Lake) were significantly higher
than those in their conspecifics from all (Northern Pike) or most (Walleye) of the on-system
lakes of the Region. Finally, Northern Pike from the off-system Manigotagan Lake had
significantly higher mercury concentrations than Northern Pike from the Winnipeg River at
Pointe du Bois, whereas the reverse relationship was observed in Walleye from the same two
waterbodies.
Comparisons between fish mercury concentrations for on- and off-system river sites (i.e., the
Hayes River compared to the lower Nelson and lower Churchill rivers) also yielded inconsistent
differences, depending on the species. Specifically, concentrations in Northern Pike were lower
(Figure 6.6-3), concentrations in Walleye were higher (Figure 6.6-4), and concentrations in Lake
Whitefish (Figure 6.6-2) were similar in the Hayes River relative to either the lower Churchill or
lower Nelson rivers.
CAMPP Three Year Summary Report Volume 9
6-140
In addition to the significant differences in fish mercury concentrations of some fish species
between on-system and off-system waterbodies for some regions, concentrations in other species
or for other regions were similar between the two types of waterbodies. Specifically,
concentrations of mercury in all fish species collected from on-system lakes in the Lower Nelson
River Region and the Upper Churchill River Region were not significantly different from the off-
system waterbodies sampled in those regions. In addition, mercury concentrations in Yellow
Perch from Setting Lake were intermediate and statistically similar to their conspecifics from the
two on-system lakes in the same region (Little Playgreen and Cross lakes; Figure 6.6-5).
Similarly, Lake Whitefish from Setting Lake had mercury concentrations not significantly
different from Lake Whitefish in the two on-system lakes with available data (Playgreen and
Little Playgreen lakes; Figure 6.6-2).
6.6.4 Comparison of Mercury Concentrations to Consumption Guidelines
Length-standardized and arithmetic mean mercury concentrations of all Lake Whitefish and
Yellow Perch populations sampled under CAMPP in 2009 and 2010 were substantially below
the 0.2 ppm, a level commonly accepted as a safe consumption limit for people eating large
quantities of fish domestically (see section 4.8.2.3). In fact, with the exception of Lake Whitefish
from Northern Indian Lake (length-standardized concentration of 0.11 ppm), mean mercury
concentrations of both Lake Whitefish and Yellow Perch were less than 0.10 ppm in all
waterbodies (Figures 6.6-2 and 6.6-5) . Moreover, mean mercury concentrations in Yellow Perch
from Cedar and Leftrook lakes and Lake Whitefish from Area 6 of Southern Indian Lake,
Playgreen Lake ,and Leftrook Lake were below the Canadian and Manitoba tissue residue
guidelines of 0.033 ppm methylmercury for the protection of wildlife consumers of aquatic biota
(Canadian Council of Ministers of the Environment [CCME] 1999; updated to 2013; MWS
2011). With just under 0.16 ppm, the arithmetic mean mercury concentration of all Lake
Sturgeon analyzed for mercury in 2009/10 was also well below the 0.2 ppm guideline for human
consumption.
In contrast to the above two species, length-standardized concentrations of the majority of the 24
Northern Pike and Walleye populations sampled under CAMPP exceeded the 0.2 ppm
guideline; only Northern Pike and Walleye from Cedar-SE and Cross lakes, and Walleye from
the Saskatchewan River (i.e., Cedar Lake West), and Playgreen and Split lakes contained
concentrations below 0.2 ppm (Figures 6.6-3 and 6.6-4). All Northern Pike and Walleye
populations contained mean mercury concentrations above the tissue residue guideline of 0.033
ppm methylmercury for the protection of wildlife consumers of aquatic biota (Canadian Council
of Ministers of the Environment [CCME] 1999; updated to 2013; MWS 2011). While CAMPP
monitors for total mercury rather than methylmercury in fish muscle, the vast majority of
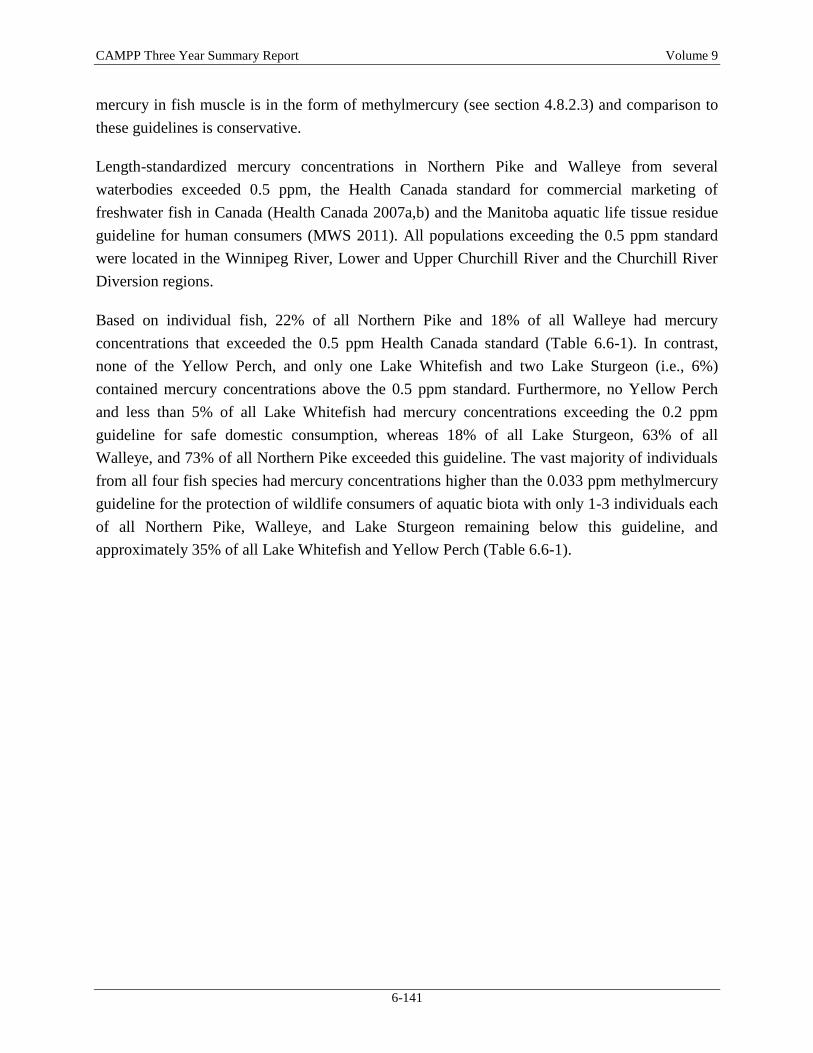
CAMPP Three Year Summary Report Volume 9
6-141
mercury in fish muscle is in the form of methylmercury (see section 4.8.2.3) and comparison to
these guidelines is conservative.
Length-standardized mercury concentrations in Northern Pike and Walleye from several
waterbodies exceeded 0.5 ppm, the Health Canada standard for commercial marketing of
freshwater fish in Canada (Health Canada 2007a,b) and the Manitoba aquatic life tissue residue
guideline for human consumers (MWS 2011). All populations exceeding the 0.5 ppm standard
were located in the Winnipeg River, Lower and Upper Churchill River and the Churchill River
Diversion regions.
Based on individual fish, 22% of all Northern Pike and 18% of all Walleye had mercury
concentrations that exceeded the 0.5 ppm Health Canada standard (Table 6.6-1). In contrast,
none of the Yellow Perch, and only one Lake Whitefish and two Lake Sturgeon (i.e., 6%)
contained mercury concentrations above the 0.5 ppm standard. Furthermore, no Yellow Perch
and less than 5% of all Lake Whitefish had mercury concentrations exceeding the 0.2 ppm
guideline for safe domestic consumption, whereas 18% of all Lake Sturgeon, 63% of all
Walleye, and 73% of all Northern Pike exceeded this guideline. The vast majority of individuals
from all four fish species had mercury concentrations higher than the 0.033 ppm methylmercury
guideline for the protection of wildlife consumers of aquatic biota with only 1-3 individuals each
of all Northern Pike, Walleye, and Lake Sturgeon remaining below this guideline, and
approximately 35% of all Lake Whitefish and Yellow Perch (Table 6.6-1).
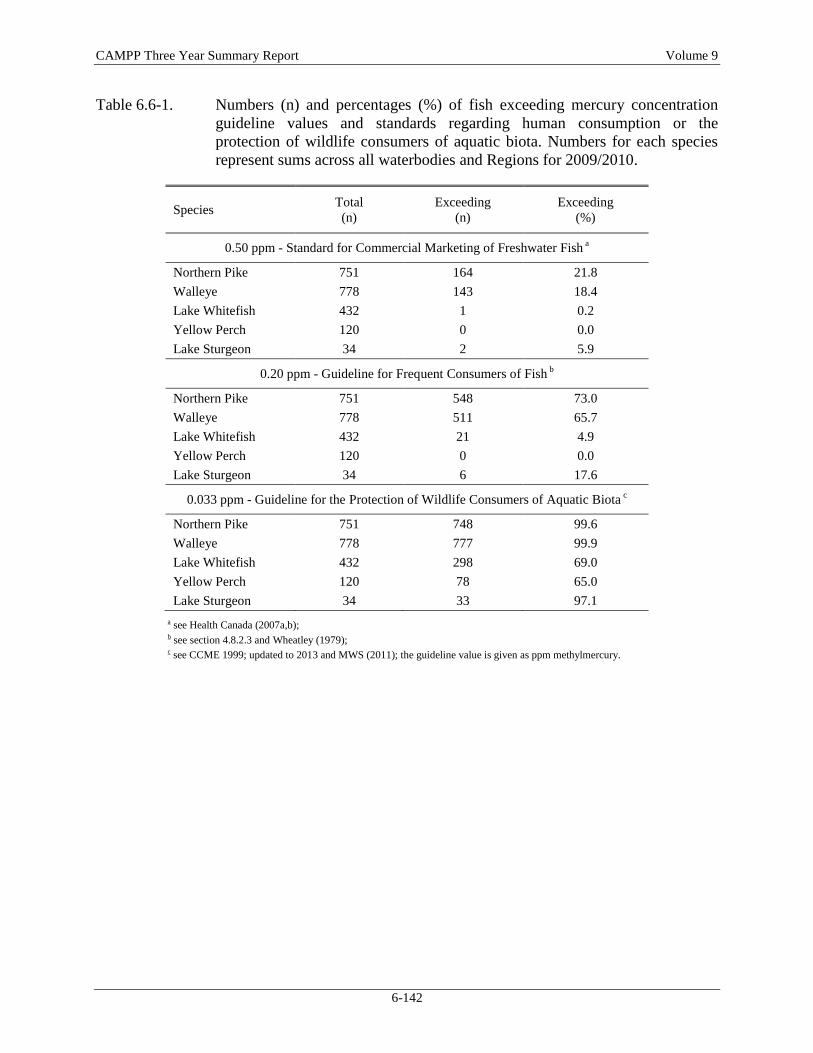
CAMPP Three Year Summary Report Volume 9
6-142
Table 6.6-1. Numbers (n) and percentages (%) of fish exceeding mercury concentration
guideline values and standards regarding human consumption or the
protection of wildlife consumers of aquatic biota. Numbers for each species
represent sums across all waterbodies and Regions for 2009/2010.
Species Total
(n)
Exceeding
(n)
Exceeding
(%)
0.50 ppm - Standard for Commercial Marketing of Freshwater Fish a
Northern Pike 751 164 21.8
Walleye 778 143 18.4
Lake Whitefish 432 1 0.2
Yellow Perch 120 0 0.0
Lake Sturgeon 34 2 5.9
0.20 ppm - Guideline for Frequent Consumers of Fish b
Northern Pike 751 548 73.0
Walleye 778 511 65.7
Lake Whitefish 432 21 4.9
Yellow Perch 120 0 0.0
Lake Sturgeon 34 6 17.6
0.033 ppm - Guideline for the Protection of Wildlife Consumers of Aquatic Biota c
Northern Pike 751 748 99.6
Walleye 778 777 99.9
Lake Whitefish 432 298 69.0
Yellow Perch 120 78 65.0
Lake Sturgeon 34 33 97.1
a see Health Canada (2007a,b); b see section 4.8.2.3 and Wheatley (1979); c see CCME 1999; updated to 2013 and MWS (2011); the guideline value is given as ppm methylmercury.
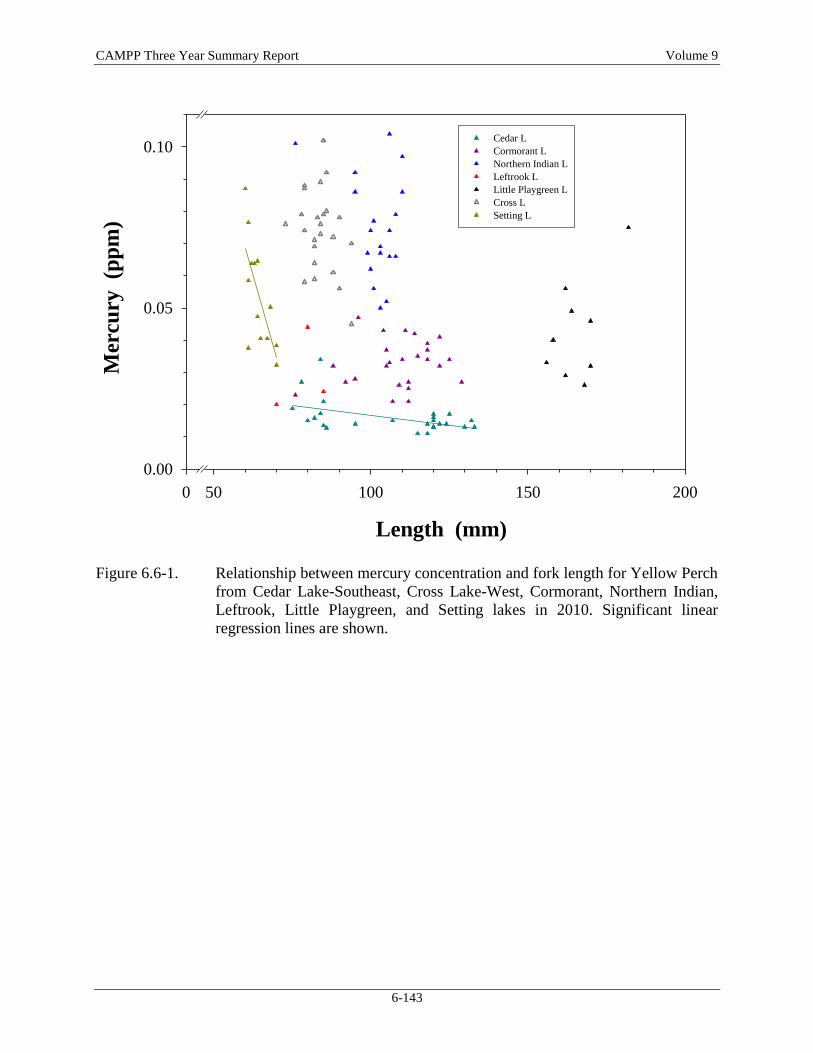
CAMPP Three Year Summary Report Volume 9
6-143
Length (mm)
0 50 100 150 200
Mer
cury
(p
pm
)
0.00
0.05
0.10Cedar L
Cormorant L
Northern Indian L
Leftrook L
Little Playgreen L
Cross L
Setting L
Figure 6.6-1. Relationship between mercury concentration and fork length for Yellow Perch
from Cedar Lake-Southeast, Cross Lake-West, Cormorant, Northern Indian,
Leftrook, Little Playgreen, and Setting lakes in 2010. Significant linear
regression lines are shown.
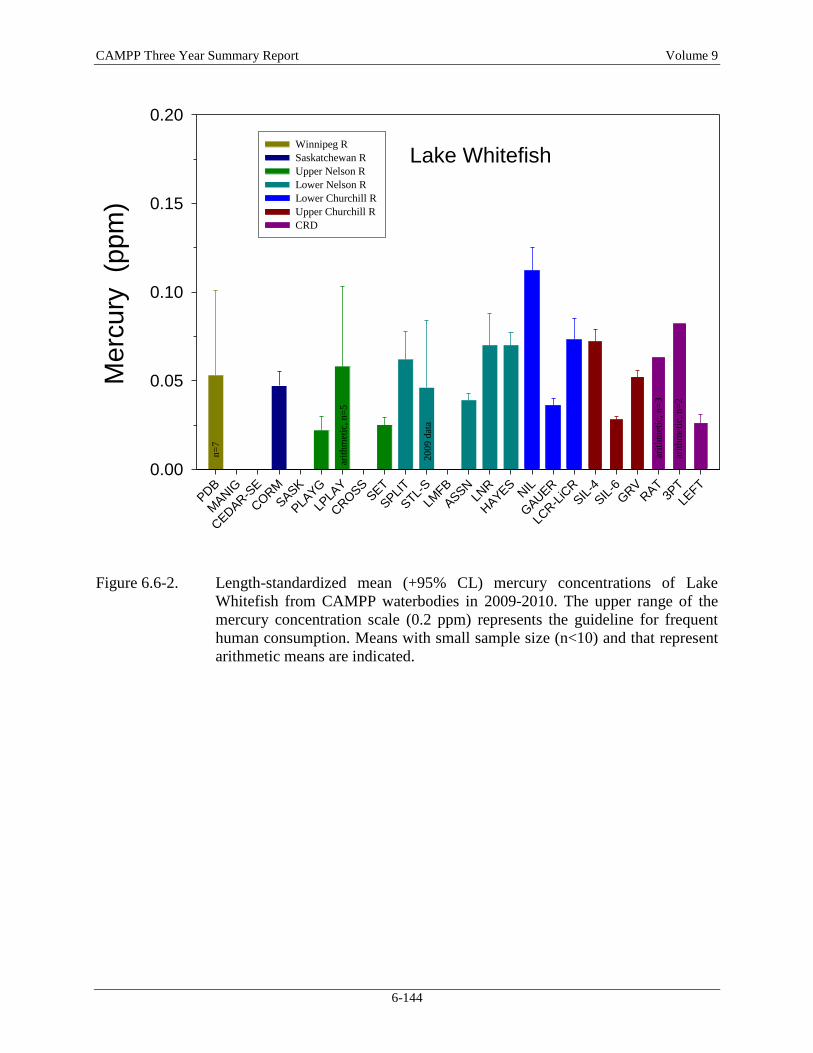
CAMPP Three Year Summary Report Volume 9
6-144
Lake Whitefish
PDB
MAN
IG
CED
AR-S
E
CORM
SASK
PLAYG
LPLA
Y
CROSS
SET
SPLIT
STL-S
LMFB
ASSNLN
R
HAYES
NIL
GAU
ER
LCR-L
iCR
SIL-4
SIL-6
GRV
RAT
3PT
LEFT
Me
rcu
ry (p
pm
)
0.00
0.05
0.10
0.15
0.20
Winnipeg R
Saskatchewan R
Upper Nelson R
Lower Nelson R
Lower Churchill R
Upper Churchill R
CRD
20
09
dat
a
arit
hm
etic
, n=
3
arit
hm
etic
, n=
2
n=
7
arit
hm
etic
, n=
5
Figure 6.6-2. Length-standardized mean (+95% CL) mercury concentrations of Lake
Whitefish from CAMPP waterbodies in 2009-2010. The upper range of the
mercury concentration scale (0.2 ppm) represents the guideline for frequent
human consumption. Means with small sample size (n<10) and that represent
arithmetic means are indicated.
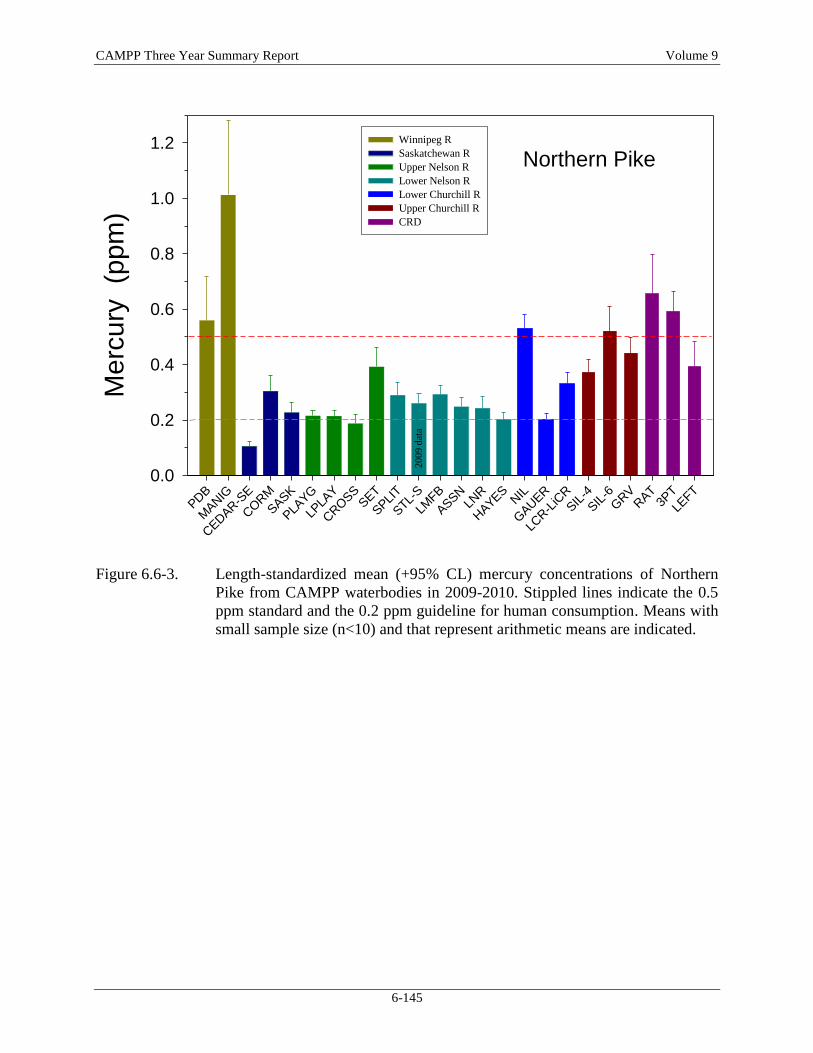
CAMPP Three Year Summary Report Volume 9
6-145
Northern Pike
PDB
MAN
IG
CED
AR-S
E
CORM
SASK
PLAYG
LPLA
Y
CROSS
SET
SPLIT
STL-S
LMFB
ASSNLN
R
HAYES
NIL
GAU
ER
LCR-L
iCR
SIL-4
SIL-6
GRV
RAT
3PT
LEFT
Me
rcu
ry (p
pm
)
0.0
0.2
0.4
0.6
0.8
1.0
1.2 Winnipeg R
Saskatchewan R
Upper Nelson R
Lower Nelson R
Lower Churchill R
Upper Churchill R
CRD
200
9 d
ata
Figure 6.6-3. Length-standardized mean (+95% CL) mercury concentrations of Northern
Pike from CAMPP waterbodies in 2009-2010. Stippled lines indicate the 0.5
ppm standard and the 0.2 ppm guideline for human consumption. Means with
small sample size (n<10) and that represent arithmetic means are indicated.
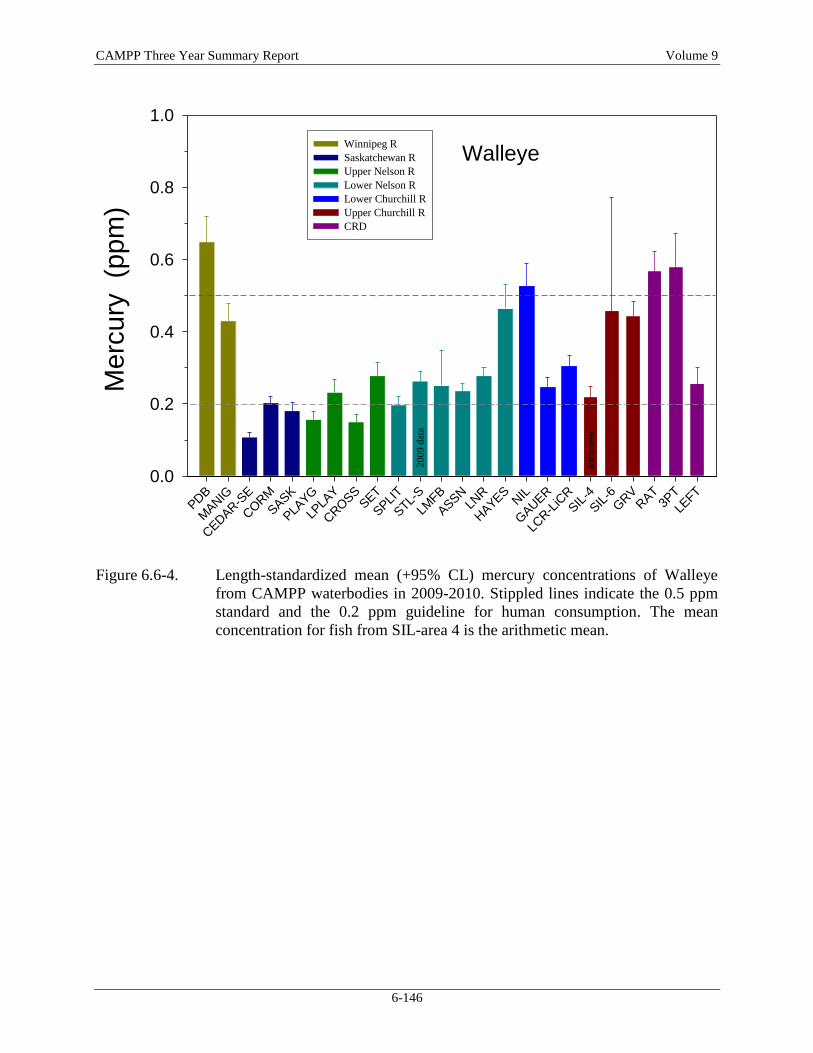
CAMPP Three Year Summary Report Volume 9
6-146
Walleye
PDB
MAN
IG
CED
AR-S
E
CORM
SASK
PLAYG
LPLA
Y
CROSS
SET
SPLIT
STL-S
LMFB
ASSNLN
R
HAYES
NIL
GAU
ER
LCR-L
iCR
SIL-4
SIL-6
GRV
RAT
3PT
LEFT
Me
rcu
ry (p
pm
)
0.0
0.2
0.4
0.6
0.8
1.0
Winnipeg R
Saskatchewan R
Upper Nelson R
Lower Nelson R
Lower Churchill R
Upper Churchill R
CRD
200
9 d
ata
arit
hm
etic
Figure 6.6-4. Length-standardized mean (+95% CL) mercury concentrations of Walleye
from CAMPP waterbodies in 2009-2010. Stippled lines indicate the 0.5 ppm
standard and the 0.2 ppm guideline for human consumption. The mean
concentration for fish from SIL-area 4 is the arithmetic mean.
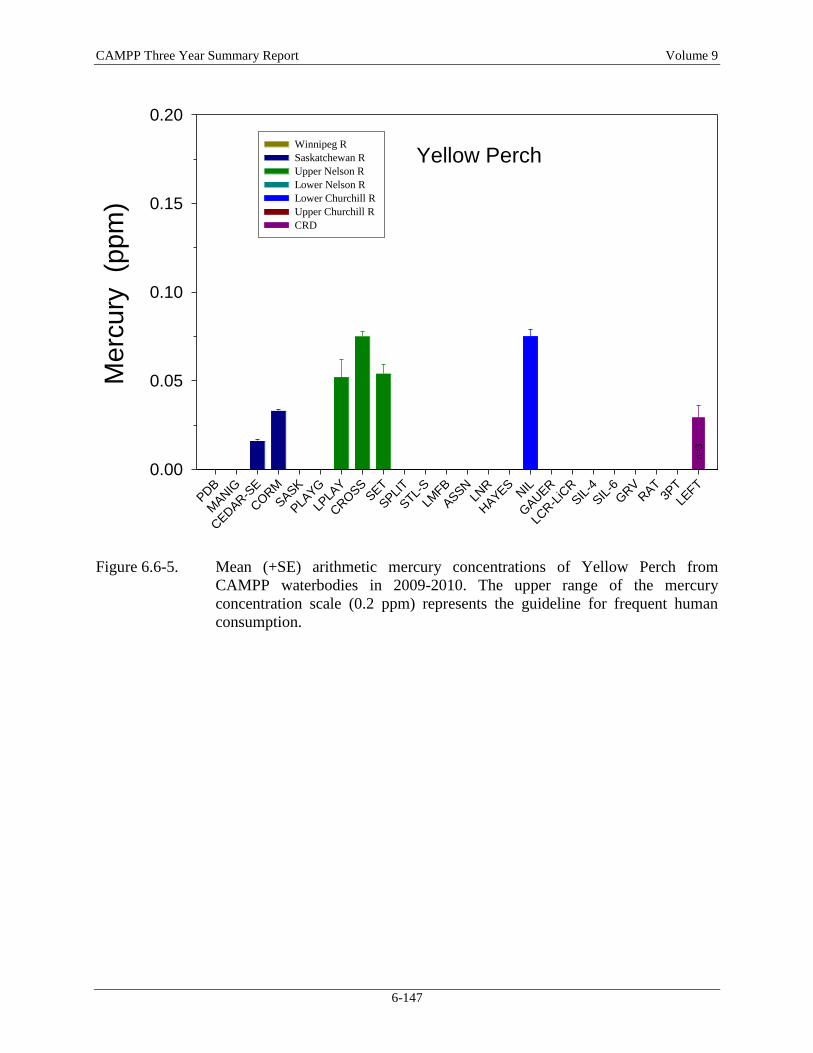
CAMPP Three Year Summary Report Volume 9
6-147
Yellow Perch
PDB
MAN
IG
CED
AR-S
E
CORM
SASK
PLAYG
LPLA
Y
CROSS
SET
SPLIT
STL-S
LMFB
ASSNLN
R
HAYES
NIL
GAU
ER
LCR-L
iCR
SIL-4
SIL-6
GRV
RAT
3PT
LEFT
Me
rcu
ry (p
pm
)
0.00
0.05
0.10
0.15
0.20
Winnipeg R
Saskatchewan R
Upper Nelson R
Lower Nelson R
Lower Churchill R
Upper Churchill R
CRD
n=
3
Figure 6.6-5. Mean (+SE) arithmetic mercury concentrations of Yellow Perch from
CAMPP waterbodies in 2009-2010. The upper range of the mercury
concentration scale (0.2 ppm) represents the guideline for frequent human
consumption.

SECTION 7: REFERENCES

CAMPP Three Year Summary Report Volume 9
7-1
7.0 REFERENCES
Baird and Stantec. 2000. Lake Winnipeg shoreline erosion study. A report prepared by W.F.
Baird & Associates Coastal Engineers Ltd. and Stantec Consulting Ltd. 2000. W.F. Baird
& Associates Coastal Engineers Ltd., Oakville, ON.
Barbour, M.T., J.B. Stribling, and J.R. Karr. 1995. Multimetric approach for establishing
biocriteria and measuring biological condition. In W.S. Davis and T.P. Simon (Eds.),
Biolgical Assessment and Criteria: Tools for Water Resource Planning and Decision
Making. Lewis, Boca Raton, FL. 63-80.
Baty, F. and M.L. Delignette-Muller. 2011. nlstools: tools for nonlinear regression diagnostics. R
package version 0.0-11.
Beck, A.E. 1977. An inventory and assessment of the resources of the Hayes River. Manitoba
Rep. No. 77-3. Dept. of Mines, Resources and Environmental Management. 118 pp.
Beke, G.J., H. Veldhuis, and J. Thie. 1973. Bio-physical land inventory of the Churchill-Nelson
rivers study area north-central Manitoba. The Lake Winnipeg, Churchill and Nelson
Rivers Study Board technical report, Appendix 3, Section A. 167 pp.
Bodaly, R.A., N.E. Strange, R.E. Hecky, R.J.P. Fudge, and C. Anema. 1987. Mercury content of
soil, lake sediment, net plankton, vegetation, and forage fish in the area of the Churchill
River Diversion, Manitoba, 1981-82. Canadian Data Report of Fisheries and Aquatic
Sciences 610, 30 pp.
Bodaly, R.A., W.A. Jansen, A.R. Majewski, R.J.P. Fudge, N.E. Strange, A.J. Derksen, and D.J.
Green. 2007. Post-impoundment time course of elevated mercury concentrations in fish
in hydroelectric reservoirs of northern Manitoba, Canada. Arch. Environ. Contam.
Toxicol. 53: 379-389.
Bourne, A., N. Armstrong, and G. Jones. 2002. A preliminary estimate of total nitrogen and total
phosphorus loading in streams in Manitoba, Canada. Manitoba Conservation Rep. #
2002-04. Manitoba Conservation, Winnipeg, MB.
Braune, B. M. 1987. Mercury accumulation in relation to size and age of Atlantic herring
(Clupea harengus harengus) from the southwestern bay of Fundy, Canada. Arch.
Environ. Contam. Toxicol. 16:311-320.
British Columbia Ministry of Environment, Lands, and Parks (BCMELP). 1998. Guidelines for
interpreting water quality data, version 1. May 1998. Prepared for the Land Use Task
Force Resource Inventory Committee.
Brunskill, G.J., S.E.M. Elliott, and P. Campbell. 1980. Morphometry, hydrology, and watershed
data pertinent to the limnology of Lake Winnipeg. Canadian Manuscript Report of
Fisheries and Aquatic Sciences No. 1556. 32 pp.
Canadian Council of Ministers of the Environment (CCME). 1999. Canadian environmental
quality guidelines. Canadian Council of Ministers of the Environment, Winnipeg, MB.
Updated to 2013.
CAMPP Three Year Summary Report Volume 9
7-2
Canadian Council of Resource and Environment Ministers (CCREM). 1987. Canadian water
quality guidelines. Canadian Council of Resource and Environment Ministers, Winnipeg,
MB.
Carlson, R. 1977. A trophic state index for lakes. Limnol. Oceanogr. 22: 361-362.
Centre for Topographic Information. 2010. National Topographic Database (NTDB) [computer
file]. Government of Canada, Natural Resources Canada, Earth Sciences Sector
(GeoGratis), Sherbrooke, QC. Available:
http://geogratis.cgdi.gc.ca/geogratis/en/index.html. (November 2012).
Chammartin, T. 2008. Sagkeeng First Nation. Available: http://www.first-nations-art-
store.com/sagkeeng-fort-alexander-first-nation.html. (November 2012).
Cherepak, B.C. 1990. The post-flood bathymetry of Split and Stephens Lakes, 1989. Manitoba
Department of Natural Resources. Fisheries Branch MS Report No. 90-08. 78 pp.
Christoffersen, J.E. 2005. Geological report on the Assean Lake gold property, Manitoba,
Canada. A report prepared for Canadian Gold Hunter Corp. 41 pp. Available:
http://www.ngexresources.com/i/pdf/AsseanLakeTechnicalReport.pdf. (November 2012).
Clifford, H.F. 1991. Aquatic invertebrates of Alberta. The University of Alberta Press,
Edmonton, AB. 538 pp.
Cooley, P. and J. Macdonald. 2008. Lake Sturgeon habitat on the Churchill River near Island
Falls Hydroelectric Station. A report prepared for Saskatchewan Power Corporation by
North/South Consultants Inc. 85 pp.
Depew, D.C., N.M. Burgess, and L. Campbell 2013. Modelling mercury concentrations in prey
fish: derivation of a national-scale common indicator of dietary mercury exposure for
piscivorous fish and wildlife. Env. Poll. 176: 234-243.
Dodds, W.K., J.R. Jones, and E.B. Welch. 1998. Suggested classification of stream trophic state:
distributions of temperate stream types by chlorophyll, total nitrogen, and phosphorus.
Wat. Res. 32: 1455-1462.
Environment Canada and Manitoba Water Stewardship (EC and MWS). 2011. State of Lake
Winnipeg: 1999 to 2007. June, 2011. 209 pp.
Environment Canada (EC). 2010. Pulp and paper environmental effects monitoring (EEM)
technical guidance document. Government of Canada. 490 pp.
Environment Canada (EC). 2012a. Metal mining technical guidance for environmental effects
monitoring. Government of Canada. 550 pp.
Environment Canada (EC). 2012b. Canadian Aquatic Biomonitoring Network (CABIN):
Wadeable streams field manual. Government of Canada. 52 pp.
Essington, T. E., and J. N. Houser. 2003. The effect of whole lake nutrient enrichment on
mercury concentration in age-1 yellow perch. Transactions of the American Fisheries
Society 132:57-68.
Fausch, K.D., J. Lyons, J.R. Karr, and P.L. Angermeier. 1990. Fish communities as indicators of
environmental degradation. Pages 123-144 in S.M. Adams, editor. Biological indicators
of stress in fish. American Fisheries Society Symposium 8, Bethesda, MD.
CAMPP Three Year Summary Report Volume 9
7-3
Findlay, D.L. and H.J. Kling. Undated. Protocols for measuring biodiversity: phytoplankton in
fresh water. Department of Fisheries and Oceans. Winnipeg, MB.
Fisheries and Oceans Canada (DFO). 2008. Lake of the Woods. Canadian Hydrographic Service,
digital charts. BSB V4. CEN12.
Fisheries and Oceans Canada (DFO). 2009. Lakes and Rivers in Manitoba and Saskatchewan.
Canadian Hydrographic Service, digital charts. BSB V4. CEN13.
Fitzjohn, D. 1985. Caribou (Quesnel) – Manigotagan lakes creel census, 1984. Manitoba
Department of Natural Resources, Fisheries Branch. 39 pp.
Ford, E. 1933. An account of the herring investigations conducted at Plymouth during the years
from 1924-1933. Journal of the Marine Biology Association (U.K.) 19: 305-384.
Fore, L.S., J.R. Karr, and L.L. Conquest. 1994. Statistical properties of an index of biotic
integrity used to evaluate water resources. Canadian Journal of Fisheries and Aquatic
Sciences 51: 1077-1087.
Gallucci, V.F. and T. Quinn II. 1979. Reparameterizing, fitting, and testing a simple growth
model. Transactions of the American Fisheries Society. 108: 14-25.
Green, D.J. 1986. Summary of fish mercury data collected from lakes on the Rat Burntwood and
Nelson River systems, 1983-1985. Manitoba Natural Resources, Fisheries Branch MS
Report No. 86 06. 359 pp.
Health Canada. 2007a. Human health risk assessment of mercury in fish and health benefits of
fish consumption. Health Canada: Bureau of Chemical Safety, Food Directorate, Health
Products and Food Branch, Ottawa, ON, 48 pp.
Health Canada. 2007b. Updating the existing risk management strategy for mercury in fish.
Health Canada: Bureau of Chemical Safety, Food Directorate, Health Products and Food
Branch, Ottawa, ON, 30 pp.
Heilman-Ternier, J. and V.L. Harms. 1975. Plant ecology - taxonomy. Churchill River Study
Final Report 5, Saskatoon, SK. 126 pp.
Holm, J., V.L. Richardson, and R.L. Bretecher. 2003. Results of index gillnetting studies
conducted in Assean Lake, Manitoba, summer 2002. Report # 02-05. North/South
Consultants Inc., Winnipeg, MB. 80 pp.
Hutchinson, G.E. 1957. A treatise on limnology v.1. Geography, Physics and Chemistry. Wiley.
1015 pp.
Integrated Taxonomic Information System (ITIS). 2013. Available: http://www.itis.gov.
(September 2013).
Jackson, T.A. 1991. Biological and environmental control of mercury accumulation by fish in
lakes and reservoirs of northern Manitoba, Canada. Can. J. Fish. Aquat. Sci. 48:
2449-2470.
Jansen, W. 2009. Fish Quality Baseline Monitoring: Fish Mercury Concentrations in the
Wuskwatim GS Study Area, 2007. A report prepared for Wuskwatim Power Limited
Partnership by North/South Consultants Inc., Report # 09-13, 33 pp.
CAMPP Three Year Summary Report Volume 9
7-4
Jansen, W. 2010a. Mercury in fish from six northern Manitoba lakes and reservoirs: results from
2007-2008 sampling and an update of time trends of monitoring data. Report prepared for
Manitoba Hydro by North/South Consultants Inc. 46 pp.
Jansen, W. 2010b. Fish mercury concentrations in the Keeyask study area, 2009. A report
prepared for Manitoba Hydro by North/South Consultants Inc., Report # 09-05, 32 pp.
Jansen, W. and N. Strange. 2007a. Mercury in fish from northern Manitoba reservoirs: results
from 1999-2005 sampling and a summary of all monitoring data for 1970-2005. A report
prepared for Manitoba Hydro by North/South Consultants Inc., 102 pp.
Jansen, W. and N. Strange. 2007b. Fish mercury concentrations from the Keeyask Project study
area for 1999-2005. Report (# 05-04) prepared for Manitoba Hydro by North/South
Consultants Inc., 152 pp.
Jansen, W. and N. Strange. 2009. Fish Quality Baseline Monitoring: Fish Mercury
Concentrations in Nine Lakes Sampled During the Wuskwatim Generation Project
Environmental Studies, 2001-2005. A draft report prepared for Wuskwatim Power
Limited Partnership by North/South Consultants Inc., Report # 09-11, 61 pp.
Jones, G. and N. Armstrong. 2001. Long-term trends in total nitrogen and total phosphorus
concentrations in Manitoba streams. Manitoba Conservation Rep. No. 2001-07. Manitoba
Conservation, Winnipeg, MB.
Karr, J.R. 1981. Assessment of biotic integrity using fish communities. Fisheries. 6:21-27.
Karr, J.R., K.D. Fausch, P.L. Angermeier, P.R. Yant, and I.J. Schlosser. 1986. Assessing
biological integrity in running water: a method and its rationale. Illinois Natural History
Survey Special Publication Number 5, Champaign, IL.
Lake Winnipeg Implementation Committee. 2005. Restoring the health of Lake Winnipeg:
Canada’s sixth great lake. Lake Winnipeg Implementation Committee, Winnipeg, MB.
56 pp.
Lake Winnipeg, Churchill and Nelson Rivers Study Board (LWCNRSB). 1975. Lake Winnipeg,
Churchill and Nelson Rivers Study Board: technical report. Lake Winnipeg, Churchill
and Nelson Rivers Study Board, Winnipeg, MB. 425 pp.
Larter, J.L., P.M. Cooley and T. Sutton. 2010. Depth, substratum, and aquatic macrophyte
distributions: Lamprey Rapids to Slave Falls GS tailrace. A report prepared for Manitoba
Hydro by North/South Consultants Inc., Winnipeg, Manitoba. 51 pp. Report # 07-02.
MacKay, G.H. 1992. An evaluation of the impacts on water levels and flows within the
Pukatawagan Resource Area caused by Manitoba Hydro actions. G.H. MacKay and
Associates, Winnipeg, MB.
Magurran, A.E. 2004. Measuring biological diversity. Blackwell Science Ltd., Oxford, U.K. 215
pp.
Mandaville, S.M. 2002. Benthic macroinvertebrates in freshwaters – taxa tolerance values,
metrics, and protocols. Project H-1. Soil and Water Conservation Society of Metro
Halifax. 48p. + Appendices.
Manitoba Conservation. 2003a. Threepoint Lake angling map.
CAMPP Three Year Summary Report Volume 9
7-5
Manitoba Conservation. 2003b. Split Lake angling map.
Manitoba Conservation. 2006. Cormorant Lake angling map.
Manitoba Conservation. 2007a. Manigotagan Lake angling map.
Manitoba Conservation. 2007b. Rat Lake angling map.
Manitoba Conservation. 2007c. Setting Lake angling map.
Manitoba Conservation and Water Stewardship (MCWS). 2012. The Coordinated Aquatic
Monitoring Program website. Available: http://campmb.com. (November 2012).
Manitoba Hydro and Nisichawayasihk Cree Nation. 2003. Wuskwatim Generation Project:
Environmental Impact Statement. Volumes 1-10. Manitoba Hydro, Winnipeg, MB.
Manitoba Hydro and the Town of Churchill. 1997. Lower Churchill River water level
enhancement weir project. Manitoba Hydro, Winnipeg, MB, and the Town of Churchill,
Churchill, MB.
Manitoba Innovation, Energy and Mines (MIEM). 2012. Manitoba mining through the centuries.
Available: http://www.manitoba.ca/iem/mrd/min-ed/minfacts/mbhistory/aroundmb.html.
(November 2012).
Manitoba Natural Resources. 1990. Gauer Lake angling map.
Manitoba Water Stewardship (MWS). 2011. Manitoba water quality standards, objectives, and
guidelines. Water Science and Management Branch, MWS Report 2011-01, November
28, 2011. 67 pp.
McTavish, W.B. 1953. A biological survey of Manigotagan Lake. Manitoba Department of
Mines and Natural Resources, Game and Fisheries Branch. 19 pp.
Meays, C. and R. Nordin. 2013. Ambient water quality guidelines for sulphate. Technical
Appendix: Update April 2013. Water Protection & Sustainability Branch Environmental
Sustainability and Strategic Policy Division, British Columbia Ministry of Environment
(BCMOE).
Merritt, R.W. and Cummins, K.W. 1996. An introduction to the aquatic insects of North
America, 3rd Edition. Kendal/Hunt Publishing Co., Dubuque, IA. 862 pp.
MIEM and the Tantalum Mining Corporation of Canada Limited (TANCO). 2012. Commodity
summaries: cesium, tantalum, and spodumene. Available:
http://www.manitoba.ca/iem/mrd/busdev/industrial/cesium.html. (November 2012).
Ministry of Health. 2005. Draft guidelines for drinking-water quality management for New
Zealand 2005, 2nd
edition. Wellington: Ministry of Health.
Minns, C.K., V.W. Cairns, R.G. Randall, and J.E. Moore. 1994. An index of biotic integrity
(IBI) for fish assemblages in the littoral zone of Great Lakes’ areas of concern. Canadian
Journal of Fisheries and Aquatic Sciences. 51: 1804-1822.
Mitchell, P. and E.E. Prepas. 1990. Atlas of Alberta Lakes. The University of Alberta Press,
Edmonton, AB. 675 pp.
CAMPP Three Year Summary Report Volume 9
7-6
Murray, L. and M.A. Gillespie. 2011. Lake Sturgeon inventory and habitat assessment of the
Winnipeg River from McArthur to Pine Falls, 2010. A report prepared for Manitoba
Hydro by North/South Consultants Inc., Winnipeg, Manitoba. 52 pp. Report # 10-04.
Natural Resources Canada (NRC). 2011. Canvec Edition 8, 2011.04.18 (www.geogratis.ca)
Natural Resources Land Cover (NRLC). 2000. Circa 2000 Vector (www.geobase.ca)
Nielsen, E. 1998. Lake Winnipeg coastal submergence over the last three centuries. Journal of
Paleolimnology 19(3): 335-342.
Niemela, S., E. Pearson, T.P. Simon, R.M. Goldstein, and P.A. Bailey. 1999. Development of an
index of biotic integrity for the species-depauperate Lake Agassiz Plain Ecoregion, North
Dakota and Minnesota. Pages 339-366 in T.P. Simon, editor. Assessing the sustainability
and biological integrity of water resource quality using fish communities. CRC Press,
Boca Raton, FL.
North/South Consultants Inc. (NSC). 2006. Literature review related to setting nutrient
objectives for Lake Winnipeg. North/South Consultants Inc., Winnipeg, MB. 186 pp.
Nürnberg. 1996. Trophic state in clear and colored, soft- and hardwater lakes with special
consideration of nutrients, anoxia, phytoplankton and fish. Lake Reservoir Manage. 12:
432-447.
Ogle, D.H. 2012a. FSA: fisheries stock analysis. R package version 0.2-8.
Ogle, D.H. 2012b. NCStats: helper functions for statistics at Northland College. R package
version 0.2-8.
Ogle, D.H. 2013. fishR vignette – Von Bertalanffy growth models. Available at:
https://sites.google.com/site/fishrfiles/gnrl/VonBertalanffy.pdf?attredirects=0.
(November 2013).
Organization for Economic Cooperation and Development (OECD). 1982. Eutrophication of
waters: monitoring, assessment and control. Final Report. OECD cooperative programme
on monitoring of inland waters (eutrophication control). Environment Directorate,
OECD, Paris, France. 154 pp.
Peckarsky, B.L., P.R. Fraissinet, M.A. Penton, D.J. Conklin Jr. 1990. Freshwater
macroinvertebrates of Northeastern North America. Cornell University Press, New York.
442 pp.
Prairie Farm Rehabilitation Administration (PFRA) Watershed Project. 2008. Version 8,
2008.03.31.
R Development Core Team. 2012. R: a language and environment for statistical computing. R
Foundation for Statistical Computing, Vienna, Austria. ISBN 3-900051-07-0, URL
http://www.R-project.org/.
Ramsey, D.J. 1991. Federal ecological monitoring program: final water quality report. Federal
Ecological Monitoring Program, technical appendices, Volume 1. 320 pp.
Rawson, D.S. 1960. A limnological comparison of twelve large lakes in Northern Saskatchewan.
Limnol. and Oceanog. 5:195-211.
CAMPP Three Year Summary Report Volume 9
7-7
Ricker, W. 1975. Computation and interpretation of biological statistics of fish populations.
Technical Report Bulletin 191, Bulletin of the Fisheries Research Board of Canada. 382
pp.
Rodgers, D.W. and S.U. Quadri. 1982. Growth and mercury accumulation in yearling yellow
perch, Perca flavescens, in the Ottawa River. Env. Biol. Fish. 7: 377-383.
Rosenberg, D.M., P.A. Chambers, J.M. Culp, W.G. Franzin, P.A. Nelson, A.G. Salki, M.P.
Stainton, R.A. Bodaly, and R.W. Newbury. 2005. Nelson and Churchill River Basins.
Pages 853-901 in A.C. Benke and C.E. Cushing, editors. Rivers of North America.
Academic Press, San Diego, CA.
Royal Ontario Museum. 2005. Royal Ontario Museum website. Available: www.rom.on.ca.
(November 2012).
Saffran, K.A. and D.O. Trew. 1996. Sensitivity of Alberta lakes to acidic deposition: an update
of sensitivity maps with emphasis on 109 northern lakes. July 1996. Water Sciences
Branch, Water Management Division, Alberta Environmental Protection.
SAS. 1999. SAS for Windows, version 8. SAS Institute Inc., Carry, NC.
Savard, T.G., S. Hnatiuk Stewart, and H.M. Cooley. 2010. Water Quality data for the Lower
Nelson River system, 2009. Report # 5414.09-04. A report prepared for Manitoba Hydro
by North/South Consultants Inc., Winnipeg, MB. 240 pp.
Schlick, R.O. 1968. A survey of Setting Lake in 1967. Manitoba Dep. Mines Nat. Res., Fish. Br.
MS. Rep. No. 68-6. 17 pp.
Smith, D.G. 2001. Pennak’s freshwater invertebrates of the United States: Porifera to Crustacea,
4th edition. John Wiley & Sons Inc., New York. 638 pp.
SPSS. 2003. SigmaStat 3.01. SPSS Inc., Chicago, IL.
Stewart, K.W. and B.P. Stark. 2002. Nymphs of North American stonefly genera (Plecoptera),
2nd edition. The Caddis Press, OH. 510 pp.
Strange, N.E. and R.A. Bodaly. 1999. Mercury in fish in northern Manitoba reservoirs and
associated waterbodies: results from 1998 sampling. Prepared for the Program for
Monitoring Mercury Concentrations in Fish in Northern Manitoba Reservoirs. 56 pp.
Swedish Environmental Protection Agency (EPA). 2000. Environmental quality criteria: lakes
and watercourses. Report 5050, Stockholm, Sweden. 102+ pp.
United States Geological Survey (USGS). 2000. Source SRTM 90 m.
Vannote, R. L., G. W. Minshall, K. W. Cummins, J. R. Sedell, and C. E. Cushing. 1980. The river
continuum concept. Can. J. Fish. Aquat. Sci. 37:130-137.
Walford, L.A. 1946. A new graphic method of describing the growth of animals. Biological
Bulletin 90: 141-147.
Ward, D. M., K. H. Nislow, C. Y. Chen, and C. L. Folt. 2010. Rapid, efficient growth reduces
mercury concentrations in stream dwelling Atlantic salmon. Transactions of the
American Fisheries Society 139: 1-10.
CAMPP Three Year Summary Report Volume 9
7-8
Wentworth, C.K. 1922. A scale of grade and class terms for clastic sediments. The Journal of
Geology 30: 377-392.
Wetzel, R.G. 1983. Limnology, 2nd
edition. Saunders College Publishing, New York. 767 pp.
Wheatley, B. 1979. Methylmercury in Canada; exposure of Indian and Inuit residents to
methylmercury in the Canadian Environment. Mercury Program Findings to December
31, 1978. Medical Services Branch, Health and Welfare Canada, Ottawa, ON, 200 pp.
Wiener, J.G., R. A. Bodaly, S.S. Brown, M. Lucotte, M.C. Newman, D.B. Porcella, R.J. Reash,
and E.B. Swain. 2007. Monitoring and evaluating trends in methylmercury accumulation
in aquatic biota. Pages 87-122 in R. Harris, D.P. Krabbenhoft, R. Mason, M.W. Murray,
R. Reash, and T. Saltman, editors. Ecosystem responses to mercury contamination:
indicators of change. CRC Press, New York.
Wiggins, G.B. 2004. Caddisflies the underwater architects. University of Toronto Press, Toronto.
292 pp.
Wilson 2013. Ross Wilson, Wilson Scientific Consulting, Vancouver, Canada, pers. comm.,
September 2013.
Zurawell, R.W., H. Chen, J.M. Burke, and E.E. Prepas. 2005. Hepatotoxic cyanobacteria: a
review of the biological importance of microcystins in freshwater environments. J.
Toxicol. Environ. Health 8: 1–37.