Embed Size (px)
Citation preview
H N P D I S C U S S I O N P A P E R
About this series...
This series is produced by the Health, Nutrition, and Population Family(HNP) of the World Bank’s Human Development Network. The papersin this series aim to provide a vehicle for publishing preliminary andunpolished results on HNP topics to encourage discussion and debate.The findings, interpretations, and conclusions expressed in this paperare entirely those of the author(s) and should not be attributed in anymanner to the World Bank, to its affiliated organizations or to membersof its Board of Executive Directors or the countries they represent.Citation and the use of material presented in this series should takeinto account this provisional character. For free copies of papers inthis series please contact the individual authors whose name appearson the paper.
Enquiries about the series and submissions should be made directly tothe Managing Editor Rama Lakshminarayanan([email protected]) or HNP Advisory Service([email protected], tel 202 473-2256, fax 202 522-3234). Formore information, see also www.worldbank.org/hnppublications.
THE WORLD BANK
1818 H Street, NWWashington, DC USA 20433Telephone: 202 473 1000Facsimile: 202 477 6391Internet: www.worldbank.orgE-mail: [email protected]
Reaching The Poor Program Paper No. 10
Ghana and Zambia: Achieving Equity in theDistribution of Insecticide-Treated Bednetsthrough Links with Measles VaccinationCampaigns
Mark Grabowsky, Nick Farrell, William Hawley, John Chimumbwa, Theresa Nobiya,Mercy Ahun, Stefan Hoyer, Adam Wolkin, and Joel Selanikio
February 2005

GHANA AND ZAMBIA: ACHIEVING EQUITY IN THE DISTRIBUTION OF INSECTICIDE-TREATED BEDNETS
THROUGH LINKS WITH MEASLES VACCINATION CAMPAIGNS
Mark Grabowsky, Nick Farrell, William Hawley, John Chimumbwa, Theresa Nobiya, Mercy Ahun, Stefan Hoyer, Adam Wolkon,
and Joel Selanikio
February 2005
Health, Nutrition and Population (HNP) Discussion Paper This series is produced by the Health, Nutrition, and Population Family (HNP) of the World Bank's Human Development Network (HNP Discussion Paper). The papers in this series aim to provide a vehicle for publishing preliminary and unpolished results on HNP topics to encourage discussion and debate. The findings, interpretations, and conclusions expressed in this paper are entirely those of the author(s) and should not be attributed in any manner to the World Bank, to its affiliated organizations or to members of its Board of Executive Directors or the countries they represent. Citation and the use of material presented in this series should take into account this provisional character. For free copies of papers in this series please contact the individual authors whose name appears on the paper. Enquiries about the series and submissions should be made directly to the Managing Editor, Rama Lakshminarayanan ([email protected]). Submissions should have been previously reviewed and cleared by the sponsoring department which will bear the cost of publication. No additional reviews will be undertaken after submission. The sponsoring department and authors bear full responsibility for the quality of the technical contents and presentation of material in the series. Since the material will be published as presented, authors should submit an electronic copy in the predefined format. Rough drafts that do not meet minimum presentational standards may be returned to authors for more work before being accepted. Guidelines for authors and the template file in the standard format may be found at www.worldbank.org/hnppublications For information regarding this and other World Bank publications, please contact the HNP Advisory Services ([email protected]) at: Tel (202) 473-2256; and Fax (202) 522-3234. © 2005 The International Bank for Reconstruction and Development / The World Bank 1818 H Street, NW Washington, DC 20433 All rights reserved.
iii
Health, Nutrition and Population (HNP) Discussion Paper
Ghana and Zambia: Achieving Equity in the Distribution of Insecticide-Treated Bednets through Links with Measles Vaccination
Campaigns
Mark Grabowskya, Nick Farrellb, William Hawleyb, John Chimumbwac, Theresa Nobiyad, Mercy Ahune, Stefan Hoyerf, Adam Wolkonb, and Joel Selanikiog
a The American Red Cross. Washington D.C., USA bCenters for Disease Control and Prevention (CDC). Atlanta, GA cEastern and Southern Africa Regional Office (ESARO), UNICEF, Nairobi, Kenya dGhana Red Cross. Accra, Ghana eGhana Health Service, Accra, Ghana f World Health Organization (WHO). Phnom Penh, Cambodia gThe DataDyne Group. Washington D.C., USA
Paper prepared for the Program on Reaching the Poor with Effective Health, Nutrition, and Population Services, organized by the World Bank in cooperation with the William and Melinda
Gates Foundation and the Governments of the Netherlands and Sweden.
Abstract: Achieving 60% coverage with insecticide-treated nets (ITNs) is a key goal of WHO's Roll Back Malaria program. While ITN coverage rates remain low in most of Africa (<20%), particularly amongst the poorest groups, measles vaccination campaigns routinely achieve high and equitable coverage (>90%). To achieve high ITN coverage, we linked ITN distribution to measles vaccination campaigns in Ghana and Zambia. In December, 2002, in Lawra District in Ghana, a measles campaign targeted all children 9 months to 15 years of age and lasted one week. Families with one or more children under five years of age were targeted to receive a free ITN. The Ghana Red Cross, working with the Ghana Health Service and UNICEF, provided logistical support, volunteer workers and social mobilization during the campaign. Volunteers visited homes to inform caretakers and encourage them to attend the campaign. Five-months post distribution, a two-stage cluster survey with population proportional sampling assessed ITN coverage, retention, and use. Both surveys assessed household wealth through an asset inventory. The Phase II study in Zambia was a larger-scale evaluation of whether high and equitable coverage could be obtained in several districts simultaneously. In both study areas, the one-week campaign resulted in a large increase in ITN ownership. In Ghana, overall household ITN ownership increased from 4.4 percent to 94.4 percent and in Zambia from 16.7 percent to 81.1 percent. In both studies, the cost of procuring an ITN and delivering it to the country was US$4.32. In both studies, 93 percent of total ITN program component funds were spent on ITN procurement instead of operational costs. These findings suggest that linking ITN distribution to measles campaigns may be an important opportunity to achieve ITN coverage targets. Disclaimer: The findings, interpretations and conclusions expressed in the paper are entirely those of the authors, and do not represent the views of the World Bank, its Executive Directors, or the countries they represent. Correspondence Details: Mark Grabowsky, American Red Cross, 2025 E Street, NW Washington, DC 20006. Tel: (202) 303-4498; email: [email protected]

iv
v
Table of Contents FOREWORD............................................................................................................................. VII
ACKNOWLEDGEMENTS ....................................................................................................... IX
INTRODUCTION......................................................................................................................... 1
THE PROJECTS .......................................................................................................................... 2
GHANA......................................................................................................................................... 2 ZAMBIA........................................................................................................................................ 3
ASSESSMENT METHODS......................................................................................................... 4
RESULTS ...................................................................................................................................... 5
ITN OWNERSHIP .......................................................................................................................... 6 ITN USE....................................................................................................................................... 7 COSTS OF ITN DELIVERY............................................................................................................. 9
DISCUSSION ................................................................................................................................ 9
REFERENCES............................................................................................................................ 11
List of Tables
Table 1: Distribution of households in Ghana (phase I) and Zambia (phase II) studies within districts by wealth status ................................................................................................................. 5
Table 2: ITN ownership, reported pre-campaign and observed post-campaign, by wealth status, Ghana (phase I) and Zambia (phase II) studies .............................................................................. 7
Table 3: Results of ITN distribution in Ghana (phase I) and Zambia (phase II) studies, by wealth status ............................................................................................................................................... 8
List of Figures
Figure 1: Household net ownership by socioeconomic status, Lawra District, Ghana, 2002. ....... 6
Figure 2: Household net ownership by socioeconomic status, four districts, Zambia, 2003. ........ 7

vi
vii
FOREWORD
This discussion paper is one in a series presenting the initial results of work undertaken through the Reaching the Poor Program, organized by the World Bank in cooperation with the Gates Foundation and the Governments of Sweden and the Netherlands. The Program is an effort to begin finding ways to overcome social and economic disparities in the use of health, nutrition, and population (HNP) services. These disparities have become increasingly well documented in recent years. Thus far, however, there has been only limited effort to move beyond documentation to the action needed to alleviate the problem. The Program seeks to start rectifying this, by taking stock of recent efforts to reach the poor with HNP services. The objective is to determine what has and has not worked in order to guide the design of future efforts. The approach taken has been quantitative, drawing upon and adapting techniques developed over the past thirty years to measure which economic groups benefit most from developing country government expenditures. This discussion paper is one of eighteen case studies commissioned by the Program. The studies were selected by a professional peer review committee from among the approximately 150 applications received in response to an internationally-distributed request for proposals. An earlier version of the paper was presented in a February 2004 global conference organized by the Program; the present version will appear in a volume of Program papers scheduled for publication in 2005, Reaching the Poor with Effective Health, Nutrition, and Population Services: What Works, What Doesn’t, and Why. Further information about the Reaching the Poor Program is available through the “Reaching the Poor Program” section of the World Bank’s poverty and health website:
http://www.worldbank.org/povertyandhealth

viii
ix
ACKNOWLEDGEMENTS
The measles mass vaccination campaigns that provided the opportunity for this study were conducted by the respective Ministries of Health with support from the Measles Initiative (American Red Cross, UN Foundation, Centers for Disease Control and Prevention, United Nations Children’s Fund [UNICEF] and the World Health Organization). In Ghana, insecticide-treated bednet (ITN) distribution was conducted by the Ghana Red Cross with support from the Ghana Ministry of Health, Lawra District Assembly, Rotarians against Malaria, Rotary/Ghana, Rotary Foundation, American Red Cross, Ghana Red Cross, and UNICEF. The assessment was conducted by the American Red Cross with support from Ghana Red Cross, Ghana Ministry of Health, ExxonMobil, Satellife, Inc, and the World Bank. In Zambia, distribution was supported by the Zambia National Malaria Control Program, Zambia Ministry of Health, Zambia Red Cross, NetMark, Canadian International Development Agency, International Federation of Red Cross and Red Crescent Societies, the Centers for Disease Control and Prevention, the World Bank, and Right to Play. The project was designed and managed by M. Grabowsky, N. Farrell, J. Chimumbwa, and W. Hawley. The assessment was designed and managed by W. Hawley, A. Wolken, and J. Selanikio. M. Grabowsky, A. Wolkon, and W. Hawley analyzed the data and wrote the first draft. All investigators contributed to the interpretation of data and review of the paper, and contributed to the writing of the final draft. The authors are grateful to the World Bank for having published this report as an HNP Discussion Paper.

x
1
INTRODUCTION
Providing insecticide-treated nets (ITNs) to 60 percent of children under five years of age (U5) is a key goal for malaria control in Africa (WHO 2000). However, current delivery strategies are falling well short of this mark. Among the 28 African countries for which comparable data are available between 1998 and 2002, ITN use by U5 children was 5 percent or less in 23 countries, and the overall median rate was only 2 percent (Monasch et al. 2004). Social marketing has shown some success in improving ITN coverage, and efforts are underway to introduce social marketing on a larger scale. However, the direct and indirect costs of marketing ITNs or using commercial distribution mechanisms may be barriers to equitable distribution. Although social marketing may not increase inequity for rural Africans (Nathan et al. 2004), alternative methods of subsidy or distribution are needed to improve coverage and equity (Gallup and Sachs 2001). In contrast to the low ITN coverage rates, childhood vaccination commonly reaches high coverage, particularly when vaccines are delivered through mass campaigns. Since 2001, the Measles Initiative has supported measles vaccination campaigns in 29 sub-Saharan African countries. These campaigns usually take place over one week and target every child in the country regardless of prior vaccination status. Through 2004, more than 160 million children have received measles vaccination through this approach. Vaccination campaigns typically reach more than 90 percent of the target population, reduce virus transmission, and essentially eliminate measles deaths for up to three years (Grabowsky et al. 2003; Biellik et al. 2002). Measles campaigns are repeated every three to four years to reach subsequent birth cohorts and maintain low disease levels. Moreover, campaigns are highly effective in reaching all children regardless of their economic status. They have become particularly useful for serving children not reached through routine services that require contact with a health center. In populations where measles vaccination campaigns are conducted, malaria is frequently the greatest health risk to children, particularly after the campaign reduces measles mortality. If each child vaccinated against measles during a campaign also received an ITN, ITN coverage would increase rapidly and equitably. The potential benefits of this approach have prompted recent global policy changes to encourage increased integration of ITN delivery and vaccination (WHO-UNICEF 2004). However, linking ITN distribution with measles vaccination presents many operational challenges. We have embarked on a three-phase approach to developing and testing integrated campaigns to deliver both ITNs and measles vaccination to African children. Phase I was a small, proof-of-concept study in one district in Ghana in December 2002. Phase II was a larger evaluation of operational and logistic requirements conducted in five districts in Zambia in June 2003. Phase III assessed nationwide implementation in Togo in December 2004 with an in-depth assessment of the impact of the Togo campaign on ITN coverage, malaria morbidity and mortality, and cost-effectiveness. In this paper, we report on the Phase I and Phase II studies.
2
THE PROJECTS
GHANA
The Phase I study was a small-scale proof-of-concept exercise to demonstrate the operational feasibility of the approach. During one week in December 2002, a mass measles campaign was conducted in Ghana, targeting 7.9 million children 9 months to 15 years of age. The area chosen for the study was Lawra District in the Upper West Region of Ghana, a rural area of extreme poverty with no ITN social marketing schemes. Household ITN coverage was estimated at 4.4 percent in northern Ghana (Ghana Statistical Service 2000; NetMark 2000). Based on population estimates and previous experience with polio campaigns, we estimated that approximately 29,000 U5 children would be brought for vaccination. From previous measles campaigns in Ghana, we estimated that each caretaker would bring an average of two U5 children. Therefore, to provide one ITN to each family that had one or more U5 child, we estimated that 14,500 ITNs would be needed. A total of 14,600 ITNs were obtained through Agrimat, Inc. (SiamDutch, Inc., Bangkok, Thailand) and the United Nations Children’s Fund (UNICEF) Ghana country office. This total included 4,520 long-lasting nets (DAWA® brand) and 10,080 pretreated nets (treated with 20 mg/m2 deltamethrin). All nets were rectangular, extra-large (150 cm x 180 cm x 190 cm). District-wide registration lists of U5 children were available from a filariasis treatment campaign conducted the previous year. Those registration lists were updated and made available at each vaccination/distribution post. Several days before the campaign, one Ghana Red Cross Volunteer (RCV) attempted to visit every home in the post’s catchment area. The volunteers informed caretakers about the measles vaccination campaign, their eligibility for ITN distribution, and proper use of the ITNs. Local radio broadcasts, posters, and banners were used to advertise the measles campaign. Mass media (radio and posters) were not used to communicate about ITN distribution because it might have attracted many people living outside the target district to the vaccination/distribution posts expecting to receive ITNs. There were 28 vaccination/distribution posts in the district during the campaign. Each post served an average of 500 households (100 a day) and was staffed by a trained health worker or vaccinator, a recording clerk, and one or two RCVs. The fixed posts were typically at health centers, and the mobile sites targeted schools. Temporary posts were located at places convenient to the rural population (villages, markets, or churches). The Ghana Red Cross Society (GRCS) was responsible for transporting the ITNs to the district, and the district health management team (DHMT) handled logistics within the district in parallel to the vaccine cold chain. GRCS volunteers were present at all vaccination posts to provide additional help for campaign logistics. All children 9 months to 15 years of age who came to a vaccination post received measles vaccination. Each caretaker accompanying one or more U5 children was given an ITN. The campaign had integrated most aspects of ITN and vaccination operations, including program planning, social mobilization, health worker salaries, transportation for some personnel, and some supervision.
3
ZAMBIA
The Phase II study was a larger-scale evaluation of whether high and equitable coverage could be obtained in several districts simultaneously. During one week in June 2003, a mass measles campaign was conducted in Zambia targeting 5,054,112 children1 aged 9 months to 15 years of age. The four rural districts chosen for the integrated measles-ITN campaign (Chilubi, Kaputa, Mambwe, and Nyimba) had a combined total population of approximately 360,000 with around 65,000 U5 children. The intention of the operational plan was to provide a single ITN to each family with one or more U5 children. The International Federation of Red Cross and Red Crescent Societies (IFRC) procured 75,000 long-lasting ITNs (LLITNs) for the four rural districts. Although the target was to provide 65,745 LLITNs, an additional 9,255 LLITNs were procured to ensure that there were no stock-outs of LLITNs during the campaign. The number of children visiting health posts often exceeded the estimated national census figures (used as the baseline), a common occurrence during immunization campaigns in Zambia due to influxes of refugees and underestimates of population sizes. Weekly planning meetings for incorporation of ITNs in the measles campaign were held at the National Malaria Control Centre (NMCC) and at the Universal Child Immunization (UCI) offices from April until June 2003. Funds were allocated to the NMCC by IFRC to enable them to coordinate the ITN component of the measles campaign in all four districts. This support included: micro-planning meetings in each district, training of each DHMT by National Malaria Control trainers, and supervision during the campaign. The logistics for ITNs consisted of transporting the ITNs from the central warehouse in the capital, Lusaka, to the districts and then assuring delivery to the vaccination/distribution posts. Each district had a planning exercise to determine the number of eligible children and families and to estimate the number of ITNs needed for full coverage. They also estimated the number of ITNs each vaccination post would need each day, based on the number of anticipated vaccinations. On average, a post would vaccinate approximately 300 children each day. ITNs were delivered from the central level to the district health and medical officer (DHMO) by the Zambia Red Cross Society (ZRCS). From there, in three of the districts (Chilubi, Mambwe, Nyimba), the DHMO was responsible for delivering the ITNs to each post. In Kaputa District, which presented a particularly difficult logistical challenge due to its isolation, poor roads, and widely dispersed population, ITNs were transported within the district by ZRCS in coordination with DHMO. Funds were provided to the DHMOs to pay allowances for district ITN managers, supervisors, and malaria agents (Community Health Workers), to hold orientation meetings, conduct the ITN component of the campaign, and transport personnel and supplies from each DHMT to the rural health centers and health posts.
1 This target population included all children 9 months to 15 years of age (about 45 percent of the total population) plus an additional 10 percent for drop-ins, such as those outside the target age group and those crossing over the border from the Democratic Republic of the Congo. UNDP population projections were refined using numerator data from previous polio campaigns. In all, approximately 4.7 million children were vaccinated.
4
ASSESSMENT METHODS
In Ghana, on distribution and vaccination days, volunteers recruited by the Lawra District Red Cross conducted exit interviews with caretakers leaving vaccination/distribution sites. The volunteers were adults who could read and write English. Volunteers were instructed to choose field sites that met certain requirements. These sites had to be in a geographical area known to the volunteer; and they had to be community-based sites where ITNs were being distributed and at which caregivers would be present (not schools because caregivers would not be present). Because some of the vaccination teams were mobile, the assessors moved with them from site to site. Each volunteer visited about four sites in three days. A single population-based survey was conducted in each country, 5-months post-campaign in Ghana and 6-months post-campaign in Zambia. The evaluation used a standard two-stage, cluster-sampling methodology (Henderson and Sundaresan 1982). In Lawra, the clusters were drawn from population records maintained at the DHMT. For Zambia, clusters were drawn from randomly selected standard enumeration areas (SEAs) within each of the five districts. The SEAs enabled the evaluation team to select clusters of 50 to 200 households from established divisions within each district. In both surveys, wealth was measured by asking the head of household questions on household assets such as ownership of a bicycle, type of roofing material, and source of water. A scoring system was taken from the Demographic and Health Surveys as developed and reported by the World Bank (Gwatkin et al., 2000a and Gwatkin et al., 2000b). Each household was assigned a score for each asset, where the score differed depending on whether or not the household owned that asset (or, in the case of sleeping arrangements, the number of people per room). The scores were summed for each household, and individuals were ranked according to the total score of the household in which they resided. The sample was then divided into population quintiles—five groups with approximately the same number of individuals in each. In all surveys, the volunteers read and recorded the survey questions on handheld computers, “personal digital assistants” (PDAs). The PDAs in this study were Visor Neos (Handspring, Inc.) using the Palm Operating System, version 3.5 (Palm, Inc.). The PDAs were supplied by Satellife, Inc. Programming was done prior to shipping to the field by using Pendragon Forms 3.2. Data analysis specialists oversaw training and data collation and analysis. The assessment data were transferred from the PDAs to a laptop computer as an Access database using the synchronizing software and cradle supplied with the PDA. The Ghana data were analyzed in EpiInfo 6.0 and EpiInfo 2002. The Zambia data were analyzed using a combination of EpiInfo 6.0, SAS, Excel, and SUDAAN. Proportions were compared using chi-square tests. For determination of whether a child slept under the ITN, we assessed children who were 6 to 59 months of age at the time of the campaign. A household was defined as the location where a single family group eats together. The index child was defined as the youngest child who usually sleeps in that household and who was at least 6 months of age at the time of the campaign. An ITN was defined as a pre-treated, long-lasting ITN delivered during the campaign or a non-long-lasting net treated with insecticide within the previous six months. ITN retention was deemed to
5
have occurred in those households where the surveyor saw a net the caretaker reported having received. ITN hanging was defined as the surveyor’s observation of the ITN over the bed where the caretaker said the child usually slept. A child was determined to have slept under an ITN if the caretaker reported that the child slept under an ITN the previous night. To assess whether an outcome measure was correlated with increasing wealth status, we considered each wealth quintile a separate stratum and applied the chi-square test for trend (EpiInfo 6.0). The equity ratio was defined as the ratio of ITN ownership in the lowest quintile to that in the highest quintile. Records with missing responses were excluded from analyses. Total ITN program component costs were defined as the cost of ITN procurement (including ITN purchase and delivery to the country) and the operational cost of delivering the ITNs (including training, in-country transportation, and community education). Costs that the measles campaign would have incurred in the absence of ITN distribution were excluded, as were the costs of external consultants and assessment. Cost information was taken directly from the funded budgets for the local Red Cross, the Ministry of Health and the IFRC. All costs are given in 2003 U.S. dollars.
RESULTS
Table 1 shows the distribution of households into wealth quintiles and the mean asset index score for each quintile for each of the three assessments. The number of households varied slightly across quintiles, because more than one household score was at the breakpoint. The asset factor scores are not comparable between counties because the factors derive from different national DHS surveys.
Table 1: Distribution of households in Ghana (phase I) and Zambia (phase II) studies within districts by wealth status
Wealth quintiles Study 1a 2 3 4 5b All
N 151 157 153 159 156 776 Exit-interview survey Mean asset
index score –0.398 –0.212 –0.089 0.384 1.026 0.147
N 51 50 49 50 48 248 Phase I –
Ghana Community- based survey Mean asset
index score –0.317 –0.121 0.021 0.361 1.582 .330
N 342 342 340 335 346 1,705 Phase II – Zambia
Community- based survey Mean asset
index score –0.463 –0.352 –0.295 –0.223 0.117 –0.242
a. Poorest. b. Least poor. Source: Authors’ research.
6
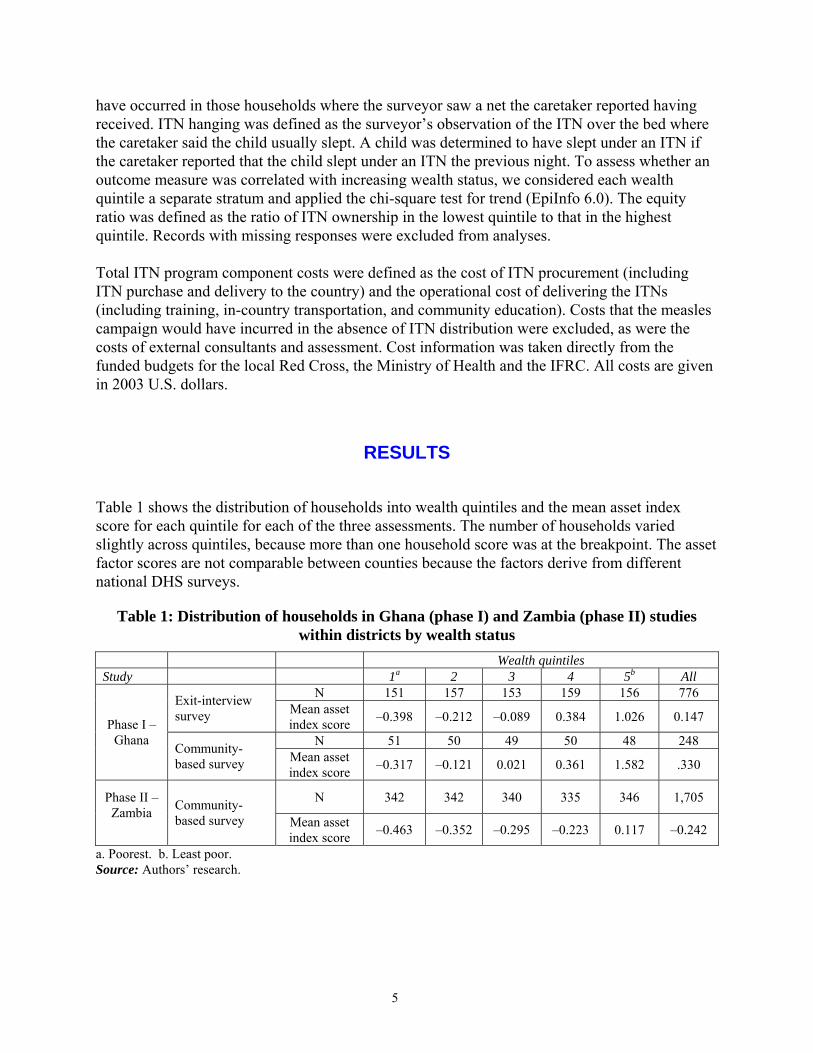
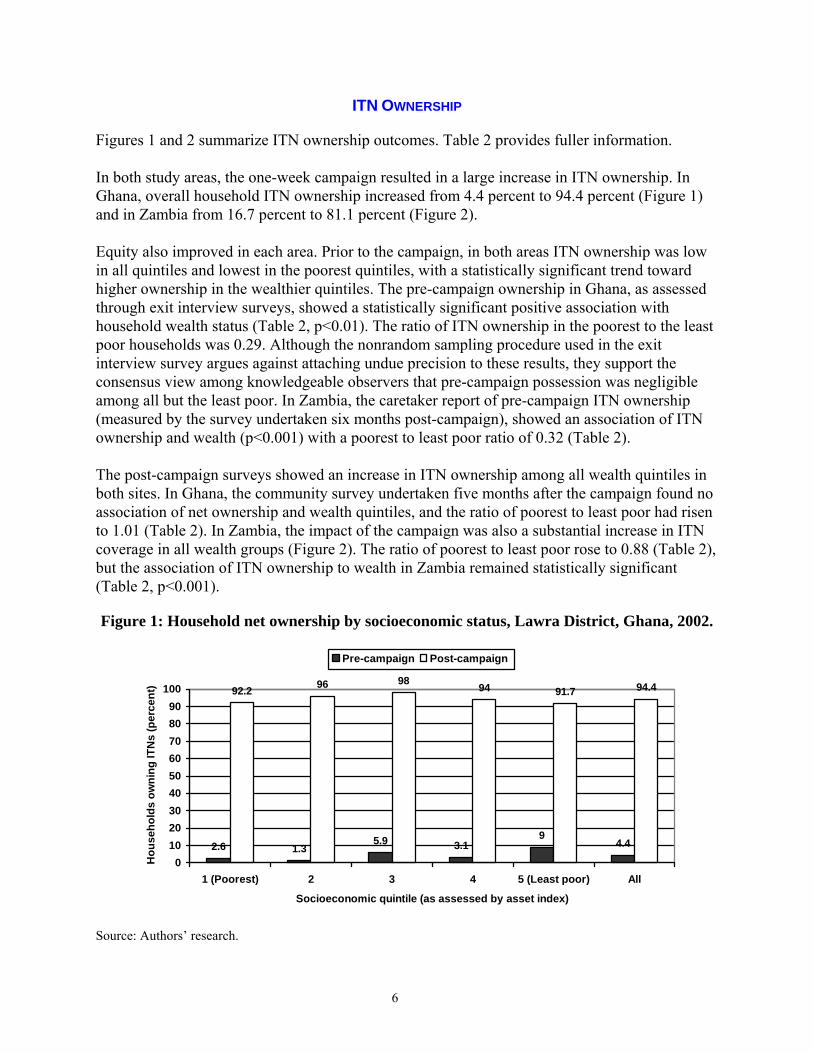
ITN OWNERSHIP
Figures 1 and 2 summarize ITN ownership outcomes. Table 2 provides fuller information. In both study areas, the one-week campaign resulted in a large increase in ITN ownership. In Ghana, overall household ITN ownership increased from 4.4 percent to 94.4 percent (Figure 1) and in Zambia from 16.7 percent to 81.1 percent (Figure 2). Equity also improved in each area. Prior to the campaign, in both areas ITN ownership was low in all quintiles and lowest in the poorest quintiles, with a statistically significant trend toward higher ownership in the wealthier quintiles. The pre-campaign ownership in Ghana, as assessed through exit interview surveys, showed a statistically significant positive association with household wealth status (Table 2, p<0.01). The ratio of ITN ownership in the poorest to the least poor households was 0.29. Although the nonrandom sampling procedure used in the exit interview survey argues against attaching undue precision to these results, they support the consensus view among knowledgeable observers that pre-campaign possession was negligible among all but the least poor. In Zambia, the caretaker report of pre-campaign ITN ownership (measured by the survey undertaken six months post-campaign), showed an association of ITN ownership and wealth (p<0.001) with a poorest to least poor ratio of 0.32 (Table 2). The post-campaign surveys showed an increase in ITN ownership among all wealth quintiles in both sites. In Ghana, the community survey undertaken five months after the campaign found no association of net ownership and wealth quintiles, and the ratio of poorest to least poor had risen to 1.01 (Table 2). In Zambia, the impact of the campaign was also a substantial increase in ITN coverage in all wealth groups (Figure 2). The ratio of poorest to least poor rose to 0.88 (Table 2), but the association of ITN ownership to wealth in Zambia remained statistically significant (Table 2, p<0.001).
Figure 1: Household net ownership by socioeconomic status, Lawra District, Ghana, 2002.
2.6 1.35.9 3.1
94.4
92.2 96 98 94 91.7 94.4
0102030405060708090
100
1 (Poorest) 2 3 4 5 (Least poor) All
Socioeconomic quintile (as assessed by asset index)
Hou
seho
lds
owni
ng IT
Ns
(per
cent
)
Pre-campaign Post-campaign
Source: Authors’ research.
7
Figure 2: Household net ownership by socioeconomic status, four districts, Zambia, 2003.
9.6 9.6 11.2
22.730.3
16.7
77.5 80.472.6
86.9 87.981.1
0102030405060708090
100
1 (Poorest) 2 3 4 5 (Leastpoor)
All
Socioeconomic quintile (assessed by asset index)
Hou
seho
lds
owni
ng IT
Ns
(per
cent
)Pre-campaign Post-campaign
Source: Authors’ research.
Table 2: ITN ownership, reported pre-campaign and observed post-campaign, by wealth status, Ghana (phase I) and Zambia (phase II) studies
Wealth quintiles Equity measures
Study Time 1a 2 3 4 5b Total
p-value, chi-square test for trend
Equity ratioc
Pre-Campaign
4/151 (2.6)
2/157 (1.3)
9/153 (5.9)
5/159 (3.1)
14/156 (9.0)
34/776 (4.4) <0.01 0.29
Phase
I- Ghana Post-
campaign 47/51 (92.2)
48/50 (96.0)
48/49 (98.0)
47/50 (94.0)
44/48 (91.7)
234/248 (94.4) 0.79 1.01
Pre-campaign
33/342 (9.6)
32/342 (9.4)
38/340 (11.2)
76/335 (22.7)
105/346 (30.3)
284/1,705 (16.7) <0.001 0.32
Phase II –
Zambia Post-campaign
265/342 (77.5)
275/342 (80.4)
247/340 (72.6)
291/335 (86.9)
304/346 (87.9)
1,382/1,705
(81.1) <0.001
0.88
a. Poorest. b. Least poor. c. Poorest/least poor. Source: Authors’ research.
ITN USE
As shown in Table 3, the rates of ITN use were lower than the rates of ownership in both study areas. In Ghana, 60.5 percent (150/248) of the index children slept under a net provided during the campaign. The equity ratio was high (0.85) and there was no statistically significant trend toward lower use by the poorest (p = 0.69) In Zambia, 56.4 percent (962/1,705) of the index children slept under a net provided during the campaign. The equity ratio was high (0.79), but
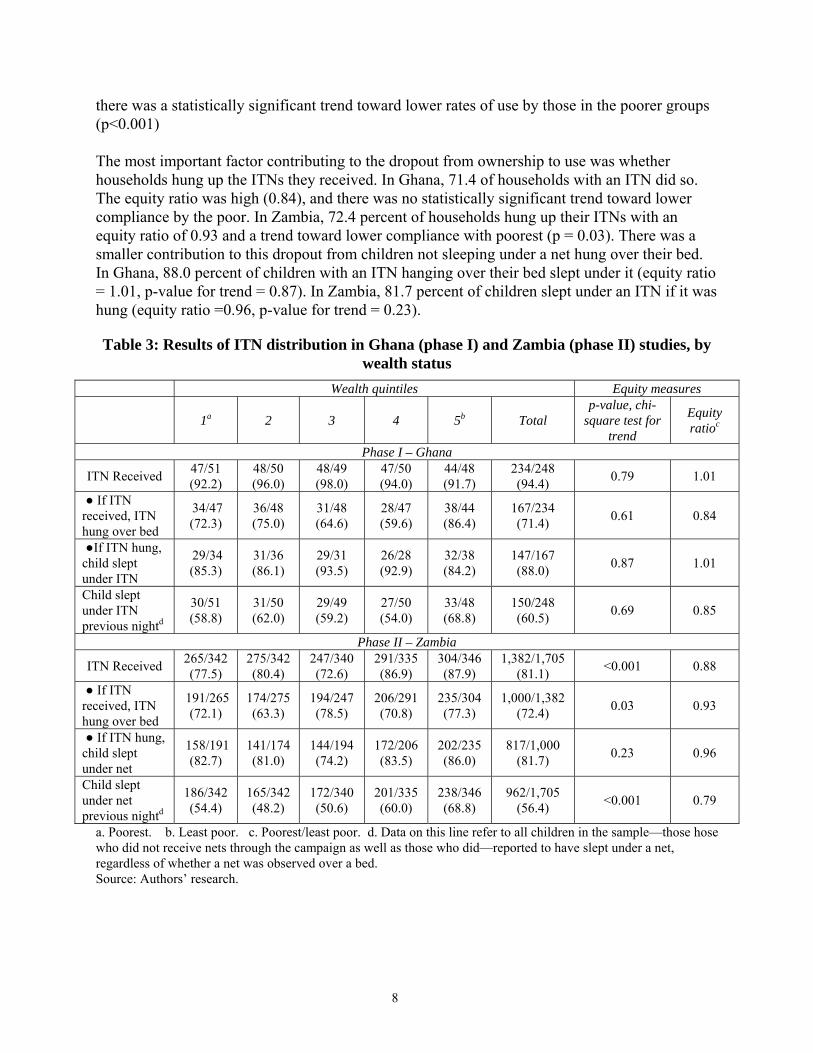
8
there was a statistically significant trend toward lower rates of use by those in the poorer groups (p<0.001) The most important factor contributing to the dropout from ownership to use was whether households hung up the ITNs they received. In Ghana, 71.4 of households with an ITN did so. The equity ratio was high (0.84), and there was no statistically significant trend toward lower compliance by the poor. In Zambia, 72.4 percent of households hung up their ITNs with an equity ratio of 0.93 and a trend toward lower compliance with poorest (p = 0.03). There was a smaller contribution to this dropout from children not sleeping under a net hung over their bed. In Ghana, 88.0 percent of children with an ITN hanging over their bed slept under it (equity ratio = 1.01, p-value for trend = 0.87). In Zambia, 81.7 percent of children slept under an ITN if it was hung (equity ratio =0.96, p-value for trend = 0.23).
Table 3: Results of ITN distribution in Ghana (phase I) and Zambia (phase II) studies, by wealth status
Wealth quintiles Equity measures
1a 2 3 4 5b Total p-value, chi-
square test for trend
Equity ratioc
Phase I – Ghana
ITN Received 47/51 (92.2)
48/50 (96.0)
48/49 (98.0)
47/50 (94.0)
44/48 (91.7)
234/248 (94.4) 0.79 1.01
● If ITN received, ITN hung over bed
34/47 (72.3)
36/48 (75.0)
31/48 (64.6)
28/47 (59.6)
38/44 (86.4)
167/234 (71.4) 0.61 0.84
●If ITN hung, child slept under ITN
29/34 (85.3)
31/36 (86.1)
29/31 (93.5)
26/28 (92.9)
32/38 (84.2)
147/167 (88.0) 0.87 1.01
Child slept under ITN previous nightd
30/51 (58.8)
31/50 (62.0)
29/49 (59.2)
27/50 (54.0)
33/48 (68.8)
150/248 (60.5) 0.69 0.85
Phase II – Zambia
ITN Received 265/342 (77.5)
275/342 (80.4)
247/340 (72.6)
291/335 (86.9)
304/346 (87.9)
1,382/1,705 (81.1) <0.001 0.88
● If ITN received, ITN hung over bed
191/265 (72.1)
174/275 (63.3)
194/247 (78.5)
206/291 (70.8)
235/304 (77.3)
1,000/1,382 (72.4) 0.03 0.93
● If ITN hung, child slept under net
158/191 (82.7)
141/174 (81.0)
144/194 (74.2)
172/206 (83.5)
202/235 (86.0)
817/1,000 (81.7) 0.23 0.96
Child slept under net previous nightd
186/342 (54.4)
165/342 (48.2)
172/340 (50.6)
201/335 (60.0)
238/346 (68.8)
962/1,705 (56.4) <0.001 0.79
a. Poorest. b. Least poor. c. Poorest/least poor. d. Data on this line refer to all children in the sample—those hose who did not receive nets through the campaign as well as those who did—reported to have slept under a net, regardless of whether a net was observed over a bed. Source: Authors’ research.
9
COSTS OF ITN DELIVERY
In both studies, the cost of procuring an ITN and delivering it to the country was US$4.32. In Ghana, total costs of the ITN program component were $67,722 with procurement costs for 14,600 ITNs of $63,072 and operational costs of $4,650. The operational cost per ITN delivered was $0.32. In Zambia, total ITN program component costs were $315,788 with procurement costs of $292,697 for 67,754 ITNs and operational costs of $23,091. The operational cost per ITN delivered was $0.34. In both studies, 93 percent of total ITN program component funds were spent on ITN procurement rather than on operational costs.
DISCUSSION
These findings suggest that integrating ITN delivery into measles vaccination campaigns achieves unprecedented levels of ITN ownership and equity at very low cost. In these study populations, the poorest families’ ITN ownership rates were comparable to or exceeded those among the least poor. The increase in the equity ratio of ITN ownership in the poorest households compared with the least poor was substantial, rising from 0.29 to 1.01 in Ghana and from 0.32 to 0.88 in Zambia. Expressed as a difference rather than a rate, the coverage among the poorest households in Ghana increased by 89.6 percentage points compared with 82.7 percentage points for the least poor. In Zambia, the increase was 67.9 percentage points for the poorest and 57.6 percentage points for the least poor. This approach to ITN distribution resulted in a larger coverage increase among the poorest in both relative and absolute terms, while also assuring high coverage levels for all wealth groups. A major difference between vaccines and ITNs in achieving effectiveness is that vaccines protect without any subsequent behavioral requirements on the part of the person vaccinated whereas ITN effectiveness requires ongoing, proper use. We found that the two key factors contributing to lower use were whether the ITN was hung up, and whether the child slept under it once it was hung. Our results indicate that these two use factors were not consistently related to wealth. The ratio of poorest to least poor for hanging the ITN and sleeping under it in Ghana were 0.84 and 1.01 and 0.93 and 0.96 in Zambia. The most likely causes of lower use rates were seasonal factors. In Northern Ghana, net use is seasonal varying from 99 percent use in the rainy season, when mosquitoes are most prevalent, and 20 percent in the dry seasons (Binka 1997). About half the homes in Zambia reported that they used nets during the rainy and hot season or when there were a lot of mosquitoes (Academy for Educational Development 2001). In our studies, the distribution and assessment took place over the dry season, and there was no intervening rainy season during the study period. Measuring ITN use during periods of high mosquito density following mass distribution will indicate what additional behavior-change interventions may be required to increase use of the nets. An important benefit of integration is that it promises to lower costs through cost-sharing and operational efficiencies. The underlying cost of the nationwide measles campaign in Zambia was $0.89 per child, of which, $0.57 was for operational costs (MOH Zambia, unpublished data). The additional operational cost of adding ITNs in the study districts was $0.34 per child. With a cost
10
per ITN of $4.32, our total costs of $4.66 per ITN meant that commodities rather than program costs accounted for more than 93 percent of total project expenditures. Using this measure, the efficiency of mass distribution may be approaching the theoretical maximum, because the costs were substantially below those reported for other approaches. In Zambia, a community-based project was estimated to cost between $17 and $22 per net distributed (Hanson et al. 2003) and a clinic-based revolving fund approach in Mozambique cost $10 per net delivered (Dgedge et al.1999). A highly successful social marketing approach in Tanzania gave a project financial cost of $8.30 per net delivered (Hanson et al. 2003). As noted by Hanson, these costs exclude the contributions of users and do not reflect the true value of the resources consumed in delivering nets. Because the nets were distributed free of charge during the measles campaigns, there were no extra costs to caretakers, because they were already coming to the service facilities in order to obtain measles vaccine. Further, the campaigns reduced the travel time and thus indirect costs of participants. Careful evaluation of a measles campaign in Kenya indicated that the campaign approach reduced direct costs to caretakers by 75 percent compared to traveling to routine vaccination delivered at a health center (KEPI 2002). While mass vaccination campaigns are relatively cost-effective (Uzicanin 2004) as a means of achieving specific disease-control objectives, they can disrupt the routine delivery of other health services. This is mainly because of the high demands on health care workers for planning and conducting the campaigns. Other disruptions may be due to the high demand on limited logistics capacity. These disruptions might impair routine service delivery. While possibly important, these adverse effects are difficult to measure and are rarely quantitatively studied. A complete assessment would include a comparison of the disruptions attributable to other distribution strategies such as social marketing. Mass campaigns integrating ITNs and other services likely cause more disruption than vaccination campaigns alone. Whether the additional gains in disease control justify this disruption has not yet been evaluated. While campaigns will always be somewhat disruptive, additional efforts are required to minimize the adverse impact of integrated campaigns, possibly through better coordination and planning. There were no obvious constraints on using this approach in other campaigns. Measles campaigns are typically nationwide, and integrating ITN delivery into these larger efforts will present additional challenges as well as opportunities for additional efficiencies. The WHO/UNICEF strategy for measles control calls for “second opportunity” vaccination campaigns to be conducted in all measles-endemic countries (WHO-UNICEF 2001). As practiced in the Americas and in Sub-Saharan Africa, campaigns are repeated every three to four years for U5 children. Current plans call for vaccinating more than 150 million children a year in developing countries during these campaigns (Henao-Restrepo et al. 2003). Each vaccination may represent a missed opportunity to deliver ITNs. The findings from these Phase I and II studies suggest that integrating ITN distribution into vaccination campaigns can achieve higher and more equitable ITN coverage than other delivery strategies at a lower cost to both providers and consumers. Linking ITNs to measles campaigns presents an important opportunity for reaching malaria control goals and merits larger scale implementation and evaluation.
11
REFERENCES
Academy for Educational Development. NetMark Formative Qualitative Research on Insecticide Treated Materials (ITMs) in Zambia. March, 2001. Washington.
Biellik R, Madema S, Taole A, Kutsulukuta A, Allies E, Eggers R, Ngcobo N, Nxumalo M, Shearley A, Mabuzane E, Kufa E, Okwo-Bele JM.. 2002. “First 5 Years of Measles Elimination in Southern Africa: 1996-2000.” Lancet 359:1564–68
Binka FN, Adongo P. Acceptability and use of insecticide impregnated bednets in northern Ghana. Trop Med Int Health. 1997 May; 2(5):499-507.
Curtis C, Maxwell C, Lemnge M, Kilama WL, Steketee RW, Hawley WA, et al. Scaling-up coverage with insecticide-treated nets against malaria in Africa: who should pay? Lancet Infectious Diseases 2003;3:304-7.
Dgedge M, Kumaranayake L, Cossa H, Hogh B, Lines J. Can the expansion of a subsidised ITN project become self-sufficient? The experience from an ITN project in Mozambique.Second International Conference on Insecticide Treated Nets; 1999; Dar es Salaam.
Gallup, J.L., and J.D. Sachs. 2001. “The Economic Burden of Malaria.” Am J Trop Med Hyg 64(1-2 Suppl): 85–96.
Ghana Statistical Services. Poverty Trends in the 1990s. Accra: Ghana Statistical Services; 2000.
Grabowsky, M., P. Strebel, A. Gay, E. Hoekstra, and R. Kezaala. 2003. “Measles Elimination in Southern Africa (letter).” Lancet 360 (9334): 716.
Gwatkin, D.R., S. Rustein, K. Johnson, R.P. Pande, and A. Wagstaff. Socio-Economic Differences in Health, Nutrition, and Population in Ghana. Paper prepared for the HNP/Poverty Thematic Group of The World Bank. Washington, D.C.: World Bank, 2000. Asset questionnaires and weighting of asset factor scoring for each country can be found at http://www1.worldbank.org/prem/poverty/health/data/ghana/ghana.pdf (accessed November 20, 2004).
Gwatkin, D.R., Rustein S., Johnson K., Pande R., and Adam Wagstaff. Socio-Economic Differences in Health, Nutrition, and Population in Togo. Paper prepared for the HNP/Poverty Thematic Group of The World Bank, 2000. Asset questionnaires and weighting of asset factor scoring for each country can be found at http://www1.worldbank.org/prem/poverty/health/data/togo/togo.xls (accessed November 20, 2004).
Hawley, W.A., F.O. ter Kuile, R.S. Steketee, B.L. Nahlen, D.J. Terlouw, J.E. Gimnig, Y.P. Shi, J.M. Vulule, J.A. Alaii, A.W. Hightower, M.S. Kolczak, S.K. Kariuki, and P.A. Phillips-Howard. 2003a. “Implications of the Western Kenya Permethrin-Treated Bednet Study for Policy, Program Implementation, and Future Research. Am J Trop Med Hyg. 68(4): 168–73.
12
Hanson K., Kikumbih N., Schellenberg J.A., Mponda H., Nathan R., Lake S., Mills A., Tanner M., and Lengeler C. Cost-effectiveness of social marketing of insecticide-treated nets for malaria control in the United Republic of Tanzania Bull World Health Organ vol.81 no.4 Genev 2003
Henderson RH, Sundaresan T. Cluster sampling to assess immunization coverage: a review of experience with a simplified sampling method. Bull World Health Organ. 1982;60(2):253-60.
Henao-Restrepo, A.M., P. Strebel, E.John Hoekstra, M. Birmingham, and J. Bilous. 2003. “Experience in Global Measles Control, 1990–2001.” J Infect Dis. 187 Suppl 1: S15–21.
Kenya Expanded Programme on Immunization (KEPI) and Division of Planning & Development, Central Bureau of Statistics, and Ministry of Finance and Planning. Vaccination Coverage and Economic Evaluation of Supplemental and Routine Measles immunization .Kenya Ministry of Health, 2002, Nairobi.
Kikumbih N, Hanson K, Mills A, Mponda H, Schellenberg JA. The economics of social marketing: the case of mosquito nets in Tanzania. Soc Sci Med. 2005 Jan;60(2):369-81.
Monasch R, Reinisch A, Steketee R, Korenromp E, Alnwick D and Bergevini Y. Child Coverage with Mosquito Nets and Malaria Treatment from Population-Based Surveys in African Countries: A Baseline for Monitoring Progress in Roll Back Malaria Am. J. Trop. Med. Hyg., 71(2 suppl), 2004, pp. 232-238
Nathan R., Masanja, H., Mshinda H., Schellenberg, J.A., de Savigny, D., Lengeler, C., Tanner M., and Victora, C.G... Mosquito nets and the poor: can social marketing redress inequities in access? Trop Med Int Health, vol 9 no 10 pp 1121–1126, Oct 2004
NetMark Regional Africa Program. Insecticide treated materials in Ghana: NetMark Regional Africa Program briefing book. Washington, DC: Academy for Educational Development; 2000.
Roll Back Malaria Technical Support Network for Insecticide Treated Netting Materials. Scaling up insecticide treated netting (itn) programmes in Africa: a strategic framework for coordinated national action Geneva: World Health Organization; 2002.
Schellenberg JR, Abdulla S, Nathan R, Mukasa O, Marchant TJ, Kikumbih N, et al. Effect of large-scale social marketing of insecticide-treated nets on child survival in rural Tanzania. Lancet 2001;357:1241-7.
Uzicanin A, Zhou F, Eggers R, Webb E, Strebel P.Economic analysis of the 1996-1997 mass measles immunization campaigns in South Africa. Vaccine. 2004 Sep 3;22(25-26):3419-26.
WHO-UNICEF. Joint Statement – Malaria control and immunisation: A sound partnership with great potential. Geneva: WHO; 2004.
WHO (World Health Organization). 2000. Declaration, African Summit on Roll Back Malaria, Abuja, Nigeria, April 25, 2000. WHO/CDS/RBM/2000.17. Geneva: WHO.
13
WHO-UNICEF (United Nations Children’s Fund). 2001. Joint Statement on Strategies to Reduce Measles Mortality Worldwide: WHO/V&B/01.40 or UNICEF/ PD/Measles/01. Geneva: WHO.


H N P D I S C U S S I O N P A P E R
About this series...
This series is produced by the Health, Nutrition, and Population Family(HNP) of the World Bank’s Human Development Network. The papersin this series aim to provide a vehicle for publishing preliminary andunpolished results on HNP topics to encourage discussion and debate.The findings, interpretations, and conclusions expressed in this paperare entirely those of the author(s) and should not be attributed in anymanner to the World Bank, to its affiliated organizations or to membersof its Board of Executive Directors or the countries they represent.Citation and the use of material presented in this series should takeinto account this provisional character. For free copies of papers inthis series please contact the individual authors whose name appearson the paper.
Enquiries about the series and submissions should be made directly tothe Managing Editor Rama Lakshminarayanan([email protected]) or HNP Advisory Service([email protected], tel 202 473-2256, fax 202 522-3234). Formore information, see also www.worldbank.org/hnppublications.
THE WORLD BANK
1818 H Street, NWWashington, DC USA 20433Telephone: 202 473 1000Facsimile: 202 477 6391Internet: www.worldbank.orgE-mail: [email protected]
Reaching The Poor Program Paper No. 10
Ghana and Zambia: Achieving Equity in theDistribution of Insecticide - Treated BednetsThrough Links with Measles VaccinationCampaigns
Mark Grabowsky, Nick Farrell, William Hawley, John Chimumbwa, Theresa Nobiya,Mercy Ahun, Stefan Hoyer, Adam Wolkin, and Joel Selanikio
February 2005