Embed Size (px)
Citation preview

Camels Don’t Fly, Deserts Don’t Bloom:
an Assessment of Saudi Arabia’s Experiment in Desert Agriculture
by
Elie Elhadj SOAS/KCL Water Research Group
Occasional Paper No 48 Water Issues Study Group
School of Oriental and African Studies (SOAS)/King’s College London University of London
May 2004
Severe arid conditions constrained agricultural production and population size in
the Arabian Peninsula over the millennia (except around oases and in parts of Yemen).
An abrupt change in Saudi Arabia started in the 1980s to make the desert bloom. This
study examines whether or not the Saudi experiment in desert irrigation has been
worthwhile in terms of cost and benefit. It concludes that the project was a waste of
money and water on a grand scale.
The study will start by describing a brief history of the project. It will be followed
by an estimate of the scheme’s cost in terms of: a) money and, b) water. It will end with
an analysis of the feasibility of Saudi quest for food self-sufficiency. The data are from
Saudi Government and other official sources.
1

1. History of agricultural development in Saudi Arabia since the 1960s Table 1 Saudi population, land and water use and production of agricultural products for
1961, 1973, 1980 and 1985-2000
Cereals Vegetables Fruits Alfalfa Years Pop-
ulation- millions
Land (000 ha.)
Tonn-es (000)
Land (000 ha.)
Tonn-es (000)
Land (000 ha.)
Tonn-es (000)
Land (000 ha.)
Tonn-es (000)
Meat excl. fish (000 tons)
Milk (000 tonne-s)
Water use (billion m3)
Total land (000 ha.)
1961 4.2 NA 361 NA 216 NA 186 NA 360 38 97 N/A 343 a 1973 6.6 201 113 18 399 38 355 29 344 81 217 N/A 373 a 1980 9.6 455 267 53 756 72 470 29 388 74 349 7.472 609 1985 12.2 634 2,191 93 1,443 75 686 145 2,134 303 414 11.607 946 1986 12.9 643 2,463 87 1,281 78 714 139 2,036 380 432 11.71 947 1987 13.6 718 2,934 99 1,911 82 781 163 2,405 396 450 13.053 1,062 1988 14.2 898 3,695 98 1,953 82 817 168 2,395 423 451 14.814 1,246 1989 14.9 968 3,950 105 1,894 88 848 166 2,294 400 475 15.682 1,327 1990 15.4 978 4,138 109 1,900 91 804 201 2,106 404 516 16.513 1,379 1991 15.8 1,090 4,575 106 1,904 96 834 227 2,514 410 520 18,384 1,519 1992 16.1 1,125 4,704 124 2,073 103 899 219 2,425 428 548 18.949 1,571 1993 16.4 1,133 5,044 125 2,181 113 951 226 2,435 470 587 19.642 1,596 1994 16.7 1,071 4,861 134 2,289 118 988 273 2,784 511 633 20.165 1,596 1995 17.1 708 2,671 159 2,692 130 1,052 305 3,069 544 698 19.088 1,302 1996 17.6 566 1,934 156 2,631 139 1,090 313 3,157 552 749 18.718 1,173 1997 18.2 659 2,340 162 2,599 146 1,150 297 2,929 608 816 18.663* 1,263 1998 18.9 624 2,204 120 2,166 147 1,149 239 3,200 552 883 18.054* 1,130 b 1999 19.6 690 2,474 91 1,875 191 1,153 234 3,606 577 937 18.303* 1,226 b 2000 20.4 620 2,168 91 1,926 193 1,189 217 3,262 643 1,039 N/A 1,120 b
Sources: - Population data and (a) are from FAO Statistical Database.
- Data marked (b) are from Saudi Statistical Yearbook (SSY), 2001: p.511. - All other data are from Ministry of Agriculture and Water (MAW), as presented by A. S. Altukhais, Vice Minister, 2002: tables 4, 5 and 6.
* MAW Preliminary estimates.
The dramatic change during the ten years or so between the early 1980s and the
early 1990s resulted from the sudden and large inflow of revenues from crude oil exports,
following the quadrupling of oil prices in October 1973 Middle East war.1 Since then
profound changes in the Saudi economy and people’s living standards took place.
1 In 1970, crude oil revenues (in nominal terms) were SR7.122 billions (US$1.58 billions at the then official rate of exchange of SR4.5 to US$1). In 1974, they jumped thirteen folds to SR94.19 billions (US$26.5 billions at SR3.55/US$1). In 1979, they doubled to SR189.295 billions (US$56.3 billions at SR3.3608/US$1). They peaked in 1981 to SR329 billions (US$94 billions at SR3.5/US$1). By 1986, they declined to SR42.464 billions (US$11.3 billions). Since 1987, they averaged SR117 billions (US$31 billions). In 2001, they were SR184 billions (US$49 billions [Saudi Arabian Monetary Agency (SAMA) Annual Report, 2002: p.388]
2

Table 1 shows that as late as 1961, the irrigated surface was limited to 343,000
hectares with a population of 4.2 millions. Twelve years later, by 1973, the irrigated
surface was still 373,000 hectares. The emphasis, however, shifted from producing
cereals to vegetables, fruits, meat and milk. Cereals production dropped from 361,000
tonnes in 1961 to 113,000 tonnes in 1973, of which wheat was merely 64,000 tonnes.
Population had grown during the same period to 6.6 millions.
Between 1973 and 1992, increased wealth and improved living conditions led to
increasing the Saudi population by about 250%, to 16.4 millions, many being expatriate
workers. 1992 is chosen as a demarcation line here because it was the year that: A)
followed the 1991 Gulf war with its heavy burden on Saudi treasury.2 B) The year in
which wheat production reached its highest level (Table 2). C) The growth of government
subsidies to wheat production was reversed. D) Barley growing was emphasized, albeit
for only two years (Table 2).
Wheat growing became the prime target of government support in the early part
of the 1980s. Until 1981 the proportion of wheat to total cereal production was around
50%. The ratio jumped in 1981 to 63.7% and in 1982 to 85.3% (Table 2). This high
percentage was maintained for ten years. During this period, wheat production steadily
increased to reach a record 4,124,000 tonnes in 1992,3 well in excess of the self-
sufficiency requirement of the country’s 16.1 million population. Also, well beyond the
storage capacity of the government’s Grain Silos and Flour Mills Organization (GSFMO)
of 2.38 million tonnes (Saudi Ministry of Planning (MOP), 2003: p.140).4
In 1992 the government began to emphasize barley growing. Within one year, in
1993, production jumped by 340%, to 1.421 million tonnes from 417,000 tonnes in 1992. 2 According to the Saudi Minister of the Interior (Arab News Newspaper, Riyadh, September 27, 2002), the 1991 Gulf war had cost Saudi Arabia US$80 billion. 3 To put the magnitude of this development in perspective, Egypt in 1993, with a population of 59.3 million, had an irrigated surface, evolved over the centuries, of 3 million hectares and wheat production of 4.8 million tons (FAO Statistical Database). 4 GSFMO is a government agency established in 1972 to develop agro-industries and achieve self-sufficiency in wheat with six-month reserve stock as a strategic objective. In 1978, GSFMO capacity was 40,000 tons. It grew to 2.38 million tons in 1989 where it stood in 2000/2001 (MOP, 2003: p.140, 146).
3
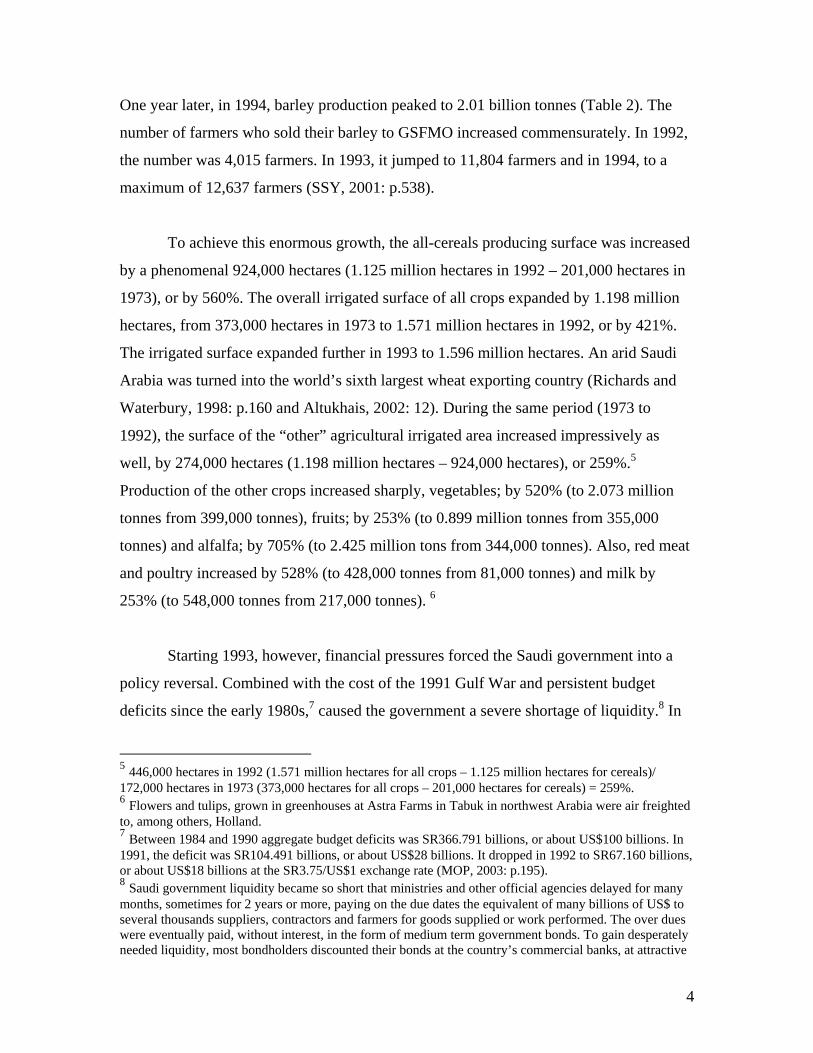
One year later, in 1994, barley production peaked to 2.01 billion tonnes (Table 2). The
number of farmers who sold their barley to GSFMO increased commensurately. In 1992,
the number was 4,015 farmers. In 1993, it jumped to 11,804 farmers and in 1994, to a
maximum of 12,637 farmers (SSY, 2001: p.538).
To achieve this enormous growth, the all-cereals producing surface was increased
by a phenomenal 924,000 hectares (1.125 million hectares in 1992 – 201,000 hectares in
1973), or by 560%. The overall irrigated surface of all crops expanded by 1.198 million
hectares, from 373,000 hectares in 1973 to 1.571 million hectares in 1992, or by 421%.
The irrigated surface expanded further in 1993 to 1.596 million hectares. An arid Saudi
Arabia was turned into the world’s sixth largest wheat exporting country (Richards and
Waterbury, 1998: p.160 and Altukhais, 2002: 12). During the same period (1973 to
1992), the surface of the “other” agricultural irrigated area increased impressively as
well, by 274,000 hectares (1.198 million hectares – 924,000 hectares), or 259%.5
Production of the other crops increased sharply, vegetables; by 520% (to 2.073 million
tonnes from 399,000 tonnes), fruits; by 253% (to 0.899 million tonnes from 355,000
tonnes) and alfalfa; by 705% (to 2.425 million tons from 344,000 tonnes). Also, red meat
and poultry increased by 528% (to 428,000 tonnes from 81,000 tonnes) and milk by
253% (to 548,000 tonnes from 217,000 tonnes). 6
Starting 1993, however, financial pressures forced the Saudi government into a
policy reversal. Combined with the cost of the 1991 Gulf War and persistent budget
deficits since the early 1980s,7 caused the government a severe shortage of liquidity.8 In
5 446,000 hectares in 1992 (1.571 million hectares for all crops – 1.125 million hectares for cereals)/ 172,000 hectares in 1973 (373,000 hectares for all crops – 201,000 hectares for cereals) = 259%. 6 Flowers and tulips, grown in greenhouses at Astra Farms in Tabuk in northwest Arabia were air freighted to, among others, Holland. 7 Between 1984 and 1990 aggregate budget deficits was SR366.791 billions, or about US$100 billions. In 1991, the deficit was SR104.491 billions, or about US$28 billions. It dropped in 1992 to SR67.160 billions, or about US$18 billions at the SR3.75/US$1 exchange rate (MOP, 2003: p.195). 8 Saudi government liquidity became so short that ministries and other official agencies delayed for many months, sometimes for 2 years or more, paying on the due dates the equivalent of many billions of US$ to several thousands suppliers, contractors and farmers for goods supplied or work performed. The over dues were eventually paid, without interest, in the form of medium term government bonds. To gain desperately needed liquidity, most bondholders discounted their bonds at the country’s commercial banks, at attractive
4

1992, subsidies to primarily wheat growing were reduced by 12%, from a peak of SR6
billions in 1991 (US$1.6 billions) to SR5.28 billions (US$1.4 billions). In August 1993, it
was announced that the government would not buy wheat in 1994 from the six main
commercial producers, while imposing quota restrictions on purchases from smaller
commercial farmers (Europa, 2003: p.957). In 1995, the subsidies dropped by 50% from
1994 [SR2.536 billions from SR5 billions (Table 2)]. The slide continued till the
subsidies became about SR0.94 billions (US$249 millions) in 2000 (Table 2).
Within 4 years, by 1996, the all-cereal growing surface dropped by a dramatic
559,000 hectares (1.125 million hectares in 1992 – 566,000 hectares in 1996), or by 50%.
Wheat production dropped even more steeply, by 70% (1.2 million tonnes in 1996/ 4,124
million tonnes in 1992). By 2000, however, wheat production recovered to a level
sufficient for the country’s domestic consumption, 1.787 million tonnes (Table 2).
Barley production’s fall was similarly dramatic. Within one year, 40% of the 2.01
billion tonnes produced in 1994 was cut, to 794,000 tonnes in 1995. The number of
farmers delivering barley to GSFMO dropped from 12,637 farmers in 1994 to 2,126
farmers in 1995 (SSY, 2001: p.538). Since then, barley growing continued its sliding
trend. In 1999 production was only 192,000 tonnes, with the number of barley growers
who sold to GSFMO dropping to 368 farmers (MOP, 2003: p.538). In 2000, production
became 118,000 tonnes (Table 2). Meanwhile, barley imports in 2001 were 3.25 million
tonnes. The cost was SR1.55 billion, or SR477 per tonne, or US$127 per tonne (SSY,
2001: p.446), considerably less costly than locally produced barley (Section 2.E below).
Vegetables production declined marginally, from 2.181 million tonnes in 1993 to
1.926 million tonnes in 2000. On the other hand, increases between 1993 and 2000 took
discount rates to the banks. The balances outstanding of such bonds as of the end of 2002 were: 1) SR235.7 billions, or US$62.9 billions, in the from of “special government bonds… primarily to contractors.” 2) SR37 billions, or US$9.9 billions, as “farmers certificates,” (SAMBA, February 2003: p. 16). The affected parties were foreign companies as well. Boeing, for example, stopped deliveries of the new 777 aircrafts to government owned Saudi Airlines for months. Delivery of the first new aircraft had to wait until the Saudi government borrowed about US$5 billion from foreign banks to fulfill the Boeing contract.
5

place in fruits production; from 951,000 tonnes to 1.189 million tonnes, in red meat and
poultry; from 470,000 tonnes to 643,000 tonnes and, in milk; from 587,000 tonnes to
1.039 billion tonnes. In December 2003, the government imposed a five-year ban on the
allocation of public land for farming (Arab News Newspaper, December 12, 2003).
Despite the drop in cereal production, agricultural water consumption remained
strong. The drop in irrigation water use was less proportional to the drop in cereals
production or the size of the irrigated surface. Between 1993 and 1999, while the overall
irrigated surface declined by 23% (1.126 million hectares in 1999/ 1.596 million hectares
in 1993), irrigation water was reduced by only 9% (18.303 billion m3 in 1999/ 19.642
billion m3 in 1993). The water saved from growing less wheat and barley was used to
increase production and exports of alfalfa plus live animals and animal products, which
require considerably more water to produce. For the five years 1990 to 1994, average
water use was 12,225 m3 per hectare (93.653 billion m3/ 7.661 million hectares). For the
following five years 1995 to 1999 water use increased to an average of 15,232 m3 per
hectare (92.826 billion m3/ 6.094 million hectares). That the reversal in policy on
subsidies to cereals was designed to conserve water cannot be supported by the facts. 1.A. Saudi exports of virtual water
Between 1993 and 1999, Alfalfa production increased by almost 1.2 million
tonnes, from 2.435 million tonnes in 1993 to 3.606 million tonnes in 1999. Such a
volume was beyond local needs. Alfalfa was exported to neighboring markets. In 2000,
the government banned alfalfa exports. So, production declined. The drop within one
year was 344,000 tonnes (3.606 million tonnes in 1999 – 3.262 million tonnes in 2000).
The drop in alfalfa crop happened while production of red meat and poultry during 2000
increased to 643,000 tonnes from 577,000 tonnes in 1999, and of milk to 1.039 million
tonnes in 2000 from 937,000 tonnes in 1999, an indication that earlier increases in alfalfa
production was for export purposes, not local meat growing. Alfalfa requires six times as
much water to grow as wheat (Altukhais, 2002: p.12). Generally, one thousand tons of
water (1,000 cubic meters) is needed to produce a ton of wheat (Allan, IW&I, 2001:p.39).
6

The water saved from abandoning the growing of 2.613 million tonnes of wheat and
barley between 1993 and 1999 9 was used up to grow 1.2 million tonnes of alfalfa.
Additionally, Saudi Arabia exports two categories of foodstuffs that require
substantial water to produce. The first is live animals and animal products. The average
between 1997 and 2001 was about US$191 millions for each of the five years.10 Saudi
Arabia’s exports of live animals and meat products could be estimated at 127,333 tonnes
for each of the subject years.11 This quantity represented about 20% of the country’s meat
production in 2000 (127,333 tonnes / 643,000 tonnes). It also represented 74% of the
increase in meat production between 1993 and 2000.12 Meat production requires huge
volumes of water. Generally, it needs about 16,000 cubic meters to produce a ton of meat
(Allan, IW&I, 2001: p.39). Saudi meat exports are synonymous with shipping away the
country’s finite water resources. 127,333 tonnes of annual meat exports is like shipping
away 2.04 billion m3 of water annually (127,333 tonnes* 16,000 m3 of water per tonne).
The second category of food exports with large water consumption is agricultural
produce. Between 1997 and 2001, Saudi Arabia exported a total of SR2.095 billions
(SSY, 2001: p.447), or an average of SR419 millions per annum, or about US$112
millions. Assuming that the per ton water requirements of these exports is similar to the
average water requirements of all crops in the country, Saudi water exports in this
category would be about 2,000 m3 per tonne (18.303 billion m3 in aggregate irrigation
water use in 1999 (Table 1)/ 9,108,000 tonnes of crops produced in 1999 (Table 1) =
2,010 m3 per tonne). Assuming further that the average export price of agricultural
products was US$500 per tonne, Saudi annual exports would have been 224,000 tonnes
9 2.613 million tonnes of wheat and barley = (3.43 million tonnes of wheat in 1993 + 1.421 million tonnes of barley in 1993 = 4.851 million tonnes) – (2.046 million tonnes of wheat in 1999 + 192,000 tonnes of barley in 1999 = 2.238 million tones (Table 2 below)). 10 Total exports of SR3.587 billions (SSY, 2001: p.447)/ SR3.75 per US$1 = US$957 millions/ 5 years = US$191.4 millions per year. 11 Given that this category includes live animals, red meat, meat products and poultry, an average export price of US$1,500 per ton will be assumed. Saudi exports of US$191 million per annum between 1977 and 2001 would translate to 127,333 tons (US$191 millions/ US$1,500 per ton). 12 127,333 tons/ (643,000 tons in 2000 – 470,000 tons in 1993)= 74%.
7
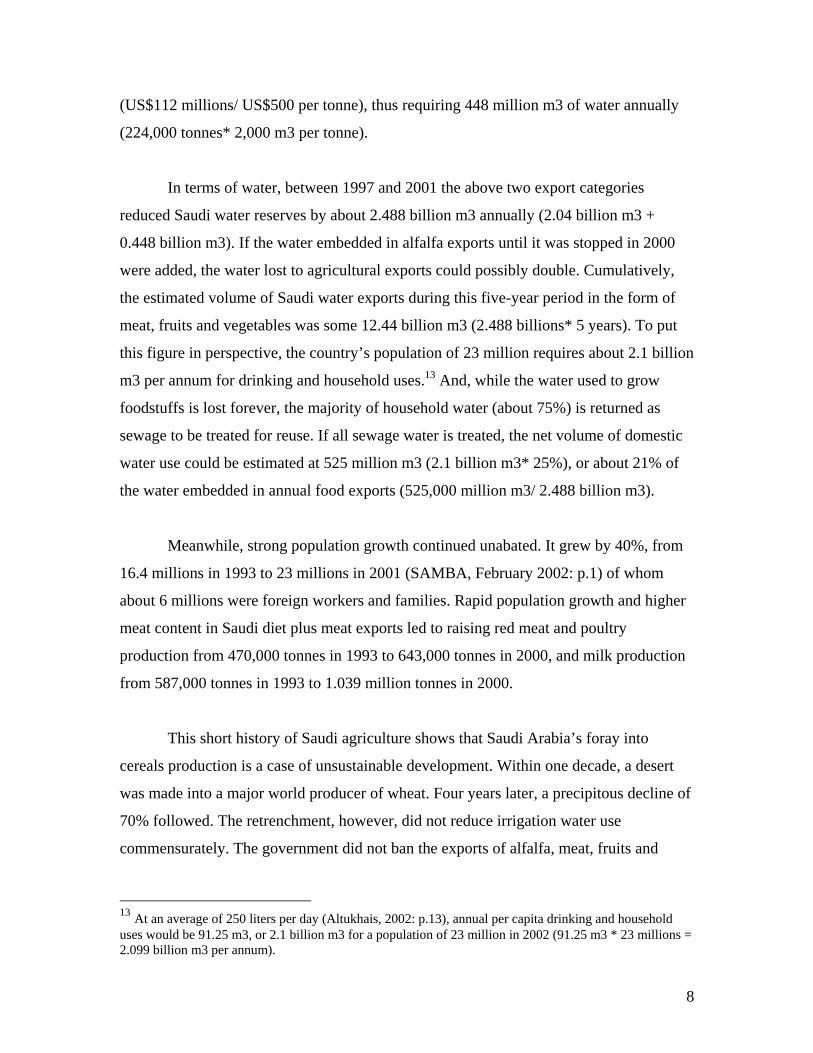
(US$112 millions/ US$500 per tonne), thus requiring 448 million m3 of water annually
(224,000 tonnes* 2,000 m3 per tonne).
In terms of water, between 1997 and 2001 the above two export categories
reduced Saudi water reserves by about 2.488 billion m3 annually (2.04 billion m3 +
0.448 billion m3). If the water embedded in alfalfa exports until it was stopped in 2000
were added, the water lost to agricultural exports could possibly double. Cumulatively,
the estimated volume of Saudi water exports during this five-year period in the form of
meat, fruits and vegetables was some 12.44 billion m3 (2.488 billions* 5 years). To put
this figure in perspective, the country’s population of 23 million requires about 2.1 billion
m3 per annum for drinking and household uses.13 And, while the water used to grow
foodstuffs is lost forever, the majority of household water (about 75%) is returned as
sewage to be treated for reuse. If all sewage water is treated, the net volume of domestic
water use could be estimated at 525 million m3 (2.1 billion m3* 25%), or about 21% of
the water embedded in annual food exports (525,000 million m3/ 2.488 billion m3).
Meanwhile, strong population growth continued unabated. It grew by 40%, from
16.4 millions in 1993 to 23 millions in 2001 (SAMBA, February 2002: p.1) of whom
about 6 millions were foreign workers and families. Rapid population growth and higher
meat content in Saudi diet plus meat exports led to raising red meat and poultry
production from 470,000 tonnes in 1993 to 643,000 tonnes in 2000, and milk production
from 587,000 tonnes in 1993 to 1.039 million tonnes in 2000.
This short history of Saudi agriculture shows that Saudi Arabia’s foray into
cereals production is a case of unsustainable development. Within one decade, a desert
was made into a major world producer of wheat. Four years later, a precipitous decline of
70% followed. The retrenchment, however, did not reduce irrigation water use
commensurately. The government did not ban the exports of alfalfa, meat, fruits and
13 At an average of 250 liters per day (Altukhais, 2002: p.13), annual per capita drinking and household uses would be 91.25 m3, or 2.1 billion m3 for a population of 23 million in 2002 (91.25 m3 * 23 millions = 2.099 billion m3 per annum).
8

vegetables. This experiment simply showed that a combination of money and water could
make even a desert bloom, until either the money or the water runs out.
Financial pressures already forced the Saudi government into a policy reversal on
subsidizing wheat and barley beyond the country’s domestic needs. More threatening in
the future, however, is the inevitable consequence of continuing the extraction of the
country’s non-renewable reserves at the present levels. Accurate reserves estimates of
groundwater are at best challenging. It is certain, however, that regardless of how vast
Saudi non-renewable water reserves might be, extraction will sooner or later, deplete the
aquifers; thus, forcing the abandonment of desert agriculture altogether. The date is a
function of the extracted volume (Section 5 below). Whenever this happens the balance
of government and private sector investments in agriculture will be written off.
Irrespective of estimates, signs of declining availability and deteriorating quality
of Saudi groundwater have already become serious. Natural springs which discharge
many aquifers have dried up in most parts of the Western, Central and Eastern regions
along with seawater intrusion in areas of the East Coast. Also, as a result of poor quality
sanitary and drainage systems and the unmonitored use of inorganic fertilizers and
pesticides the quality of water in most aquifers has become brackish (Saudi Water Net).
The New York Times (January 23, 2003) reported the Minister of the newly formed
Ministry of Water as saying: “I remember flowing springs when I was a boy in the
Eastern Province. Now all of these have dried up and you have to dig.” A local wheat
farmer in Qassim was reported as saying: “I’ve had to lower my pumps 100 meters” - 328
feet – “in the past 10 years.” This farmer’s “4,000-foot-deep wells bring up water that is
increasingly mineral-laden,” the article continued. Qassim is Saudi Arabia’s major wheat
producing are in the Central Province.14 The following two sections will address the cost
of Saudi agriculture in general and cereals production in particular in terms of money and
water. It will also examine the possible motives behind this fateful undertaking.
14 In 2000 the crop area in the Central province was 485,242 hectares (255,865 hectares for Riyadh + 229,377 hectares for Qassim) out of a total of 1.12 million hectares, or 43%(SSY, 2001: p.511).
9

2. The financial cost of Saudi agriculture
The rapid development in Saudi irrigation between the early 1980s and 1994 was
prompted and promoted by government subsidies to farming in general and to growing
wheat and, later barley, in particular. As these subsidies were instituted, then increased
and declined, crop production increased and declined. The financial cost of growing
agricultural products at home over and above the cost of importing a similar volume of
foodstuffs from abroad represents the sum total of four components. The first is the cost
of the direct subsidies that the Saudi government pays to farmers. The second is the cost
of the indirect government subsidies that benefit farmers. The third is the annual
economic cost of operating government infrastructure projects that benefit the
agricultural sector. The fourth is the cost of production incurred by private sector farmers.
2.A. Direct government subsidies
Table 2 lists Saudi wheat and barley production between 1973 and 2001 as well as
the quantities of wheat purchased and the prices paid to wheat growers by between 1979
and 2000 (amounts between 1980 and 1983 are unavailable). It also shows the amounts
of the subsidies paid by GSFMO for local wheat and barley. These subsidies are imputed.
They represent the difference between the import prices that could have been paid (on
FOB basis), had the wheat and barley been imported, and the prices that GSFMO paid to
local farmers. The subsidies reflect the extra cost of home grow cereals.
10
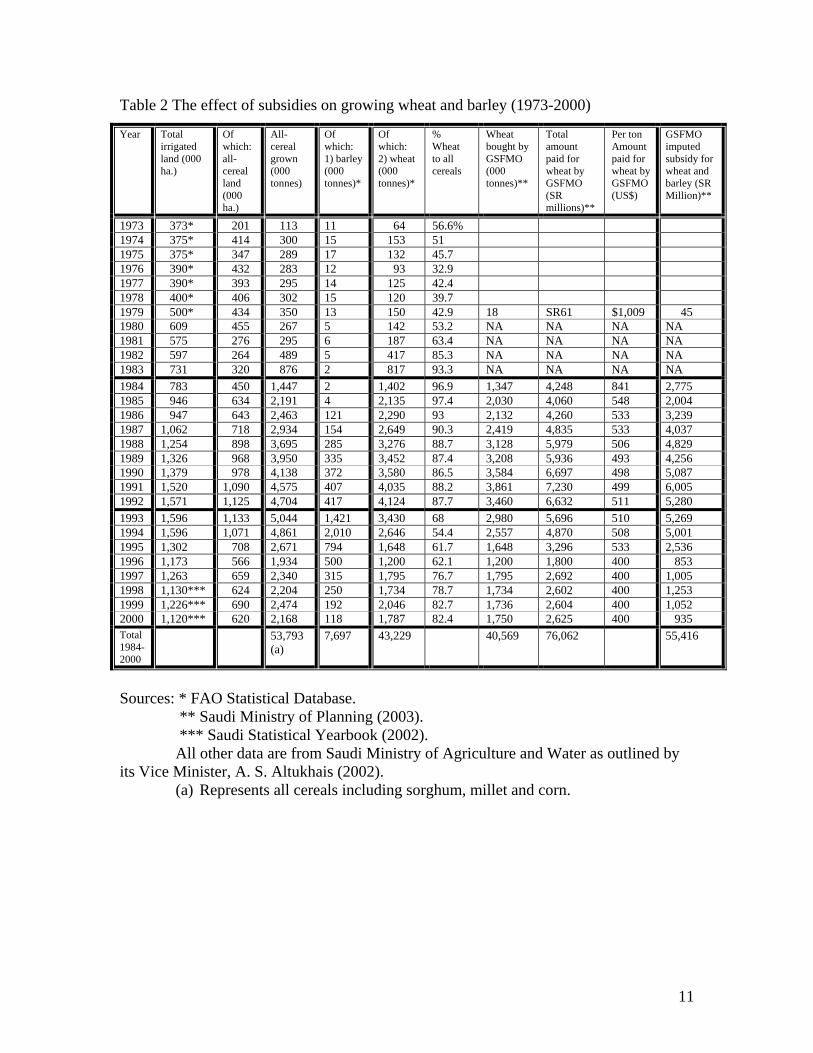
Table 2 The effect of subsidies on growing wheat and barley (1973-2000)
Year Total irrigated land (000 ha.)
Of which: all- cereal land (000 ha.)
All- cereal grown (000 tonnes)
Of which: 1) barley (000 tonnes)*
Of which: 2) wheat (000 tonnes)*
% Wheat to all cereals
Wheat bought by GSFMO (000 tonnes)**
Total amount paid for wheat by GSFMO (SR millions)**
Per ton Amount paid for wheat by GSFMO (US$)
GSFMO imputed subsidy for wheat and barley (SR Million)**
1973 373* 201 113 11 64 56.6% 1974 375* 414 300 15 153 51 1975 375* 347 289 17 132 45.7 1976 390* 432 283 12 93 32.9 1977 390* 393 295 14 125 42.4 1978 400* 406 302 15 120 39.7 1979 500* 434 350 13 150 42.9 18 SR61 $1,009 45 1980 609 455 267 5 142 53.2 NA NA NA NA 1981 575 276 295 6 187 63.4 NA NA NA NA 1982 597 264 489 5 417 85.3 NA NA NA NA 1983 731 320 876 2 817 93.3 NA NA NA NA 1984 783 450 1,447 2 1,402 96.9 1,347 4,248 841 2,775 1985 946 634 2,191 4 2,135 97.4 2,030 4,060 548 2,004 1986 947 643 2,463 121 2,290 93 2,132 4,260 533 3,239 1987 1,062 718 2,934 154 2,649 90.3 2,419 4,835 533 4,037 1988 1,254 898 3,695 285 3,276 88.7 3,128 5,979 506 4,829 1989 1,326 968 3,950 335 3,452 87.4 3,208 5,936 493 4,256 1990 1,379 978 4,138 372 3,580 86.5 3,584 6,697 498 5,087 1991 1,520 1,090 4,575 407 4,035 88.2 3,861 7,230 499 6,005 1992 1,571 1,125 4,704 417 4,124 87.7 3,460 6,632 511 5,280 1993 1,596 1,133 5,044 1,421 3,430 68 2,980 5,696 510 5,269 1994 1,596 1,071 4,861 2,010 2,646 54.4 2,557 4,870 508 5,001 1995 1,302 708 2,671 794 1,648 61.7 1,648 3,296 533 2,536 1996 1,173 566 1,934 500 1,200 62.1 1,200 1,800 400 853 1997 1,263 659 2,340 315 1,795 76.7 1,795 2,692 400 1,005 1998 1,130*** 624 2,204 250 1,734 78.7 1,734 2,602 400 1,253 1999 1,226*** 690 2,474 192 2,046 82.7 1,736 2,604 400 1,052 2000 1,120*** 620 2,168 118 1,787 82.4 1,750 2,625 400 935 Total 1984-2000
53,793 (a)
7,697 43,229 40,569 76,062 55,416
Sources: * FAO Statistical Database.
** Saudi Ministry of Planning (2003). *** Saudi Statistical Yearbook (2002). All other data are from Saudi Ministry of Agriculture and Water as outlined by
its Vice Minister, A. S. Altukhais (2002). (a) Represents all cereals including sorghum, millet and corn.
11

Table 2 shows that during the 16 years between 1984 and 2000, the Saudi
Government paid SR76.062 billion were paid to purchase 40.569 million tonnes of
domestic wheat, an average of SR1,875 per ton, or US$502 per tonne.15 The international
market price for wheat during the same period averaged about US$120 per tonne.16 Of
the purchase price, the direct subsidy portion over and above the cost of imports totaled
SR55.416 billions, or US$14.8 billions.17 The average annual subsidy for each of the
subject 16 years over and above imports’ cost was US$925 million (US$14.8 billions/ 16
years). The per tonne average was US$307 [US$14.8 billions/ (40.569 million tonnes of
wheat + 7.697 million tonnes of barley)]. Since 1992, the subsidies declined. The 2000
amount was SR935 millions, or US$249 millions (SR935 millions/ SR3.75 per US$1).
The per-tonne subsidy was SR491 [SR935 millions/ (1.787 million tonnes of wheat +
118,000 tonnes of barley)], or US$131 per tonne (SR491/ SR3.75 per US$1).
Figure 1 The strong association between government subsidies and cereals growing
(1985-2000)
The effect of Saudi government subsidies on growing wheat and barley between1985 and 2000
0
1,000
2,000
3,000
4,000
5,000
6,000
7,000
1985 1986 1987 1988 1989 1990 1991 1992 1993 1994 1995 1996 1997 1998 1999 2000
Years
0
1,000
2,000
3,000
4,000
5,000
6,000
GSF
MO
Sub
sidy
(S
R M
illio
n)
GSFMO Subsidy (SR Million)Volume of Cereal Grown (000 Tons)
15 SR4.248 billions in 1984/ SR3.58 per US$1 (exchange rate in 1984) + SR4.06 billions in 1985/ SR3.65 per US$1 (exchange rate in 1985) + SR67.754 billions for 1986-2000/ 3.75 per US$1 (exchange rate since 1986) = US$20.366 billions/ 40.569 million tonnes = US$502 per tonne. 16 The average price is for Louisiana wheat. Arkansas average price was about US$114. 17 SR2.775 billions in 1984/ SR3.58 per US$1 + SR2.004 billions in 1985/ SR3.65 per US$1 + SR50.637 billions for 1986-2000/ SR3.75 per US$1 = US$14.8 billions.
12

During the same period (1984 – 2000), direct subsidies from the government
owned Agricultural Bank to the agriculture sector totaled SR7.1 billions, or US$1.9
billions 18 (MOP, 2003: p.220). These were introduced in 1973 to assist farmers to
purchase mainly engines and pumps for groundwater extraction and also general farm
machinery.19 Additionally, direct subsidies to poultry feed between 1985 (the year of
inception of the program) and 2000, totaled SR3.9 billions, or US$1.04 billions 20 (MOP,
2003: P.220). The total of these two subsidies was US$2.94 billions, or US$183.8
millions for each of the subject years.
In 2000, government subsidies to general agriculture was SR266.4 millions and to
poultry feed, SR383.9, thus totaling SR650.3 millions, or US$173.4 millions (SR650.3
millions / SR3.75 per US$1).
Total direct subsidies to the agricultural sector between 1984 and 2000 would be
US$17.7 billions (US$14.8 millions +US$1.9 millions + US$1.04 millions).21 The
average annual amount of subsidies between 1984 and 2000 would be US$1.1 billions
(US$17.7/ 16 years).22
18 (SR1.449 billions in 1984/ SR3.58 per US$1) + (SR1.080 billions/ SR3.65 per US$1) + (SR4.584 billions/ SR3.75 per US$1) = US$1.9 billions. 19 The subsidy program granted 45% of the price of farm machinery, 50% of the price of fertilizers, 50% of the price animal feed concentrate, 30% of poultry plus dairy farms (20% if financed by the Agricultural Bank) and 100% of transportation cost of 200 or more daily cattle (SAMA, 1976 Annual Report: p.58). 20 (SR267.4 millions/ SR3.65 per US$1) + (SR3.641 billions/ SR3.75 per US$1) = US$1.04 billions. 21 This is in addition to the cost of concessionary terms that the government owned Agricultural Bank provides on its long-term loans for well drilling and casing, irrigation equipment, farm-machinery and pumps, as well as the short-term working capital loans to help farmers purchase fuel, fertilizers, seeds, insecticides and pay labor’s wages. These loans are effectively interest free. Total loans disbursed since the bank’s inception in 1965 and 2000 reached SR32.5 billions (SAMA, 2001: p.225), or US$8.7 billions. 22 Additionally the imputed value of the land given away by the government under the 1968 Regulation for Fallow Land Distribution and specifically used for crop growing should be added. By 1999, the distributed land reached 3 million hectares (SAMA, 2001: p. 229).
13

2.B. Indirect government subsidies
In addition to the direct subsidies, the annual imputed value of a range of indirect
subsidies to input factors of production need to be added, such as, electricity 23 plus the
fuel to operate farm machinery, transportation equipment and pumps. Irrigation water in
Saudi Arabia is mostly extracted through the use of mechanical energy produced by
pumps driven by electricity from diesel generators. It is estimated that the energy
required for pumping 1 m3 of water from wells range between 0.4 Kilowatt-hour (Kwh)
and 0.8 Kwh (W. Abderrahman, 2001: p.247), depending on well’s depths. As such, the
electricity needed to lift 18.303 billion m3 of irrigation water in 1999 would have ranged
between 7.3 million Megawatt-hours (Mwh) (18.303 billion m3* 0.4 Kwh) and 14.6
million Mwh (18.303 billin m3* 0.8 Kwh), or an average of 10.95 million Mwh [7.3
million Mwh + 14.6 million Mwh)/ 2]. During 1999, industrial and private electricity
consumption was 111 million Mwh (SSY, 2001: p.352). Thus, in terms of energy, the
cost of the 1999 Saudi irrigation water supply could be estimated at about 10% of total
Saudi electricity consumption cost (10.95 million Mwh/ 111 million Mwh).
2.C. Estimate of government capital investment in agricultural infrastructure
projects and their annual economic cost of operations
The economic cost of operations, depreciation, and maintenance of government
infrastructure projects that benefited agricultural development should be added, including
an opportunity cost of government capital investment in its best alternative use. Such
projects include, for example, irrigation canals, land reclamation, drainage schemes, rural
roads and dam construction. The 5-year development plan between 1975 and 1979
allocated SR39 billions to the development of agriculture as well as water resources, of
which SR4.685 billions, or US$1.3 billions (SR4.685 billions/ SR3.5 average exchange
rate of the period) were for agricultural development programs (SAMA, 1976: p.58). The
23 Between 1984 and 2000, government subsidies to electric companies were SR11.695 billions (MOP, 2003: p.220), or US$3.17 billions (SR3.05 billions/ SR3.58 per US$1 + SR1.75 billions/ SR3.65 per US$1 + SR6.8949 billions/ SR3.75 per US$1 = US$3.17 billions).
14

5-year plan between 1980 and 1984 allocated SR72 billions (SAMA, 1981: p.65), of
which SR7.975 billions, or about US$2.3 billions (SR7.975 billions/ SR3.48 average
exchange rate for the period) were for agriculture (Europa, 2002: p.909). Between 1984
and 2000, based on calculations from data in Ministry of Planning’s “Achievements of
the Development Plans, 2003,” it may be estimated that government capital investment in
agriculture and related projects totalled about SR21.7 billions, or about US$5.8 billions.24
Total government capital investment in agricultural projects between 1975 and 2000
would, thus, be estimated at around US$9.4 billions (US$1.3 billions + US$2.3 billions +
US$5.8 billions). Assuming annual operating overhead of 5% of capital investment,
depreciation charges of 4% (composite useful life of 25 years) and opportunity cost of
capital of 5%, the cost of operating government’s infrastructure projects that benefited
the agricultural sector in 2000 would be guesstimated at US$1.3 billions (US$9.4
billions* 14%). This represents US$ 1,161 per hectare annually [US$1.3 billions/ 1.120
million hectares (table 1)], or US$152 per tonne of all crops (US$1.3 billions/ 8.545
million tonnes in 2000). If the aggregate rates for opportunity capital cost, operations and
depreciation were assumed to be 20% instead of 14%, the annual operating overhead
becomes US$1.88 billions (US$9.4* 20%), instead of US$1.3 billions.
These subsidies and investments were made during a period of persistent and
large budget deficits. Between 1984 and 2000, the total deficit reached SR762 billions, or
US$203 billions (MOP, 2003: p.195). Consequently, government debt in 2001 reached
about SR630 billions, or about US$168 billions (SR630 billions/ SR3.75 exchange rate),
representing 99% of the 2001 estimated Saudi GDP (SAMBA, February, 2002: p.1).
24 Total government gross fixed capital formation between 1984 and 2000 at 1994 constant prices was SR597 billions (MOP, 2003: p.211). To estimate the proportion of this amount that was allocated to agricultural projects, it is assumed here that the proportion was equal to the difference in the contribution that the agricultural sector made into Saudi GDP, between the average of a few years before 1984 and the average of the period between 1984 and 2000. This was 3.635% (6.735% being the average contribution of agriculture, forestry and fishing into GDP between 1984 and 2000 – 3.1%, the average contribution of the same sector to GDP in 1969, 1974 and 1979 = 3.635%). Thus, 3.635%* SR597 billions = SR 21.7 billions. Over the subject 16 years, this was equivalent to US$5.8 billions [(SR74.01 billions of capital formation in 1984/ SR3.58 per US$1 exchange rate in 1984) + SR50.31 billions of capital formation in 1985/ SR3.65 per US$1 exchange rate in 1985) + SR473 billions of capital formation between 1986 and 2000/ SR3.75 per US$1 exchange rate since 1986)], or some US$363 million per annum (US$5.8 billions/16 years). This guesstimate is consistent with the actual investments of the previous ten years of US$3.6 billions (US$1.3 billions + US$2.3 billions), or US$360 millions per annum (US$3.6 billions/ 10 years).
15
2.D. Estimate of private sector’s capital investment in agriculture and the
annual economic cost of production
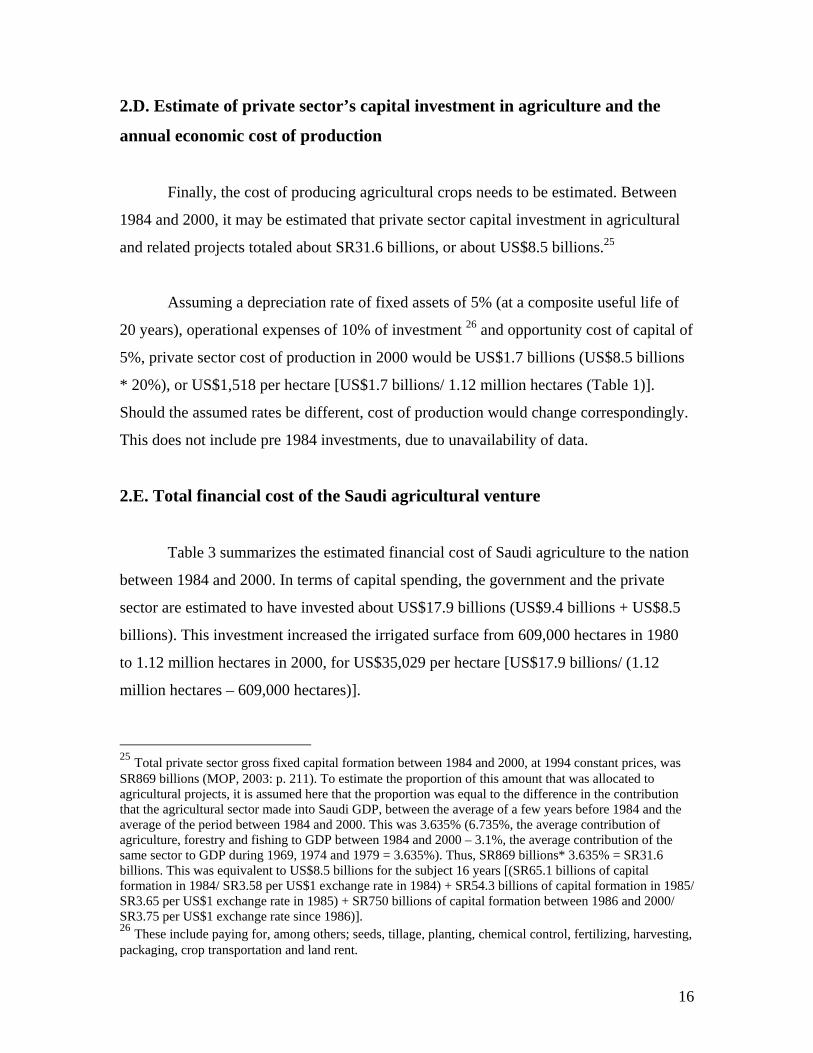
Finally, the cost of producing agricultural crops needs to be estimated. Between
1984 and 2000, it may be estimated that private sector capital investment in agricultural
and related projects totaled about SR31.6 billions, or about US$8.5 billions.25
Assuming a depreciation rate of fixed assets of 5% (at a composite useful life of
20 years), operational expenses of 10% of investment 26 and opportunity cost of capital of
5%, private sector cost of production in 2000 would be US$1.7 billions (US$8.5 billions
* 20%), or US$1,518 per hectare [US$1.7 billions/ 1.12 million hectares (Table 1)].
Should the assumed rates be different, cost of production would change correspondingly.
This does not include pre 1984 investments, due to unavailability of data.
2.E. Total financial cost of the Saudi agricultural venture
Table 3 summarizes the estimated financial cost of Saudi agriculture to the nation
between 1984 and 2000. In terms of capital spending, the government and the private
sector are estimated to have invested about US$17.9 billions (US$9.4 billions + US$8.5
billions). This investment increased the irrigated surface from 609,000 hectares in 1980
to 1.12 million hectares in 2000, for US$35,029 per hectare [US$17.9 billions/ (1.12
million hectares – 609,000 hectares)].
25 Total private sector gross fixed capital formation between 1984 and 2000, at 1994 constant prices, was SR869 billions (MOP, 2003: p. 211). To estimate the proportion of this amount that was allocated to agricultural projects, it is assumed here that the proportion was equal to the difference in the contribution that the agricultural sector made into Saudi GDP, between the average of a few years before 1984 and the average of the period between 1984 and 2000. This was 3.635% (6.735%, the average contribution of agriculture, forestry and fishing to GDP between 1984 and 2000 – 3.1%, the average contribution of the same sector to GDP during 1969, 1974 and 1979 = 3.635%). Thus, SR869 billions* 3.635% = SR31.6 billions. This was equivalent to US$8.5 billions for the subject 16 years [(SR65.1 billions of capital formation in 1984/ SR3.58 per US$1 exchange rate in 1984) + SR54.3 billions of capital formation in 1985/ SR3.65 per US$1 exchange rate in 1985) + SR750 billions of capital formation between 1986 and 2000/ SR3.75 per US$1 exchange rate since 1986)]. 26 These include paying for, among others; seeds, tillage, planting, chemical control, fertilizing, harvesting, packaging, crop transportation and land rent.
16

In terms of annual operating expenses, this may be estimated at US$4.109 billions
for each of the 16 years involved at 1994 constant prices (Table 3). This makes the per-
tonne cost of all-agriculture produce in 2000 some US$481 [US$4.109 billions/ 8.545
million tonnes (Table 1)] and the total of operating expenses between 1984 and 2000
about US$65.7 billions (US$4.109* 16 years). Thus, the estimated total financial outlay
of this venture becomes US$83.6 billions (US$17.9 billions+ US$65.7 billions).
Additionally, the agricultural sector benefited from three subsidies, un-quantified
here; namely, a) subsidized electricity and fuel prices, b) concessionary borrowing terms
from the Saudi Agricultural Bank on US$8.7 billions [Section (2.A) above] and, c)
government land given away under the 1968 Regulation for Fallow Land distribution
(Section 2.C). Also, the discussion did not address: d) the cost of abandoning 476,000
hectares, or 30% of the country’s irrigated surface (from 1.596 million hectares in 1994
to 1.12 million hectares in 2000), which resulted from reducing government subsidies
since 1994. If these elements were accounted for the cost of the venture becomes greater.
Table 3 Saudi capital investments in agriculture, annual operating expenses and
government subsidies (1984-2000) (US$ billions)
Capital
Investment (1)
Annual Operating expenses (2)
Average annual govt. direct subsidies to cereals production (1984–2000) (3)
Average annual direct govt. subsidies for general agricultural purposes (1984-2000) (4)
Total direct govt. subsidies (1984-2000) (5)=(3)+(4)
Total annual operating expenses + govt. subsidies (6)=(2)+(5)
Government 9.4 1.3 0.925 0.184 1.109 2.409
Private sector
8.5 1.7 1.7
Total 17.9 3 0.925 0.184 1.109 4.109
The return from the Saudi agricultural scheme between 1984 and 2000 is
summarized in Table 4. It shows the country’s total production of foodstuffs during the
period and an estimate of their value based on the guesstimated value of similar imports
for the duration.
17

Table 4 Saudi foodstuffs production (1984-2000) and their estimated value
Cereals Vegetables Fruits Red meat Poultry Milk Total Production (million tonnes) (1)
53.793 34.031 15.763 2.459 5.386 10.522
Estimated Per-tonne average Value 1984-2000 (US$) (2)
150* 300 600 2,000 750 250
Product value (US$ billions)
8.1 10.2 9.5 4.9 4 2.6 39.3
Sources: (1) Table 1, for the period between 1985 and 2000 + Altukhais (2002: tables 4 and 5) for the 1984 production year. (2) Personal estimates.
* About US$120 per tonne + some US$30 in freight and insurance
To summarize, between about 1984 and 2000, Saudi agriculture spent US$17.9
billions in capital investment plus US$65.7 billions in production costs (US$4.109
billions* 16 years), not including the four elements mentioned in (2.E) above, for a total
of US$83.6 billions. This enabled local production of foodstuffs that could have been
imported for less than US$40 billions. Additionally, the venture’s water cost was a
mammoth 300 billion m3 of the nation’s mainly non-renewable water endowment. This
issue will be examined in Section 3.
18

2.F. Water depletion premium
Valuation of depletable resources, such as water, requires the inclusion of an
opportunity cost component for depletion, or depletion premium. The premium represents
the present value of the estimated future cost increases that will be associated with water
extraction finite reserves in addition to the normal market value of water (its marginal
extraction cost).
In order to include depletion premium in the economic cost of Saudi irrigation
water the present value of the estimated increases in future extraction costs resulting from
deeper wells and/or from degradation in water quality should be added. These estimates
are at best conjectural. They typically suffer from a number of inherent uncertainties such
as the present knowledge about the size and useful life of the reserves and the level of
future prices for water. Due to lack of reliable data, no attempt to quantify this cost
element will be made.
3. The cost of Saudi agriculture in terms of water
The cost of Saudi agricultural policies in terms of water consumption has been
gigantic. Saudi Ministry of Agriculture and Water (MAW) data in Table 5 show the rapid
development in the country’s agricultural surface between 1980 and 1994 and the
accompanying increase in the volume of irrigation water. It also shows the contrast
during 1994 to 2000 between the steep decline in the size of the irrigated surface and the
relatively insignificant drop in water consumption. Given that rainfall is scant and
perennial rivers and lakes non-existent, Saudi agriculture is practically entirely dependant
on irrigation from ground water reserves.
19
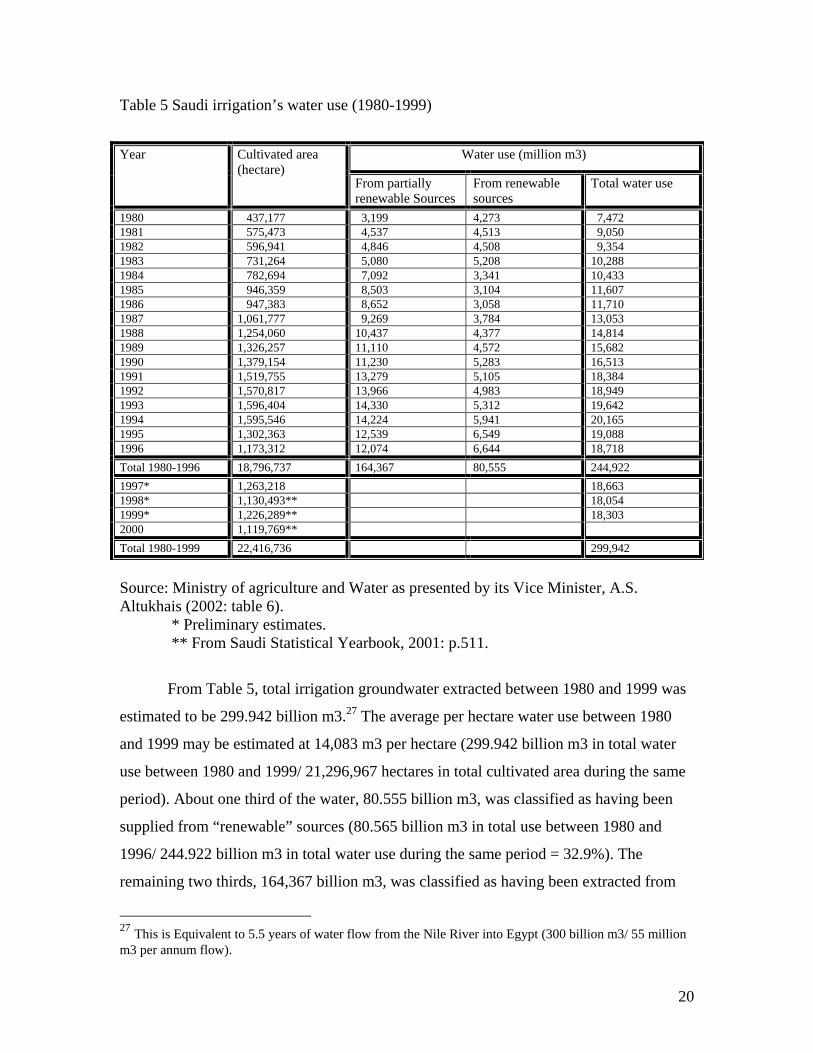
Table 5 Saudi irrigation’s water use (1980-1999)
Water use (million m3) Year Cultivated area
(hectare) From partially renewable Sources
From renewable sources
Total water use
1980 437,177 3,199 4,273 7,472 1981 575,473 4,537 4,513 9,050 1982 596,941 4,846 4,508 9,354 1983 731,264 5,080 5,208 10,288 1984 782,694 7,092 3,341 10,433 1985 946,359 8,503 3,104 11,607 1986 947,383 8,652 3,058 11,710 1987 1,061,777 9,269 3,784 13,053 1988 1,254,060 10,437 4,377 14,814 1989 1,326,257 11,110 4,572 15,682 1990 1,379,154 11,230 5,283 16,513 1991 1,519,755 13,279 5,105 18,384 1992 1,570,817 13,966 4,983 18,949 1993 1,596,404 14,330 5,312 19,642 1994 1,595,546 14,224 5,941 20,165 1995 1,302,363 12,539 6,549 19,088 1996 1,173,312 12,074 6,644 18,718 Total 1980-1996 18,796,737 164,367 80,555 244,922 1997* 1,263,218 18,663 1998* 1,130,493** 18,054 1999* 1,226,289** 18,303 2000 1,119,769** Total 1980-1999 22,416,736 299,942
Source: Ministry of agriculture and Water as presented by its Vice Minister, A.S. Altukhais (2002: table 6). * Preliminary estimates. ** From Saudi Statistical Yearbook, 2001: p.511.
From Table 5, total irrigation groundwater extracted between 1980 and 1999 was
estimated to be 299.942 billion m3.27 The average per hectare water use between 1980
and 1999 may be estimated at 14,083 m3 per hectare (299.942 billion m3 in total water
use between 1980 and 1999/ 21,296,967 hectares in total cultivated area during the same
period). About one third of the water, 80.555 billion m3, was classified as having been
supplied from “renewable” sources (80.565 billion m3 in total use between 1980 and
1996/ 244.922 billion m3 in total water use during the same period = 32.9%). The
remaining two thirds, 164,367 billion m3, was classified as having been extracted from
27 This is Equivalent to 5.5 years of water flow from the Nile River into Egypt (300 billion m3/ 55 million m3 per annum flow).
20

“partially renewable” aquifers. It should be noted from Ministry of Planning estimates
that the volume of non-renewable water consumption is much greater than that reported
by Ministry of Agriculture and Water (Table 6).
It is difficult to guesstimate how much, if any, of this huge volume of water was
actually renewed or replenished. Classifying water sources as “renewable” does not mean
replenishment. It does not even mean equilibrium in aquifers’ water balance between
sources and uses. It merely describes a physical characteristic of the land, being able to
absorb and store rainwater if and when water becomes available. Actually, it may be
contended that during the past twenty years, over extraction from Saudi “renewable”
water sources has turned the balance in the aquifers into negative. This is because water
extraction has been greater than rainfall. While rainwater after evaporation is estimated at
less than 2 billion m3 per annum,28 the volume of extracted water had increased from 4.3
billion m3 in 1980 to 6.6 billions m3 in 1996. If over-extraction continues it will cause
water levels to deepen, pressure to weaken and extractable volume to dwindle. These will
increase salinity and the amounts of quality-degrading minerals in the water. Recent
evidence shows that such problems have already been manifesting themselves
increasingly in most parts of the country (Section 1).
As for the “partially renewable” aquifers, extraction will lead to deterioration in
their water quality and gradual depletion. It is estimated that between 1982 and 1997 the
number of wells increased from 26,000 to 86,000 (W. Abderrahman, 2001: pp.249, 250).
Water extraction from “partially renewable” sources climbed from 3.2 billion m3 in 1980
to 14.3 billion m3 in 1993, then dropped to 12 billion m3 in 1996, for a total extraction
during the period of 164 billion m3 (Table 5). MAW’s notion that the geological
formations of Saudi “partially renewable” aquifers might possibly be allowing the
28 Aside of the South Western mountainous area, rainfall is scant. Evaporation is high. It is thought that 20% of the rain evaporates immediately and a further 50% through water runoff in seasonal streams (Saudi Water Net). Flash floods are frequent. In order to avert flooding, replenish aquifers and utilize the collected water in irrigation and households the government constructed by 2000 a total of 197 dams with aggregate storage capacity of 810 million m3 (SSY, 2001: p.536).
21

replenishment of water in these aquifers from unidentified underground sources (A.
Altukhais, 2002: p.3) is at best conjectural.
As discussed in Section 1, the drop in irrigation water use was much less
proportional to the drop in cereals production or the size of the irrigated surface. Between
1994 and 1999, while the overall irrigated surface declined by 23% (1.126 million
hectares in 1999/ 1.596 million hectares in 1994), water used in irrigation was reduced by
only 9% (18.303 billion m3 in 1999/ 19.642 billion m3 in 1993). Figure 2 illustrates.
Figure 2 The excessive use of irrigation water between 1994 and 1999 as compared with
1980 and 1993
Saudi irrigationÕs water use and the irrigated surface between 1980 and 1999
0
200,000
400,000
600,000
800,000
1,000,000
1,200,000
1,400,000
1,600,000
1,800,000
1980
1981
1982
1983
1984
1985
1986
1987
1988
1989
1990
1991
1992
1993
1994
1995
1996
1997
1998
1999
2000
Years
0
5,000
10,000
15,000
20,000
25,000
Tota
l wat
er u
se
(mill
ion
m3)
Cultivated area (hectare)Total water use (million m3)
4. The challenge of Saudi data Conflicting estimates between Saudi Ministry of Planning (MOP) and Ministry of
Agriculture and water cast doubt on the accuracy of official Saudi data. Quoted by W.
Abbderrahman (2001: table 2), MOP estimates that overall Saudi water supply from
surface and renewable sources was 2.1 billion m3 in 1990, and 2.14 billion m3 in 1996.
These volumes contrast with MAW’s estimates of irrigation alone, 5.283-billion m3 in
1990 and 6,644 billion m3 in 1996 (Table 5).
22

Also, Ministry of Planning reported that overall water supply from “non-
renewable” sources was 24.489 billion m3 in 1990 and 15.376 billion m3 in 1997. These
compare with Ministry of Agriculture and Water supply figures of 11.23 billion m3 in
1990 and 12.074 billion m3 in 1996 for irrigation purposes. It is curious to note that the
planning ministry uses the word “non-renewable” to signify what the agricultural
ministry describes as “partially renewable” groundwater sources.29
Table 6 summarizes the divergence in the sources of water estimates between the
two ministries. It shows that between 1990 and 1997 the divergence between the two
ministries narrowed. However, the divergence in the allocation between renewable and
non-renewable sources remained wide.
Table 6 Saudi Renewable and non-renewable water estimates, according to Ministry of
Agriculture and Water and Ministry of Planning for 1990, 1996 & 1997 (billion m3)
1990 MAW 1990 MOP 1996 MAW 1997 MOP
Renewable water (1)
5.283 2.1 6.644 2.14
Non-renewable (2) 11.23 24.489 12.074 15.376 Total (3) 16.513 26.589 18.718 17.516 (1) / (3) 32% 7.9% 35.5% 12.2%
Source: A.S. Altukhais (2002: table 6) and W. Abderrahman (2001: table 2).
The divergence between the two ministries is also reflected in the volume of
water used by the agricultural sector. While, according to MAW, irrigation used 7.472
billion m3 in 1980, 16.513 billion m3 in 1990 and 18.3 billion m3 in 1999, MOP reports
1.85 billion m3 in 1980, 25.589 billion m3 in 1990 and 11.2 billion m3 in 2000. Table 7
summarizes.
29 Saudi Water Net reports that in 2000, “non-renewable groundwater” supply was estimated at 12.3 billion m3 while “surface and renewable” water supply was 1.8 billion m3.
23

Table 7 Agriculture use of water according to Ministry of Agriculture and Water and
Ministry of Planning (1980–2000) in billion m3
1980 1990 1999 2000 MAW 7.472 16.513 18.303 N/A MOP 1.85 25.589 N/A 11.2
Source: A.S. Altukhais (2002: table 6) and W. Abderrahman (2001: table 1)
5. Saudi water availability
Groundwater represents the major water source in Saudi Arabia. Rainfall is scant.
There are two types of groundwater, renewable and non-renewable. The country’s severe
arid conditions cause surface and renewable groundwater to be very limited. Estimating
their volumes accurately is difficult. According to Ministry of Agriculture and Water,
renewable water aquifers are encountered in about one third of the surface of Saudi
Arabia, known as the “Arab Shield” (Altukhais, 2001: p.3). Table 5 attributes to
renewable water sources one third of total irrigation water use (80.565 billion m3/
244.922 billion m3). Much of Saudi renewable groundwater is thought to be in the
Southeastern region. Water from this source may be accessed through wells ranging in
depths between a few meters and 100 meters. As discussed above, “Renewable” does not
necessarily mean full water replenishment of the extracted water. It could even be argued
that the water balance in these aquifers has been negative since 1980, probably earlier. It
may be predicted that unless water extraction is reduced to the level of water sources,
these aquifers will eventually run out of water.
Non-renewable aquifers represent the major source of water in Saudi Arabia. It is
thought that they were formed 600 million years ago (Altukhais, 2002: p.3). Water may
be found at depths ranging from 100 meters to 500 meters, sometimes up to 2,500 meters.
Due to the unavailability of mechanical means and money they remained largely
undisturbed until the early 1980s when exploitation started in earnest.
24

There are 27 non-renewable aquifers in Saudi Arabia. Reserves are estimated to
be about 500 billion m3 (Saudi Water Net). About 50% is thought to be in five locations.
Table 8 Groundwater reserves estimates in the five major aquifers (billion m3)
Aquifer Proven Probable Possible Saq 65 100 200 Wajid 30 50 100 Minjur & Dhruma 18 35 85 Wasia 120 180 290 Umm ErRadhuma 16 40 75 Total 249 405 750
Source: Saudi Water Net
The first deep water well was drilled in 1937 by ARAMCO in the Eastern
province. In 1956, the Minjur aquifer was discovered as a result of drilling the Shumaisy
well in downtown Riyadh. The Ministry of Agriculture and Water started surveying
groundwater resources in the early 1960s. The effort was intensified in the 1970s using
advanced tools and methods. The estimated volumes of these surveys were alarmingly
low to scientists, researchers and others. In the early 1980s, two “detailed” MAW studies
concluded that considerably more groundwater reserves existed than was previously
estimated (Altukhais, 2002: p.11). This was the prerequisite needed to embark upon an
ambitious project to make the desert bloom.
Using MOP’s 1997 estimate of Saudi overall water uses, 500 billion m3 of non-
renewable water reserves could be depleted within 33 years [500 billion m3/ 15.376
billion m3 per annum (Table 6)] from the date of the estimate. Using MAW’s data will
extend the expected period to 38 years.30 These projections assume that:
30 Since MAW’s data cover irrigation water use only, water for household and industrial uses drawn from non-renewable sources should be added for proper comparison. This is estimated at 1 billion m3 per annum (2 billion m3 for the two non-irrigation uses – 1 billion m3 in desalinated and treated wastewater). The useful life estimate under MAW’s data becomes 38 years [500 billion m3/ (12.074 billion m3 per annum (Table 5) + 1 billion m3) = 38.2 years].
25

a) Reserves estimates are current. If not, water consumption figures in Table 5
between the actual date of the survey and the present time need to be deducted. This
could reduce the 500-billion m3 reserves by as much as one third, to 336 billion m3 (500
billion m3 in proven reserves – 164 billion m3 utilized between 1980 and 1999 (Table 5).
336 billion m3 could be depleted within 22 years, using MOP’s 1997 estimate [336
billion m3/ 15.376 billion m3 annually (Table 6)] and 26 years, using MAW’s 1996
estimate [336 billion m3/ (12.074 billion m3 annually (Table 6) + 1 billion m3)]. Clearly,
if the volume of water reserves is greater than 500 billions, or if new reserves will be
discovered, the useful life of the aquifers becomes longer.
Table 9 Estimate of the expected remaining useful life of Saudi non-renewable aquifers
Estimated volume of water reserves in non-renewable aquifers (billion m3)
Years of useful life using MAW estimates
Years of useful life using MOP estimates
500 500 / 13.074* = 38 500 / 15.376 = 33 336 336 / 13.074* = 26 336 / 15.376 = 22
* 12.074 billion m3 in 1996 irrigation plus 1 billion m3 for domestic and industrial uses.
Table 9 shows that the expected useful life of non-renewable Saudi aquifers may
range between 22 years and 38 years, provided that:
b) Water reserves are extractable in their entirety. If not, the aquifers’ useful life
becomes shorter.
c) Aggregate agricultural water use will remain constant. Unless its growth is
disallowed, agriculture is more likely to require greater volumes of water for two reasons:
1) population growth will increase the demand for food. 2) Increased affluence will
introduce more meat products into Saudi diet, which requires considerably more water to
grow (Allan, IW&I, 2001: p.39).
26

There are two other sources of water supply in Saudi Arabia. Treated wastewater,
used mainly for irrigation, and desalinated water for drinking, household and industrial
uses. They are relatively small in volume. In 2000 the former was around 0.2 billion m3.
The latter was approximately 1 billion m3. Desalinated water meets about 50% of
household water demand with the remaining 1 billion m3 or so per annum being
extracted from wells.
Table 10 Estimates of 1999 Saudi water uses and sources (billion m3)
Groundwater Rain Treated wastewater
Desalinated water
Total
Agriculture 18* 0.5** 0.2 18.7 Domestic 1 1 2 Industry 0.35 0.1 0.45 Total 19.35 0.5 0.2 1.1 21.15
* Ministry of Agriculture and Water (Table 7 above). ** A 25% guesstimate of rainfall of 2 billion m3 per annum.
Total water available and used may be estimated at about 21 billion m3 of which
groundwater sources provided 19.35 billions m3, or 91.5% of total water supply.
5.A. Alternative guesstimate of Saudi water availability
How much water might be left in Saudi aquifers? It may be guesstimated that
irrigation water extraction exhausted thus far about two thirds of the country’s known
non-renewable aquifers. “A technique first published in 1956 by M. King Hubbert…
observed that in any large region, unrestrained extraction of a finite resource rises along a
bell-shaped curve that peaks when about half the resource is gone (Colin J. Campbell and
Jean H. Laherrere, March 1998).” While Hubbert’s theory was developed in connection
with fossil fuel production and reserves, Hubbert (1949: p.107) found that “a growth
27

curve of the utilization of water power, should rise in a manner similar to those of the
fossil fuels.”31
Given that: 1) Saudi water extraction has been unrestrained since the start of the
country’s foray into agricultural production since the early 1980s [the decline in cereal
production that started in 1994 was compensated by almost a corresponding increase in
the production of other crops (Table 1)] and, 2) the volume of water extraction from
“partially renewable sources,” according to MAW, described as “non-renewable” by
MOP, reached a peak of 14 billion m3 in 1994 (Table 5), it might be presumed that
1993/1994 signifies the midpoint in the volume of Saudi non-renewable water reserves
that prevailed around 1980. Up to that time water extraction was rather small- 3 billion
m3 in 1980, (Table 5) less so in prior years.32 It follows that, according to Hubbert’s
theory, the volume of Saudi non-renewable water was likely to be around 300 billion m3
[140 billion m3 in total extractions between 1980 and 1994 (Table 5)* 2= 280 billions)],
not 500 billion m3.
Unless new aquifers will be discovered and/or the volume of extraction changed
the remaining reserves in 2001 might be estimated at around 90 billion m3 [300 billion
m3 – (164 billion m3 extracted between 1980 and 1996 (Table 5) + estimated extraction
of about 48 billion m3 between 1997 and 2000].33 At this level, the remaining useful life
of the reserves would be about 7 years according to MAW estimate (90 billion m3/
13.074 billion m3) and about 6 years, according to MOP estimate [90 billion m3/ 15.376
billion m3 (Table 9)].
31 Hubbert’s contribution has been acclaimed in scientific and industrial circles. At a conference to honor the 100th anniversary of his birth, Hubbert was described as “the single greatest influence on the development of the quantitative study of groundwater hydrology.” 32 Total cultivated land in 1980 was 609,000 hectares. In 1973, it was 373,000 hectares (Table1), thus requiring less water. 33 Average of 12 billion m3 in each of the four years, as prevailed in 1996, given that the cultivated surface during this period remained equal to that of 1996 of about 1.2 million hectares.
28

6. Saudi water requirement
Like other countries, there are three main water uses in Saudi Arabia. The first is
to grow foodstuffs. Typically, this is by far the greatest use everywhere. “An individual
needs each year at least 1,000 cubic meters of water, either naturally occurring in soil
profiles, or transported to the profiles by irrigation systems, to raise the food needs of that
individual” (Allan, 2001: p.6). The composition of diet determines the volume of water
embedded in food. While it requires one thousand tons of water (1,000 cubic meters) to
produce a ton of wheat, it requires about 16,000 cubic meters of water to produce a tonne
of meat (Allan, IW&I, 2001: p.39). Therefore, the more meat a diet contains the more
water embedded in food is consumed. Saudi Arabia’s 23 million-population in 2002
would need an estimated 23 billion m3 of water per annum in the form of foodstuffs (23
million population* 1,000 m3 per person).
The second water use is for household purposes, cooking, cleaning and sanitation.
This generally ranges between 50 m3 and 100 m3 annually, less in rural communities.
The Saudi average is 250 liters per day (Altukhais, 2002: p.13). It makes the annual per
capita drinking and household water use some 91.25 m3, or 2.1 billion m3 in 2002 (91.25
m3* 23 millions). Per capita drinking water averages merely 1 m3 per annum.
The third water use is industrial. Its volume is rather modest, estimated in 2000 at
around 450 million m3 (Altukhais, 2002: p.5).
Total Saudi water requirements could be estimated at about 25.55 billion m3 (23
billion m3 for irrigation + 2.1 billion m3 for drinking and households + 0.45 billion m3
for industry). Of this volume, 90% is used in agriculture (23 billion m3/ 25.55 billion m3)
and the remaining 10% in other uses. Total water use at the present time is about 21.15
billion m3 (Table 10). The deficiency would be about 4.4 billion m3, or 17.2% of the
country’s water needs. As Saudi population grows, water demand and associated deficits
are expected to grow proportionately. The water deficit will have to be met through the
importation of food, or virtual water.
29
7. Saudi quest for food independence
Saudi population growth is strong. With a rate of about 3.84% between 1980 and
2000 (from 9.6 millions to 20.4 millions), it has been among the highest in the world.34 It
is forecast to reach 31 millions in 2010 (Statistical Abstract of the United States: 2000:
p.823) and over 40 millions in 2025 (Altukhais, 2002: p.4). Given such a high rate of
growth and regardless of how large Saudi water reserves might be, food independence is
an impossible task to sustain on the long run. This is because Saudi groundwater reserves
are mainly non-renewable. Their finite nature makes it only a matter of time before
irrigation exhausts their recoverable contents.
Despite using mammoth volumes of water over the past two decades and
spending huge amounts of money, Saudi food sufficiency remains illusive. In 2001,
Saudi Arabia imported SR18 billions in foodstuffs, or US$4.8 billions [SR18 billions
(SSY, 2001: p.448)/ 3.75 exchange rate). During the 5 years ending in 2001, food imports
totaled US$24.6 billions, or an average of US$4.9 billion annually (SSY, 2001: p.448).
Hoekstra and Hung (2003: p.42), estimate that between 1995 and 2000 Saudi Arabia’s
imports of foodstuffs were equivalent to gross virtual water imports of 11.313 billion m3
per annum. Although major achievements in food sufficiency have been made, the ratio
is expected to retract. The current volume of water extraction from the country’s non-
renewable aquifers could not be sustained for a long time in the future.
A population of 23 millions means that their annual consumption of water 1,000
m3 per person (Allan, 2001: p.6). Given the agricultural ministry’s estimates that in 1999
the volume of water used in irrigation was about 18 billion m3 (Table 1) the ratio of
locally produced foodstuffs to the country’s total needs would be around 78% (18 billion
m3/ 23 billion m3). The proportion becomes 49% (11.2 billion m3 (table 4.6)/ 23 billion
m3) if the data of the ministry of planning were used. The Hoekstra and Hung estimate is
more compatible with Ministry of planning than Ministry of Agriculture and Water data. 34 The combined Saudi population growth of nationals and foreign workers slowed to 3.49% between 1985 and 2000 (from 12.2 millions to 20.4 millions, respectively) and further down to 2.84% between 1990 and 2000 (from 15.4 millions to 20.4 millions, respectively).
30

In 2010, Saudi water consumption embedded in foodstuffs could be estimated to
reach 31 billion m3 (31 million population* 1,000 m3 per person). Assuming that the
volume of irrigation water remains unchanged, the proportion of food produced
domestically to total food requirements, according to MAW, would drop to 58% (18
billion m3/ 31 billion m3). The proportion becomes 36% (11.2 billion m3/ 31 billion m3),
using MOP data.
In 2025, Saudi water consumption embedded in foodstuffs could be estimated to
reach 40 billion m3 (40 million population* 1,000 m3 per person). Assuming that the
volume of irrigation water remains unchanged from its 18 billion m3 in 1999, the
proportion of food produced domestically to total food requirements, according to MAW,
would drop further to 45% (18 billion m3/ 40 billion m3). The proportion would be 28%
(11.2 billion m3/ 40 billion m3), using MOP data.
Table 11 Estimates of Saudi domestic production of foodstuffs as a proportion of the
country’s total requirements
Year Population (millions) MAW data estimates (%)
MOP data estimates (%)
2002 23 78 49 2010 31 58 36 2025 40 45 28
Will there be sufficient groundwater by 2010, or 2025 to maintain irrigation at the
2000 level of 1.12 million hectares? The answer is doubtful. An additional 25 years of
water extraction at the MOP rate of 15.376 billion m3 per annum (Table 6) would deplete
about 385 billion m3 (15.376 billions* 25 years). At the MAW estimate of 12.074 billion
m3 per annum, depletion would be 302 billion m3 (12.074 billions* 25 years). These are
dangerously high utilization rates relative to the estimated proven reserves of 500 billion
m3, let alone 336 billion m3 (Sections 5 and 5.A).
31

8. Possible motives behind Saudi foray into desert agriculture
Why was it that the Saudi Government chose the course of expensive agricultural
development for an arid country despite its persistent and large budget deficits during the
1980s and 1990s? Is it: A) food independence. B) Settlement of the Bedouins, or C)
enriching the ruling elite? It was probably a combination of all three, but with a special
emphasis on (C).
8.A Food independence
This notion has a nationalistic appeal. It conveys a message of control over Saudi
Arabia’s own political and economic destiny. The strategy might have been prompted by
threats in the US media to withhold food supplies as leverage against unacceptable oil
export and pricing policies, following the 1973 oil boycott and quadrupling of prices.
However, the claim cannot be supported by the facts. There are 2 reasons here:
The first reason is that self-sufficiency in foodstuffs provides neither political nor
economic independence. A review of Saudi balance of trade shows the country’s heavy
reliance on the developed world. Indeed, no country could possibly attain comparative
advantages and production efficiencies in all critical item of modern living. By virtue of
its limited natural resources, except for crude oil, and because of the many hindrances to
diversifying its GDP, Saudi Arabia is heavily dependent on imports of goods and skilled
labor from the USA, Europe and Japan. A boycott by the exporters of, among others,
automotive and agricultural machinery, medical and pharmaceutical apparatus,
telecommunication equipment, computer hardware and software, airplanes, spare parts
and experts to operate and maintain all these could be as detrimental, may be more so, to
Saudi national security than wheat boycott. Indeed, withholding shipments of spare parts
32

and experts for the desalination plants that provide Saudi cities with most of their
drinking and household water could be catastrophic.35
The second reason is that sustained food independence in Saudi Arabia is
impossible to achieve, as discussed in Section 7 above. High rates of population growth
in a country of limited non-renewable water resources will lead eventually to depleting its
aquifers, thus eliminating forever the hope of growing domestic foodstuffs again.
8.B Settlement of the Bedouins
In 1968 the Regulation for Fallow Land Distribution was promulgated. It was
intended to settle the Bedouins. The evidence shows, however, that a relatively small
amount of land was distributed during the first twelve years of the Regulation. If the
purpose of the new law were to settle the Bedouins the size of the distributed land
between 1968 and 1980 should have been greater. By the end of 1975, the government
distributed 48,500 hectares of fallow land (SAMA, 1976: p.60). As of 1980, the total was
still 123,163 hectares distributed to 19,421 individuals and 87 agro-business projects
(SAMA, 1981: p.66). The speed accelerated during the 1980s. 373,580 hectares were
distributed between 1980 and 1992 (496,743 hectares as of the end of 1992 – 123,163
hectares in 1980) to 74,196 individuals (SAMA, 1992: p.97). Since 1992, the pace of
land distribution to individuals slowed down, 107,811 hectares by the end of 1999
(604,554 hectares in 1999 – 496,743 hectares in 1992) benefiting 93,432 individuals
(SAMA, 2001: p.230). The history of this law suggests that its purpose evolved to
increase foodstuffs production.
8.C Enriching the ruling elites 35 In 1983, there were 16 desalination plants in Saudi Arabia with total daily capacity of 1.532 million m3, or about 559.2 million m3 per annum. By 2000, the number of the plants increased to 30 with a daily capacity of 2.877 million m3, or about 1.05 billion m3 per annum (Altukhais, 2002: table 1).
33

The Saudi ruling elite is composed of four groups. They support the 4,000 or so
members of the ruling family in return for privileges and benefits. These are: the religious
establishment, the tribal leadership, the major merchant families and the military class.
The first group lends the regime religious legitimacy and uses its spiritual influence to
help it control society. The second and third groups control the rank and file members of
the business and tribal communities. This structure is particularly important in a country
with no civil society organizations, labor unions, political parties, student and women
associations, social clubs and the like. The military class defends the regime against local
dissent. It is thought that Saudi desert agriculture was a scheme to enrich these groups.
Such might be deduced from:
8.C.1. Growing considerably more wheat than the amount needed for domestic
self-sufficiency. In 1992, wheat production reached 4.1 million tons for a population of
16.2 millions, more than double local needs.
8.C.2. The early participants in Saudi desert agriculture were business
entrepreneurs, not professional farmers. They were absentee owners with little or no
experience in farming. Over the millennia, severe aridity prevented the development of
settled agricultural communities in the Arabian Desert of any size. Farming is alien to the
desert habitat and the culture of its peoples. The promise of high financial returns from
government subsidies to wheat growing enticed some of the country’s businessmen to
underwrite the risk of the new venture in the early 1980s. They imported the resources
needed for the new enterprise from around the world, the engineers, mechanics, farm
managers and laborers along with those giant 1000-foot-arm pivot irrigation systems,
pumps, tractors, harvesters, seeds, chemicals and fertilizers.
The new investors needed to have good investment acumen and business
experience. They also had to be financially sound, with substantial landholdings. Mainly
34

powerful businessmen,36 especially in the Riyadh and Qasim region in the Central
Province possessed these prerequisites. In 1998, the share of this Province of the overall
Saudi cropping area was 49%. It became 42% in 1999 and 43% in 2000 (SSY, 2001:
p.511).37 Other Saudis, including the beneficiaries of the fallow land law, did not have the
financial means, managerial skills or land size for wheat growing.38 Between 1980 and
1992, of the overall increase in the irrigated area of 962,000 hectares [1.571 million
hectares in 1992 – 609,000 hectares in 1980 (Table 2)], only 373,580 hectares, or 33%
may be attributed to the 1968 land distribution law. The rest belonged to the country’s
business elites.
9. An observation on Saudi water use in agriculture
As the chapter on Saudi desert agriculture eventually reaches its end, a footnote in
the long sweep of history will, nonetheless, remain. It will tell a side story to the Saudi oil
bonanza. This is the tale of the one-generation that spent tens of billions of dollars from
its newly found oil wealth (plus other un-quantified subsidies) on the unnatural endeavor
of trying to make the desert bloom. The chapter will also tell the story of the one Saudi
generation that ushered unsustainable environmental politics to its desert habitat. It
consumed 300 billion m3 of mostly non-renewable water reserves in return for growing
cereals, alfalfa, meat and milk in the forbidding sun of the Arabian Desert.
36 Among these were four of Saudi Arabia’s reputedly richest businessmen, the Alrajhi brothers of Bukairia, Qassim. Their interests span banking, real estate, building materials, poultry farming and a wide range of manufacturing industries. In the early 1980s, they added wheat growing. Soon, two brothers became the largest wheat producers. Alrajhi’s businesses in every field are among the largest in the country. For example, their flagship banking entity in the early 1980s was the Alrajhi Company for Currency Exchange and Commerce, a partnership of the four brothers that finds its roots in the 1940s. In 1988, it became Saudi Arabia’s only publicly held Islamic bank, Alrajhi Banking and Investment Corporation. As of 12/31/2000 the Bank had shareholders’ equity of 1.7 billions, market capitalization of US$12 billions (SAMBA/MEED Investor’s guide, 2001) and over 450 branches. A poultry farm, established in the mid 1980s, owned by one of the brother, was thought to be the largest contiguous factory of its kind worldwide. These investors were attracted to wheat growing on a large scale by virtue of government subsidies. 37 In 1998, the cropping area in the Central province was 553,890 hectares out of a total of 1.13 million hectares. In 1999 it became 512,505 hectares out of a total of 1.226 million hectares. In 2000 it was 485,242 hectares out of a total of 1.12 million hectares (SSY, 2001: p.511). 38 Under the terms of the Regulation individual cultivators were granted “not less than 5 hectares and not more than 10 hectares” (SAMA, 1976: p.60). Such size land was too small for efficient wheat farming.
35

What was the instrument that enabled this situation to develop? The answer is that
it developed as a result of government subsidies to desert irrigation. Subsidies distort the
efficient workings of markets. They cause resources to be misallocated. The above
analysis shows that under current international prices for agricultural crops, had Saudi
Arabia not subsidized desert irrigation, the cost of growing unsubsidized agricultural
crops would have been much higher than the market prices for similar imports. This
could have led capital funds to be deployed away from loss making desert irrigation
schemes into more rewarding industries, provided that there were no protective tariffs in
favor of local produce. It would also have preserved the country’s non-renewable
aquifers.
References
Allan, Tony, 2001, The Middle East Water Question – Hydropolitics and the Global
Economy, I. B. Taurus.
_________, 2001, Virtual Water- economically invisible and politically silent- a way to
solve strategic water problems, International Water & Irrigation, Vol. 21, No. 4.
Abdrrahman, W, “Energy and Water in Arid developing countries, Saudi Arabia, a case
study” in Water Resources Development, Vol. 17, No. 2, 2001.
Altukhis, Ali bin Saad, Vice Minister, Ministry of Agriculture and Water affairs of Saudi
Arabia. A Paper entitled The future of Water Resources in the Kingdom of Saudi Arabia
presented at a conference organized by the Ministry of Planning in Riyadh (October 19 –
October 23, 2002).
36

Arab News Newspaper, Riyadh, Saudi Arabia, September 27, 2002, Gulf War cost
Riyadh $80 billion: Prince Naif.
_____________________________________, December12, 2003, Ban on Allocation of
Land for Farming.
Asian Development Bank, Manila, Philippines, “Guidelines for the Economic analysis of
Projects.” Appendix 6.
Berthke, Craig M. Department of Geology, University of Illinois, “M. King Hubbert and
the Rise of Quantitative Hydrology.” A paper presented at a conference entitled M. King
Hubbert at 100: The Enduring Contributions of Twentieth-Century Geology’s
Renaissance Man, Monday, November 3, 2003, Washington State Convention and Trade
Center:
Campbell Colin J. and Laherrere, Jean H. “The end of cheap oil”, Scientific American,
March 1998
Europa Publications, 49th Edition, The Middle East and Africa 2003, Saudi Arabia.
London.
Food and Agriculture Organization of the United Nations- http://www.fao.org/
FAOSTAT Agriculture Data- http://apps.fao.org/page/collections?subset=agriculture
Japan International Cooperation Agency (JICA), The Study on Water Resources
Development in the Northwestern and Central Basins in the Syrian Arab Republic (Phase
I), Volume III: Supporting Report, October 1997.
Hoekstra, A. Y. and Hung, P. Q. Virtual water trade: A quantification of virtual water
flows between nations in relation to international crop trade, Proceedings of the
37
International Expert Meeting on Virtual Water Trade, edited by A. Y. Hoekstra, Delft,
The Netherlands, 12-13 December 2002.
Hubbert, M. King, “Energy from Fossil Fuels,” American Association for the
Advancement of Science, February 4, 1949 Vol. 109, pp.103 – 109.
Ministry of Planning, Kingdom of Saudi Arabia, Statistical Yearbook, Thirty Seventh
Issue, 2001.
______________________________________, Achievement of the Development Plans,
Facts and Figures. Nineteenth Issue 1970 – 2001, Published in 2003.
Richards, A. and Waterbury, J., 1998, A Political Economy of the Middle East, Westview
Press.
The New York Times, January 26, 2003. Saudis Worry as They Waste Their Scarce
Water, by Graig Smith.
Saudi American Bank, Brad Bourland, Chief economist. The Saudi Economy in 2002,
February 2002. Riyadh, Saudi Arabia.
Saudi Arabian Monetary Agency, Annual Reports.
Statistical Abstract of the United Sates of America: 2000.
Saudi Water Net, King Fahd University for Petroleum and Minerals website
www.kfupm.edu.sa/saudiwaternet/
Elie Elhadj
SOAS Water Issues Research Group
38