Embed Size (px)
Citation preview

Cambrian School District
2010-11Academic Performance Index
(API)Adequate Yearly Progress (AYP)
Program Improvement (PI)Report
Overview
Academic Performance Index (API)
Stickers, Sliders, Gainers
Adequate Yearly Progress (AYP)
Program Improvement (PI)
Next Steps
Academic Performance IndexAPI
•California Model•Improvement Model•Weighted score
• By subject matter• Advancement from lower levels earns higher points
•High Performing equals score above 800
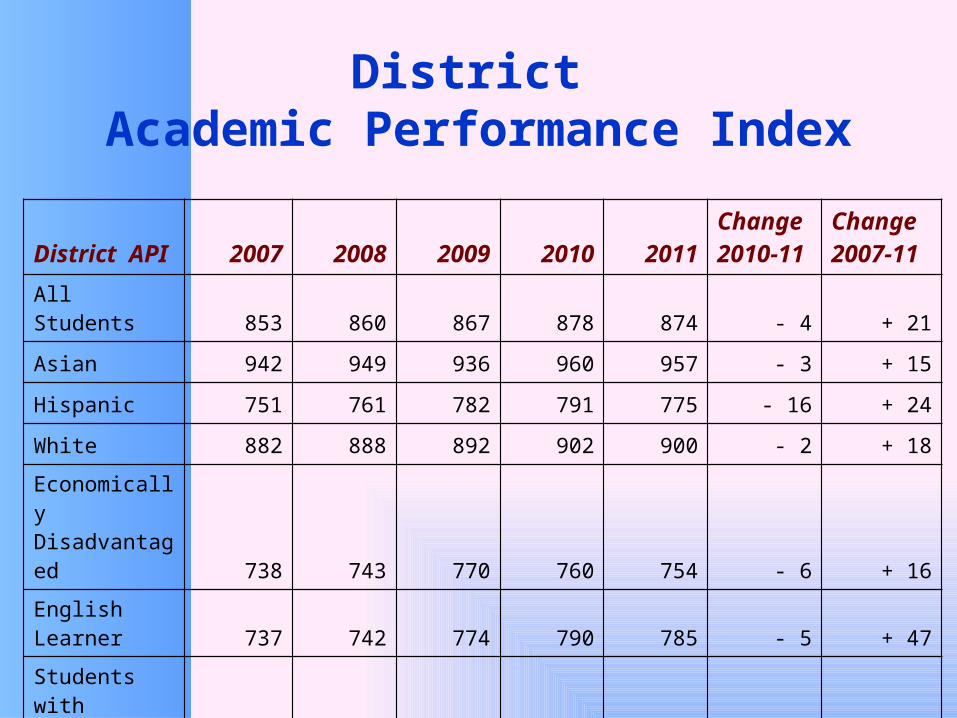
District Academic Performance Index
District API 2007 2008 2009 2010 2011
Change 2010-11
Change 2007-11
All Students 853 860 867 878 874 - 4 + 21
Asian 942 949 936 960 957 - 3 + 15
Hispanic 751 761 782 791 775 - 16 + 24
White 882 888 892 902 900 - 2 + 18
Economically Disadvantaged 738 743 770 760 754 - 6 + 16
English Learner 737 742 774 790 785 - 5 + 47
Students with Disabilities 612 638 591 650 673 + 23 + 61
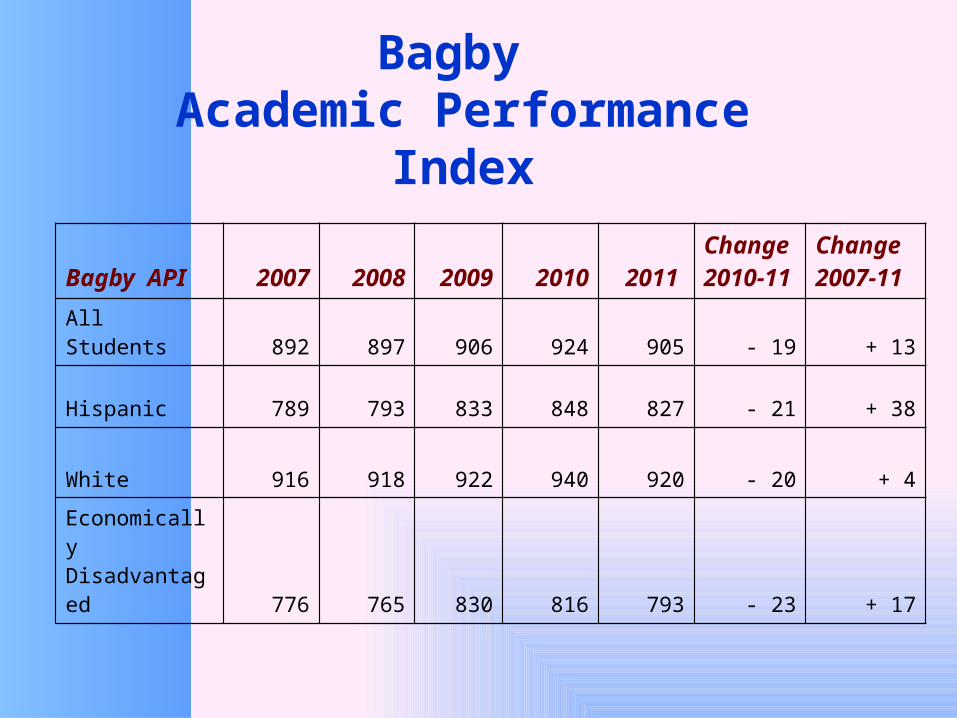
Bagby Academic Performance
Index
Bagby API 2007 2008 2009 2010 2011
Change 2010-11
Change 2007-11
All Students 892 897 906 924 905 - 19 + 13
Hispanic 789 793 833 848 827 - 21 + 38
White 916 918 922 940 920 - 20 + 4
Economically Disadvantaged 776 765 830 816 793 - 23 + 17
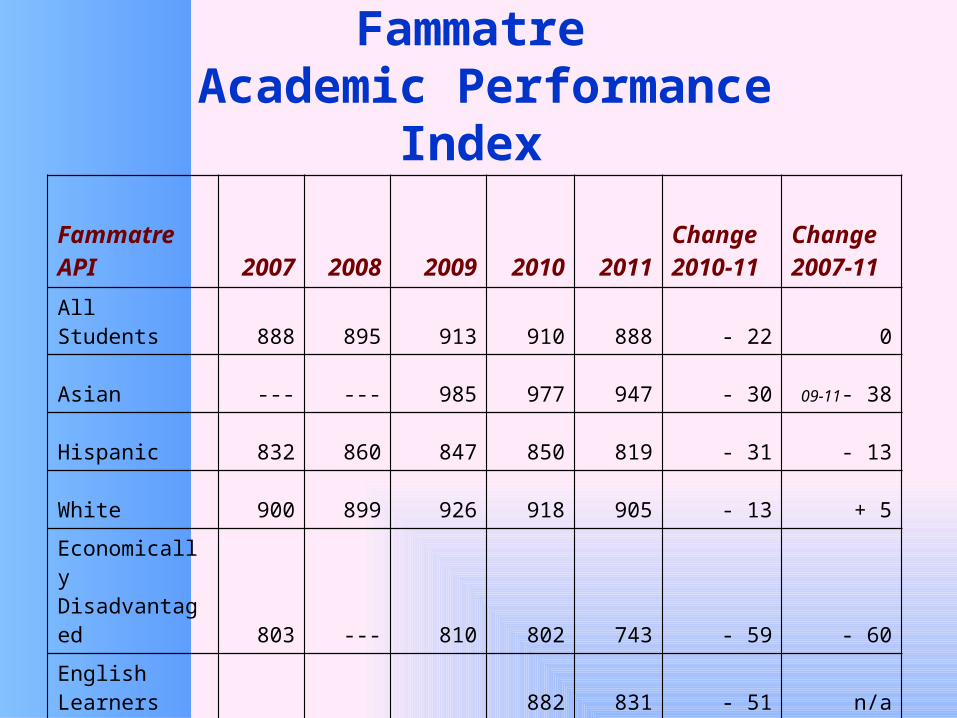
Fammatre Academic Performance
Index
Fammatre API 2007 2008 2009 2010 2011
Change 2010-11
Change 2007-11
All Students 888 895 913 910 888 - 22 0
Asian --- --- 985 977 947 - 30 09-11- 38
Hispanic 832 860 847 850 819 - 31 - 13
White 900 899 926 918 905 - 13 + 5
Economically Disadvantaged 803 --- 810 802 743 - 59 - 60
English Learners 882 831 - 51 n/a
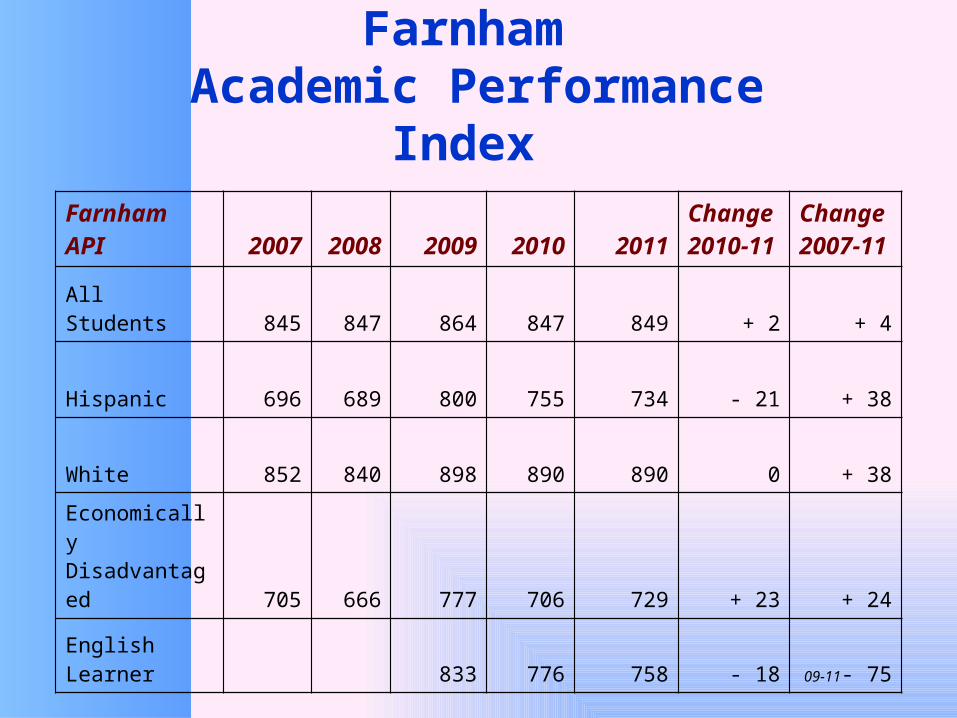
Farnham Academic Performance
Index
Farnham API 2007
2008 2009 2010 2011
Change 2010-11
Change 2007-11
All Students 845 847 864 847 849 + 2 + 4
Hispanic 696 689 800 755 734 - 21 + 38
White 852 840 898 890 890 0 + 38
Economically Disadvantaged 705 666 777 706 729 + 23 + 24
English Learner 833 776 758 - 18 09-11- 75
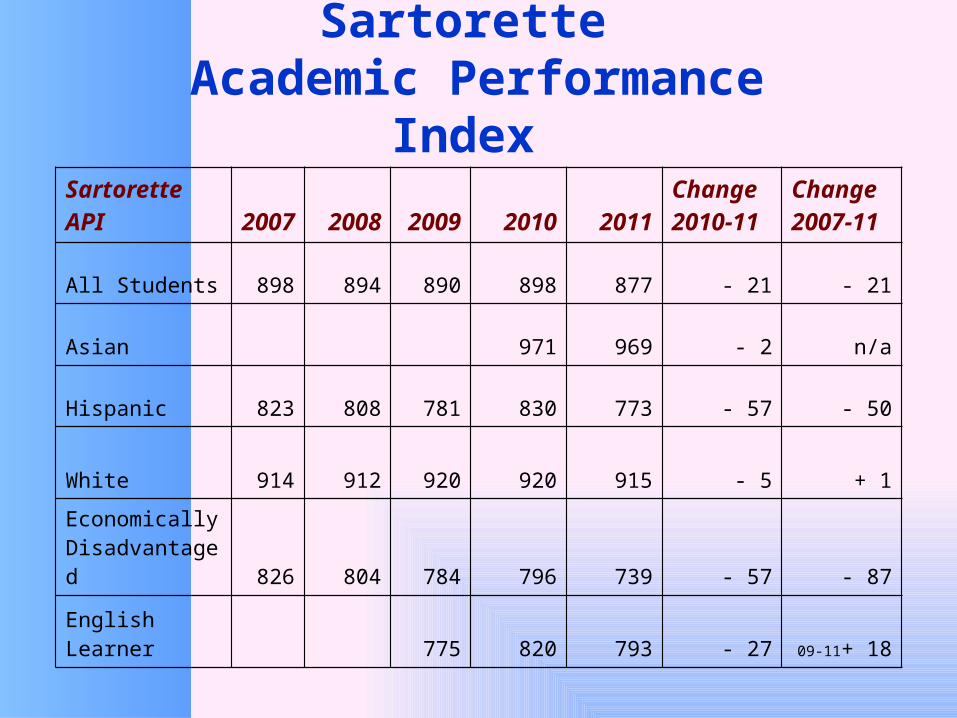
Sartorette Academic Performance
Index
Sartorette API
2007 2008
2009 2010 2011
Change 2010-11
Change 2007-11
All Students 898 894 890 898 877 - 21 - 21
Asian 971 969 - 2 n/a
Hispanic 823 808 781 830 773 - 57 - 50
White 914 912 920 920 915 - 5 + 1
Economically Disadvantaged 826 804 784 796 739 - 57 - 87
English Learner 775 820 793 - 27 09-11+ 18
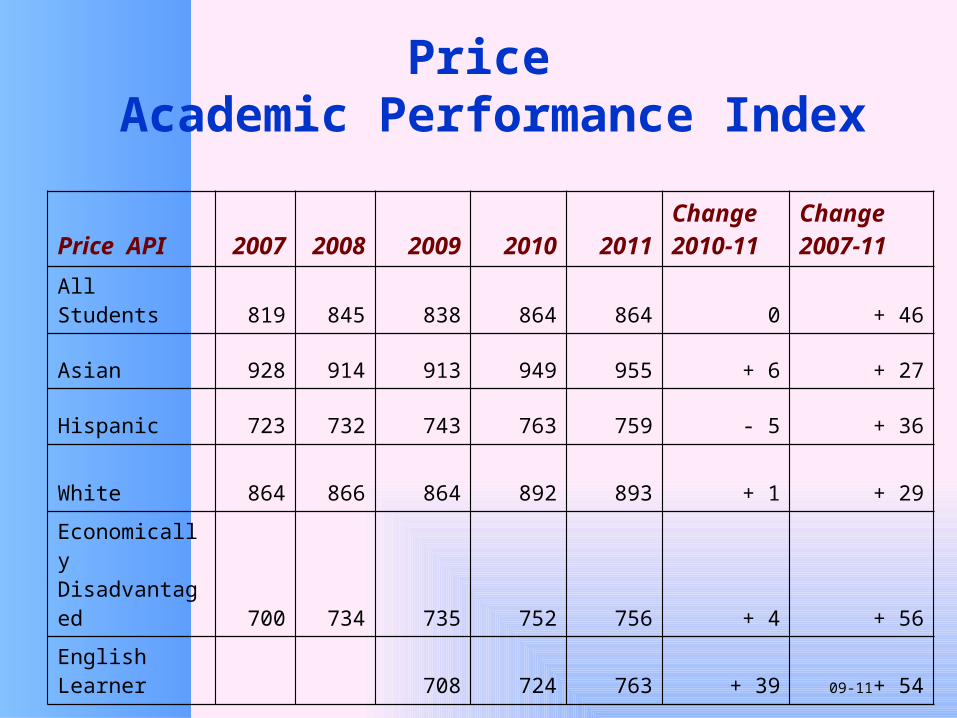
Price Academic Performance Index
Price API200
7200
8 2009 2010 2011
Change 2010-11
Change 2007-11
All Students 819 845 838 864 864 0 + 46
Asian 928 914 913 949 955 + 6 + 27
Hispanic 723 732 743 763 759 - 5 + 36
White 864 866 864 892 893 + 1 + 29
Economically Disadvantaged 700 734 735 752 756 + 4 + 56
English Learner 708 724 763 + 39 09-11+ 54
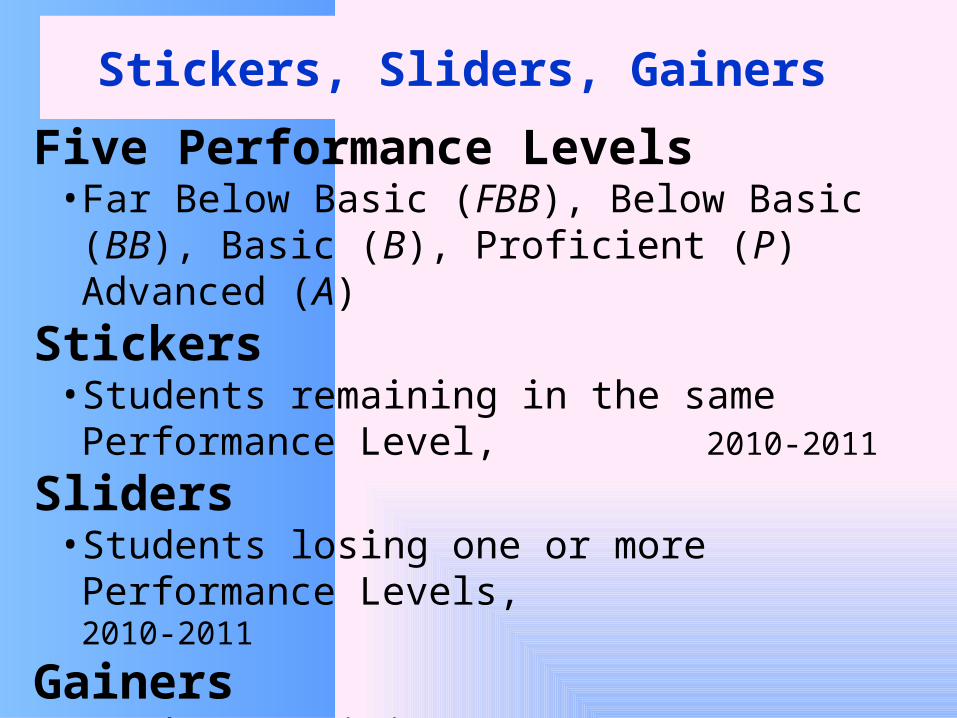
Stickers, Sliders, Gainers
Five Performance Levels• Far Below Basic (FBB), Below Basic (BB), Basic (B),
Proficient (P) Advanced (A)Stickers
• Students remaining in the same Performance Level, 2010-2011
Sliders• Students losing one or more Performance Levels,
2010-2011
Gainers• Students gaining one or more Performance Levels,
2010-2011
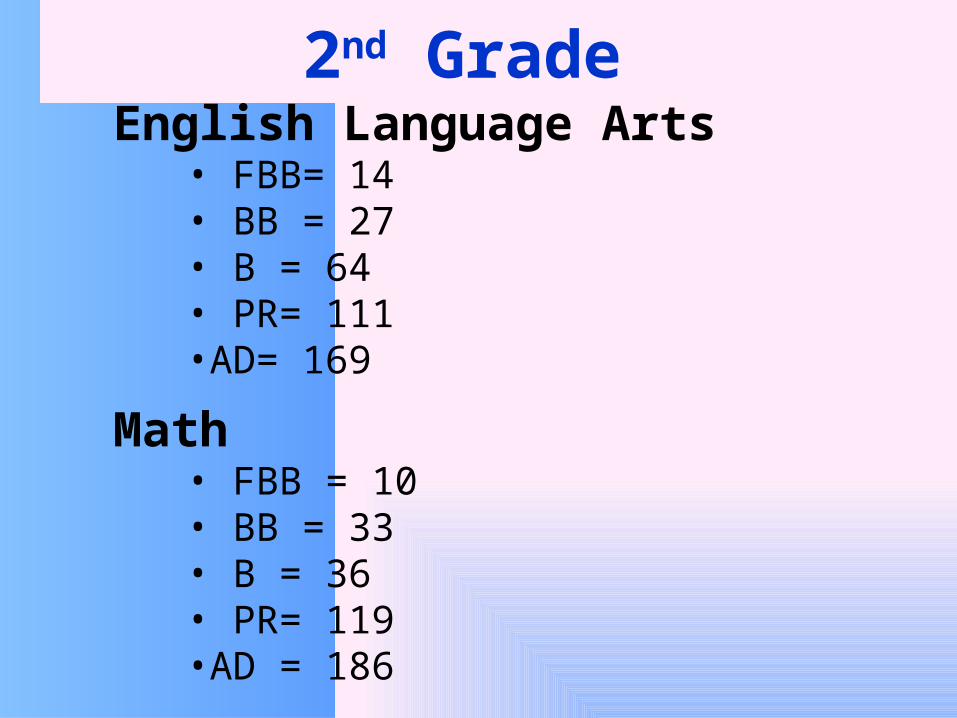
2nd GradeEnglish Language Arts
• FBB= 14• BB = 27• B = 64• PR= 111 • AD= 169
Math• FBB = 10• BB = 33• B = 36• PR= 119 • AD = 186
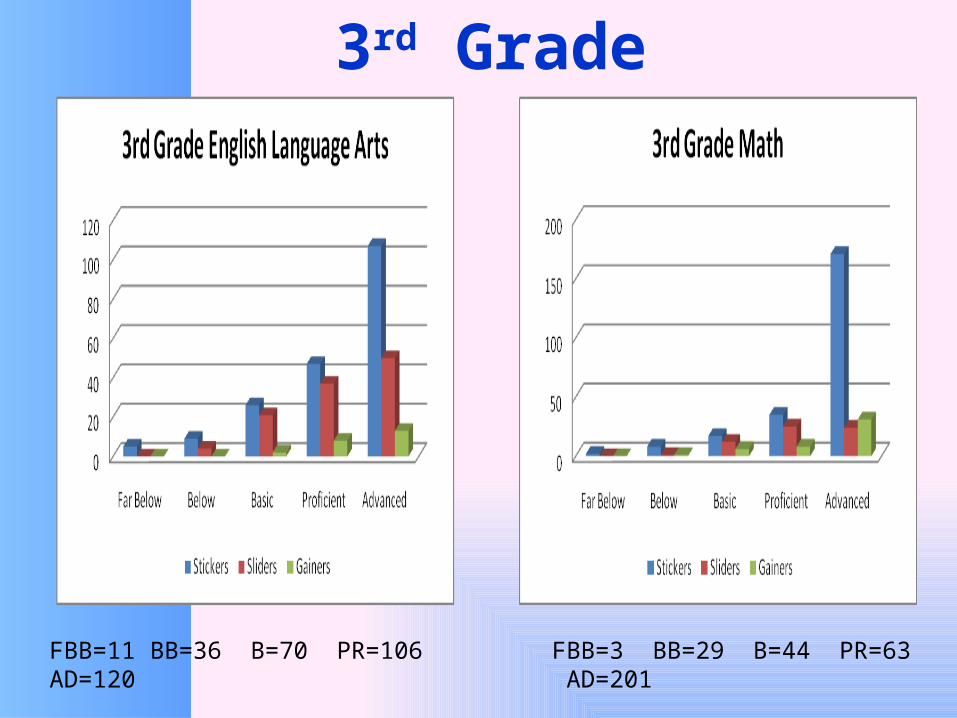
3rd Grade
FBB=11 BB=36 B=70 PR=106 AD=120 FBB=3 BB=29 B=44 PR=63 AD=201
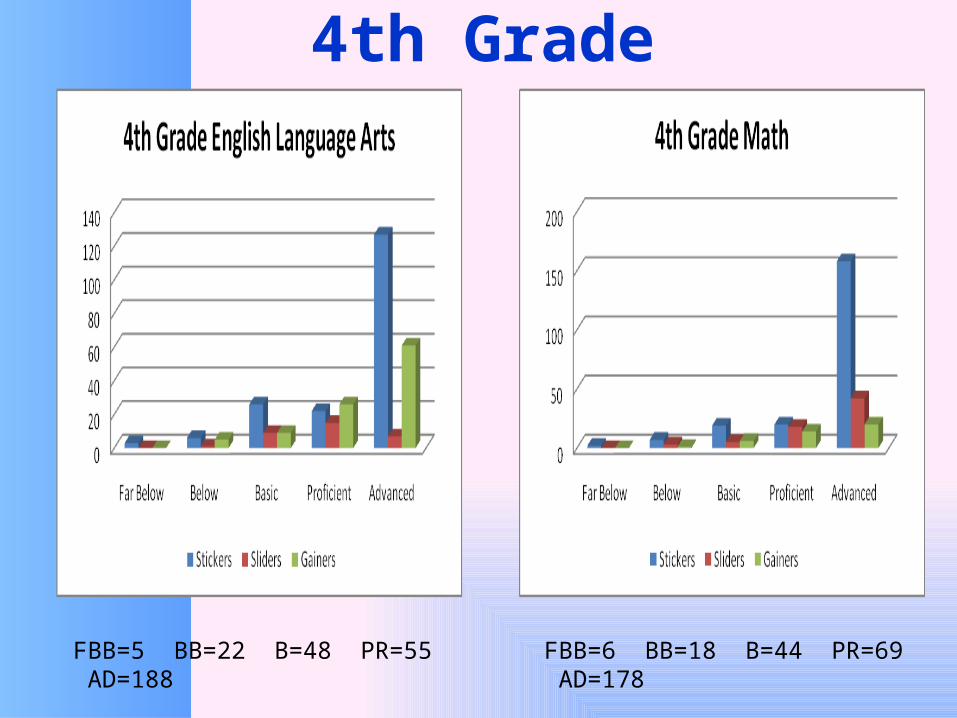
4th Grade
FBB=5 BB=22 B=48 PR=55 AD=188 FBB=6 BB=18 B=44 PR=69 AD=178
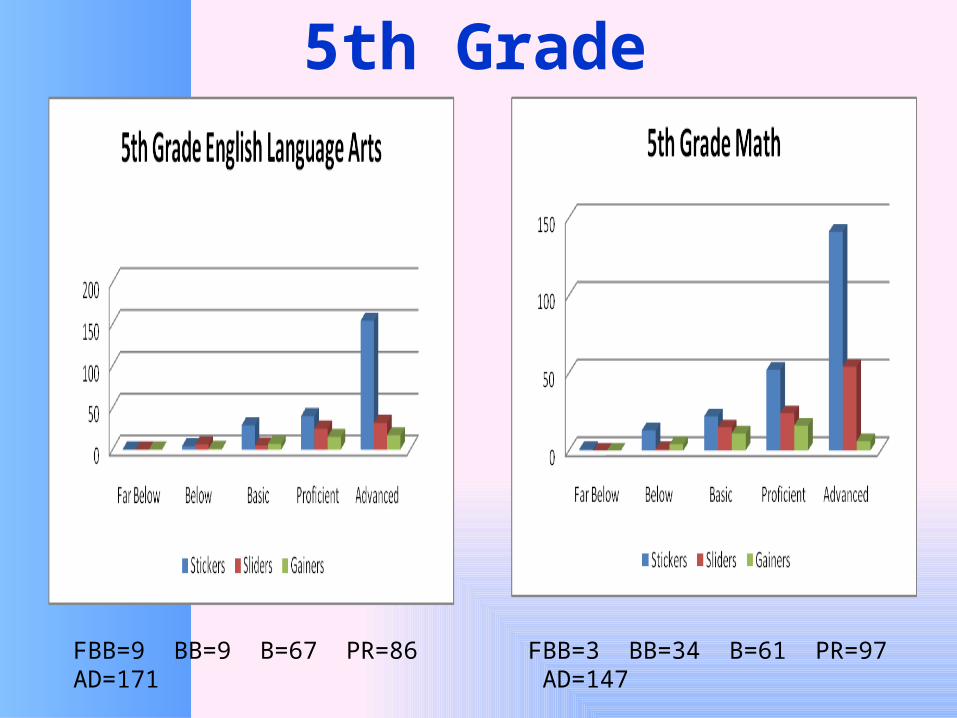
5th Grade
FBB=9 BB=9 B=67 PR=86 AD=171 FBB=3 BB=34 B=61 PR=97 AD=147
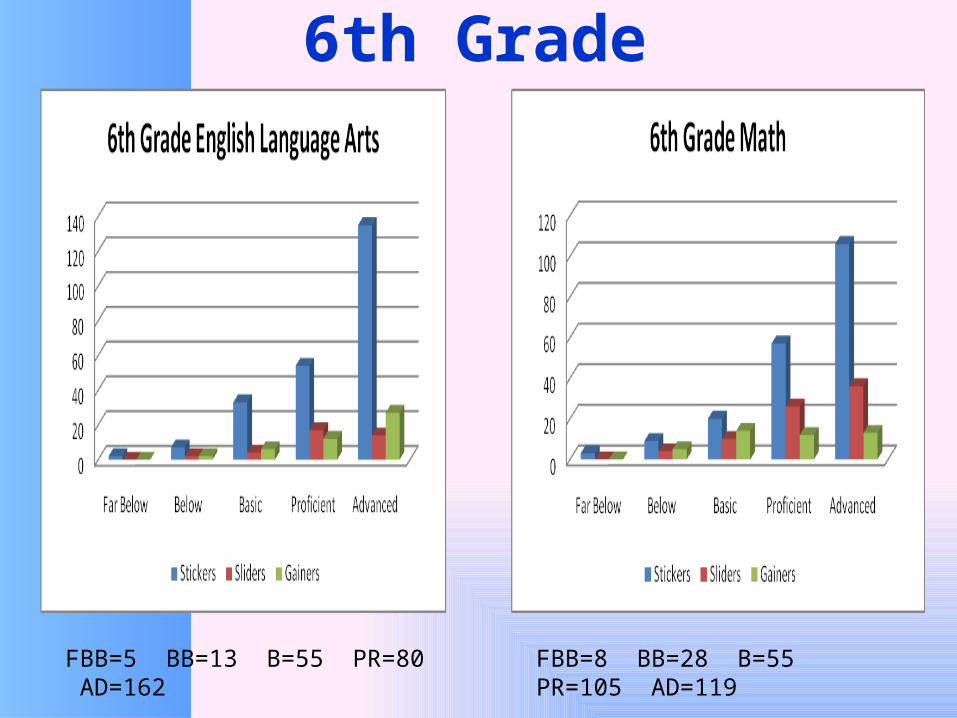
6th Grade
FBB=5 BB=13 B=55 PR=80 AD=162 FBB=8 BB=28 B=55 PR=105 AD=119
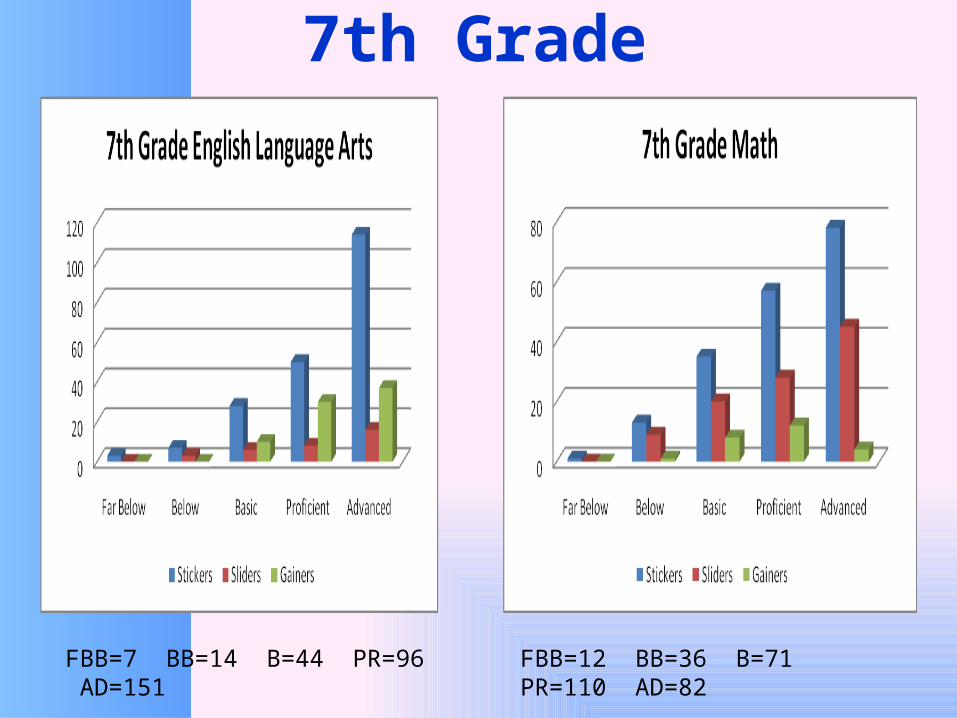
7th Grade
FBB=7 BB=14 B=44 PR=96 AD=151 FBB=12 BB=36 B=71 PR=110 AD=82
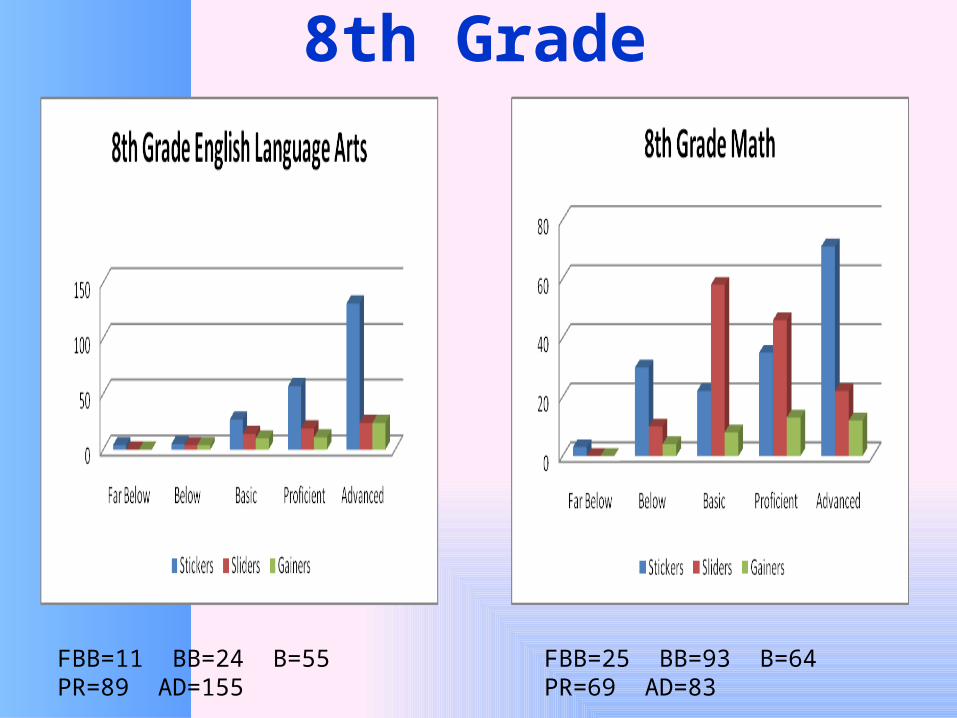
8th Grade
FBB=11 BB=24 B=55 PR=89 AD=155 FBB=25 BB=93 B=64 PR=69 AD=83
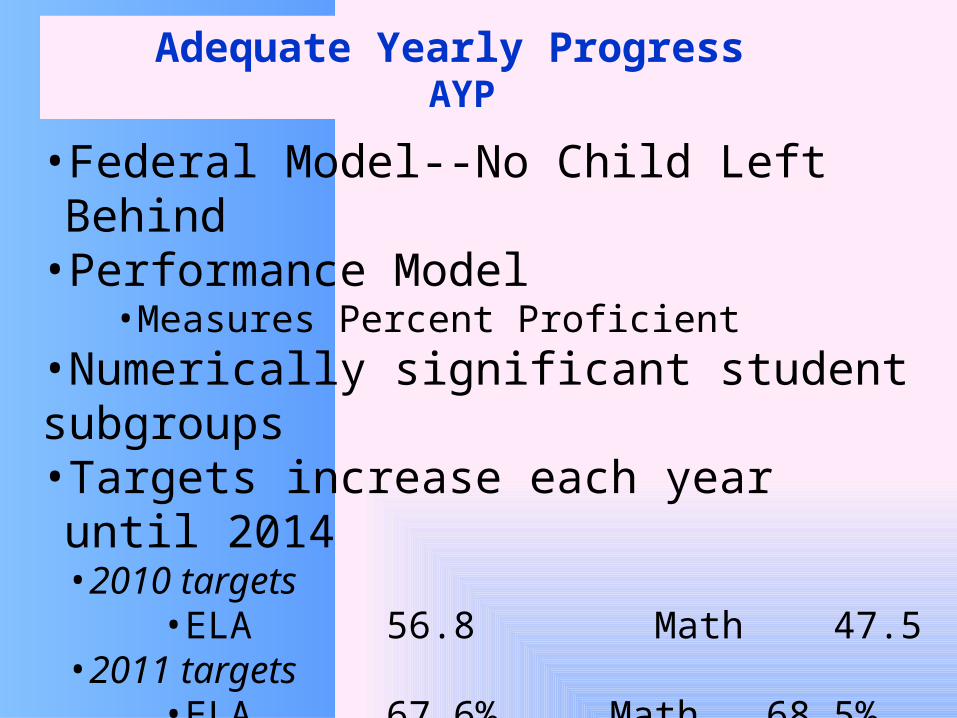
Adequate Yearly Progress AYP
• Federal Model--No Child Left Behind• Performance Model
• Measures Percent Proficient •Numerically significant student subgroups• Targets increase each year until 2014
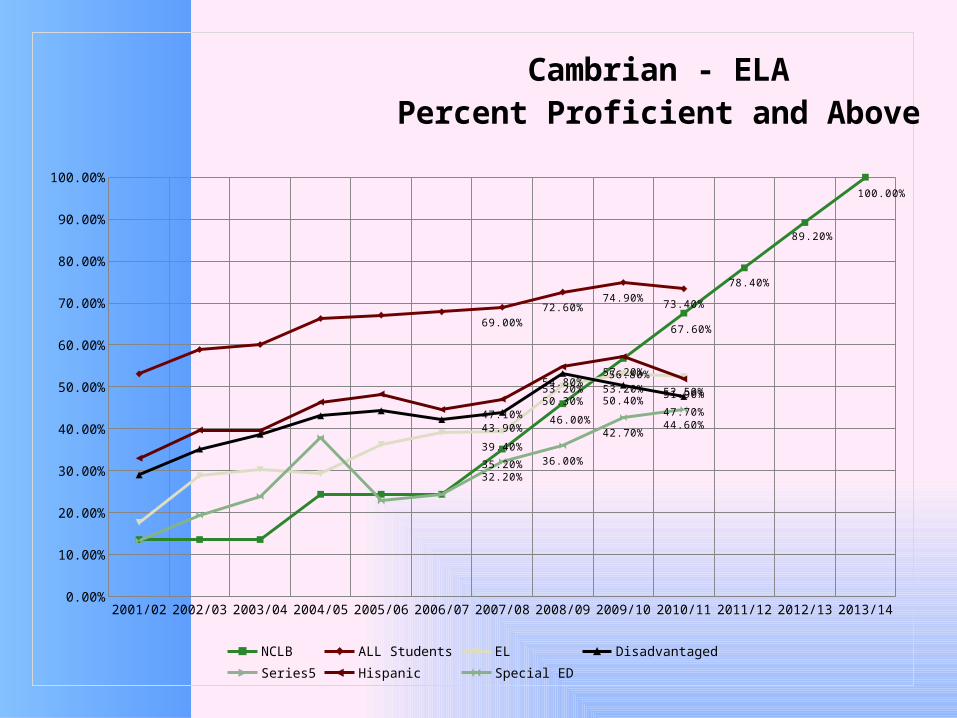
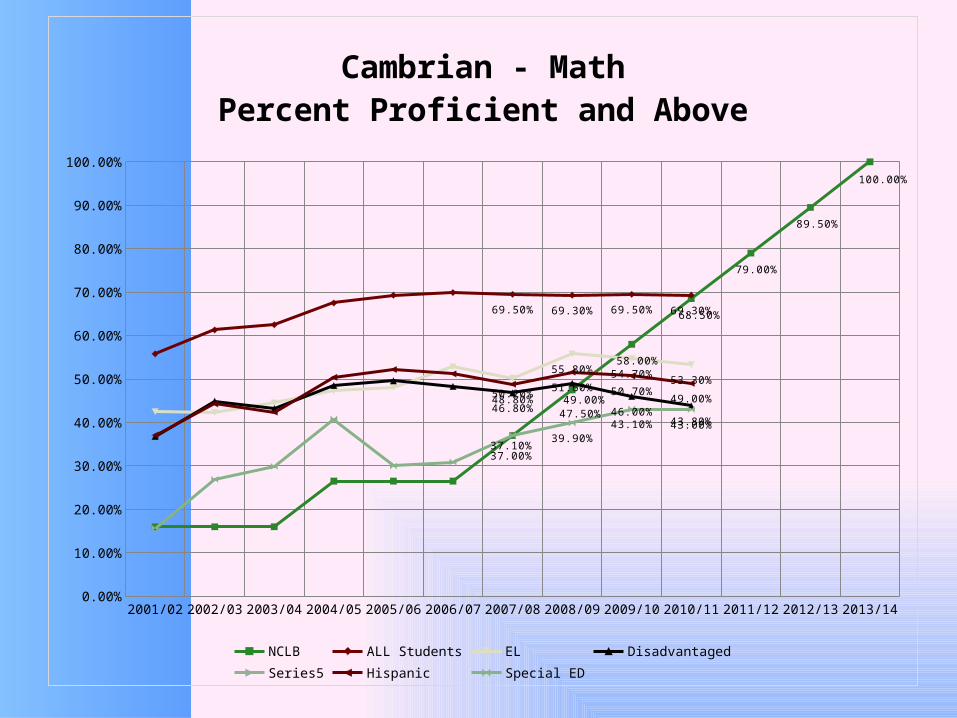
• 2010 targets• ELA 56.8 Math 47.5
• 2011 targets• ELA 67.6% Math 68.5%
• 2012 targets• ELA 78.4% Math 79%
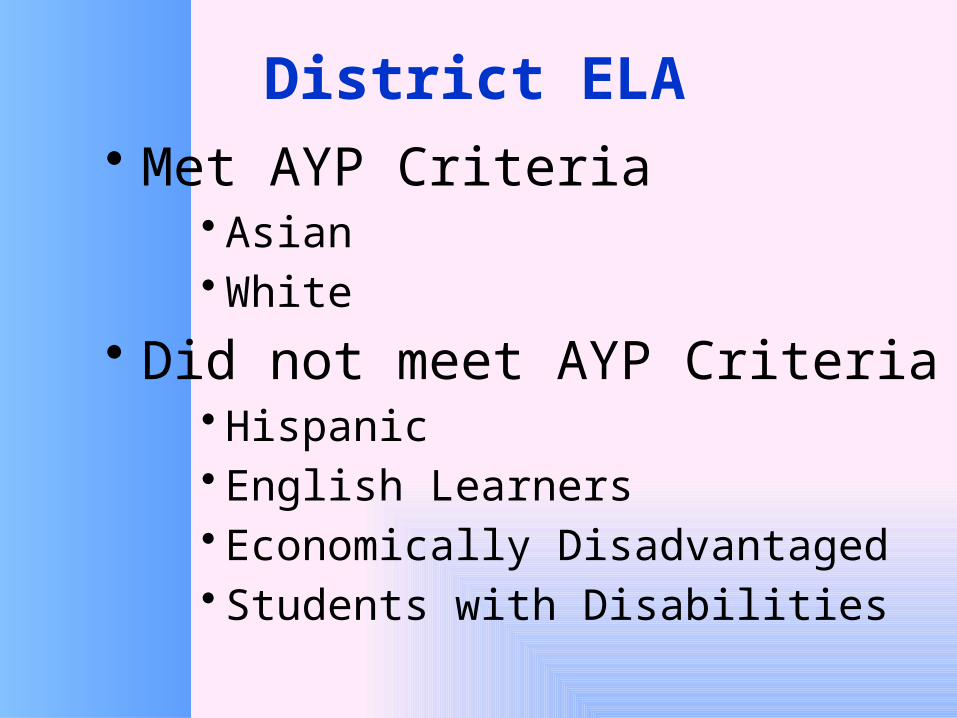
District ELA• Met AYP Criteria
• Asian• White
• Did not meet AYP Criteria• Hispanic• English Learners• Economically Disadvantaged• Students with Disabilities
2001/02 2002/03 2003/04 2004/05 2005/06 2006/07 2007/08 2008/09 2009/10 2010/11 2011/12 2012/13 2013/140.00%
10.00%
20.00%
30.00%
40.00%
50.00%
60.00%
70.00%
80.00%
90.00%
100.00%
35.20%
46.00%
56.80%
67.60%
78.40%
89.20%
100.00%
69.00%
72.60%74.90%
73.40%
39.40%
50.30%53.20% 52.50%
43.90%
53.20%50.40%
47.70%47.10%
54.80%57.20%
51.90%
32.20%
36.00%
42.70%44.60%
Cambrian - ELAPercent Proficient and Above
NCLB ALL Students EL DisadvantagedSeries5 Hispanic Special ED
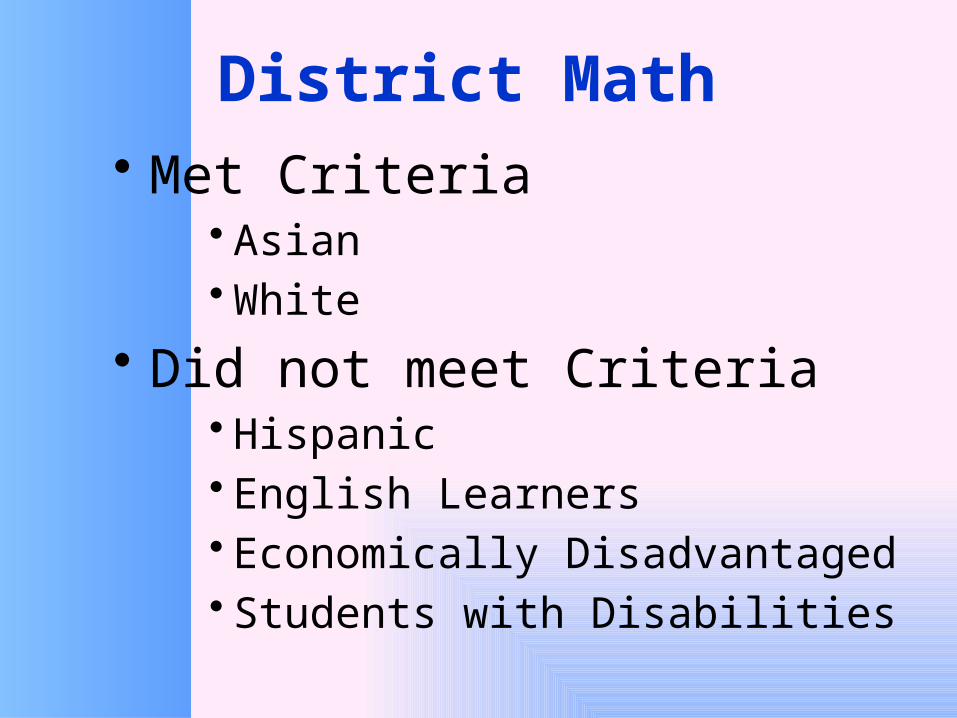
District Math• Met Criteria
• Asian• White
• Did not meet Criteria• Hispanic• English Learners• Economically Disadvantaged• Students with Disabilities
2001/02 2002/03 2003/04 2004/05 2005/06 2006/07 2007/08 2008/09 2009/10 2010/11 2011/12 2012/13 2013/140.00%
10.00%
20.00%
30.00%
40.00%
50.00%
60.00%
70.00%
80.00%
90.00%
100.00%
37.00%
47.50%
58.00%
68.50%
79.00%
89.50%
100.00%
69.50% 69.30% 69.50% 69.30%
50.20%
55.80% 54.70%53.30%
46.80%49.00%
46.00%43.80%
48.80%51.60% 50.70%
49.00%
37.10%39.90%
43.10% 43.00%
Cambrian - MathPercent Proficient and Above
NCLB ALL Students EL DisadvantagedSeries5 Hispanic Special ED
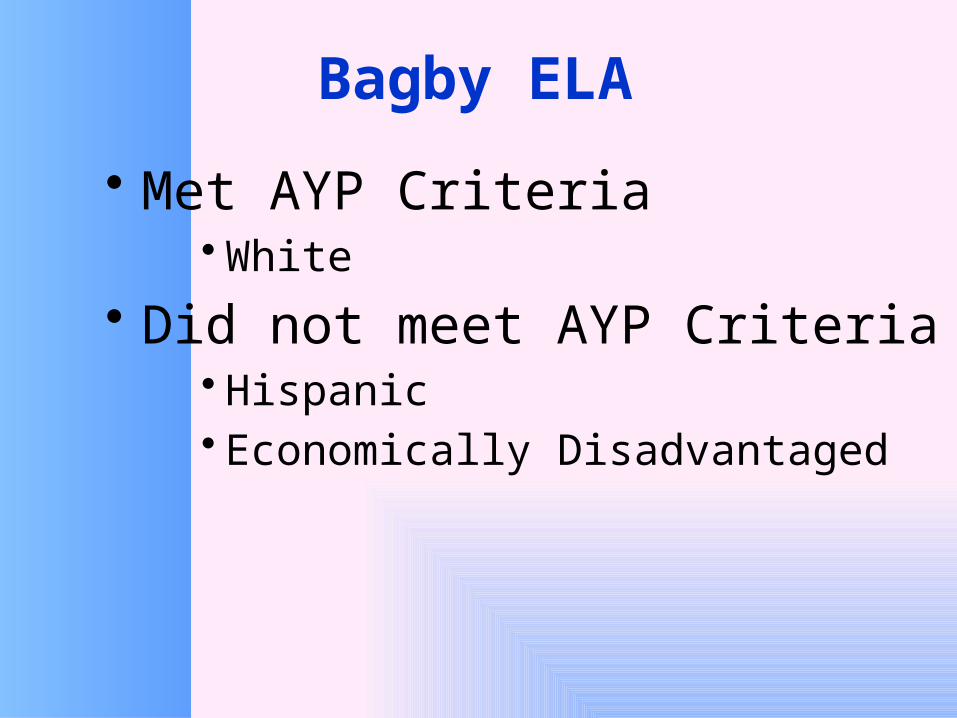
Bagby ELA
• Met AYP Criteria• White
• Did not meet AYP Criteria• Hispanic• Economically Disadvantaged
2001/02 2002/03 2003/04 2004/05 2005/06 2006/07 2007/08 2008/09 2009/10 2010/11 2011/12 2012/13 2013/140.00%
10.00%
20.00%
30.00%
40.00%
50.00%
60.00%
70.00%
80.00%
90.00%
100.00%
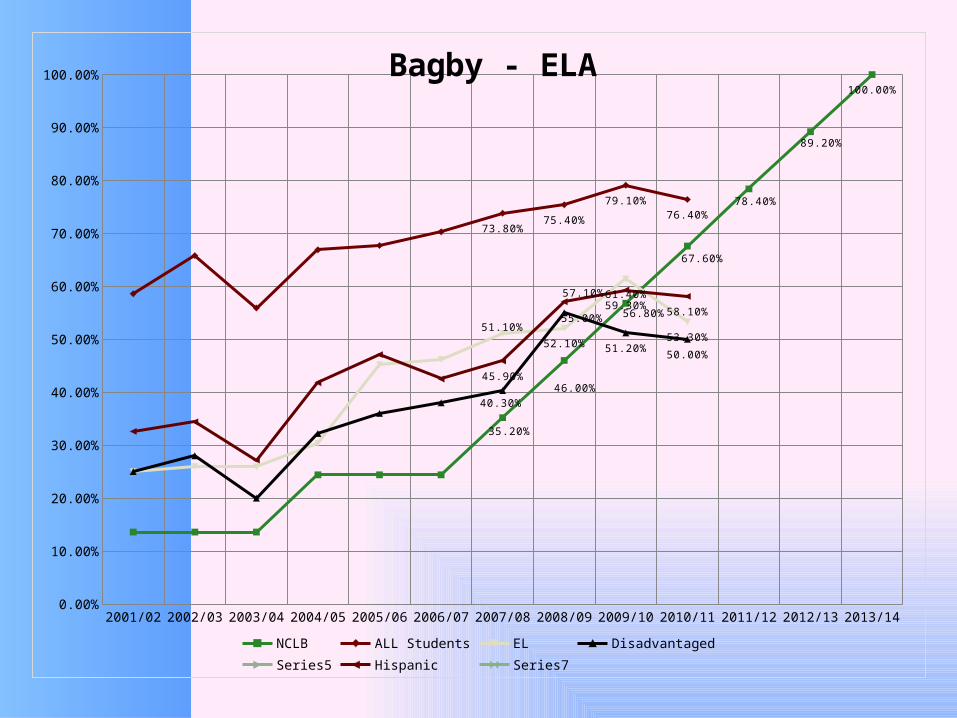
35.20%
46.00%
56.80%
67.60%
78.40%
89.20%
100.00%
73.80%75.40%
79.10%76.40%
51.10%
52.10%
61.40%
53.30%
40.30%
55.00%
51.20%50.00%
45.90%
57.10%59.30%
58.10%
Bagby - ELA
NCLB ALL Students EL DisadvantagedSeries5 Hispanic Series7
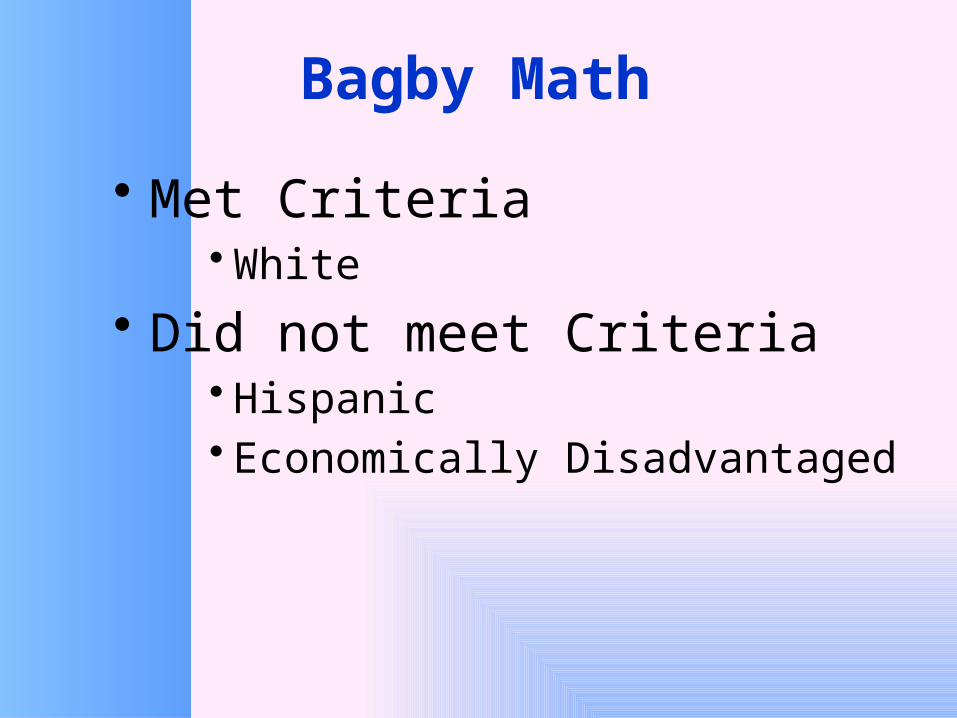
Bagby Math
• Met Criteria• White
• Did not meet Criteria• Hispanic• Economically Disadvantaged
2001/02 2002/03 2003/04 2004/05 2005/06 2006/07 2007/08 2008/09 2009/10 2010/11 2011/12 2012/13 2013/140.00%
10.00%
20.00%
30.00%
40.00%
50.00%
60.00%
70.00%
80.00%
90.00%
100.00%
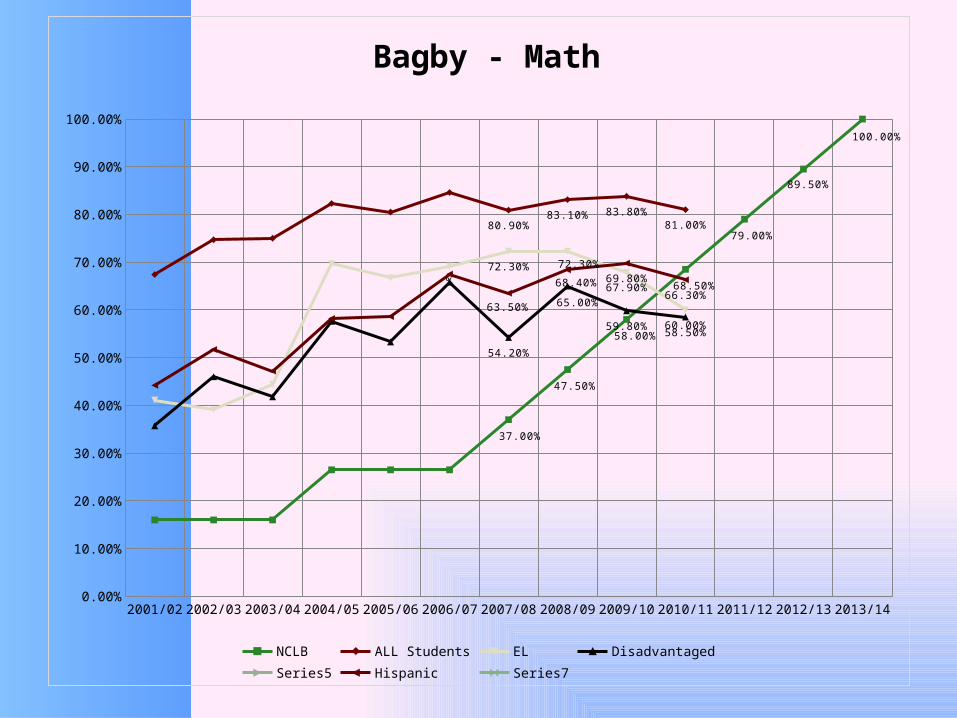
37.00%
47.50%
58.00%
68.50%
79.00%
89.50%
100.00%
80.90%83.10% 83.80%
81.00%
%72.30% 72.30%
67.90%
60.00%
54.20%
65.00%
59.80%58.50%
63.50%
68.40% 69.80%
66.30%
Bagby - Math
NCLB ALL Students EL DisadvantagedSeries5 Hispanic Series7
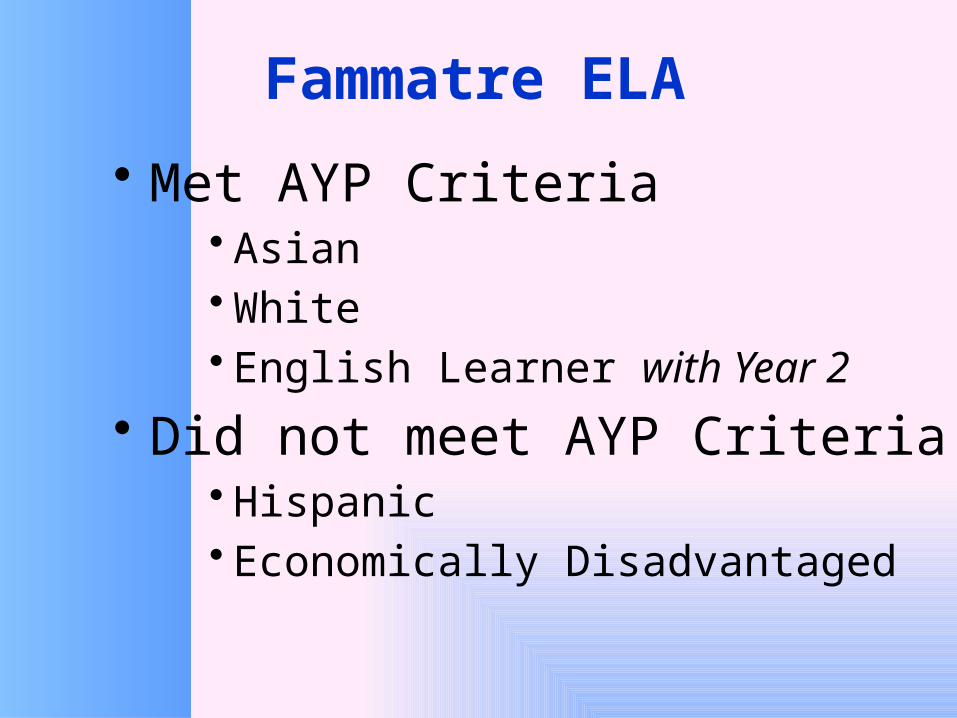
Fammatre ELA
• Met AYP Criteria• Asian• White• English Learner with Year 2
• Did not meet AYP Criteria• Hispanic• Economically Disadvantaged
2001/02 2002/03 2003/04 2004/05 2005/06 2006/07 2007/08 2008/09 2009/10 2010/11 2011/12 2012/13 2013/140.00%
10.00%
20.00%
30.00%
40.00%
50.00%
60.00%
70.00%
80.00%
90.00%
100.00%
35.20%
46.00%
56.80%
67.60%
78.40%
89.20%
100.00%
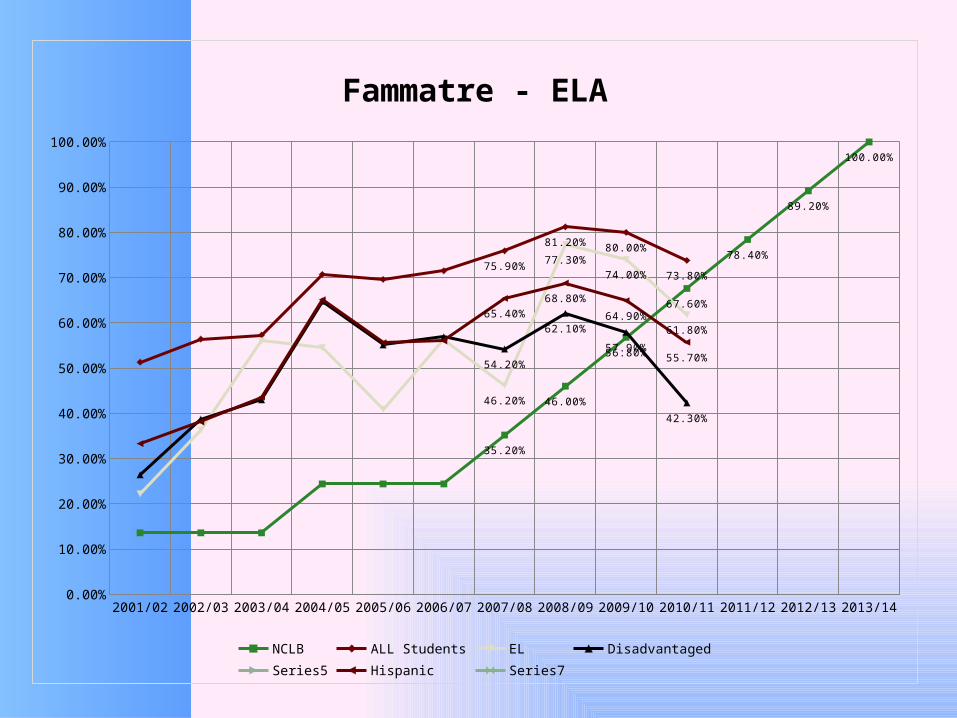
75.90%
81.20% 80.00%
73.80%
46.20%
77.30%
74.00%
61.80%
54.20%
62.10%
57.90%
42.30%
65.40%
68.80%
64.90%
55.70%
Fammatre - ELA
NCLB ALL Students EL DisadvantagedSeries5 Hispanic Series7
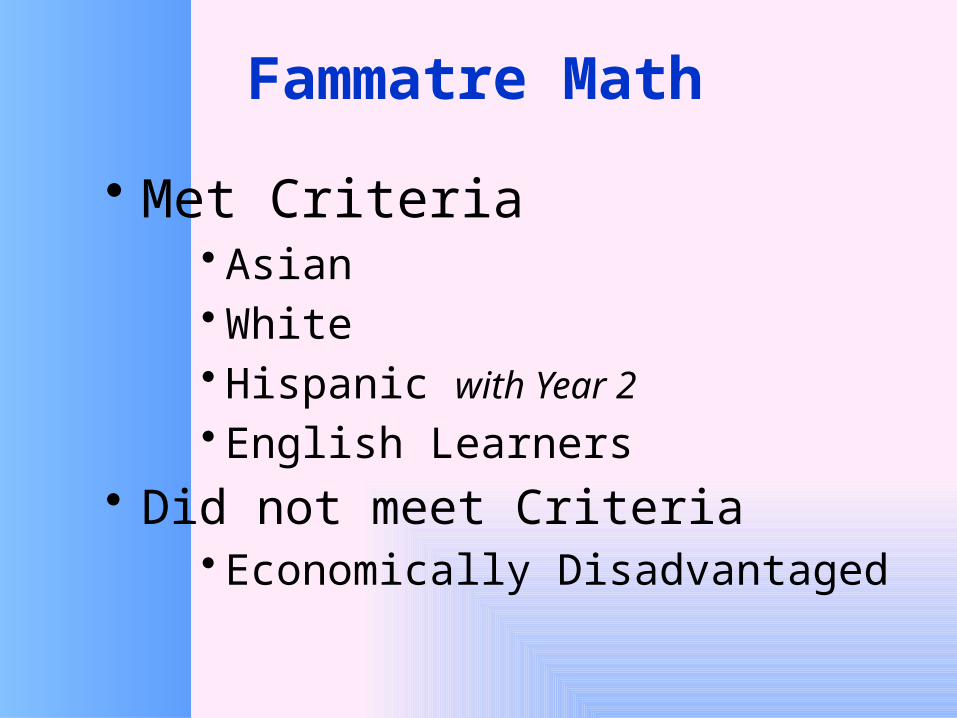
Fammatre Math
• Met Criteria• Asian• White• Hispanic with Year 2• English Learners
• Did not meet Criteria• Economically Disadvantaged
2001/02 2002/03 2003/04 2004/05 2005/06 2006/07 2007/08 2008/09 2009/10 2010/11 2011/12 2012/13 2013/140.00%
10.00%
20.00%
30.00%
40.00%
50.00%
60.00%
70.00%
80.00%
90.00%
100.00%
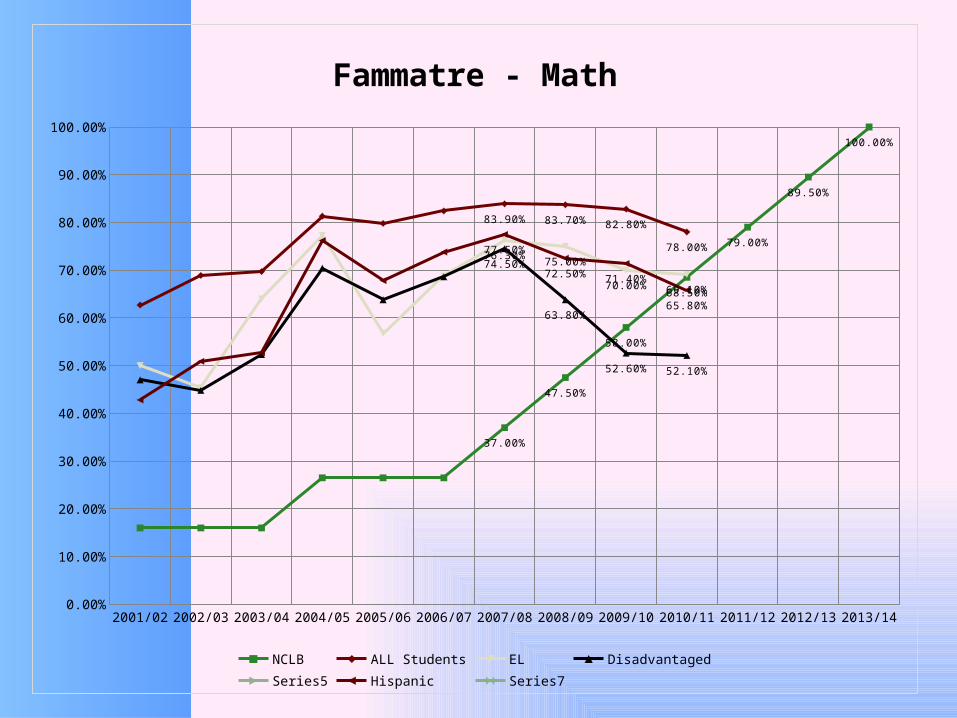
37.00%
47.50%
58.00%
68.50%
79.00%
89.50%
100.00%
83.90% 83.70% 82.80%
78.00%76.30%
75.00%
70.00% 69.10%
74.50%
63.80%
52.60% 52.10%
77.50%
72.50% 71.40%
65.80%
Fammatre - Math
NCLB ALL Students EL DisadvantagedSeries5 Hispanic Series7
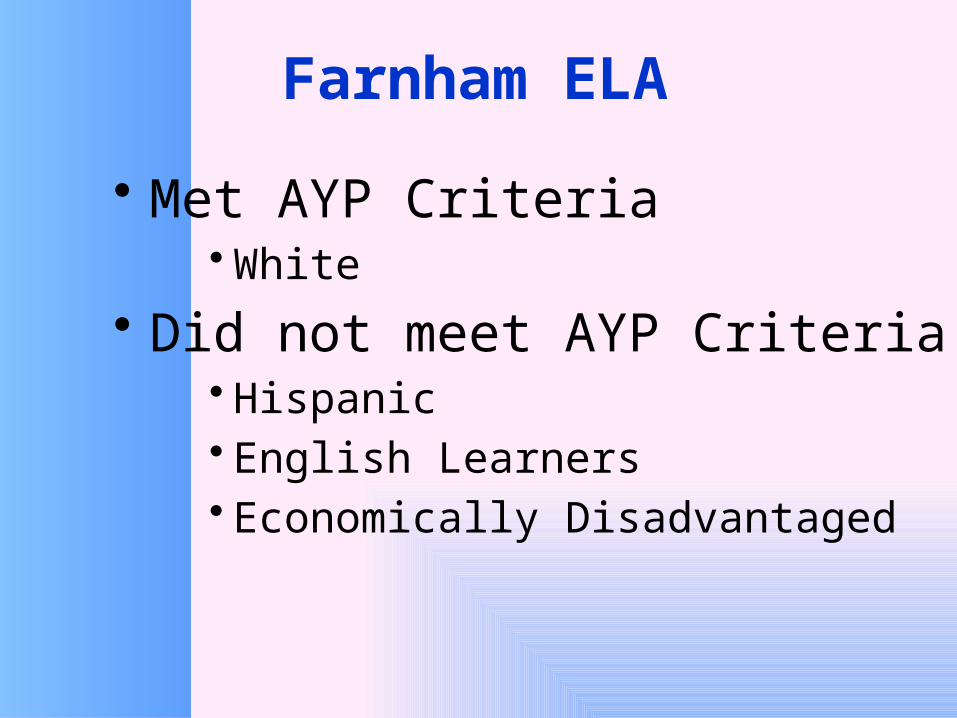
Farnham ELA
• Met AYP Criteria• White
• Did not meet AYP Criteria• Hispanic• English Learners• Economically Disadvantaged
2001/02 2002/03 2003/04 2004/05 2005/06 2006/07 2007/08 2008/09 2009/10 2010/11 2011/12 2012/13 2013/140.00%
10.00%
20.00%
30.00%
40.00%
50.00%
60.00%
70.00%
80.00%
90.00%
100.00%
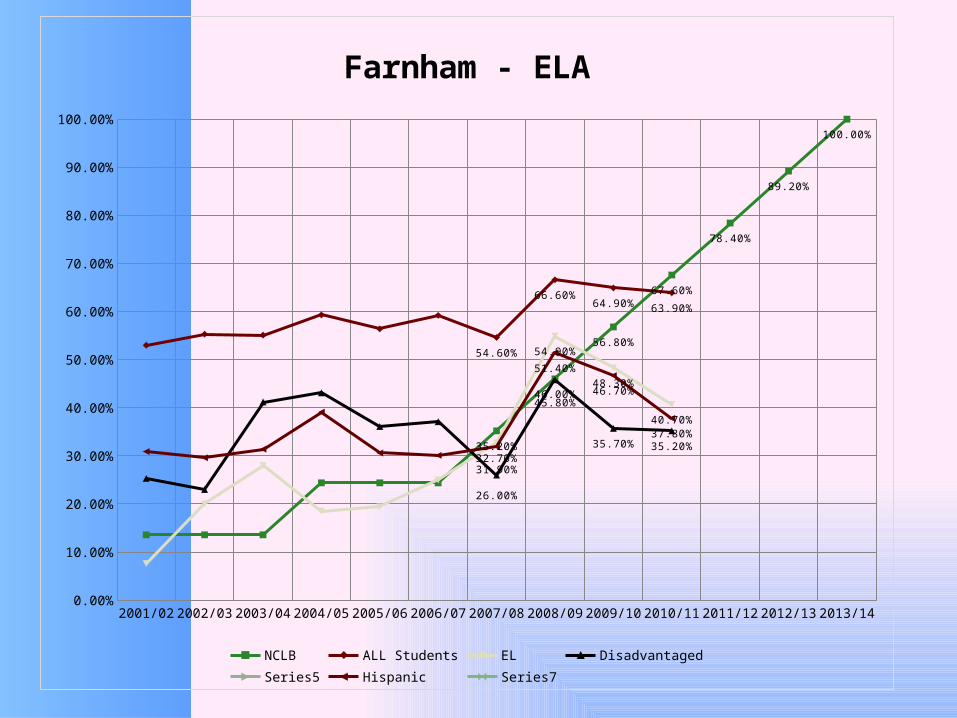
35.20%
46.00%
56.80%
67.60%
78.40%
89.20%
100.00%
54.60%
66.60%64.90% 63.90%
32.70%
54.90%
48.30%
40.70%
26.00%
45.80%
35.70% 35.20%
31.90%
51.40%
46.70%
37.80%
Farnham - ELA
NCLB ALL Students EL DisadvantagedSeries5 Hispanic Series7
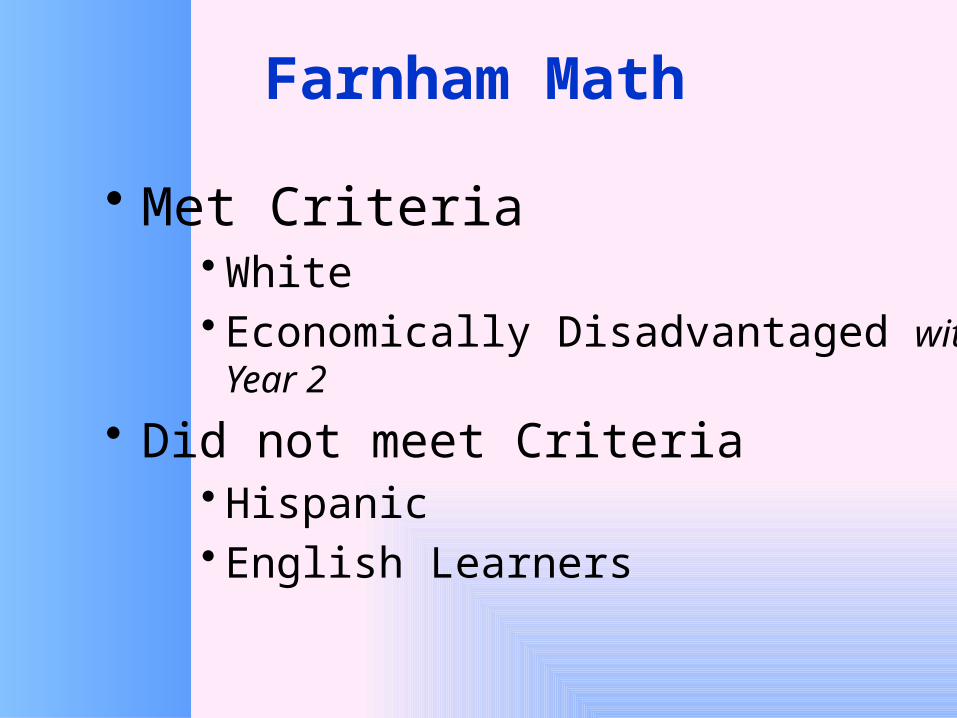
Farnham Math
• Met Criteria• White• Economically Disadvantaged with Year 2
• Did not meet Criteria• Hispanic• English Learners
2001/02 2002/03 2003/04 2004/05 2005/06 2006/07 2007/08 2008/09 2009/10 2010/11 2011/12 2012/13 2013/140.00%
10.00%
20.00%
30.00%
40.00%
50.00%
60.00%
70.00%
80.00%
90.00%
100.00%
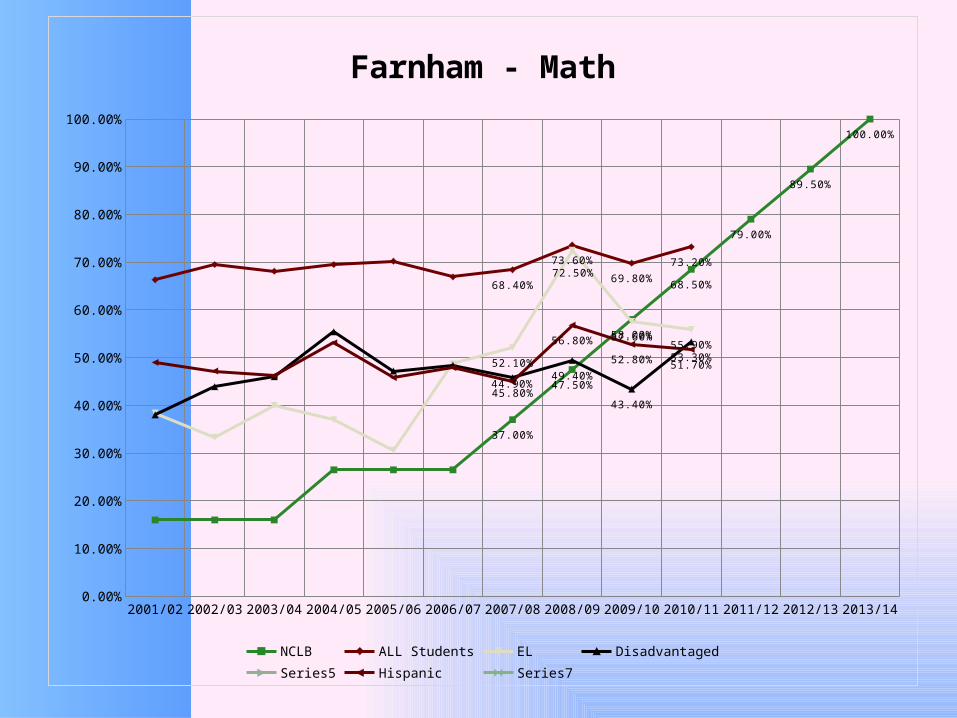
37.00%
47.50%
58.00%
68.50%
79.00%
89.50%
100.00%
68.40%
73.60%
69.80%
73.20%
52.10%
72.50%
57.60%55.90%
45.80%
49.40%
43.40%
53.30%
44.90%
56.80%
52.80% 51.70%
Farnham - Math
NCLB ALL Students EL DisadvantagedSeries5 Hispanic Series7
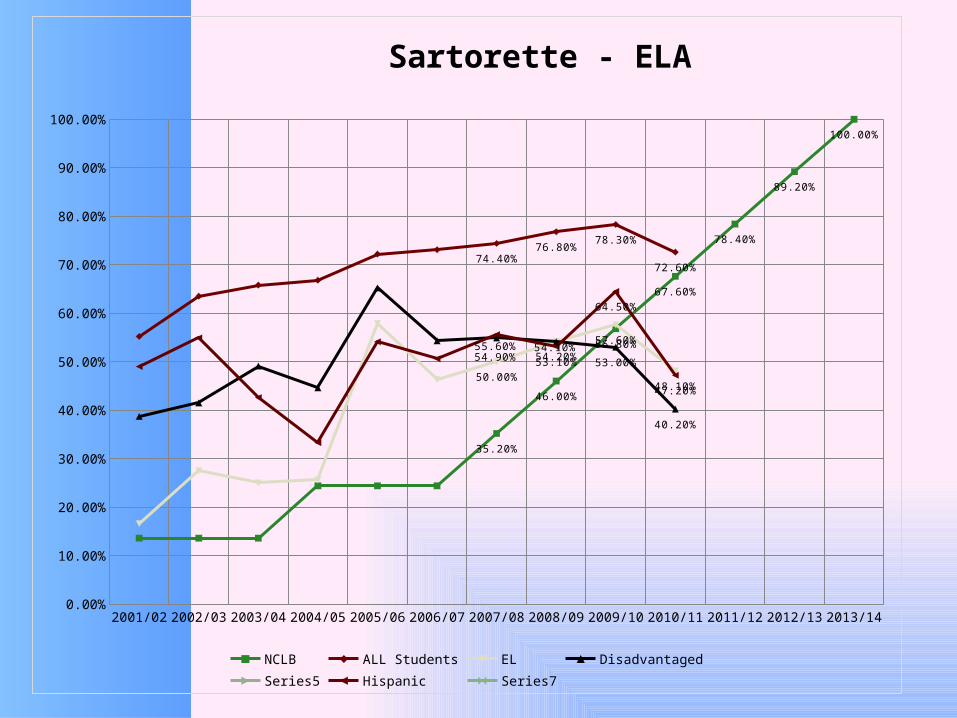
Sartorette ELA
• Met AYP Criteria• Asian• White
• Did not meet AYP Criteria• Hispanic• English Learners• Economically Disadvantaged
2001/02 2002/03 2003/04 2004/05 2005/06 2006/07 2007/08 2008/09 2009/10 2010/11 2011/12 2012/13 2013/140.00%
10.00%
20.00%
30.00%
40.00%
50.00%
60.00%
70.00%
80.00%
90.00%
100.00%
35.20%
46.00%
56.80%
67.60%
78.40%
89.20%
100.00%
74.40%76.80%
78.30%
72.60%
50.00%
54.20%
57.60%
48.10%
54.90%54.10%
53.00%
40.20%
55.60%53.10%
64.50%
47.20%
Sartorette - ELA
NCLB ALL Students EL DisadvantagedSeries5 Hispanic Series7

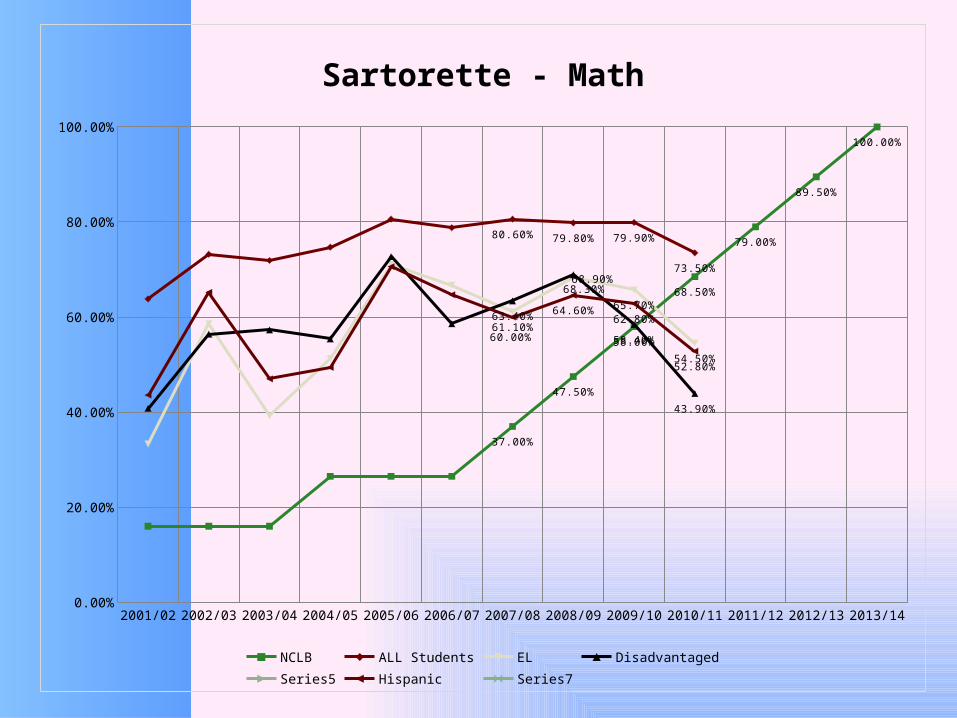
Sartorette Math
• Met Criteria• Asian• White
• Did not meet Criteria• Hispanic• English Learners• Economically Disadvantaged
2001/02 2002/03 2003/04 2004/05 2005/06 2006/07 2007/08 2008/09 2009/10 2010/11 2011/12 2012/13 2013/140.00%
20.00%
40.00%
60.00%
80.00%
100.00%
37.00%
47.50%
58.00%
68.50%
79.00%
89.50%
100.00%
80.60% 79.80% 79.90%
73.50%
61.10%
68.30%
65.70%
54.50%
63.40%
68.90%
58.40%
43.90%
60.00%
64.60%62.80%
52.80%
Sartorette - Math
NCLB ALL Students EL DisadvantagedSeries5 Hispanic Series7
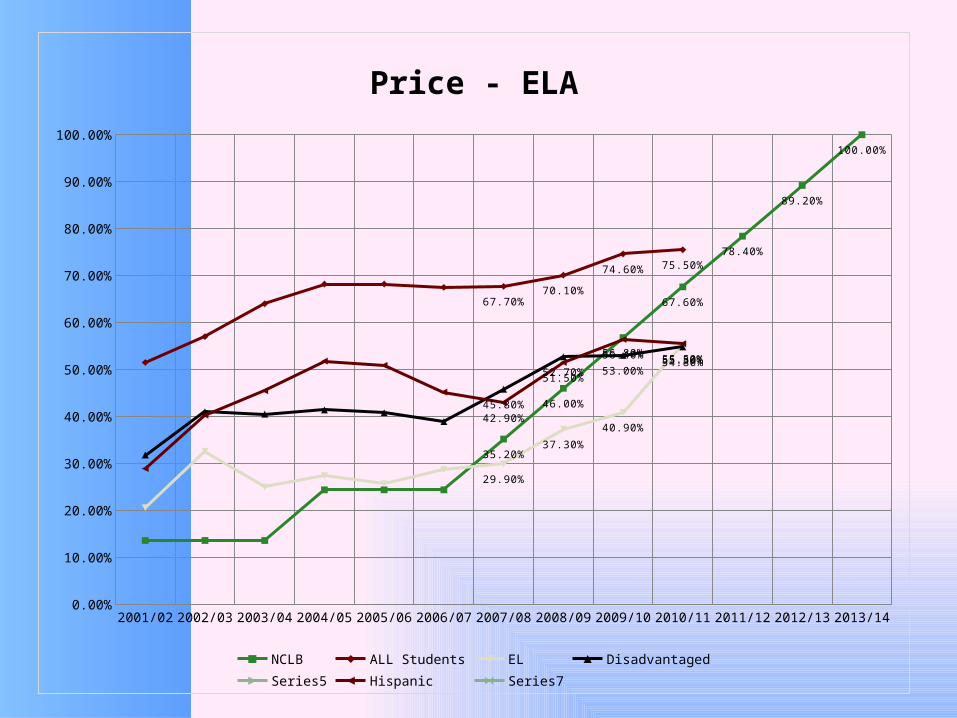
Price ELA
• Met AYP Criteria• Asian• White• English Learners with Safe Harbor• Economically Disadvantaged with Safe Harbor
• Did not meet AYP Criteria• Hispanic
2001/02 2002/03 2003/04 2004/05 2005/06 2006/07 2007/08 2008/09 2009/10 2010/11 2011/12 2012/13 2013/140.00%
10.00%
20.00%
30.00%
40.00%
50.00%
60.00%
70.00%
80.00%
90.00%
100.00%
35.20%
46.00%
56.80%
67.60%
78.40%
89.20%
100.00%
67.70%70.10%
74.60% 75.50%
29.90%
37.30%
40.90%
55.30%
45.80%
52.70% 53.00%54.80%
42.90%
51.50%
56.40% 55.50%
Price - ELA
NCLB ALL Students EL DisadvantagedSeries5 Hispanic Series7

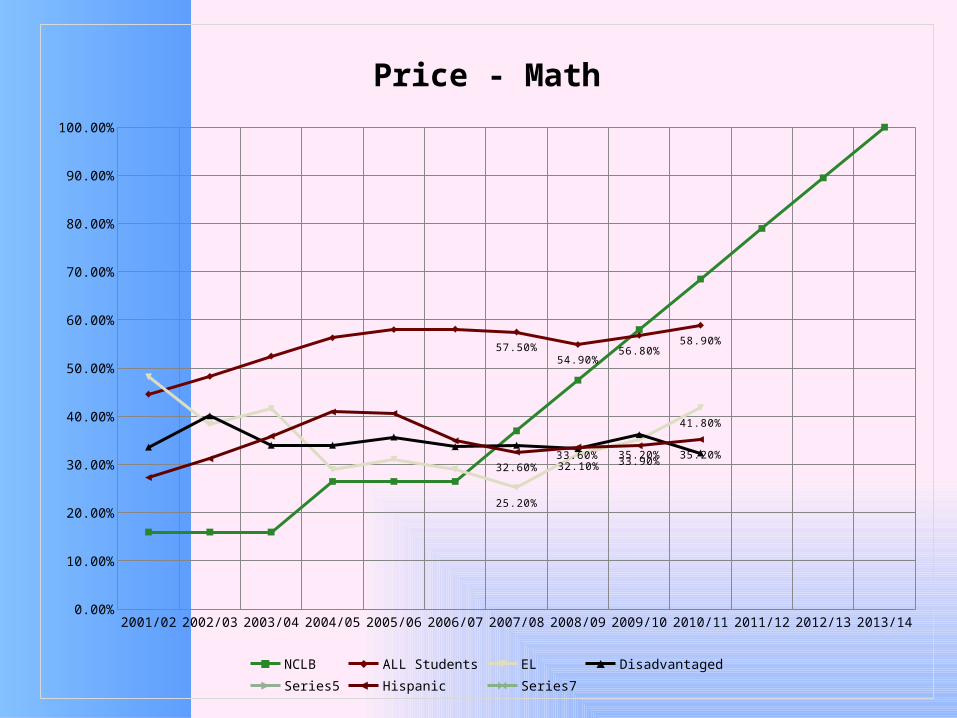
Price Math
• Met Criteria• Asian• English Learners with Safe Harbor
• Did not meet Criteria• White• Hispanic• Economically Disadvantaged
2001/02 2002/03 2003/04 2004/05 2005/06 2006/07 2007/08 2008/09 2009/10 2010/11 2011/12 2012/13 2013/140.00%
10.00%
20.00%
30.00%
40.00%
50.00%
60.00%
70.00%
80.00%
90.00%
100.00%
57.50%54.90%
56.80%58.90%
25.20%
32.10%35.20%
41.80%
32.60%33.60% 33.90%
35.20%
Price - Math
NCLB ALL Students EL DisadvantagedSeries5 Hispanic Series7
Program Improvement
Program Improvement (PI) is a formaldesignation for Title l funded schools and
local education agencies (LEAs) that donot make AYP for two consecutive years
school wide or for any numericallysignificant subgroups, according to the
No Child Left Behind Act (NCLB).
Program Improvement
This year, the district, as well asFarnham and Sartorette, are in
Year 1 PI due to thescores in some of the
subgroups.

Program Improvement
Under NCLB, PI schools and LEAs areresponsible for implementing specificfederal and state requirements during
each year they are in PI.
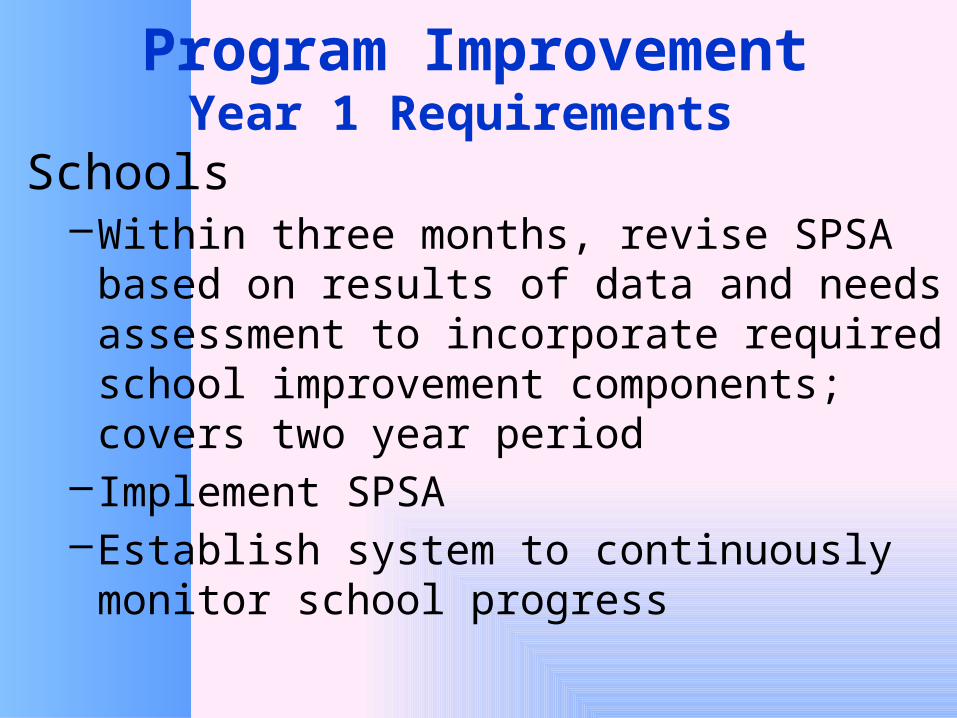
Program ImprovementYear 1 Requirements
Schools–Within three months, revise SPSA based on
results of data and needs assessment to incorporate required school improvement components; covers two year period
– Implement SPSA –Establish system to continuously monitor
school progress
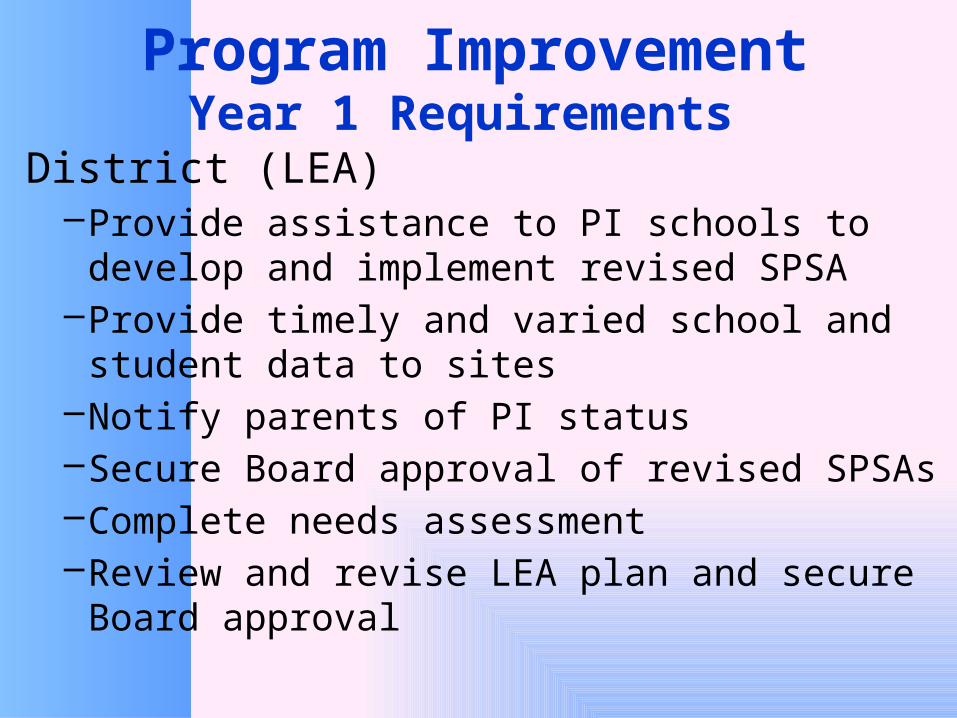
Program ImprovementYear 1 Requirements
District (LEA)–Provide assistance to PI schools to develop and
implement revised SPSA–Provide timely and varied school and student data
to sites–Notify parents of PI status – Secure Board approval of revised SPSAs–Complete needs assessment–Review and revise LEA plan and secure Board
approval

Next Steps• Completion of all requirements for Year I PI• Data disaggregation
–Site, grade level, subgroups, students• Revision of all SPSAs• Analysis of benchmark and assessment data• Increased accountability• Ongoing specific tracking of students throughout
year and adjusting instruction –Student by student
• Targeted interventions and extensions