Embed Size (px)
Citation preview
Cambodia
Poverty and Social Impact of the Global Economic Crises: Using
the Past to Plan for the Future
April, 2011
Pub
lic D
iscl
osur
e A
utho
rized
Pub
lic D
iscl
osur
e A
utho
rized
Pub
lic D
iscl
osur
e A
utho
rized
Pub
lic D
iscl
osur
e A
utho
rized
i
Table of Contents EXECUTIVE SUMMARY II
Main findings ii
Policy recommendations v
Short Term Policy Recommendations v
Long Term (Structural) Policy Recommendations viii
THE EARLY YEARS 1990’S-2007 1
Introduction 1
Macroeconomic Conditions 2
Welfare Changes 3
THE TURNING POINT: 2008 7
Economic growth 7
Labor Markets 8
Household welfare 9
Vulnerable households 12
Inflation and Prices 15
Rice prices 16
Other Factors in 2008 17
THE CRISIS YEAR AND BEYOND: 2009 AND LATER 19
Changes in the Labor Market 19
Impact on Households 21
The Impact on Poor and Vulnerable Workers 23
Coping Strategies 25
Income Generating Strategies 25
Consumption Reducing Strategies 26
Social Protection 26
Government Response 28
THE ENTIRE PERIOD 31
BIBLIOGRAPHY 35
ii
Executive Summary
MAIN FINDINGS
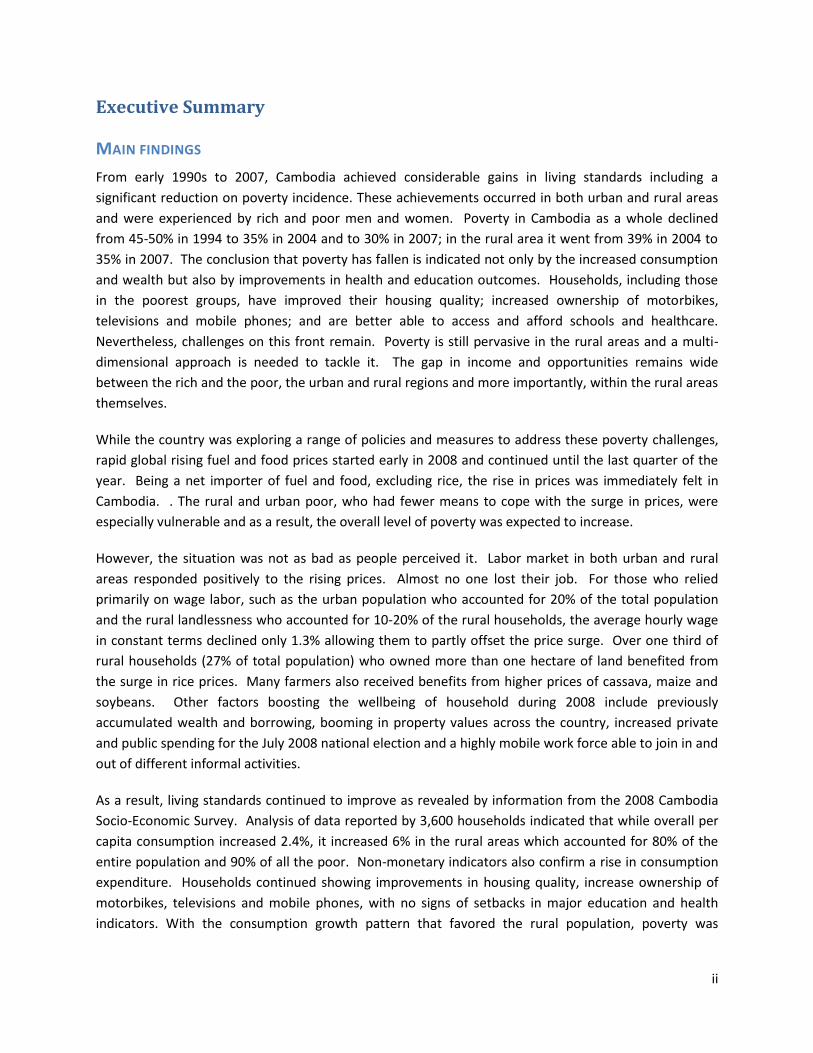
From early 1990s to 2007, Cambodia achieved considerable gains in living standards including a
significant reduction on poverty incidence. These achievements occurred in both urban and rural areas
and were experienced by rich and poor men and women. Poverty in Cambodia as a whole declined
from 45-50% in 1994 to 35% in 2004 and to 30% in 2007; in the rural area it went from 39% in 2004 to
35% in 2007. The conclusion that poverty has fallen is indicated not only by the increased consumption
and wealth but also by improvements in health and education outcomes. Households, including those
in the poorest groups, have improved their housing quality; increased ownership of motorbikes,
televisions and mobile phones; and are better able to access and afford schools and healthcare.
Nevertheless, challenges on this front remain. Poverty is still pervasive in the rural areas and a multi-
dimensional approach is needed to tackle it. The gap in income and opportunities remains wide
between the rich and the poor, the urban and rural regions and more importantly, within the rural areas
themselves.
While the country was exploring a range of policies and measures to address these poverty challenges,
rapid global rising fuel and food prices started early in 2008 and continued until the last quarter of the
year. Being a net importer of fuel and food, excluding rice, the rise in prices was immediately felt in
Cambodia. . The rural and urban poor, who had fewer means to cope with the surge in prices, were
especially vulnerable and as a result, the overall level of poverty was expected to increase.
However, the situation was not as bad as people perceived it. Labor market in both urban and rural
areas responded positively to the rising prices. Almost no one lost their job. For those who relied
primarily on wage labor, such as the urban population who accounted for 20% of the total population
and the rural landlessness who accounted for 10-20% of the rural households, the average hourly wage
in constant terms declined only 1.3% allowing them to partly offset the price surge. Over one third of
rural households (27% of total population) who owned more than one hectare of land benefited from
the surge in rice prices. Many farmers also received benefits from higher prices of cassava, maize and
soybeans. Other factors boosting the wellbeing of household during 2008 include previously
accumulated wealth and borrowing, booming in property values across the country, increased private
and public spending for the July 2008 national election and a highly mobile work force able to join in and
out of different informal activities.
As a result, living standards continued to improve as revealed by information from the 2008 Cambodia
Socio-Economic Survey. Analysis of data reported by 3,600 households indicated that while overall per
capita consumption increased 2.4%, it increased 6% in the rural areas which accounted for 80% of the
entire population and 90% of all the poor. Non-monetary indicators also confirm a rise in consumption
expenditure. Households continued showing improvements in housing quality, increase ownership of
motorbikes, televisions and mobile phones, with no signs of setbacks in major education and health
indicators. With the consumption growth pattern that favored the rural population, poverty was
iii
reduced by 9 percentage points to 21%. Without this new consumption growth pattern, simulations
show that the poverty rate would have only been reduced by 2 percent points to 28%.
Nevertheless, there is no room for complacency with this sharp drop in poverty. Many households who
managed to climb out of poverty are facing a higher risk of falling back because their capacities to cope
with major shocks have been stretched mainly by reduced savings, limited lending capacity and lack of
alternative jobs providing adequate returns. In other words, many households have now become more
vulnerable to another shock. The high degree of vulnerability could be observed on the elasticity of
poverty to consumption (percentage change on poverty due to one percentage change in consumption.)
For over half of the population in Cambodia poverty elasticity is above 2.0, the average for developing
countries in the region. Therefore, for a large share of households, small changes on their wellbeing can
move them in or out of poverty. Another dimension of high vulnerability was reflected by the high
proportion of transient poor. A study by the Cambodia Development Resource Institute to track
movement of living standards of 1,000 households in 9 rural villages showed that 40 – 45% of sample
households were falling in and out of poverty from 2001 to 2008.
It is clear that Cambodia has a serious nutrition problem which is only partially related to economic
conditions. Malnutrition is prevalent among the bottom four income quintiles and no improvements
were observed between 2008 and 2008 in Acute Malnutrition (changed from 8.4 to 8.9 percent), or in
Underweight (changed from 28.2 to 28.8 percent). Poor quality water and deficient sanitation practices
are good examples of why malnutrition remains a problem, even for the wealthiest households. Not
only how much food is taken is important, but so is its quality. The ability of the body to absorb
nutrients and make full use of the food intake is limited by health conditions. Problems like diarrhea,
parasites and infectious diseases do have a negative effect on nutritional outcomes, even when enough
calories are being consumed.
In short, there is enough evidence supporting that poverty actually declined sharply in 2008. However,
this sharp decline was likely a onetime gain and could result unsustainable because of the following
reasons. First, the rising cost of living and producing export products could threaten the country’s
competitiveness in the garment and tourism sectors. Second, wage increases are unlikely any time
soon. Third, gains in constant rice price are uncertain due to high price volatility and the increase of
input costs. Fourth, wealth and other means to cope with further shocks have been depleted.
The increased level of household vulnerability by end of 2008 was exacerbated by the effects brought
about by the global financial crisis. Full impact of the crisis was felt throughout 2009. Unlike 2008, labor
markets could no longer shoulder the negative impacts. As a consequence, hundreds of thousands of
jobs in the garment, construction and tourism-related services, were cut or affected due to closures of
garment factories and hotels. The property sector bubble burst, and jobs in construction were hit by
postponing or cancelling major investment projects. Data from the Cambodia Socio-Economic Survey
showed that average monthly wages during the first six months of the year decreased 15% from 2008 to
2009. Workers adjusted to this economic situation to avoid extreme consequences and over two million
new secondary jobs were created in the agricultural sector, mainly by women. More people were part
iv
of the labor force, more people were working in agriculture, and more people had more than one job;
however in the end, they were working less hours and their wages were drastically reduced. Constant
rice prices were falling since April 2009 and continued decreasing during the rest of the year and, with
an increased input cost, farmers margins were shrinking. This, together with lower wages, made the
agricultural sector an alternative that only provided partial protection against the crisis impacts. The
reduction in well-being is corroborated by the little or no improvement in housing quality and the
smaller ownership of durables like motorbikes, televisions and mobile phones. This implies that the
poverty reduction gain of 2008 was partly reversed in 2009.
During the crisis period of 2008 and 2009 the government and development partners continued with
existing social programs and in some cases, like in the food programs, increased their coverage. Also in
response to the crises, the RGC implemented a series of actions to improve the general economic
conditions of several sectors of the economy. These policies were aimed at improving the health of the
banking system, reducing the tariffs and taxes for the garment, agricultural and tourism sectors and
promoting training programs for displaced garment workers. It is difficult to measure the effectiveness
of individual policies but it is certain that the financial sector did not collapse and by 2010 was
considered in good standing. Agriculture continued to grow during the food, fuel and financial crisis,
and the tourism and garment sector experienced significant contractions in 2009 but have rebounded by
2011.
Like in many countries, the design of response measures was probably challenged by timeliness or
unavailability of real-time and systematic information. The crisis also revealed the lack of an adequate
information system able to provide the necessary information to better design responses to unexpected
shocks.
Box 1. Important findings 1990s-2007
Cambodia made significant progress in almost all social indicators including health, education and poverty. However, this progress had a very low base, leaving much room for improvement.
2008 Constant food prices did not increase for rural but did so for urban households (nominal food and fuel prices
increased for everybody).
In 2008, during the food and fuel crisis, consumption for the lowest three quintiles increased around 13% and overall conditions improved for the poor.
Wasting and underweight were not related to the socioeconomic conditions of households.
2009 Workers were highly mobile and during the first half of 2009 more than 2 million new jobs were created;
unfortunately almost all of them were non-paid family farm activities by women holding a second job.
Education provided partial protection against the 2009 financial crisis.
Several quick surveys designed during the crisis provided information on the general impact on households and special groups. However, their scope and coverage was limited and were not enough to provide an appropriate picture the country or to guide policy decisions to deal with new and emerging problems on a timely manner.

v
POLICY RECOMMENDATIONS
The food, fuel and financial crises highlighted different strengths and weaknesses on people’s ability to
adapt to hard times. On the positive side, Cambodians had a high degree of job mobility especially
between agricultural and non-agricultural activities. This was clearly illustrated by the significant share
of women joining the labor market and/or taking a second job during the financial crisis. Also, the high
concentration of people in the rural sector and their engagement in farming, shielded most of the rural
population against the negative impact of the food price increase during 2008. However, the events
also showed some of weaknesses that characterized many Cambodians, including their high dependency
on low paid, informal jobs; lack of a solid social protection system able to respond quickly to unforeseen
events; and low cash or in-kind savings to work as cushion for events lasting more than a few months. A
high degree of vulnerability was another uncovered characteristic, were small changes in income, and
therefore reductions in consumption, can move large shares of the population into poverty.
Policy recommendation are presented in two groups: those that are appropriate during an actual crisis,
requiring more immediate and targeted responses, and those addressing structural issues to better
prepare the country for unexpected events in the future. Probably the best strategy for individual
households is a combination of both sets of recommendations suited for their specific conditions.
Short Term Policy Recommendations
Human Capital: Targeted training
During the financial crisis, workers in the garment, tourism and construction sectors were among the
most vulnerable to changes in employment opportunities and struggled the most to retain their jobs or
income levels. Workers in these sectors, especially garment and tourism, are not among the poorest in
Cambodia; their incomes are above the national average, even among urban dwellers where most of
them live. At the same time these workers are highly vulnerable to changes in their employment and,
with very few alternative income sources and little savings to cushion even short periods of
unemployment, losing a job can very quickly move them into poverty. .
These vulnerable workers cannot be identified a priory and programs providing some relief should
include self targeting characteristics to select beneficiaries, address the main problem (unemployment
or underemployment) and facilitate their rapid integration into the work market. Towards that end, two
types of short term targeted trainings are recommended: sector specific training and general skills (soft
skills) training.
Sector specific training is recommended when an industry has shed part of the workforce but is
expected to recuperate in the short run (within 18 months or less). Training should aim at improving
some already acquired basic skills and this will help select the beneficiaries. Some design characteristics,
like the time of the training (during standard work hours) will also discourage people already holding a
job from joining the program. Some minimum stipend should be considered to compensate/cover for
food and transportation expenses.
vi
“Behavioral soft skills” training is recommended when workers have been displaced from several sectors
and there is uncertainty about future sector specific job opportunities. Behavioral soft skills are
necessary in any job and include communication, work attitude, team work, self discipline,
perseverance, and the ability to negotiate conflict and manage risks (World Bank, 2006). Improvement
in soft skills is expected to also raise workers productivity, further increasing their chances of finding a
new job. Both trainings should be short term training programs planned and executed jointly with
private sector counterparts, with a flexible design able to adapt to changing conditions over time.
Social Programs
Limited saving or alternative sources of income have been identified as a major problem during the
crises. To help workers during short periods of time, it is recommended to design and implement a
modest unemployment insurance or savings plan. For example, a plan to provide an income
supplement for up to six months (equivalent to three month salaries) can make a substantial difference
and extend the ability of workers in the formal sector to have some minimum resources until a new job
is found. Such schemes are usually comprised of both employee and employer contributions and these
should be “portable” from one job to another.
To help informal workers, the Government of Cambodia could consider the establishment of self-
targeted Public Work Programs. By paying an amount close to the reservation wage, only the
unemployed or the severely under-employed would have a strong motivation to join the program. In
order to cover as many people as possible, participation in the program should be limited to a maximum
number of months. Also, by selecting projects valuable to the communities, the benefits of such
programs could be enjoyed by a wider share of the population beyond the direct beneficiaries, promote
local organizations and create stronger community relationships.
Food distribution programs have been already established in Cambodia. Several studies showed that
during the food, fuel and financial crises, these types of programs were the most popular and
appreciated by beneficiaries and the population in general. Also, during the crisis, several food
distribution programs were able to expand and to cover a wider share of the population. It is
recommended to keep the food distribution programs in place and to continue improving the
mechanisms used to target the poorest and vulnerable. During 2008 food and fuel crisis, food prices in
Cambodia’s urban areas increased faster than inflation; at the same time, nutritional studies provided
strong indication of increased nutritional problems in the urban areas. It is recommended to put
attention to areas of the country were food prices increase faster than overall inflation due to the
tendency of households to decrease food consumption in favor of other goods and services under such
circumstances with negative impacts on nutrition.
Economic facilitation
During the 2008 food and fuel crisis a common strategy used by households in trouble was to borrow
money from formal and informal lenders. Before households were able to repay the loans, the financial
crisis impacts were felt in Cambodia and households were struggling to find new sources of money and
repay previous acquired loans. The bigger loans were used for production purposes, but the most
frequent type of loans were partially used to complement households’ income and bust their
vii
consumption. Regardless of the loan size, the instruments of the financial institutions were not
designed to accommodate one crisis after another and, more importantly, were not flexible enough to
adapt to the changing conditions.
The recommendation is for the Government of Cambodia to design an appropriate mechanism to
provide support through the established financial institutions, in case a similar situation arises in the
future. At this point is not clear what the best way is to promote the introduction of more flexible
lending mechanisms and options; government-supported loan insurance or guarantee provider should
be analyzed and considered.
Information systems
Establishing a continuous employment survey providing timely information on the conditions and
characteristics of the labor force can be a very useful tool for policy makers. Current information on
labor conditions in Cambodia is available only for a small share of the labor force concentrated on the
garment industry. Albeit the importance of the garment segment, it only represents around five percent
of the total labor force and does not include the poorest workers. A continuous labor survey can also
provide early warnings to emerging problems and detect unexpected changes. As one of the main users
of such a survey, the National Employment Agency should be involved on its design and help provide
linkages between these data and policy makers.
Box 2 Short Term Policy Recommendation Abstract HUMAN CAPITAL
Establish a join Public-Private sector small scale training program to improve sector specific skills and general behavioral soft skills of workers. The small scale program should work as the basis for a more extensive operation in the case of future crisis and provide targeted training to displaced workers in vulnerable sectors.
SOCIAL PROGRAMS Set up a savings/unemployment scheme to increase formal workers ability to weather out short periods of unemployment. For informal workers, especially in the rural areas, a public works programs can provide similar relief during short periods of time to the unemployed or seasonable unemployed. Secondary message: keep the existing food distribution programs and keep improving mechanisms to reach the poorest and most vulnerable, paying attention to areas of the country with possible food shortages and with food prices increasing faster than inflation.
ECONOMIC FACILITATION Promote more flexible type of lending mechanisms that take into consideration changing conditions in the face of generalized crisis in the country. No specific recommendation is made beyond exploring the alternatives to be prepared for possible future crises.
INFORMATION SYSTEMS Design a continuous employment survey with current information on the conditions of the labor force in Cambodia and provide early warnings during a crisis.
viii
Long Term (Structural) Policy Recommendations
Human Capital
Increasing human capital through formal education is one of the best long term strategies to improve
the socioeconomic conditions of the people. Access to primary education in Cambodia significantly
increased reaching 86.7 percent of children six to eleven years old in 20081. Even for children in the
poorest quintile, access increased to 82.5%. During the financial crisis, formal education was one of the
few characteristics that partially shelter workers from major wage reductions2.
Efforts to expand primary education access should concentrate in rural areas. Almost all children not
attending school (93.1 percent) live in rural areas and efforts to make primary education a truly
universal service in Cambodia needs to promote school attendance or provide better access to rural
households. More attention should be given to the age of children at graduation from primary
education. Given the high coverage levels in primary education, the government of Cambodia should
start looking at other issues, mainly aspects related to children finishing the first six years of education
on time: entry age, promotion and dropout rates.
Secondary education has two almost equally important limiting factors in Cambodia: access and age
of students. Indeed, 56.5 percent of children 13 to 17 years old are not attending secondary, but not all
of them are out of the school system: half are in primary education. Access and education levels at ages
13 to 17 are especially low for the poorest three quintiles in urban households and for the poorest four
quintiles in rural areas. The over aged students attending a specific grade is a problem that has to be
addressed at the primary education level; any improvement at that level will benefit secondary
education performance. To address the economic reasons for not going to secondary school,
expansion of the scholarship programs and/or a Conditional Cash Transfer program for education is
recommended. To improve access to secondary education, two issue need to be addressed:
discouraged students mentioned by almost a quarter of children not in school, and economic reasons,
mentioned by almost 62 percent of the time. Unexpectedly, there is almost no difference between
males and females in reporting “contributing to household income” or “helping with household chores”
as the main reason for not attending school.
Social Programs
Targeting of social programs was one of the most important recommendations on the Social Protection
Strategy prepared by the government of Cambodia in 2010. Targeting does promote the use of limited
resources on a rational and fair manner, allocating them where they are needed the most: the poor and
the vulnerable.
Social programs aimed at the poor and vulnerable have to be directed at rural households with only
small interventions on urban areas outside Phnom Penh. Even after taking the vulnerable into
consideration, around 90 percent of the poor are in the rural areas and only about 8% live in the urban
1 Access to education is defined here as the percentage of children attending school for a given age range.
2 The only other characteristic associated with smaller wage reductions was people living in urban areas.
ix
areas outside Phnom Penh. Resource allocation for social programs should reflect the high
concentration of the poor living in the rural side of the country.
Targeting mechanisms in social programs should include not only the poor but a much bigger segment
of the population. The socioeconomic conditions of Cambodian households are especially vulnerable to
change; for example, an increase of 30 percent in the poverty line would translate in doubling the
number of poor. Furthermore, half of the households in the country -the poorest- have similar
characteristics including land assets, access to housing services, education, and family size. Any social
program aiming at the poor and vulnerable in Cambodia needs to consider how similar households are
and include a much larger than usual share of the non-poor as potential beneficiaries. This
recommendation should be considered not only to establish social programs but also new programs like
the Cash Transfer program being piloted in 2011.
The evidence base analysis in Cambodia indicates that other factor beyond total food intake play an
important role in the nutrition conditions of the population; but the role of those factors is not well
understood: how much do water quality, food handling, sanitation and cultural practices influence
nutritional outcomes? Further analysis is needed on causes of malnutrition, including reasons behind
increases in child wasting. International evidence suggests that implementing a comprehensive
package of community-based and facility-based nutrition interventions can have a significant impact
on child malnutrition, but such interventions have not yet been scaled up in Cambodia.
Monitoring and evaluation should be an integral part of any social program in Cambodia. Monitoring
and especially evaluation of social programs is not a common practice. Unfortunately, not doing so limits
the ability to identify strengths and weaknesses on most programs making it difficult to modify them
and maximize the impact of interventions. The government of Cambodia has a lot to gain by requiring a
well-defined plan for monitoring and evaluation of the social programs including financial and
administrative processes, implementation, service delivery, and impact.
Promoting agricultural activities
Farming, and especially rice cultivation remains not only the main activity for rural households but also
the single most important item of consumption in Cambodia. During the food and fuel crisis, farmers
were able to capture the benefits of higher rice prices and more than compensated for the negative
impact with significant increases in their per capita consumption. The rural sector also provided partial
protection against the financial crisis by providing almost all the new jobs created during that period.
To benefit the poor and vulnerable, agricultural policy should promote yields’ increase by encouraging
a more intensive use of inputs targeted to small size farms. In 2008, Cambodian rice productivity of 2.6
tons per hectare remained very low compared to that of other countries in the region; for example, the
average yields in tons per hectare were 3.5 in Laos and 4.9 in Vietnam, countries with similar agro-
ecological conditions to Cambodia. Better yields can be achieved by infrastructure investments (mainly
irrigation), an increased use of inputs such as improved seeds, fertilizers, herbicides, etc., and the use of
better practices necessary to take full advantage of a more factor intensive model of production.
Facilitating a more intensive use of the land has to take into consideration that nine out of ten land plots
x
used by farmers are smaller than three hectares; technology promoted by extension services including
light machinery, tools and farming techniques, as well as financial instruments (loans), inputs packaging,
and others has to be tailored to meet the needs of these relatively small farms.
Facilitate the creation of small scale processing industries to capture the full benefits of agricultural
products and provide job diversification in rural communities. Around a third of rural households has
very small plots of land, less than a fifth of a hectare, or has no land at all. For such households job
opportunities on the farming sector are mainly seasonal and do not provide a continuous source of
income during the entire year. The creation of small scale processing industries would take advantage
of the local knowledge and the proximity to the raw materials, add value to the local agricultural
products, diversify the local economy and provide an alternative source of income for rural households.
Information systems
Taking full advantage of information sources already available in the country requires making them
more accessible on a timely fashion and adopting better analytical practices to help breach the gap
between data producers and users. Information used as a tool for policy guidance has to be accessible,
current and relevant. The degree of accessibility and the time it takes from collecting the data to
presenting the results can be substantially improved by changing the design of the data gathering and
the data entry processes. This is not an issue of working faster but of working in a different manner,
including these principles among the already set objectives of the institutions collecting the information.
Making the information more relevant to public policy in Cambodia requires a significant increase of
communication between data producers and data users and a design of flexible data gathering
instruments to adjust for emerging issues and changing conditions in the country.
Box 3. Long Term/Structural Policy recommendation abstract HUMAN CAPITAL
Concentrate efforts to ensure timely completion of primary education by promoting early entry, grade promotion and reduction of dropout rates. Secondary message: provide economic incentives to increase secondary education participation.
SOCIAL PROGRAMS Expand the use of targeting mechanisms used by social programs to include not only the poor but a much bigger segment of the population within rural households. Include the principle not only on existing programs but also in new ones like the Cash Transfer program to be piloted in 2011. Conduct further analysis on causes of malnutrition on Cambodia and plan for implementing a comprehensive package of community-based and facility-based nutrition interventions. Secondary message: require monitoring and evaluation of social programs as a standard practice looking into processes, service delivery and impact of the programs.
AGRICULTURAL SECTOR Facilitate and promote a more intensive use of the land (i.e. more inputs, improved farming techniques, etc.) tailored to farmers with less than three hectares of land. Concentrate on rice, maize and cassava farmers. Secondary message: promote and facilitate the creation of small scale processing industry of agricultural products on rural communities.
INFORMATION SYSTEMS Strengthen the link between data producers and data users to provide relevant information for policy makers on a timely manner.

xi
1
The Early years 1990’s-2007
INTRODUCTION
To be able to understand the impact and responses to the crisis, it is important to distinguish three
periods in time: first, a period of high growth and significant reduction in poverty from the early 1990’s
to 2007; second, 2008, the year of food and fuel price increases; and third, the period where the
financial crisis hit Cambodia the hardest, the early 2009 and later on. This report is organized following
these three periods and pays special attention to the different issues that characterized each of them. A
final section providing an overall view is presented the end. There are some cross cutting themes, but
they are mostly the underlying characteristics of the country and represent by far most of the dynamics,
responses and lessons learned, useful to draw conclusions for future changes over time. Also, the
timing of the events does not perfectly fit the periods chosen; the best cutting points were selected
taking into consideration data availability. The document will mention especial cases when important
shifts were observed during any period. The policy recommendations from the note were put forward in
the executive summary and will not be summarized in the main text.
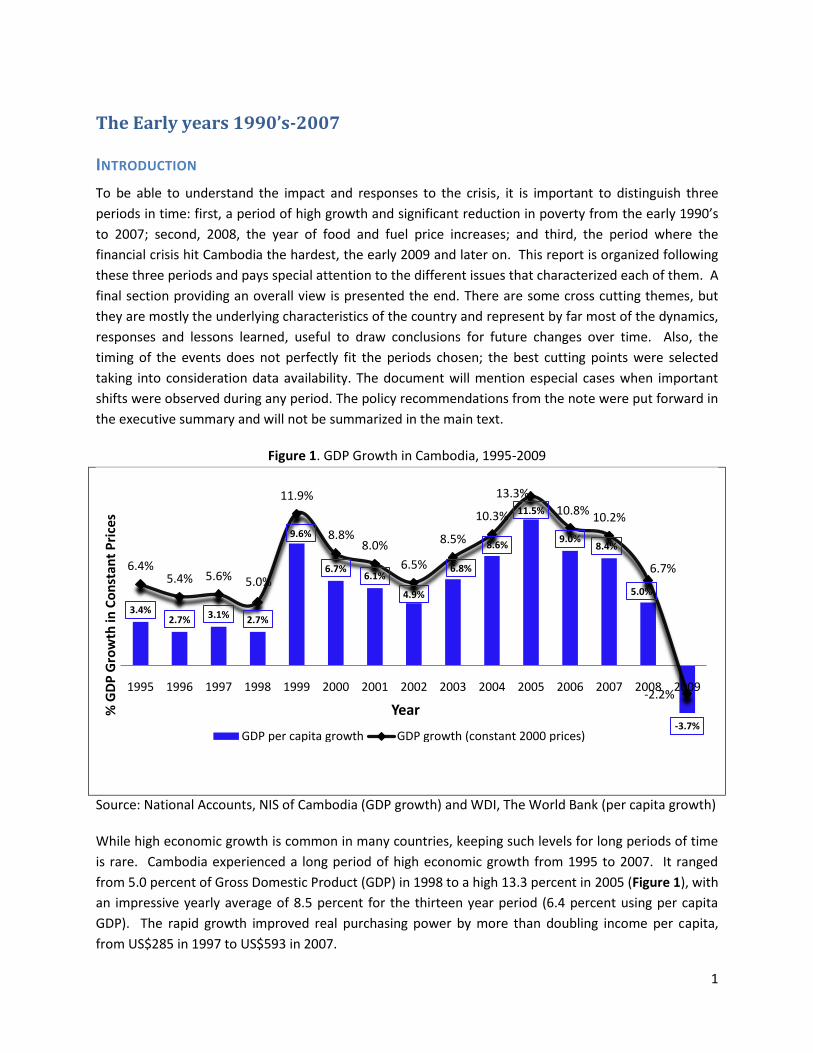
Figure 1. GDP Growth in Cambodia, 1995-2009
Source: National Accounts, NIS of Cambodia (GDP growth) and WDI, The World Bank (per capita growth)
While high economic growth is common in many countries, keeping such levels for long periods of time
is rare. Cambodia experienced a long period of high economic growth from 1995 to 2007. It ranged
from 5.0 percent of Gross Domestic Product (GDP) in 1998 to a high 13.3 percent in 2005 (Figure 1), with
an impressive yearly average of 8.5 percent for the thirteen year period (6.4 percent using per capita
GDP). The rapid growth improved real purchasing power by more than doubling income per capita,
from US$285 in 1997 to US$593 in 2007.
3.4%2.7% 3.1% 2.7%
9.6%
6.7%6.1%
4.9%
6.8%
8.6%
11.5%
9.0%8.4%
5.0%
-3.7%
6.4%5.4% 5.6% 5.0%
11.9%
8.8%8.0%
6.5%
8.5%
10.3%
13.3%
10.8%10.2%
6.7%
-2.2%1995 1996 1997 1998 1999 2000 2001 2002 2003 2004 2005 2006 2007 2008 2009
% G
DP
Gro
wth
in C
on
stan
t P
rice
s
Year
GDP per capita growth GDP growth (constant 2000 prices)
2
MACROECONOMIC CONDITIONS
This rapid growth can be viewed as the product of three dimensions: (i) History and Geography
including the peace dividend following the previous decade’s end of a multi-decade conflict, overall
global growth in a dynamic East Asia region, and a transition to democracy; (ii) Use of Natural Resources
including forests, fisheries, land (real state/construction) and touristic sites; and (iii) Improved
Governance of Sector Specific Activities, specifically of the garment sector by providing the
appropriate business environment in association with private enterprises, supervised by international
organizations and in cooperation with export partners (World Bank, 2009).
The fast growth experienced during this period also had an
impact on the structure of the economy. With 44.7 percent
share of GPD, agriculture was the most important sector of
the economy in 1995. By 2007 agriculture was displaced to
third, behind Industry and Services3. Most of the decrease in
the agricultural share was captured by Industry, and more
specifically by the garment sector, substituting low
productivity activities in the agricultural sector with higher productivity jobs in industry (Table 1).
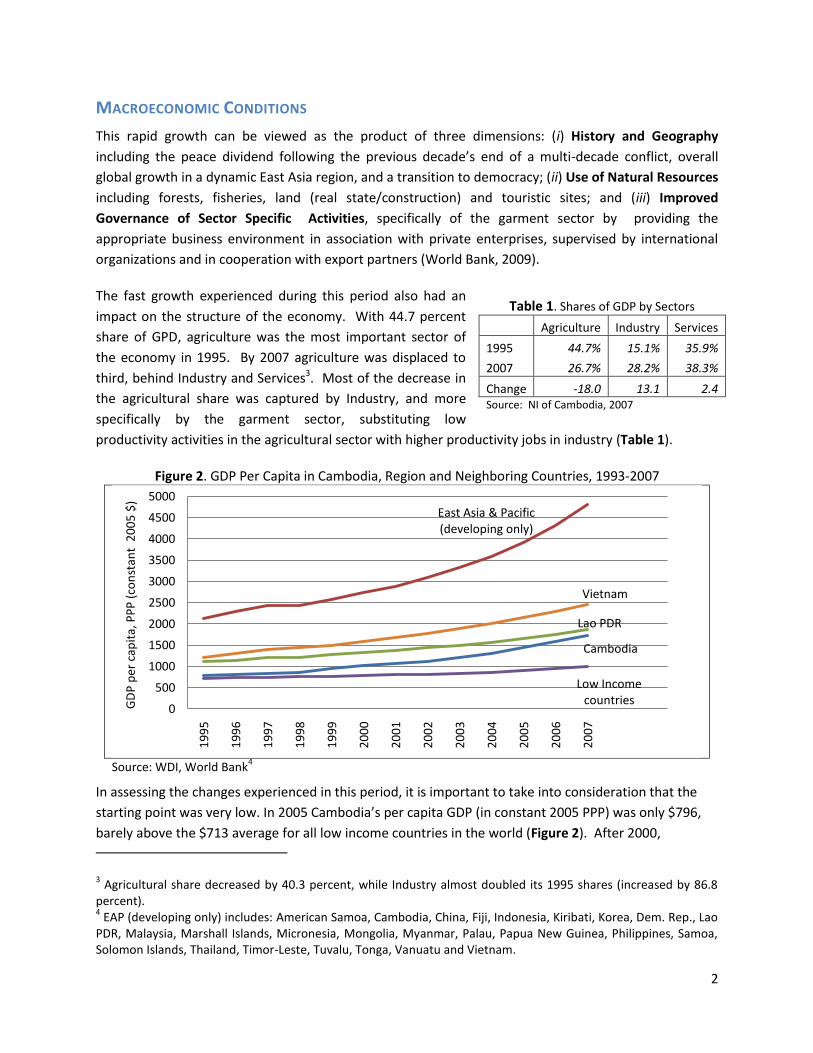
Figure 2. GDP Per Capita in Cambodia, Region and Neighboring Countries, 1993-2007
Source: WDI, World Bank
4
In assessing the changes experienced in this period, it is important to take into consideration that the
starting point was very low. In 2005 Cambodia’s per capita GDP (in constant 2005 PPP) was only $796,
barely above the $713 average for all low income countries in the world (Figure 2). After 2000,
3 Agricultural share decreased by 40.3 percent, while Industry almost doubled its 1995 shares (increased by 86.8
percent). 4 EAP (developing only) includes: American Samoa, Cambodia, China, Fiji, Indonesia, Kiribati, Korea, Dem. Rep., Lao
PDR, Malaysia, Marshall Islands, Micronesia, Mongolia, Myanmar, Palau, Papua New Guinea, Philippines, Samoa, Solomon Islands, Thailand, Timor-Leste, Tuvalu, Tonga, Vanuatu and Vietnam.
Cambodia
East Asia & Pacific (developing only)
Lao PDR
Low Income countries
Vietnam
0
500
1000
1500
2000
2500
3000
3500
4000
4500
5000
19
95
19
96
19
97
19
98
19
99
20
00
20
01
20
02
20
03
20
04
20
05
20
06
20
07
GD
P p
er c
apit
a, P
PP
(co
nst
ant
20
05
$)
Table 1. Shares of GDP by Sectors
Agriculture Industry Services
1995 44.7% 15.1% 35.9%
2007 26.7% 28.2% 38.3%
Change -18.0 13.1 2.4 Source: NI of Cambodia, 2007
3
Cambodia per capita GDP increased faster than the low income countries and Lao PDR but the gap with
Vietnam and developing nations in the region increased over time.
WELFARE CHANGES
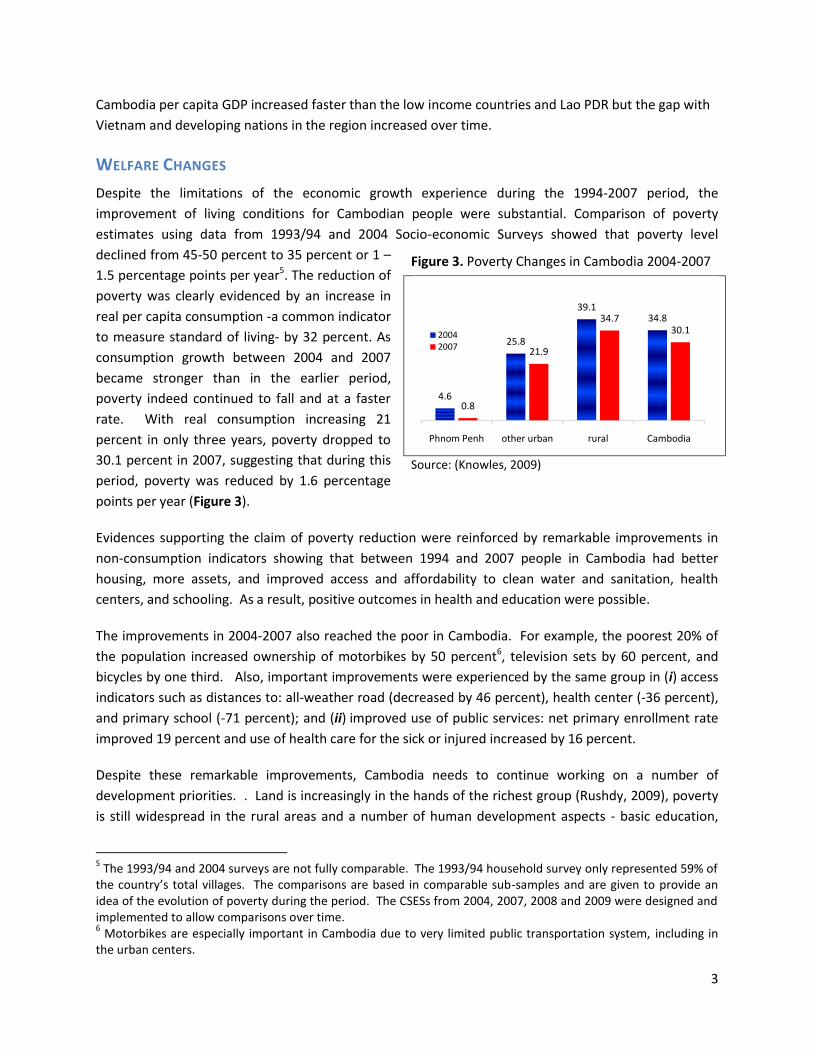
Despite the limitations of the economic growth experience during the 1994-2007 period, the
improvement of living conditions for Cambodian people were substantial. Comparison of poverty
estimates using data from 1993/94 and 2004 Socio-economic Surveys showed that poverty level
declined from 45-50 percent to 35 percent or 1 –
1.5 percentage points per year5. The reduction of
poverty was clearly evidenced by an increase in
real per capita consumption -a common indicator
to measure standard of living- by 32 percent. As
consumption growth between 2004 and 2007
became stronger than in the earlier period,
poverty indeed continued to fall and at a faster
rate. With real consumption increasing 21
percent in only three years, poverty dropped to
30.1 percent in 2007, suggesting that during this
period, poverty was reduced by 1.6 percentage
points per year (Figure 3).
Evidences supporting the claim of poverty reduction were reinforced by remarkable improvements in
non-consumption indicators showing that between 1994 and 2007 people in Cambodia had better
housing, more assets, and improved access and affordability to clean water and sanitation, health
centers, and schooling. As a result, positive outcomes in health and education were possible.
The improvements in 2004-2007 also reached the poor in Cambodia. For example, the poorest 20% of
the population increased ownership of motorbikes by 50 percent6, television sets by 60 percent, and
bicycles by one third. Also, important improvements were experienced by the same group in (i) access
indicators such as distances to: all-weather road (decreased by 46 percent), health center (-36 percent),
and primary school (-71 percent); and (ii) improved use of public services: net primary enrollment rate
improved 19 percent and use of health care for the sick or injured increased by 16 percent.
Despite these remarkable improvements, Cambodia needs to continue working on a number of
development priorities. . Land is increasingly in the hands of the richest group (Rushdy, 2009), poverty
is still widespread in the rural areas and a number of human development aspects - basic education,
5 The 1993/94 and 2004 surveys are not fully comparable. The 1993/94 household survey only represented 59% of
the country’s total villages. The comparisons are based in comparable sub-samples and are given to provide an idea of the evolution of poverty during the period. The CSESs from 2004, 2007, 2008 and 2009 were designed and implemented to allow comparisons over time. 6 Motorbikes are especially important in Cambodia due to very limited public transportation system, including in
the urban centers.
Figure 3. Poverty Changes in Cambodia 2004-2007
Source: (Knowles, 2009)
4.6
25.8
39.134.8
0.8
21.9
34.730.1
Phnom Penh other urban rural Cambodia
20042007
4
maternal health, and environment – are likely to get the country off-track the Millennium Development
Goal targets unless they are immediately intervened. In 2007, one in three persons still lived under the
poverty line, which made the rural area a place where 90 percent of the total number of the poor
resided.
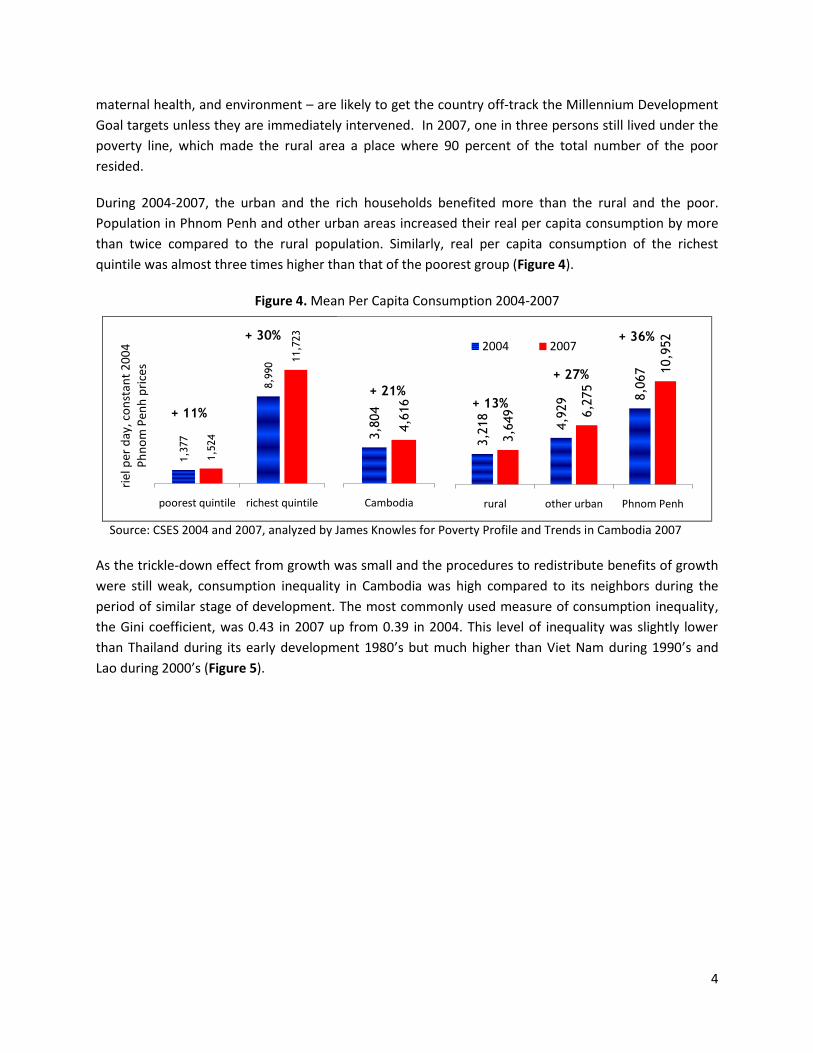
During 2004-2007, the urban and the rich households benefited more than the rural and the poor.
Population in Phnom Penh and other urban areas increased their real per capita consumption by more
than twice compared to the rural population. Similarly, real per capita consumption of the richest
quintile was almost three times higher than that of the poorest group (Figure 4).
Figure 4. Mean Per Capita Consumption 2004-2007
Source: CSES 2004 and 2007, analyzed by James Knowles for Poverty Profile and Trends in Cambodia 2007
As the trickle-down effect from growth was small and the procedures to redistribute benefits of growth
were still weak, consumption inequality in Cambodia was high compared to its neighbors during the
period of similar stage of development. The most commonly used measure of consumption inequality,
the Gini coefficient, was 0.43 in 2007 up from 0.39 in 2004. This level of inequality was slightly lower
than Thailand during its early development 1980’s but much higher than Viet Nam during 1990’s and
Lao during 2000’s (Figure 5).
1,377
8,990
1,524
11,723
poorest quintile richest quintile
riel
per
day
, co
nst
ant
20
04
P
hn
om
Pen
h p
rice
s
+ 11%
+ 30%
3,804
4,616
Cambodia
+ 21%
3,218
4,929 8,067
3,649 6,275
10,952
rural other urban Phnom Penh
2004 2007
+ 13%
+ 27%
+ 36%

5
Figure 5. Gini inequality in Cambodia and Neighboring Countries
Source: World Bank’s PovCal information database, November 20,2008
Contrary to perceptions, most of the inequality in 2007 as well as its rise were not due to differences
between the urban and rural households. The widening gap among rural households was primarily
responsible for the increasing of the country’ overall gap. The inequality measure known as the Theil
index can distinguish between changes due to differences within regions and differences among regions.
In 2007, differences among rural households accounted for over half the total inequality in Cambodia.
Also, between 2004 and 2007, the Theil index showed that the increase in inequality within regions
accounted for two-thirds of the increase in total inequality. Among the regions, the increase in gap
within rural areas accounted for 41% of the total increase in inequality while differences among the
regions accounted for one third (Figure 6).
Figure 6. Shares of Theil index for 2007 and for 2004-2007 changes
Source: World Bank staff estimates using 2004 and 2007 CSES
0.25
0.30
0.35
0.40
0.45
0.50
1992 1997 2002 1992 1998 2002 2006 1981 1988 1992 1996 2004 2007
Lao (PDR Vietnam Thailand Cambodia
0%
10%
20%
30%
40%
50%
60%
Within Phnom Penh Within other urban Within rural Between Regions
2007 2004-2007 increase

6
7
The Turning Point: 2008 Cambodia felt the adverse impact of the global financial and economic crisis in last quarter of 2008. The crisis was preceded by rapid rising fuel and food prices in early and mid 2008 combined with various transcontinental epidemic diseases, namely SARS, bird flu, and H1N1. While the country was coping with the negative impact of multiple crises, the situation in some part of the country - particularly in the North and Northeastern provinces – was exacerbated by typhoon Ketsana and flash floods. The typhoon damaged houses, rice crops, and livestock. The typhoon brought $132 million in total damage and loss to Cambodia (Cambodia Post Disaster Needs Assessment).
It is very difficult, if not impossible, to analyze the net impact of each crisis on poverty and human
development because they came one after the other and at the same time. However, the consensus
would be that these crises have diverted the reduction of poverty Cambodia has had in the past. Also,
the crises did not happened in a vacuum: the effects came on top of existing processes of medium- to
long-term social and economic change making it hard to distinguish secular trends from the effects of
the crisis. These underlying trends include (i) a demographic transition that brings around 250 thousand
young Cambodians into the labor market each year; (ii) environmental change and increasing
privatization of what were traditionally open-access natural resources; (iii) increasing concentration of
landholding; and (iv) the increasing commoditization of rural economic relations which in the past were
based upon principles of inter-household reciprocity and a degree of social assistance.
ECONOMIC GROWTH
To help understand how the crises affected Cambodia, it is helpful to distinguish who was influenced
and when the effects were felt. As mentioned before, it is almost impossible to differentiate the impact
of each event that took place in 2008, but at least we can identify who was more likely to bear the
consequences of changes during the year and their effect on poverty and welfare in general.
As Cambodia is a net importer of fuel and consumer of food despite being a net rice producer, it was
believed that rapid rising of fuel and food prices would have wide distributional impacts on households.
In addition, the fact that people panicked due to uncertain and unpredictable rising cost of living, made
the prediction of increasing poverty likeliness a valid argument.
It has been pointed out that economic growth was drastically reduced in 2008. Indeed, per capita GDP
growth decreased from 8.4 percent in 2007 to 5.0 percent in 20087 (Figure 1), but that is hardly a drastic
reduction. For example, from 2000 to 2003, part of the period of economic expansion, average per
capita GDP growth in Cambodia was 6.1 percent and included one year with a lower growth than that of
2008 (4.9 percent in 2002). Even by international standards, per capita GDP growth of 5.0 percent is
considered robust and is not associated with hard times or macroeconomic crises.
Why was then 2008 perceived as such a bad year and, for example, 2002, with a lower GDP growth rate
was not? There are two major differences between the two years that can help us understand the
7 For welfare analysis per capita GDP growth is used here. Nevertheless, total GDP growth evolution is very similar
reaching the same conclusions.
8
negative perceptions of 2008: first, 2002 was preceded and followed by higher economic growth rates
making it easier to compensate over time for the slow down; after 2008 the economic growth was
negative, having a compounding effect and making it much more difficult to smooth conditions over
time; second, most of the economic slowdown in 2008 occurred in the fourth quarter of the year,
leaving a lasting impression that reflected more the conditions of the last part and not of the entire year.
Third, inflation in 2008 was 43.6%8, increasing a sense of vulnerability and bringing about rapid changes
not common in Cambodia (see Inflation and Prices section).
LABOR MARKETS
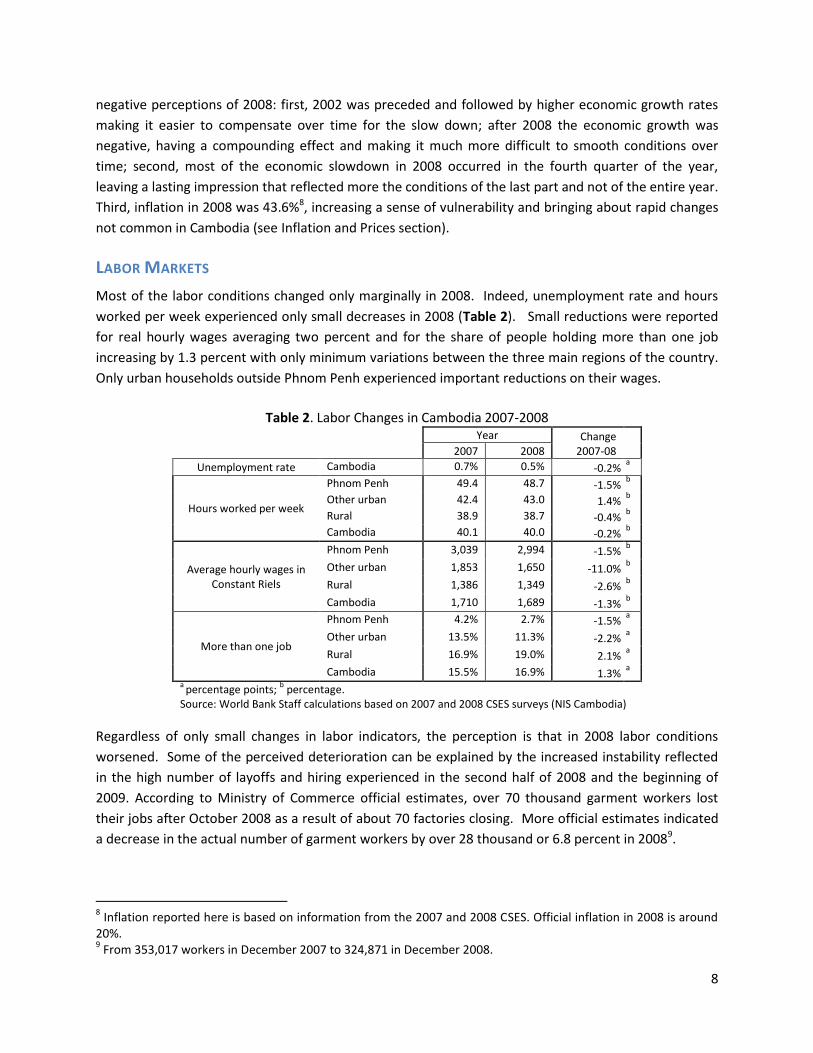
Most of the labor conditions changed only marginally in 2008. Indeed, unemployment rate and hours
worked per week experienced only small decreases in 2008 (Table 2). Small reductions were reported
for real hourly wages averaging two percent and for the share of people holding more than one job
increasing by 1.3 percent with only minimum variations between the three main regions of the country.
Only urban households outside Phnom Penh experienced important reductions on their wages.
Table 2. Labor Changes in Cambodia 2007-2008
Year Change
2007-08
2007 2008 Unemployment rate Cambodia 0.7% 0.5% -0.2%
a
Hours worked per week
Phnom Penh 49.4 48.7 -1.5% b
Other urban 42.4 43.0 1.4% b
Rural 38.9 38.7 -0.4% b
Cambodia 40.1 40.0 -0.2% b
Average hourly wages in Constant Riels
Phnom Penh 3,039 2,994 -1.5% b
Other urban 1,853 1,650 -11.0% b
Rural 1,386 1,349 -2.6% b
Cambodia 1,710 1,689 -1.3% b
More than one job
Phnom Penh 4.2% 2.7% -1.5% a
Other urban 13.5% 11.3% -2.2% a
Rural 16.9% 19.0% 2.1% a
Cambodia 15.5% 16.9% 1.3% a
a percentage points;
b percentage.
Source: World Bank Staff calculations based on 2007 and 2008 CSES surveys (NIS Cambodia)
Regardless of only small changes in labor indicators, the perception is that in 2008 labor conditions
worsened. Some of the perceived deterioration can be explained by the increased instability reflected
in the high number of layoffs and hiring experienced in the second half of 2008 and the beginning of
2009. According to Ministry of Commerce official estimates, over 70 thousand garment workers lost
their jobs after October 2008 as a result of about 70 factories closing. More official estimates indicated
a decrease in the actual number of garment workers by over 28 thousand or 6.8 percent in 20089.
8 Inflation reported here is based on information from the 2007 and 2008 CSES. Official inflation in 2008 is around
20%. 9 From 353,017 workers in December 2007 to 324,871 in December 2008.
9
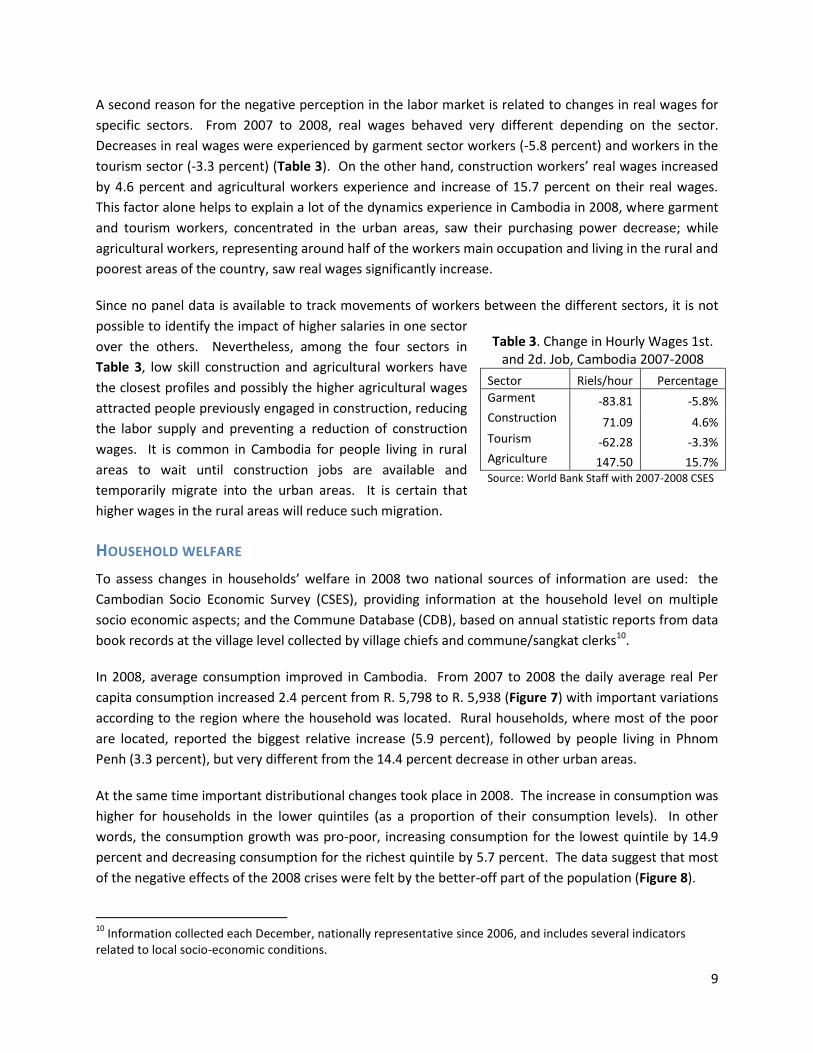
A second reason for the negative perception in the labor market is related to changes in real wages for
specific sectors. From 2007 to 2008, real wages behaved very different depending on the sector.
Decreases in real wages were experienced by garment sector workers (-5.8 percent) and workers in the
tourism sector (-3.3 percent) (Table 3). On the other hand, construction workers’ real wages increased
by 4.6 percent and agricultural workers experience and increase of 15.7 percent on their real wages.
This factor alone helps to explain a lot of the dynamics experience in Cambodia in 2008, where garment
and tourism workers, concentrated in the urban areas, saw their purchasing power decrease; while
agricultural workers, representing around half of the workers main occupation and living in the rural and
poorest areas of the country, saw real wages significantly increase.
Since no panel data is available to track movements of workers between the different sectors, it is not
possible to identify the impact of higher salaries in one sector
over the others. Nevertheless, among the four sectors in
Table 3, low skill construction and agricultural workers have
the closest profiles and possibly the higher agricultural wages
attracted people previously engaged in construction, reducing
the labor supply and preventing a reduction of construction
wages. It is common in Cambodia for people living in rural
areas to wait until construction jobs are available and
temporarily migrate into the urban areas. It is certain that
higher wages in the rural areas will reduce such migration.
HOUSEHOLD WELFARE
To assess changes in households’ welfare in 2008 two national sources of information are used: the
Cambodian Socio Economic Survey (CSES), providing information at the household level on multiple
socio economic aspects; and the Commune Database (CDB), based on annual statistic reports from data
book records at the village level collected by village chiefs and commune/sangkat clerks10.
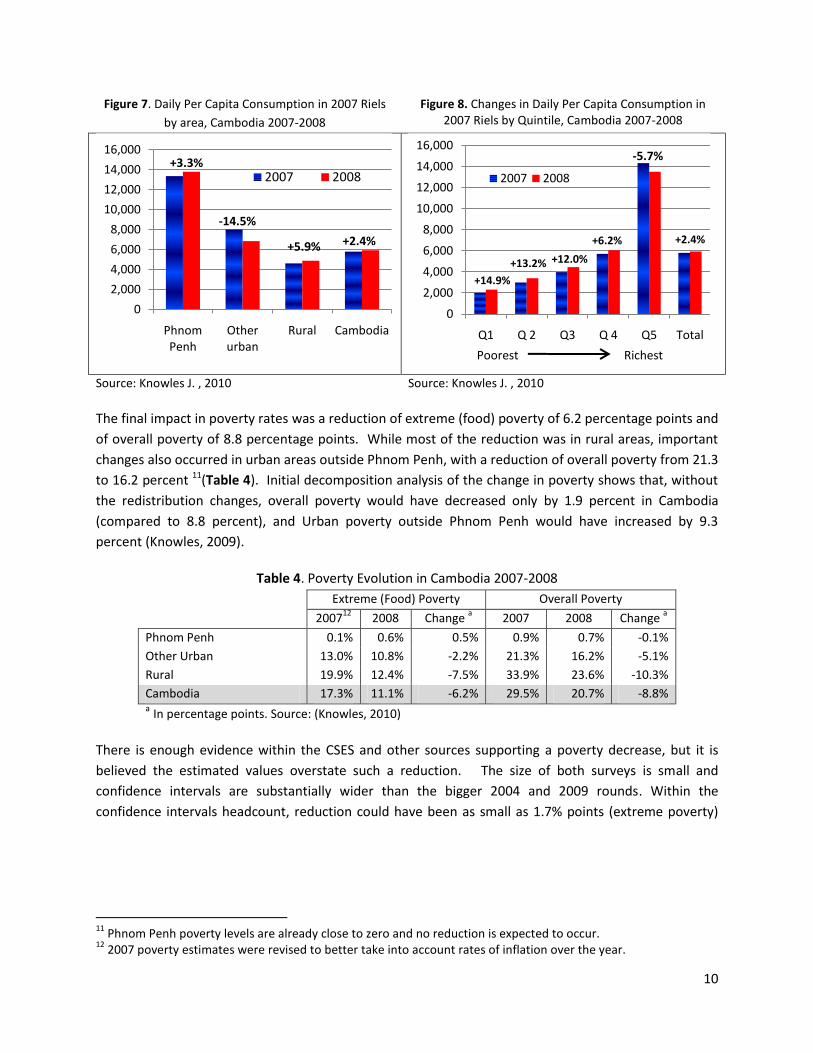
In 2008, average consumption improved in Cambodia. From 2007 to 2008 the daily average real Per
capita consumption increased 2.4 percent from R. 5,798 to R. 5,938 (Figure 7) with important variations
according to the region where the household was located. Rural households, where most of the poor
are located, reported the biggest relative increase (5.9 percent), followed by people living in Phnom
Penh (3.3 percent), but very different from the 14.4 percent decrease in other urban areas.
At the same time important distributional changes took place in 2008. The increase in consumption was
higher for households in the lower quintiles (as a proportion of their consumption levels). In other
words, the consumption growth was pro-poor, increasing consumption for the lowest quintile by 14.9
percent and decreasing consumption for the richest quintile by 5.7 percent. The data suggest that most
of the negative effects of the 2008 crises were felt by the better-off part of the population (Figure 8).
10
Information collected each December, nationally representative since 2006, and includes several indicators related to local socio-economic conditions.
Table 3. Change in Hourly Wages 1st. and 2d. Job, Cambodia 2007-2008
Sector Riels/hour Percentage
Garment -83.81 -5.8% Construction 71.09 4.6% Tourism -62.28 -3.3% Agriculture 147.50 15.7% Source: World Bank Staff with 2007-2008 CSES
10
Figure 7. Daily Per Capita Consumption in 2007 Riels
by area, Cambodia 2007-2008
Figure 8. Changes in Daily Per Capita Consumption in 2007 Riels by Quintile, Cambodia 2007-2008
Source: Knowles J. , 2010 Source: Knowles J. , 2010
The final impact in poverty rates was a reduction of extreme (food) poverty of 6.2 percentage points and
of overall poverty of 8.8 percentage points. While most of the reduction was in rural areas, important
changes also occurred in urban areas outside Phnom Penh, with a reduction of overall poverty from 21.3
to 16.2 percent 11(Table 4). Initial decomposition analysis of the change in poverty shows that, without
the redistribution changes, overall poverty would have decreased only by 1.9 percent in Cambodia
(compared to 8.8 percent), and Urban poverty outside Phnom Penh would have increased by 9.3
percent (Knowles, 2009).
Table 4. Poverty Evolution in Cambodia 2007-2008
Extreme (Food) Poverty Overall Poverty
200712
2008 Change a 2007 2008 Change
a
Phnom Penh 0.1% 0.6% 0.5% 0.9% 0.7% -0.1%
Other Urban 13.0% 10.8% -2.2% 21.3% 16.2% -5.1%
Rural 19.9% 12.4% -7.5% 33.9% 23.6% -10.3%
Cambodia 17.3% 11.1% -6.2% 29.5% 20.7% -8.8% a In percentage points. Source: (Knowles, 2010)
There is enough evidence within the CSES and other sources supporting a poverty decrease, but it is
believed the estimated values overstate such a reduction. The size of both surveys is small and
confidence intervals are substantially wider than the bigger 2004 and 2009 rounds. Within the
confidence intervals headcount, reduction could have been as small as 1.7% points (extreme poverty)
11
Phnom Penh poverty levels are already close to zero and no reduction is expected to occur. 12
2007 poverty estimates were revised to better take into account rates of inflation over the year.
-14.5%
+3.3%
+5.9% +2.4%
0
2,000
4,000
6,000
8,000
10,000
12,000
14,000
16,000
Phnom Penh
Other urban
Rural Cambodia
2007 2008
-5.7%
+14.9%
+13.2% +12.0%
+2.4%+6.2%
0
2,000
4,000
6,000
8,000
10,000
12,000
14,000
16,000
Q1 Q 2 Q3 Q 4 Q5 Total
2007 2008
Poorest Richest
11
and 3.0% points (overall poverty). Also, 2008 was a year of high inflation in Cambodia and the country
was not prepared to accurately measure changes in purchasing power averaging 3.3% per month13.
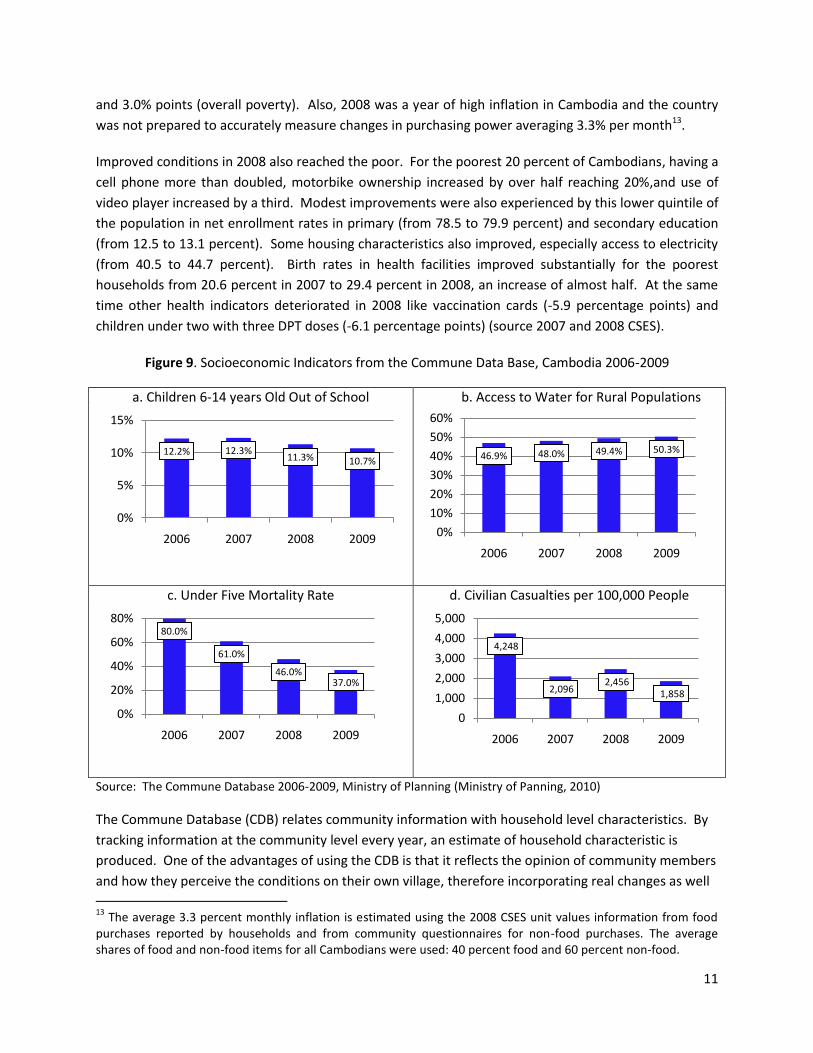
Improved conditions in 2008 also reached the poor. For the poorest 20 percent of Cambodians, having a
cell phone more than doubled, motorbike ownership increased by over half reaching 20%,and use of
video player increased by a third. Modest improvements were also experienced by this lower quintile of
the population in net enrollment rates in primary (from 78.5 to 79.9 percent) and secondary education
(from 12.5 to 13.1 percent). Some housing characteristics also improved, especially access to electricity
(from 40.5 to 44.7 percent). Birth rates in health facilities improved substantially for the poorest
households from 20.6 percent in 2007 to 29.4 percent in 2008, an increase of almost half. At the same
time other health indicators deteriorated in 2008 like vaccination cards (-5.9 percentage points) and
children under two with three DPT doses (-6.1 percentage points) (source 2007 and 2008 CSES).
Figure 9. Socioeconomic Indicators from the Commune Data Base, Cambodia 2006-2009
a. Children 6-14 years Old Out of School b. Access to Water for Rural Populations
c. Under Five Mortality Rate d. Civilian Casualties per 100,000 People
Source: The Commune Database 2006-2009, Ministry of Planning (Ministry of Panning, 2010)
The Commune Database (CDB) relates community information with household level characteristics. By
tracking information at the community level every year, an estimate of household characteristic is
produced. One of the advantages of using the CDB is that it reflects the opinion of community members
and how they perceive the conditions on their own village, therefore incorporating real changes as well
13
The average 3.3 percent monthly inflation is estimated using the 2008 CSES unit values information from food purchases reported by households and from community questionnaires for non-food purchases. The average shares of food and non-food items for all Cambodians were used: 40 percent food and 60 percent non-food.
12.2% 12.3%11.3% 10.7%
0%
5%
10%
15%
2006 2007 2008 2009
46.9% 48.0% 49.4% 50.3%
0%
10%
20%
30%
40%
50%
60%
2006 2007 2008 2009
80.0%
61.0%
46.0%37.0%
0%
20%
40%
60%
80%
2006 2007 2008 2009
4,248
2,096 2,456
1,858
0
1,000
2,000
3,000
4,000
5,000
2006 2007 2008 2009
12
as expectations, fears, vulnerabilities, and overall sentiments otherwise not included in alternative
measures.
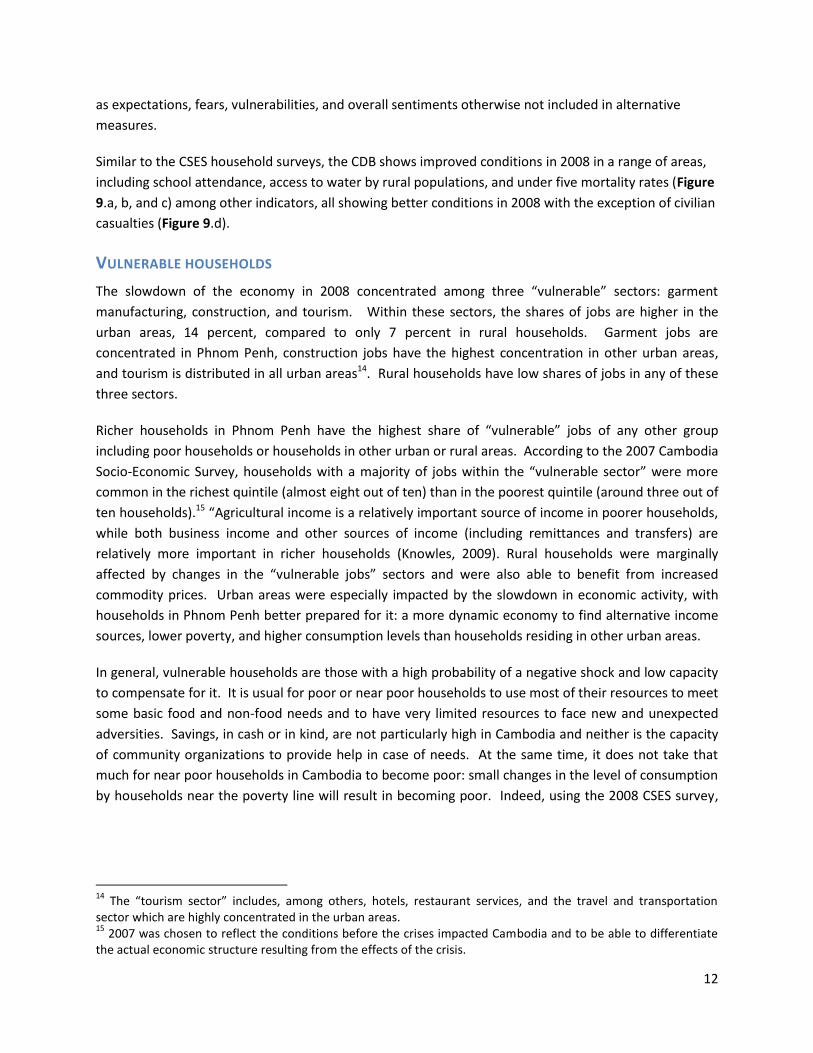
Similar to the CSES household surveys, the CDB shows improved conditions in 2008 in a range of areas,
including school attendance, access to water by rural populations, and under five mortality rates (Figure
9.a, b, and c) among other indicators, all showing better conditions in 2008 with the exception of civilian
casualties (Figure 9.d).
VULNERABLE HOUSEHOLDS
The slowdown of the economy in 2008 concentrated among three “vulnerable” sectors: garment
manufacturing, construction, and tourism. Within these sectors, the shares of jobs are higher in the
urban areas, 14 percent, compared to only 7 percent in rural households. Garment jobs are
concentrated in Phnom Penh, construction jobs have the highest concentration in other urban areas,
and tourism is distributed in all urban areas14. Rural households have low shares of jobs in any of these
three sectors.
Richer households in Phnom Penh have the highest share of “vulnerable” jobs of any other group
including poor households or households in other urban or rural areas. According to the 2007 Cambodia
Socio-Economic Survey, households with a majority of jobs within the “vulnerable sector” were more
common in the richest quintile (almost eight out of ten) than in the poorest quintile (around three out of
ten households).15 “Agricultural income is a relatively important source of income in poorer households,
while both business income and other sources of income (including remittances and transfers) are
relatively more important in richer households (Knowles, 2009). Rural households were marginally
affected by changes in the “vulnerable jobs” sectors and were also able to benefit from increased
commodity prices. Urban areas were especially impacted by the slowdown in economic activity, with
households in Phnom Penh better prepared for it: a more dynamic economy to find alternative income
sources, lower poverty, and higher consumption levels than households residing in other urban areas.
In general, vulnerable households are those with a high probability of a negative shock and low capacity
to compensate for it. It is usual for poor or near poor households to use most of their resources to meet
some basic food and non-food needs and to have very limited resources to face new and unexpected
adversities. Savings, in cash or in kind, are not particularly high in Cambodia and neither is the capacity
of community organizations to provide help in case of needs. At the same time, it does not take that
much for near poor households in Cambodia to become poor: small changes in the level of consumption
by households near the poverty line will result in becoming poor. Indeed, using the 2008 CSES survey,
14
The “tourism sector” includes, among others, hotels, restaurant services, and the travel and transportation sector which are highly concentrated in the urban areas. 15
2007 was chosen to reflect the conditions before the crises impacted Cambodia and to be able to differentiate the actual economic structure resulting from the effects of the crisis.
13
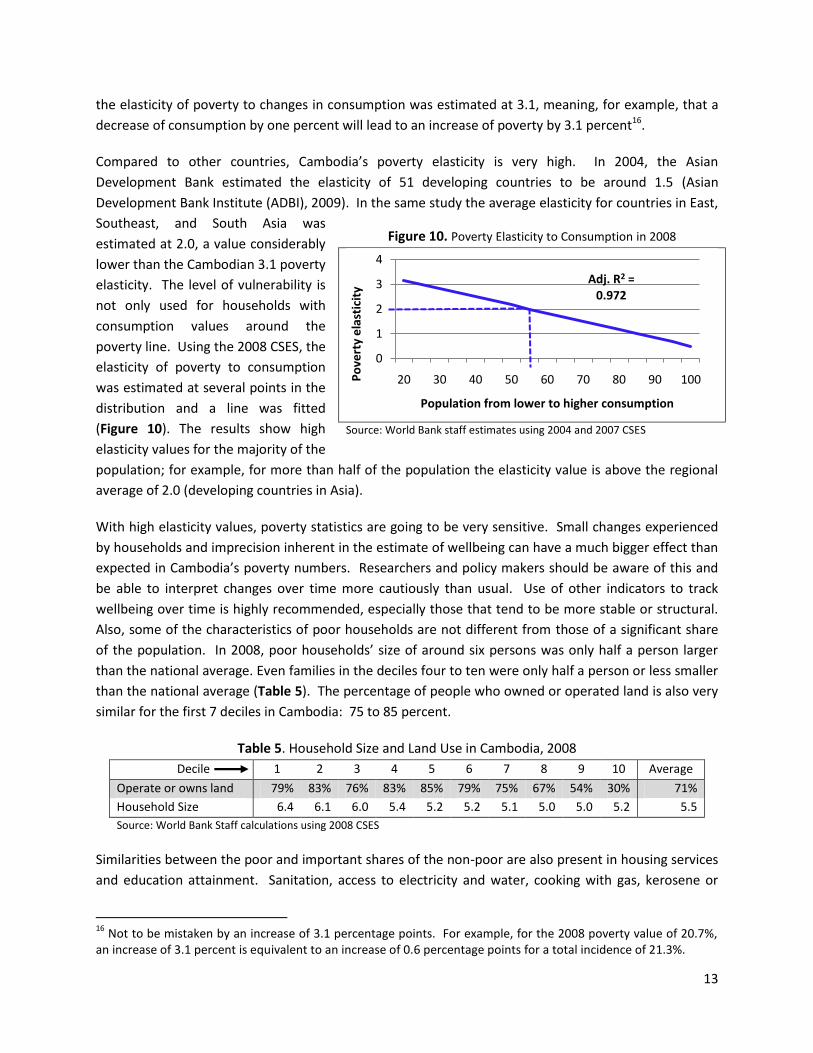
the elasticity of poverty to changes in consumption was estimated at 3.1, meaning, for example, that a
decrease of consumption by one percent will lead to an increase of poverty by 3.1 percent16.
Compared to other countries, Cambodia’s poverty elasticity is very high. In 2004, the Asian
Development Bank estimated the elasticity of 51 developing countries to be around 1.5 (Asian
Development Bank Institute (ADBI), 2009). In the same study the average elasticity for countries in East,
Southeast, and South Asia was
estimated at 2.0, a value considerably
lower than the Cambodian 3.1 poverty
elasticity. The level of vulnerability is
not only used for households with
consumption values around the
poverty line. Using the 2008 CSES, the
elasticity of poverty to consumption
was estimated at several points in the
distribution and a line was fitted
(Figure 10). The results show high
elasticity values for the majority of the
population; for example, for more than half of the population the elasticity value is above the regional
average of 2.0 (developing countries in Asia).
With high elasticity values, poverty statistics are going to be very sensitive. Small changes experienced
by households and imprecision inherent in the estimate of wellbeing can have a much bigger effect than
expected in Cambodia’s poverty numbers. Researchers and policy makers should be aware of this and
be able to interpret changes over time more cautiously than usual. Use of other indicators to track
wellbeing over time is highly recommended, especially those that tend to be more stable or structural.
Also, some of the characteristics of poor households are not different from those of a significant share
of the population. In 2008, poor households’ size of around six persons was only half a person larger
than the national average. Even families in the deciles four to ten were only half a person or less smaller
than the national average (Table 5). The percentage of people who owned or operated land is also very
similar for the first 7 deciles in Cambodia: 75 to 85 percent.
Table 5. Household Size and Land Use in Cambodia, 2008
Decile 1 2 3 4 5 6 7 8 9 10 Average
Operate or owns land 79% 83% 76% 83% 85% 79% 75% 67% 54% 30% 71%
Household Size 6.4 6.1 6.0 5.4 5.2 5.2 5.1 5.0 5.0 5.2 5.5
Source: World Bank Staff calculations using 2008 CSES
Similarities between the poor and important shares of the non-poor are also present in housing services
and education attainment. Sanitation, access to electricity and water, cooking with gas, kerosene or
16
Not to be mistaken by an increase of 3.1 percentage points. For example, for the 2008 poverty value of 20.7%, an increase of 3.1 percent is equivalent to an increase of 0.6 percentage points for a total incidence of 21.3%.
Figure 10. Poverty Elasticity to Consumption in 2008
Source: World Bank staff estimates using 2004 and 2007 CSES
Adj. R2 = 0.972
0
1
2
3
4
20 30 40 50 60 70 80 90 100Po
vert
y e
last
icit
y
Population from lower to higher consumption
14
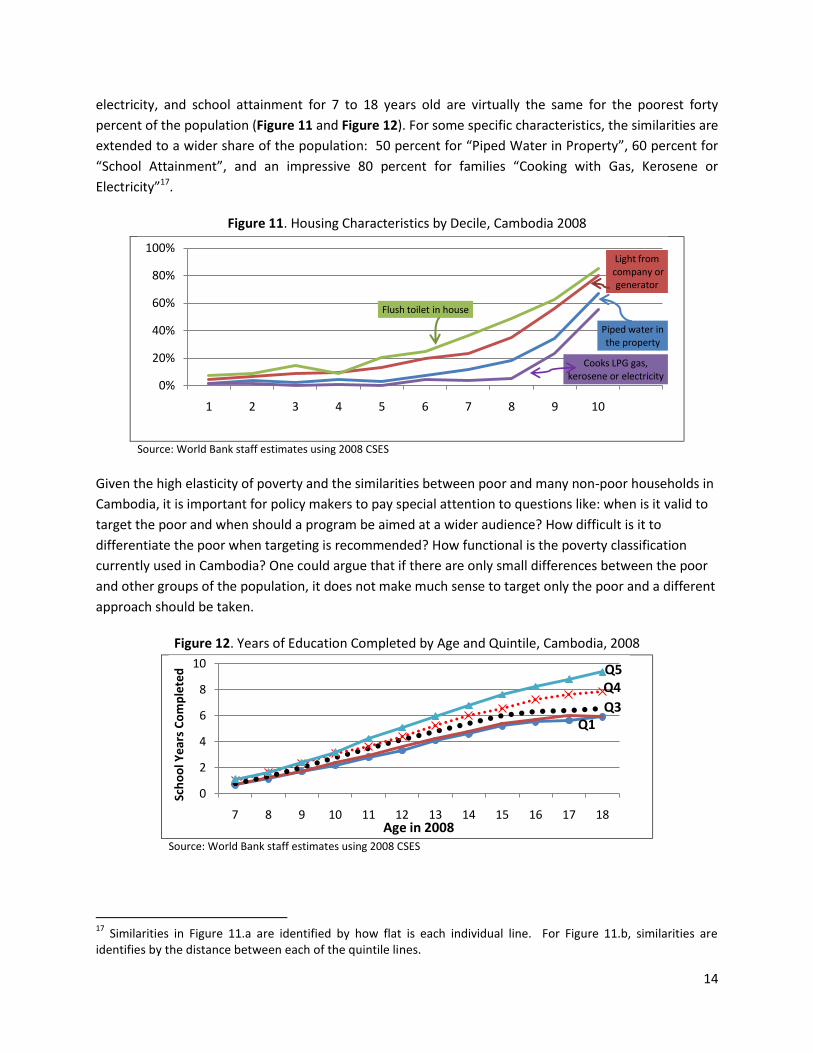
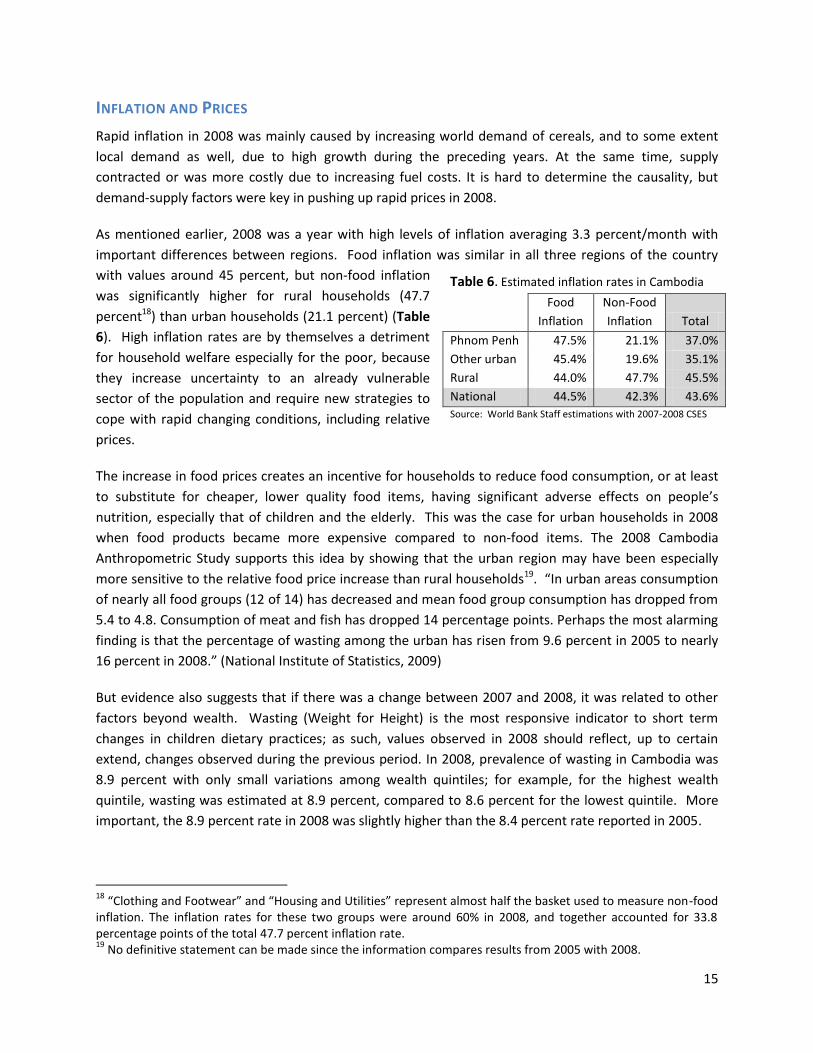
electricity, and school attainment for 7 to 18 years old are virtually the same for the poorest forty
percent of the population (Figure 11 and Figure 12). For some specific characteristics, the similarities are
extended to a wider share of the population: 50 percent for “Piped Water in Property”, 60 percent for
“School Attainment”, and an impressive 80 percent for families “Cooking with Gas, Kerosene or
Electricity”17.
Figure 11. Housing Characteristics by Decile, Cambodia 2008
Source: World Bank staff estimates using 2008 CSES
Given the high elasticity of poverty and the similarities between poor and many non-poor households in
Cambodia, it is important for policy makers to pay special attention to questions like: when is it valid to
target the poor and when should a program be aimed at a wider audience? How difficult is it to
differentiate the poor when targeting is recommended? How functional is the poverty classification
currently used in Cambodia? One could argue that if there are only small differences between the poor
and other groups of the population, it does not make much sense to target only the poor and a different
approach should be taken.
Figure 12. Years of Education Completed by Age and Quintile, Cambodia, 2008
Source: World Bank staff estimates using 2008 CSES
17
Similarities in Figure 11.a are identified by how flat is each individual line. For Figure 11.b, similarities are identifies by the distance between each of the quintile lines.
Piped water in the property
Light fromcompany or generator
Flush toilet in house
Cooks LPG gas, kerosene or electricity
0%
20%
40%
60%
80%
100%
1 2 3 4 5 6 7 8 9 10
Q1Q3
Q4Q5
0
2
4
6
8
10
7 8 9 10 11 12 13 14 15 16 17 18
Sch
oo
l Ye
ars
Co
mp
lete
d
Age in 2008
15
INFLATION AND PRICES
Rapid inflation in 2008 was mainly caused by increasing world demand of cereals, and to some extent
local demand as well, due to high growth during the preceding years. At the same time, supply
contracted or was more costly due to increasing fuel costs. It is hard to determine the causality, but
demand-supply factors were key in pushing up rapid prices in 2008.
As mentioned earlier, 2008 was a year with high levels of inflation averaging 3.3 percent/month with
important differences between regions. Food inflation was similar in all three regions of the country
with values around 45 percent, but non-food inflation
was significantly higher for rural households (47.7
percent18) than urban households (21.1 percent) (Table
6). High inflation rates are by themselves a detriment
for household welfare especially for the poor, because
they increase uncertainty to an already vulnerable
sector of the population and require new strategies to
cope with rapid changing conditions, including relative
prices.
The increase in food prices creates an incentive for households to reduce food consumption, or at least
to substitute for cheaper, lower quality food items, having significant adverse effects on people’s
nutrition, especially that of children and the elderly. This was the case for urban households in 2008
when food products became more expensive compared to non-food items. The 2008 Cambodia
Anthropometric Study supports this idea by showing that the urban region may have been especially
more sensitive to the relative food price increase than rural households19. “In urban areas consumption
of nearly all food groups (12 of 14) has decreased and mean food group consumption has dropped from
5.4 to 4.8. Consumption of meat and fish has dropped 14 percentage points. Perhaps the most alarming
finding is that the percentage of wasting among the urban has risen from 9.6 percent in 2005 to nearly
16 percent in 2008.” (National Institute of Statistics, 2009)
But evidence also suggests that if there was a change between 2007 and 2008, it was related to other
factors beyond wealth. Wasting (Weight for Height) is the most responsive indicator to short term
changes in children dietary practices; as such, values observed in 2008 should reflect, up to certain
extend, changes observed during the previous period. In 2008, prevalence of wasting in Cambodia was
8.9 percent with only small variations among wealth quintiles; for example, for the highest wealth
quintile, wasting was estimated at 8.9 percent, compared to 8.6 percent for the lowest quintile. More
important, the 8.9 percent rate in 2008 was slightly higher than the 8.4 percent rate reported in 2005.
18
“Clothing and Footwear” and “Housing and Utilities” represent almost half the basket used to measure non-food inflation. The inflation rates for these two groups were around 60% in 2008, and together accounted for 33.8 percentage points of the total 47.7 percent inflation rate. 19
No definitive statement can be made since the information compares results from 2005 with 2008.
Table 6. Estimated inflation rates in Cambodia
Food
Inflation
Non-Food
Inflation Total
Phnom Penh 47.5% 21.1% 37.0%
Other urban 45.4% 19.6% 35.1%
Rural 44.0% 47.7% 45.5%
National 44.5% 42.3% 43.6%
Source: World Bank Staff estimations with 2007-2008 CSES
16
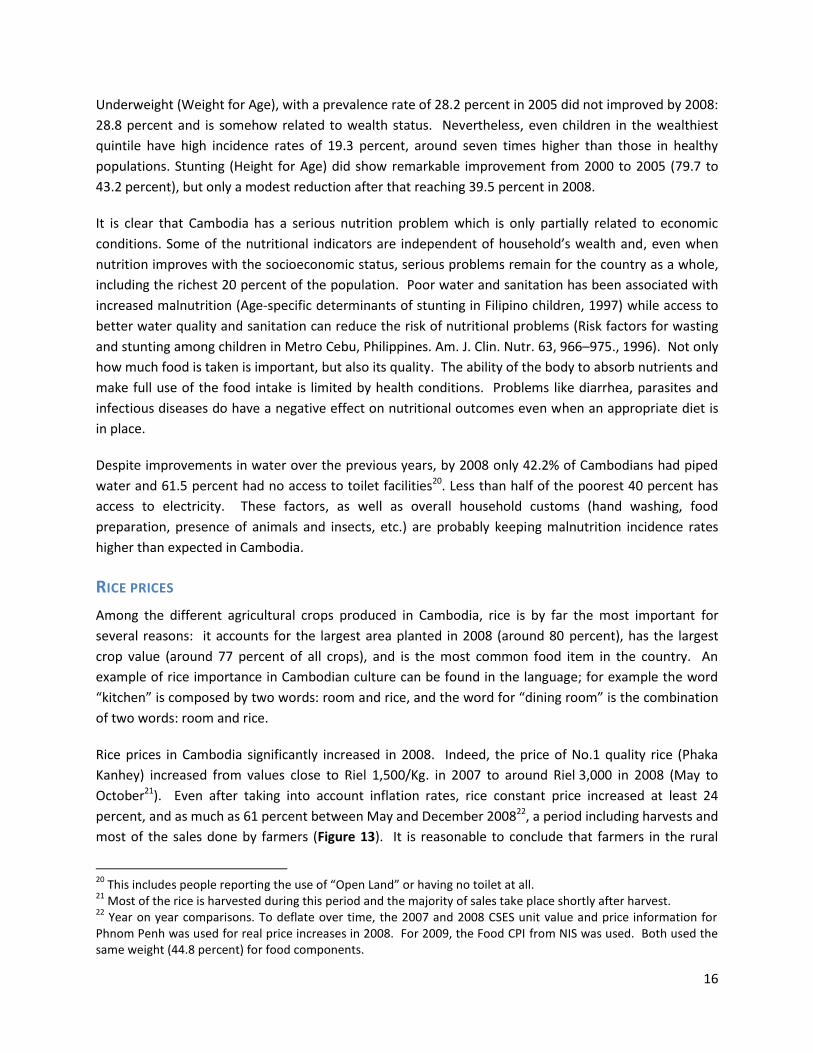
Underweight (Weight for Age), with a prevalence rate of 28.2 percent in 2005 did not improved by 2008:
28.8 percent and is somehow related to wealth status. Nevertheless, even children in the wealthiest
quintile have high incidence rates of 19.3 percent, around seven times higher than those in healthy
populations. Stunting (Height for Age) did show remarkable improvement from 2000 to 2005 (79.7 to
43.2 percent), but only a modest reduction after that reaching 39.5 percent in 2008.
It is clear that Cambodia has a serious nutrition problem which is only partially related to economic
conditions. Some of the nutritional indicators are independent of household’s wealth and, even when
nutrition improves with the socioeconomic status, serious problems remain for the country as a whole,
including the richest 20 percent of the population. Poor water and sanitation has been associated with
increased malnutrition (Age-specific determinants of stunting in Filipino children, 1997) while access to
better water quality and sanitation can reduce the risk of nutritional problems (Risk factors for wasting
and stunting among children in Metro Cebu, Philippines. Am. J. Clin. Nutr. 63, 966–975., 1996). Not only
how much food is taken is important, but also its quality. The ability of the body to absorb nutrients and
make full use of the food intake is limited by health conditions. Problems like diarrhea, parasites and
infectious diseases do have a negative effect on nutritional outcomes even when an appropriate diet is
in place.
Despite improvements in water over the previous years, by 2008 only 42.2% of Cambodians had piped
water and 61.5 percent had no access to toilet facilities20. Less than half of the poorest 40 percent has
access to electricity. These factors, as well as overall household customs (hand washing, food
preparation, presence of animals and insects, etc.) are probably keeping malnutrition incidence rates
higher than expected in Cambodia.
RICE PRICES
Among the different agricultural crops produced in Cambodia, rice is by far the most important for
several reasons: it accounts for the largest area planted in 2008 (around 80 percent), has the largest
crop value (around 77 percent of all crops), and is the most common food item in the country. An
example of rice importance in Cambodian culture can be found in the language; for example the word
“kitchen” is composed by two words: room and rice, and the word for “dining room” is the combination
of two words: room and rice.
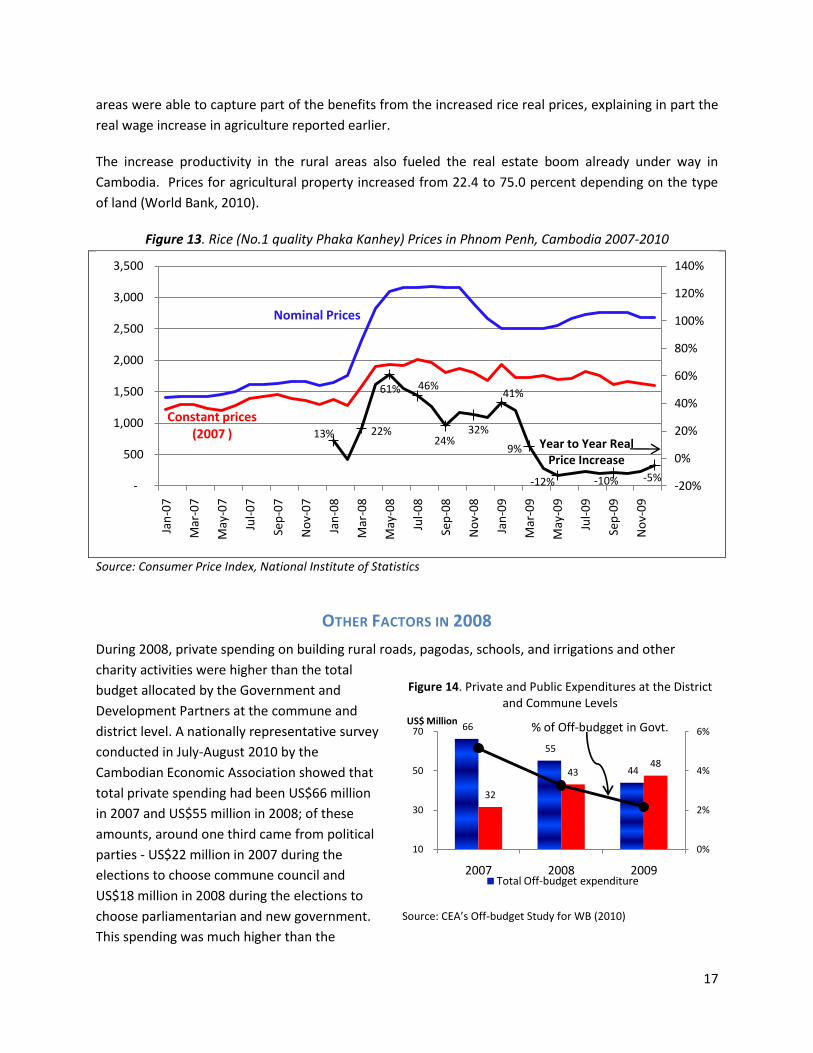
Rice prices in Cambodia significantly increased in 2008. Indeed, the price of No.1 quality rice (Phaka
Kanhey) increased from values close to Riel 1,500/Kg. in 2007 to around Riel 3,000 in 2008 (May to
October21). Even after taking into account inflation rates, rice constant price increased at least 24
percent, and as much as 61 percent between May and December 200822, a period including harvests and
most of the sales done by farmers (Figure 13). It is reasonable to conclude that farmers in the rural
20
This includes people reporting the use of “Open Land” or having no toilet at all. 21
Most of the rice is harvested during this period and the majority of sales take place shortly after harvest. 22
Year on year comparisons. To deflate over time, the 2007 and 2008 CSES unit value and price information for Phnom Penh was used for real price increases in 2008. For 2009, the Food CPI from NIS was used. Both used the same weight (44.8 percent) for food components.
17
areas were able to capture part of the benefits from the increased rice real prices, explaining in part the
real wage increase in agriculture reported earlier.
The increase productivity in the rural areas also fueled the real estate boom already under way in
Cambodia. Prices for agricultural property increased from 22.4 to 75.0 percent depending on the type
of land (World Bank, 2010).
Figure 13. Rice (No.1 quality Phaka Kanhey) Prices in Phnom Penh, Cambodia 2007-2010
Source: Consumer Price Index, National Institute of Statistics
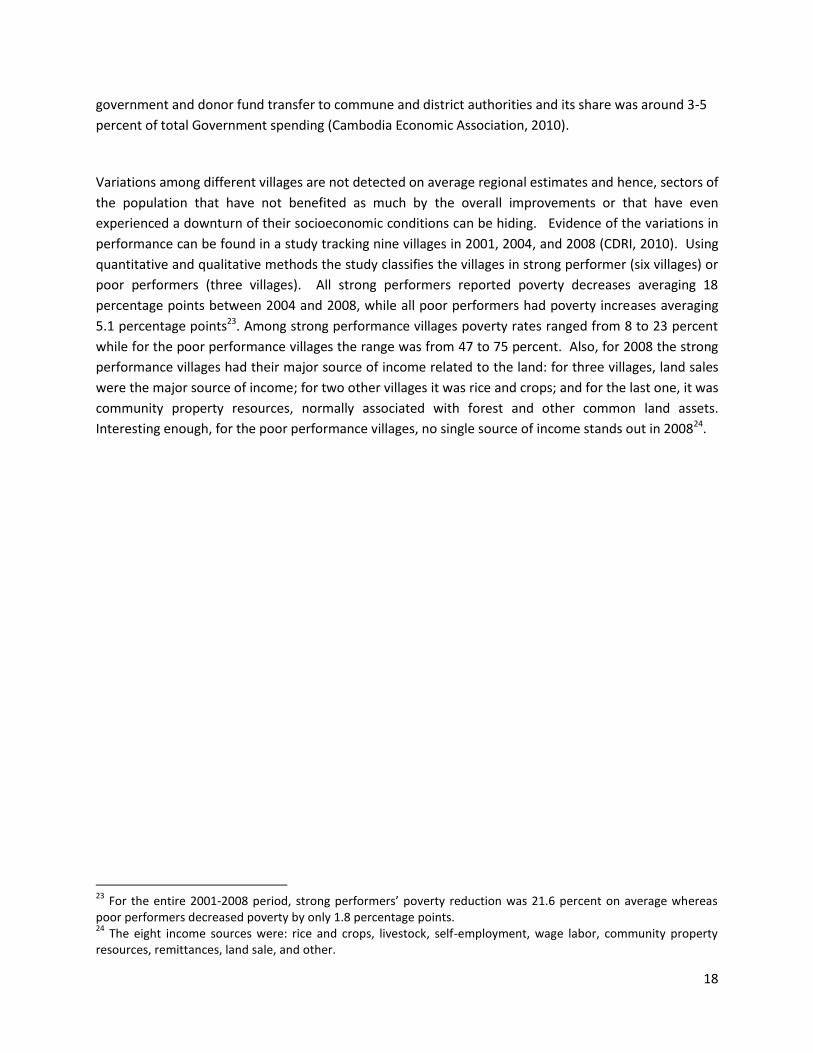
OTHER FACTORS IN 2008
During 2008, private spending on building rural roads, pagodas, schools, and irrigations and other
charity activities were higher than the total
budget allocated by the Government and
Development Partners at the commune and
district level. A nationally representative survey
conducted in July-August 2010 by the
Cambodian Economic Association showed that
total private spending had been US$66 million
in 2007 and US$55 million in 2008; of these
amounts, around one third came from political
parties - US$22 million in 2007 during the
elections to choose commune council and
US$18 million in 2008 during the elections to
choose parliamentarian and new government.
This spending was much higher than the
Nominal Prices
Year to Year Real Price Increase
Constant prices (2007 ) 13% 22%
61% 46%
24%32%
41%
9%
-12% -10% -5%-20%
0%
20%
40%
60%
80%
100%
120%
140%
-
500
1,000
1,500
2,000
2,500
3,000
3,500
Jan
-07
Mar
-07
May
-07
Jul-
07
Sep
-07
No
v-0
7
Jan
-08
Mar
-08
May
-08
Jul-
08
Sep
-08
No
v-0
8
Jan
-09
Mar
-09
May
-09
Jul-
09
Sep
-09
No
v-0
9
Figure 14. Private and Public Expenditures at the District and Commune Levels
Source: CEA’s Off-budget Study for WB (2010)
66
55
44
32
4348
0%
2%
4%
6%
10
30
50
70
2007 2008 2009
US$ Million
Total Off-budget expenditure
% of Off-budgget in Govt.
18
government and donor fund transfer to commune and district authorities and its share was around 3-5
percent of total Government spending (Cambodia Economic Association, 2010).
Variations among different villages are not detected on average regional estimates and hence, sectors of
the population that have not benefited as much by the overall improvements or that have even
experienced a downturn of their socioeconomic conditions can be hiding. Evidence of the variations in
performance can be found in a study tracking nine villages in 2001, 2004, and 2008 (CDRI, 2010). Using
quantitative and qualitative methods the study classifies the villages in strong performer (six villages) or
poor performers (three villages). All strong performers reported poverty decreases averaging 18
percentage points between 2004 and 2008, while all poor performers had poverty increases averaging
5.1 percentage points23. Among strong performance villages poverty rates ranged from 8 to 23 percent
while for the poor performance villages the range was from 47 to 75 percent. Also, for 2008 the strong
performance villages had their major source of income related to the land: for three villages, land sales
were the major source of income; for two other villages it was rice and crops; and for the last one, it was
community property resources, normally associated with forest and other common land assets.
Interesting enough, for the poor performance villages, no single source of income stands out in 200824.
23
For the entire 2001-2008 period, strong performers’ poverty reduction was 21.6 percent on average whereas poor performers decreased poverty by only 1.8 percentage points. 24
The eight income sources were: rice and crops, livestock, self-employment, wage labor, community property resources, remittances, land sale, and other.
19
The Crisis Year and Beyond: 2009 and Later By 2009 overall conditions in Cambodia were deteriorating and the impact of the financial crisis was
being felt in several fronts. For once, constant per capita GDP experienced the first contraction in over
14 years: a 3.7 percent reduction in contrast with the 6.3 percent positive average growth of the
previous 13 years (Figure 1). Important drivers of growth such as the garment sector experienced a
reduction of 7.8 percent in January 2009 (year to year), tourist arrivals by air also decreased 8.8 percent,
and number of construction projects approved in Phnom Penh decreased to less than 40 (from a yearly
average of 60 in the previous three years) (World Bank, 2009). Also Foreign Direct Investment,
accounting for three quarters of the capital, contracted by 50 percent in 2009. With an annual growth
rate of 5.4 percent, agriculture was the only sector able to maintain growth rates similar to 2008 (5.7
percent) and to the 2001-2007 period (6.2 percent) (National Institute of Statistics, 2009)25.
CHANGES IN THE LABOR MARKET
The financial crisis of 2009 was characterized by important changes in the labor market that included an
increase in the share of workers in agriculture, an elevated number of job losses and new jobs created,
increased labor participation by women, more than doubling the share of workers with two or more
jobs, and a drastic reduction on hourly wages during the first part of 2009. The net impact was mostly
negative for Cambodians and the changes suggest that workers were adjusting to economic shifts more
as an option of last resort than as a free choice. In other words, people were not looking to improve
their conditions (compared to 2008) as much as finding a way to avoid extreme consequences.
After several years of declining agricultural shares in the labor market, they increased to 60.3 percent in
2009 (a gain of 7.7 percentage points)26 (Figure 15.a). At the same time, services (including trade) had a
6.6 percentage point reduction of work share participation between 2008 and 2009, accounting for most
of the increase reported in agriculture. The garment industry net work force was further contracted by
over 43 thousand jobs or 13.2 percent (over half of the job reductions in 2008) (Ministry of Commerce
Official Statistics, 2010) with a total of 34 thousand net job loss specifically reported in the months of
February and March.
The crisis period was characterized by elevated numbers of job losses and new jobs created. Indeed, in
2009, around 720 thousand net jobs were lost, with services and trade accounting for most of the losses
(78.8 percent); at the same time, an impressive 2.28 million net jobs were created, mostly in agriculture.
27
25
In 2009, construction expanded 5.0 percent, a similar value as that of 2008 (5.8 percent), but well below the 25.0 percent reported in the 2001-2007 period. 26
Comparisons including 2009 information are based on the first six months of the year due to data limitations at the time. 27
The term net job losses refers to an initial classification for each sector as a net job gainer or as a net job looser (each sector has to be in one and only one of those two groups). For the total net job changes, values of both groups are added. As such, the real total number of jobs created and destroyed is understated; for example, for a
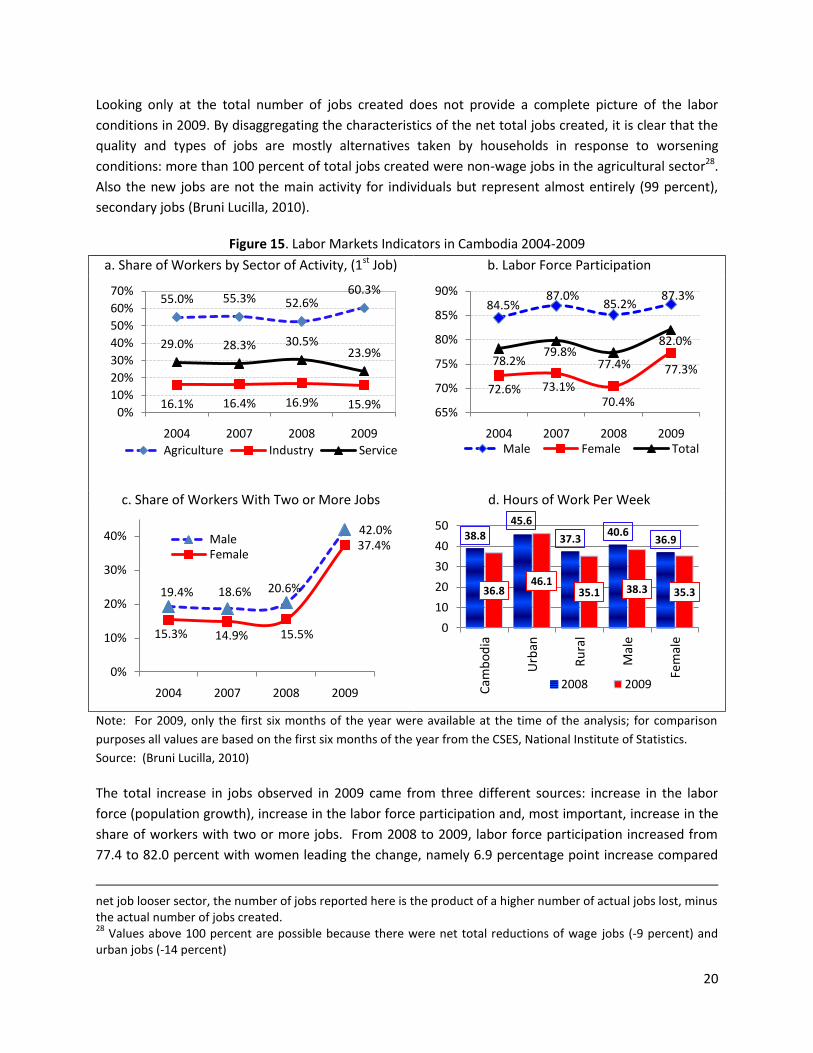
20
Looking only at the total number of jobs created does not provide a complete picture of the labor
conditions in 2009. By disaggregating the characteristics of the net total jobs created, it is clear that the
quality and types of jobs are mostly alternatives taken by households in response to worsening
conditions: more than 100 percent of total jobs created were non-wage jobs in the agricultural sector28.
Also the new jobs are not the main activity for individuals but represent almost entirely (99 percent),
secondary jobs (Bruni Lucilla, 2010).
Figure 15. Labor Markets Indicators in Cambodia 2004-2009
a. Share of Workers by Sector of Activity, (1st Job) b. Labor Force Participation
c. Share of Workers With Two or More Jobs d. Hours of Work Per Week
Note: For 2009, only the first six months of the year were available at the time of the analysis; for comparison
purposes all values are based on the first six months of the year from the CSES, National Institute of Statistics.
Source: (Bruni Lucilla, 2010)
The total increase in jobs observed in 2009 came from three different sources: increase in the labor
force (population growth), increase in the labor force participation and, most important, increase in the
share of workers with two or more jobs. From 2008 to 2009, labor force participation increased from
77.4 to 82.0 percent with women leading the change, namely 6.9 percentage point increase compared
net job looser sector, the number of jobs reported here is the product of a higher number of actual jobs lost, minus the actual number of jobs created. 28
Values above 100 percent are possible because there were net total reductions of wage jobs (-9 percent) and urban jobs (-14 percent)
55.0% 55.3% 52.6%60.3%
16.1% 16.4% 16.9% 15.9%
29.0% 28.3% 30.5%23.9%
0%
10%
20%
30%
40%
50%
60%
70%
2004 2007 2008 2009
Agriculture Industry Service
84.5%87.0%
85.2%87.3%
72.6% 73.1%70.4%
77.3%78.2%
79.8%77.4%
82.0%
65%
70%
75%
80%
85%
90%
2004 2007 2008 2009Male Female Total
19.4% 18.6% 20.6%
42.0%
15.3% 14.9% 15.5%
37.4%
0%
10%
20%
30%
40%
2004 2007 2008 2009
MaleFemale
38.8
45.6
37.340.6
36.9
36.846.1
35.1 38.3 35.3
0
10
20
30
40
50
Cam
bo
dia
Urb
an
Ru
ral
Mal
e
Fem
ale
2008 2009
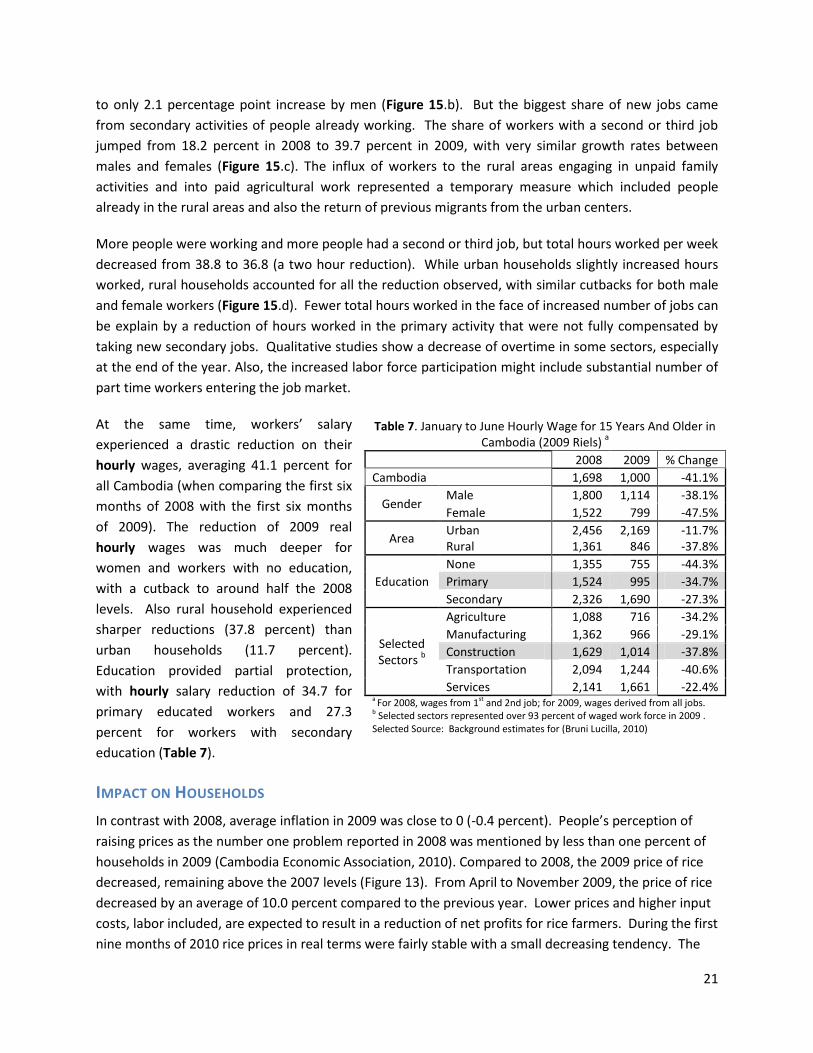
21
to only 2.1 percentage point increase by men (Figure 15.b). But the biggest share of new jobs came
from secondary activities of people already working. The share of workers with a second or third job
jumped from 18.2 percent in 2008 to 39.7 percent in 2009, with very similar growth rates between
males and females (Figure 15.c). The influx of workers to the rural areas engaging in unpaid family
activities and into paid agricultural work represented a temporary measure which included people
already in the rural areas and also the return of previous migrants from the urban centers.
More people were working and more people had a second or third job, but total hours worked per week
decreased from 38.8 to 36.8 (a two hour reduction). While urban households slightly increased hours
worked, rural households accounted for all the reduction observed, with similar cutbacks for both male
and female workers (Figure 15.d). Fewer total hours worked in the face of increased number of jobs can
be explain by a reduction of hours worked in the primary activity that were not fully compensated by
taking new secondary jobs. Qualitative studies show a decrease of overtime in some sectors, especially
at the end of the year. Also, the increased labor force participation might include substantial number of
part time workers entering the job market.
At the same time, workers’ salary
experienced a drastic reduction on their
hourly wages, averaging 41.1 percent for
all Cambodia (when comparing the first six
months of 2008 with the first six months
of 2009). The reduction of 2009 real
hourly wages was much deeper for
women and workers with no education,
with a cutback to around half the 2008
levels. Also rural household experienced
sharper reductions (37.8 percent) than
urban households (11.7 percent).
Education provided partial protection,
with hourly salary reduction of 34.7 for
primary educated workers and 27.3
percent for workers with secondary
education (Table 7).
IMPACT ON HOUSEHOLDS
In contrast with 2008, average inflation in 2009 was close to 0 (-0.4 percent). People’s perception of
raising prices as the number one problem reported in 2008 was mentioned by less than one percent of
households in 2009 (Cambodia Economic Association, 2010). Compared to 2008, the 2009 price of rice
decreased, remaining above the 2007 levels (Figure 13). From April to November 2009, the price of rice
decreased by an average of 10.0 percent compared to the previous year. Lower prices and higher input
costs, labor included, are expected to result in a reduction of net profits for rice farmers. During the first
nine months of 2010 rice prices in real terms were fairly stable with a small decreasing tendency. The
Table 7. January to June Hourly Wage for 15 Years And Older in Cambodia (2009 Riels)
a
2008 2009 % Change
Cambodia 1,698 1,000 -41.1%
Gender Male 1,800 1,114 -38.1%
Female 1,522 799 -47.5%
Area Urban 2,456 2,169 -11.7% Rural 1,361 846 -37.8%
Education
None 1,355 755 -44.3%
Primary 1,524 995 -34.7%
Secondary 2,326 1,690 -27.3%
Selected Sectors
b
Agriculture 1,088 716 -34.2%
Manufacturing 1,362 966 -29.1%
Construction 1,629 1,014 -37.8%
Transportation 2,094 1,244 -40.6%
Services 2,141 1,661 -22.4% a For 2008, wages from 1st and 2nd job; for 2009, wages derived from all jobs. b Selected sectors represented over 93 percent of waged work force in 2009 . Selected Source: Background estimates for (Bruni Lucilla, 2010)
22
decreasing tendency in real rice prices since 2009 is eroding the favorable terms of rice product in
Cambodia and should be taken into consideration when making public policy decisions.
Given the rapid changes in input and product prices, as well as the composition of the labor force in
agricultural activities, a more in-depth analysis of this sector should performed. The CSES is an excellent
source of information, which has not been fully used, for more serious and comprehensive analysis of
the dynamics involving Cambodian agricultural activities. Future analytical work should make better use
of all information available in the country to improve our understanding of long term dynamics and the
short term changes related to farm activities.
The impact of the financial crisis in household welfare was mixed. On one hand, the number of
households reporting difficulties increased and agricultural net income decreased. However, other
welfare indicators such as ownership of durable goods, quality of housing materials and primary
education enrollment rates remained basically unchanged from 2008.
To measure the impact of the economic crisis, a study focusing on the impacts on household at the
community level was carried out. It collected information from 1,070 households in June 2008 and July
200929. Information was provided by women and key informants in each village. (Cambodia Economic
Association, 2010). The results showed that, by July 2009, significant impacts on households
concentrated on poor urban, tourism dependent, and cash crop villages. Households reporting
difficulties in the last six months not only increased but there was an important shift on problem
rankings: first, in 2008 job loss or decreased income was mentioned by less than one percent of
respondents while in 2009 it represented 27.8 percent of problems reported (mainly reduced income);
and second, high food prices accounted for over half of the problems reported in 2008 but only 7.3
percent of the cases in 2009. Sickness and health expenses continued having a high proportion among
problems reported in both years: over one quarter of the cases in 2008 and almost one third in 2009.
While agricultural activities remained profitable, net income decreased in 2009, especially for farmers
engaged in the production of maize (-56 percent), cassava (-32 percent), wet season rice (-32 percent),
and fishing villages (74 percent of households reporting income reductions). Overall, half of the
households reported a reduction of income from agricultural activities by July 2009.
Foreign remittances did not change between 2008 and 2009 while one quarter of households reported
decreases in domestic remittances (the rest reported no changes or increases). Ownership of the most
common durable goods (assets) did not change or increased in 2009. Ownership of televisions and
motorbikes did not change between 2008 and 2009 but ownership of cell phones increased
substantially, reaching 50 percent of households in the 14 villages included in the study (an increase of
almost 12 percentage points). (Cambodia Economic Association, 2010)
29
The same 14 villages were included in both years. In 2009, a fifteenth village in Siem Reap was added to the study.
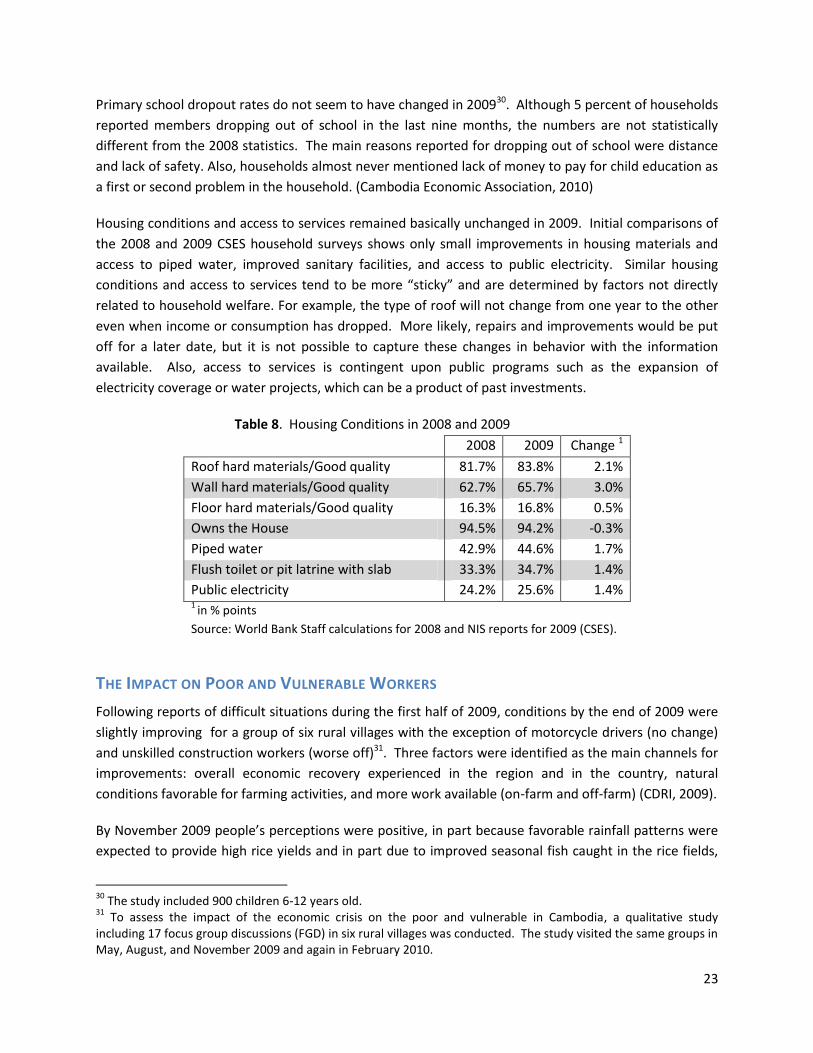
23
Primary school dropout rates do not seem to have changed in 200930. Although 5 percent of households
reported members dropping out of school in the last nine months, the numbers are not statistically
different from the 2008 statistics. The main reasons reported for dropping out of school were distance
and lack of safety. Also, households almost never mentioned lack of money to pay for child education as
a first or second problem in the household. (Cambodia Economic Association, 2010)
Housing conditions and access to services remained basically unchanged in 2009. Initial comparisons of
the 2008 and 2009 CSES household surveys shows only small improvements in housing materials and
access to piped water, improved sanitary facilities, and access to public electricity. Similar housing
conditions and access to services tend to be more “sticky” and are determined by factors not directly
related to household welfare. For example, the type of roof will not change from one year to the other
even when income or consumption has dropped. More likely, repairs and improvements would be put
off for a later date, but it is not possible to capture these changes in behavior with the information
available. Also, access to services is contingent upon public programs such as the expansion of
electricity coverage or water projects, which can be a product of past investments.
Table 8. Housing Conditions in 2008 and 2009
2008 2009 Change 1
Roof hard materials/Good quality 81.7% 83.8% 2.1%
Wall hard materials/Good quality 62.7% 65.7% 3.0%
Floor hard materials/Good quality 16.3% 16.8% 0.5%
Owns the House 94.5% 94.2% -0.3%
Piped water 42.9% 44.6% 1.7%
Flush toilet or pit latrine with slab 33.3% 34.7% 1.4%
Public electricity 24.2% 25.6% 1.4% 1
in % points
Source: World Bank Staff calculations for 2008 and NIS reports for 2009 (CSES).
THE IMPACT ON POOR AND VULNERABLE WORKERS
Following reports of difficult situations during the first half of 2009, conditions by the end of 2009 were
slightly improving for a group of six rural villages with the exception of motorcycle drivers (no change)
and unskilled construction workers (worse off)31. Three factors were identified as the main channels for
improvements: overall economic recovery experienced in the region and in the country, natural
conditions favorable for farming activities, and more work available (on-farm and off-farm) (CDRI, 2009).
By November 2009 people’s perceptions were positive, in part because favorable rainfall patterns were
expected to provide high rice yields and in part due to improved seasonal fish caught in the rice fields,
30
The study included 900 children 6-12 years old. 31
To assess the impact of the economic crisis on the poor and vulnerable in Cambodia, a qualitative study including 17 focus group discussions (FGD) in six rural villages was conducted. The study visited the same groups in May, August, and November 2009 and again in February 2010.
24
improving food consumption and reducing out of pocket food expenditures. Increased farm job
availability was reported in several villages as well as increased on-farm demand for harvesting related
activities. Primary school dropout did not increase in spite of children joining agricultural activities
during the vacation period. On the other hand, the most common problems mentioned in the Focus
Discussions Groups were limited access to new loans, lack of resources repaying previous ones, increase
costs of agricultural inputs, and small businesses reduction on the profit margins (Cambodia Economic
Association, 2010) .
For vulnerable workers, conditions by the end of 2009 were mixed32. Signs of recovery were found for
garment workers and waiters, and while construction workers in general were less affected than the
rest of vulnerable workers, conditions were likely to deteriorate for motor taxi drivers, cyclo drivers, and
rice field workers and no clear conclusions can be drawn for scavengers, porters, and vegetable
traders33.
For the non-garment vulnerable workers, the average daily consumption decreased 12 percent from
2008 but the pace of reduction was declining at the end of 2009 and first months of 2010; for example,
the reduction in consumption from May to August 2009 was 25 percent but from august to November it
only decreased 2 percent. Garment workers reported increases in real daily earnings of 18 percent with
a gradual increase of the proportion reported overtime from 15 percent in February to 27 percent in
November 2009. Male and female earning differential was basically unchanged from the 2007 levels
with males earning on average a third more than females workers (CDRI, 2009).
2010 income expectations for non-garment workers gradually and slowly improved during 2009 (by 5
percentage points); the major change occurred for garment workers with a reduction of lower income
expectations from 21.5 percent to 5.7. The fourth round of interviews conducted in February 2010
shows a continuation of the tendencies observed in November 2009, reinforcing the direction of
changes observed before; the majority of the vulnerable worker groups were recovering from the 2009
crisis and other groups were almost reaching their pre-crisis level (CDRI, 2010).
By February 2010, the garment and tourism sectors show further signs of improvement while the
construction sector shows signs of recovery. Wellbeing for workers and their families in these three
hardest hit sectors has shown sustained improvements. Low income and job availability remain
important constraints for unskilled construction workers, cyclo drivers, restaurant works and migrant
workers (CDRI, 2010)
32
Since 2000 a mostly urban, quarterly survey was conducted in five provinces: Phom Penh, Kandal, Kompong Speu, Siem Reap and Battambang. The survey included 480 persons from ten groups of vulnerable workers. The information is not statistically representative but indicative of income and consumption in the groups. 33
These groups reported earnings increases/decreased from 2007 to 2008 and decreases/increases from 2008 to 2009.
25
COPING STRATEGIES
Some of the households’ responses to the crisis were observed at the end of 2008 but, by far, the
intensity and number of strategies performed increased considerable in 2009. Since many strategies
were adopted by different households, the majority of them can be found in small proportions of the
population and are not necessarily captured by national surveys. On the other hand, qualitative studies
including focus groups and targeted surveys provide a good indication of the different actions taken by
households, which in their totality represent important mechanisms to deal with deteriorating
conditions, especially for specific groups in the country. Results from specific studies are only
representative of the selected populations or groups, mostly the poor and vulnerable, and can’t be
extrapolated to the entire country.
The main coping strategy to deal with the 2009 crisis was the reallocation of labor, mainly by increasing
labor participation and taking up unpaid secondary jobs in the rural areas. Women proved to be the
more flexible to implement this strategy but men also accounted for an important share of the labor
shift. Despite the labor changes, all evidence indicates incomes dropped in 2009, forcing households to
change their behavior to accommodate or compensate for the earnings reduction.
Income Generating Strategies
To compensate for reduced income, four strategies adopted by households were commonly mentioned
as income generating activities: migration/remittances; borrowing; selling assets; and use of forest for
wood, hunting, and foraging. Each strategy has different characteristics and most of them had
undesirable side effects.
Despite fears of important reductions on migrations and/or remittances, migration to Rural Thailand
doubled in 2009 and households were able to maintain their income from remittances (Cambodian
Economic Association, 2010). The fact that most Cambodian migrants into Thailand tend to engage in
“difficult, dirty and dangerous” jobs that are not wanted by Thai workers, help explain the resilient
migration to that country. Nevertheless most information is partial and preliminary at best and no
definitive conclusions can be made.
Migration within Cambodia significantly increased from 15 percent in 2008 to 24 percent in 2009. For
those households experiencing worsening conditions, migration was mentioned even more as a coping
mechanism, namely 62 percent in 2009 compared to only 33 percent in 2008 (Cambodia Economic
Association, 2010). Unfortunately, the increased migration is not expected to improve remittances;
especially remittances sent from the urban centers to the rural areas are estimated to decrease US$30-
45 million (United Nations, 2009).
Lending from microfinance institutions and from family and friends was a common strategy to solve
income reductions from other sources in 2008. In 2009, 71 percent of households had borrowed
money, with the biggest increases reported on cash crop villages (25 percentage points) and poor urban
villages (15 percentage points increase). Around half of the loans reported were for business expansion
and agricultural activities (Cambodia Economic Association, 2010). By the end of 2009, borrowing from
26
microfinance institutions appeared stagnant, leaving relatives, neighbors, and friends as the only source
for future loans. More importantly, households were having problems repaying previously acquired
loans. Households facing problems to repay loans to the microfinance institutions were hard pressed to
find money from local lenders, even at high interest rates, or from family members or friends with only
limited lending capacity and, in a few instances, were forced to sell assets to avoid losing their house or
land (CDRI, 2009).
Use of forests for wood, hunting, and foraging is one of the “hidden” strategies used by households to
deal with difficult times. One of the reasons is the lack of regulation for the use of forests (for wood and
hunting) with no clear classification of which activities are permitted or prohibited. In cases with
community property resources openly accessible to the people, income from this activity is remarkably
high. In a study including nine villages it was found that income from the community property resources
represented an average of 20% of total income with shares as high as 40 percent (CDRI, 2010). In 2007
the income from forestry, hunting and foraging was higher than either livestock or fishing/fisheries for
the poorest half of Cambodians (Knowles, 2009).
Consumption Reducing Strategies
Even after taking into consideration the different “income generating” strategies, total income was not
enough to cover basic needs for many households. These households were confronted with decisions
on how to reduce expenditures/consumption. As such, households can reduce consumption of food
items or non food items and services.
Reduction of food consumption can be achieved by switching to cheaper and lower quality products and
by reducing the amount of food intake. Using cheaper food products was the most common strategy
selected by households but cases of intake reduction especially by women were also mentioned. Food
intake is also highly correlated with rice harvest season, quality of harvest, and availability of fish and
vegetables. By April 2009, 75 percent of the population reported consumption of cheaper food with
rates going up as much as 85 percent for the poorest rural villages (Cambodia Economic Association,
2010). By February 2010, reduction of food consumption was no longer a leading strategy to deal with
the crisis, but reducing non-food consumption remained an important reaction to economic hardship.
Similarly to the 2009 results, consumption of non-food items was kept to a minimum to reduce
expenditures in households: clothes, make-up, travelling, recreation, and social gatherings were
minimized. (CDRI, 2010).
SOCIAL PROTECTION
Overall budget on social programs has not changed too much over time and remains well below the
regional average. By 2009, total social expending on Health and Education by the Government of
Cambodia was estimated around 3.8 percent of GDP, with the biggest share allocated to education (1.6
percent of GDP) and health (1.2 percent of GDP). Expenditure in other social programs was estimated
around half a percentage point. This value is considerably lower than the regional average; for example,
public spending in education alone accounted for over four percent of GDP in 2005 in the region.
27
Information on disaggregated national budget data and clear definitions of categories are not available
in Cambodia. The information available regarding national budgets is presented in grouping activities
without clear definition of what is included. For example, almost all government agencies report
expenditures labeled as social interventions while not all have social agenda activities34 (World Bank,
2009). The social intervention category includes general administration budgets for the supreme and
appeals courts, the national audit authority, and the senate. Defense and interior security are also
included in the group. Even within social administration the secretariat of civil aviation, water
resources, and meteorology, and post and telecommunications include budgets accounted for as social
interventions. Providing better definitions of categories and making available disaggregated
information to be able to match budgets with specific sectors are important improvements that should
be considered in the way national accounts are managed in Cambodia.
The majority of the social protection spending targets civil service pension and veterans benefits; retired
or disabled civil servants, veterans and their widows and orphans are entitled to a pension. Civil
servants are also entitled to invalidity, maternity, and dead of the breadwinner benefits but are not
covered in cases of accidents while working or health care problems outside work. The system remains
non-contributory and is administered by the Ministry of Social Affairs, Veterans and Youth Rehabilitation
(World Bank, 2010).
Most or the existing safety net programs in the country are in the health/nutrition and education sectors
and include (i) the Health Equity Fund, managed among the government, donors, and local NGOs,
targeting the poor according to the ID Poor project, covering all costs of hospitalization and other
medical expenses, and providing resources for transportation and food to access the services; (ii)
Mother and Child Health program providing food rations to poor pregnant and lactating women and
children in food vulnerable communities; (iii) the National Social Security Fund providing coverage to
around a quarter of a million government employees; (iv) a Pre-paid health insurance scheme in the
pilot stages with participation of the government and several NGOs; (v) Food for Work providing food
rations to approximately one quarter of a million persons in exchange for work in infrastructure projects
and targeted to the poor in food-insecure communes; (vi) school feeding programs covering around half
a million students and providing food for mothers and children and; (vii) targeted scholarship programs
mainly for poor girls in secondary education and covering around 30 thousand students (Hossein Jalilian,
2009).
Government and NGOs interventions appear coordinated, with NGOs concentrated in the poorest rural
and land abundant villages and government focused on the poorest rural and dry season rice villages.
NGOs reported higher participation rates providing assistance to 93 percent of the households receiving
any benefit, and government programs reaching 40 percent of aid-recipient households35 (Cambodia
Economic Association, 2010).
34
Social interventions were defined in the new 2007 budget structure and included under chapters 64 and 65. 35
The percentages add up to more than 100 percent because of households receiving aid from government and NGOs at the same time.

28
GOVERNMENT RESPONSE
The Government of Cambodia announced in February 2007 a new stimulus package to mitigate the
negative effects of the financial crisis. Some of the measures included reducing four percentage points
on banks’ reserve requirement for loans (from 16 to 12 percent); increasing by three fold the minimum
capital for commercial banks; introducing a 15 percent limit on real estate lending; reducing
manufacturing costs; increasing public investments in agriculture, transportation and safety nets; and
increasing credit availability for rice millers, farmers associations, and input suppliers (see Box 4 for a
detail description).
Since October 2008 and as a response to high food prices, the Government of Cambodia in partnership
with the Asian Development Bank implemented a food emergency program with a total budget of US$
40 million. Almost half of the resources (US$19 million) were used to improve social protection
programs and the rest to increase food productivity and government capacity. Most of the assistance
was concentrated around the Tonle Sap Lake and in the first face around 342 thousand people had
received rice rations (35 Kg) (Hossein Jalilian, 2009).
Other social programs also benefit Cambodians, but most of them were not a response to the food or
financial crisis and only reached a small group of people. Nevertheless they are an important part of the
socioeconomic conditions, especially for the poor and vulnerable and should be taken into consideration
to understand the impact of the financial crisis and to provide insights on improving the social
protection system in the country.
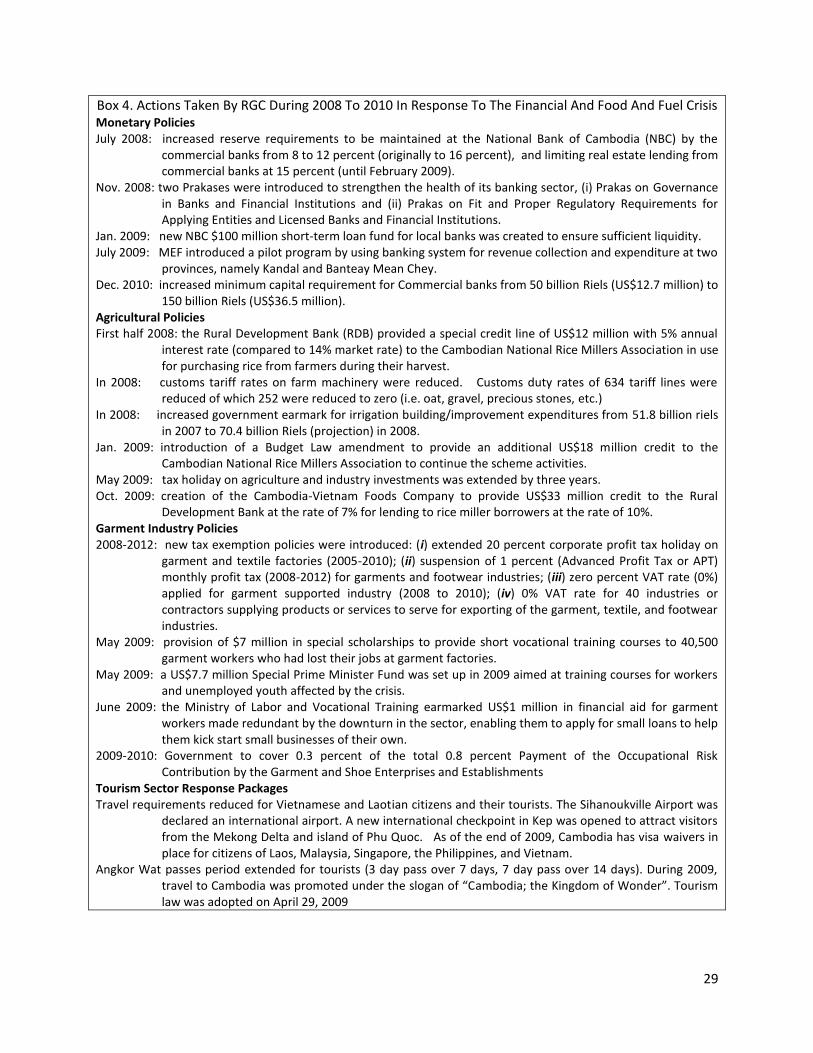
29
Box 4. Actions Taken By RGC During 2008 To 2010 In Response To The Financial And Food And Fuel Crisis Monetary Policies July 2008: increased reserve requirements to be maintained at the National Bank of Cambodia (NBC) by the
commercial banks from 8 to 12 percent (originally to 16 percent), and limiting real estate lending from commercial banks at 15 percent (until February 2009).
Nov. 2008: two Prakases were introduced to strengthen the health of its banking sector, (i) Prakas on Governance in Banks and Financial Institutions and (ii) Prakas on Fit and Proper Regulatory Requirements for Applying Entities and Licensed Banks and Financial Institutions.
Jan. 2009: new NBC $100 million short-term loan fund for local banks was created to ensure sufficient liquidity. July 2009: MEF introduced a pilot program by using banking system for revenue collection and expenditure at two
provinces, namely Kandal and Banteay Mean Chey. Dec. 2010: increased minimum capital requirement for Commercial banks from 50 billion Riels (US$12.7 million) to
150 billion Riels (US$36.5 million). Agricultural Policies First half 2008: the Rural Development Bank (RDB) provided a special credit line of US$12 million with 5% annual
interest rate (compared to 14% market rate) to the Cambodian National Rice Millers Association in use for purchasing rice from farmers during their harvest.
In 2008: customs tariff rates on farm machinery were reduced. Customs duty rates of 634 tariff lines were reduced of which 252 were reduced to zero (i.e. oat, gravel, precious stones, etc.)
In 2008: increased government earmark for irrigation building/improvement expenditures from 51.8 billion riels in 2007 to 70.4 billion Riels (projection) in 2008.
Jan. 2009: introduction of a Budget Law amendment to provide an additional US$18 million credit to the Cambodian National Rice Millers Association to continue the scheme activities.
May 2009: tax holiday on agriculture and industry investments was extended by three years. Oct. 2009: creation of the Cambodia-Vietnam Foods Company to provide US$33 million credit to the Rural
Development Bank at the rate of 7% for lending to rice miller borrowers at the rate of 10%. Garment Industry Policies 2008-2012: new tax exemption policies were introduced: (i) extended 20 percent corporate profit tax holiday on
garment and textile factories (2005-2010); (ii) suspension of 1 percent (Advanced Profit Tax or APT) monthly profit tax (2008-2012) for garments and footwear industries; (iii) zero percent VAT rate (0%) applied for garment supported industry (2008 to 2010); (iv) 0% VAT rate for 40 industries or contractors supplying products or services to serve for exporting of the garment, textile, and footwear industries.
May 2009: provision of $7 million in special scholarships to provide short vocational training courses to 40,500 garment workers who had lost their jobs at garment factories.
May 2009: a US$7.7 million Special Prime Minister Fund was set up in 2009 aimed at training courses for workers and unemployed youth affected by the crisis.
June 2009: the Ministry of Labor and Vocational Training earmarked US$1 million in financial aid for garment workers made redundant by the downturn in the sector, enabling them to apply for small loans to help them kick start small businesses of their own.
2009-2010: Government to cover 0.3 percent of the total 0.8 percent Payment of the Occupational Risk Contribution by the Garment and Shoe Enterprises and Establishments
Tourism Sector Response Packages Travel requirements reduced for Vietnamese and Laotian citizens and their tourists. The Sihanoukville Airport was
declared an international airport. A new international checkpoint in Kep was opened to attract visitors from the Mekong Delta and island of Phu Quoc. As of the end of 2009, Cambodia has visa waivers in place for citizens of Laos, Malaysia, Singapore, the Philippines, and Vietnam.
Angkor Wat passes period extended for tourists (3 day pass over 7 days, 7 day pass over 14 days). During 2009, travel to Cambodia was promoted under the slogan of “Cambodia; the Kingdom of Wonder”. Tourism law was adopted on April 29, 2009

30
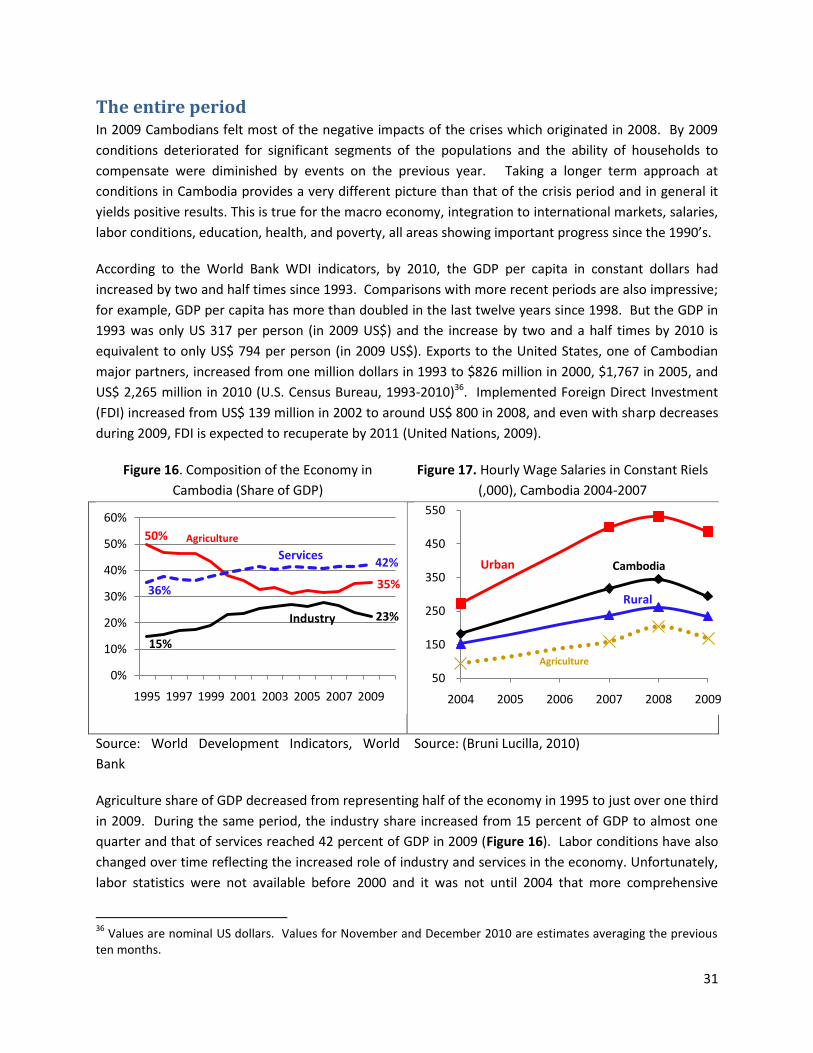
31
The entire period In 2009 Cambodians felt most of the negative impacts of the crises which originated in 2008. By 2009
conditions deteriorated for significant segments of the populations and the ability of households to
compensate were diminished by events on the previous year. Taking a longer term approach at
conditions in Cambodia provides a very different picture than that of the crisis period and in general it
yields positive results. This is true for the macro economy, integration to international markets, salaries,
labor conditions, education, health, and poverty, all areas showing important progress since the 1990’s.
According to the World Bank WDI indicators, by 2010, the GDP per capita in constant dollars had
increased by two and half times since 1993. Comparisons with more recent periods are also impressive;
for example, GDP per capita has more than doubled in the last twelve years since 1998. But the GDP in
1993 was only US 317 per person (in 2009 US$) and the increase by two and a half times by 2010 is
equivalent to only US$ 794 per person (in 2009 US$). Exports to the United States, one of Cambodian
major partners, increased from one million dollars in 1993 to $826 million in 2000, $1,767 in 2005, and
US$ 2,265 million in 2010 (U.S. Census Bureau, 1993-2010)36. Implemented Foreign Direct Investment
(FDI) increased from US$ 139 million in 2002 to around US$ 800 in 2008, and even with sharp decreases
during 2009, FDI is expected to recuperate by 2011 (United Nations, 2009).
Figure 16. Composition of the Economy in
Cambodia (Share of GDP)
Figure 17. Hourly Wage Salaries in Constant Riels
(,000), Cambodia 2004-2007
Source: World Development Indicators, World
Bank
Source: (Bruni Lucilla, 2010)
Agriculture share of GDP decreased from representing half of the economy in 1995 to just over one third
in 2009. During the same period, the industry share increased from 15 percent of GDP to almost one
quarter and that of services reached 42 percent of GDP in 2009 (Figure 16). Labor conditions have also
changed over time reflecting the increased role of industry and services in the economy. Unfortunately,
labor statistics were not available before 2000 and it was not until 2004 that more comprehensive
36
Values are nominal US dollars. Values for November and December 2010 are estimates averaging the previous ten months.
50% Agriculture
35%
15%
Industry 23%
36%
Services42%
0%
10%
20%
30%
40%
50%
60%
1995 1997 1999 2001 2003 2005 2007 2009
Cambodia Urban
Rural
Agriculture
50
150
250
350
450
550
2004 2005 2006 2007 2008 2009
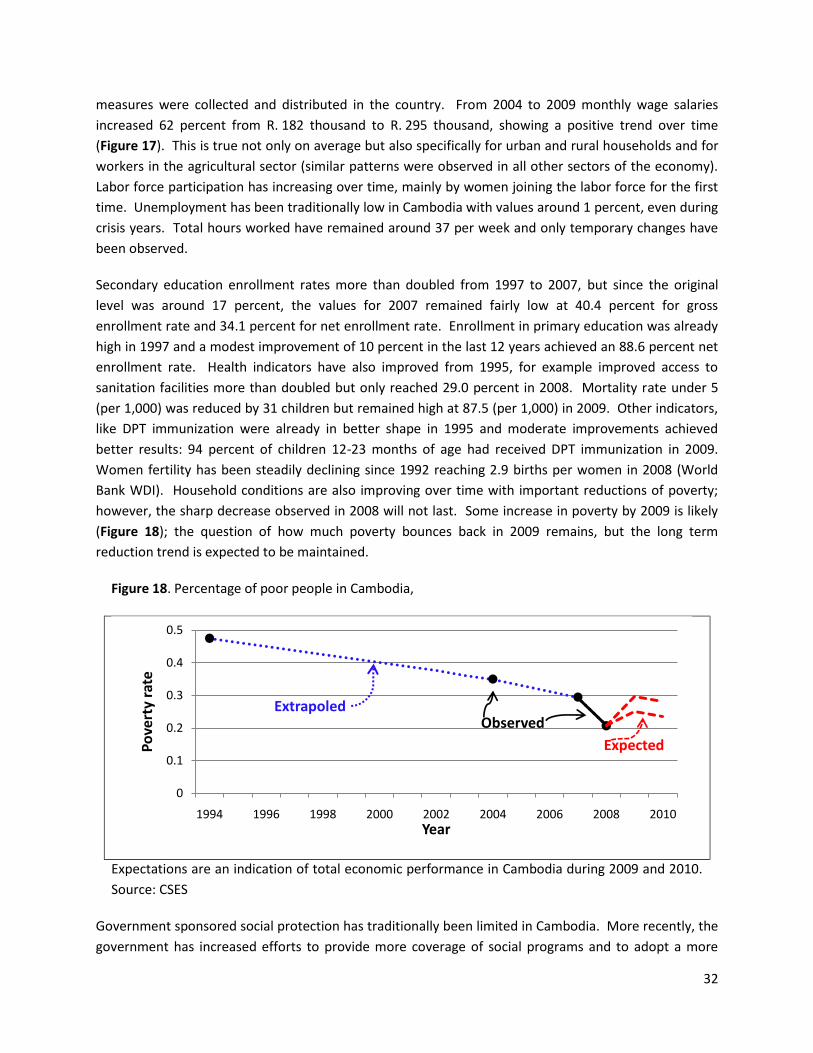
32
measures were collected and distributed in the country. From 2004 to 2009 monthly wage salaries
increased 62 percent from R. 182 thousand to R. 295 thousand, showing a positive trend over time
(Figure 17). This is true not only on average but also specifically for urban and rural households and for
workers in the agricultural sector (similar patterns were observed in all other sectors of the economy).
Labor force participation has increasing over time, mainly by women joining the labor force for the first
time. Unemployment has been traditionally low in Cambodia with values around 1 percent, even during
crisis years. Total hours worked have remained around 37 per week and only temporary changes have
been observed.
Secondary education enrollment rates more than doubled from 1997 to 2007, but since the original
level was around 17 percent, the values for 2007 remained fairly low at 40.4 percent for gross
enrollment rate and 34.1 percent for net enrollment rate. Enrollment in primary education was already
high in 1997 and a modest improvement of 10 percent in the last 12 years achieved an 88.6 percent net
enrollment rate. Health indicators have also improved from 1995, for example improved access to
sanitation facilities more than doubled but only reached 29.0 percent in 2008. Mortality rate under 5
(per 1,000) was reduced by 31 children but remained high at 87.5 (per 1,000) in 2009. Other indicators,
like DPT immunization were already in better shape in 1995 and moderate improvements achieved
better results: 94 percent of children 12-23 months of age had received DPT immunization in 2009.
Women fertility has been steadily declining since 1992 reaching 2.9 births per women in 2008 (World
Bank WDI). Household conditions are also improving over time with important reductions of poverty;
however, the sharp decrease observed in 2008 will not last. Some increase in poverty by 2009 is likely
(Figure 18); the question of how much poverty bounces back in 2009 remains, but the long term
reduction trend is expected to be maintained.
Figure 18. Percentage of poor people in Cambodia,
Expectations are an indication of total economic performance in Cambodia during 2009 and 2010.
Source: CSES
Government sponsored social protection has traditionally been limited in Cambodia. More recently, the
government has increased efforts to provide more coverage of social programs and to adopt a more
ExtrapoledObserved
Expected
0
0.1
0.2
0.3
0.4
0.5
1994 1996 1998 2000 2002 2004 2006 2008 2010
Po
vert
y ra
te
Year
33
coordinated approach by means of a Social Protection Strategy. Actions for the near future stress the
importance of better targeting and increased harmonization of limited resources to increment coverage
of the poor and vulnerable. Improving and expanding coverage in health protection, education, child
nutrition, and public works together with a new program of cash transfers to the extreme/chronic poor
are also recommended to be implemented in the near future. The strategy also calls for actions aimed
at improving the abilities to implement programs in general by supporting CARD’s role as a coordinator,
improving the financial sustainability of the programs, and evaluating and improving the existing
targeting systems.
During the crisis period of 2008 and 2009 the government and development partners continued with
existing social programs and in some cases like the food programs increased coverage. Also in response
to the crises, the RGC implemented a series of actions to improve the general economic conditions of
several sectors of the economy: (i) monetary policies including increases in reserve requirements by the
National Bank of Cambodia and by commercial banks, banking reforms to strengthen the health and
regulation of the banking sector, and provision of funds for local banks to ensure their liquidity; (ii)
agricultural policies providing special credit lines or new credit institutions mainly to support rice
producers and millers, earmarking of funds for irrigation projects, reduction of custom tariffs on farm
equipment and inputs, and tax breaks for agricultural and industrial investments; (iii) industrial policies
including the reduction of several taxes and tariffs for garments and footwear industries as well as for
industries or contractors supplying products or services to the garment sector and the support of several
training programs and scholarships to train displaced workers from the garment sector and facilitate
their involvement in other activities or improving their skills for when joining the sector in the future;
and (iv) tourism policies reducing visa requirements for some visitors, improving airports facilities and
classifications to become more accessible for international travellers and international promotion of
Cambodia as a tourist destination (see Box 4 for a more detailed description).
After taking a long term look at the socioeconomic conditions in Cambodia, the overall impression is one
of good performance at low levels. In other words Cambodia has come a long way since the early 90’s
with important improvements for its people, but the starting point was very low two decades ago. This
is the case not only for the economy in general but also for access to services and households’
wellbeing. In areas where conditions were already improving at the beginning of the 1990’s, primary
education and some vaccination programs for example, the levels reached by 2009 are quite
satisfactory. On the other hand, for those indicators with very low values during the 90’s, access to
sanitation, GDP per capita and secondary education for example, the improvements achieved were not
enough to reach satisfactory levels by 2009.
It is clear that Cambodia has made substantial improvements in the information systems available to
guide public policy including: (i) regular information sources such as a continuous LSMS style survey to
measure poverty and living conditions, CPI to track inflation over time, local and international/export
price information for important commodities, regular population censuses, commercial establishments
census (by 2011), commune socioeconomic information system, etc; (ii) multiple year surveys executed
by the CDRI such as the Vulnerable Workers Study, Rapid Assessment on the Impact of the Financial

34
Crisis, and the Poverty Dynamic Study; (iii) “one time” exercises aiming at answering more specific
issues; (iv) better targeting for social programs or ID-poor; and (v) improved access to information from
national accounts. The next step is to improve coordination among the information sources and develop
a national information system that allows for the combined use of information and the setting of
priorities based on an assessment of needs and existing gaps in the country. NIS has taken steps in this
direction with a National Statistical Plan and its efforts should be supported. The quality of the
information varies significantly between sources and surveys and in many cases some data collected is
underutilized, if used at all. To address these problems, an evaluation of the quality, relevance and use
of information produced in Cambodia is necessary in order to establish standards and identify areas of
improvement.
35
Bibliography
Age-specific determinants of stunting in Filipino children. Adair DK, Guilkey LS. 1997. 1997, Journal of
Nutrition. 127, pp. 314-320.
Asian Development Bank Institute (ADBI). 2009. Patterns of Inclusive Growth in Developing Asia:
Insights from an Enhanced Growth-Poverty Elasticity Analysis. 2009.
Bruni Lucilla, Mason Andrew, Pabon Laura and Turk Carrie. 2010. Gender Impacts of the Global
Financial Crisis in Cambodia. 2010.
Cambodia Economic Association. 2010. The Impact of The Economic Downturn on Households and
Communities in Cambodia. 2010.
Cambodian Economic Association. 2010. The Impact of The Economic Downturn on Households and
Communities in Cambodia. 2010.
CDRI. 2010. Poverty Dynamic Study Evidence from Nine Villages in Cambodia. 2010.
—. 2010. Rapid Assessment of the Impacts of the Economic Crisis on Cambodian Households and
Vulnerable Workers (Fourth Round). 2010.
—. 2009. Rapid Assessment of the Impacts of the Economic Crisis on Cambodian Households and
Vulnerable Workers: Road to Recovery (Third Round). 2009.
—. 2010. Vulnerable workers Survey in Phnom Penh, Kandal, Kompong Speu, Siem Reap and Battamban
(Forth Round). 2010.
—. 2009. Vulnerable Workers Survey in Phnom Penh, Kandal, Kompong Speu, Siem Reap and Battanbang
(Third round). 2009.
Hossein Jalilian, Chan Sophal, Glenda Reyes, Saing Chan Hang, Phann Dalis and Pon Dorina. 2009.
Global Financial Crisis Discussions Series: Paper 4: Cambodia. 2009.
Knowles, James C. 2009. Cambodia: analizing the Poverty/Welfare Impacts of the Global Financial Crisis.
2009.
—. 2009. Cambodia: Analyzinf the Poverty/Welfate Impacts of the Global Financial Crisis. 2009.
—. 2010. Poverty Estimates for Cambodia, 2008. 2010.
Ministry of Panning. 2010. Poverty and Selected CMDG Mapas and Charts 2003-2009: Preliminary
Results of The CDB-Based Research and Analysis Report (2010 Updated Edition). 2010.
National Institute of Statistics. 2009. Ministry of Planning Cambodia Anthropemetrics Survey. 2009.
—. 2009. National Account of Cambodia. 2009.
Risk factors for wasting and stunting among children in Metro Cebu, Philippines. Am. J. Clin. Nutr. 63,
966–975. Ricci J.A., Becker S. 1996. 1996, American Journal of Clinical Nutrition 63, pp. 966–
975.
Rushdy, Sherif. 2009. Achieving Cambodia’s Millennium Development Goal: Gap Analysis. . 2009.
36
U.S. Census Bureau. 1993-2010. Trade with Cambodia. 1993-2010.
United Nations. 2009. The Global Economic Downturn: Opportunity or Crisis? 2009.
World Bank. 2009. Cambodia Sustaining Rapid Growth in a Challenging Enviroment: Country Economic
Memorandum, Report 49158-KH. 2009.
—. 2009. Country Economic Monitoring Note. 2009.
—. 2006. Development and the Next Generation World Bank Development Report 2007. 2006.
—. 2010. Poverty Estimates for Cambodia, 2008. 2010.
—. 2009. Poverty Profile and Trends in Cambodia : findings from the 2007 Cambodia Socio Economic
Survey (CES). 2009.
—. 2009. The Social Impact of the financial Crisis and the Social Protection Response: Cambodia. 2009.
—. 2010. Towards a Social Protection Strategy for the Poor and Vulnerable: Outcomes of the
Consultation Process. 2010.