Embed Size (px)
Citation preview
CHAPTER 4
Cambodia Country Report
Heang Theangseng
March 2021
This chapter should be cited as:Theangseng, H. (2021), ‘Cambodia Country Report’, in Han, P. and S. Kimura (eds.), Energy Outlook and Energy Saving Potential in East Asia 2020, Jakarta: ERIA, pp.55-72.
55
CHAPTER 4
Cambodia Country ReportHeang Theangseng
1. Background
Located in the lower Mekong region of Southeast Asia, Cambodia has an area of 181,035 square
kilometres (km) and an 800 km border with Thailand in the west, Lao People’s Democratic
Republic (Lao PDR) in the north, and Viet Nam in the east. The landscape is dominated by
lowland plains around the Mekong River and the Tonle Sap Lake. The country has about 2.5
million hectares (ha) of arable land and over 0.5 million ha of pastureland.
Gross domestic product (GDP) average annual growth rate (AAGR) was 7.2% in 2010–2018.
The service sector was the largest in that period and contributed the most (38%) to economy
in 2018. The AAGR of services was 7.2% in 2010–2018, however, lower than that of industry
(11.1%), which indicates industry’s growing importance in GDP. Agriculture’s share was about
34% in 2010 and decreased to 22% in 2018, with an AAGR of 1.7%. The Ministry of Economy
and Finance, Cambodia predicts that GDP will stay at about 6.0% from 2023 as a result of
the coronavirus disease (COVID-19) outbreak, which could cost the global economy $77
billion–$347 billion or 0.1%–0.4% loss of GDP.
The population increased steadily at an AAGR of 1.6% in 2010–2018. The urban population
grew by 3.4% per year, faster than the rural population. The rural population, however, was still
bigger than the urban population, making up 77% of the total in 2018.
Electricity generation facilities in 2018 were hydro, coal, diesel, and solar power plants, and
plants using wood and other biomass. Total installed capacity of power generation grew by
56 | Energy Outlook and Energy Saving Potential in East Asia 2020
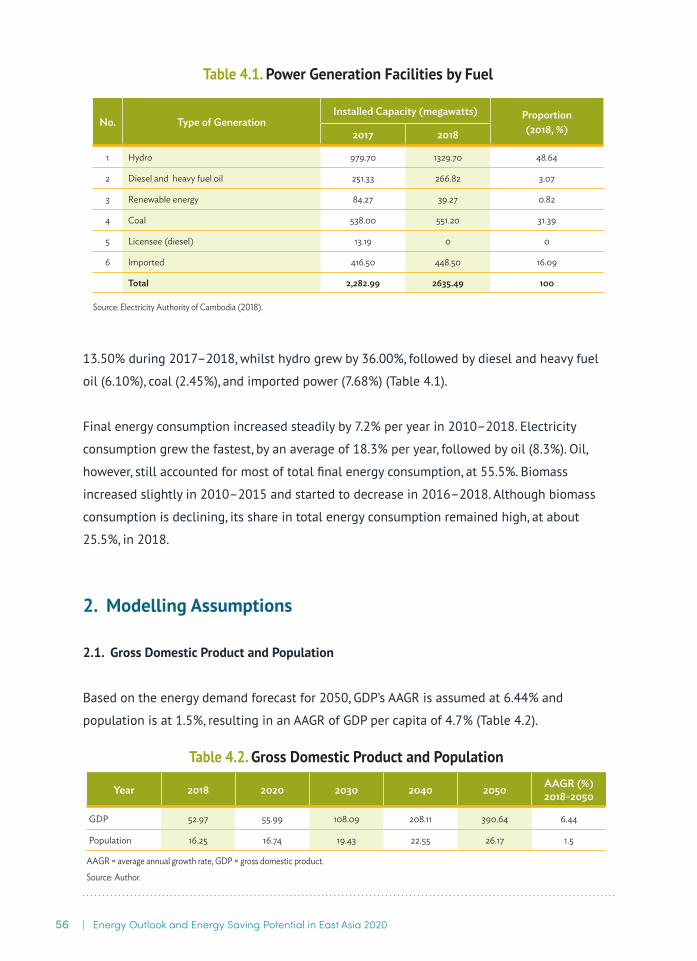
13.50% during 2017–2018, whilst hydro grew by 36.00%, followed by diesel and heavy fuel
oil (6.10%), coal (2.45%), and imported power (7.68%) (Table 4.1).
Final energy consumption increased steadily by 7.2% per year in 2010–2018. Electricity
consumption grew the fastest, by an average of 18.3% per year, followed by oil (8.3%). Oil,
however, still accounted for most of total final energy consumption, at 55.5%. Biomass
increased slightly in 2010–2015 and started to decrease in 2016–2018. Although biomass
consumption is declining, its share in total energy consumption remained high, at about
25.5%, in 2018.
2. Modelling Assumptions
2.1. Gross Domestic Product and Population
Based on the energy demand forecast for 2050, GDP’s AAGR is assumed at 6.44% and
population is at 1.5%, resulting in an AAGR of GDP per capita of 4.7% (Table 4.2).
No. Type of GenerationInstalled Capacity (megawatts) Proportion
(2018, %) 2017 2018
1 Hydro 979.70 1329.70 48.64
2 Diesel and heavy fuel oil 251.33 266.82 3.07
3 Renewable energy 84.27 39.27 0.82
4 Coal 538.00 551.20 31.39
5 Licensee (diesel) 13.19 0 0
6 Imported 416.50 448.50 16.09
Total 2,282.99 2635.49 100
Source: Electricity Authority of Cambodia (2018).
Table 4.1. Power Generation Facilities by Fuel
Year 2018 2020 2030 2040 2050 AAGR (%)2018-2050
GDP 52.97 55.99 108.09 208.11 390.64 6.44
Population 16.25 16.74 19.43 22.55 26.17 1.5
AAGR = average annual growth rate, GDP = gross domestic product.
Source: Author.
Table 4.2. Gross Domestic Product and Population
57Cambodia Country Report |
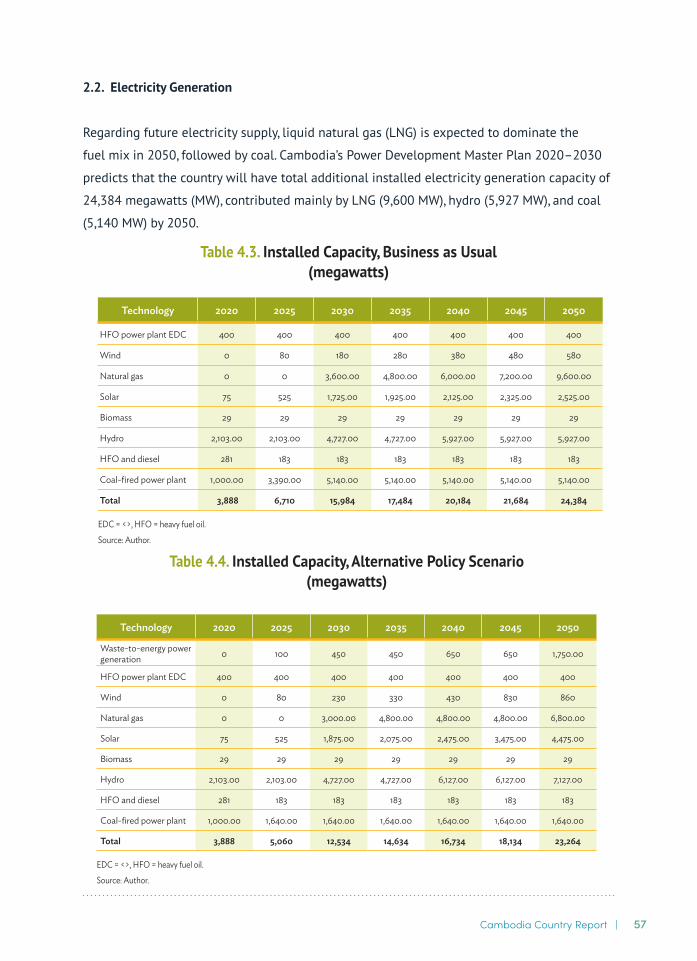
2.2. Electricity Generation
Regarding future electricity supply, liquid natural gas (LNG) is expected to dominate the
fuel mix in 2050, followed by coal. Cambodia’s Power Development Master Plan 2020–2030
predicts that the country will have total additional installed electricity generation capacity of
24,384 megawatts (MW), contributed mainly by LNG (9,600 MW), hydro (5,927 MW), and coal
(5,140 MW) by 2050.
Technology 2020 2025 2030 2035 2040 2045 2050
HFO power plant EDC 400 400 400 400 400 400 400
Wind 0 80 180 280 380 480 580
Natural gas 0 0 3,600.00 4,800.00 6,000.00 7,200.00 9,600.00
Solar 75 525 1,725.00 1,925.00 2,125.00 2,325.00 2,525.00
Biomass 29 29 29 29 29 29 29
Hydro 2,103.00 2,103.00 4,727.00 4,727.00 5,927.00 5,927.00 5,927.00
HFO and diesel 281 183 183 183 183 183 183
Coal-fired power plant 1,000.00 3,390.00 5,140.00 5,140.00 5,140.00 5,140.00 5,140.00
Total 3,888 6,710 15,984 17,484 20,184 21,684 24,384
EDC = <>, HFO = heavy fuel oil.
Source: Author.
Table 4.3. Installed Capacity, Business as Usual(megawatts)
Technology 2020 2025 2030 2035 2040 2045 2050
Waste-to-energy power generation 0 100 450 450 650 650 1,750.00
HFO power plant EDC 400 400 400 400 400 400 400
Wind 0 80 230 330 430 830 860
Natural gas 0 0 3,000.00 4,800.00 4,800.00 4,800.00 6,800.00
Solar 75 525 1,875.00 2,075.00 2,475.00 3,475.00 4,475.00
Biomass 29 29 29 29 29 29 29
Hydro 2,103.00 2,103.00 4,727.00 4,727.00 6,127.00 6,127.00 7,127.00
HFO and diesel 281 183 183 183 183 183 183
Coal-fired power plant 1,000.00 1,640.00 1,640.00 1,640.00 1,640.00 1,640.00 1,640.00
Total 3,888 5,060 12,534 14,634 16,734 18,134 23,264
EDC = <>, HFO = heavy fuel oil.
Source: Author.
Table 4.4. Installed Capacity, Alternative Policy Scenario(megawatts)
58 | Energy Outlook and Energy Saving Potential in East Asia 2020
2.3. Energy Efficiency and Conservation Policies
Cambodia’s energy efficiency and conservation (EE&C) programs aim to achieve integrated
and sustainable improvements in major energy-consuming sectors and help prevent wasteful
fuel consumption. The sectors must use energy more efficiently and have increased access
to energy-efficiency project financing. The government must establish energy-efficiency
regulatory frameworks. Cambodia is implementing pilot projects to achieve the following:
(i) Improve the efficiency of the overall supply chain for home lighting in rural areas by
providing decentralised energy services through a new generation of rural energy
entrepreneurs.
(ii) Help transform the market for home and office electrical appliances through bulk
purchase and dissemination of high-performance lamps, showcasing of energy efficient
products, support to competent organisations for testing and certification of energy-
efficient products, and establishment of ‘green learning rooms’ in selected schools to
impart life-long education on EE&C.Improve energy efficiency in buildings and public
facilities.
(iii) Improve energy efficiency, in cooperation with the United Nations Industrial
Development (UNIDO) and the Ministry of Mines and Energy (MME), in rice mills, brick
kilns, rubber refineries, and garment factories.
Cambodia is preparing an action plan for EE&C in cooperation with the energy efficiency
design sub-working group. The MME is drafting actions plans for industry, transport, and other
sectors. The action plans will result in estimated reduction of existing consumer demand by
5% by 2025 and by 20% by 2050 under the business as usual (BAU) scenario. These initial
estimates were used to forecast energy demand under the alternative policy scenario (APS).
The National Energy Efficiency Policy, Strategy and Action Plan identifies five priorities:
(i) energy efficiency in industry,
(ii) energy efficiency of end-user products,
(iii) energy efficiency in buildings,
(iv) energy efficiency of rural electricity generation and distribution, and
(v). efficient use of biomass resources for residential and industrial purposes.
The energy-efficiency assumption in the Long-range Energy Alternative Planning system (LEAP) model is based on the assessment of the energy-efficiency potential of buildings,
59Cambodia Country Report |
industry, and transport. The National Energy Efficiency Policy aims to reduce energy demand by 20% by 2050 relative to BAU.
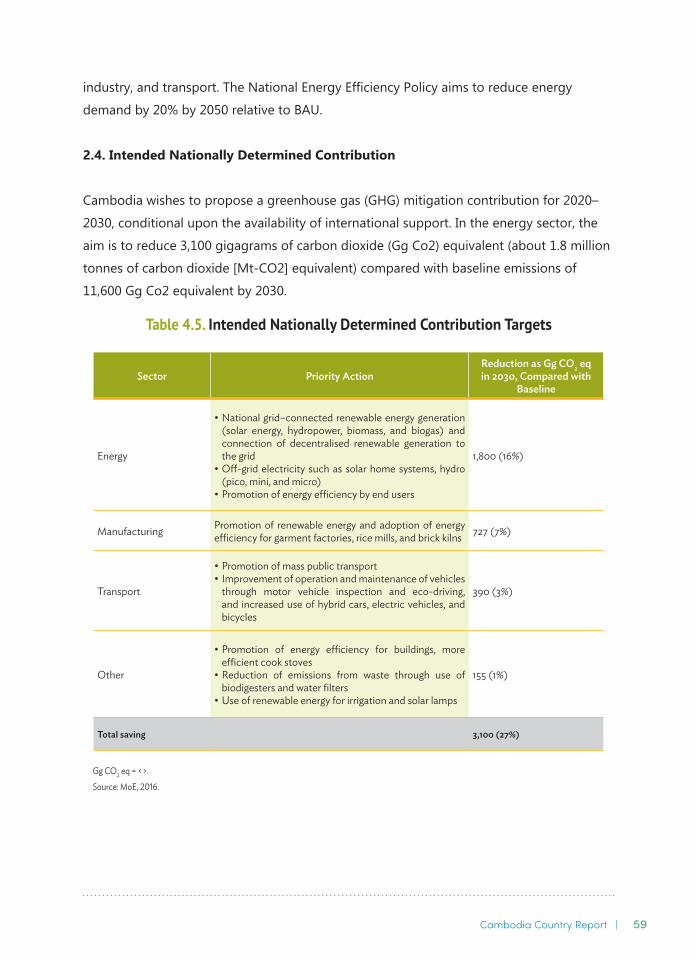
2.4. Intended Nationally Determined Contribution
Cambodia wishes to propose a greenhouse gas (GHG) mitigation contribution for 2020–2030, conditional upon the availability of international support. In the energy sector, the aim is to reduce 3,100 gigagrams of carbon dioxide (Gg Co2) equivalent (about 1.8 million tonnes of carbon dioxide [Mt-CO2] equivalent) compared with baseline emissions of 11,600 Gg Co2 equivalent by 2030.
Table 4.5. Intended Nationally Determined Contribution Targets
Sector Priority ActionReduction as Gg CO2 eq in 2030, Compared with
Baseline
Energy
• National grid–connected renewable energy generation (solar energy, hydropower, biomass, and biogas) and connection of decentralised renewable generation to the grid
• Off-grid electricity such as solar home systems, hydro (pico, mini, and micro)
• Promotion of energy efficiency by end users
1,800 (16%)
Manufacturing Promotion of renewable energy and adoption of energy efficiency for garment factories, rice mills, and brick kilns 727 (7%)
Transport
• Promotion of mass public transport • Improvement of operation and maintenance of vehicles
through motor vehicle inspection and eco-driving, and increased use of hybrid cars, electric vehicles, and bicycles
390 (3%)
Other
• Promotion of energy efficiency for buildings, more efficient cook stoves
• Reduction of emissions from waste through use of biodigesters and water filters
• Use of renewable energy for irrigation and solar lamps
155 (1%)
Total saving 3,100 (27%)
Gg CO2 eq = <>.
Source: MoE, 2016.
60 | Energy Outlook and Energy Saving Potential in East Asia 2020
3. Outlook Results
3.1. Business as Usual
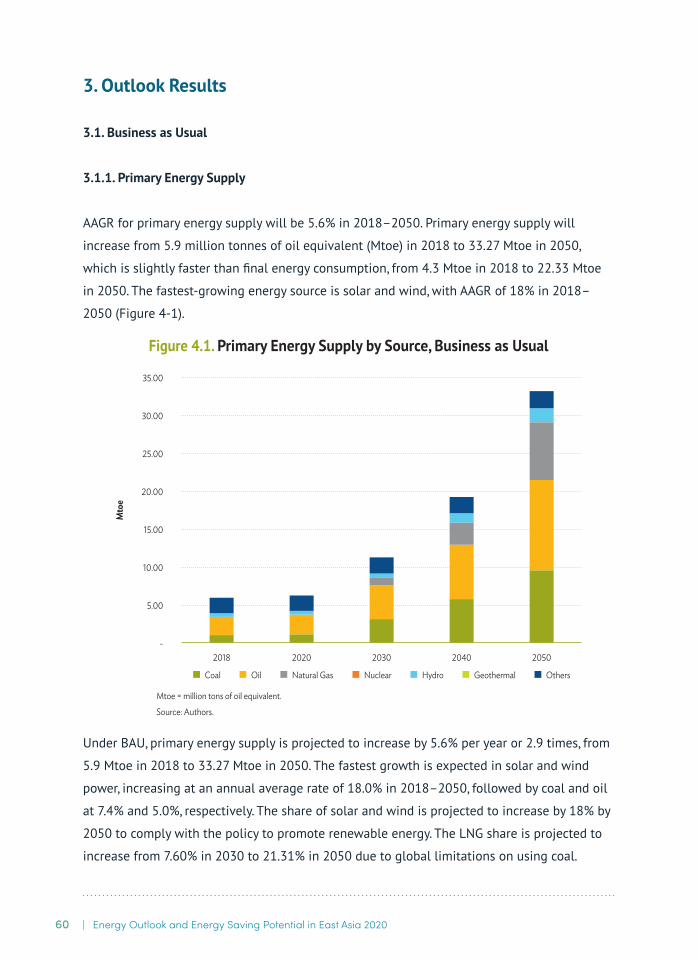
3.1.1. Primary Energy Supply
AAGR for primary energy supply will be 5.6% in 2018–2050. Primary energy supply will
increase from 5.9 million tonnes of oil equivalent (Mtoe) in 2018 to 33.27 Mtoe in 2050,
which is slightly faster than final energy consumption, from 4.3 Mtoe in 2018 to 22.33 Mtoe
in 2050. The fastest-growing energy source is solar and wind, with AAGR of 18% in 2018–
2050 (Figure 4-1).
Under BAU, primary energy supply is projected to increase by 5.6% per year or 2.9 times, from
5.9 Mtoe in 2018 to 33.27 Mtoe in 2050. The fastest growth is expected in solar and wind
power, increasing at an annual average rate of 18.0% in 2018–2050, followed by coal and oil
at 7.4% and 5.0%, respectively. The share of solar and wind is projected to increase by 18% by
2050 to comply with the policy to promote renewable energy. The LNG share is projected to
increase from 7.60% in 2030 to 21.31% in 2050 due to global limitations on using coal.
Figure 4.1. Primary Energy Supply by Source, Business as Usual
Mtoe = million tons of oil equivalent.
Source: Authors.
2030 2040 2050
Mto
e
Coal Oil Natural Gas Nuclear Hydro Geothermal Others
5.00
10.00
15.00
20.00
25.00
30.00
35.00
-2018 2020
61Cambodia Country Report |
3.1.2. Final Energy Demand
3.1.2.1. By Sector
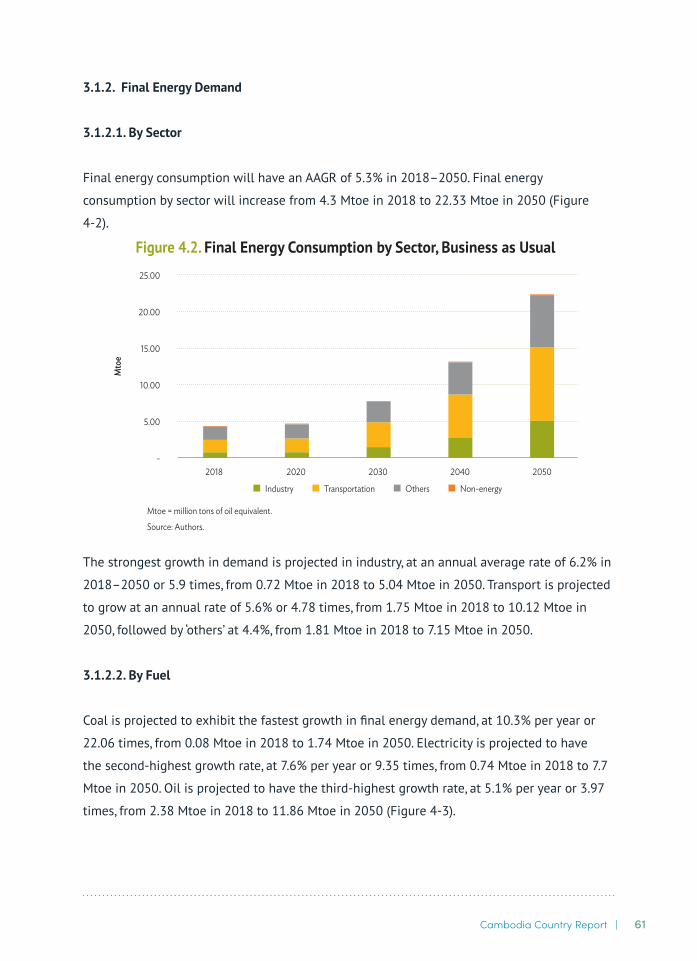
Final energy consumption will have an AAGR of 5.3% in 2018–2050. Final energy
consumption by sector will increase from 4.3 Mtoe in 2018 to 22.33 Mtoe in 2050 (Figure
4-2).
The strongest growth in demand is projected in industry, at an annual average rate of 6.2% in
2018–2050 or 5.9 times, from 0.72 Mtoe in 2018 to 5.04 Mtoe in 2050. Transport is projected
to grow at an annual rate of 5.6% or 4.78 times, from 1.75 Mtoe in 2018 to 10.12 Mtoe in
2050, followed by ‘others’ at 4.4%, from 1.81 Mtoe in 2018 to 7.15 Mtoe in 2050.
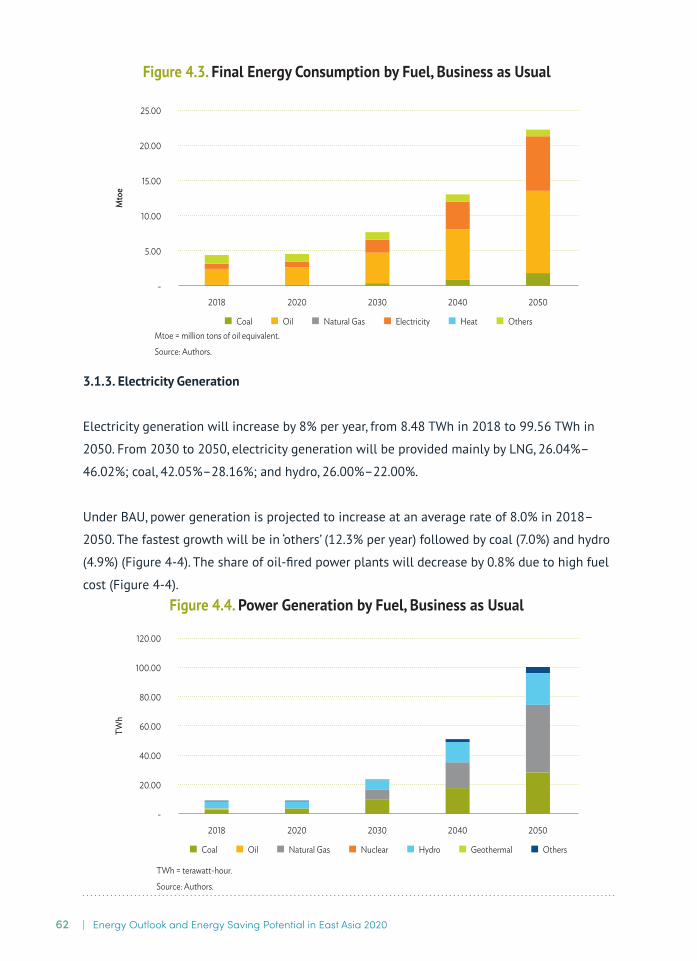
3.1.2.2. By Fuel
Coal is projected to exhibit the fastest growth in final energy demand, at 10.3% per year or
22.06 times, from 0.08 Mtoe in 2018 to 1.74 Mtoe in 2050. Electricity is projected to have
the second-highest growth rate, at 7.6% per year or 9.35 times, from 0.74 Mtoe in 2018 to 7.7
Mtoe in 2050. Oil is projected to have the third-highest growth rate, at 5.1% per year or 3.97
times, from 2.38 Mtoe in 2018 to 11.86 Mtoe in 2050 (Figure 4-3).
Figure 4.2. Final Energy Consumption by Sector, Business as Usual
Mtoe = million tons of oil equivalent.
Source: Authors.
2030 2040 2050
Mto
e
2020
5.00
10.00
15.00
20.00
25.00
-2018
Industry Transportation Others Non-energy
62 | Energy Outlook and Energy Saving Potential in East Asia 2020
3.1.3. Electricity Generation
Electricity generation will increase by 8% per year, from 8.48 TWh in 2018 to 99.56 TWh in
2050. From 2030 to 2050, electricity generation will be provided mainly by LNG, 26.04%–
46.02%; coal, 42.05%–28.16%; and hydro, 26.00%–22.00%.
Under BAU, power generation is projected to increase at an average rate of 8.0% in 2018–
2050. The fastest growth will be in ‘others’ (12.3% per year) followed by coal (7.0%) and hydro
(4.9%) (Figure 4-4). The share of oil-fired power plants will decrease by 0.8% due to high fuel
cost (Figure 4-4).
Figure 4.4. Power Generation by Fuel, Business as Usual
TWh = terawatt-hour.
Source: Authors.
2030 2040 2050
TWh
2018 2020-
20.00
40.00
60.00
80.00
100.00
120.00
Coal Oil Natural Gas Nuclear Hydro Geothermal Others
2030 2040 2050
Mto
e
2018 2020-
5.00
10.00
15.00
20.00
25.00
Coal Oil Natural Gas Electricity Heat Others
Figure 4.3. Final Energy Consumption by Fuel, Business as Usual
Mtoe = million tons of oil equivalent.
Source: Authors.

63Cambodia Country Report |
3.1.4. Carbon Dioxide Emissions
CO2 emissions from energy consumption are projected to increase by 6.8% per year, from 3.0
Mt-C in 2018 to 25.0 Mt-C in 2050 under BAU.
Coal is the largest source of carbon emissions, which will increase the fastest, with an AAGR
of 7.4%, from 1.1 Mt-C in 2018 to 10.05 Mt-C in 2050. The second-largest source of carbon
emissions is oil, with an AAGR of 5.1%, from 2.0 Mt-C in 2018 to 9.7 Mt-C in 2050 (Figure 4-5).
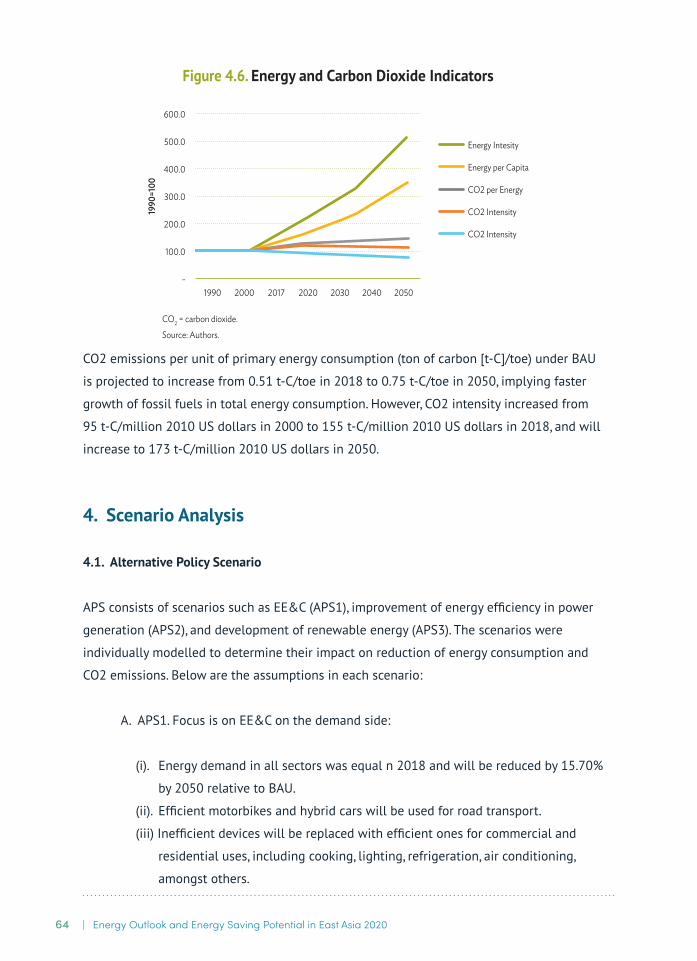
3.1.5. Energy Indicators
Primary energy intensity decreased from 775 toe/million 2010 US dollars in 1990 to 301 toe/
million 2010 US dollars in 2018. Under BAU, energy intensity will further decrease to 230
toe/million 2010 US dollars in 2050 as a result of the EE&C program.
Primary energy per capita increased from 0.3 toe in 1990 to 0.4 toe in 2018. Under BAU,
energy per capita will further increase to 1.3 toe in 2050 because living standards will
improve, resulting in increasing energy demand per capita.
Figure 4-6 shows indicators of energy consumption.
2030 2040 2050
Mt-
C
2018 2020-
5.00
10.00
15.00
20.00
25.00
30.00
Coal Oil Natural Gas
Figure 4.5. Carbon Dioxide Emissions from Energy Consumption, Business as Usual
Mt-C = million tonnes of carbon equivalent.
Source: Authors.
64 | Energy Outlook and Energy Saving Potential in East Asia 2020
CO2 emissions per unit of primary energy consumption (ton of carbon [t-C]/toe) under BAU
is projected to increase from 0.51 t-C/toe in 2018 to 0.75 t-C/toe in 2050, implying faster
growth of fossil fuels in total energy consumption. However, CO2 intensity increased from
95 t-C/million 2010 US dollars in 2000 to 155 t-C/million 2010 US dollars in 2018, and will
increase to 173 t-C/million 2010 US dollars in 2050.
4. Scenario Analysis
4.1. Alternative Policy Scenario
APS consists of scenarios such as EE&C (APS1), improvement of energy efficiency in power
generation (APS2), and development of renewable energy (APS3). The scenarios were
individually modelled to determine their impact on reduction of energy consumption and
CO2 emissions. Below are the assumptions in each scenario:
A. APS1. Focus is on EE&C on the demand side:
(i). Energy demand in all sectors was equal n 2018 and will be reduced by 15.70%
by 2050 relative to BAU.
(ii). Efficient motorbikes and hybrid cars will be used for road transport.
(iii) Inefficient devices will be replaced with efficient ones for commercial and
residential uses, including cooking, lighting, refrigeration, air conditioning,
amongst others.
Figure 4.6. Energy and Carbon Dioxide Indicators
CO2 = carbon dioxide.
Source: Authors.
-
100.0
200.0
300.0
400.0
600.0
500.019
90=1
00
1990 2000 2017 2020 2030 2040 2050
Energy Intesity
Energy per Capita
CO2 per Energy
CO2 Intensity
CO2 Intensity

65Cambodia Country Report |
B. APS2. Thermal power plants are more energy-efficient. Energy efficiency of LNG, coal,
and fuel oil thermal power plants is assumed to stay constant at 41.2% until 2050
under BAU. Under APS2, new LNG, coal, and fuel oil thermal power plants are assumed
to have thermal efficiencies of 51%. APS2 is projected to improve the efficiency of
thermal power generation to about 23% in 2018–2050.
C. APS3. Under BAU, the share of renewables in the power generation mix is 37.16%, but
under APS3, it is up to 55.17% by 2050. The power generation mix in 2050 will consist
of hydro at 27.61%, LNG 22.08%, coal 20.49%, solar 17.34%, biomass 6.89%, and wind
3.3%.
D. APS5 or APS. Combination of APS1 to APS3.
The APS assumptions were analysed separately to determine the individual impacts of each
under APS1, APS2, APS3, and APS5. Figure 4-7 shows the changes in primary energy supply
in all scenarios. APS1 and APS2 have the largest reduction in primary energy supply in 2050
due to improved energy efficiency in thermal power generation and APS1 energy-efficiency
assumptions. APS1 could reduce primary energy supply under BAU by 4.64 Mtoe or 14%.
Under APS2, reduction will be slower, amounting to 2.88 Mtoe or 9.5%.
Figure 4.7. Comparison of Scenarios and Total Primary Energy Supply by 2050
APS = alternative policy scenario, BAU = business as usual, Mtoe = million tons of oil equivalent.
Source: Author.
APS2 APS3 APS5
Mto
e
BAU APS10.0
5.0
10.0
15.0
20.0
25.0
30.0
35.0
40.0
45.0
Coal Oil Natural Gas Hydro Others
66 | Energy Outlook and Energy Saving Potential in East Asia 2020
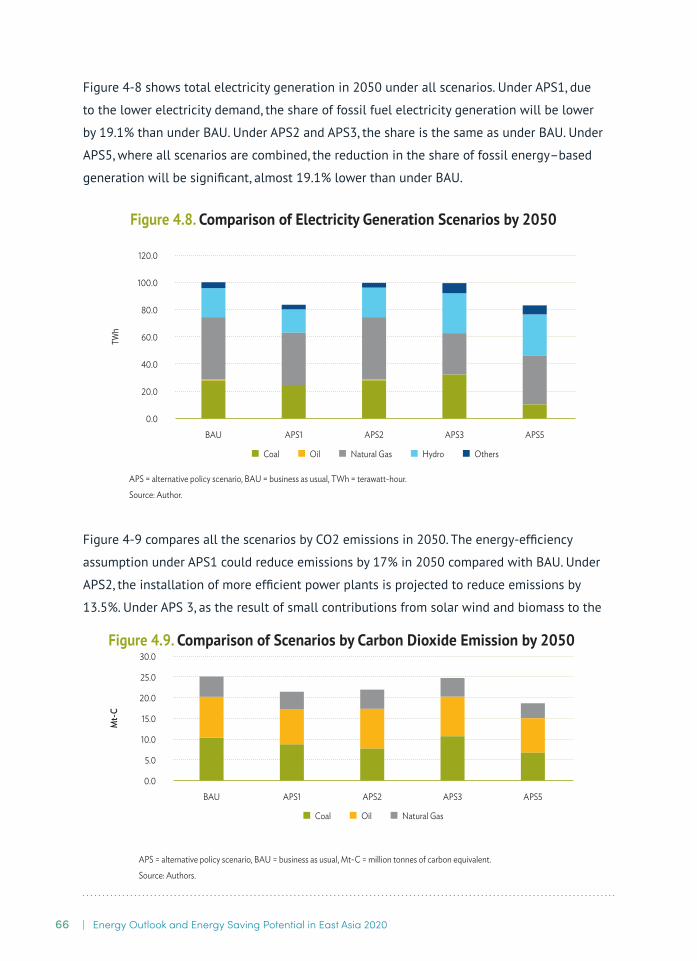
Figure 4-8 shows total electricity generation in 2050 under all scenarios. Under APS1, due
to the lower electricity demand, the share of fossil fuel electricity generation will be lower
by 19.1% than under BAU. Under APS2 and APS3, the share is the same as under BAU. Under
APS5, where all scenarios are combined, the reduction in the share of fossil energy–based
generation will be significant, almost 19.1% lower than under BAU.
Figure 4-9 compares all the scenarios by CO2 emissions in 2050. The energy-efficiency
assumption under APS1 could reduce emissions by 17% in 2050 compared with BAU. Under
APS2, the installation of more efficient power plants is projected to reduce emissions by
13.5%. Under APS 3, as the result of small contributions from solar wind and biomass to the
APS2 APS3 APS5
Mt-
C
BAU APS10.0
5.0
10.0
15.0
20.0
25.0
30.0
Coal Oil Natural Gas
Figure 4.9. Comparison of Scenarios by Carbon Dioxide Emission by 2050
APS = alternative policy scenario, BAU = business as usual, Mt-C = million tonnes of carbon equivalent.
Source: Authors.
Figure 4.8. Comparison of Electricity Generation Scenarios by 2050
APS = alternative policy scenario, BAU = business as usual, TWh = terawatt-hour.
Source: Author.
APS2 APS3 APS5
TWh
BAU APS10.0
20.0
40.0
60.0
80.0
100.0
120.0
Coal Oil Natural Gas Hydro Others

67Cambodia Country Report |
power generation mix, emissions could be reduced slightly, by 1%. All assumptions combined
(APS5) could reduce BAU CO2 emissions by 34.1% in 2050.
4.2. Energy Saving Potential and Carbon Dioxide Emission Reduction
4.2.2. Final Energy Demand
Under APS5, final energy consumption is 19 Mtoe and under BAU 22 Mtoe. Final energy
consumption under APS5 is projected to decrease by 13.5% compared with BAU in 2050
because of EE&C measures (APS1) in industry, transport, and residential and commercial
(‘others’) sectors.
Final energy consumption saving between APS5 and BAU is 3 Mtoe. Saving is expected to
occur in ‘others’ (1 Mtoe), transport (1 Mtoe), and industry (1 Mtoe).
Improvement in end-user technologies and the introduction of energy management systems
are expected to help slow consumption growth, particularly in ‘others’, industry, and transport
(Figure 4-10).
APS = alternative policy scenario, BAU = business as usual, Mtoe = million tons of oil equivalent.
Source: Authors.
BAU
2018 2018 2018 20182050 2050 2050 2050
BAU BAU BAUAPS APS APS APS
Non-energyOthersTransportIndustry
-14.6%
-11.3%
-16.0%
0.0%
0
2
4
6
8
10
12
Mto
e
Figure 4.10. Final Energy Consumption by Sector, Business as Usual and Alternative Policy Scenario
68 | Energy Outlook and Energy Saving Potential in East Asia 2020
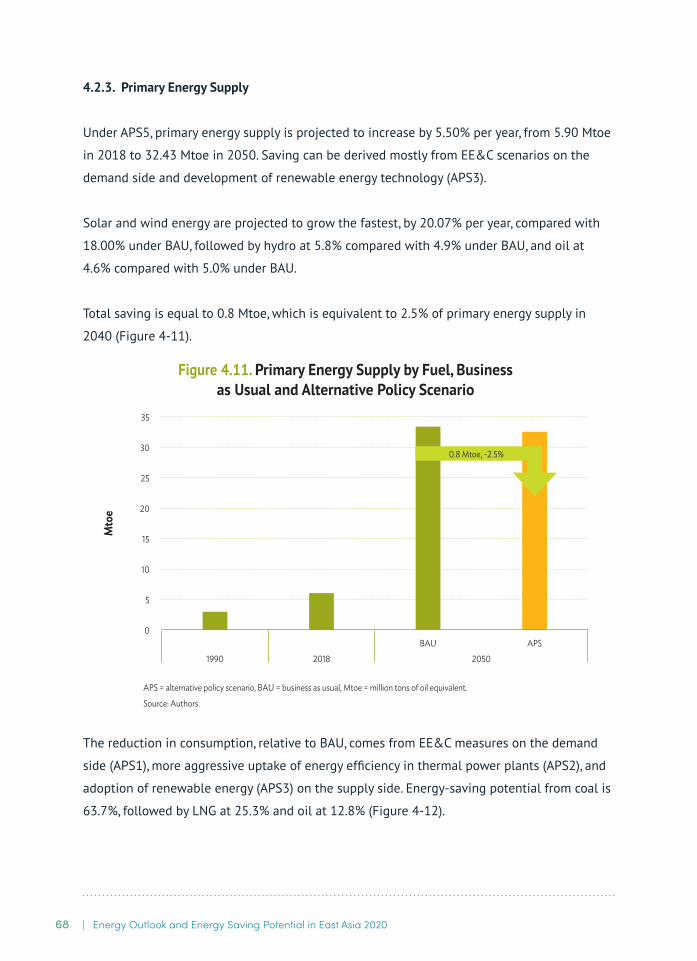
4.2.3. Primary Energy Supply
Under APS5, primary energy supply is projected to increase by 5.50% per year, from 5.90 Mtoe
in 2018 to 32.43 Mtoe in 2050. Saving can be derived mostly from EE&C scenarios on the
demand side and development of renewable energy technology (APS3).
Solar and wind energy are projected to grow the fastest, by 20.07% per year, compared with
18.00% under BAU, followed by hydro at 5.8% compared with 4.9% under BAU, and oil at
4.6% compared with 5.0% under BAU.
Total saving is equal to 0.8 Mtoe, which is equivalent to 2.5% of primary energy supply in
2040 (Figure 4-11).
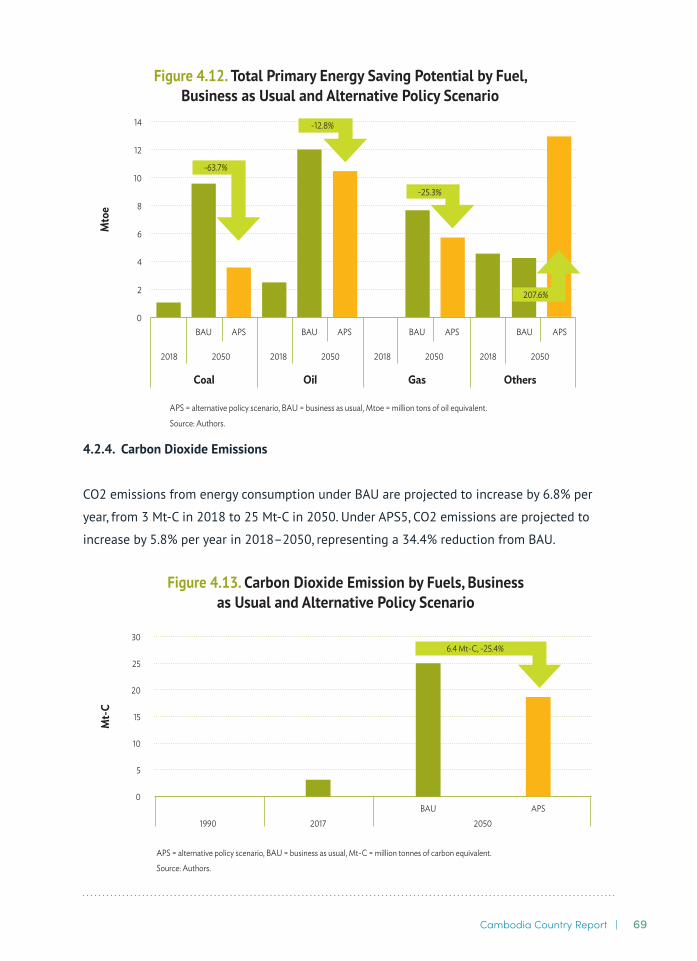
The reduction in consumption, relative to BAU, comes from EE&C measures on the demand
side (APS1), more aggressive uptake of energy efficiency in thermal power plants (APS2), and
adoption of renewable energy (APS3) on the supply side. Energy-saving potential from coal is
63.7%, followed by LNG at 25.3% and oil at 12.8% (Figure 4-12).
0
5
10
15
20
25
30
35
Mto
e
1990 2018 2050BAU APS
Figure 4.11. Primary Energy Supply by Fuel, Business as Usual and Alternative Policy Scenario
APS = alternative policy scenario, BAU = business as usual, Mtoe = million tons of oil equivalent.
Source: Authors.
0.8 Mtoe, -2.5%
69Cambodia Country Report |
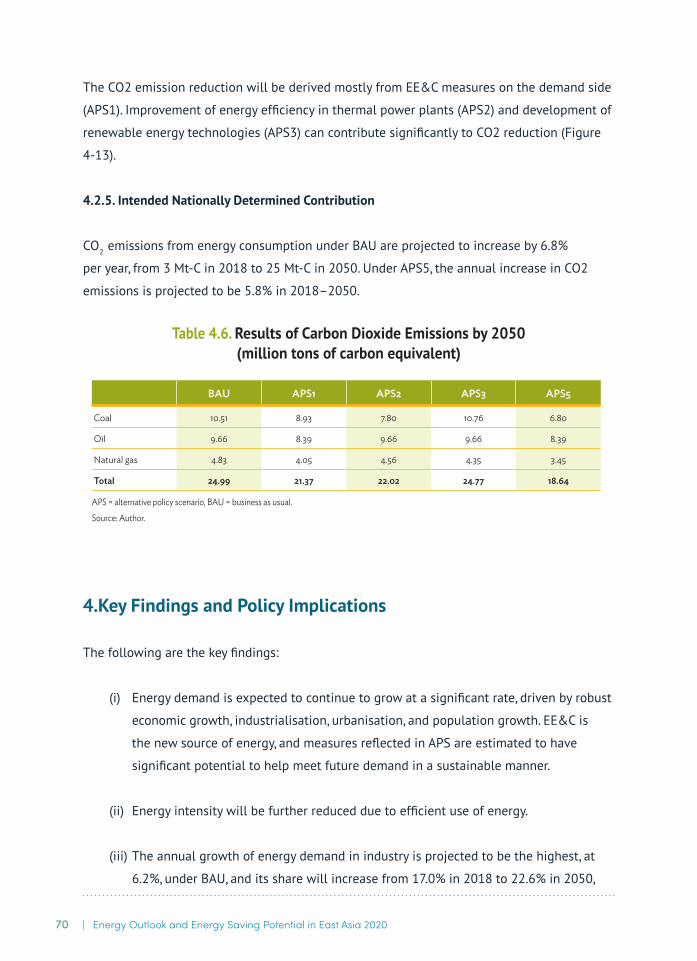
4.2.4. Carbon Dioxide Emissions
CO2 emissions from energy consumption under BAU are projected to increase by 6.8% per
year, from 3 Mt-C in 2018 to 25 Mt-C in 2050. Under APS5, CO2 emissions are projected to
increase by 5.8% per year in 2018–2050, representing a 34.4% reduction from BAU.
APS = alternative policy scenario, BAU = business as usual, Mtoe = million tons of oil equivalent.
Source: Authors.
BAU
2018 2018 2018 20182050 2050 2050 2050
BAU BAU BAUAPS APS APS APS
OthersGasOilCoal
-63.7%
-12.8%
-25.3%
207.6%
0
2
4
6
8
10
12
14
Mto
e
Figure 4.12. Total Primary Energy Saving Potential by Fuel, Business as Usual and Alternative Policy Scenario
Figure 4.13. Carbon Dioxide Emission by Fuels, Business as Usual and Alternative Policy Scenario
APS = alternative policy scenario, BAU = business as usual, Mt-C = million tonnes of carbon equivalent.
Source: Authors.
0
5
10
15
20
25
30
1990 2017 2050BAU APS
6.4 Mt-C, -25.4%
Mt-
C
70 | Energy Outlook and Energy Saving Potential in East Asia 2020
The CO2 emission reduction will be derived mostly from EE&C measures on the demand side
(APS1). Improvement of energy efficiency in thermal power plants (APS2) and development of
renewable energy technologies (APS3) can contribute significantly to CO2 reduction (Figure
4-13).
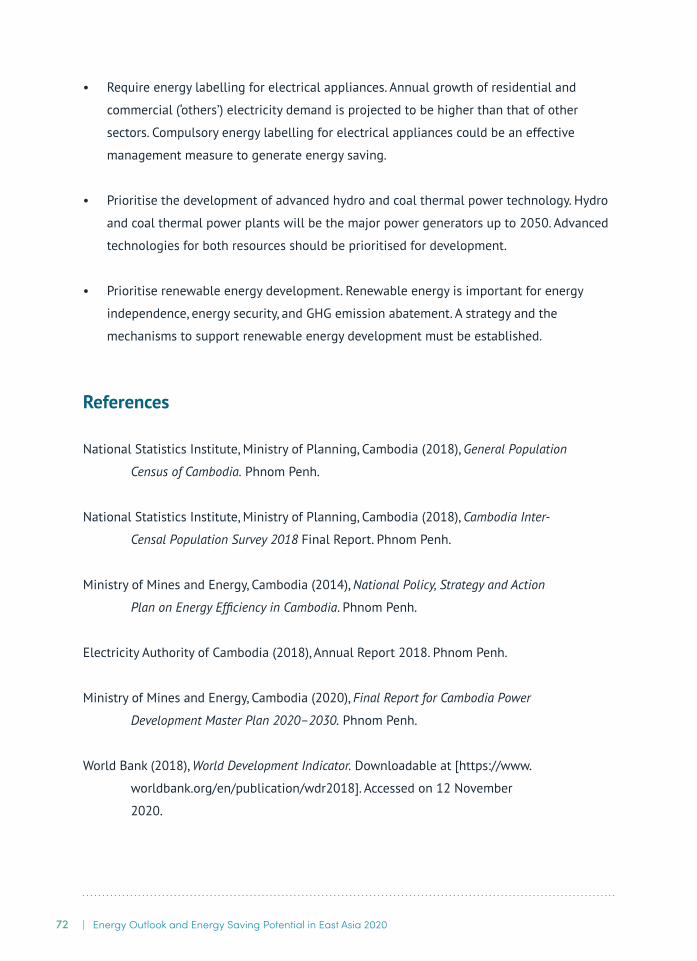
4.2.5. Intended Nationally Determined Contribution
CO2 emissions from energy consumption under BAU are projected to increase by 6.8%
per year, from 3 Mt-C in 2018 to 25 Mt-C in 2050. Under APS5, the annual increase in CO2
emissions is projected to be 5.8% in 2018–2050.
4.Key Findings and Policy Implications
The following are the key findings:
(i) Energy demand is expected to continue to grow at a significant rate, driven by robust
economic growth, industrialisation, urbanisation, and population growth. EE&C is
the new source of energy, and measures reflected in APS are estimated to have
significant potential to help meet future demand in a sustainable manner.
(ii) Energy intensity will be further reduced due to efficient use of energy.
(iii) The annual growth of energy demand in industry is projected to be the highest, at
6.2%, under BAU, and its share will increase from 17.0% in 2018 to 22.6% in 2050,
BAU APS1 APS2 APS3 APS5
Coal 10.51 8.93 7.80 10.76 6.80
Oil 9.66 8.39 9.66 9.66 8.39
Natural gas 4.83 4.05 4.56 4.35 3.45
Total 24.99 21.37 22.02 24.77 18.64
APS = alternative policy scenario, BAU = business as usual.
Source: Author.
Table 4.6. Results of Carbon Dioxide Emissions by 2050(million tons of carbon equivalent)

71Cambodia Country Report |
showing that industry has large potential for energy saving.
(iv) Coal demand is increasing, with the highest annual growth rate of 10.3% under BAU,
and is projected to be slightly lower, at 9.9%, under APS5.
(v) LNG power plants will be the major power generation source. LNG’s share in total
power generation output will increase from 26.4% in 2030 to 46.02% in 2050. LNG
will have the largest energy saving and GHG mitigation potential.
(vi) Coal power plants will be the second major source of power generation. Coal’s share
in total of power generation output will increase from 37.86% in 2018 and drop to
28.16% in 2050 due to the huge contribution of LNG.
The following actions are recommended:
• Establish targets and a road map for EE&C. The targets should be set up for the short,
medium, and long term and focused on buildings and industry. The long-term plan should
be based on an assessment of energy-saving potential for all energy sectors, including
residential and commercial sectors, that have large potential for energy saving up to
2050. Some activities can promote EE&C:
(a) support for the development of energy conservation professionals to be responsible
for energy management and operation, verification and monitoring, consultancy and
engineering service provision and planning, and supervision and implementation of
energy conservation measures;
(b) support for the development of institutional capability of public and private
sector agencies and organisations to be responsible for the planning, supervision,
promotion, and implementation of energy conservation measures;
(c) support for the operation of energy service companies to alleviate technical
and financial risks of entrepreneurs wishing to implement energy conservation
measures; and
(d) sharing of knowledge about energy conservation with the public through
educational institutions, and fostering of youth awareness.
72 | Energy Outlook and Energy Saving Potential in East Asia 2020
• Require energy labelling for electrical appliances. Annual growth of residential and
commercial (‘others’) electricity demand is projected to be higher than that of other
sectors. Compulsory energy labelling for electrical appliances could be an effective
management measure to generate energy saving.
• Prioritise the development of advanced hydro and coal thermal power technology. Hydro
and coal thermal power plants will be the major power generators up to 2050. Advanced
technologies for both resources should be prioritised for development.
• Prioritise renewable energy development. Renewable energy is important for energy
independence, energy security, and GHG emission abatement. A strategy and the
mechanisms to support renewable energy development must be established.
References
National Statistics Institute, Ministry of Planning, Cambodia (2018), General Population
Census of Cambodia. Phnom Penh.
National Statistics Institute, Ministry of Planning, Cambodia (2018), Cambodia Inter-
Censal Population Survey 2018 Final Report. Phnom Penh.
Ministry of Mines and Energy, Cambodia (2014), National Policy, Strategy and Action
PlanonEnergyEfficiencyinCambodia. Phnom Penh.
Electricity Authority of Cambodia (2018), Annual Report 2018. Phnom Penh.
Ministry of Mines and Energy, Cambodia (2020), Final Report for Cambodia Power
Development Master Plan 2020–2030. Phnom Penh.
World Bank (2018), World Development Indicator. Downloadable at [https://www.
worldbank.org/en/publication/wdr2018]. Accessed on 12 November
2020.