Embed Size (px)
Citation preview
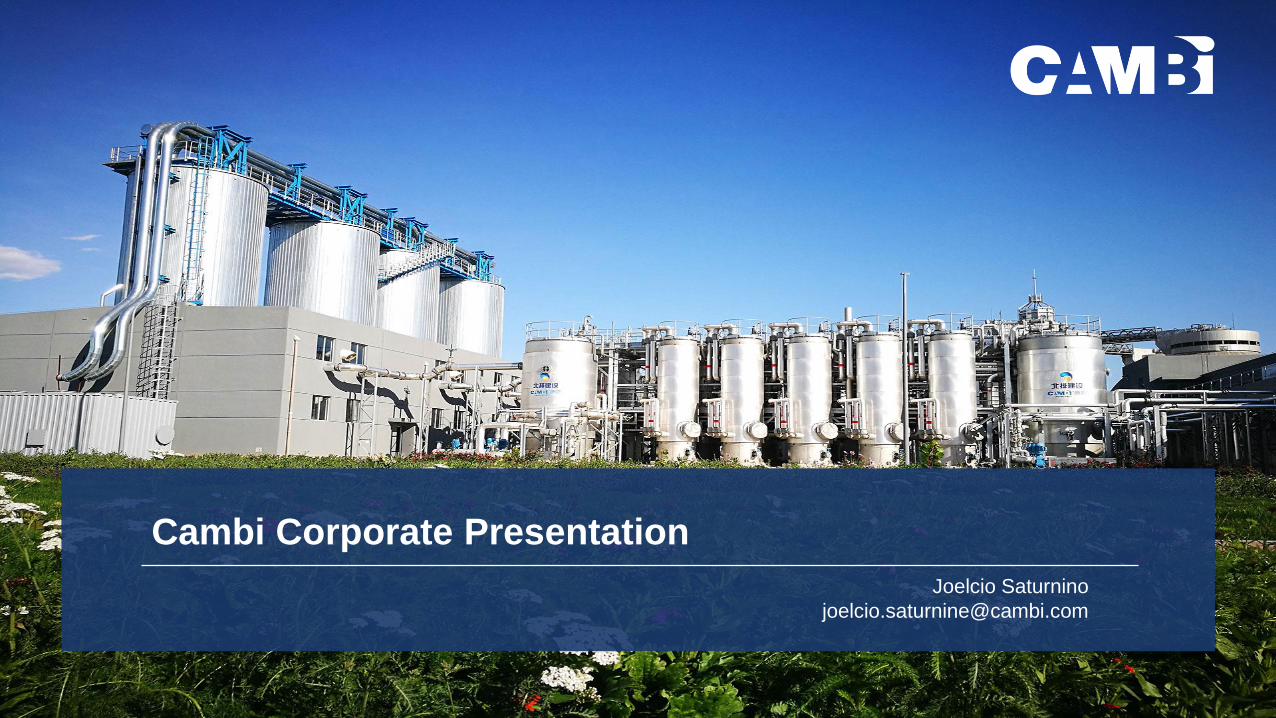
Slide 2
FROM WASTE TO WORTH USING ADVANCED ANAEROBIC DIGESTION
THE CAMBI SOLUTION TURNS
PROBLEMS INTO PRODUCTS:
FROM WASTE TO WORTH
Slide 3
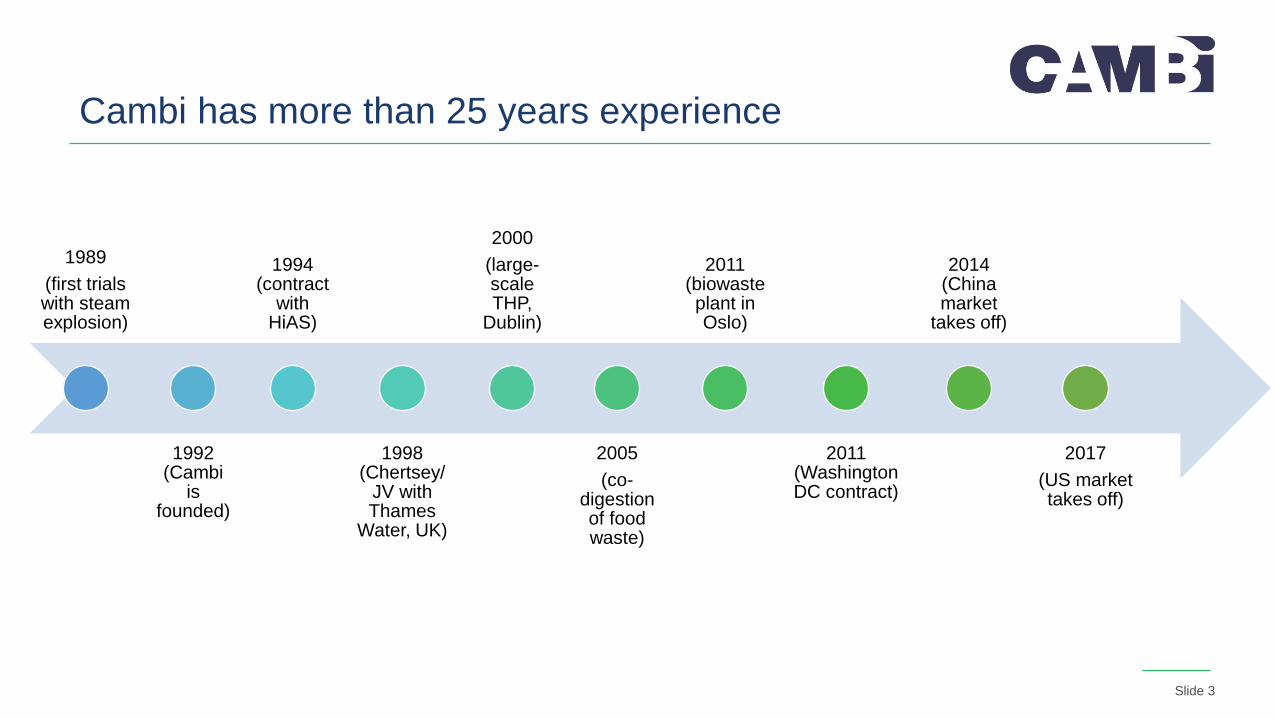
1989
(first trials with steam explosion)
1992 (Cambi
is founded)
1994 (contract
with HiAS)
1998 (Chertsey/
JV with Thames
Water, UK)
2000
(large-scale THP,
Dublin)
2005
(co-digestion of food waste)
2011 (biowaste plant in Oslo)
2011 (Washington DC contract)
2014 (China market
takes off)
2017
(US market takes off)
Cambi has more than 25 years experience
Slide 4
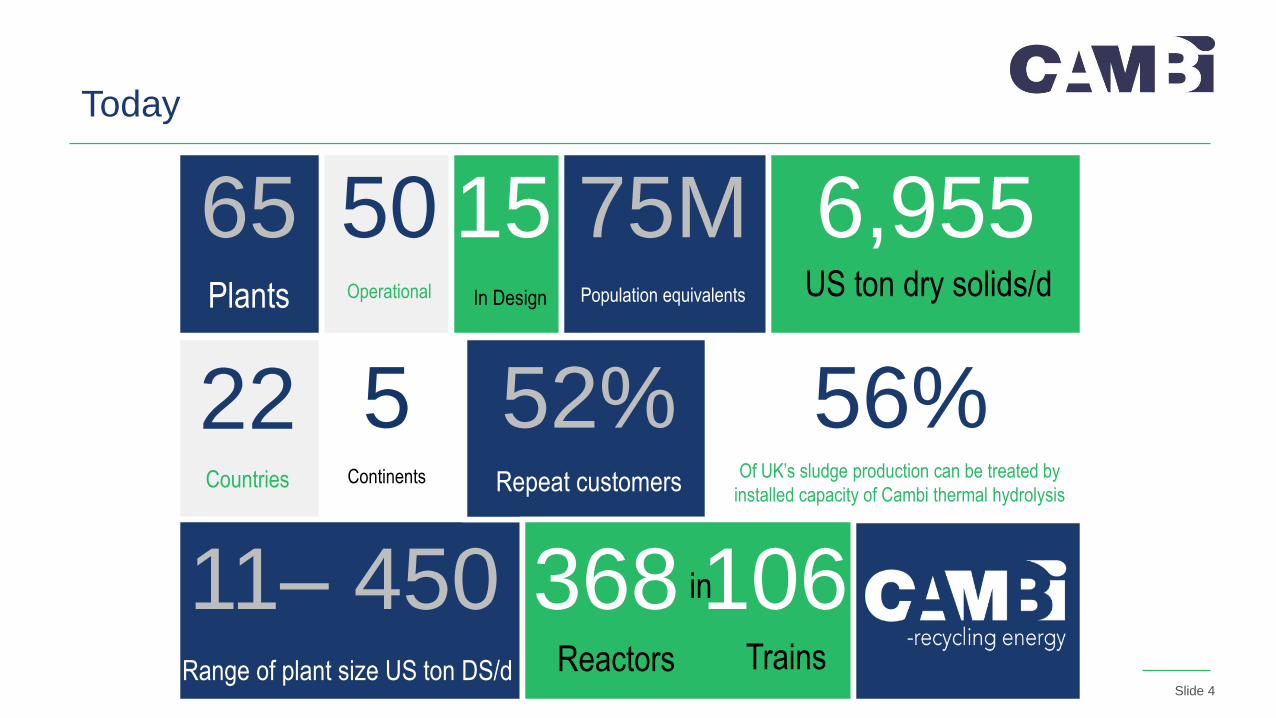
Today
65Plants
50Operational
15In Design
22Countries
5Continents
52%Repeat customers
11– 450 Range of plant size US ton DS/d
56%Of UK’s sludge production can be treated by
installed capacity of Cambi thermal hydrolysis
368Reactors
106Trains
6,955US ton dry solids/d
75MPopulation equivalents
in
Slide 5
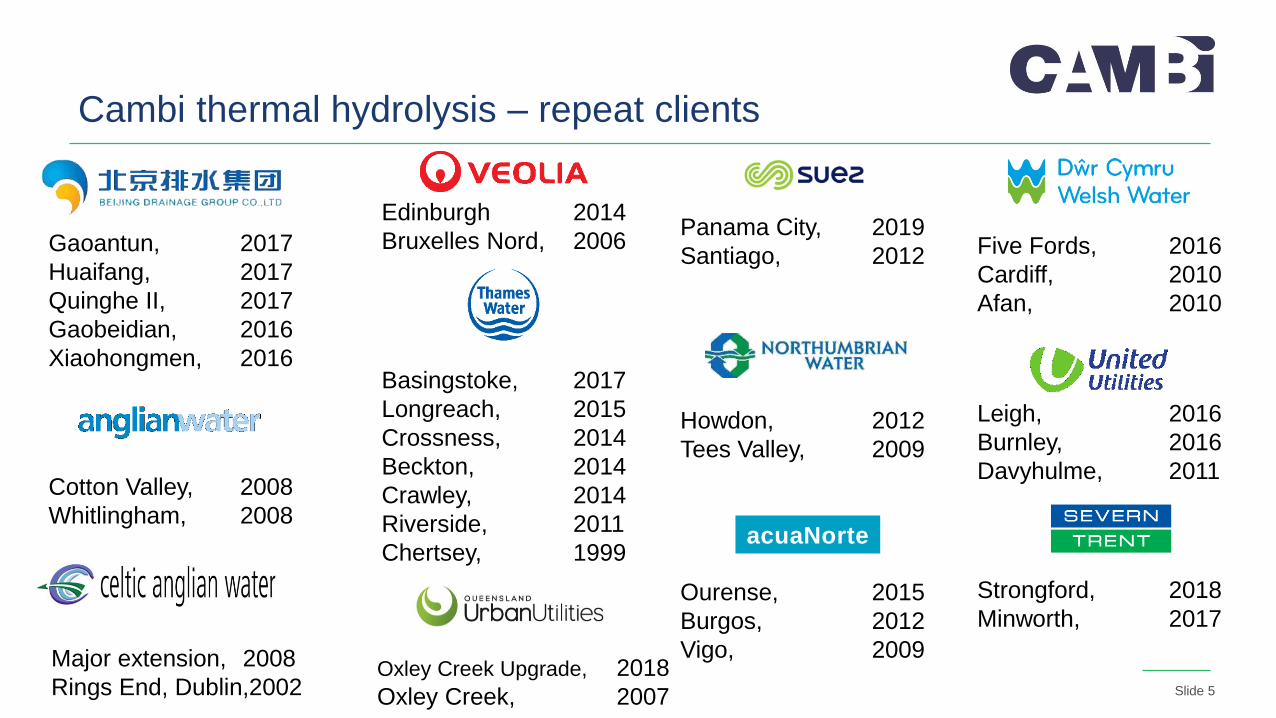
Gaoantun, 2017
Huaifang, 2017
Quinghe II, 2017
Gaobeidian, 2016
Xiaohongmen, 2016
Cambi thermal hydrolysis – repeat clients
Basingstoke, 2017
Longreach, 2015
Crossness, 2014
Beckton, 2014
Crawley, 2014
Riverside, 2011
Chertsey, 1999
Five Fords, 2016
Cardiff, 2010
Afan, 2010
Edinburgh 2014
Bruxelles Nord, 2006
Leigh, 2016
Burnley, 2016
Davyhulme, 2011
Panama City, 2019
Santiago, 2012
Cotton Valley, 2008
Whitlingham, 2008
Howdon, 2012
Tees Valley, 2009
Major extension, 2008
Rings End, Dublin,2002
Ourense, 2015
Burgos, 2012
Vigo, 2009
acuaNorte
Oxley Creek Upgrade, 2018
Oxley Creek, 2007
Strongford, 2018
Minworth, 2017

Slide 6
Today, thermal hydrolysis is a standard technology
ETE
Bar
ue
ri, S
P,
BR
(1
2 m
³/s)
50 t DS/d
100 t DS/d
150 t DS/d
200 t DS/d
250 t DS/d
300 t DS/d
350 t DS/d
400 t DS/d
Slide 7
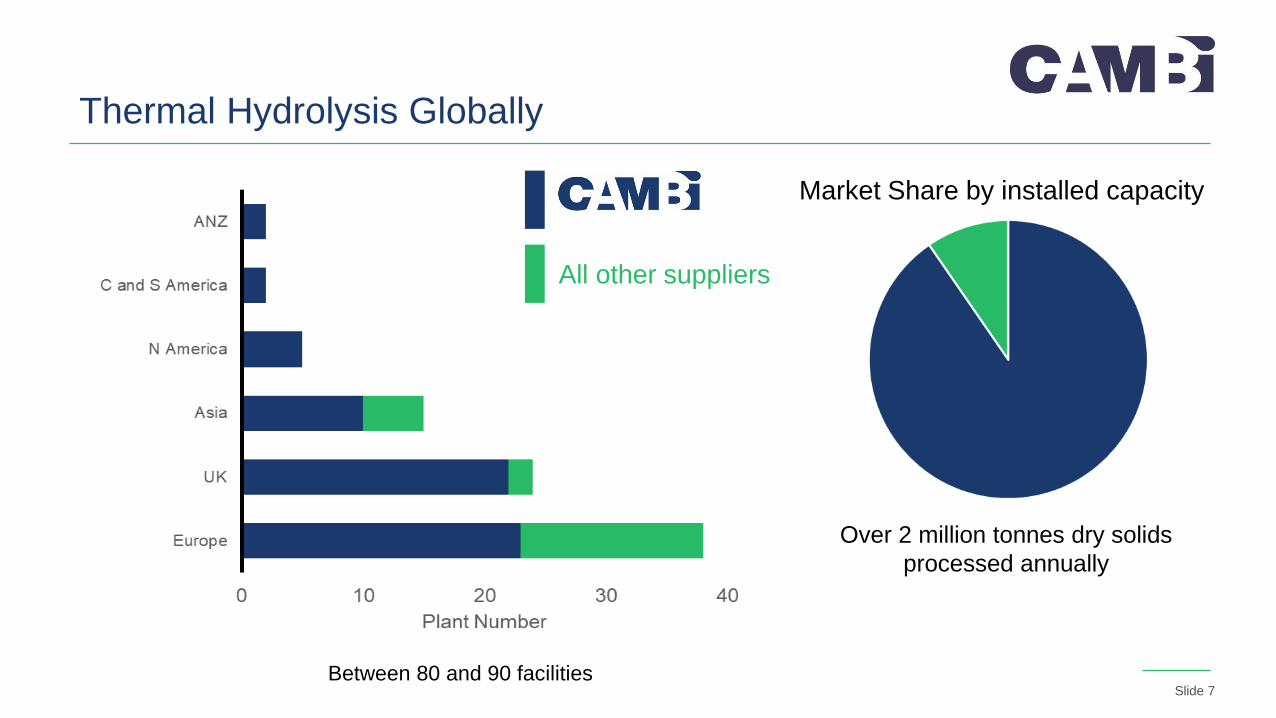
Thermal Hydrolysis Globally
All other suppliers
Over 2 million tonnes dry solids
processed annually
Market Share by installed capacity
Between 80 and 90 facilities

Slide 8
SEOUL – DUBLIN – OSLO – BRUSSELS – ATHENS
SANTIAGO DE CHILE – EDINBURGH – CARDIFF – AND 20+ OTHER CITIES
CAMBI SERVES A POPULATION OF MORE THAN 70 MILLION PEOPLE WORLD WIDE, > 20 YEARS
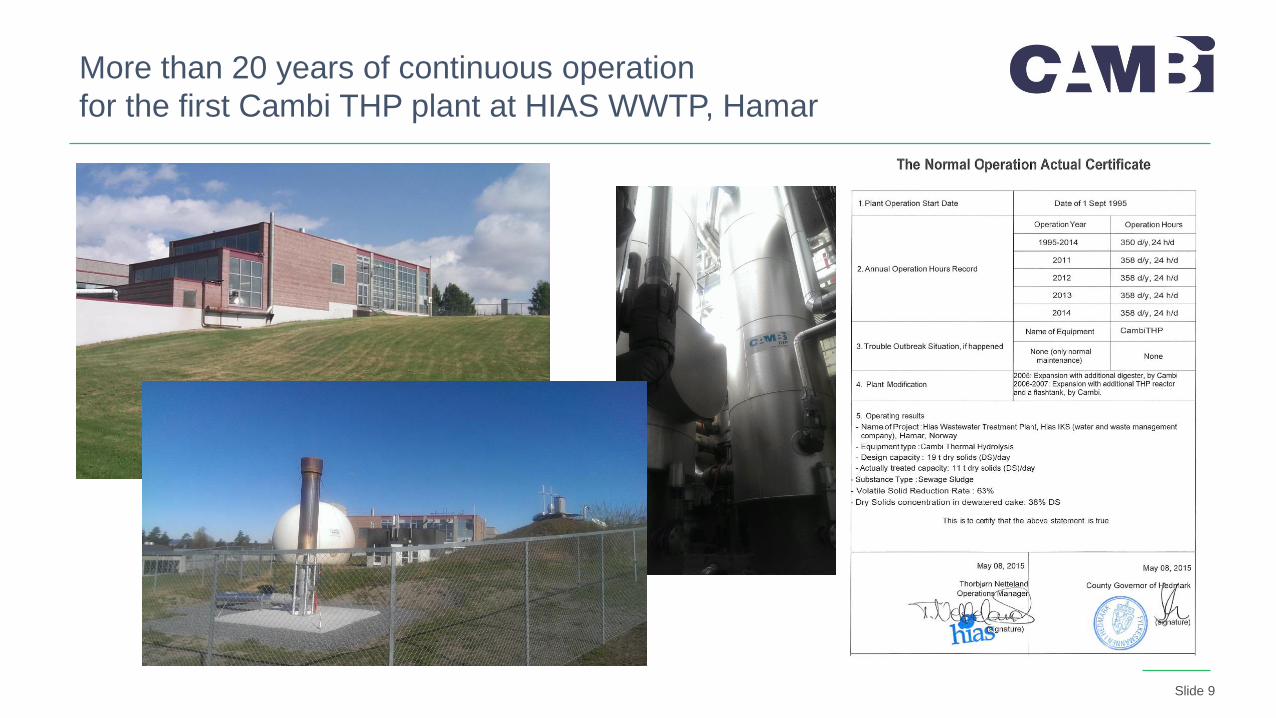
Slide 9
More than 20 years of continuous operation
for the first Cambi THP plant at HIAS WWTP, Hamar
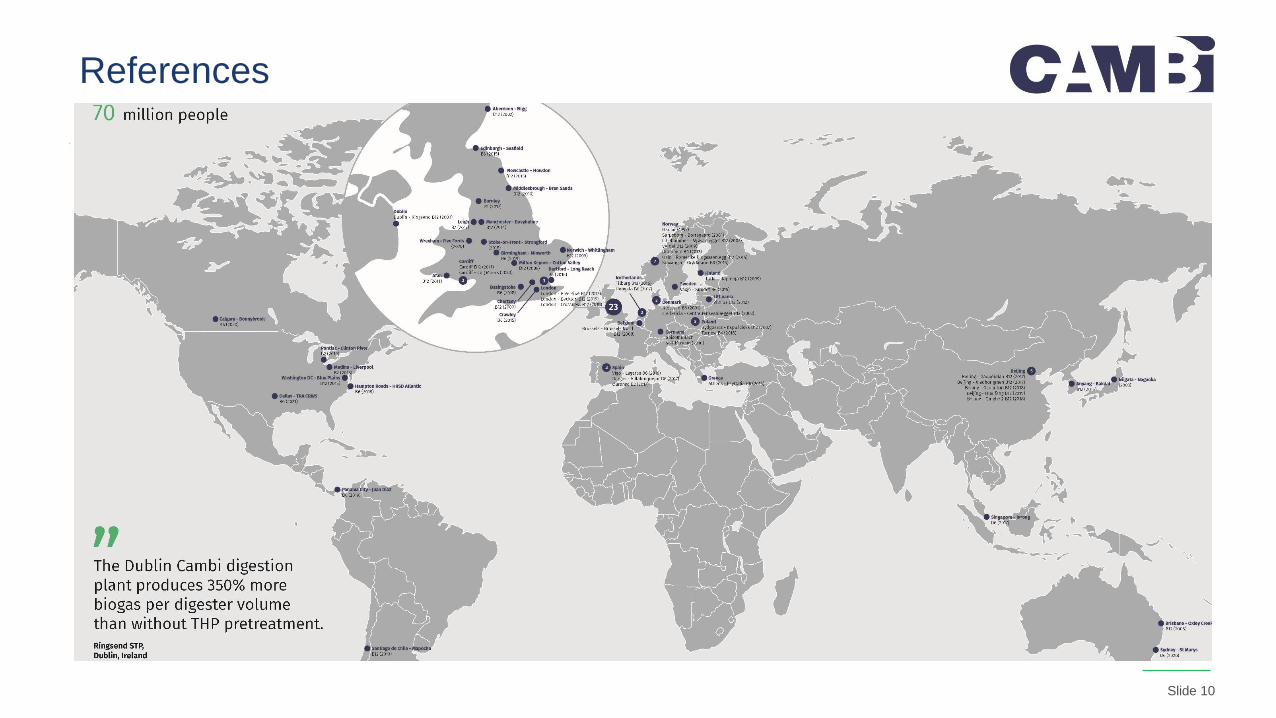
Slide 10
References
Slide 11
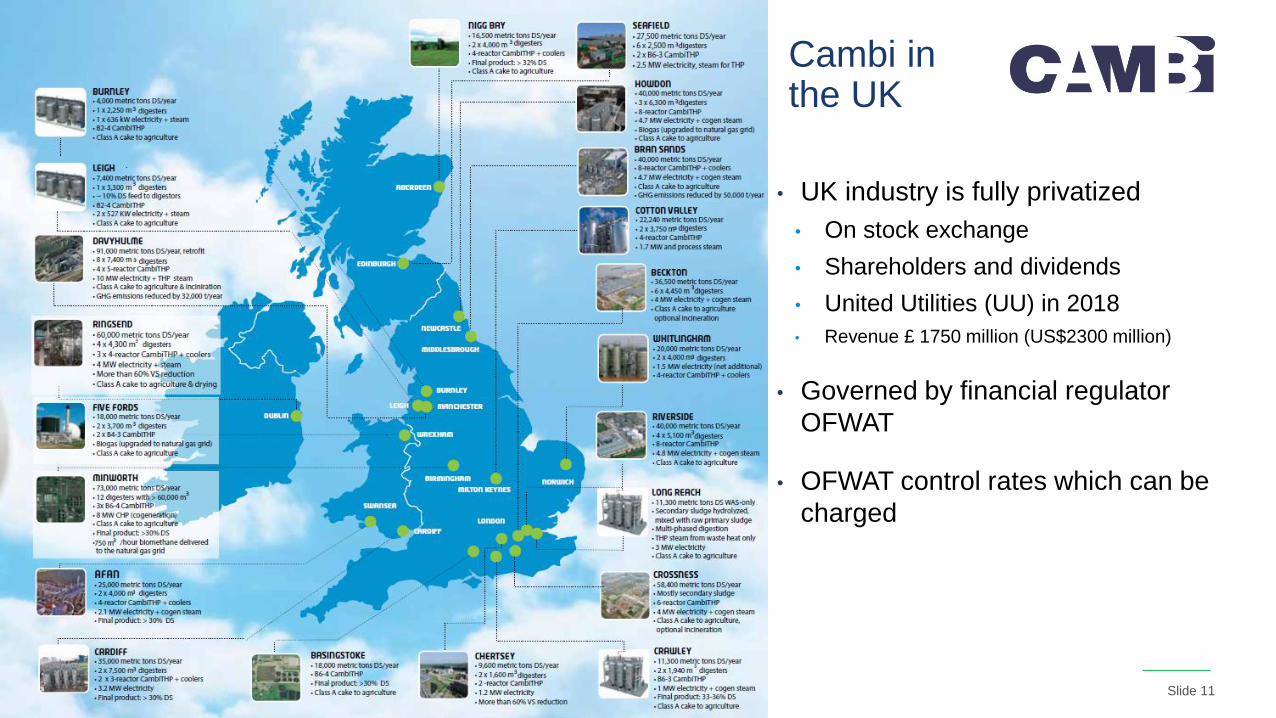
• UK industry is fully privatized
• On stock exchange
• Shareholders and dividends
• United Utilities (UU) in 2018
• Revenue £ 1750 million (US$2300 million)
• Governed by financial regulator
OFWAT
• OFWAT control rates which can be
charged
Cambi in the UK
Slide 12
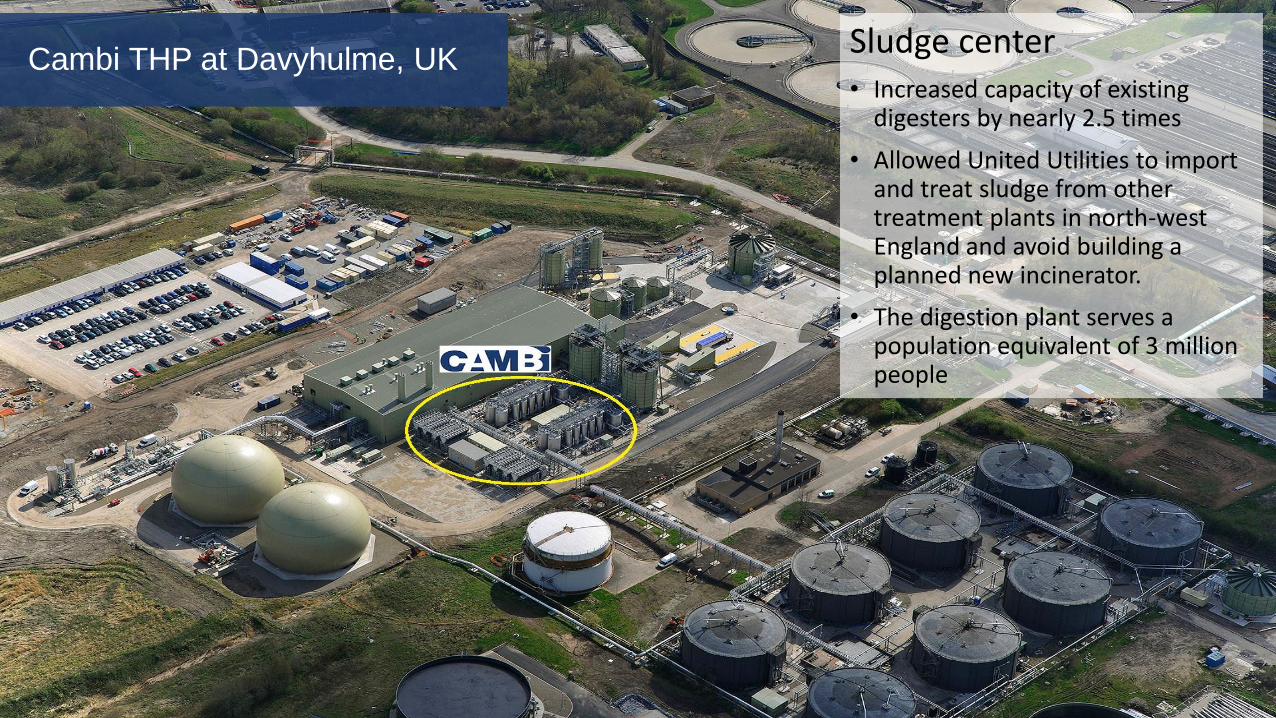
Cambi THP at Davyhulme, UKSludge center• Increased capacity of existing
digesters by nearly 2.5 times
• Allowed United Utilities to import and treat sludge from other treatment plants in north-west England and avoid building a planned new incinerator.
• The digestion plant serves a population equivalent of 3 million people

Slide 13
Cambi THP at Blue Plains WWTP in Washington DC (USA) – 4 million p.e.
• 4 digesters = 58 100 m3 (1/3 of traditional)
• Saved $200 million CAPEX vs traditional
• Saved >$20 mill in OPEX/year
• Generate 13 MW (net 10 MW) of clean, renewable power from the CHP
• PLANNED TRADITIONAL DESIGN• CAMBI SOLUTION
• 8 digesters = 174 000 m3 designed originally
CANCELLED TRADITIONAL DESIGN
NEW SOLUTION
CAMBI PROCESS
Slide 14
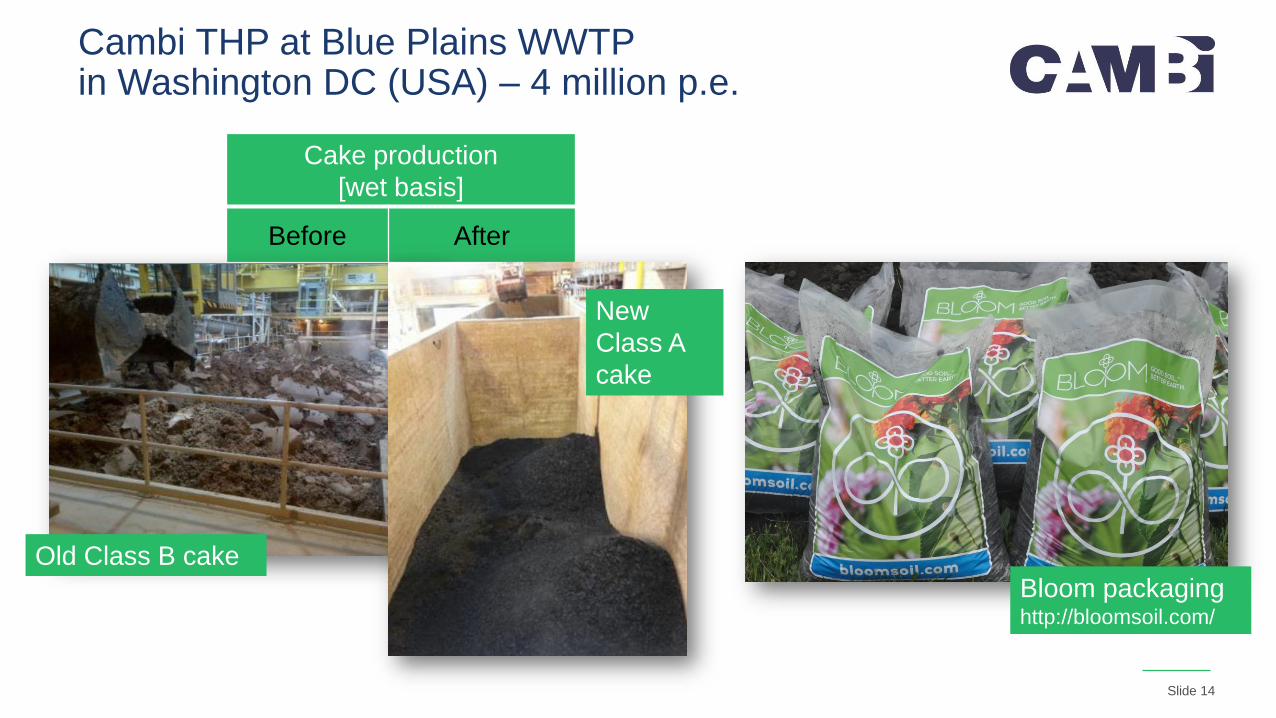
Cake production
[wet basis]
Before After
Bloom packaginghttp://bloomsoil.com/
Cambi THP at Blue Plains WWTP in Washington DC (USA) – 4 million p.e.
New
Class A
cake
Old Class B cake

Slide 15
FIVE CAMBI PLANTS IN BEIJING 4.2 million m3/d = 48,6 m3/s , 6000 t of wet sludge/day
GAOANTUN WWTP HUAIFANG WWTPGAOBEIDIAN WWTP
XIAOHONGMEN WWTP QINGHE II WWTP

Slide 16
Beijing Drainage Group (BDG) for Huaifang Water Reclamation Plant (HWRP) project for winning the IWA Gold Prize for category Exceptional Project Execution and Delivery at the International Water Association - World Water Congress 2018 at Tokyo – Japan. (16-21, September, 2018)
Madam Lin, the Chairman of BDG group: “The success of this award, belongs to BDG and Cambi'scooperation, we thank the two companies for their collaborative efforts to work together”.
FIVE CAMBI PLANTS IN BEIJING 4.2 million m3/d = 48,6 m3/s , 6000 t of wet sludge/day
Slide 17
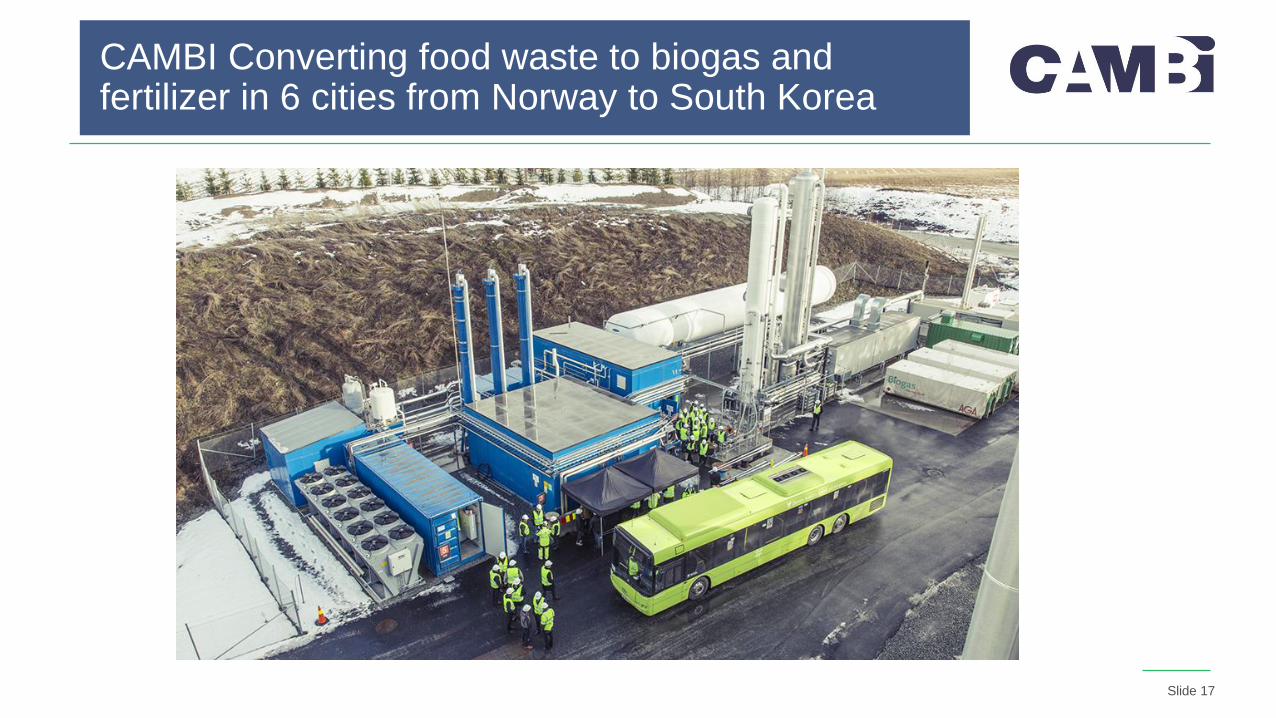
CAMBI Converting food waste to biogas and fertilizer in 6 cities from Norway to South Korea
Slide 18
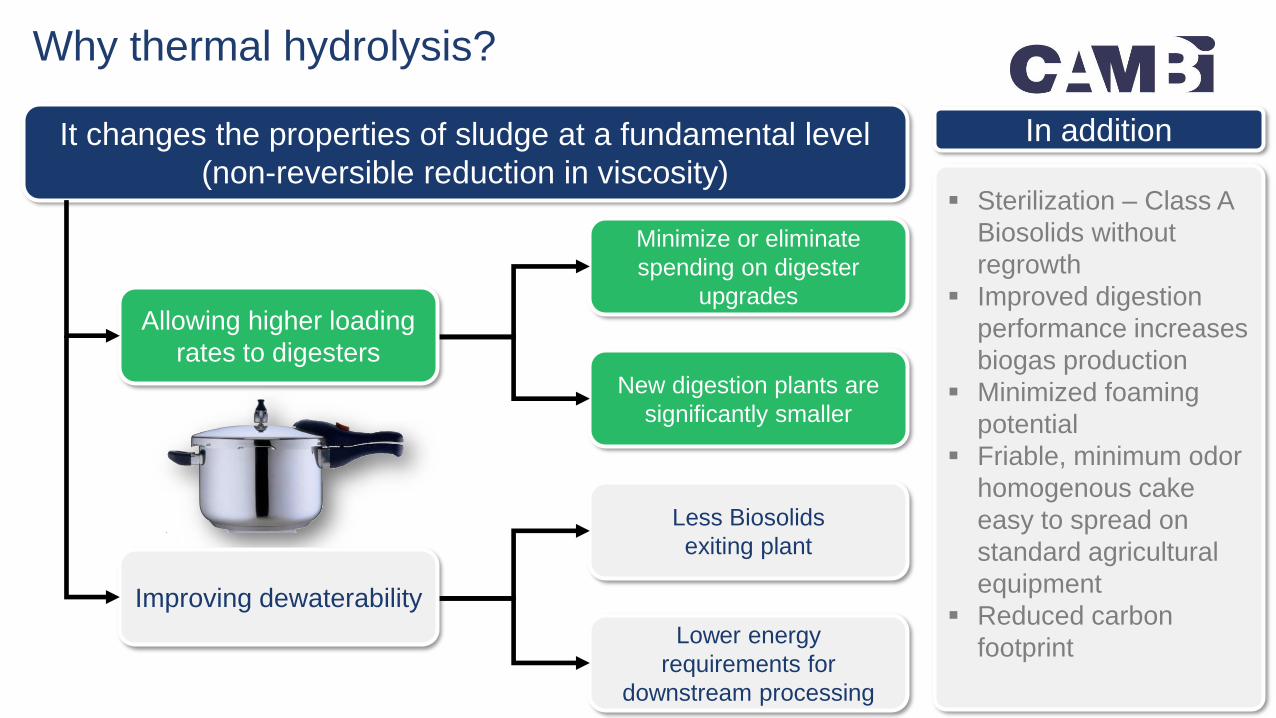
Why thermal hydrolysis?
It changes the properties of sludge at a fundamental level
(non-reversible reduction in viscosity)
Minimize or eliminate
spending on digester
upgrades
New digestion plants are
significantly smaller
Less Biosolids
exiting plant
Lower energy
requirements for
downstream processing
Improving dewaterability
Allowing higher loading
rates to digesters
In addition
Sterilization – Class A
Biosolids without
regrowth
Improved digestion
performance increases
biogas production
Minimized foaming
potential
Friable, minimum odor
homogenous cake
easy to spread on
standard agricultural
equipment
Reduced carbon
footprint

Slide 19
CAMBI
Where is CAMBI in a wwtp ?
CAMBI Solutions
steam
CAMBI Thermal Hydrolysis Process
Source: World Resources Institute, 2017
Slide 20
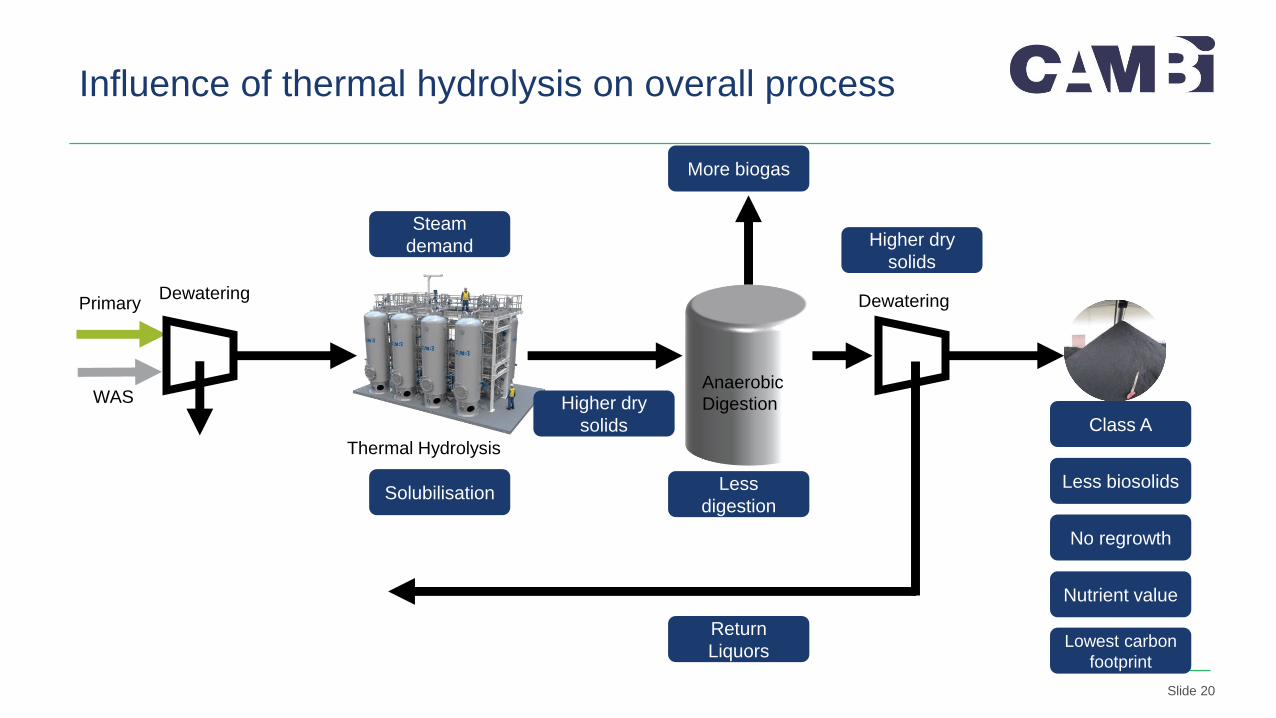
Influence of thermal hydrolysis on overall process
Primary
WAS
Thermal Hydrolysis
DewateringDewatering
Steam
demand
Class A
Less biosolids
No regrowth
Nutrient value
Return
Liquors
Less
digestion
Anaerobic
DigestionHigher dry
solids
More biogas
Higher dry
solids
Solubilisation
Lowest carbon
footprint
Slide 21
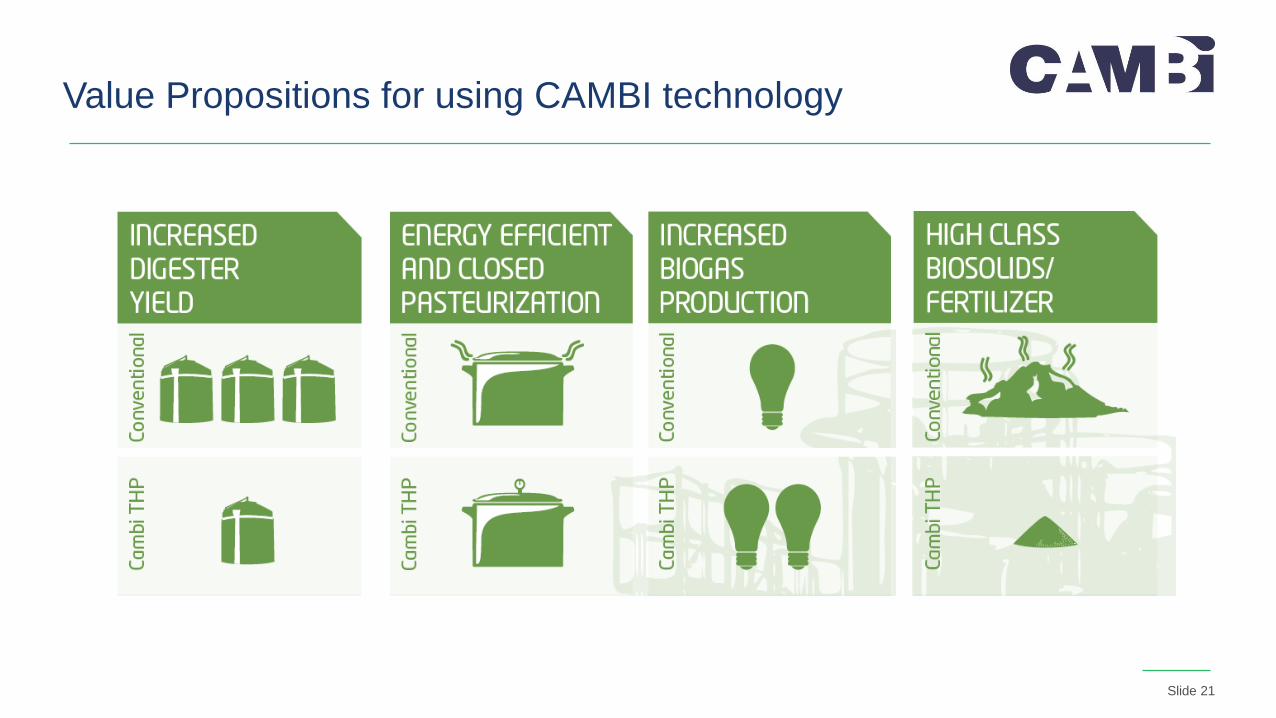
Value Propositions for using CAMBI technology
Slide 22
Reduce carbonfootprint
Slide 23
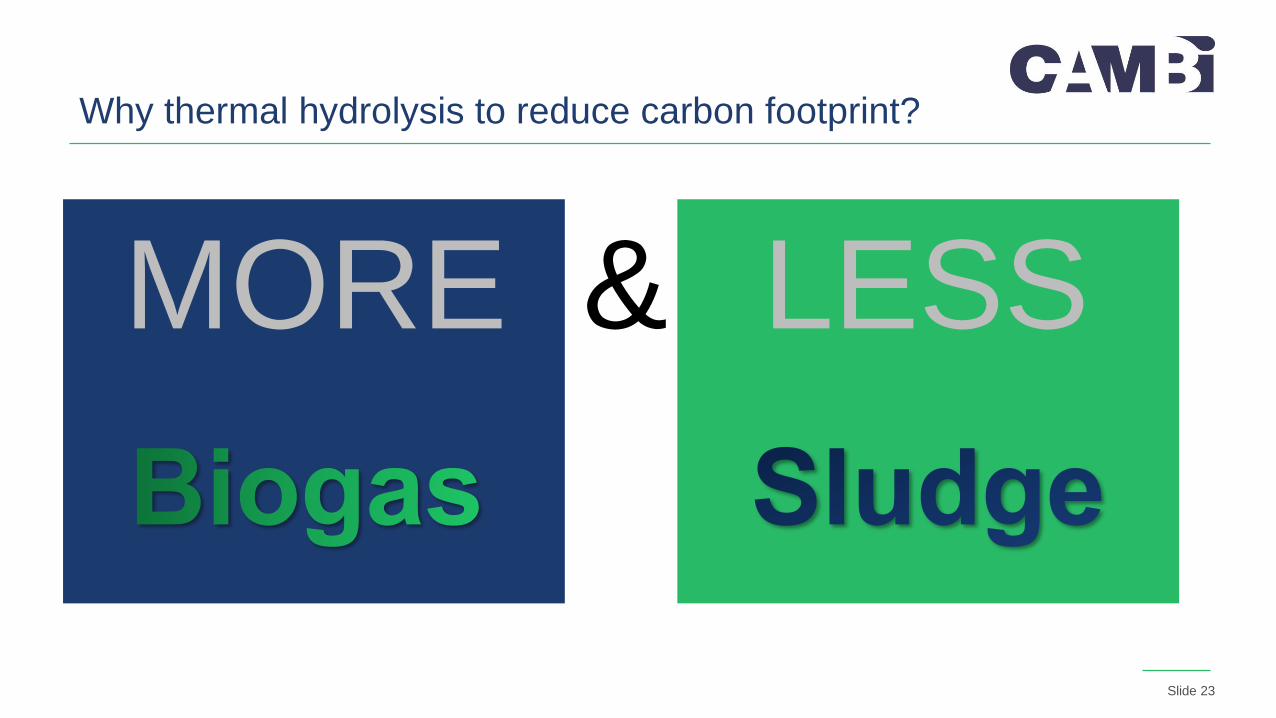
Why thermal hydrolysis to reduce carbon footprint?
MORE LESS&
Slide 24
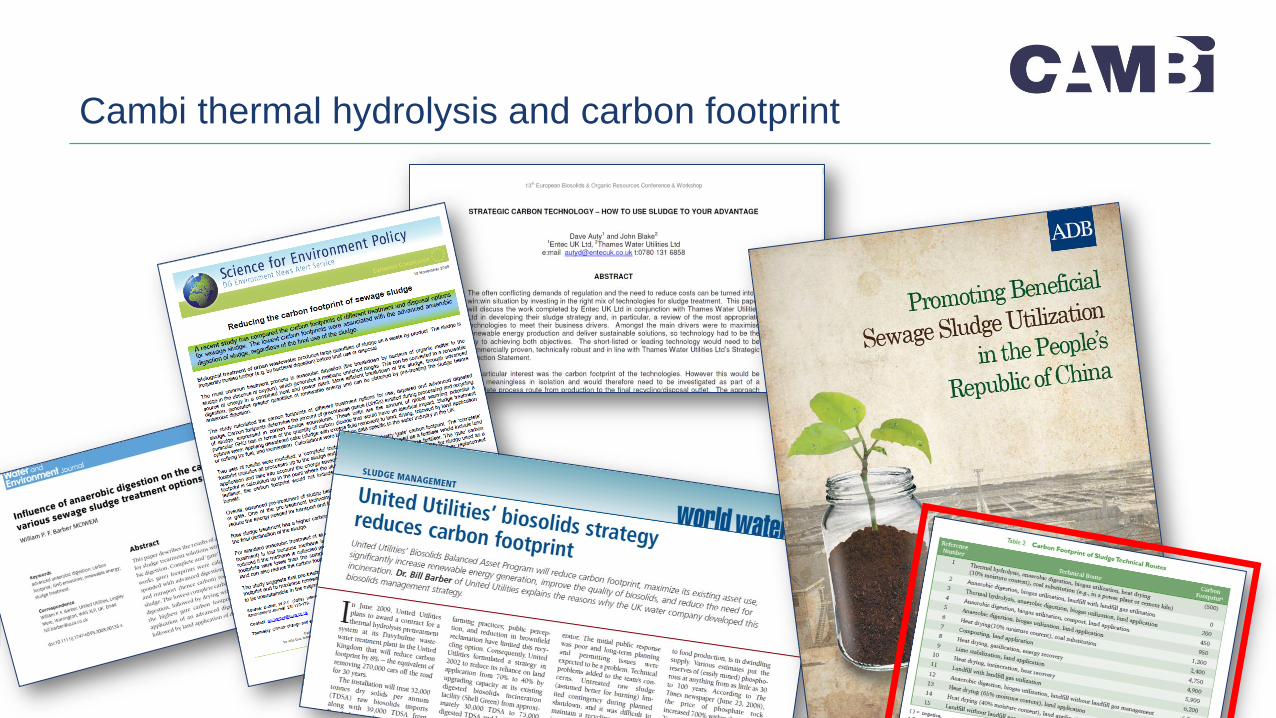
Cambi thermal hydrolysis and carbon footprint
Slide 25
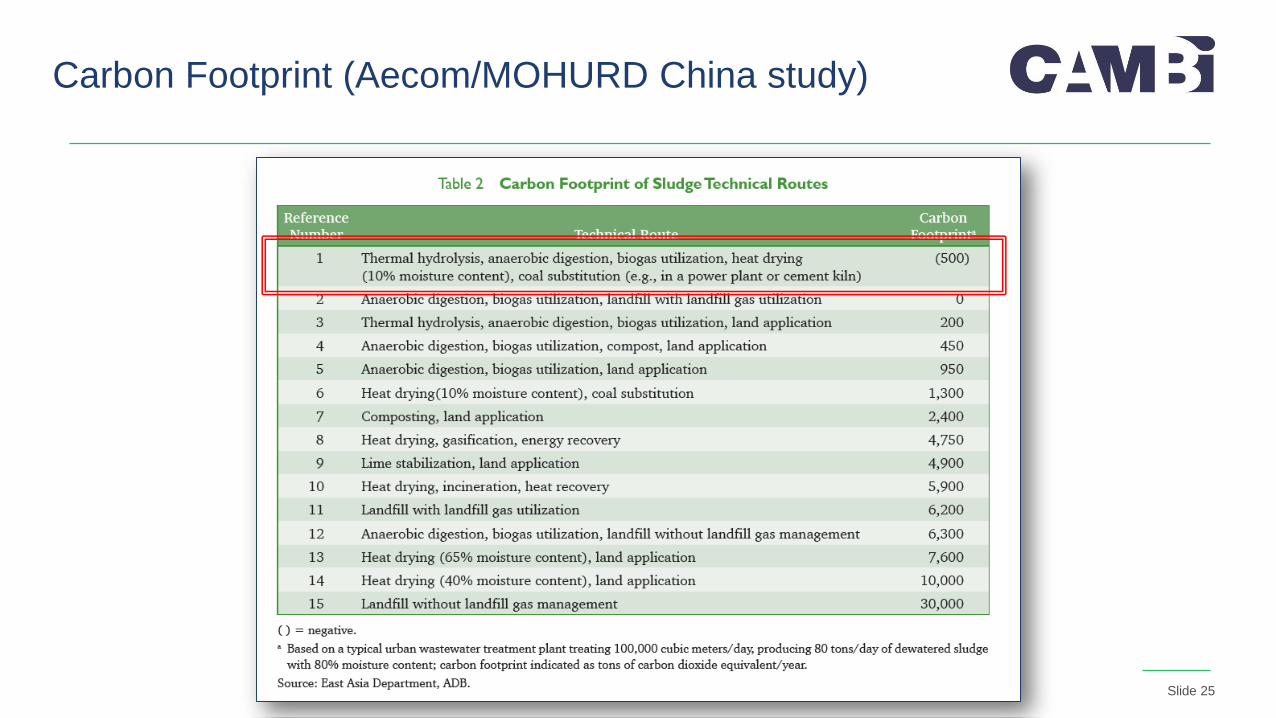
Carbon Footprint (Aecom/MOHURD China study)

Slide 26
Impact on carbon footprint
Highest Volatile
solids destruction
Better dewaterability
Better quality of
product
More renewable
energy
Less sludge
Less Transport and
downstream
processing
Less water in
biosolids cake
Lower energy
requirements for
thermal systems
Less sludgeLess transport to
land
Less land required
for reuseLess transport
Low
est
op
erat
ing
carb
on
foo
tpri
nt
Slide 27
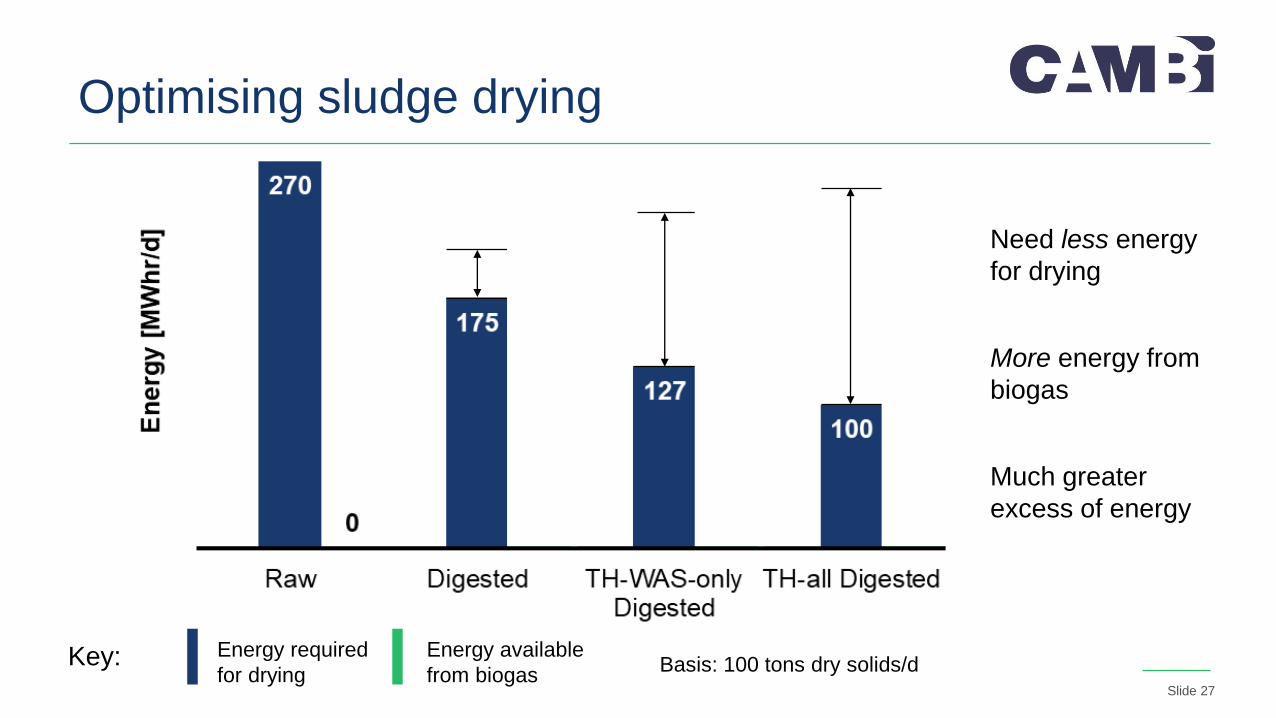
Key:
Optimising sludge drying
Energy required
for drying
Energy available
from biogas
Need less energy
for drying
More energy from
biogas
Much greater
excess of energy
Basis: 100 tons dry solids/d
Slide 28
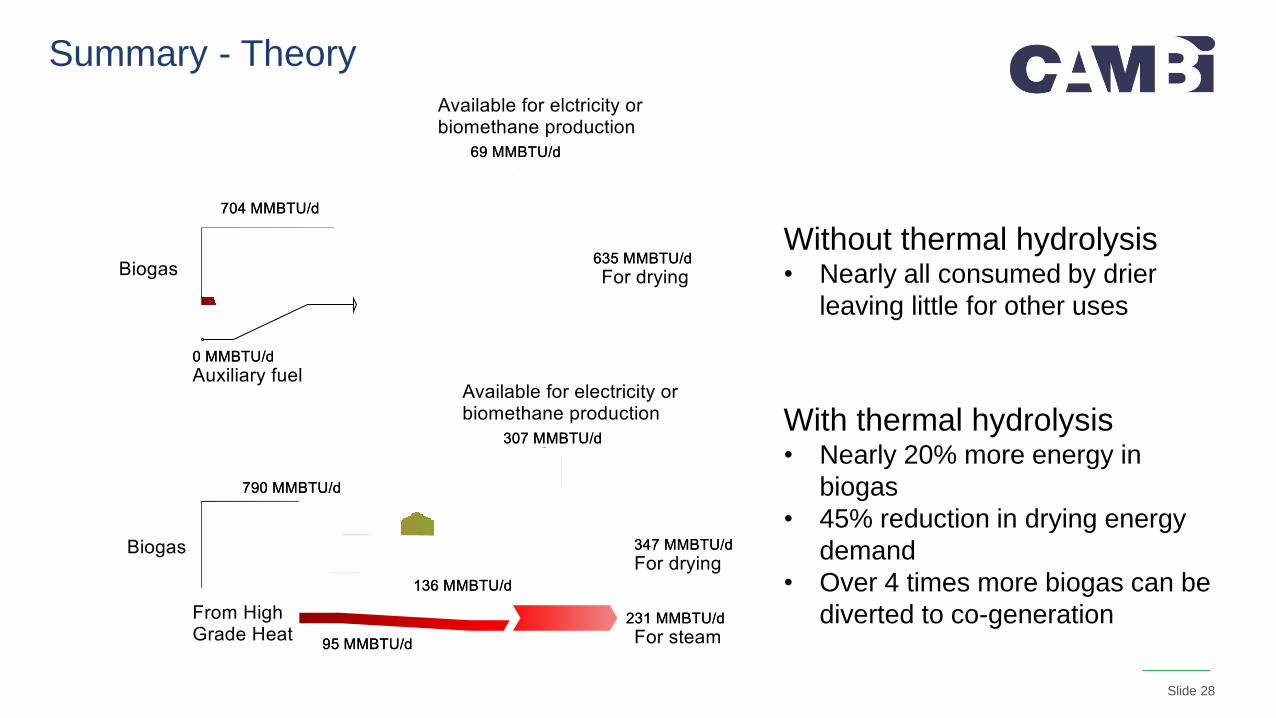
Summary - Theory
Without thermal hydrolysis• Nearly all consumed by drier
leaving little for other uses
With thermal hydrolysis• Nearly 20% more energy in
biogas
• 45% reduction in drying energy
demand
• Over 4 times more biogas can be
diverted to co-generation
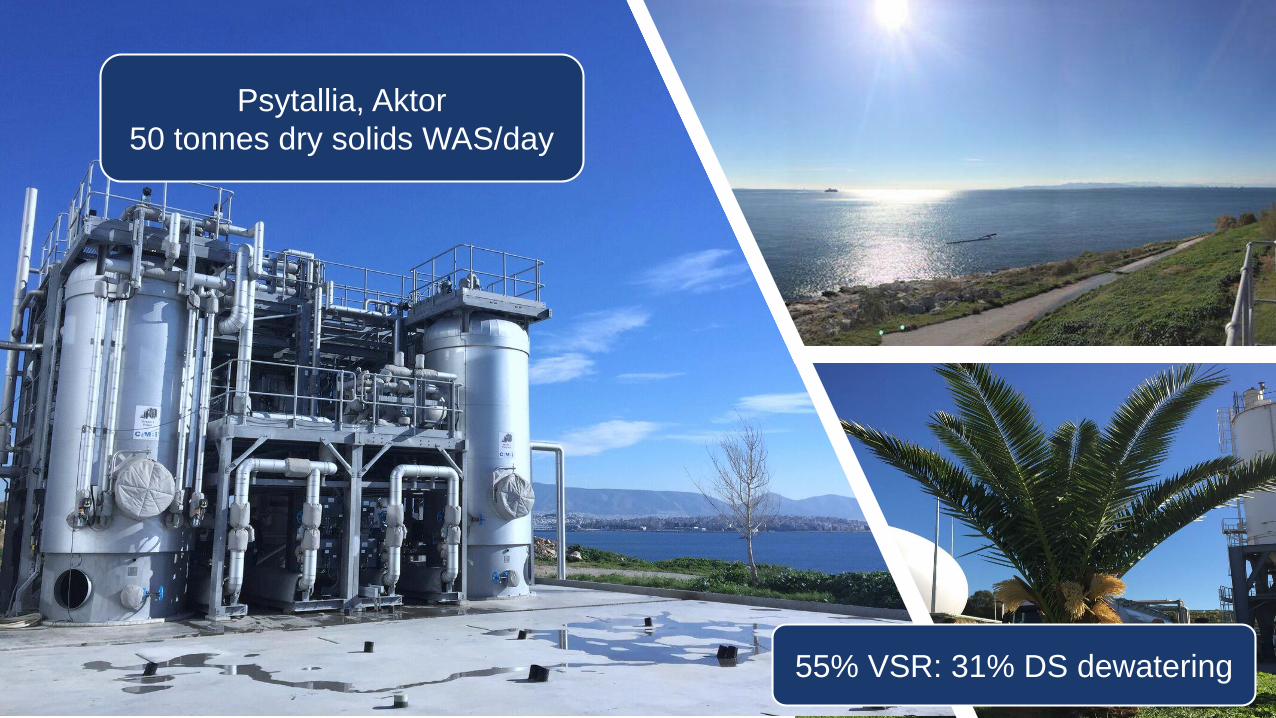
Psytallia, Aktor
50 tonnes dry solids WAS/day
55% VSR: 31% DS dewatering
Slide 30
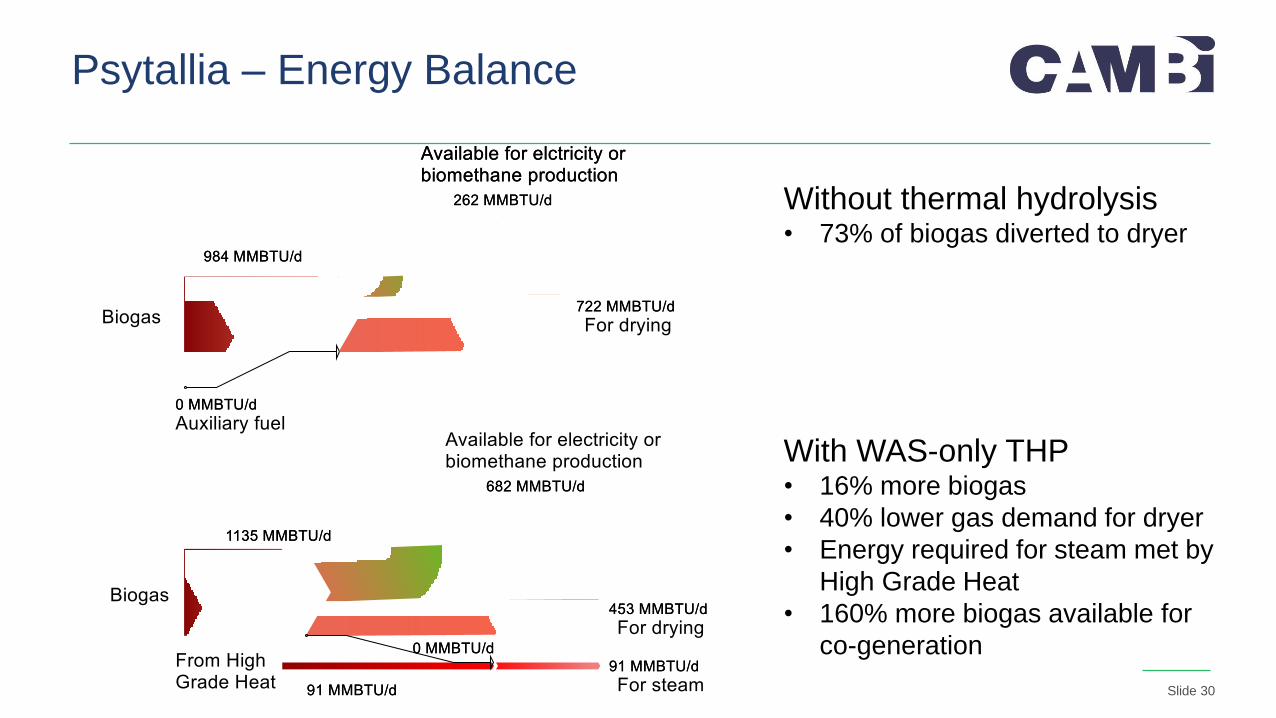
Psytallia – Energy Balance
Without thermal hydrolysis• 73% of biogas diverted to dryer
With WAS-only THP• 16% more biogas
• 40% lower gas demand for dryer
• Energy required for steam met by
High Grade Heat
• 160% more biogas available for
co-generation
Slide 31
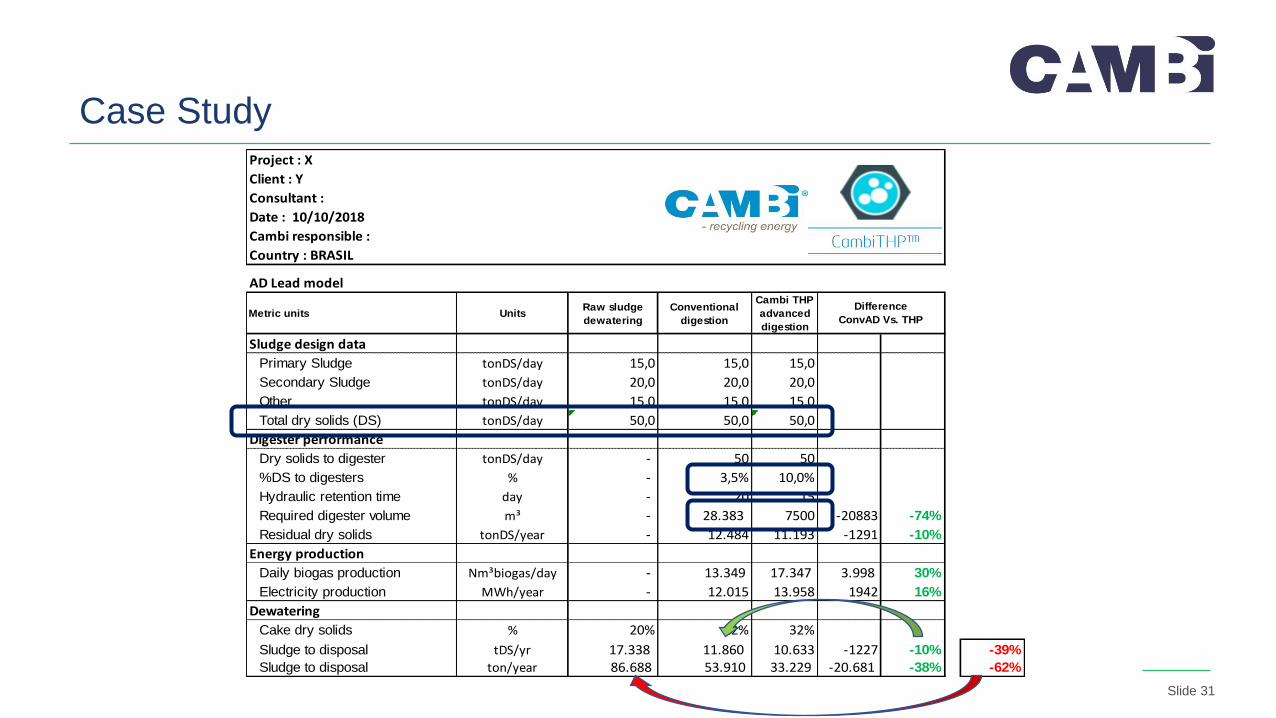
Project : X
Client : Y
Consultant :
Date : 10/10/2018
Cambi responsible :
Country : BRASIL
AD Lead model
Metric units UnitsRaw sludge
dewatering
Conventional
digestion
Cambi THP
advanced
digestion
Sludge design data
Primary Sludge tonDS/day 15,0 15,0 15,0
Secondary Sludge tonDS/day 20,0 20,0 20,0
Other tonDS/day 15,0 15,0 15,0
Total dry solids (DS) tonDS/day 50,0 50,0 50,0
Digester performance
Dry solids to digester tonDS/day - 50 50
%DS to digesters % - 3,5% 10,0%
Hydraulic retention time day - 20 15
Required digester volume m³ - 28.383 7500 -20883 -74%
Residual dry solids tonDS/year - 12.484 11.193 -1291 -10%
Energy production
Daily biogas production Nm³biogas/day - 13.349 17.347 3.998 30%
Electricity production MWh/year - 12.015 13.958 1942 16%
Dewatering
Cake dry solids % 20% 22% 32%
Sludge to disposal tDS/yr 17.338 11.860 10.633 -1227 -10% -39%
Sludge to disposal ton/year 86.688 53.910 33.229 -20.681 -38% -62%
Difference
ConvAD Vs. THP
Case Study
Slide 32
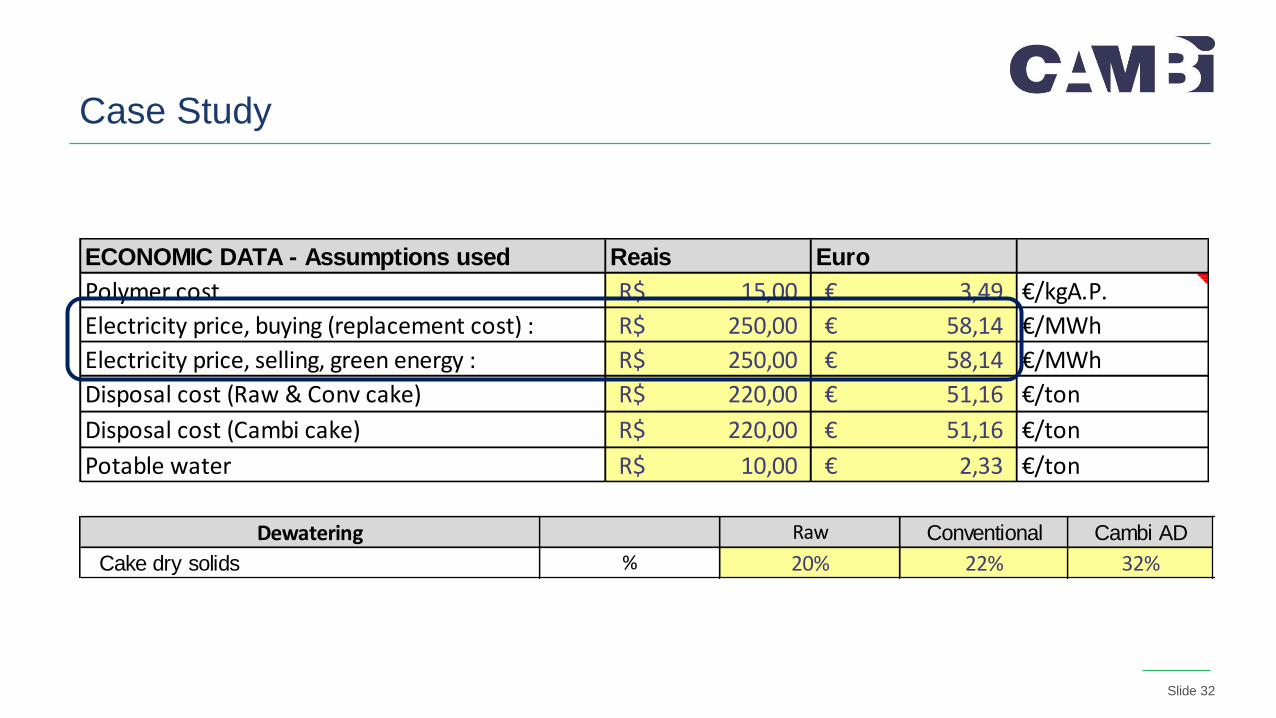
ECONOMIC DATA - Assumptions used Reais Euro
Polymer cost 15,00R$ 3,49€ €/kgA.P.
Electricity price, buying (replacement cost) : 250,00R$ 58,14€ €/MWh
Electricity price, selling, green energy : 250,00R$ 58,14€ €/MWh
Disposal cost (Raw & Conv cake) 220,00R$ 51,16€ €/ton
Disposal cost (Cambi cake) 220,00R$ 51,16€ €/ton
Potable water 10,00R$ 2,33€ €/ton
Case Study
Dewatering Raw Conventional Cambi AD
Cake dry solids % 20% 22% 32%
Slide 33
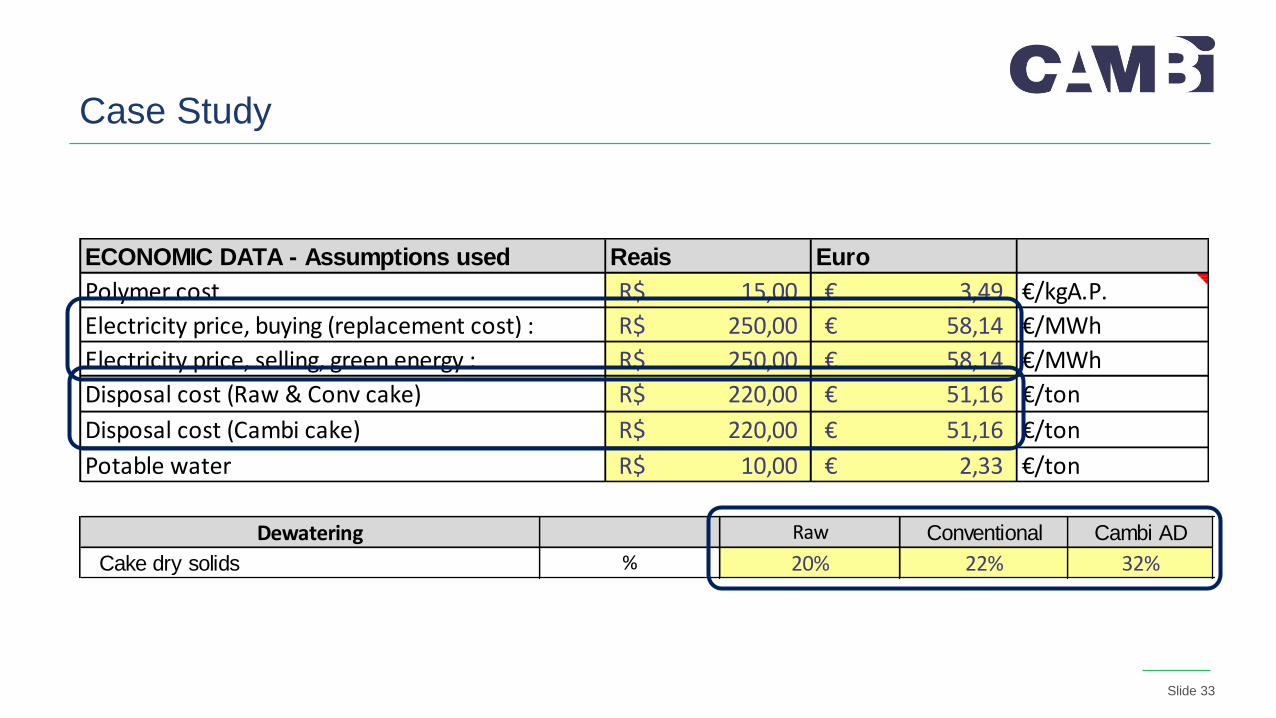
ECONOMIC DATA - Assumptions used Reais Euro
Polymer cost 15,00R$ 3,49€ €/kgA.P.
Electricity price, buying (replacement cost) : 250,00R$ 58,14€ €/MWh
Electricity price, selling, green energy : 250,00R$ 58,14€ €/MWh
Disposal cost (Raw & Conv cake) 220,00R$ 51,16€ €/ton
Disposal cost (Cambi cake) 220,00R$ 51,16€ €/ton
Potable water 10,00R$ 2,33€ €/ton
Case Study
Dewatering Raw Conventional Cambi AD
Cake dry solids % 20% 22% 32%
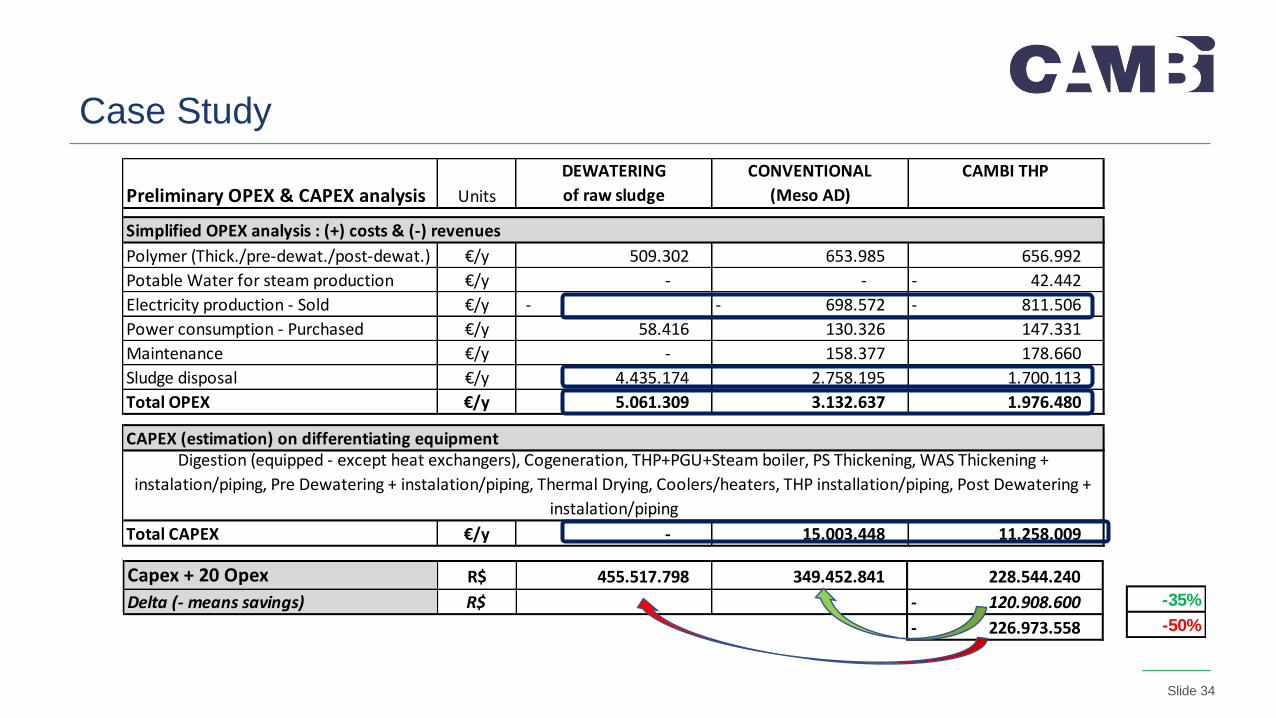
Slide 34
Preliminary OPEX & CAPEX analysis Units
DEWATERING
of raw sludge
CONVENTIONAL
(Meso AD)
CAMBI THP
Polymer (Thick./pre-dewat./post-dewat.) €/y 509.302 653.985 656.992
Potable Water for steam production €/y - - 42.442 -
Electricity production - Sold €/y - 698.572 - 811.506 -
Power consumption - Purchased €/y 58.416 130.326 147.331
Maintenance €/y - 158.377 178.660
Sludge disposal €/y 4.435.174 2.758.195 1.700.113
Total OPEX €/y 5.061.309 3.132.637 1.976.480
Total CAPEX €/y - 15.003.448 11.258.009
Capex + 20 Opex € 101.226.177 77.656.187 50.787.609
Delta (- means savings) € 26.868.578 - -35%
50.438.568 - -50%
Simplified OPEX analysis : (+) costs & (-) revenues
CAPEX (estimation) on differentiating equipmentDigestion (equipped - except heat exchangers), Cogeneration, THP+PGU+Steam boiler, PS Thickening, WAS Thickening +
instalation/piping, Pre Dewatering + instalation/piping, Thermal Drying, Coolers/heaters, THP installation/piping, Post Dewatering +
instalation/piping
Case Study
Capex + 20 Opex R$ 455.517.798 349.452.841 228.544.240
Delta (- means savings) R$ 120.908.600 -
226.973.558 -

Slide 35
Electric Energy or upgrade to Biomethane
Dry sludge using waste energy from
CHP
Pathogen free solids to
agriculture
Carbon footprint credits
Case Study
To consider:
Slide 36
Power from the People – with CAMBITHANK YOU FOR YOUR ATTENTION QUESTIONS?
Follow Us on www.cambi.comCambi Academy