Embed Size (px)
Citation preview
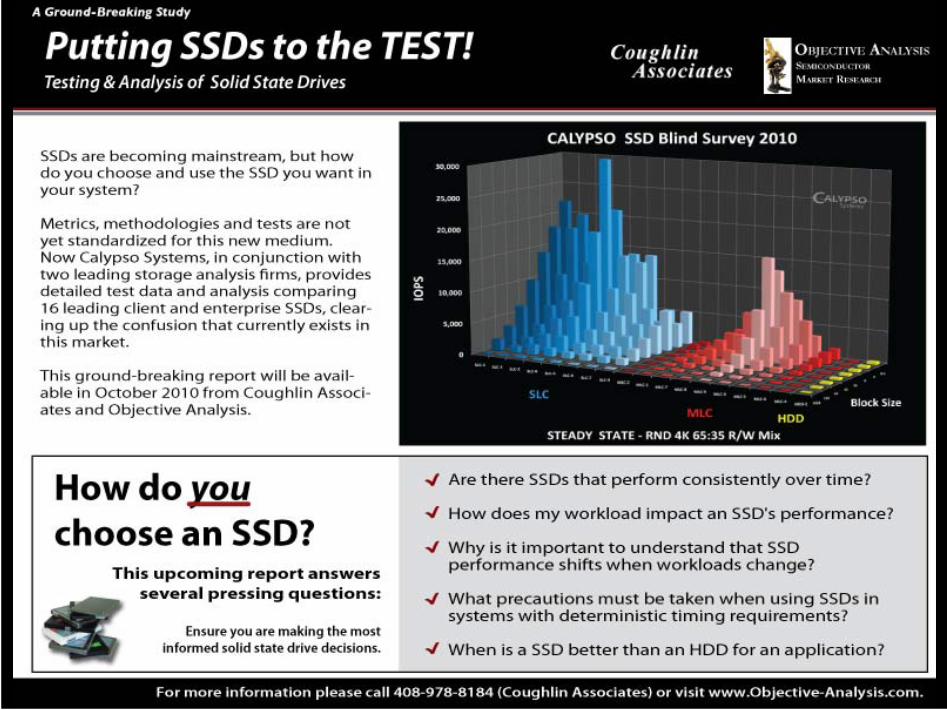
Calypso Blind Survey 2010
SSD Performance Comparison MLC, SLC & HDD
Eden Kim, CEO Dr. Easen Ho, CTO
Calypso Systems, Inc.
SNIA SDC Santa Clara, CA 22 September 2010
1
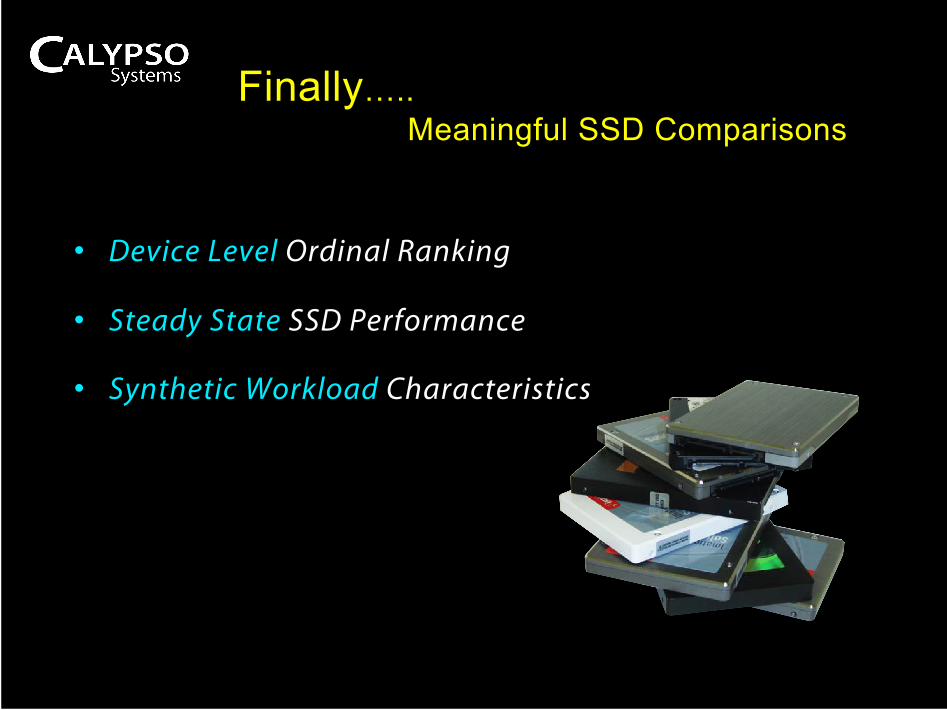
Finally….. Meaningful SSD Comparisons
Santa Clara, CA August 2010 2
• Device Level Ordinal Ranking
• Steady State SSD Performance
• Synthetic Workload Characteristics

Santa Clara, CA August 2010 3
Table of Contents
Topics for Today
Santa Clara, CA August 2010 4
• SSS TWG Performance Test Spec – Overview
• PTS Methodology
• Calypso Blind Survey
• Reference Test Environment
• Group Blinded Data
• Enterprise SSD v HDD
• Take Aways
Santa Clara, CA August 2010 5
SNIA PTS TEST SPEC
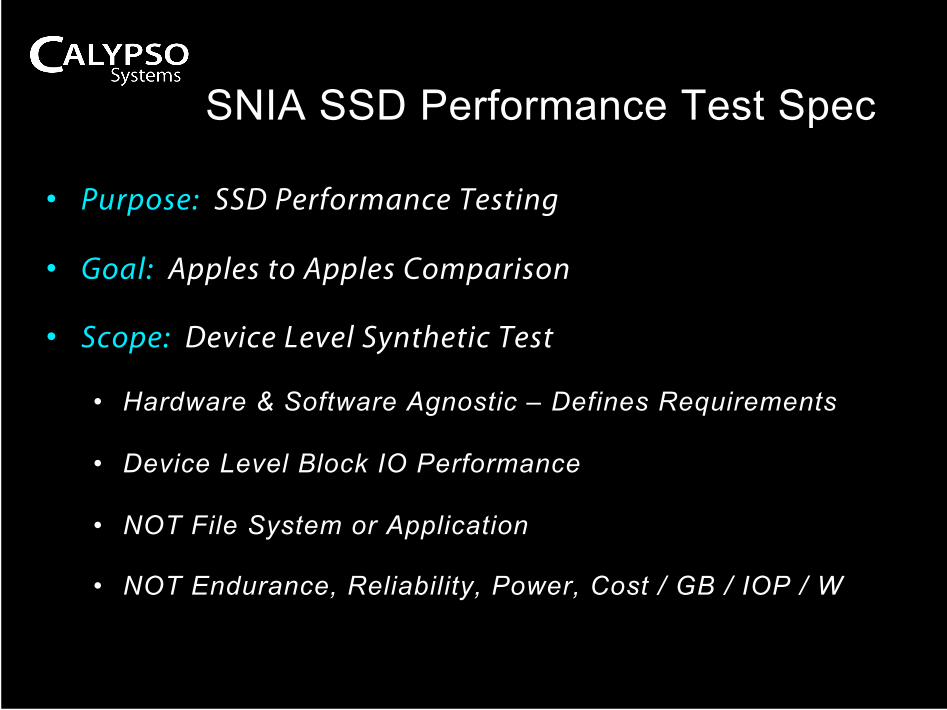
SNIA SSD Performance Test Spec
Santa Clara, CA August 2010 6
• Purpose: SSD Performance Testing
• Goal: Apples to Apples Comparison
• Scope: Device Level Synthetic Test
• Hardware & Software Agnostic – Defines Requirements
• Device Level Block IO Performance
• NOT File System or Application
• NOT Endurance, Reliability, Power, Cost / GB / IOP / W
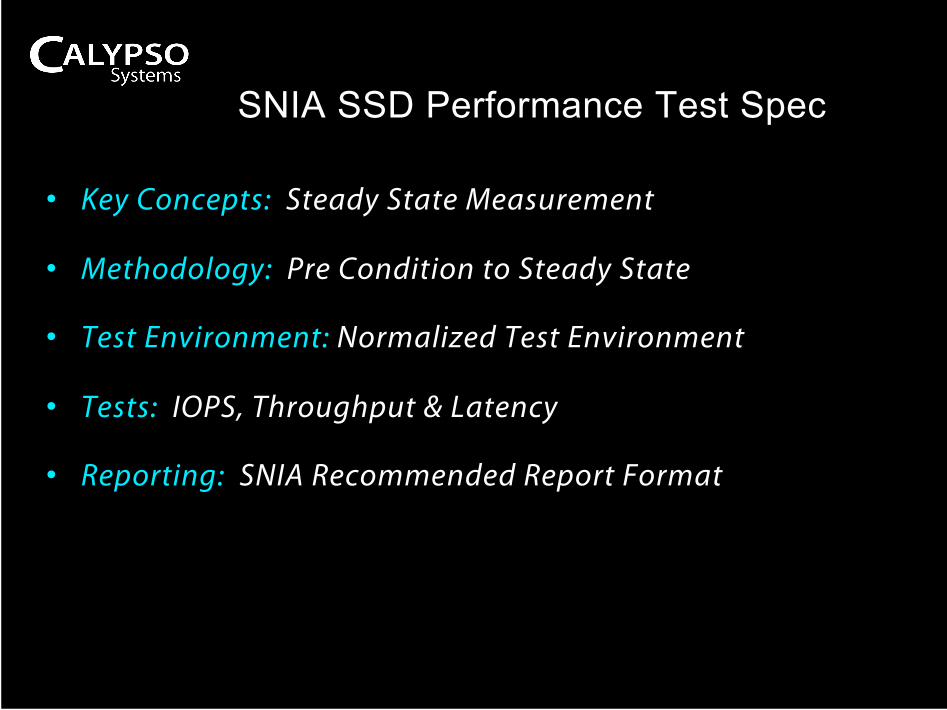
SNIA SSD Performance Test Spec
Santa Clara, CA August 2010 7
• Key Concepts: Steady State Measurement
• Methodology: Pre Condition to Steady State
• Test Environment: Normalized Test Environment
• Tests: IOPS, Throughput & Latency
• Reporting: SNIA Recommended Report Format

Santa Clara, CA August 2010 8
STEADY STATE
Santa Clara, CA August 2010 9
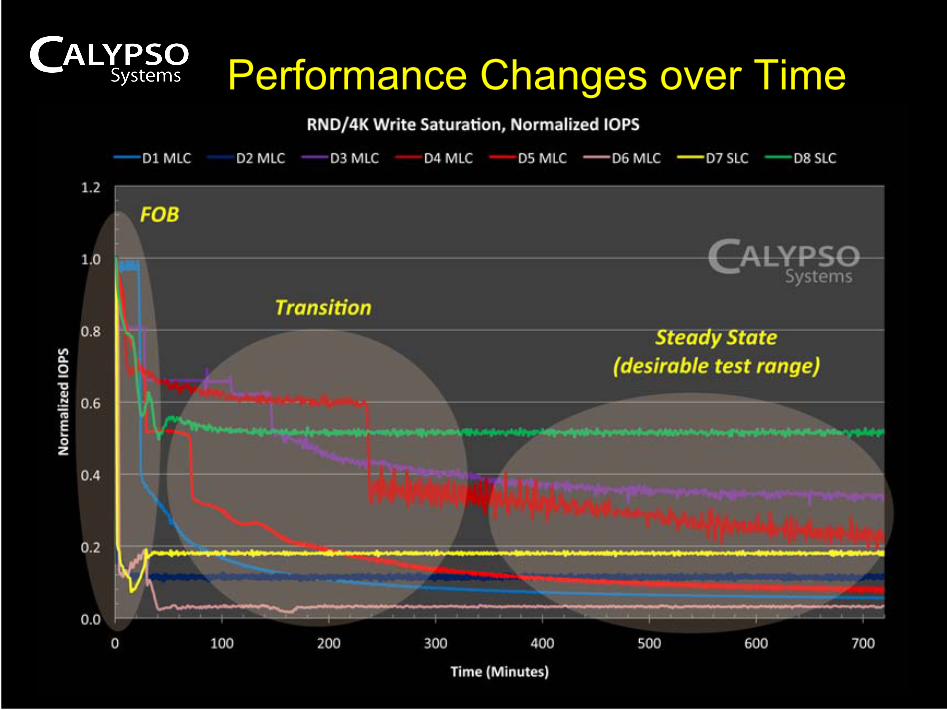
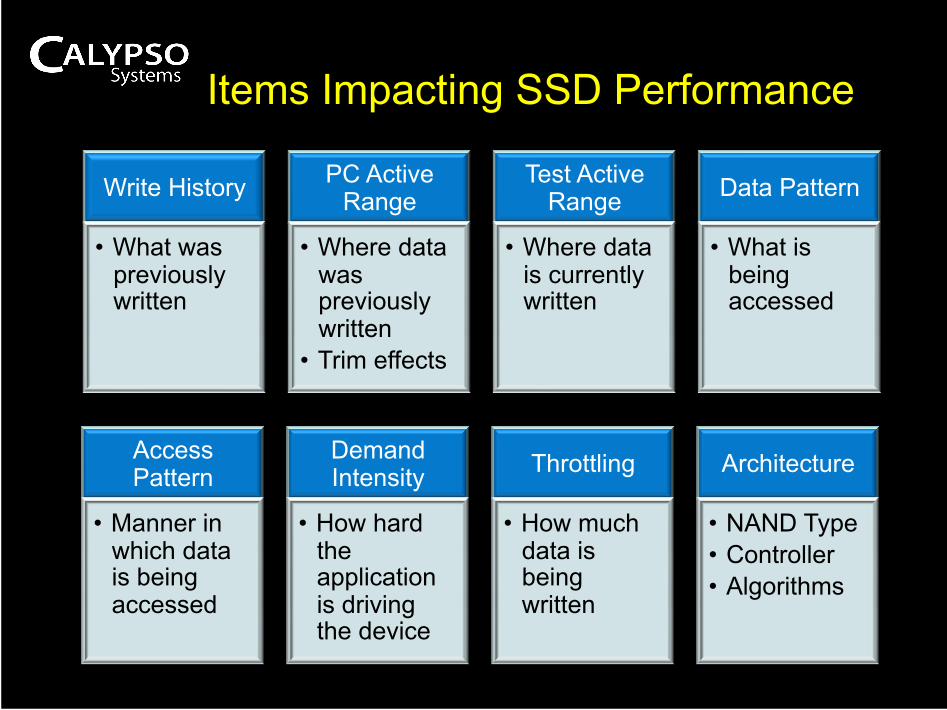
Performance Changes over Time
10
Write History
• What was previously written
PC Active Range
• Where data was previously written
• Trim effects
Test Active Range
• Where data is currently written
Data Pattern
• What is being accessed
Access Pattern
• Manner in which data is being accessed
Demand Intensity
• How hard the application is driving the device
Throttling
• How much data is being written
Architecture
• NAND Type • Controller • Algorithms
11
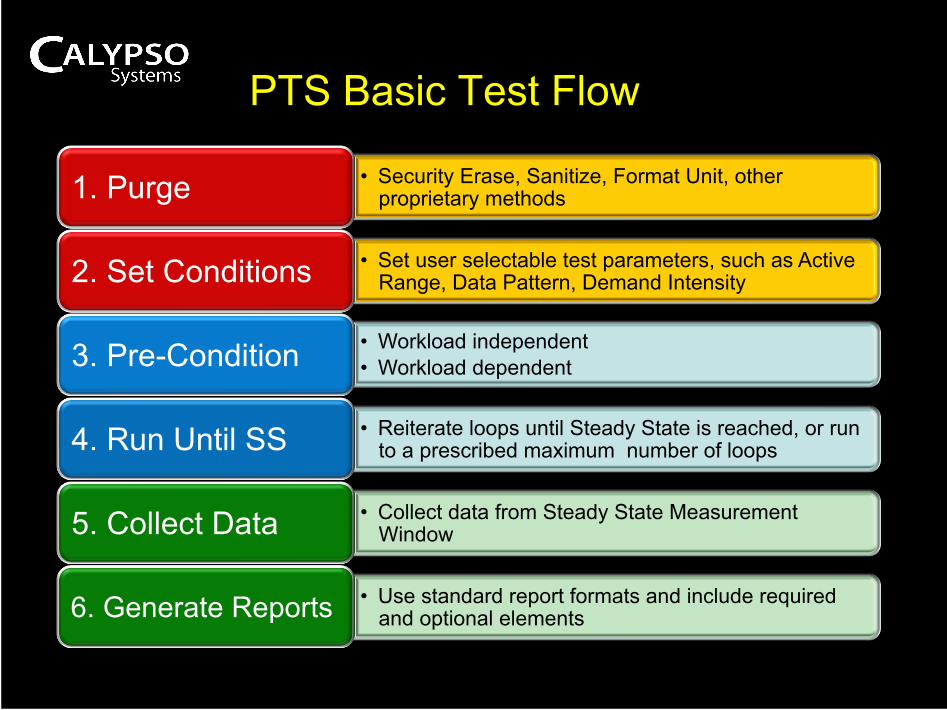
• Security Erase, Sanitize, Format Unit, other proprietary methods 1. Purge
• Set user selectable test parameters, such as Active Range, Data Pattern, Demand Intensity 2. Set Conditions
• Workload independent • Workload dependent 3. Pre-Condition
• Reiterate loops until Steady State is reached, or run to a prescribed maximum number of loops 4. Run Until SS
• Collect data from Steady State Measurement Window 5. Collect Data
• Use standard report formats and include required and optional elements 6. Generate Reports
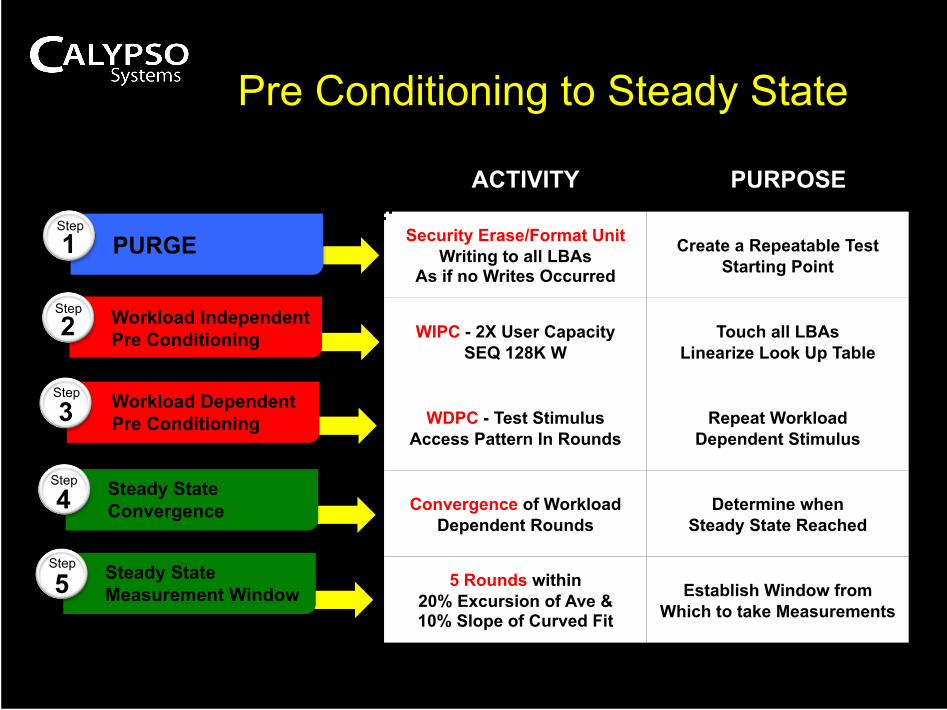
Pre Conditioning to Steady State
Santa Clara, CA August 2010
12
PURGE
Workload Independent Pre Conditioning
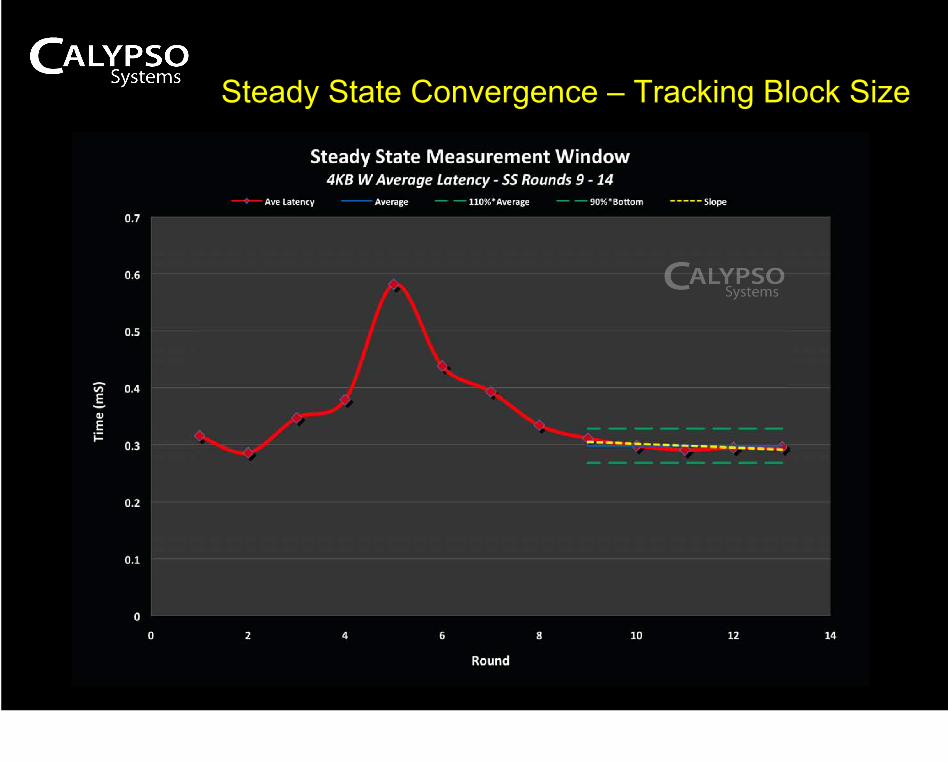
Steady State Convergence
Steady State Measurement Window
Workload Dependent Pre Conditioning
1 Step
2 Step
3 Step
4 Step
5 Step
ACTIVITY PURPOSE
Security Erase/Format Unit Writing to all LBAs
As if no Writes Occurred
Create a Repeatable Test Starting Point
WIPC - 2X User Capacity SEQ 128K W
Touch all LBAs Linearize Look Up Table
WDPC - Test Stimulus Access Pattern In Rounds
Repeat Workload Dependent Stimulus
Convergence of Workload Dependent Rounds
Determine when Steady State Reached
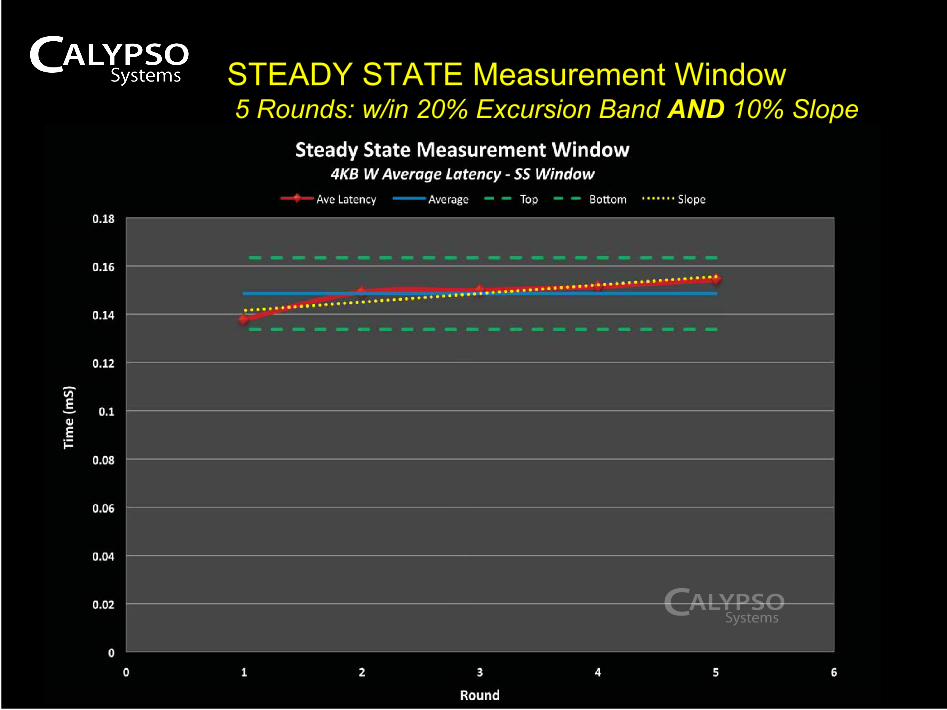
5 Rounds within 20% Excursion of Ave & 10% Slope of Curved Fit
Establish Window from Which to take Measurements
Santa Clara, CA August 2010 13
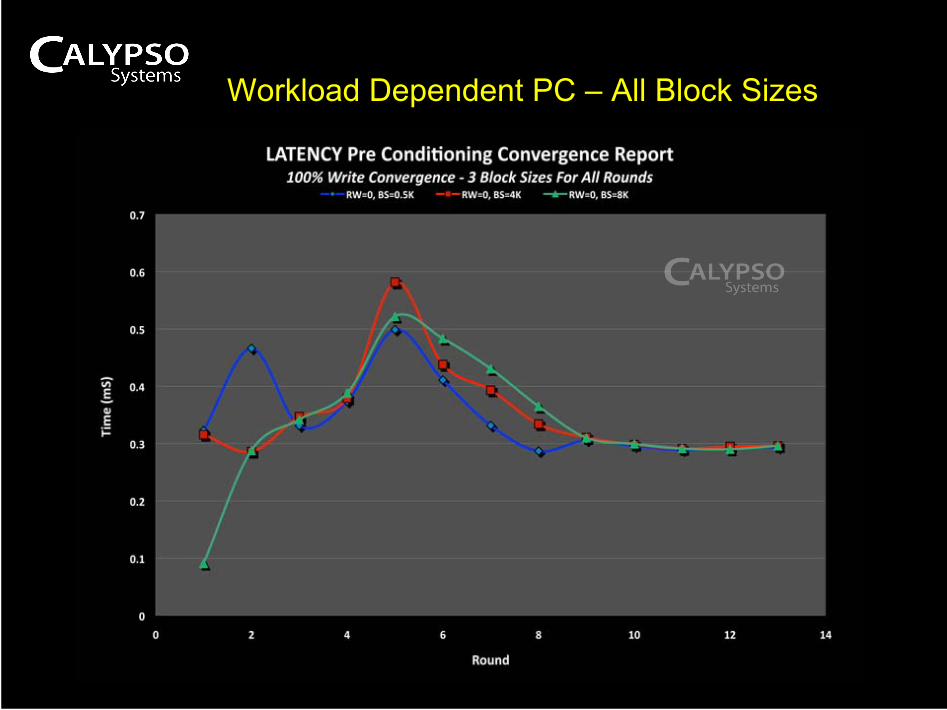
Workload Dependent PC – All Block Sizes
Santa Clara, CA August 2010 14
Steady State Convergence – Tracking Block Size
Santa Clara, CA August 2010 15
STEADY STATE Measurement Window 5 Rounds: w/in 20% Excursion Band AND 10% Slope

Santa Clara, CA August 2010 16
Blind Survey 2010
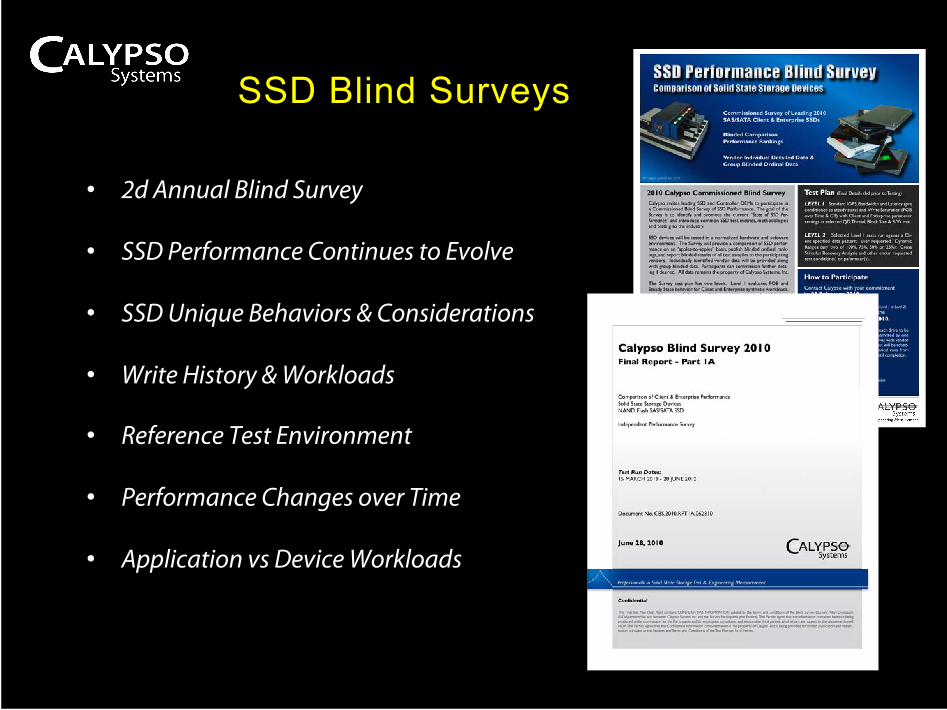
SSD Blind Surveys
• 2d Annual Blind Survey
• SSD Performance Continues to Evolve
• SSD Unique Behaviors & Considerations
• Write History & Workloads
• Reference Test Environment
• Performance Changes over Time
• Application vs Device Workloads
Santa Clara, CA August 2010 17
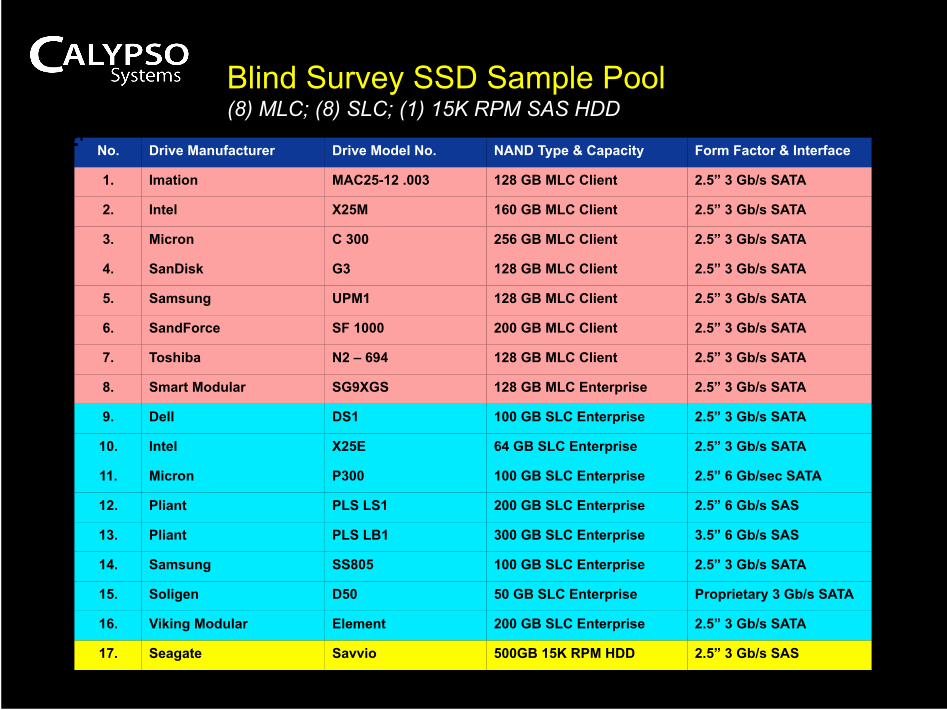
Blind Survey SSD Sample Pool (8) MLC; (8) SLC; (1) 15K RPM SAS HDD
Santa Clara, CA August 2010 18
No. Drive Manufacturer Drive Model No. NAND Type & Capacity Form Factor & Interface
1. Imation MAC25-12 .003 128 GB MLC Client 2.5” 3 Gb/s SATA
2. Intel X25M 160 GB MLC Client 2.5” 3 Gb/s SATA
3. Micron C 300 256 GB MLC Client 2.5” 3 Gb/s SATA
4. SanDisk G3 128 GB MLC Client 2.5” 3 Gb/s SATA
5. Samsung UPM1 128 GB MLC Client 2.5” 3 Gb/s SATA
6. SandForce SF 1000 200 GB MLC Client 2.5” 3 Gb/s SATA
7. Toshiba N2 – 694 128 GB MLC Client 2.5” 3 Gb/s SATA
8. Smart Modular SG9XGS 128 GB MLC Enterprise 2.5” 3 Gb/s SATA
9. Dell DS1 100 GB SLC Enterprise 2.5” 3 Gb/s SATA
10. Intel X25E 64 GB SLC Enterprise 2.5” 3 Gb/s SATA
11. Micron P300 100 GB SLC Enterprise 2.5” 6 Gb/sec SATA
12. Pliant PLS LS1 200 GB SLC Enterprise 2.5” 6 Gb/s SAS
13. Pliant PLS LB1 300 GB SLC Enterprise 3.5” 6 Gb/s SAS
14. Samsung SS805 100 GB SLC Enterprise 2.5” 3 Gb/s SATA
15. Soligen D50 50 GB SLC Enterprise Proprietary 3 Gb/s SATA
16. Viking Modular Element 200 GB SLC Enterprise 2.5” 3 Gb/s SATA
17. Seagate Savvio 500GB 15K RPM HDD 2.5” 3 Gb/s SAS
Santa Clara, CA August 2010 19
Test Set Up
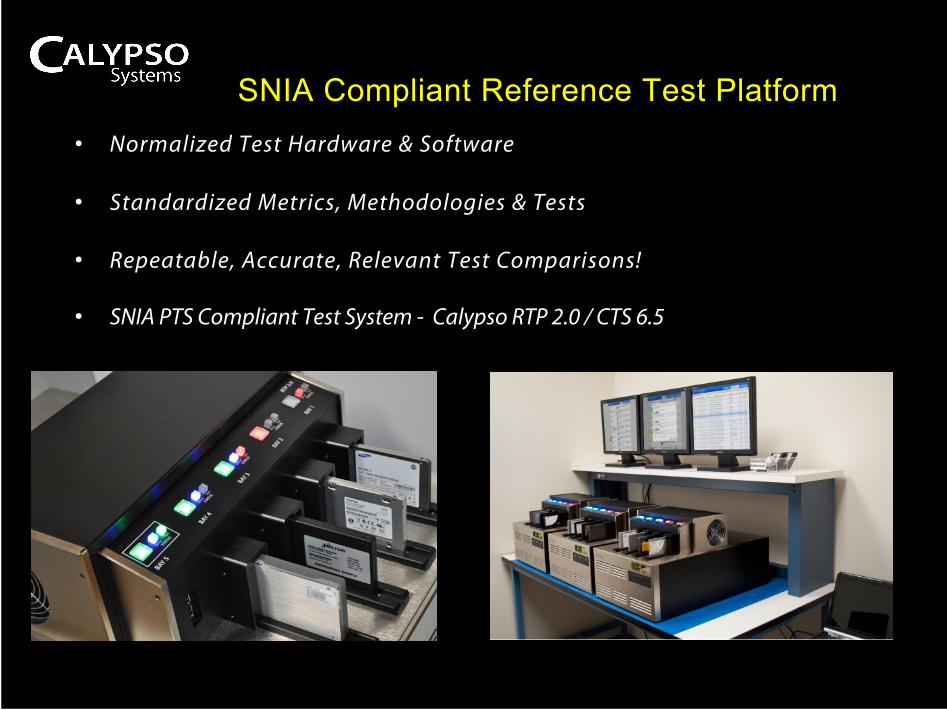
SNIA Compliant Reference Test Platform
Santa Clara, CA August 2010 20
• Normalized Test Hardware & Software
• Standardized Metrics, Methodologies & Tests
• Repeatable, Accurate, Relevant Test Comparisons!
• SNIA PTS Compliant Test System - Calypso RTP 2.0 / CTS 6.5
21
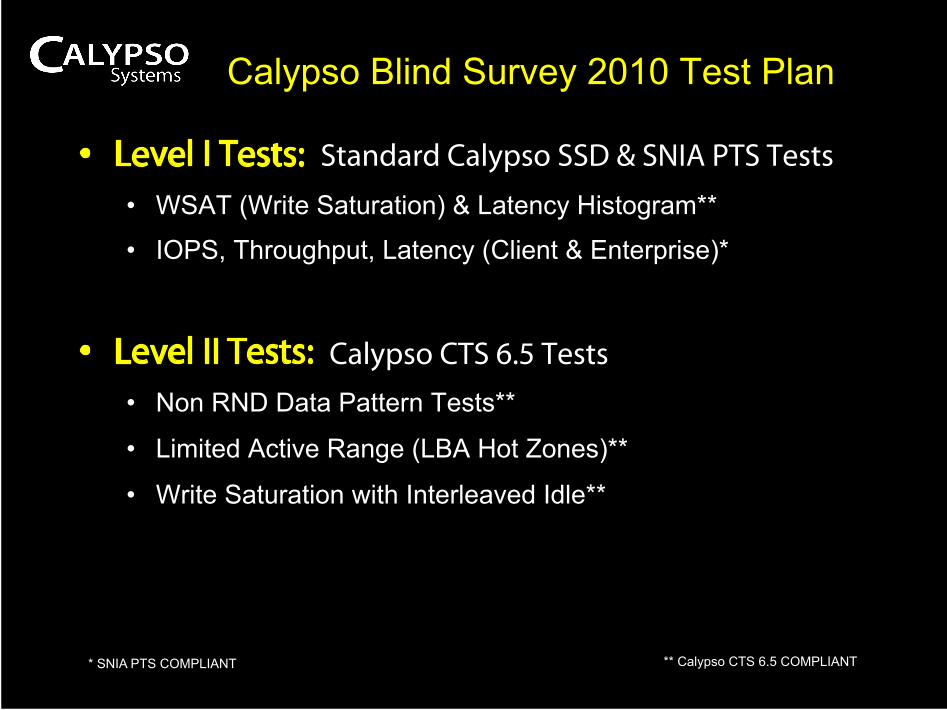
Calypso Blind Survey 2010 Test Plan
* SNIA PTS COMPLIANT
Standard Calypso SSD & SNIA PTS Tests • WSAT (Write Saturation) & Latency Histogram**
• IOPS, Throughput, Latency (Client & Enterprise)*
Calypso CTS 6.5 Tests • Non RND Data Pattern Tests**
• Limited Active Range (LBA Hot Zones)**
• Write Saturation with Interleaved Idle**
** Calypso CTS 6.5 COMPLIANT
Santa Clara, CA August 2010 22
FOB Performance “Fresh-out-of-the-Box”
Santa Clara, CA August 2010 23
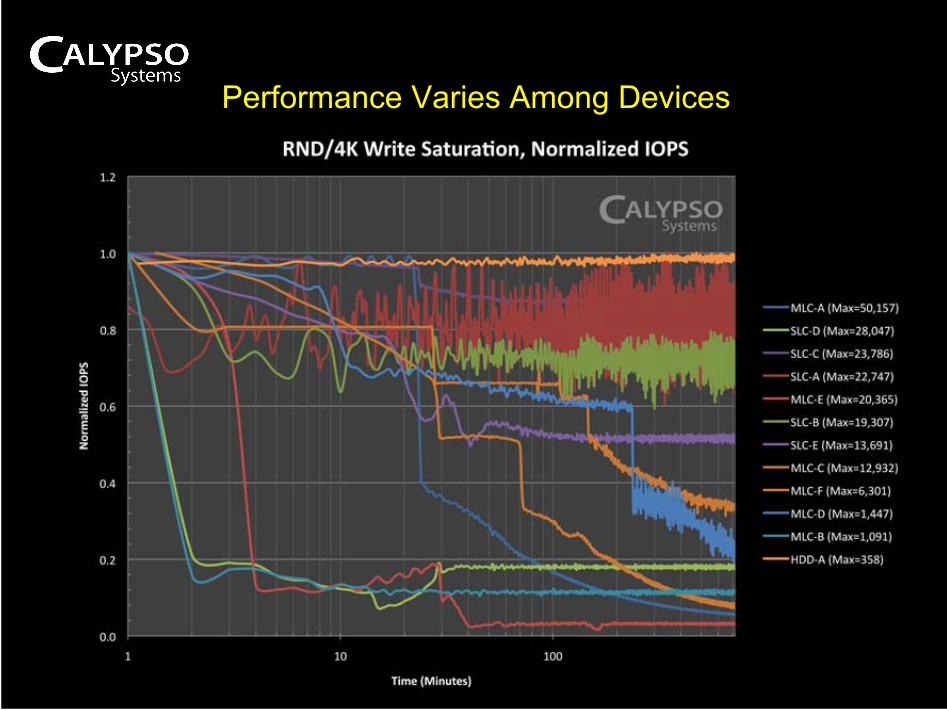
Performance Varies Among Devices
Santa Clara, CA August 2010 24
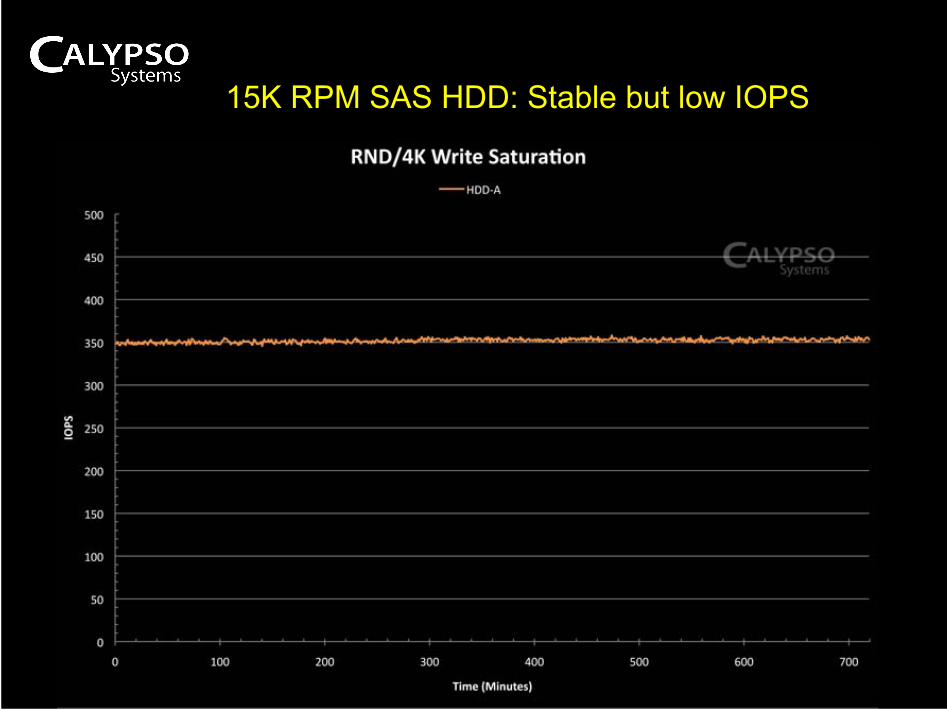
15K RPM SAS HDD: Stable but low IOPS
Santa Clara, CA August 2010 25
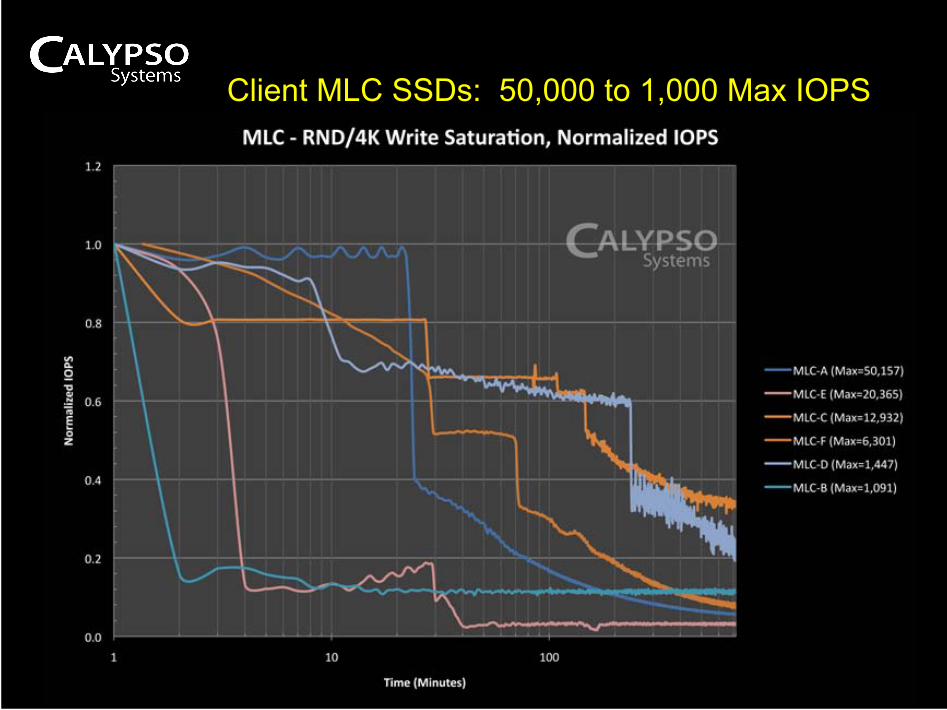
Client MLC SSDs: 50,000 to 1,000 Max IOPS
Santa Clara, CA August 2010 26
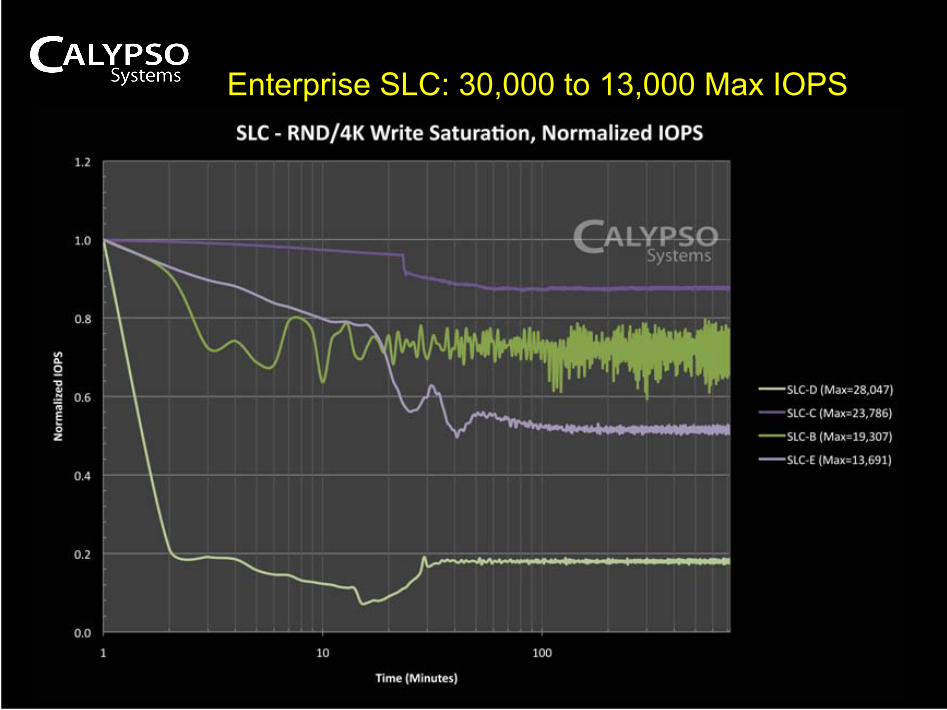
Enterprise SLC: 30,000 to 13,000 Max IOPS
Santa Clara, CA August 2010 27
FOB v Steady State
Santa Clara, CA August 2010 28
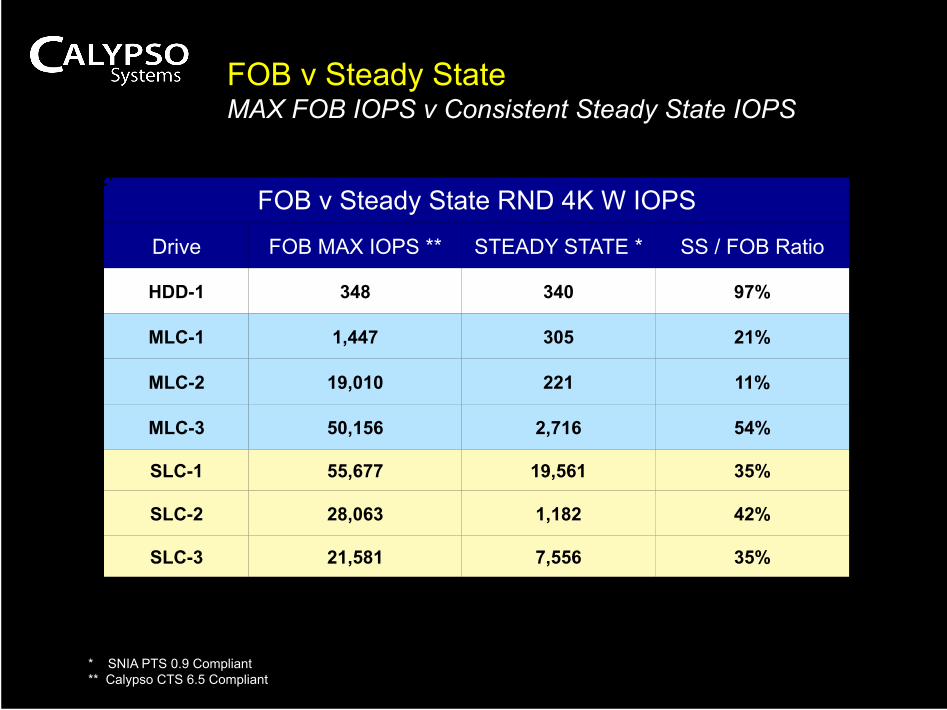
FOB v Steady State MAX FOB IOPS v Consistent Steady State IOPS
FOB v Steady State RND 4K W IOPS
Drive FOB MAX IOPS ** STEADY STATE * SS / FOB Ratio
HDD-1 348 340 97%
MLC-1 1,447 305 21%
MLC-2 19,010 221 11%
MLC-3 50,156 2,716 54%
SLC-1 55,677 19,561 35%
SLC-2 28,063 1,182 42%
SLC-3 21,581 7,556 35%
* SNIA PTS 0.9 Compliant ** Calypso CTS 6.5 Compliant
29
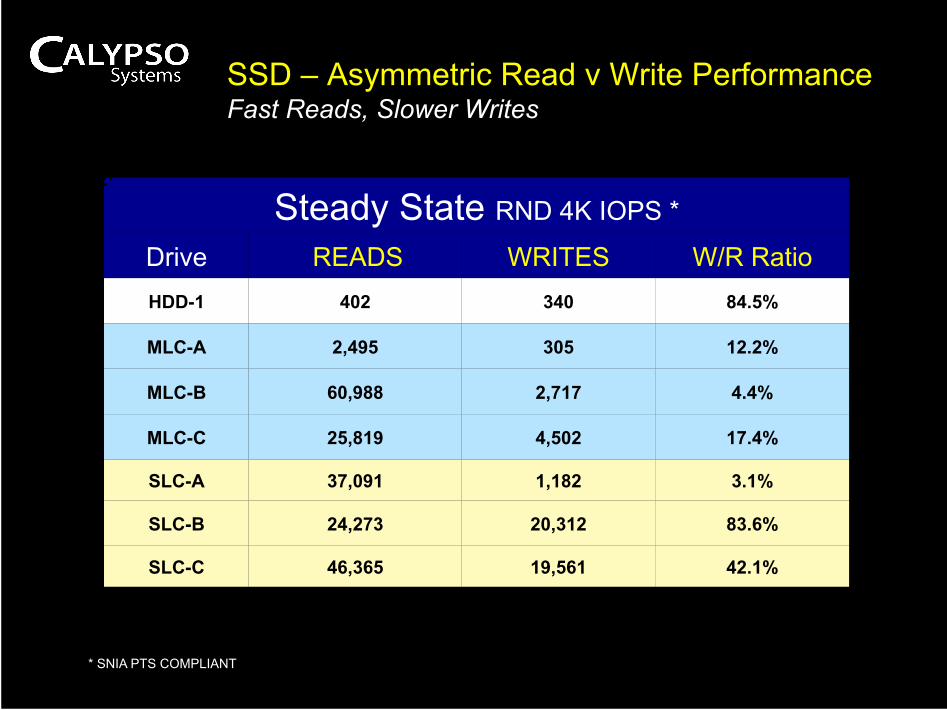
SSD – Asymmetric Read v Write Performance Fast Reads, Slower Writes
Steady State RND 4K IOPS *
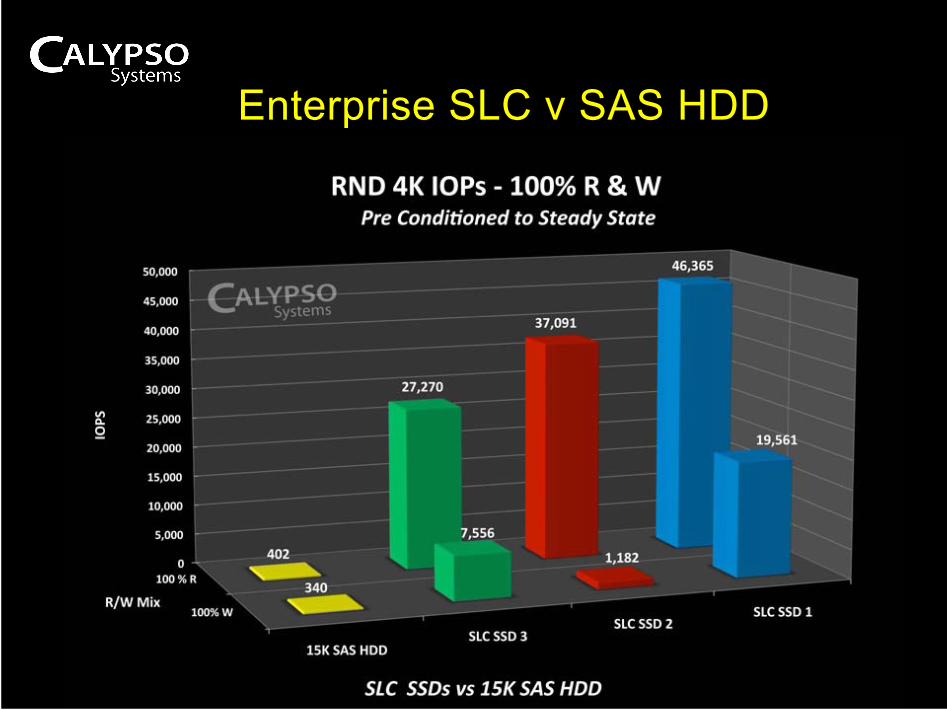
Drive READS WRITES W/R Ratio HDD-1 402 340 84.5%
MLC-A 2,495 305 12.2%
MLC-B 60,988 2,717 4.4%
MLC-C 25,819 4,502 17.4%
SLC-A 37,091 1,182 3.1%
SLC-B 24,273 20,312 83.6%
SLC-C 46,365 19,561 42.1%
* SNIA PTS COMPLIANT
Santa Clara, CA August 2010 30
Group SLC, MLC
IOPS & Throughput
Santa Clara, CA August 2010 31
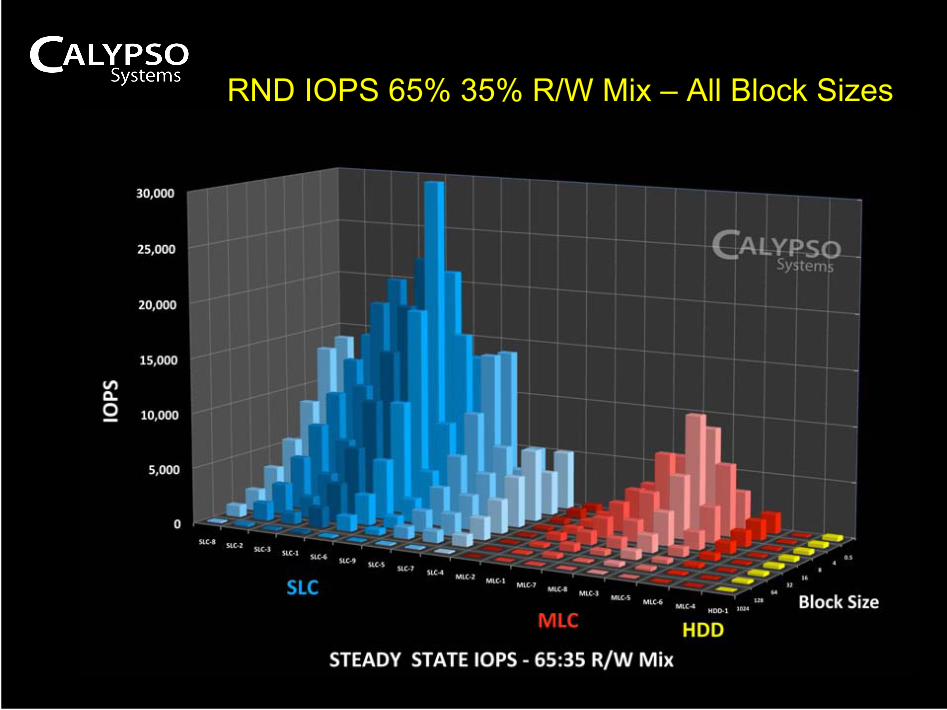
RND IOPS 65% 35% R/W Mix – All Block Sizes
Santa Clara, CA August 2010 32
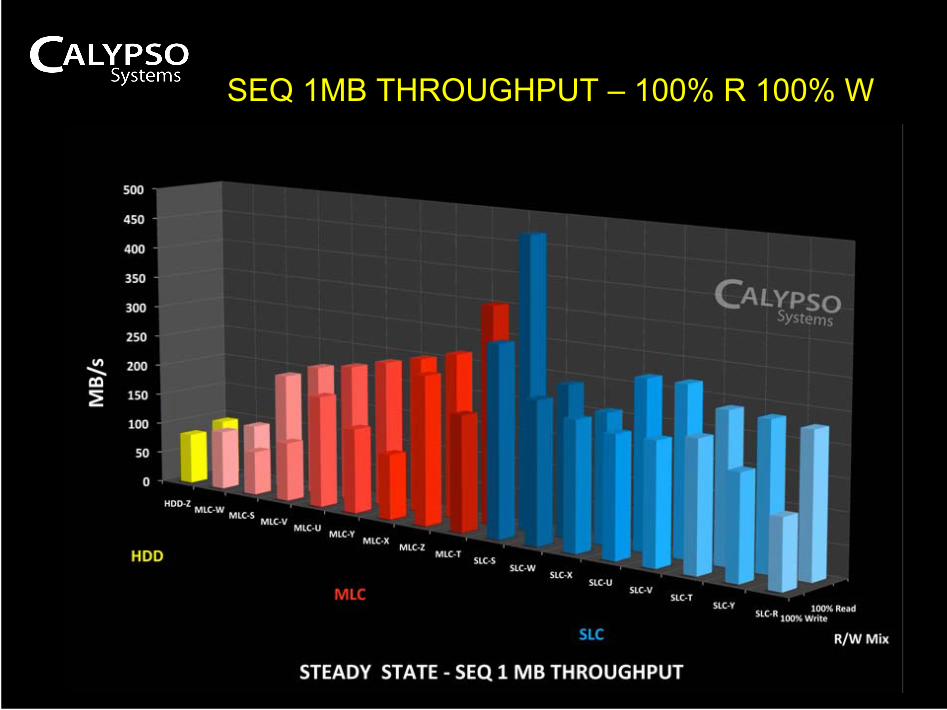
SEQ 1MB THROUGHPUT – 100% R 100% W
Santa Clara, CA August 2010 33
Enterprise SLC v
15K RPM SAS HDD
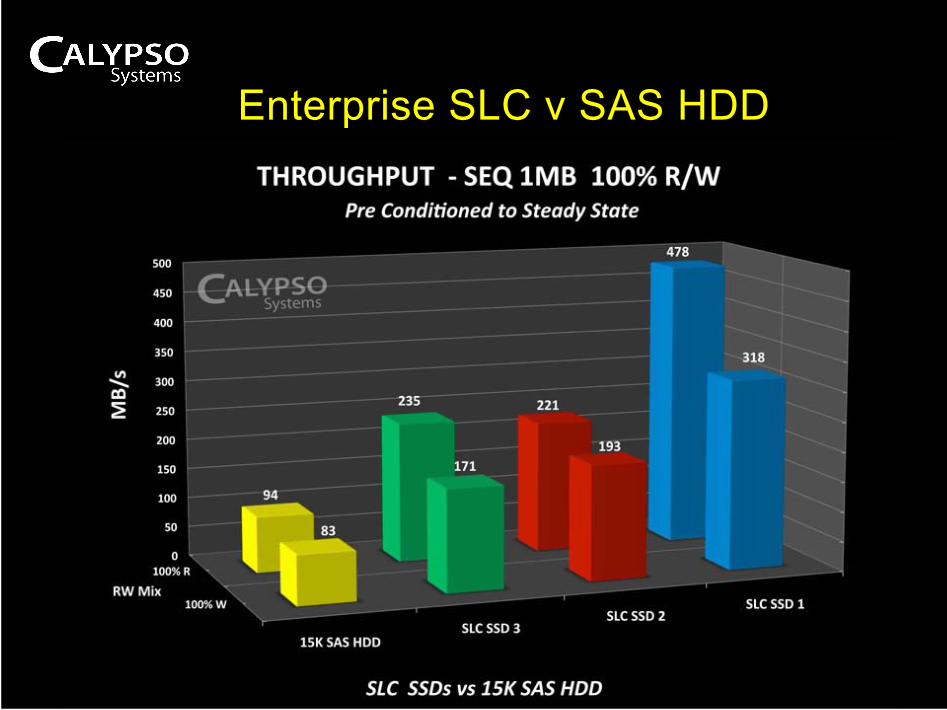
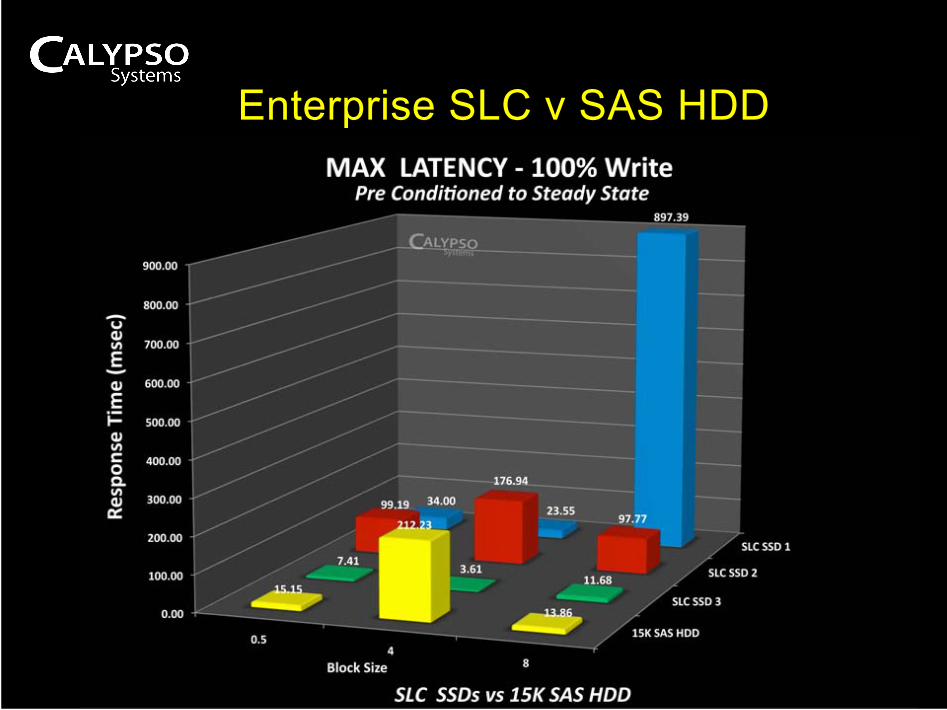
Enterprise SLC v SAS HDD
Santa Clara, CA August 2010 34
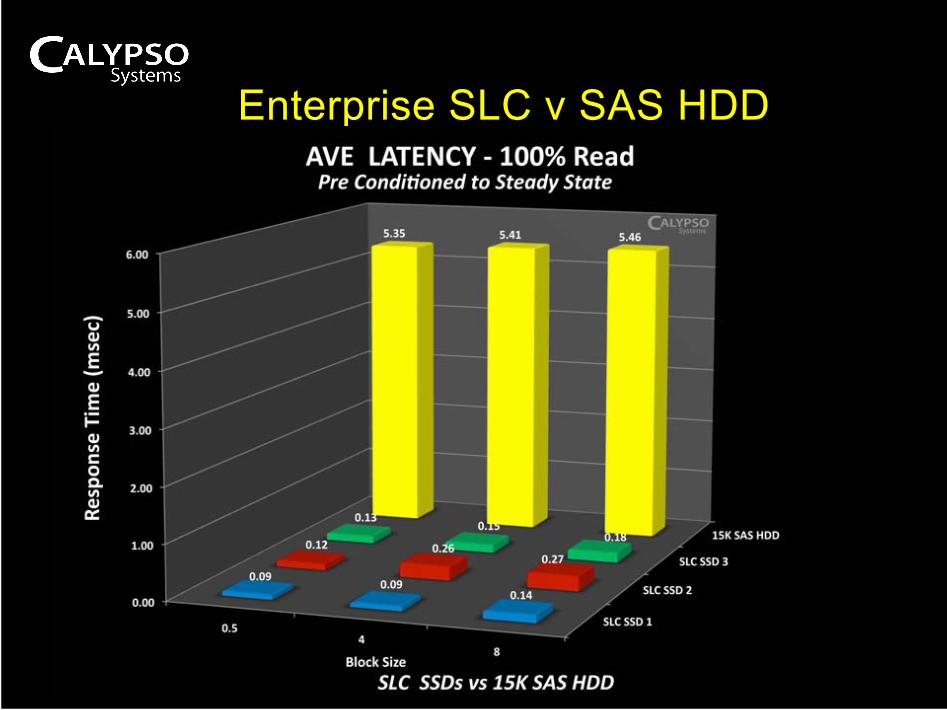
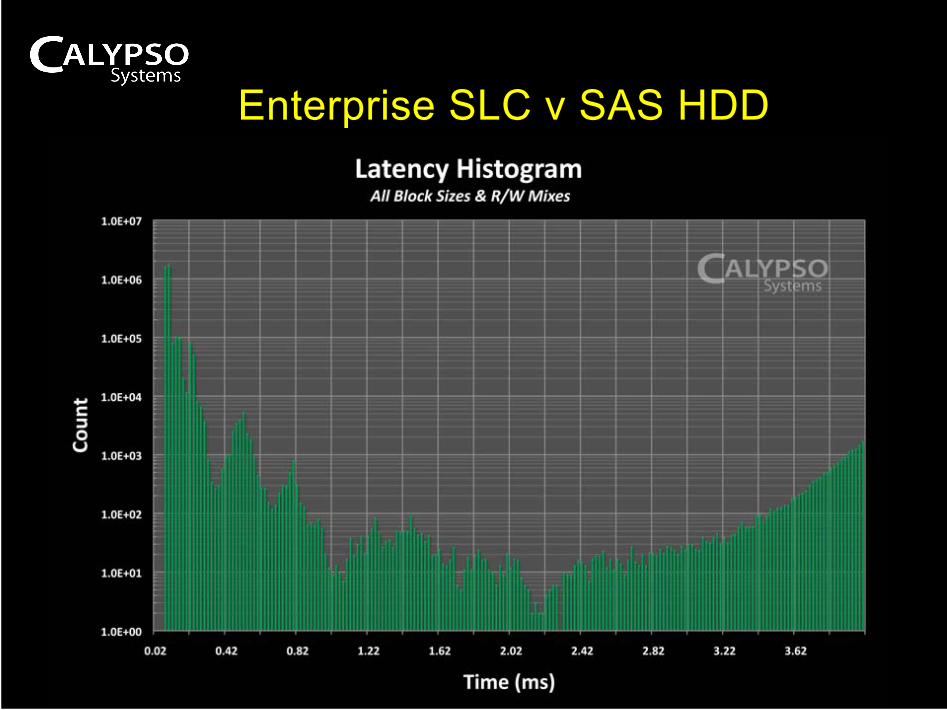
Enterprise SLC v SAS HDD
Santa Clara, CA August 2010 35
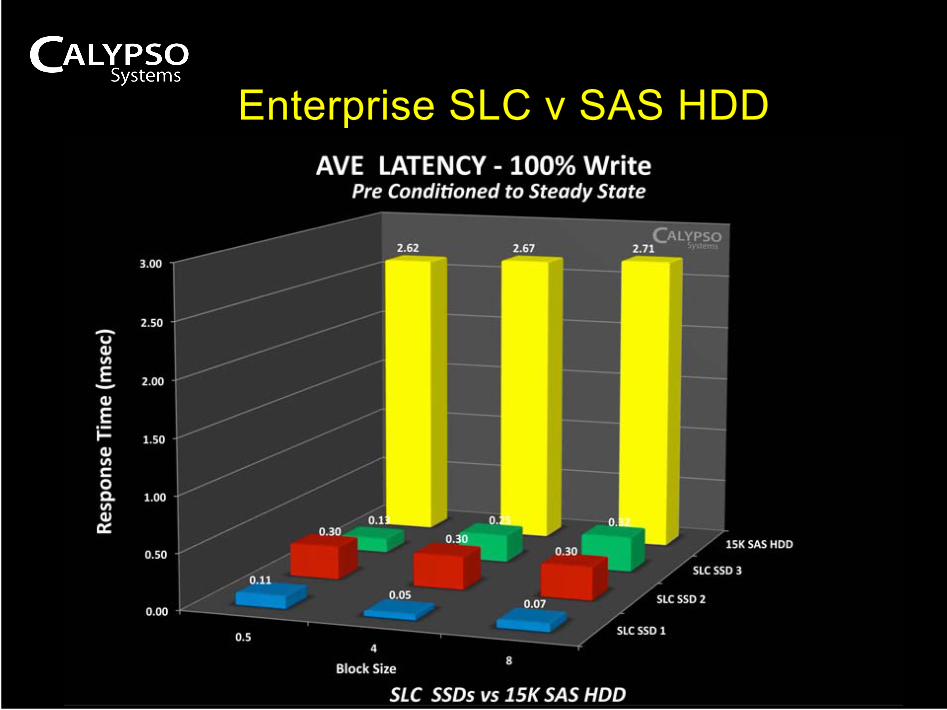
Enterprise SLC v SAS HDD
Santa Clara, CA August 2010 36
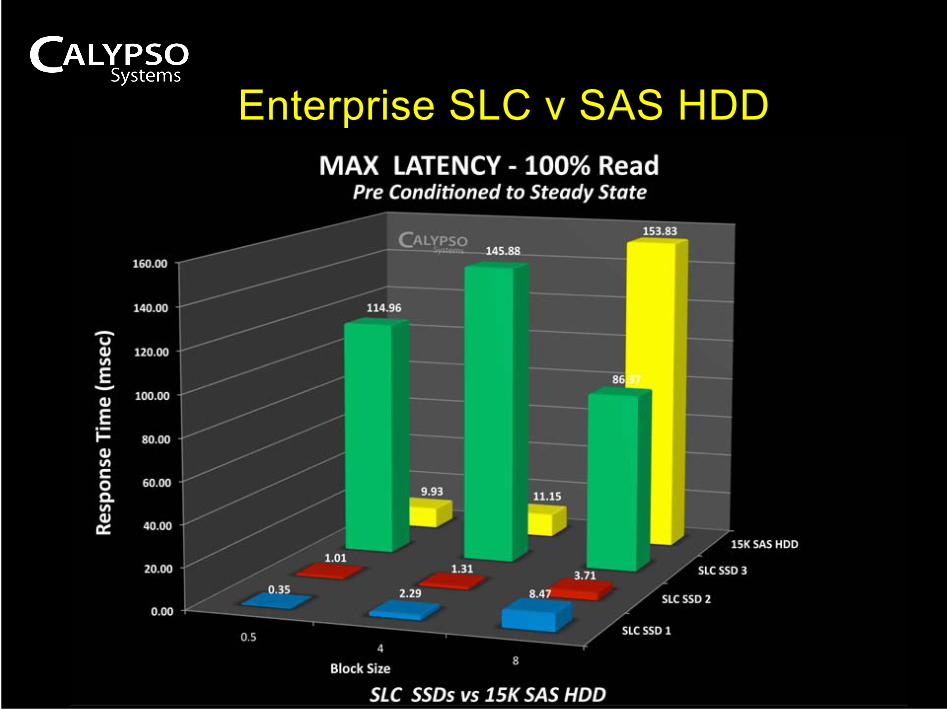
Enterprise SLC v SAS HDD
Santa Clara, CA August 2010 37
Enterprise SLC v SAS HDD
Santa Clara, CA August 2010 38
Enterprise SLC v SAS HDD
Santa Clara, CA August 2010 39
Enterprise SLC v SAS HDD
Santa Clara, CA August 2010 40

Survey Conclusions
Santa Clara, CA August 2010 41
NON RANDOM
DATA PATTERNS
42
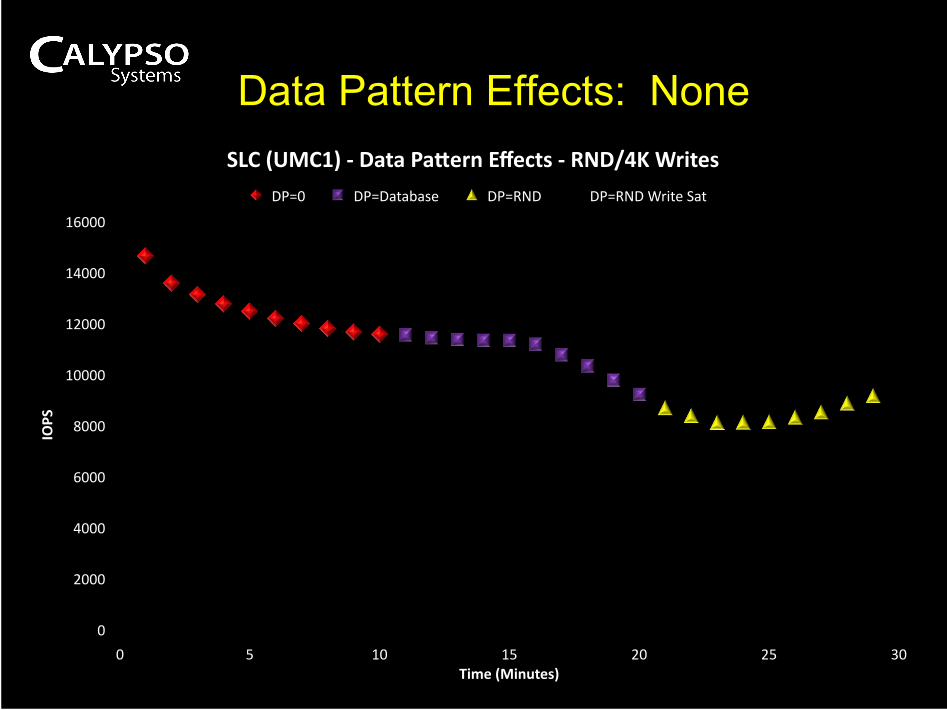
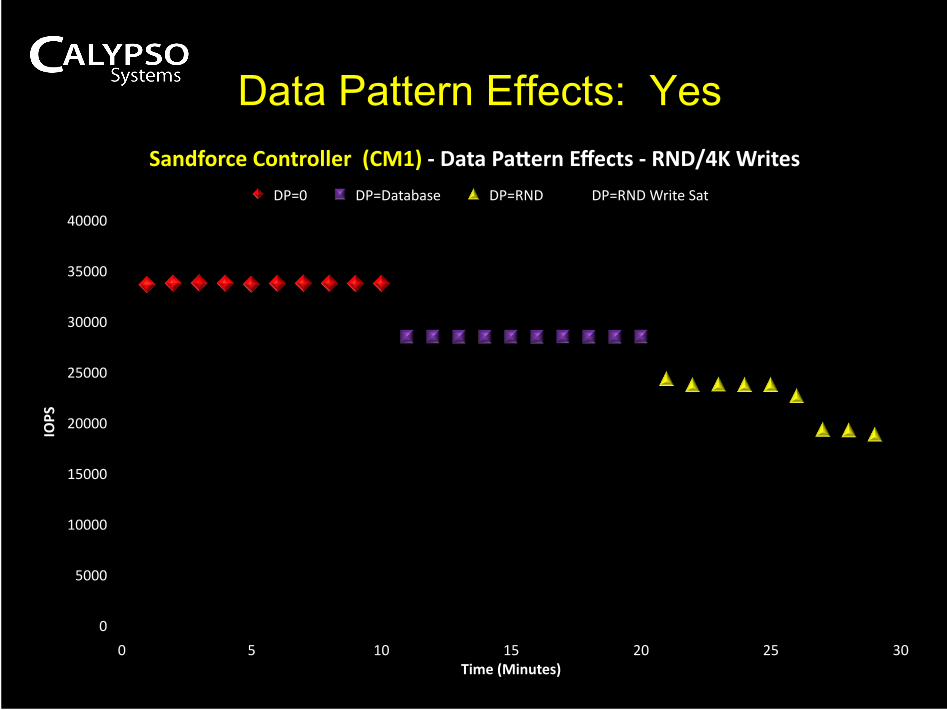
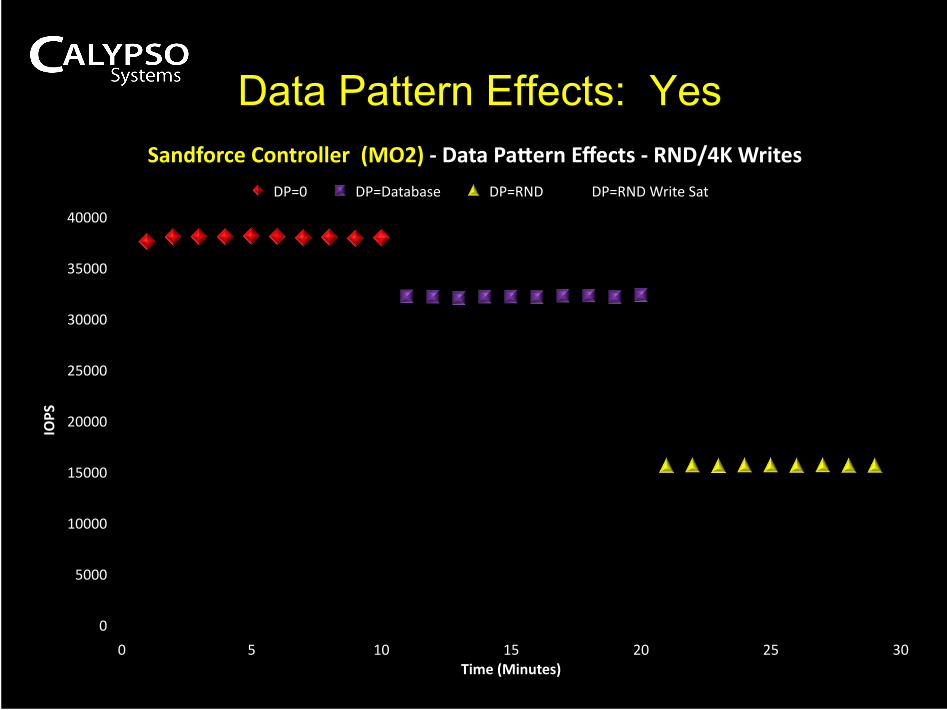
Non Random Data Patterns
* SNIA PTS COMPLIANT
• WSAT using RND Data Pattern - WSAT
• WSAT using Non Random (0000s)
• WSAT using a Compressible Data Base Binary File
** Calypso CTS 6.5 COMPLIANT
43
0
5000
10000
15000
20000
25000
30000
0 5 10 15 20 25 30
IOPS
Time (Minutes)
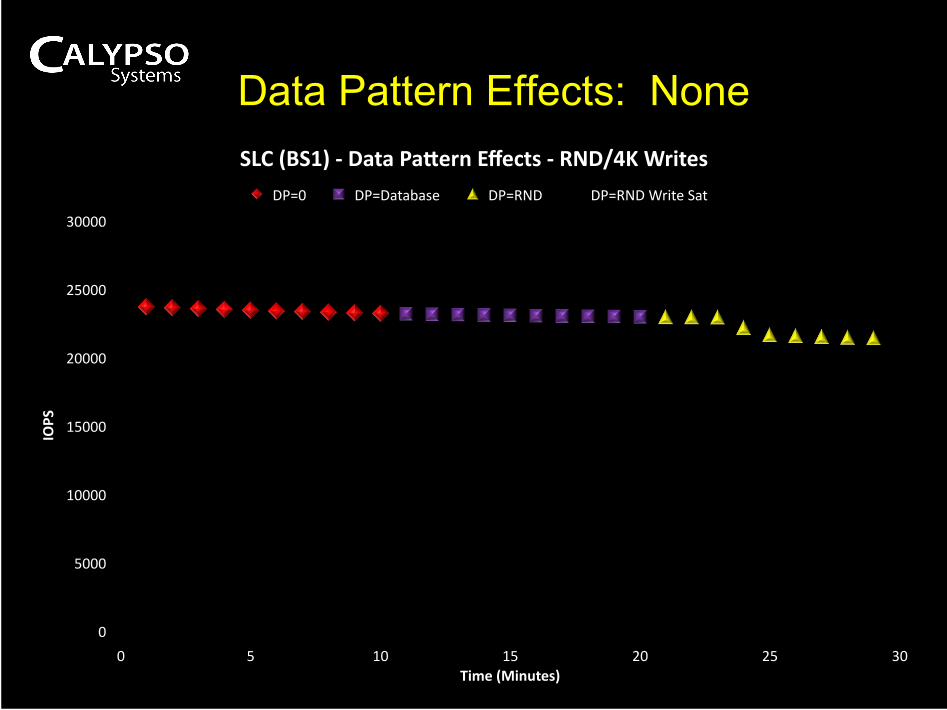
SLC (BS1) ‐ Data Pa8ern Effects ‐ RND/4K Writes
DP=0 DP=Database DP=RND DP=RNDWriteSat
44
0
2000
4000
6000
8000
10000
12000
14000
16000
0 5 10 15 20 25 30
IOPS
Time (Minutes)
SLC (UMC1) ‐ Data Pa8ern Effects ‐ RND/4K Writes
DP=0 DP=Database DP=RND DP=RNDWriteSat
45
0
5000
10000
15000
20000
25000
30000
35000
40000
0 5 10 15 20 25 30
IOPS
Time (Minutes)
Sandforce Controller (CM1) ‐ Data Pa8ern Effects ‐ RND/4K Writes
DP=0 DP=Database DP=RND DP=RNDWriteSat
46
0
5000
10000
15000
20000
25000
30000
35000
40000
0 5 10 15 20 25 30
IOPS
Time (Minutes)
Sandforce Controller (MO2) ‐ Data Pa8ern Effects ‐ RND/4K Writes
DP=0 DP=Database DP=RND DP=RNDWriteSat
Survey Conclusions
Santa Clara, CA August 2010 47
Take Aways
Santa Clara, CA August 2010 48
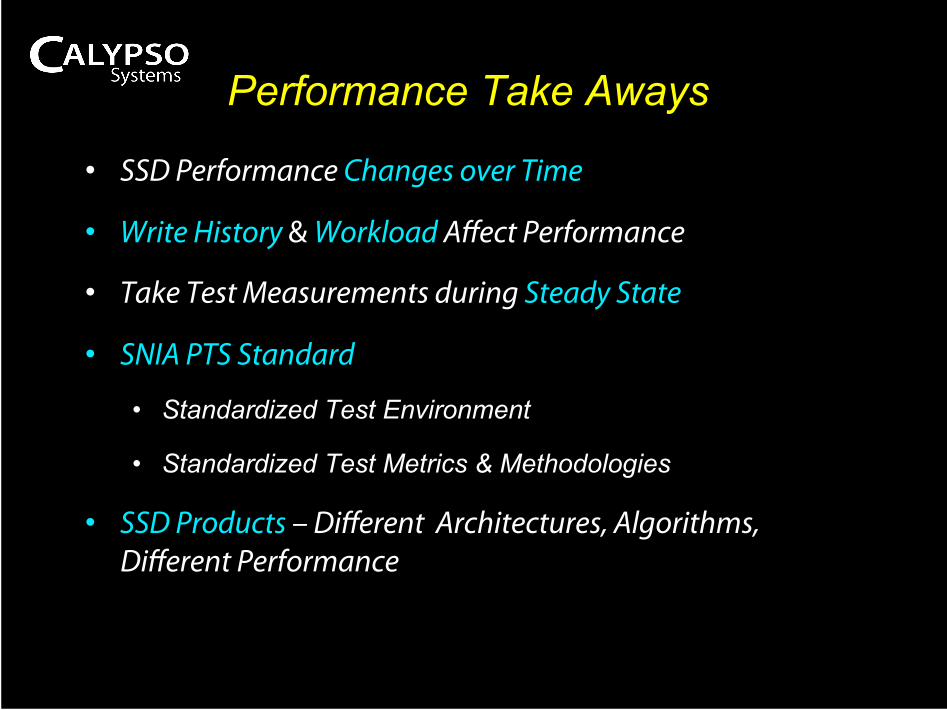
Performance Take Aways
• SSD Performance Changes over Time
• Write History & Workload Affect Performance
• Take Test Measurements during Steady State
• SNIA PTS Standard
• Standardized Test Environment
• Standardized Test Metrics & Methodologies
• SSD Products – Different Architectures, Algorithms, Different Performance
Santa Clara, CA August 2010 49
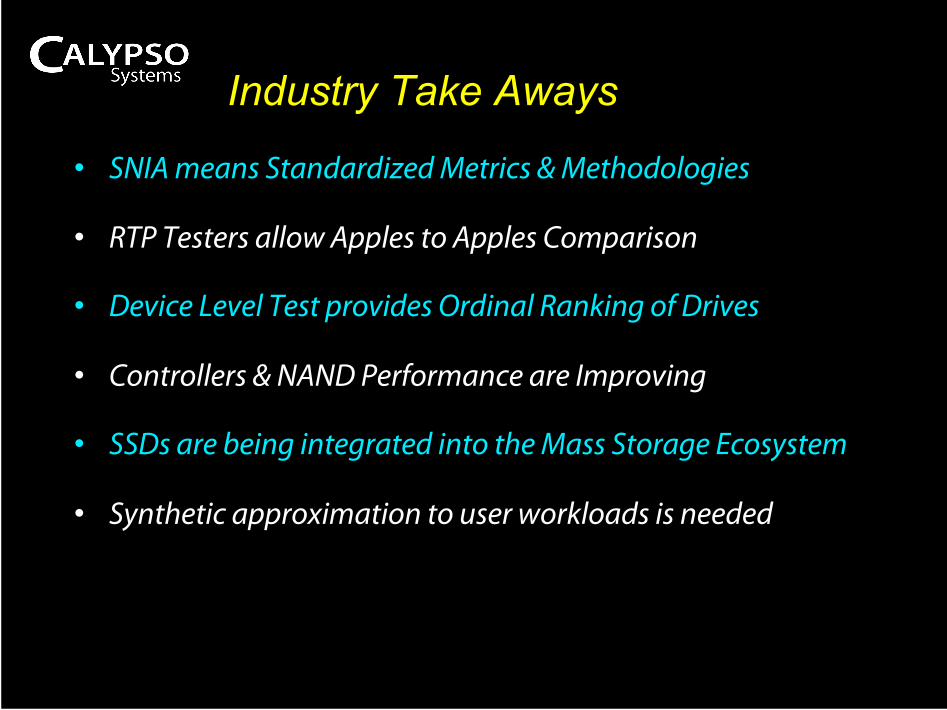
Industry Take Aways
• SNIA means Standardized Metrics & Methodologies
• RTP Testers allow Apples to Apples Comparison
• Device Level Test provides Ordinal Ranking of Drives
• Controllers & NAND Performance are Improving
• SSDs are being integrated into the Mass Storage Ecosystem
• Synthetic approximation to user workloads is needed
Santa Clara, CA August 2010 50
Santa Clara, CA August 2010 51
Professionals in Solid State Storage Test & Measurement
www.calypsotesters.com [email protected]
Engineering Test Services SSD Testing Equipment
Product Validation
Point Click Results
Thank You!