Embed Size (px)
Citation preview
Preliminary Investigation Caltrans Division of Research, Innovation and System Information
Flood Flow Estimation using Large Scale Particle Image Velocimetry (LSPIV)
Requested by Kevin Flora, Division of Maintenance, Caltrans
February 8, 2017
The Caltrans Division of Research, Innovation and System Information (DRISI) receives and evaluates numerous research problem statements for funding every year. DRISI conducts Preliminary Investigations on these problem statements to better scope and prioritize the proposed research in light of existing credible work on the topics nationally and internationally. Online and print sources for Preliminary Investigations include the National Cooperative Highway Research Program (NCHRP) and other Transportation Research Board (TRB) programs, the American Association of State Highway and Transportation Officials (AASHTO), the research and practices of other transportation agencies, and related academic and industry research. The views and conclusions in cited works, while generally peer reviewed or published by authoritative sources, may not be accepted without qualification by all experts in the field. The contents of this document reflect the views of the authors, who are responsible for the facts and accuracy of the data presented herein. The contents do not necessarily reflect the official views or policies of the California Department of Transportation (Caltrans), the State of California, or the Federal Highway Administration. This document does not constitute a standard, specification, or regulation. No part of this publication should be construed as an endorsement for a commercial product, manufacturer, contractor, or consultant. Any trade names or photos of commercial products appearing in this publication are for clarity only.
Table of Contents Executive Summary .................................................................................................................................... 3
Background ............................................................................................................................................... 3 Advantages of LSPIV............................................................................................................................. 3
Summary of Findings................................................................................................................................. 4 LSPIV Theory and Overview ................................................................................................................. 4
Illumination ......................................................................................................................................... 5 Seeding .............................................................................................................................................. 5 Image Recording ................................................................................................................................ 5 Image Processing............................................................................................................................... 6 LSPIV Data Collection System........................................................................................................... 7
LSPIV for River Surface Flow Measurement Case Studies .................................................................. 8 LSPIV Accuracy ...................................................................................................................................10 Currently Available LSPIV Analysis Software......................................................................................10
PIVlab...............................................................................................................................................10 Fudaa-LSPIV Software.....................................................................................................................10 RIVeR (Rectification of Image Velocity Result) Toolbox Software ..................................................10 PTVlab..............................................................................................................................................10 LSPIV App for Smartphones ............................................................................................................11
National Guidance and State DOT Practices ......................................................................................11 State DOT Survey Results Summary...............................................................................................11 National Guidance............................................................................................................................12 USGS Resources .............................................................................................................................12
UAS (Unmanned Aircraft System)-based LSPIV.................................................................................12 Advantages of UAS-based LSPIV....................................................................................................13 Disadvantages and Regulatory Issues of UAS-based LSPIV..........................................................13 Mitigation of Some Technical Disadvantages of UAS-based LSPIV ...............................................14
Related Research and Resources.......................................................................................................14 Other Remote Sensing Technology for River Surface Flow Measurement .....................................14 Comparison of PSVR and LSPIV.....................................................................................................14 IRSTEA Research on using PSVR ..................................................................................................15
Gaps in Findings......................................................................................................................................15 Next Steps ...............................................................................................................................................15
Recommendations on Mast-based LSPIV for River Surface Flow Measurement...............................15 Strategic Steps for LSPIV Implementation.......................................................................................15
Recommendations for UAS-based LSPIV for River Surface Flow Measurement ...............................16
Detailed Findings ......................................................................................................................................17 Arkansas State Highway and Transportation Department ......................................................................17 Indiana DOT ............................................................................................................................................17 Iowa DOT.................................................................................................................................................18 Maryland DOT .........................................................................................................................................18 Minnesota DOT .......................................................................................................................................18 Montana DOT ..........................................................................................................................................19 New Mexico DOT ....................................................................................................................................19 North Carolina DOT.................................................................................................................................19 North Dakota DOT...................................................................................................................................20 Ohio DOT.................................................................................................................................................20 US Geological Survey (in Georgia, by request of Georgia DOT)............................................................20 Utah DOT.................................................................................................................................................21
Contacts .....................................................................................................................................................22 Agencies .................................................................................................................................22
Produced by Kin Yen, Advanced Highway Maintenance & Construction Technology Research Center 2
Executive Summary
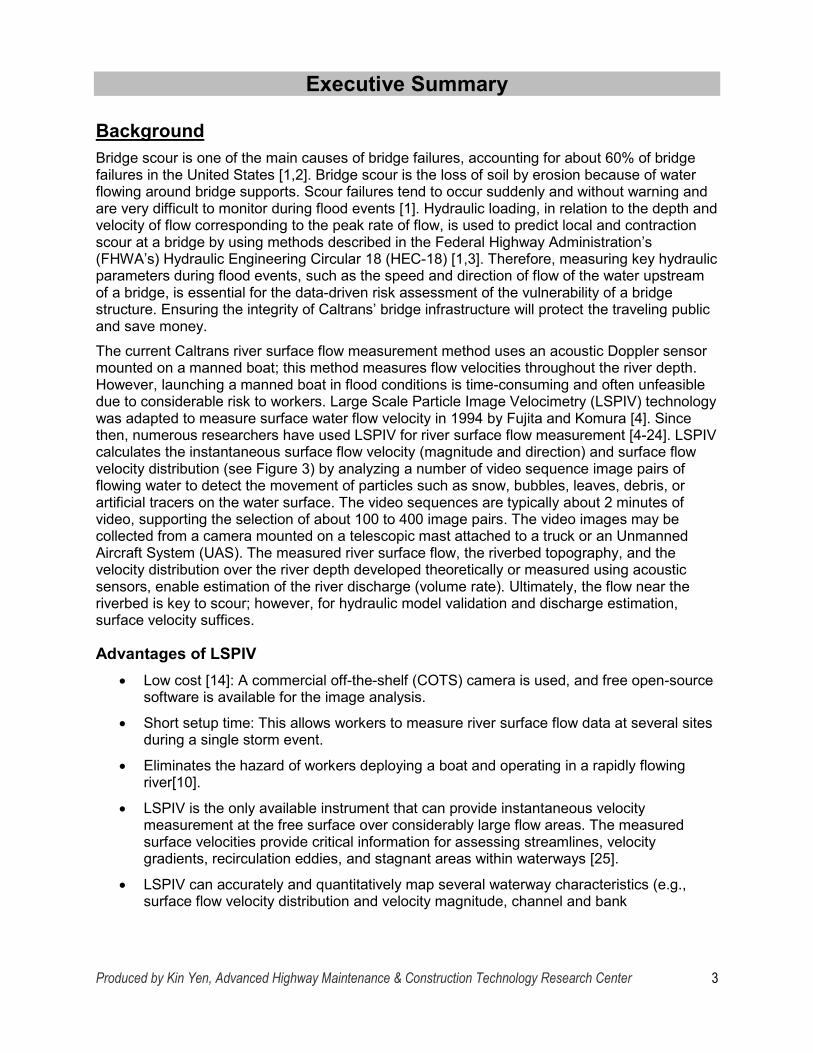
Background Bridge scour is one of the main causes of bridge failures, accounting for about 60% of bridge failures in the United States [1,2]. Bridge scour is the loss of soil by erosion because of water flowing around bridge supports. Scour failures tend to occur suddenly and without warning and are very difficult to monitor during flood events [1]. Hydraulic loading, in relation to the depth and velocity of flow corresponding to the peak rate of flow, is used to predict local and contraction scour at a bridge by using methods described in the Federal Highway Administration’s (FHWA’s) Hydraulic Engineering Circular 18 (HEC-18) [1,3]. Therefore, measuring key hydraulic parameters during flood events, such as the speed and direction of flow of the water upstream of a bridge, is essential for the data-driven risk assessment of the vulnerability of a bridge structure. Ensuring the integrity of Caltrans’ bridge infrastructure will protect the traveling public and save money. The current Caltrans river surface flow measurement method uses an acoustic Doppler sensor mounted on a manned boat; this method measures flow velocities throughout the river depth. However, launching a manned boat in flood conditions is time-consuming and often unfeasible due to considerable risk to workers. Large Scale Particle Image Velocimetry (LSPIV) technology was adapted to measure surface water flow velocity in 1994 by Fujita and Komura [4]. Since then, numerous researchers have used LSPIV for river surface flow measurement [4-24]. LSPIV calculates the instantaneous surface flow velocity (magnitude and direction) and surface flow velocity distribution (see Figure 3) by analyzing a number of video sequence image pairs of flowing water to detect the movement of particles such as snow, bubbles, leaves, debris, or artificial tracers on the water surface. The video sequences are typically about 2 minutes of video, supporting the selection of about 100 to 400 image pairs. The video images may be collected from a camera mounted on a telescopic mast attached to a truck or an Unmanned Aircraft System (UAS). The measured river surface flow, the riverbed topography, and the velocity distribution over the river depth developed theoretically or measured using acoustic sensors, enable estimation of the river discharge (volume rate). Ultimately, the flow near the riverbed is key to scour; however, for hydraulic model validation and discharge estimation, surface velocity suffices.
Advantages of LSPIV Low cost [14]: A commercial off-the-shelf (COTS) camera is used, and free open-source
software is available for the image analysis.
Short setup time: This allows workers to measure river surface flow data at several sites during a single storm event.
Eliminates the hazard of workers deploying a boat and operating in a rapidly flowing river[10].
LSPIV is the only available instrument that can provide instantaneous velocity measurement at the free surface over considerably large flow areas. The measured surface velocities provide critical information for assessing streamlines, velocity gradients, recirculation eddies, and stagnant areas within waterways [25].
LSPIV can accurately and quantitatively map several waterway characteristics (e.g., surface flow velocity distribution and velocity magnitude, channel and bank
Produced by Kin Yen, Advanced Highway Maintenance & Construction Technology Research Center 3
characteristics including vegetation presence) in the vicinity of the bridges using one measurement tool [25].
COTS thermal image infrared (IR) cameras (sensitivity 7 to 14 µm wavelength infrared radiation) have been used to capture images at night without illumination for LSPIV analysis [21-24].
The camera can capture surface signatures of the turbulent water column that lie beneath the surface. These signatures include circular boils, surface-attached vortices, and long stream-aligned convergence zones. IR thermal image data can be used to detect patches of warmer and cooler water brought to the surface. Using quantitative imaging techniques to passively track the signatures, researchers can extract metrics of the surface mean flow field, the turbulence intensity, the surface divergence and dissipation fields, and the integral length scales of the surface turbulence. IR cameras allow high-resolution images of the thermal disequilibrium patterns to be captured. These patterns can be tracked, allowing the turbulent surface velocity field to be remotely monitored [26].
Surface turbulence metrics, readily measurable by visible-light and IR-based LSPIV approaches, are rich with information on the complex flows and boundary conditions beneath the free surface [26].
To calibrate hydraulic models used for bridge scour analysis, it is necessary to collect information about the flow characteristics in a river during flood events. However, per the Caltrans Request for Preliminary Investigation, “a manned boat can be difficult to deploy and dangerous to operate in flood conditions.” Deploying instruments from a bridge deck is also challenging and limited in spatial extent. A new data collection method is needed for determining discharge and flow velocity (magnitude and direction) in a river which: can be used over a large spatial area (1,000 - 2,000 feet), is quick to use, is safe for Caltrans personnel, and is easily deployable. This Preliminary Investigation (PI) investigated the potential for using LSPIV techniques to collect the needed flood flow data. This included recommended methods for collecting data such as using a UAS or truck-mounted mast system. Based on the PI results, the use of LSPIV to obtain river flood flow data can improve hydraulic modeling for scour evaluations.
Summary of Findings
LSPIV Theory and Overview Ichiro Fujita,1 Marian Muste,2 and their research associates have performed extensive research on using LSPIV for river surface flow measurement. Their research papers provide detailed LSPIV theory, image processing algorithms, laboratory and field implementation examples, accuracy verification, and guidelines on the application of LSPIV [4,9,27]. Muste et al. [25] developed a mobile LSPIV data collection system, image processing software (DIGIMAP), and field procedures and performed case studies funded by Iowa Department of Transportation (DOT). LSPIV consists of four major components: illumination, seeding, image recording, and image processing [13,14].
1 Associate Professor, Kobe University, Japan 2 Research Engineer, Iowa Institute of Hydraulic Research, University of Iowa
Produced by Kin Yen, Advanced Highway Maintenance & Construction Technology Research Center 4
Illumination For river surface flow measurement, the illumination is the natural sunlight. The typical COTS camera used for LSPIV does not perform well in low-light conditions. The United States Geological Survey’s (USGS) “Guidelines for the collection of video for Large Scale Particle Velocimetry (LSPIV)”3 provides best practices guidelines for camera setup to avoid poor lighting conditions. Strong reflections, glare, shadows, and sparkling patterns on the filmed surface can degrade the image quality, resulting in poor image analysis results [14]. Polarizing lens filters can be used to mitigate or remove surface reflections. COTS color and near IR cameras used for LSPIV do not work at night. However, COTS thermal image IR cameras have been successfully used by researchers for LSPIV image collection at night without any illumination [21-24]. Seeding LSPIV analysis requires visible particles on the water surface in order to track their movement and measure velocity (speed and direction). In some cases, natural debris such as bubbles, snow, and leaves provide sufficient visual data for LSPIV image analysis. Sometimes, artificial “tracers” are added to provide sufficient visual aid for the LSPIV image analysis. A variety of materials are used for tracers, including Eco-foam [13,14], wood mulch [6], oranges [10], and straw [13,14]. Muste et al. [13] found that Eco-foam is superior to straw. The artificial tracer size must be large enough to occupy at least one pixel of the camera image [7]. Puleo et al. [23] found that naturally-formed foam tended to be more abundant near both banks relative to the middle of the river, and that the “thermal signal”, collected using thermal image IR camera for LSPIV tracking, is available evenly across the entire river surface[23]. Puleo et al. state that the cause of the thermal signal was a small apparent temperature contrast induced by turbulent mixing of a thin layer of cooler water near the river surface with underlying warmer water. Yu et al. [21] and Puleo et al. [23] both found that thermal image IR camera data enable them to measure slow river surface flow (slower than 0.1 m/s) due to these “thermal signals.” When river surface flow is slow, naturally formed tracers are not sufficient for LSPIV tracking. Image Recording Generally, COTS color, near IR, and thermal image IR cameras are used for LSPIV. The minimum color video resolution used was 640x480 at 30 frames per second (fps). Recent LSPIV applications have utilized color cameras with 1920x1080 at 30 fps. Typical recording session durations are about two minutes, allowing the selection of about 100 to 400 image pairs. The camera should be elevated as high as possible to increase tilt angle in order to minimize the error from orthorectification. The more oblique the camera is to the stream surface, the more error is produced in image registration and transformation [7]. Higher resolution video would improve the tracking of tracers at the expense of increased processing time. Yu et al. [21] and Puleo et al. [23] compared the LSPIV result from images collected by color, near IR, and thermal image IR camera during daytime and nighttime. Yu et al. [21] found that near IR cameras work best during the day time, and thermal image IR cameras work well at night without illumination. Puleo et al. [23] provided similar findings. Puleo et al. performed noise analysis on thermal image IR camera data and provided thermal sensitivity requirement recommendations. Thermal image IR cameras used by LSPIV researchers include:
TBT TSM-73: 720x516 image resolution, 25 fps, 0.07 oF temperature resolution, 8 to 14 µm wavelength sensitivity [21]
3 https://my.usgs.gov/confluence/pages/viewpage.action?pageId=546865360
Produced by Kin Yen, Advanced Highway Maintenance & Construction Technology Research Center 5
FLIR Systems ThermaCAM S65HSV: 320x240 image resolution, 30 fps, 0.09 oF temperature resolution, 7.5 to 13 µm wavelength sensitivity [24]
FLIR Systems SC660:, 640x480 image resolution, 25 fps, 0.09 oF temperature resolution, 7.5 to 13 µm wavelength sensitivity [23]
Advantages of thermal image IR camera:
Work at night, in fog, or in smoke without any illumination
Capture water surface temperature and turbulence
Detect slow river surface flow without aid of artificial tracers Disadvantages of thermal image IR camera:
High cost compared to color and near IR cameras
Lower image resolution and frame rate compared to color or near IR cameras
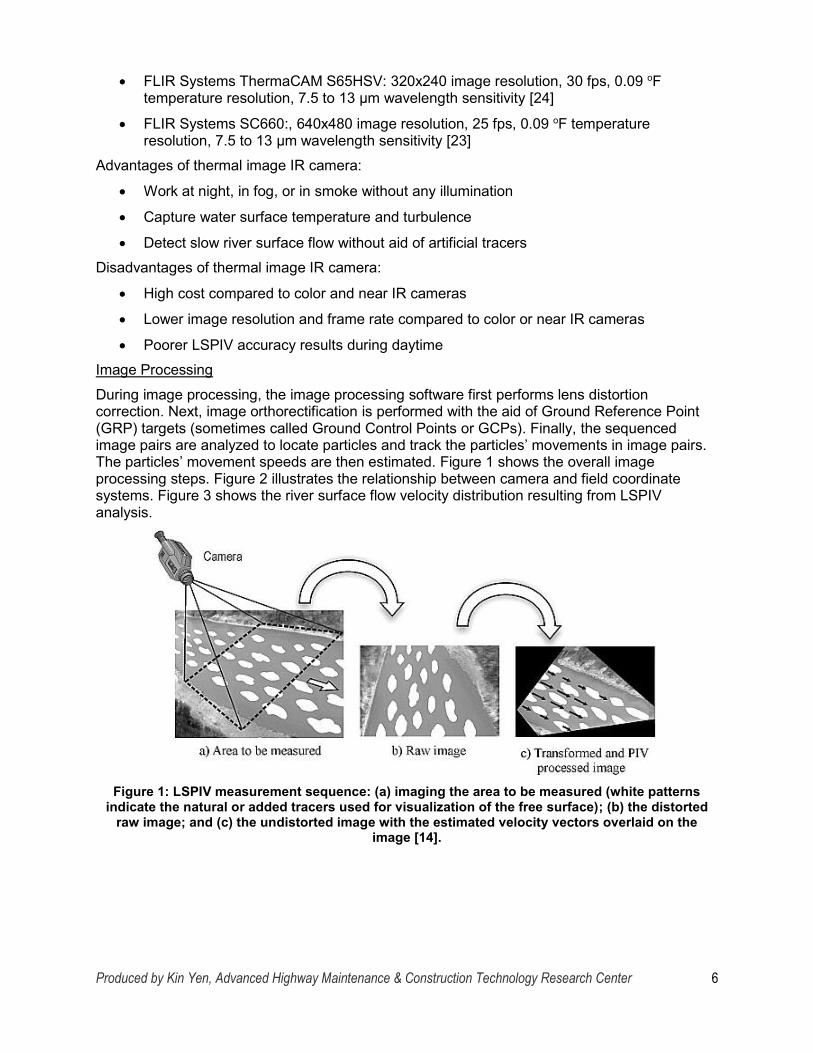
Poorer LSPIV accuracy results during daytime Image Processing During image processing, the image processing software first performs lens distortion correction. Next, image orthorectification is performed with the aid of Ground Reference Point (GRP) targets (sometimes called Ground Control Points or GCPs). Finally, the sequenced image pairs are analyzed to locate particles and track the particles’ movements in image pairs. The particles’ movement speeds are then estimated. Figure 1 shows the overall image processing steps. Figure 2 illustrates the relationship between camera and field coordinate systems. Figure 3 shows the river surface flow velocity distribution resulting from LSPIV analysis.
Figure 1: LSPIV measurement sequence: (a) imaging the area to be measured (white patterns indicate the natural or added tracers used for visualization of the free surface); (b) the distorted
raw image; and (c) the undistorted image with the estimated velocity vectors overlaid on the image [14].
Produced by Kin Yen, Advanced Highway Maintenance & Construction Technology Research Center 6
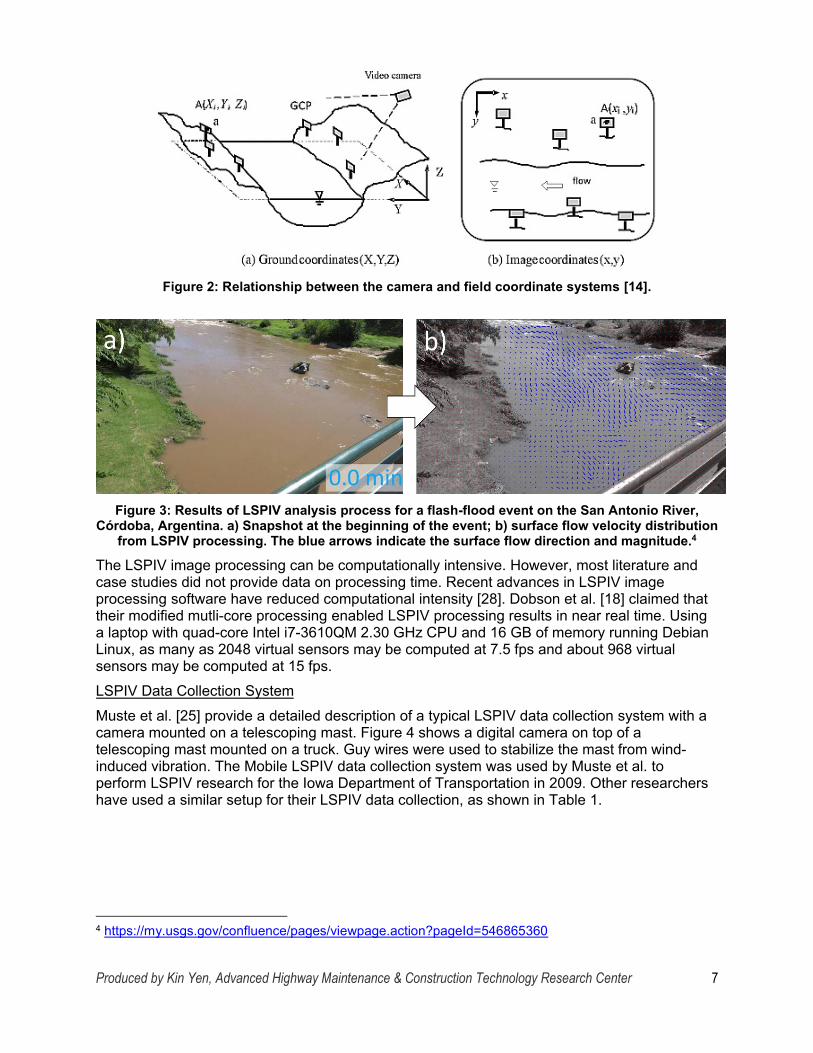
Figure 2: Relationship between the camera and field coordinate systems [14].
Figure 3: Results of LSPIV analysis process for a flash-flood event on the San Antonio River, Córdoba, Argentina. a) Snapshot at the beginning of the event; b) surface flow velocity distribution
from LSPIV processing. The blue arrows indicate the surface flow direction and magnitude.4
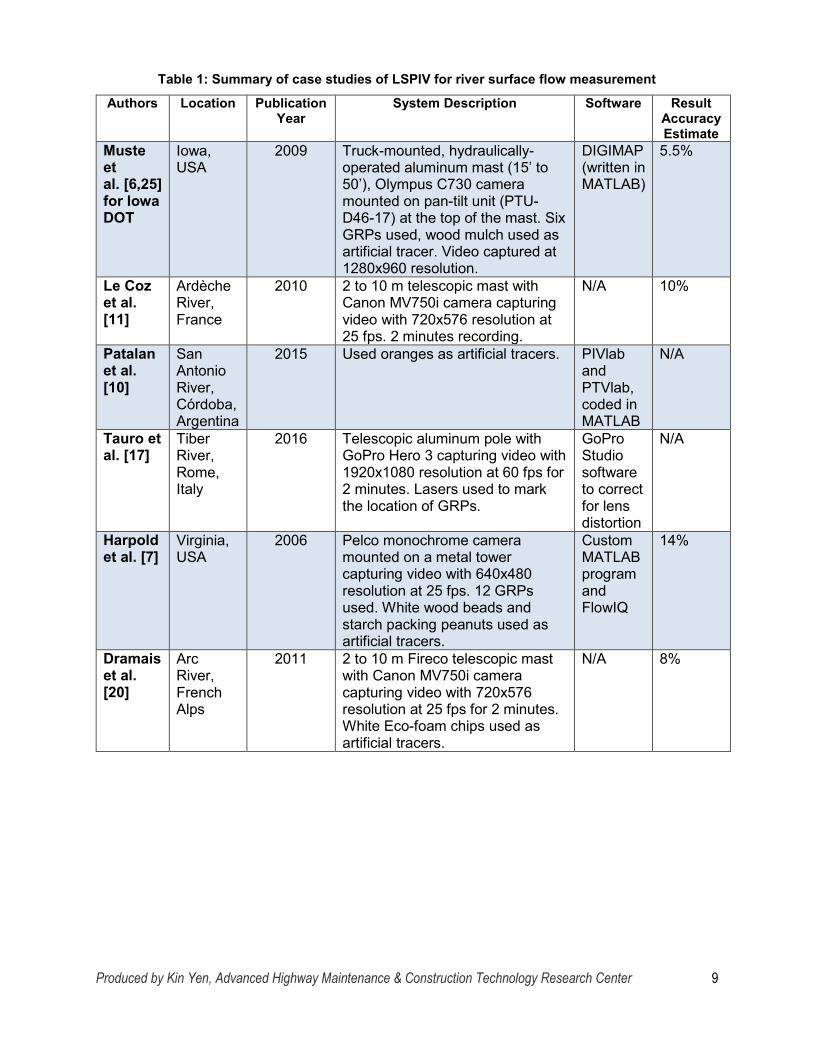
The LSPIV image processing can be computationally intensive. However, most literature and case studies did not provide data on processing time. Recent advances in LSPIV image processing software have reduced computational intensity [28]. Dobson et al. [18] claimed that their modified mutli-core processing enabled LSPIV processing results in near real time. Using a laptop with quad-core Intel i7-3610QM 2.30 GHz CPU and 16 GB of memory running Debian Linux, as many as 2048 virtual sensors may be computed at 7.5 fps and about 968 virtual sensors may be computed at 15 fps. LSPIV Data Collection System Muste et al. [25] provide a detailed description of a typical LSPIV data collection system with a camera mounted on a telescoping mast. Figure 4 shows a digital camera on top of a telescoping mast mounted on a truck. Guy wires were used to stabilize the mast from wind-induced vibration. The Mobile LSPIV data collection system was used by Muste et al. to perform LSPIV research for the Iowa Department of Transportation in 2009. Other researchers have used a similar setup for their LSPIV data collection, as shown in Table 1.
4 https://my.usgs.gov/confluence/pages/viewpage.action?pageId=546865360
Produced by Kin Yen, Advanced Highway Maintenance & Construction Technology Research Center 7
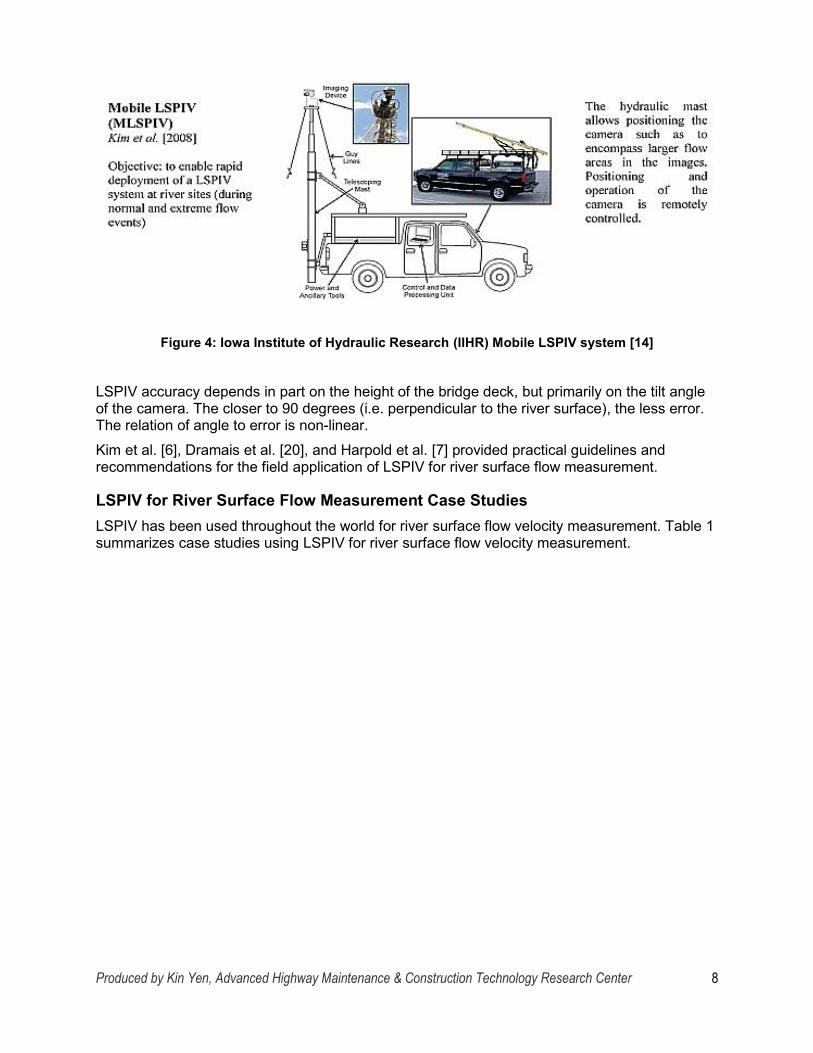
Figure 4: Iowa Institute of Hydraulic Research (IIHR) Mobile LSPIV system [14]
LSPIV accuracy depends in part on the height of the bridge deck, but primarily on the tilt angle of the camera. The closer to 90 degrees (i.e. perpendicular to the river surface), the less error. The relation of angle to error is non-linear. Kim et al. [6], Dramais et al. [20], and Harpold et al. [7] provided practical guidelines and recommendations for the field application of LSPIV for river surface flow measurement.
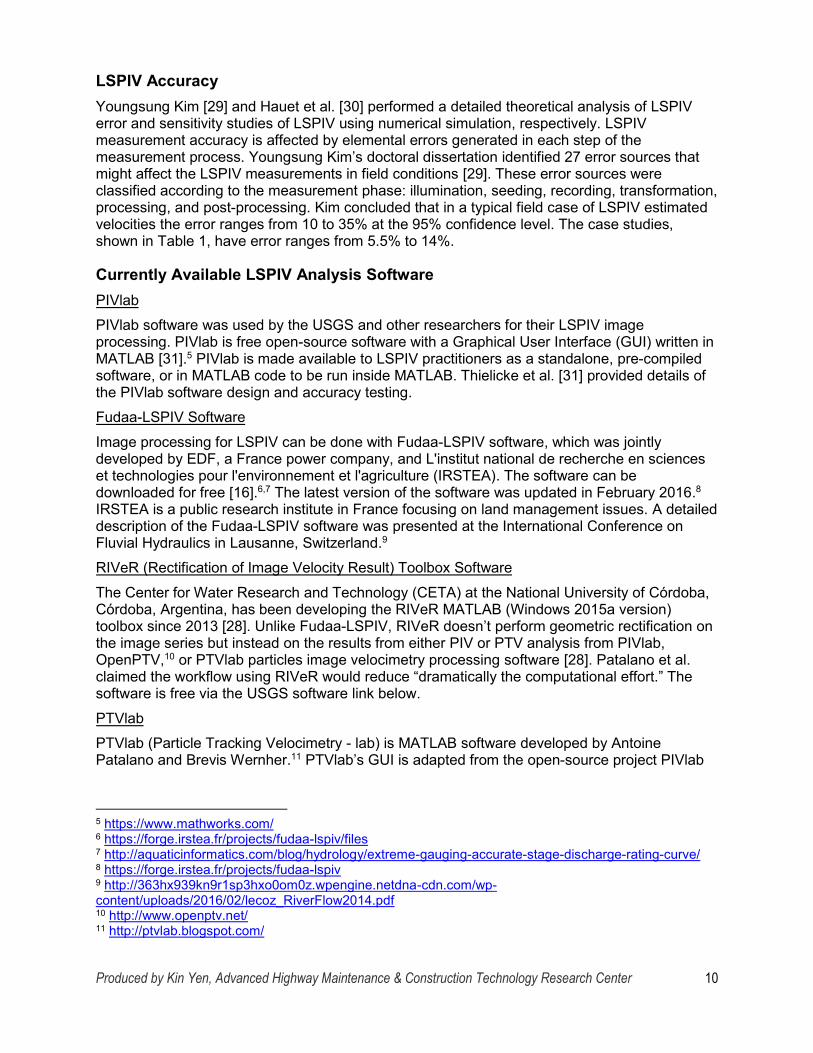
LSPIV for River Surface Flow Measurement Case Studies LSPIV has been used throughout the world for river surface flow velocity measurement. Table 1 summarizes case studies using LSPIV for river surface flow velocity measurement.
Produced by Kin Yen, Advanced Highway Maintenance & Construction Technology Research Center 8
Authors Location Publication Year
System Description Software Result Accuracy
Estimate Muste et al. [6,25] for Iowa DOT
Iowa, USA
2009 Truck-mounted, hydraulically-operated aluminum mast (15’ to 50’), Olympus C730 camera mounted on pan-tilt unit (PTU-D46-17) at the top of the mast. Six GRPs used, wood mulch used as artificial tracer. Video captured at 1280x960 resolution.
DIGIMAP (written in MATLAB)
5.5%
Le Coz et al.
[11]
Ardèche River,
France
2010 2 to 10 m telescopic mast with Canon MV750i camera capturing
video with 720x576 resolution at 25 fps. 2 minutes recording.
N/A 10%
Patalan et al.
San Antonio
2015 Used oranges as artificial tracers. PIVlab and
N/A
[10] River, Córdoba, Argentina
PTVlab, coded in
MATLAB Tauro et
al. [17] Tiber
River, Rome,
Italy
2016 Telescopic aluminum pole with GoPro Hero 3 capturing video with
1920x1080 resolution at 60 fps for 2 minutes. Lasers used to mark
the location of GRPs.
GoPro Studio software
to correct for lens
N/A
distortion Harpold
et al. [7] Virginia,
USA 2006 Pelco monochrome camera
mounted on a metal tower capturing video with 640x480
resolution at 25 fps. 12 GRPs used. White wood beads and
Custom MATLAB
program and
FlowIQ
14%
starch packing peanuts used as artificial tracers.
Dramais et al.
[20]
Arc River,
French Alps
2011 2 to 10 m Fireco telescopic mast with Canon MV750i camera
capturing video with 720x576 resolution at 25 fps for 2 minutes.
White Eco-foam chips used as artificial tracers.
N/A 8%
Table 1: Summary of case studies of LSPIV for river surface flow measurement
Produced by Kin Yen, Advanced Highway Maintenance & Construction Technology Research Center 9
LSPIV Accuracy Youngsung Kim [29] and Hauet et al. [30] performed a detailed theoretical analysis of LSPIV error and sensitivity studies of LSPIV using numerical simulation, respectively. LSPIV measurement accuracy is affected by elemental errors generated in each step of the measurement process. Youngsung Kim’s doctoral dissertation identified 27 error sources that might affect the LSPIV measurements in field conditions [29]. These error sources were classified according to the measurement phase: illumination, seeding, recording, transformation, processing, and post-processing. Kim concluded that in a typical field case of LSPIV estimated velocities the error ranges from 10 to 35% at the 95% confidence level. The case studies, shown in Table 1, have error ranges from 5.5% to 14%.
Currently Available LSPIV Analysis Software PIVlab PIVlab software was used by the USGS and other researchers for their LSPIV image processing. PIVlab is free open-source software with a Graphical User Interface (GUI) written in MATLAB [31].5 PIVlab is made available to LSPIV practitioners as a standalone, pre-compiled software, or in MATLAB code to be run inside MATLAB. Thielicke et al. [31] provided details of the PIVlab software design and accuracy testing. Fudaa-LSPIV Software Image processing for LSPIV can be done with Fudaa-LSPIV software, which was jointly developed by EDF, a France power company, and L'institut national de recherche en sciences et technologies pour l'environnement et l'agriculture (IRSTEA). The software can be downloaded for free [16].6,7 The latest version of the software was updated in February 2016.8
IRSTEA is a public research institute in France focusing on land management issues. A detailed description of the Fudaa-LSPIV software was presented at the International Conference on Fluvial Hydraulics in Lausanne, Switzerland.9
RIVeR (Rectification of Image Velocity Result) Toolbox Software The Center for Water Research and Technology (CETA) at the National University of Córdoba, Córdoba, Argentina, has been developing the RIVeR MATLAB (Windows 2015a version) toolbox since 2013 [28]. Unlike Fudaa-LSPIV, RIVeR doesn’t perform geometric rectification on the image series but instead on the results from either PIV or PTV analysis from PIVlab, OpenPTV,10 or PTVlab particles image velocimetry processing software [28]. Patalano et al. claimed the workflow using RIVeR would reduce “dramatically the computational effort.” The software is free via the USGS software link below. PTVlab PTVlab (Particle Tracking Velocimetry - lab) is MATLAB software developed by Antoine Patalano and Brevis Wernher.11 PTVlab’s GUI is adapted from the open-source project PIVlab
5 https://www.mathworks.com/ 6 https://forge.irstea.fr/projects/fudaa-lspiv/files 7 http://aquaticinformatics.com/blog/hydrology/extreme-gauging-accurate-stage-discharge-rating-curve/ 8 https://forge.irstea.fr/projects/fudaa-lspiv 9 http://363hx939kn9r1sp3hxo0om0z.wpengine.netdna-cdn.com/wp-content/uploads/2016/02/lecoz_RiverFlow2014.pdf 10 http://www.openptv.net/ 11 http://ptvlab.blogspot.com/
Produced by Kin Yen, Advanced Highway Maintenance & Construction Technology Research Center 10
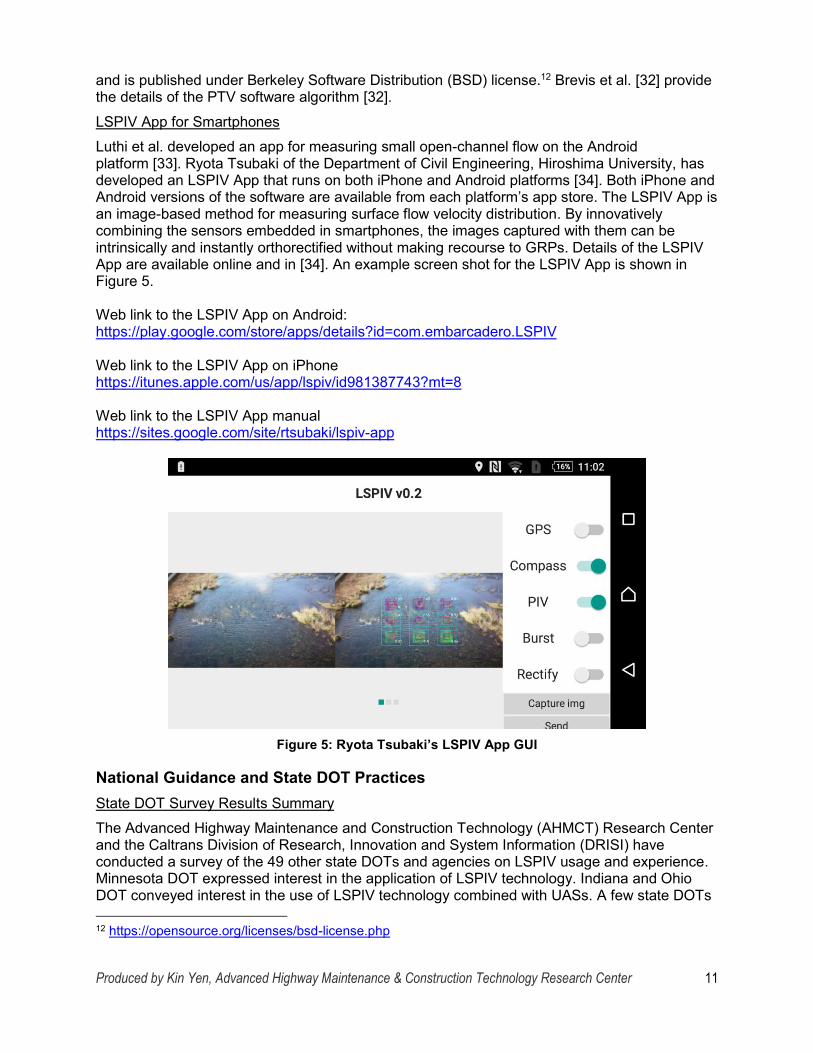
and is published under Berkeley Software Distribution (BSD) license.12 Brevis et al. [32] provide the details of the PTV software algorithm [32]. LSPIV App for Smartphones Luthi et al. developed an app for measuring small open-channel flow on the Android platform [33]. Ryota Tsubaki of the Department of Civil Engineering, Hiroshima University, has developed an LSPIV App that runs on both iPhone and Android platforms [34]. Both iPhone and Android versions of the software are available from each platform’s app store. The LSPIV App is an image-based method for measuring surface flow velocity distribution. By innovatively combining the sensors embedded in smartphones, the images captured with them can be intrinsically and instantly orthorectified without making recourse to GRPs. Details of the LSPIV App are available online and in [34]. An example screen shot for the LSPIV App is shown in Figure 5.
Web link to the LSPIV App on Android: https://play.google.com/store/apps/details?id=com.embarcadero.LSPIV
Web link to the LSPIV App on iPhone https://itunes.apple.com/us/app/lspiv/id981387743?mt=8
Web link to the LSPIV App manual https://sites.google.com/site/rtsubaki/lspiv-app
Figure 5: Ryota Tsubaki’s LSPIV App GUI
National Guidance and State DOT Practices State DOT Survey Results Summary The Advanced Highway Maintenance and Construction Technology (AHMCT) Research Center and the Caltrans Division of Research, Innovation and System Information (DRISI) have conducted a survey of the 49 other state DOTs and agencies on LSPIV usage and experience. Minnesota DOT expressed interest in the application of LSPIV technology. Indiana and Ohio DOT conveyed interest in the use of LSPIV technology combined with UASs. A few state DOTs
12 https://opensource.org/licenses/bsd-license.php
Produced by Kin Yen, Advanced Highway Maintenance & Construction Technology Research Center 11
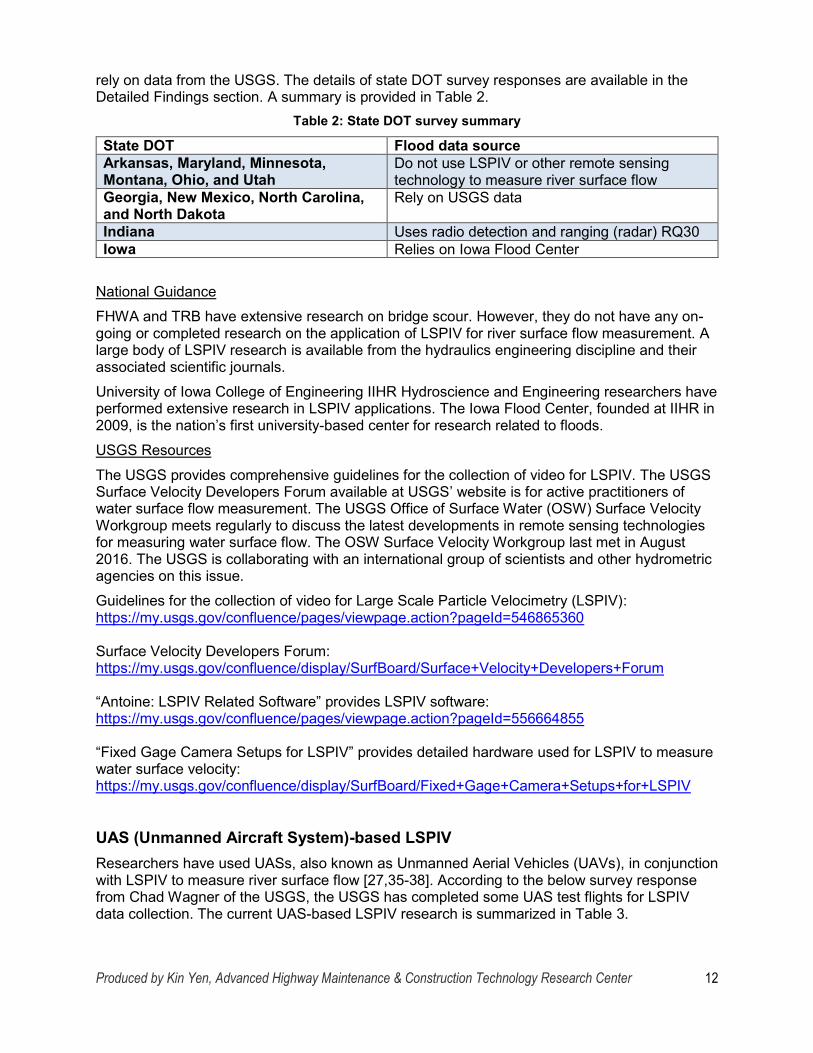
rely on data from the USGS. The details of state DOT survey responses are available in the Detailed Findings section. A summary is provided in Table 2.
Table 2: State DOT survey summary
State DOT Flood data source Arkansas, Maryland, Minnesota, Montana, Ohio, and Utah
Do not use LSPIV or other remote sensing technology to measure river surface flow
Georgia, New Mexico, North Carolina, and North Dakota
Rely on USGS data
Indiana Uses radio detection and ranging (radar) RQ30 Iowa Relies on Iowa Flood Center
National Guidance FHWA and TRB have extensive research on bridge scour. However, they do not have any on-going or completed research on the application of LSPIV for river surface flow measurement. A large body of LSPIV research is available from the hydraulics engineering discipline and their associated scientific journals. University of Iowa College of Engineering IIHR Hydroscience and Engineering researchers have performed extensive research in LSPIV applications. The Iowa Flood Center, founded at IIHR in 2009, is the nation’s first university-based center for research related to floods. USGS Resources The USGS provides comprehensive guidelines for the collection of video for LSPIV. The USGS Surface Velocity Developers Forum available at USGS’ website is for active practitioners of water surface flow measurement. The USGS Office of Surface Water (OSW) Surface Velocity Workgroup meets regularly to discuss the latest developments in remote sensing technologies for measuring water surface flow. The OSW Surface Velocity Workgroup last met in August 2016. The USGS is collaborating with an international group of scientists and other hydrometric agencies on this issue. Guidelines for the collection of video for Large Scale Particle Velocimetry (LSPIV): https://my.usgs.gov/confluence/pages/viewpage.action?pageId=546865360
Surface Velocity Developers Forum: https://my.usgs.gov/confluence/display/SurfBoard/Surface+Velocity+Developers+Forum
“Antoine: LSPIV Related Software” provides LSPIV software: https://my.usgs.gov/confluence/pages/viewpage.action?pageId=556664855
“Fixed Gage Camera Setups for LSPIV” provides detailed hardware used for LSPIV to measure water surface velocity: https://my.usgs.gov/confluence/display/SurfBoard/Fixed+Gage+Camera+Setups+for+LSPIV
UAS (Unmanned Aircraft System)-based LSPIV Researchers have used UASs, also known as Unmanned Aerial Vehicles (UAVs), in conjunction with LSPIV to measure river surface flow [27,35-38]. According to the below survey response from Chad Wagner of the USGS, the USGS has completed some UAS test flights for LSPIV data collection. The current UAS-based LSPIV research is summarized in Table 3.
Produced by Kin Yen, Advanced Highway Maintenance & Construction Technology Research Center 12
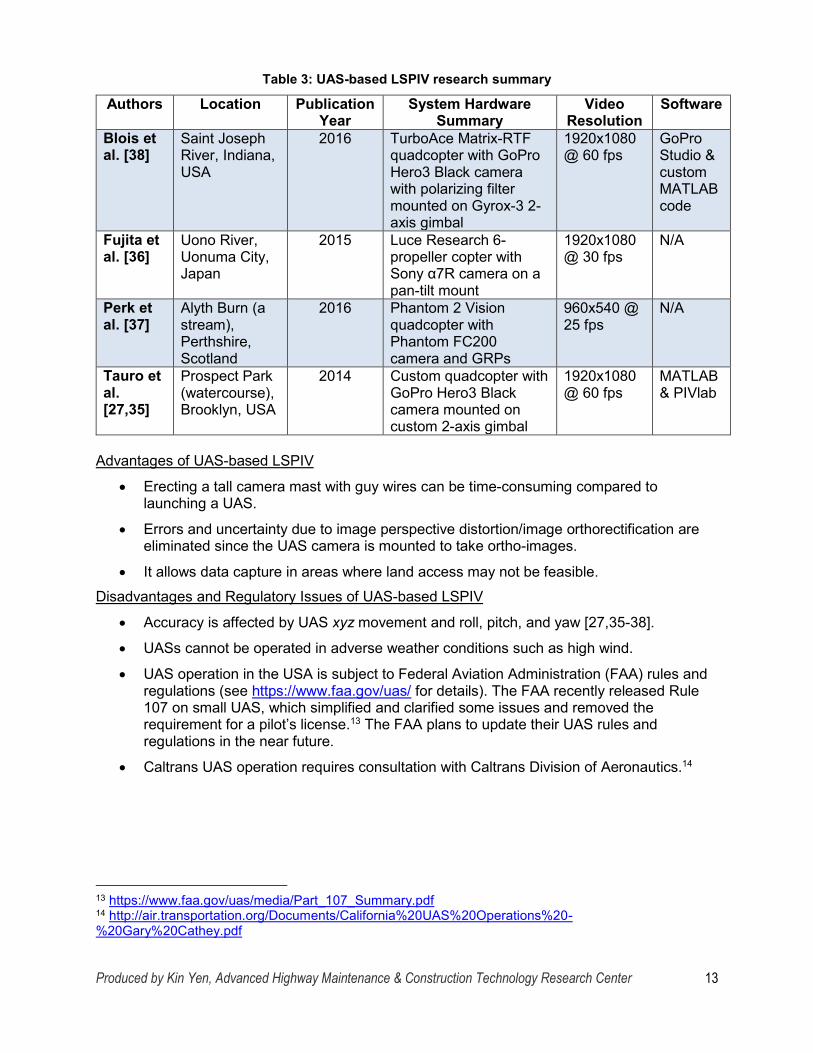
Table 3: UAS-based LSPIV research summary
Authors Location Publication System Hardware Video Software Year Summary Resolution
Blois et al. [38]
Saint Joseph River, Indiana, USA
2016 TurboAce Matrix-RTF quadcopter with GoPro Hero3 Black camera
1920x1080 @ 60 fps
GoPro Studio & custom
with polarizing filter mounted on Gyrox-3 2-axis gimbal
MATLAB code
Fujita et Uono River, 2015 Luce Research 6- 1920x1080 N/A al. [36] Uonuma City, propeller copter with @ 30 fps
Japan Sony α7R camera on a pan-tilt mount
Perk et Alyth Burn (a 2016 Phantom 2 Vision 960x540 @ N/A al. [37] stream), quadcopter with 25 fps
Perthshire, Phantom FC200 Scotland camera and GRPs
Tauro et Prospect Park 2014 Custom quadcopter with 1920x1080 MATLAB al. (watercourse), GoPro Hero3 Black @ 60 fps & PIVlab [27,35] Brooklyn, USA camera mounted on
custom 2-axis gimbal
Advantages of UAS-based LSPIV
Erecting a tall camera mast with guy wires can be time-consuming compared to launching a UAS.
Errors and uncertainty due to image perspective distortion/image orthorectification are eliminated since the UAS camera is mounted to take ortho-images.
It allows data capture in areas where land access may not be feasible. Disadvantages and Regulatory Issues of UAS-based LSPIV
Accuracy is affected by UAS xyz movement and roll, pitch, and yaw [27,35-38].
UASs cannot be operated in adverse weather conditions such as high wind.
UAS operation in the USA is subject to Federal Aviation Administration (FAA) rules and regulations (see https://www.faa.gov/uas/ for details). The FAA recently released Rule 107 on small UAS, which simplified and clarified some issues and removed the requirement for a pilot’s license.13 The FAA plans to update their UAS rules and regulations in the near future.
Caltrans UAS operation requires consultation with Caltrans Division of Aeronautics.14
13 https://www.faa.gov/uas/media/Part_107_Summary.pdf 14 http://air.transportation.org/Documents/California%20UAS%20Operations%20-%20Gary%20Cathey.pdf
Produced by Kin Yen, Advanced Highway Maintenance & Construction Technology Research Center 13
Mitigation of Some Technical Disadvantages of UAS-based LSPIV
Gimbal camera stabilization is often used to counteract the UAS roll and pitch movement and keep the camera pointing directly downward, parallel to gravity [27,35,38].
Advanced image processing can be used with fixed GRPs to minimize the error caused by the UAS movement [36,37].
Related Research and Resources A comprehensive literature search utilizing Google, Google Scholar, and the TRB and FHWA web search tools, revealed several useful references, studies, and analyses related to other practical remote sensing technology commonly used for river surface flow measurement. Other Remote Sensing Technology for River Surface Flow Measurement Both Indiana DOT and the USGS have used portable surface velocity radar (PSVR) for river surface flow measurement. Indiana DOT discusses their work in this area in their below survey response. The USGS has performed extensive research on the use of PSVR for river surface flow measurement since 2000 [12,39]. “Guidelines for Siting and Operating Surface-water Velocity Radars”15 extends the non-contact methods initiated by HYDRO 21 [39]. Within the USGS Hydrologic Instrumentation Facility (HIF), project chiefs from six USGS Water Science Centers (WSCs) and two vendors (Stalker and Hydrological Services of America (HSA)) participated in proof-of-concept testing of PSVR. USGS has worked with Environment and Climate Change Canada16 and the Swiss Federal Institute of Metrology17 (METAS) on the evaluation of PSVR in laboratory and field tests. PSVR can:
1. Deliver real-time discharge at new stations where stage-discharge, index-velocity, or slope-discharge ratings are not available;
2. Corroborate indirect measurements; 3. Provide an alternative for measuring discharge at sites with complex ratings.
Comparison of PSVR and LSPIV PSVR and LSPIV have their strengths and weaknesses.
PSVR is not reliable for flow below 0.7 m/s according to USGS.
LSPIV does not work in the dark if visible light or near IR camera is used for image collection. However, thermal imaging IR camera can collect usable images at night and in fog.
PSVR measures flow speed one location point at a time and cannot measure surface flow velocity distribution like LSPIV can. The flow distribution and flow direction are instrumental in the calibration of the hydraulic models. Therefore, PSVR would be useful in achieving Caltrans users’ primary objective.
15 https://my.usgs.gov/confluence/display/SurfBoard/Guidelines+for+Siting+and+Operating+Surface-water+Velocity+Radars 16 https://www.ec.gc.ca/cc/ 17 http://www.metas.ch/metas/en/home.html
Produced by Kin Yen, Advanced Highway Maintenance & Construction Technology Research Center 14
IRSTEA Research on using PSVR Jerome Le Coz, an IRSTEA scientist, presented their PSVR research at the New Zealand Hydrological Society’s (NZHS’s) technical workshop in Gisborne, New Zealand in early April 2016. Le Coz’s presentation covered both the use of PSVR and LSPIV.18
According to Le Coz et al., PSVR advantages are:
Very easy to use
Quick measurement (~2 minutes per position)
Overall ±10% difference and PSVR limitations are:
The PSVR instrument as implemented is not waterproof
The water surface must be rough (have ripples)
High velocity errors with V < 0.5 m/s according to IRSTEA
Gaps in Findings A comprehensive literature search failed to identify any COTS mobile LSPIV system for river surface flow measurement. Practitioners have put together mobile LSPIV systems using COTS components (camera, telescoping mast and/or UAS, software, and tracers). The existing LSPIV image processing programs are written by researchers and have been proven by many independent researchers and case studies. Although the LSPIV image processing programs are free and open-source, there are no commercial companies actively supporting and developing this or any other LSPIV software. However, peer-to-peer support is available via the USGS developer forum. A system, workflow, and methodology must be assembled and tested to best meet Caltrans’ specific requirements.
Next Steps
Recommendations on Mast-based LSPIV for River Surface Flow Measurement International and national hydraulics engineering researchers have shown that LSPIV is a viable and commonly used technology for measuring river surface flow. By carefully following LSPIV data collection guidelines and recommendations, LSPIV would provide accurate river surface flow velocity data over a large water surface area. This PI revealed a wide array of equipment configurations used for LSPIV for river surface flow measurement data collection and software for image processing. Adaptation of this technology for use in Caltrans would provide much greater access to field data for studying bridge scour than is currently is available and would do so in a safer manner. Strategic Steps for LSPIV Implementation
1. Develop Caltrans-specific LSPIV requirements to achieve their specific operational objectives.
2. Follow USGS LSPIV guidelines in Caltrans LSPIV implementation. 3. Evaluate LSPIV for river surface flow measurement.
18 https://drive.google.com/file/d/0B7VZuWAt62X4cF9xNlBMS0JUMnc/view
Produced by Kin Yen, Advanced Highway Maintenance & Construction Technology Research Center 15
a. Develop a prototype mobile LSPIV for testing and technology evaluation. i. Procure COTS components that meet Caltrans’ specific needs. If this
cannot be done with COTS components, then design, fabricate, and develop components.
ii. Evaluate component hardware
Color, near IR, and thermal image IR cameras.
Truck-mounted mast. iii. Conduct field testing and evaluation.
b. Evaluate LSPIV image processing software suites. c. Develop Caltrans-specific LSPIV workflow and guidelines to ensure consistent
data collection results and data accuracy. 4. Field operational testing and pilot studies on several mobile LSPIV systems.
Recommendations for UAS-based LSPIV for River Surface Flow Measurement 1. FAA rules for the operation of unmanned aircraft systems (UASs) must be reviewed
carefully to ensure that Caltrans could operate a UAS for LSPIV without violating FAA regulations.
a. Submit application to the FAA for Certificate of Authorization (COA) to conduct UAS operations.
2. Consultation with Caltrans Division of Aeronautics is required before any Caltrans UAS operation.
a. Review California aviation legislation.19
b. Review Caltrans DRISI PI: “The Use of Unmanned Aerial Systems for Steep Terrain Investigations”20 for details on rules, regulations, and policy related to UAS operation. Confirm that these rules are current, as the rules are rapidly evolving.
3. Based on existing UAS-based LSPIV case studies and LSPIV requirements, it is likely that a COTS UAS could be used with minor modifications.
4. Evaluation of the use of UASs for LSPIV should proceed provided that FAA, California, and Caltrans laws and regulations would not be violated.
19 http://dot.ca.gov/hq/planning/aeronaut/documents/leg_reports/LR03252016.pdf 20http://www.dot.ca.gov/research/researchreports/preliminary_investigations/docs/unmanned_aerial_syst ems_preliminary_investigation_rev8-14-14.pdf
Produced by Kin Yen, Advanced Highway Maintenance & Construction Technology Research Center 16
Detailed Findings Consultation with State DOTs
A survey of other transportation agency’s current practices or experiences with LSPIV and other remote sensing technologies to measure river surface flow was conducted. This survey was sent by Caltrans DRISI to the American Association of State Highway and Transportation Officials (AASHTO) Research Advisory Committee (RAC) for distribution. Of the 50 states and other transportation agencies contacted, the below questionnaire responses were received. The questionnaire is provided here for reference, and the questions are omitted in the results section.
1. Does your agency have any innovative methods such as radar (other than LSPIV) to measure river flood flow without using a boat in the water? If so, please briefly describe the innovative methods and equipment your agency utilizes.
2. Has your agency utilized or considered using Large Scale Particle Image Velocimetry (LSPIV) techniques to collect river flood flow data? If so, please answer the following questions.
If yes: a. What is the current video data collection hardware? (E.g. truck-mounted mast
model and maker? Camera model? Computer or tablet used?) b. What are your LSPIV data collection procedures and/or best practices (Truck-
mounted mast height? Camera resolution? Camera frame rate? Recording duration? Number of ground control points?)
c. What LSPIV analysis software is used? (Software name? Web link to software? Software vendor name?) Please also discuss software that you have evaluated and not used in your current operation.
3. Has your agency used an unmanned aerial vehicle (UAV) to collect data for LSPIV analysis to measure river flood flow data?
4. If you feel your agency has more information to offer on this subject, please provide contact information to allow a follow-up discussion.
5. Please provide any other information or feedback that you believe may be of value for this research.
Arkansas State Highway and Transportation Department Respondent: Mark Earl, P.E., Staff Hydraulic Engineer, Roadway Design Division, Arkansas State Highway and Transportation Department Survey answers:
1. No. 2. No. 3. No. 4. We have not used or evaluated any technology similar to what is being asked about. 5. We have no comments.
Additional comments: None
Indiana DOT Tommy E. Nantung, Manager for Pavement, Materials, and Construction Research, Indiana DOT, Division of Research and Development
Produced by Kin Yen, Advanced Highway Maintenance & Construction Technology Research Center 17
Survey answers: 1. We are using radar, the Sommer RQ-30 unit. This unit must still be verified with boat
measurements but it can calculate discharge internally after a vertical velocity constant is determined from those boat measurements. We mount the unit to the bridge.
2. No. 3. No. 4. No. 5. I would be interested in a UAV that could measure river flood flow data.
Additional comments: None
Iowa DOT Brian Worrel, P.E., SPR Research Engineer, Iowa DOT, Research & Analytics Survey answers:
1. We have the University of Iowa’s hydrologic flood forecasting model “CUENCAS” and their sensors that provide real-time stage/discharge information throughout the state. Google search “Iowa Flood Center” for more information.
2. No. 3. No. 4. N/A. 5. N/A.
Additional comments: None
Maryland DOT Hua Xiang, Office of Policy and Research, Maryland DOT Survey answers:
1. N/A. 2. N/A. 3. N/A. 4. N/A. 5. N/A.
Additional comments: Maryland Department of Transportation State Highway Administration has not used anything this sophisticated to measure river flood flow.
Minnesota DOT Nicole Bartelt, PE, Minnesota DOT Survey answers:
1. No. 2. Not at this time, potentially interested in the future. 3. No. 4. I don’t know if we have much to offer, but here is my contact info: Nicole Bartelt, Phone
651-366-4474, [email protected]. 5. We just recently learned of LSPIV, and are potentially interested in its use, but haven’t
done much if any research into the subject. We would be interested in learning from your research as it is completed.
Additional comments: None
Produced by Kin Yen, Advanced Highway Maintenance & Construction Technology Research Center 18
Montana DOT David Hedstrom and Susan Sillick, Montana DOT Survey answers:
1. N/A. 2. N/A. 3. N/A. 4. N/A. 5. N/A.
Additional comments: Unfortunately, we don't have anything to share.
New Mexico DOT Steven Morgenstern, PE, Drainage Design Bureau, New Mexico DOT Survey answers:
1. All of our flood flow data is collected by USGS. They use old-style cork indicators, and a few newer pressure transducer units. On one particular bridge we have installed a radar distance gauge to track water surface elevation, but have not developed a flow rating table for that crossing. We installed it primarily to monitor extreme events and scour.
2. No. 3. No. 4. No more information to provide. 5. N/A.
Additional comments: None
North Carolina DOT Matthew (Matt) Lauffer, PE, CPM, Assistant State Hydraulics Engineer, Hydraulics Unit, North Carolina DOT Chad Wagner, USGS, Raleigh, NC Survey answers:
1. In addition to traditional methods and LSPIV approaches, the USGS uses surface velocity radar (SVR) units. USGS is evaluating and developing protocols for proper use of handheld SVR, such as the Stalker Pro II radar gun and similar products. USGS also uses fixed mounted SVR devices at a few gages.
2. Yes a. USGS uses both fixed LSPIV gaging (mounted cameras at existing gages) and
in-situ measurements. In general, USGS have technicians take stable-mounted video (tripod, truck mounted, or other method). Several cameras are used, and different PC hardware is deployed. USGS currently do not have established protocols for and do not use truck-mounted masts.
b. For procedures and best practices related to synoptic LSPIV please see: https://my.usgs.gov/confluence/pages/viewpage.action?pageId=546865360 USGS is still developing protocols for fixed gage deployments and therefore do not have anything to share at this time.
c. The following are software used and evaluated by USGS: PIVlab: http://pivlab.blogspot.com/ RIVeR: http://riverdischarge.blogspot.com.ar/p/download.html FUDAA-LSPIV: https://forge.irstea.fr/projects/fudaa-lspiv Our knowledge and experience with these software packages for use in LSPIV flood measurements is still relatively limited.
Produced by Kin Yen, Advanced Highway Maintenance & Construction Technology Research Center 19
3. USGS has completed some test UAV flights for LSPIV data collection. However, current FAA regulations greatly restrict what we can and cannot do with UAVs.
4. Frank L. Engel, PhD, Chair, OSW Surface Velocity Workgroup https://my.usgs.gov/confluence/display/SurfBoard [email protected] 217-328-9774.
5. USGS are investigating use of surface-velocity methods in both flooding and fixed gaging applications. As a part of their work, USGS is developing policy and guidance recommendations for USGS scientists. USGS is collaborating with an international group of scientists and other Hydrometric Agencies on this progress.
Additional comments: None
North Dakota DOT Brad Pfeifer, Hydraulic engineer, North Dakota DOT, Bridge Division Survey answers:
1. No. The NDDOT does not perform any flow measurements. We rely on data provided by USGS when necessary, and when available.
2. No. 3. No. 4. N/A. 5. N/A.
Additional comments: None
Ohio DOT Kyle Brandon, PE, SI, Office of Hydraulic Engineering, Ohio DOT Survey answers:
1. ODOT does not use any such methods. 2. ODOT has not used or considered the use of LSPIV. We are however interested in
learning more about the technology and would consider its use if beneficial. 3. ODOT has not used a UAV for this purpose. 4. N/A 5. N/A
Additional comments: None
US Geological Survey (in Georgia, by request of Georgia DOT) Tony Gotvald, USGS South Atlantic Water Science Center Survey answers:
1. N/A. 2. N/A. 3. N/A. 4. N/A. 5. N/A.
Additional comments: We don't do any LSPIV work in Georgia, but there is a USGS group at the national level that is doing some work. You might already be aware of this work, but if you haven't, I included a link with contact information pertaining to this work. https://my.usgs.gov/confluence/pages/viewpage.action?pageId=546865360
Produced by Kin Yen, Advanced Highway Maintenance & Construction Technology Research Center 20

Utah DOT Jeff Erdman, P.E., Utah DOT, Central Hydraulics, Drainage Engineer Survey answers:
1. No. 2. No. 3. No. 4. N/A. 5. N/A.
Additional comments: None
Produced by Kin Yen, Advanced Highway Maintenance & Construction Technology Research Center 21
Contacts AHMCT and Caltrans DRISI contacted the following individuals to gather information for this investigation.
Agencies
Arkansas DOT Chris Dailey, P.E., Advanced Research Study Engineer System Information and Research Division Arkansas State Highway and Transportation Department Phone: 501-569-2599 Email: [email protected]
Mark Earl, P.E., Staff Hydraulic Engineer Roadway Design Division, Arkansas State Highway and Transportation Department P.O. Box 2261 Little Rock, AR 72203 Phone: 501-569-2589 Email: [email protected]
Indiana DOT Tommy E. Nantung, Manager for Pavement, Materials, and Construction Research Indiana DOT, Division of Research and Development 1205 Montgomery Street West Lafayette, IN 47906 Phone: 765-463-1521 ext. 248 Email: [email protected]
Iowa DOT Brian Worrel, P.E., SPR Research Engineer Research & Analytics, Iowa DOT 800 Lincoln Way, Ames, IA 50010 Phone: 515-239-1471 Email: [email protected]
Maryland DOT Hua Xiang Office of Policy and Research, Maryland DOT Phone: 410-545-2953 Email: [email protected]
Minnesota DOT Nicole Bartelt, PE Minnesota DOT Phone: 651-366-4474 Email: [email protected]
Produced by Kin Yen, Advanced Highway Maintenance & Construction Technology Research Center 22
Montana DOT David Hedstrom, Montana DOT Susan Sillick, Research Programs Manager, Montana DOT 2701 Prospect Avenue PO Box 201001 Helena, MT 59620-1001 Phone: 406-444-7693 Email: [email protected]
New Mexico DOT Steven Morgenstern, PE, Drainage Design Bureau, New Mexico DOT Santa Fe, NM Phone: 505-827-5330 Email: [email protected]
North Carolina DOT Matthew (Matt) Lauffer, PE, CPM, Assistant State Hydraulics Engineer Hydraulics Unit, North Carolina DOT 1020 Birch Ridge Dr. Raleigh, NC 27610 Phone: 919 707 6703 Email: [email protected]
North Dakota DOT Brad Pfeifer, Hydraulic Engineer, North Dakota DOT, Bridge Division Email: [email protected]
Ohio DOT Zona Kahkonen Keppler, M.L.S., Library Administrator Ohio DOT, Office of Statewide Planning & Research Mail Stop 3280 1980 West Broad Street Columbus, Ohio 43223-1102 Phone: 614-466-2882 Email: [email protected]
Kyle Brandon, PE, SI Office of Hydraulic Engineering, Ohio DOT Mail Stop 5220 1980 West Broad Street Columbus OH 43223 Phone: 614-466-5199 E-Mail: [email protected]
Produced by Kin Yen, Advanced Highway Maintenance & Construction Technology Research Center 23
US Geological Survey Kevin Oberg 405 N. Goodwin Ave. Urbana, IL, 61801 Phone: 217-328-9739 Email: [email protected]
Robert R. Holmes, Jr. 1400 Independence Road Mail Stop 100 Rolla, MO, 65401-2602 Phone: 573-308-3581 Email: [email protected]
Frank Engel 405 N. Goodwin Ave. Urbana, IL, 61801 Phone: 217-328-9774 Email: [email protected]
Tony Gotvald, USGS South Atlantic Water Science Center 1770 Corporate Drive, Suite 500 Norcross, GA 30093 Phone: 678-924-6648 Email: [email protected]
Chad Wagner Raleigh, NC
Utah DOT Jeff Erdman, P.E., Drainage Engineer Utah DOT, Central Hydraulics Phone: 801-648-6253 Email: [email protected]
Produced by Kin Yen, Advanced Highway Maintenance & Construction Technology Research Center 24
References
1. L. Deng and C. Cai, "Bridge Scour: Prediction, Modeling, Monitoring, and Countermeasures—Review," Practice Periodical on Structural Design and Construction, 15(2): pp. 125-134, 2009.
2. J.-L. Briaud, P. Gardoni, and C. Yao, "Statistical, Risk, and Reliability Analyses of Bridge Scour," Journal of Geotechnical and Geoenvironmental Engineering, 140(2): pp. 04013011, 2013.
3. P. Clopper, P. Lagasse, and L. Zevenbergen, "Risk-Based Approach for Bridge Scour Prediction: Applications for Design," 2014.
4. I. Fujita, M. Muste, and A. Kruger, "Large-Scale Particle Image Velocimetry for Flow Analysis in Hydraulic Engineering Applications," Journal of Hydraulic Research, 36(3): pp. 397-414, 1998.
5. F. Tauro, G. Olivieri, A. Petroselli, M. Porfiri, and S. Grimaldi, "Technical Note: Surface Water Velocity Observations from a Camera: A Case Study on the Tiber River," Hydrology and Earth System Sciences Discussions, 11(10): pp. 11883-11904, 2014.
6. Y. Kim, M. Muste, A. Hauet, W.F. Krajewski, A. Kruger, and A. Bradley, "Stream Discharge Using Mobile Large‐Scale Particle Image Velocimetry: A Proof of Concept," Water Resources Research, 44(9), 2008.
7. A. Harpold, S. Mostaghimi, P. Vlachos, K. Brannan, and T. Dillaha, "Stream Discharge Measurement Using a Large-Scale Particle Image Velocimetry (LSPIV) Prototype," Transactions of the ASABE, 49(6): pp. 1791-1805, 2006.
8. R. Tauro, M. Porfiri, A. Petroselli, G. Olivieri, R. Rapiti, G. Cipollari, and S. Grimaldi, "River Surface Flow Estimation Using a Camera: A Case Study on the Tiber River," Proceedings of the International Association of Hydrological Sciences, 366: pp. 173, 2015.
9. I. Fujita and S. Aya, "Refinement of LSPIV Technique for Monitoring River Surface Flows," in ASCE 2000 Joint Conference on Water Resources Engineering and Water Resources Planning and Management, 2000.
10. A. Patalano, C. Garcia, W. Brevis, T. Bleninger, N. Guillen, L. Moreno, and A. Rodriguez, "Recent Advances in Eulerian and Lagrangian Large-Scale Particle Image Velocimetry," in E-proceedings of the 36th IAHR World Congress, 2015.
11. J. Le Coz, A. Hauet, G. Pierrefeu, G. Dramais, and B. Camenen, "Performance of Image-Based Velocimetry (LSPIV) Applied to Flash-Flood Discharge Measurements in Mediterranean Rivers," Journal of Hydrology, 394(1): pp. 42-52, 2010.
12. J.E. Costa, K.R. Spicer, R.T. Cheng, F.P. Haeni, N.B. Melcher, E.M. Thurman, W.J. Plant, and W.C. Keller, "Measuring Stream Discharge by Non‐Contact Methods: A Proof‐of‐Concept Experiment," Geophysical Research Letters, 27(4): pp. 553-556, 2000.
13. M. Muste, Z. Xiong, A. Bradley, and A. Kruger, "Large-Scale Particle Image Velocimetry—a Reliable Tool for Physical Modeling," in Building Partnerships. pp. 1-10,
14. M. Muste, I. Fujita, and A. Hauet, "Large-Scale Particle Image Velocimetry for Measurements in Riverine Environments," Water Resources Research, 44(4), 2008.
15. V. Weitbrecht, G. Kühn, and G.H. Jirka, "Large Scale PIV-Measurements at the Surface of Shallow Water Flows," Flow Measurement and Instrumentation, 13(5–6): pp. 237-245, 2002.
16. J. Le Coz, M. Jodeau, A. Hauet, B. Marchand, and R. Le Boursicaud, "Image-Based Velocity and Discharge Measurements in Field and Laboratory River Engineering Studies Using the Free Fudaa-LSPIV Software," in River Flow, Proc. 7th Int. Conf. on Fluvial Hydraulics, Lausanne, Switzerland, 2014.
Produced by Kin Yen, Advanced Highway Maintenance & Construction Technology Research Center 25
17. F. Tauro, G. Olivieri, A. Petroselli, M. Porfiri, and S. Grimaldi, "Flow Monitoring with a Camera: A Case Study on a Flood Event in the Tiber River," Environmental Monitoring and Assessment, 188(2): pp. 1-11, 2016.
18. D.W. Dobson, K.T. Holland, and J. Calantoni, "Fast, Large-Scale, Particle Image Velocimetry-Based Estimations of River Surface Velocity," Computers & Geosciences, 70: pp. 35-43, 2014.
19. M. Muste, A. Hauet, I. Fujita, C. Legout, and H.-C. Ho, "Capabilities of Large-Scale Particle Image Velocimetry to Characterize Shallow Free-Surface Flows," Advances in Water Resources, 70: pp. 160-171, 2014.
20. G. Dramais, J. Le Coz, B. Camenen, and A. Hauet, "Advantages of a Mobile LSPIV Method for Measuring Flood Discharges and Improving Stage–Discharge Curves," Journal of Hydro-Environment Research, 5(4): pp. 301-312, 2011.
21. K. Yu and B. Yoon, "Development of a Portable Surface Image Velocimeter by Using a Far Infra-Red Camera," in River Flow 2016, CRC Press. pp. 646-651, 2016.
22. C.C. Chickadel, S.A. Talke, A.R. Horner-Devine, and A.T. Jessup, "Infrared-Based Measurements of Velocity, Turbulent Kinetic Energy, and Dissipation at the Water Surface in a Tidal River," IEEE Geoscience and Remote Sensing Letters, 8(5): pp. 849-853, 2011.
23. J.A. Puleo, T.E. McKenna, K.T. Holland, and J. Calantoni, "Quantifying Riverine Surface Currents from Time Sequences of Thermal Infrared Imagery," Water Resources Research, 48(1), 2012.
24. E. Jackson, D. Admiraal, D. Alexander, J. Stansbury, J. Guo, D. Rundkuist, and M. Drain, "Thermal Imaging for Discharge and Velocity Measurements in Open Channels," in 33rd International Association of Hydraulic Research Symposium, pp. 9-14, 2009.
25. M. Muste, A. Hauet, H. Ho, and T. Nakato, "Quantitative Mapping of Waterways Characteristics at Bridge Sites," Rept. # TR-569, 2008.
26. E. Cowen, S. Schweitzer, V. Citerone, A. King, E. Johnson, and R. Tinoco, "Exploiting Surface Turbulence Metrics and Secondary Flows in Straight River Reaches and Open Channels," in River Flow 2016, CRC Press. pp. 7-9, 2016.
27. F. Tauro, C. Pagano, P. Phamduy, S. Grimaldi, and M. Porfiri, "Large-Scale Particle Image Velocimetry from an Unmanned Aerial Vehicle," IEEE/ASME Transactions on Mechatronics, 20(6): pp. 3269-3275, 2015.
28. A. Patalano and C. García, "RIVeR—Towards Affordable, Practical and User-Friendly Toolbox for Large Scale PIV and PTV Techniques," in River Flow 2016, CRC Press. pp.576-579, 2016.
29. Y. Kim, Uncertainty Analysis for Non-Intrusive Measurement of River Discharge Using Image Velocimetry, Ph.D. dissertation, Dept. of Civil and Environmental Engineering, University of Iowa, 2006.
30. A. Hauet, J.-D. Creutin, and P. Belleudy, "Sensitivity Study of Large-Scale Particle Image Velocimetry Measurement of River Discharge Using Numerical Simulation," Journal of Hydrology, 349(1): pp. 178-190, 2008.
31. W. Thielicke and E. Stamhuis, "PIVlab–Towards User-Friendly, Affordable and Accurate Digital Particle Image Velocimetry in MATLAB," Journal of Open Research Software, 2(1), 2014.
32. W. Brevis, Y. Niño, and G.H. Jirka, "Integrating Cross-Correlation and Relaxation Algorithms for Particle Tracking Velocimetry," Experiments in Fluids, 50(1): pp. 135-147, 2011.
33. B. Lüthi, T. Philippe, and S. Pena-Haro, "Mobile Device App for Small Open-Channel Flow Measurement," in Proceedings of the 7th International Congress on Environmental Modelling and Software (iEMSs’ 14), pp. 283-287, 2014.
Produced by Kin Yen, Advanced Highway Maintenance & Construction Technology Research Center 26
34. R. Tsubaki, I. Fujita, K. Yu, and M. Muste, "Large-Scale Particle Image Velocimetry (LSPIV) Implementation on Smartphone," in 36th IAHR Congress, 2015.
35. C. Pagano, F. Tauro, S. Grimaldi, and M. Porfiri, "Development and Testing of an Unmanned Aerial Vehicle for Large Scale Particle Image Velocimetry," in ASME 2014 Dynamic Systems and Control Conference, pp. V003T44A001, 2014.
36. I. Fujita, Y. Notoya, and M. Shimono, "Development of UAV-Based River Surface Velocity Measurement by STIV Based on High-Accurate Image Stabilization Techniques," in E-proceedings of the 36th IAHR World Congress, 2015.
37. M.T. Perks, A.J. Russell, and A.R. Large, "Technical Note: Advances in Flash Flood Monitoring Using Unmanned Aerial Vehicles (UAVs)," Hydrology and Earth System Sciences, 20(10): pp. 4005-4015, 2016.
38. G. Blois, J.L. Best, T. Christensen, V. Cichella, A. Donahue, N. Hovakimyan, A. Kennedy, and I. Pakrasi, "UAV-Based PIV for Quantifying Water-Flow Processes in Large-Scale Natural Environments," in 18th International Symposium on the Application of Laser and Imaging Techniques to Fluid Mechanics, Lisbon, Portugal, 2016.
39. J.E. Costa, R.T. Cheng, F.P. Haeni, N. Melcher, K.R. Spicer, E. Hayes, W. Plant, K. Hayes, C. Teague, and D. Barrick, "Use of Radars to Monitor Stream Discharge by Noncontact Methods," Water Resources Research, 42(7), 2006.
Produced by Kin Yen, Advanced Highway Maintenance & Construction Technology Research Center 27