Embed Size (px)
Citation preview
91
American Economic Journal: Economic Policy 3 (February 2011): 91–128http://www.aeaweb.org/articles.php?doi=10.1257/pol.3.1.91
Between 1995 and 2008, the fraction of Americans who were obese rose from 15.9 percent to 26.6 percent, and according to the OECD the United States is
the most obese nation in the world.1 Researchers have debated the causes of the dramatic rise in obesity, often referred to as an epidemic, and economists have debated whether it is a public or private concern.2 Regardless, there is rising inter-est in potential policy interventions, including prohibitions on vending machines in schools, taxation of certain foods, and regulation of fast food restaurants.3 One pol-icy has recently emerged with great momentum, mandatory posting of calories on menus in chain restaurants. The law was first implemented in New York City (NYC) in mid-2008. Numerous other states have subsequently enacted similar laws, and the Patient Protection and Affordable Care Act passed by the federal government in March 2010, includes a nutrition labeling requirement for restaurants.
In this study we measure the effect of the NYC law on consumers’ caloric pur-chases, and analyze the mechanism underlying the effect. On the one hand it may
1 Based on data from the Centers for Disease Control and Prevention (CDC). Obesity is defined as BMI ≥ 30.0. BMI refers to body mass index, defined as weight (in kilograms) divided by height (in meters) squared. For international comparisons see OECD (2009).
2 See Jay Bhattacharya (2008), Sara N. Bleich et al. (2008), Tomas J. Philipson and Richard A. Posner (2008), and the papers cited therein.
3 See Michelle M. Mello, David M. Studdert, and Troyen A. Brennan (2006).
* Bollinger: Stanford University, Graduate School of Business, 518 Memorial Way, Stanford, CA 94305 (e-mail: [email protected]); Leslie: Stanford University, Graduate School of Business, 518 Memorial Way, Stanford, CA 94305 (e-mail: [email protected]); Sorensen: Stanford University, Graduate School of Business, 518 Memorial Way, Stanford, CA 94305 (e-mail: [email protected]). We thank Barbara McCarthy and Ryan Patton for research assistance. We are very grateful to Starbucks for providing us with the data used in this study. We have no consulting relationship with Starbucks—the findings in this study are completely independent of Starbuck’s interests. Thanks also to Michael Anderson, Kyle Bagwell, Dan Kessler, Eddie Lazear, David Matsa, Paul Oyer, Kathryn Shaw, and Mike Toffel for valuable feedback.
† To comment on this article in the online discussion forum, or to view additional materials, visit the article page at http://www.aeaweb.org/articles.php?doi=10.1257/pol.3.1.91.
Calorie Posting in Chain Restaurants†
By Bryan Bollinger, Phillip Leslie, and Alan Sorensen*
We study the impact of mandatory calorie posting on consumers’ purchase decisions using detailed data from Starbucks. We find that average calories per transaction fall by 6 percent. The effect is almost entirely related to changes in consumers’ food choices—there is almost no change in purchases of beverage calories. There is no impact on Starbucks profit on average, and for the subset of stores located close to their competitor Dunkin Donuts, the effect of calorie posting is actually to increase Starbucks revenue. Survey evidence and analysis of commuters suggests the mechanism for the effect is a combination of learning and salience. (JEL D12, D18, D83, L83)
ContentsCalorie Posting in Chain Restaurants† 91
I. Background 94A. Data Summary 95B. Related Research 97II. Effect of Mandatory Calorie Posting on Calorie Consumption 99A. Calories Per Transaction 99B. Substitution Effects 106C. Heterogeneity in the Effect of Mandatory Calorie Posting 110III. Effect of Mandatory Calorie Posting on Profit 112IV. Discussion 114A. Why is There an Effect? 115B. Is the Effect Big Enough to Matter? 120C. Does Mandatory Calorie Posting Cause Restaurants to Offer Low-Calorie Options? 121D. Why is Government Intervention Required? 123V. Conclusion 123Appendix 125References 126
92 AmEricAn Economic JournAL: Economic PoLicy FEBruAry 2011
seem obvious that increasing the provision of nutrition information to consumers would help them to purchase healthier food. Indeed, the common presumption is that consumers will be surprised to learn how many calories are in the beverage and food items offered at chain restaurants. On the other hand, consumers at chain restaurants (especially fast food chains) may care mostly about convenience, price, and taste, with calories being relatively unimportant. Consumers who do care about calories may already be well-informed, since calorie information is already widely available on in-store posters and brochures, on placemats and packaging, and on company websites. Even for consumers who are not well-informed, the direction of the policy’s effect depends on the direction of the surprise. While some consumers may learn that they were underestimating the calorie content of their favorite menu items, others may learn that they were overestimating—so the direction of the aver-age response is a priori unclear.
Ultimately, the impact of the policy must be gauged by observing consumers’ actual purchase behavior. To this end, we persuaded Starbucks to provide us with detailed transaction data. There are three key components to the dataset we ana-lyze. First, we observe every transaction at Starbucks company stores in NYC from January 1, 2008 to February 28, 2009, with mandatory calorie posting commencing on April 1, 2008. To control for other factors affecting transactions, we also observe every transaction at Starbucks company stores in Boston and Philadelphia, where there was no calorie posting. The second component is a large sample of anonymous Starbucks cardholders (inside and outside of NYC) that we track over the same period of time, allowing us to examine the impact of calorie posting at the indi-vidual level. The third component we analyze is a set of in-store customer surveys we performed before and after the introduction of a calorie posting law in Seattle on January 1, 2009. These surveys provide evidence about how knowledgeable people were about calories at Starbucks before and after the law change. We also surveyed consumers at the same points in time in control locations where there was no calorie posting.
We find that mandatory calorie posting does influence consumer behavior at Starbucks, causing average calories per transaction to decrease by 6 percent (from 247 calories to 232 calories per transaction). The effects are long lasting. The calo-rie reduction in NYC persists for the entire period of our data, which extends 10 months after the calorie posting commenced. Almost all of the effect is related to food purchases—average beverage calories per transaction did not substantially change, while average food calories per transaction fell by 14 percent (equal to 14 calories per transaction on average). Three quarters of the reduction in calories per transaction is due to consumers buying fewer items, and one quarter of the effect is due to consumers substituting towards lower calorie items.
The potential impact of calorie posting on restaurants’ profits is an important aspect of the policy’s overall effect. The data in this study provide a unique opportunity to directly assess the impact of calorie posting on Starbucks revenue (which is highly correlated with their profit under plausible assumptions). We find that calorie post-ing did not cause any statistically significant change in Starbucks revenue overall. Interestingly, we estimate that revenue actually increased by 3 percent at Starbucks stores located within 100 meters of a Dunkin Donuts (an important competitor to
VoL. 3 no. 1 93BoLLingEr ET AL.: cALoriE PoSTing in chAin rESTAurAnTS
Starbucks in NYC). Hence, there is evidence that calorie posting may have caused some consumers to substitute away from Dunkin Donuts toward Starbucks. The fact that Starbuck’s profitability is unaffected by calorie posting is consistent with the find-ing that consumers’ beverage choices are unchanged, which is of course Starbuck’s core business.
The competitive effect of calorie posting highlights the distinction between man-datory versus voluntary posting. It is important to note that our analysis concerns a policy in which all chain restaurants, not just Starbucks, are required to post calorie information on their menus. Voluntary posting by a single chain would result in sub-stantively different outcomes, especially with respect to competitive effects.4
By associating local demographics with store locations, we estimate the effect of calorie posting is increasing in income and education. The anonymous cardholder data is particularly well-suited to analyzing heterogeneity in consumers’ responsive-ness to calorie posting. We find that individuals who averaged more than 250 calo-ries per transaction prior to calorie posting reacted to calorie posting by decreasing calories per transaction by 26 percent—dramatically more than the 6 percent aver-age reduction for all consumers.
The cardholder data and the survey data also allow us to explore the mechanism underlying consumers’ reaction to the information. Calorie posting may affect con-sumer choice because it improves their knowledge of calories (a learning effect) and/or because it increases their sensitivity to calories (a salience effect). In our sur-veys, consumers report placing more importance on calories in their purchase deci-sions after having been exposed to calorie posting, which is suggestive of a salience effect. However, when we analyze the transactions of cardholders who make regular purchases both in and out of NYC (i.e., commuters), we find that exposure to calorie information affects their choices even at nonposting (i.e., non-NYC) stores, which is consistent with a learning effect but inconsistent with the salience effect.
Mandatory calorie-posting laws have been controversial, with strong opposition from some chains and restaurant associations. Ultimately, whether calorie posting affects people’s behavior is an empirical question. The detailed transaction data we use in this study are uniquely well-suited to answering this question. However, there are two important limitations to this research. First, we do not directly measure the effect of calorie posting on obesity itself. Current lags in the availability of BMI data from the Centers for Disease Control (CDC) suggest this will not be addressable for a few more years. For now, we can only use evidence from the medical literature to provide a crude estimate of the change in body weight that would result from the calorie reductions we find at Starbucks (see Section IVB).
A second limitation is that we have data for only one chain (Starbucks). We can-not know if the effects of mandatory calorie posting at Starbucks are similar to the effects at other chains. We also do not know if people offset changes in their calorie consumption at Starbucks by changing what they eat at home, for example. While these shortcomings must be acknowledged, the advantage of our data is that we have a remarkably complete picture of the effects of the calorie posting at Starbucks—it
4 The potential for information unravelling, in which all firms choose to voluntarily disclose calorie information, is discussed in Section IV.
94 AmEricAn Economic JournAL: Economic PoLicy FEBruAry 2011
is difficult to imagine having such detailed data for other chains, let alone for a large cross-section of them. Moreover, Starbucks is an especially important testing ground by virtue of its large size. Starbuck’s revenue in 2008 was over $10 billion, with around 11,000 stores in the United States.5 Only one other chain restaurant had more than $10 billion in annual revenues in 2008, McDonalds.6
I. Background
The mandatory calorie posting law in NYC requires all chains (with 15 or more units nationwide) to display calories for every item on all menu boards and menus in a font and format that is at least as prominent as price. Health department inspectors verify the posting, and restaurants may be fined up to $2,000 per restaurant location for noncompliance. The NYC Board of Health first voted in the law in 2006, but legal challenges from the New York State Restaurant Association delayed its imple-mentation until mid-2008.7 The litigation process gave restaurants a couple of years to anticipate the introduction of the new law and created uncertainty around the date at which enforcement would commence. In early May 2008, it was reported that restaurants in NYC were being given citations for noncompliance. However, fines were not imposed until late July 2008. Starbucks commenced calorie posting in their NYC stores on April 1, 2008. They were one of the first chains to start posting and, as best we can tell, other chains were close behind.
The principal argument made by opponents of mandatory calorie posting is that the information is already available (on in-store posters and brochures, wrappers, tray liners, and on the internet).8 Indeed, Starbucks also provided calorie informa-tion via in-store brochures and online before the new law in NYC. However, the NYC health department has emphasized the importance of making calorie infor-mation available at the point of purchase.9 Another natural argument against calo-rie posting is that forcing restaurants to put the information on menus is costly. One news report indicated the cost of compliance for the Wendy’s chain was about $2,000 per store.10 However, the law may have generated some additional indirect costs for chains, such as costs associated with having different menus for different cities (increasing delays in the process of introducing new products).
There are a number of ways consumers may respond to calorie posting: consum-ers may purchase less frequently (a change in the extensive margin); consumers may purchase fewer items when they do make a purchase (one kind of change in the inten-sive margin); consumers may substitute toward lower calorie items (another kind of
5 The total North American movie exhibition box office (at $9.8 billion in 2008) was less than Starbuck’s revenue.
6 According to QSr Magazine (a leading industry publication).7 Thomas A. Farley et al. (2009) provides a detailed review of the challenges faced by the NYC Health
Department in implementing the calorie posting requirement.8 See Mark Berman and Risa Lavizzo-Mourey (2008) for a review of the arguments for and against calorie
posting.9 In support of this view, Christina A. Roberto, Henry Agnew, and Kelly D. Brownell (2009) observe patrons in
fast food restaurants that provide brochures or posters with calorie information (calories are not posted on menus), finding that only 0.1 percent of consumers are attentive to the information.
10 Lisa Anderson, “NYC Counting on Calorie Law,” chicago Tribune, May 11, 2008, accessed May 14, 2008, http://articles.chicagotribune.com/2008-05-11/news/0805110009_1_calories-health-department-restaurants.
VoL. 3 no. 1 95BoLLingEr ET AL.: cALoriE PoSTing in chAin rESTAurAnTS
change in the intensive margin); and consumers may choose different restaurants leading to a change in consumer composition at any given restaurant.11 The Starbucks data we study is rich enough to allow us to distinguish these various responses, as we explain in the next section. Calorie posting may also cause restaurants to change their menus (prices and/or menu items), although this did not occur at Starbucks during the 14 month period covered by our data.
A. Data Summary
Our transaction data cover all 222 Starbucks locations in NYC, and all 94 Star-bucks locations in Boston and Philadelphia.12 At each location we observe all trans-actions for a period of time 3 months before and 11 months after calorie posting commenced (i.e., January 1, 2008–February 28, 2009). There are over 100 million transactions in the dataset.13 For each transaction we observe the time and date, store location, items purchased, and price of each item. Using Starbucks nutritional information we can also calculate the calories in each purchase.
In addition to the transaction data we have data for a sample of anonymous Starbucks cardholders, tracking their purchases over the same period of time all over the United States. There are 2.7 million anonymous individuals in this dataset, but most do not make purchases in NYC. We define a subsample containing any individual that averaged at least one transaction per week in one of NYC, Boston, or Philadelphia, in the period before calorie posting in NYC. There are 7,520 such individuals in NYC and 3,772 such individuals in Boston and Philadelphia, generat-ing a combined 1.51 million transactions for us to study.
We refer to the first dataset as the transaction data and the second dataset as the cardholder data. The advantage of the cardholder data is that we can assess how the calorie information causes particular individuals to change behavior. Importantly, this allows us to isolate the effects of calorie posting on changes in the intensive and extensive margins (outlined above) from changes in consumer composition. However, these cardholders may not be representative of Starbucks customers more generally, as we expect these individuals are above average in their loyalty to Starbucks. The transaction data, on the other hand, cover the universe of transac-tions. In the analysis we compare the separately estimated effects of calorie posting on the cardholder data with transaction data.
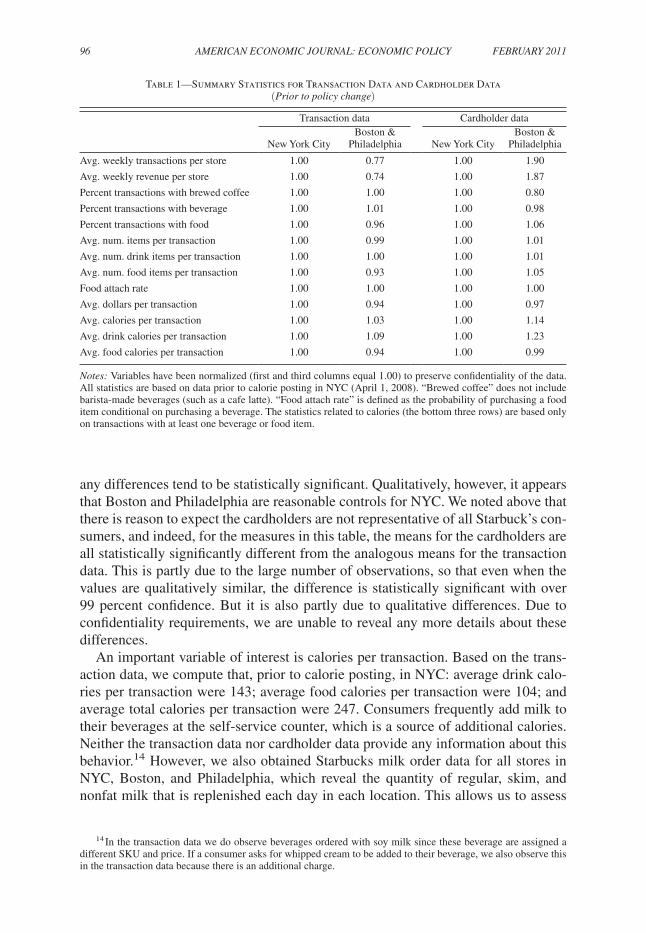
Table 1 provides an array of summary statistics for transactions. To preserve con-fidentialty of competitively sensitive information, for both datasets, we normalize the value for NYC to one. This allows us to show differences across regions for each dataset without revealing the levels. Due to the very large number of observations,
11 For example, in theory, calorie posting may cause an increase in average calories per transaction at Starbucks because of a change in consumer composition.
12 These data cover all Starbucks company-owned stores. Starbucks products are also sold in a small number of independently owned locations for which we do not have any data. The fraction of excluded transactions is unknown, but we believe it to be well under 5 percent.
13 We exclude transactions at stores that were not open during the entire data period (i.e., we analyze the bal-anced panel), and we exclude transactions that included more than four units of any one item because we consider these purchases to be driven by fundamentally different processes (bulk purchases for an office, say). The excluded transactions represent only 2.2 percent of all transactions.
96 AmEricAn Economic JournAL: Economic PoLicy FEBruAry 2011
any differences tend to be statistically significant. Qualitatively, however, it appears that Boston and Philadelphia are reasonable controls for NYC. We noted above that there is reason to expect the cardholders are not representative of all Starbuck’s con-sumers, and indeed, for the measures in this table, the means for the cardholders are all statistically significantly different from the analogous means for the transaction data. This is partly due to the large number of observations, so that even when the values are qualitatively similar, the difference is statistically significant with over 99 percent confidence. But it is also partly due to qualitative differences. Due to confidentiality requirements, we are unable to reveal any more details about these differences.
An important variable of interest is calories per transaction. Based on the trans-action data, we compute that, prior to calorie posting, in NYC: average drink calo-ries per transaction were 143; average food calories per transaction were 104; and average total calories per transaction were 247. Consumers frequently add milk to their beverages at the self-service counter, which is a source of additional calories. Neither the transaction data nor cardholder data provide any information about this behavior.14 However, we also obtained Starbucks milk order data for all stores in NYC, Boston, and Philadelphia, which reveal the quantity of regular, skim, and nonfat milk that is replenished each day in each location. This allows us to assess
14 In the transaction data we do observe beverages ordered with soy milk since these beverage are assigned a different SKU and price. If a consumer asks for whipped cream to be added to their beverage, we also observe this in the transaction data because there is an additional charge.
Table 1—Summary Statistics for Transaction Data and Cardholder Data (Prior to policy change)
Transaction data Cardholder data
New York CityBoston &
Philadelphia New York CityBoston &
Philadelphia
Avg. weekly transactions per store 1.00 0.77 1.00 1.90
Avg. weekly revenue per store 1.00 0.74 1.00 1.87
Percent transactions with brewed coffee 1.00 1.00 1.00 0.80
Percent transactions with beverage 1.00 1.01 1.00 0.98
Percent transactions with food 1.00 0.96 1.00 1.06
Avg. num. items per transaction 1.00 0.99 1.00 1.01
Avg. num. drink items per transaction 1.00 1.00 1.00 1.01
Avg. num. food items per transaction 1.00 0.93 1.00 1.05
Food attach rate 1.00 1.00 1.00 1.00
Avg. dollars per transaction 1.00 0.94 1.00 0.97
Avg. calories per transaction 1.00 1.03 1.00 1.14
Avg. drink calories per transaction 1.00 1.09 1.00 1.23
Avg. food calories per transaction 1.00 0.94 1.00 0.99
notes: Variables have been normalized (first and third columns equal 1.00) to preserve confidentiality of the data. All statistics are based on data prior to calorie posting in NYC (April 1, 2008). “Brewed coffee” does not include barista-made beverages (such as a cafe latte). “Food attach rate” is defined as the probability of purchasing a food item conditional on purchasing a beverage. The statistics related to calories (the bottom three rows) are based only on transactions with at least one beverage or food item.
VoL. 3 no. 1 97BoLLingEr ET AL.: cALoriE PoSTing in chAin rESTAurAnTS
the impact of calorie posting on aggregate and proportional consumption of each kind of milk in Starbucks. Based on this dataset, customers in NYC, Boston, and Philadelphia consume 5.1 ounces of milk per transaction (on average).
Each Starbucks location offers more than 1,000 beverage and food products (defined by SKUs), all varying in caloric content. Notably, brewed coffee (their sta-ple product) is very low in calories (five calories). The highest calorie beverage sold by Starbucks is the 24 oz. hazelnut signature hot chocolate with whipped cream, at 860 calories. Food items sold at Starbucks vary between roughly 100 calories (small cookies) and 500 calories (some muffins).
How much variation is there in prices and product offerings? Prices at Starbucks vary across regions, but not within cities. For example, a latte is the same price in Manhattan as in Staten Island, but has a different price in Boston. Within regions, there is no price variation over time within the 14 month period of our data. Beverage offerings are the same in all Starbucks and there is some variation in food items. The only significant change to product offerings that took place during the period of our data was the introduction in August 2008 of the Vivanno smoothies, which are low calorie alternatives to a frappuccino. These were introduced nationwide, and were unrelated to calorie posting in NYC. We discuss the topic of changing product offer-ings in more detail in Section V.
Seattle was the next city after NYC to introduce a calorie posting law. Seattle’s law came into effect on January 1, 2009. In anticipation of the law change, we performed in-store customer surveys on December 5, 2008 at two locations in Seattle and two locations in San Francisco (as controls). We repeated the surveys at the same four locations on January 30, 2009, after the law came into effect. The questionnaire is shown in the Appendix. The key questions concern consumers’ knowledge of calories, providing direct evidence about how well informed consumers were in the absence of posting, and to what degree posting of calories affected their knowledge. We defer a more detailed summary of these data until Section V. Finally, we also have transaction data for Seattle and control cities (Portland, Oregon and San Francisco) over the same period of time as in NYC. As we explain below, the law change in Seattle differs from NYC, preventing us from replicating the analysis of the law change in NYC.
B. related research
The notion that increasing the provision of nutrition information may stimulate people to adopt healthier eating habits is an old idea, and numerous prior stud-ies have sought to evaluate its merit. An early study by Jacob Jacoby, Robert W. Chestnut, and William Silberman (1977) presents evidence that consumers tend not to seek out nutrition information or to understand it, despite claiming they would be willing to pay for more nutrition information. Hence, an important theme in this line of research has been the importance of how information is presented— designing programs that make information easy to access and understand.15 Many
15 See J. Craig Andrews, Richard G. Netemeyer, and Scot Burton (1998), Siva K. Balasubramanian and Catherine Cole (2002), Jacoby (1974), Thomas E. Muller (1985), Carl V. Phillips and Richard Zeckhauser (1996) and J. Edward Russo et al. (1986).
98 AmEricAn Economic JournAL: Economic PoLicy FEBruAry 2011
of the studies on this topic rely on survey responses. However, several studies exam-ine the effect of nutrition information on actual sales, including Pauline M. Ippolito and Alan D. Mathios (1990, 1995), Kristin Kiesel and Sofia B. Villas-Boas (2008) and Mathios (2000).16 All of these papers find evidence that demand is sensitive to nutrition information. Finally, Jayachandran N. Variyam and John Cawley (2006) analyze the question of whether nutrition labeling causes reduced obesity, finding that it does.17
The above-mentioned papers all focus on nutrition labeling of packaged foods. However, the calorie posting requirement that we study applies to restaurant meals, and, in particular, to chains that are largely fast food restaurants. Indeed, a popular view seems to be that fast food restaurants are important contributors to the rise in obesity. Several studies have sought to test this hypothesis, including two recent papers by Michael L. Anderson and David A. Matsa (2011) and Janet Currie et al. (2010).18 Neither paper finds that fast food restaurants have a significant effect on obesity in general. However, Currie et al. (2010) find that teenagers whose schools are located within 0.1 miles of a fast food chain have significantly higher obesity rates.
A few prior studies also analyze mandatory calorie posting at chain restaurants in NYC. In one study prior to calorie posting (in 2007), researchers from the NYC health department surveyed chain patrons in NYC to assess the potential impact of calorie posting (Mary T. Bassett et al. 2008). Important for their study was the fact that Subway restaurants had already chosen to post calorie information. They found that 32 percent of survey respondents at Subway reported seeing calorie informa-tion, compared to 4 percent of respondents at other chains where calorie information was only available via brochures or posters. Furthermore, the Subway respondents that reported seeing calorie information purchased 52 fewer calories, on average, than the Subway respondents who did not.
Two subsequent papers compare purchase data before and after calorie posting in NYC. Julie S. Downs, George Loewenstein, and Jessica Wisdom (2009) collected a total of 1,354 receipts from patrons at two burger restaurants and one coffee shop (all unnamed) before and after calorie posting. There are no control locations where calories were never posted in their study. Large standard errors prevent the authors from drawing clear conclusions, but they argue there is some evidence of respon-siveness to calorie posting.
A second study by Brian Elbel et al. (2009) also utilizes receipts collected from patrons outside of chain restaurants, before and after calorie posting in NYC. The data cover 14 restaurants in NYC and five control restaurants in Newark, New Jersey (there was no posting in New Jersey). All restaurants are located in low-income neighborhoods, and the sample covers McDonald’s, Burger King, Wendy’s and KFC.19 The pre-period data were collected over a two week period beginning on
16 Klaus G. Grunert and Josephine M. Wills (2007) provide a detailed survey of recent related research.17 Kerry Anne McGeary (2009) finds that state-level nutrition-education funding also causes a reduction in
obesity.18 See also the study of fast food advertising by Shin-Yi Chou, Inas Rashad, and Michael Grossman (2008).19 We actually find that the effects of calorie posting are greater in high-income and high-education neighbor-
hoods (see below).
VoL. 3 no. 1 99BoLLingEr ET AL.: cALoriE PoSTing in chAin rESTAurAnTS
July 8, 2008.20 The post-period data were collected approximately four weeks later. Their dataset comprises a total of 1,156 receipts. As in Downs, Lowenstein, and Wisdom (2009), large standard errors lead to the conclusion that calorie posting had no statistically significant impact on calories per transaction.21
Since our study is not the first to examine the impact of the NYC calorie posting law, it is important that we clarify how our approach differs from the prior research. In comparison, the dataset we study is much larger and broader—the universe of over 100 million transactions at Starbucks in Boston, NYC, and Philadelphia over a 14-month period. We also analyze individual-level data (1.5 million transactions of anonymous customers over time), as well as a survey that focuses on testing consumers’ knowledge of calories (the prior studies did not test consumers’ knowl-edge). In common with the prior research, we address the fundamental question of whether calorie posting affects calories per transaction. However, it is conceivable the policy change would have only a short-run effect, while news coverage height-ens awareness. We examine the time-path and longevity of the effect, for up to 11 months after calorie posting. Furthermore, we analyze the impact on product substi-tution patterns—switching to smaller sizes, lower calorie items, fewer items, or less frequent purchases. We also examine heterogeneity in consumers’ responsiveness to calorie posting. Lastly, the data we study provides a unique opportunity to analyze the impact of calorie posting on restaurants’ profits.
II. Effect of Mandatory Calorie Posting on Calorie Consumption
A. calories Per Transaction
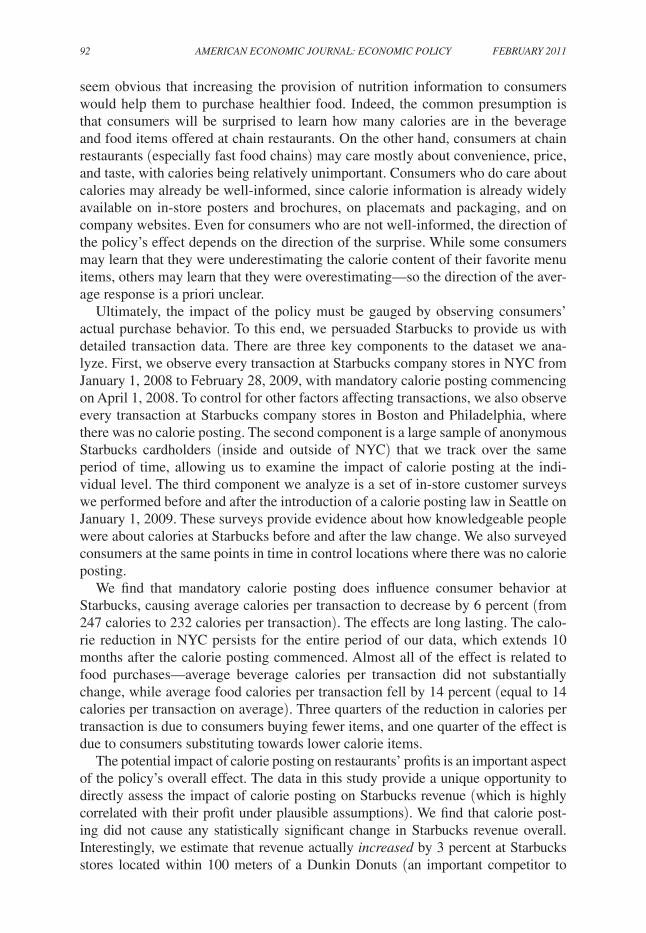
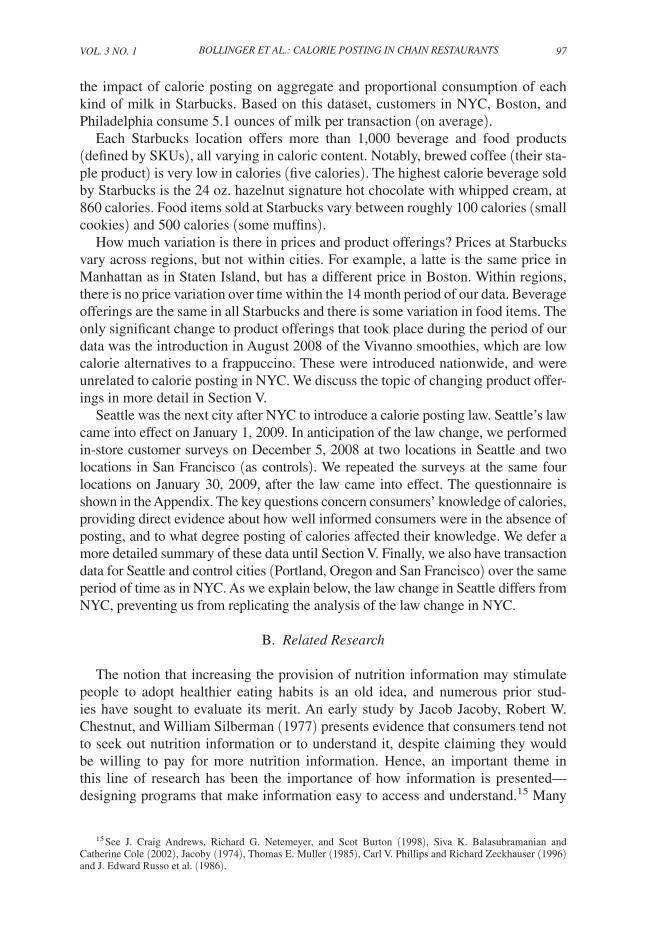
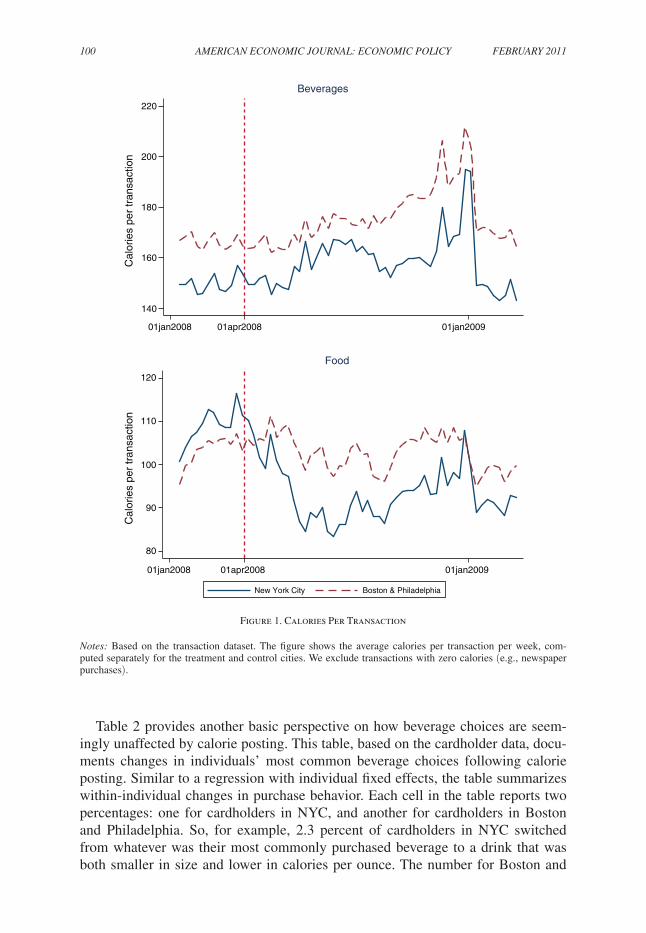
The basic impact of mandatory calorie posting on calorie consumption is evident without any regression analysis (no controls of any kind). Based on the transaction data (and using only transactions with at least one beverage or food item), Figure 1 shows average calories per transaction each week, distinguishing transactions in NYC from transactions in the control cities.22 The top panel shows calories from beverages (both hot and cold), and the bottom panel shows calories from food items. The vertical line at April 1, 2008 corresponds to the introduction of calorie posting on Starbucks menu boards in NYC. The figure for beverages does not reveal a clear impact, although some effect becomes apparent around October 2008.23 In contrast, the pattern for food calories is striking. Prior to calorie posting, average food calo-ries per transaction was consistently higher in NYC than in Boston and Philadelphia, and this is clearly reversed following calorie posting.
20 The timing of their pre-period sample collection is questionable, since Starbucks began posting on April 1, 2008. Also, the new york Times reported on April 22, 2008, that a number of chains were already posting calories as they had expected the law to have already come into effect. (James Barron, “At Fast-Food Outlets: Premature Sticker Shock for the Weight Conscious,” new york Times, April 22, 2008, accessed April 24, 2008, http://www.nytimes.com/2008/04/22/nyregion/22calorie.html.)
21 Wisdom, Downs, and Loewenstein (2010) experiment with the provision of calorie information to restaurant consumers, although not in the form of calorie posting on menu boards. See also Sarah Elizabeth Colby et al. (2009) and Mary A. Gerend (2009).
22 All the analysis in this section utilizes the subset of transactions with at least one beverage or food item. We exclude transactions for items such as newspapers. Elsewhere in the paper we examine all transactions.
23 Note the spiking in late 2008 relates to Thanksgiving and the Christmas-New Year period.
100 AmEricAn Economic JournAL: Economic PoLicy FEBruAry 2011
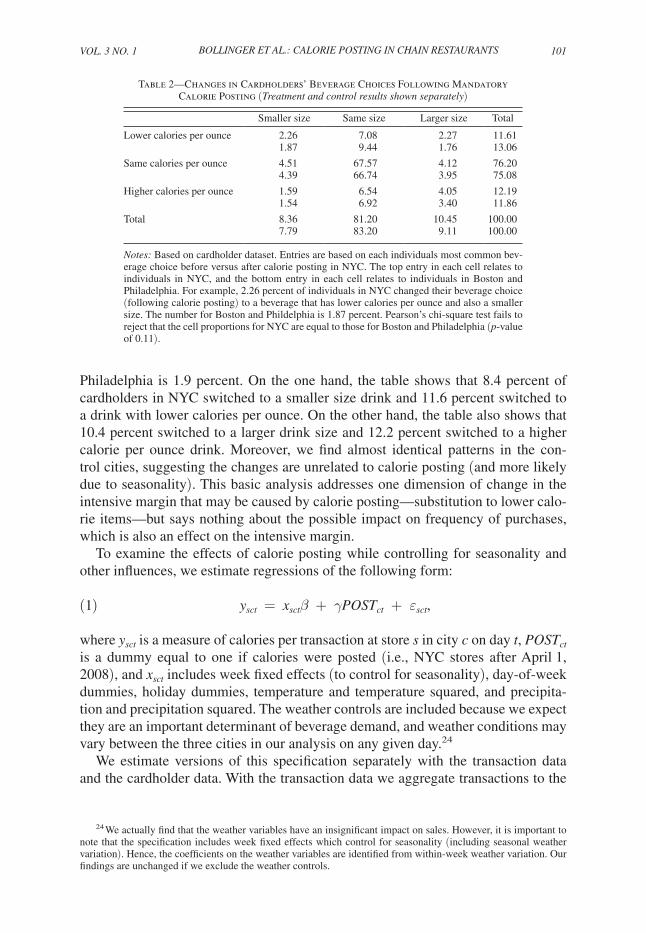
Table 2 provides another basic perspective on how beverage choices are seem-ingly unaffected by calorie posting. This table, based on the cardholder data, docu-ments changes in individuals’ most common beverage choices following calorie posting. Similar to a regression with individual fixed effects, the table summarizes within-individual changes in purchase behavior. Each cell in the table reports two percentages: one for cardholders in NYC, and another for cardholders in Boston and Philadelphia. So, for example, 2.3 percent of cardholders in NYC switched from whatever was their most commonly purchased beverage to a drink that was both smaller in size and lower in calories per ounce. The number for Boston and
140
160
180
200
220
Cal
orie
s pe
r tr
ansa
ctio
n
01jan2008 01apr2008 01jan2009
Beverages
80
90
100
110
120
Cal
orie
s pe
r tr
ansa
ctio
n
01jan2008 01apr2008 01jan2009
New York City Boston & Philadelphia
Food
Figure 1. Calories Per Transaction
notes: Based on the transaction dataset. The figure shows the average calories per transaction per week, com-puted separately for the treatment and control cities. We exclude transactions with zero calories (e.g., newspaper purchases).
VoL. 3 no. 1 101BoLLingEr ET AL.: cALoriE PoSTing in chAin rESTAurAnTS
Philadelphia is 1.9 percent. On the one hand, the table shows that 8.4 percent of cardholders in NYC switched to a smaller size drink and 11.6 percent switched to a drink with lower calories per ounce. On the other hand, the table also shows that 10.4 percent switched to a larger drink size and 12.2 percent switched to a higher calorie per ounce drink. Moreover, we find almost identical patterns in the con-trol cities, suggesting the changes are unrelated to calorie posting (and more likely due to seasonality). This basic analysis addresses one dimension of change in the intensive margin that may be caused by calorie posting—substitution to lower calo-rie items—but says nothing about the possible impact on frequency of purchases, which is also an effect on the intensive margin.
To examine the effects of calorie posting while controlling for seasonality and other influences, we estimate regressions of the following form:
(1) y sct = x sct β + γPoS T ct + ε sct ,
where y sct is a measure of calories per transaction at store s in city c on day t, PoS T ct is a dummy equal to one if calories were posted (i.e., NYC stores after April 1, 2008), and x sct includes week fixed effects (to control for seasonality), day-of-week dummies, holiday dummies, temperature and temperature squared, and precipita-tion and precipitation squared. The weather controls are included because we expect they are an important determinant of beverage demand, and weather conditions may vary between the three cities in our analysis on any given day.24
We estimate versions of this specification separately with the transaction data and the cardholder data. With the transaction data we aggregate transactions to the
24 We actually find that the weather variables have an insignificant impact on sales. However, it is important to note that the specification includes week fixed effects which control for seasonality (including seasonal weather variation). Hence, the coefficients on the weather variables are identified from within-week weather variation. Our findings are unchanged if we exclude the weather controls.
Table 2—Changes in Cardholders’ Beverage Choices Following Mandatory Calorie Posting (Treatment and control results shown separately)
Smaller size Same size Larger size Total
Lower calories per ounce 2.26 7.08 2.27 11.611.87 9.44 1.76 13.06
Same calories per ounce 4.51 67.57 4.12 76.204.39 66.74 3.95 75.08
Higher calories per ounce 1.59 6.54 4.05 12.191.54 6.92 3.40 11.86
Total 8.36 81.20 10.45 100.007.79 83.20 9.11 100.00
notes: Based on cardholder dataset. Entries are based on each individuals most common bev-erage choice before versus after calorie posting in NYC. The top entry in each cell relates to individuals in NYC, and the bottom entry in each cell relates to individuals in Boston and Philadelphia. For example, 2.26 percent of individuals in NYC changed their beverage choice (following calorie posting) to a beverage that has lower calories per ounce and also a smaller size. The number for Boston and Phildelphia is 1.87 percent. Pearson’s chi-square test fails to reject that the cell proportions for NYC are equal to those for Boston and Philadelphia (p-value of 0.11).
102 AmEricAn Economic JournAL: Economic PoLicy FEBruAry 2011
store-day level, because estimation at the transaction level (with over 100 million observations) is too burdensome. In this case, we also include store fixed effects to control for all time-invariant, store-specific heterogeneity. Store fixed effects also control for time-invariant city characteristics, which is noteworthy because the pol-icy variation we rely on for identification is at the city-week level. When we estimate the above model using the cardholder data we include individual consumer fixed effects (and drop the store fixed effects). In both cases (transaction data and card-holder data), identification of the effect of calorie posting stems from within-city variation over time.
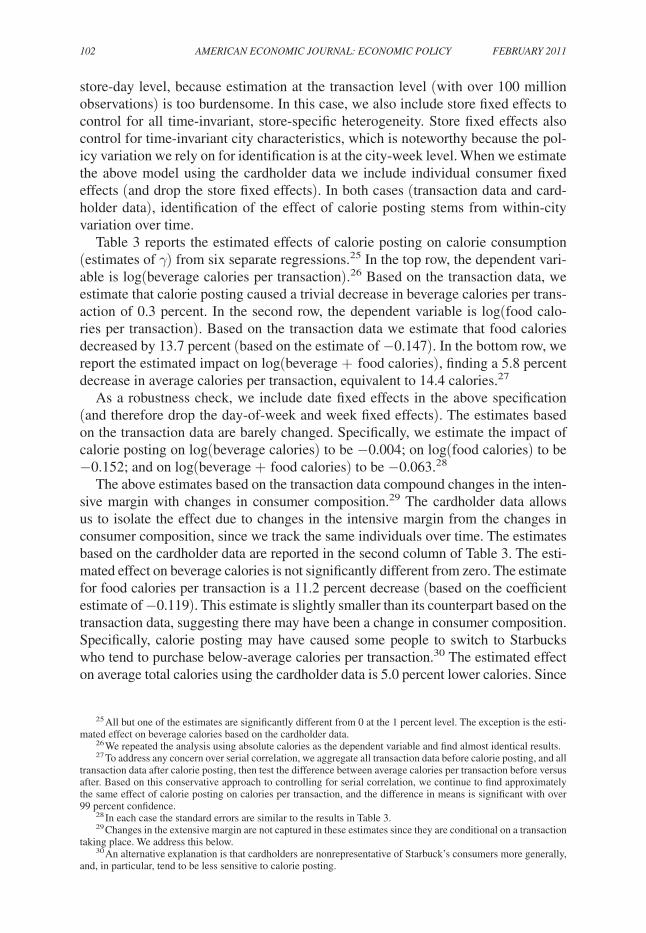
Table 3 reports the estimated effects of calorie posting on calorie consumption (estimates of γ) from six separate regressions.25 In the top row, the dependent vari-able is log(beverage calories per transaction).26 Based on the transaction data, we estimate that calorie posting caused a trivial decrease in beverage calories per trans-action of 0.3 percent. In the second row, the dependent variable is log(food calo-ries per transaction). Based on the transaction data we estimate that food calories decreased by 13.7 percent (based on the estimate of −0.147). In the bottom row, we report the estimated impact on log(beverage + food calories), finding a 5.8 percent decrease in average calories per transaction, equivalent to 14.4 calories.27
As a robustness check, we include date fixed effects in the above specification (and therefore drop the day-of-week and week fixed effects). The estimates based on the transaction data are barely changed. Specifically, we estimate the impact of calorie posting on log(beverage calories) to be −0.004; on log(food calories) to be −0.152; and on log(beverage + food calories) to be −0.063.28
The above estimates based on the transaction data compound changes in the inten-sive margin with changes in consumer composition.29 The cardholder data allows us to isolate the effect due to changes in the intensive margin from the changes in consumer composition, since we track the same individuals over time. The estimates based on the cardholder data are reported in the second column of Table 3. The esti-mated effect on beverage calories is not significantly different from zero. The estimate for food calories per transaction is a 11.2 percent decrease (based on the coefficient estimate of −0.119). This estimate is slightly smaller than its counterpart based on the transaction data, suggesting there may have been a change in consumer composition. Specifically, calorie posting may have caused some people to switch to Starbucks who tend to purchase below-average calories per transaction.30 The estimated effect on average total calories using the cardholder data is 5.0 percent lower calories. Since
25 All but one of the estimates are significantly different from 0 at the 1 percent level. The exception is the esti-mated effect on beverage calories based on the cardholder data.
26 We repeated the analysis using absolute calories as the dependent variable and find almost identical results.27 To address any concern over serial correlation, we aggregate all transaction data before calorie posting, and all
transaction data after calorie posting, then test the difference between average calories per transaction before versus after. Based on this conservative approach to controlling for serial correlation, we continue to find approximately the same effect of calorie posting on calories per transaction, and the difference in means is significant with over 99 percent confidence.
28 In each case the standard errors are similar to the results in Table 3.29 Changes in the extensive margin are not captured in these estimates since they are conditional on a transaction
taking place. We address this below.30 An alternative explanation is that cardholders are nonrepresentative of Starbuck’s consumers more generally,
and, in particular, tend to be less sensitive to calorie posting.
VoL. 3 no. 1 103BoLLingEr ET AL.: cALoriE PoSTing in chAin rESTAurAnTS
the regressions from the two datasets rely on different sources of identification, the similarity of the estimated effects strengthens our conclusions. In Section IV, we dis-cuss the magnitude of these estimates and their potential implications for obesity.
We also estimate the impact of calorie posting on the total number of calories sold by Starbucks each day. This approach combines the effect of a change in aver-age calories per transaction with a change in the number of transactions per day (which we analyze separately, below). In other words, it allows us to estimate the combined effect of changes in the extensive margin, intensive margin, and consumer composition. Although not shown in a table, we find that calorie posting causes a 4.6 in average calories per store-day.31 Since this effect is less than the estimated reduc-tion in calories per transaction, this obviously reflects the fact that Starbucks expe-rienced an increase in transactions due to calorie posting, as shown in Section III.32
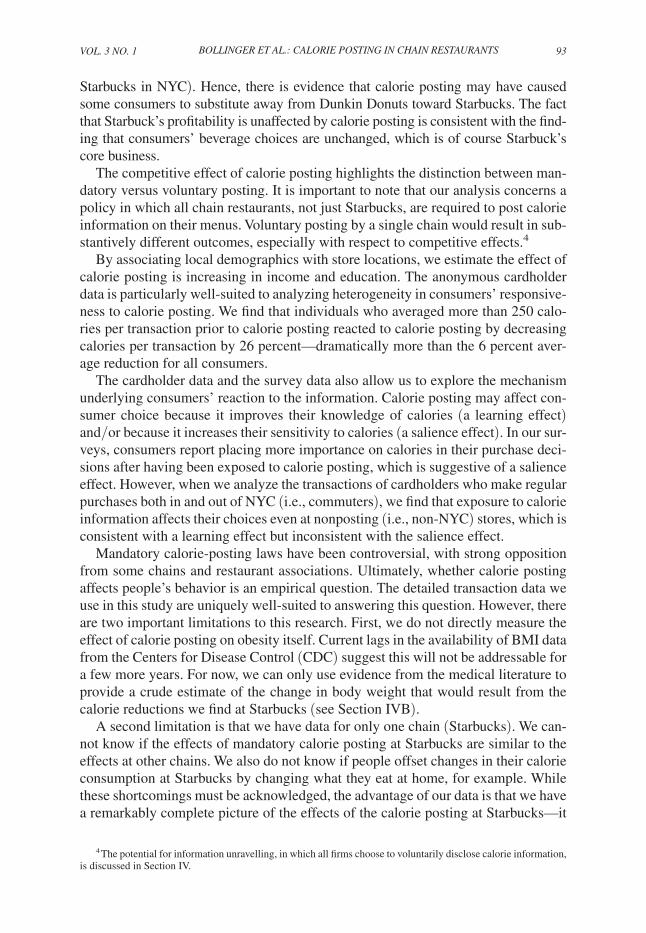
The results shown in Table 3 are based on specifications in which calorie posting is binary—i.e., the PoST variable is simply a dummy equal to one at NYC stores on every day after April 1, 2008. An alternative approach is to modify equation (1) to include separate week dummies for NYC and the control cities, and to exclude the PoST variable. This allows the data to flexibly show whether the timing of the decrease in calories per transaction corresponds to the posting date, and whether the effect diminishes over time. We can also perform this exercise separately on the
31 The estimate is significantly different from 0 with 99 percent confidence. The regression includes the same controls as in the above analysis of calories per transaction.
32 We also estimated the impact of calorie posting on calories per transaction during different mealtimes. The results show that the effect of calorie posting is slightly greater around lunchtime, but is otherwise uniform through-out the day.
Table 3—Estimates of the Effect of Mandatory Calorie Posting on Log (calories per transaction)
Transaction data Cardholder data
log (beverage calories) −0.003*** 0.008(0.001) (0.005)
log (food calories) −0.147*** −0.119***(0.002) (0.008)
log (beverages + food) −0.060*** −0.051***(0.001) (0.005)
Observations 118,480 1,511,516
notes: Each reported coefficient estimate is obtained from a separate regression. The rows rep-resent different dependent variables and the columns correspond to the transaction data and the cardholder data, respectively. An observation in the transaction data regressions is a store-day combination. An observation in the cardholder data regressions is a cardholder transaction. We exclude transactions that do not include at least one beverage or food item. All regressions include week fixed effects, day-of-week fixed effects, weather controls (temperature, temper-ature-squared, precipitation, and precipitation-squared). Additionally, regressions using the transaction data include store fixed effects, and regressions using the cardholder data include individual fixed effects. In the first column, the r 2 ranges from 0.73 to 0.85, and in the second column the r 2 ranges from 0.27 to 0.64.
*** Significant at the 1 percent level. ** Significant at the 5 percent level. * Significant at the 10 percent level.
104 AmEricAn Economic JournAL: Economic PoLicy FEBruAry 2011
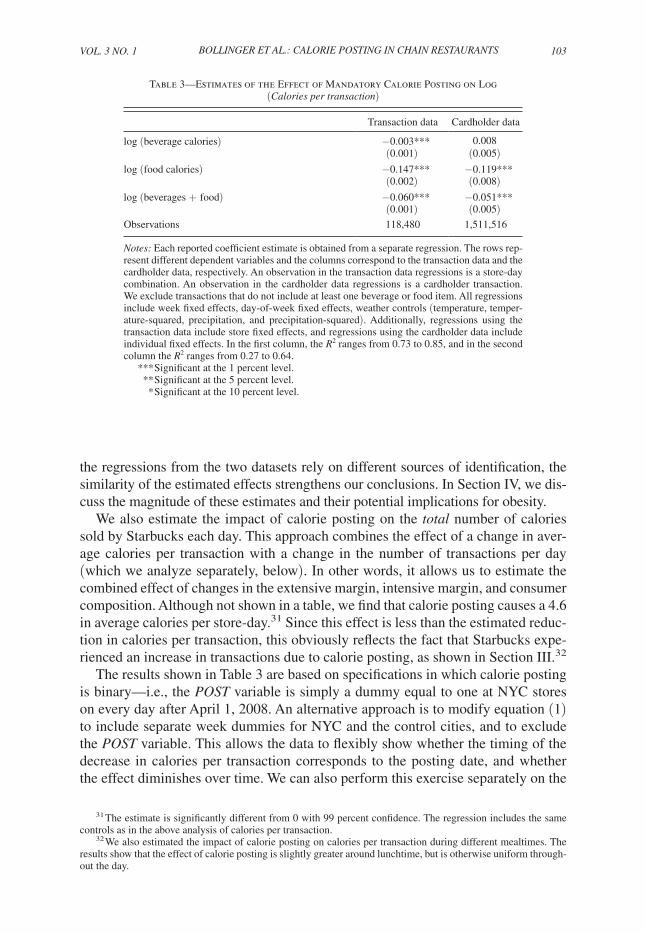
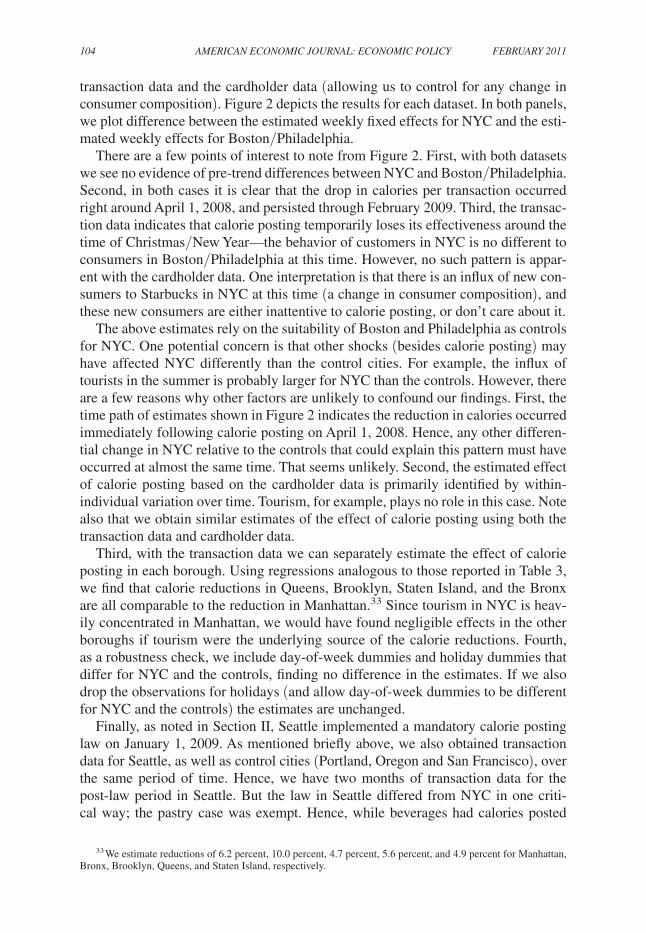
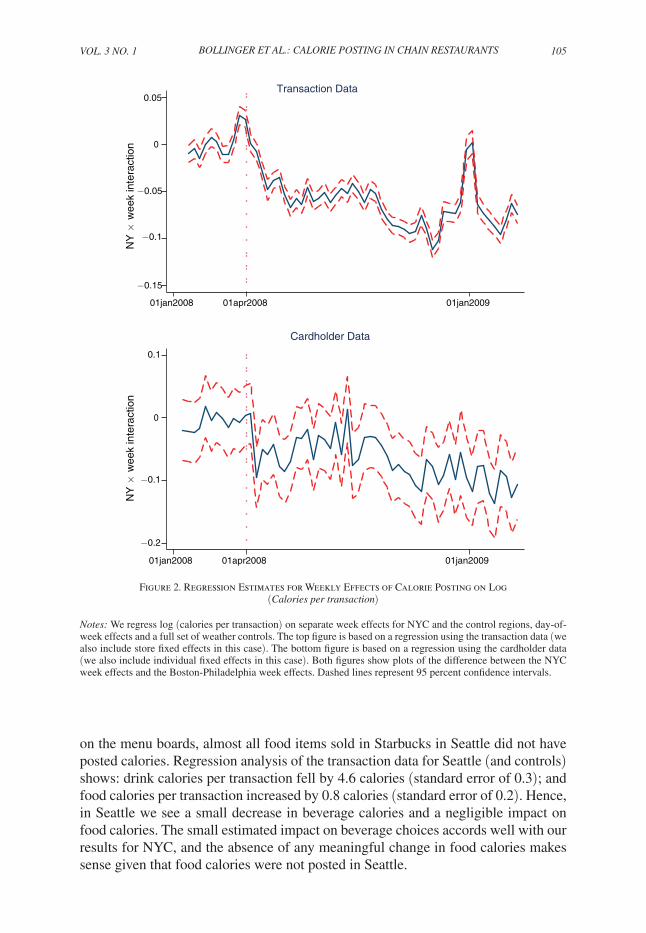
transaction data and the cardholder data (allowing us to control for any change in consumer composition). Figure 2 depicts the results for each dataset. In both panels, we plot difference between the estimated weekly fixed effects for NYC and the esti-mated weekly effects for Boston/Philadelphia.
There are a few points of interest to note from Figure 2. First, with both datasets we see no evidence of pre-trend differences between NYC and Boston/Philadelphia. Second, in both cases it is clear that the drop in calories per transaction occurred right around April 1, 2008, and persisted through February 2009. Third, the transac-tion data indicates that calorie posting temporarily loses its effectiveness around the time of Christmas/New Year—the behavior of customers in NYC is no different to consumers in Boston/Philadelphia at this time. However, no such pattern is appar-ent with the cardholder data. One interpretation is that there is an influx of new con-sumers to Starbucks in NYC at this time (a change in consumer composition), and these new consumers are either inattentive to calorie posting, or don’t care about it.
The above estimates rely on the suitability of Boston and Philadelphia as controls for NYC. One potential concern is that other shocks (besides calorie posting) may have affected NYC differently than the control cities. For example, the influx of tourists in the summer is probably larger for NYC than the controls. However, there are a few reasons why other factors are unlikely to confound our findings. First, the time path of estimates shown in Figure 2 indicates the reduction in calories occurred immediately following calorie posting on April 1, 2008. Hence, any other differen-tial change in NYC relative to the controls that could explain this pattern must have occurred at almost the same time. That seems unlikely. Second, the estimated effect of calorie posting based on the cardholder data is primarily identified by within-individual variation over time. Tourism, for example, plays no role in this case. Note also that we obtain similar estimates of the effect of calorie posting using both the transaction data and cardholder data.
Third, with the transaction data we can separately estimate the effect of calorie posting in each borough. Using regressions analogous to those reported in Table 3, we find that calorie reductions in Queens, Brooklyn, Staten Island, and the Bronx are all comparable to the reduction in Manhattan.33 Since tourism in NYC is heav-ily concentrated in Manhattan, we would have found negligible effects in the other boroughs if tourism were the underlying source of the calorie reductions. Fourth, as a robustness check, we include day-of-week dummies and holiday dummies that differ for NYC and the controls, finding no difference in the estimates. If we also drop the observations for holidays (and allow day-of-week dummies to be different for NYC and the controls) the estimates are unchanged.
Finally, as noted in Section II, Seattle implemented a mandatory calorie posting law on January 1, 2009. As mentioned briefly above, we also obtained transaction data for Seattle, as well as control cities (Portland, Oregon and San Francisco), over the same period of time. Hence, we have two months of transaction data for the post-law period in Seattle. But the law in Seattle differed from NYC in one criti-cal way; the pastry case was exempt. Hence, while beverages had calories posted
33 We estimate reductions of 6.2 percent, 10.0 percent, 4.7 percent, 5.6 percent, and 4.9 percent for Manhattan, Bronx, Brooklyn, Queens, and Staten Island, respectively.
VoL. 3 no. 1 105BoLLingEr ET AL.: cALoriE PoSTing in chAin rESTAurAnTS
on the menu boards, almost all food items sold in Starbucks in Seattle did not have posted calories. Regression analysis of the transaction data for Seattle (and controls) shows: drink calories per transaction fell by 4.6 calories (standard error of 0.3); and food calories per transaction increased by 0.8 calories (standard error of 0.2). Hence, in Seattle we see a small decrease in beverage calories and a negligible impact on food calories. The small estimated impact on beverage choices accords well with our results for NYC, and the absence of any meaningful change in food calories makes sense given that food calories were not posted in Seattle.
Figure 2. Regression Estimates for Weekly Effects of Calorie Posting on Log (calories per transaction)
notes: We regress log (calories per transaction) on separate week effects for NYC and the control regions, day-of-week effects and a full set of weather controls. The top figure is based on a regression using the transaction data (we also include store fixed effects in this case). The bottom figure is based on a regression using the cardholder data (we also include individual fixed effects in this case). Both figures show plots of the difference between the NYC week effects and the Boston-Philadelphia week effects. Dashed lines represent 95 percent confidence intervals.
−0.15
−0.1
−0.05
0
0.05
NY
× w
eek
inte
ract
ion
01jan2008 01apr2008 01jan2009
Transaction Data
NY
× w
eek
inte
ract
ion
01jan2008 01apr2008 01jan2009
Cardholder Data
−0.2
−0.1
0
0.1
106 AmEricAn Economic JournAL: Economic PoLicy FEBruAry 2011
B. Substitution Effects
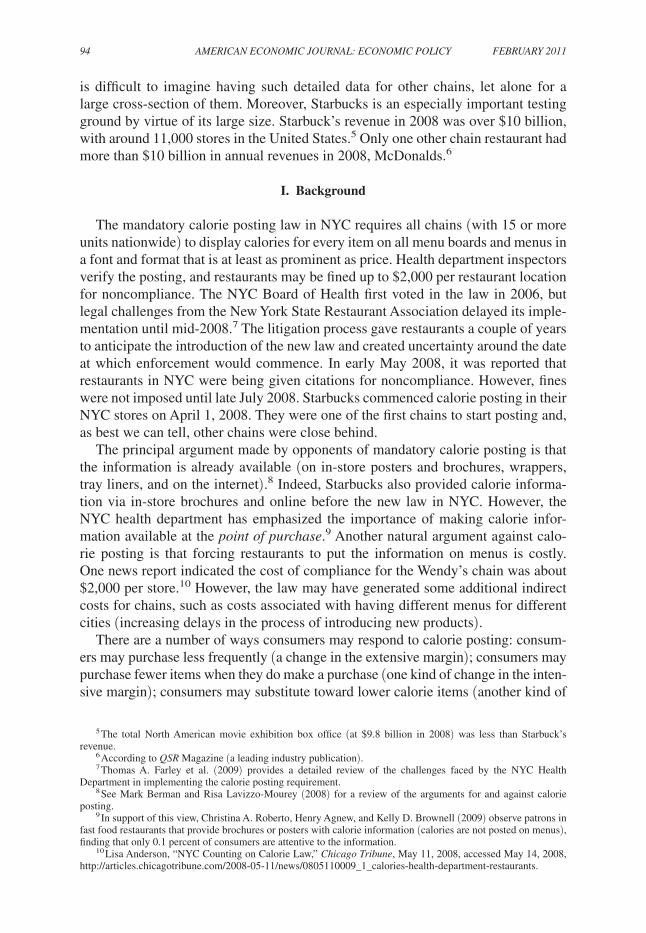
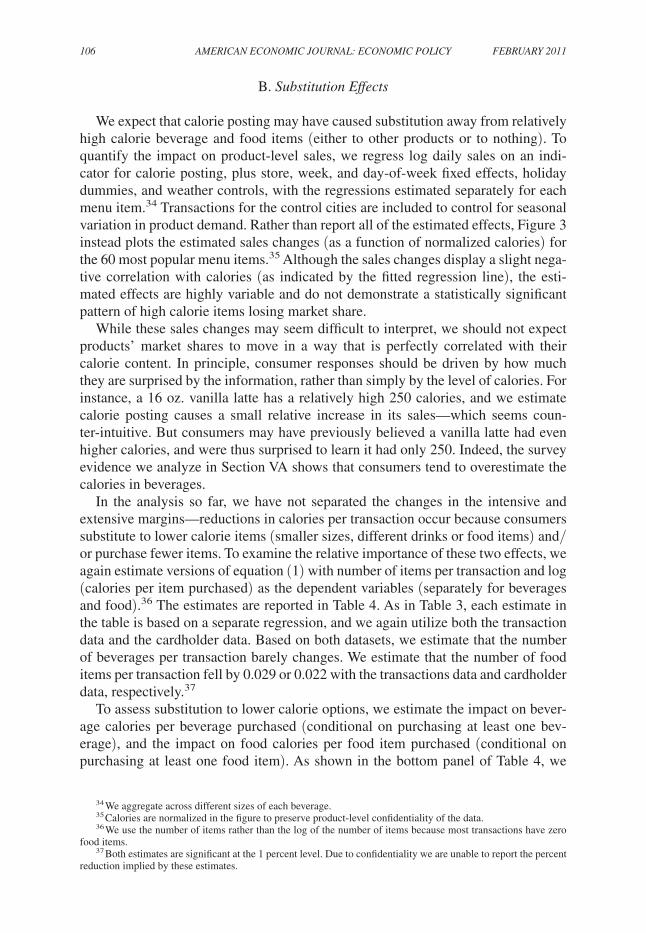
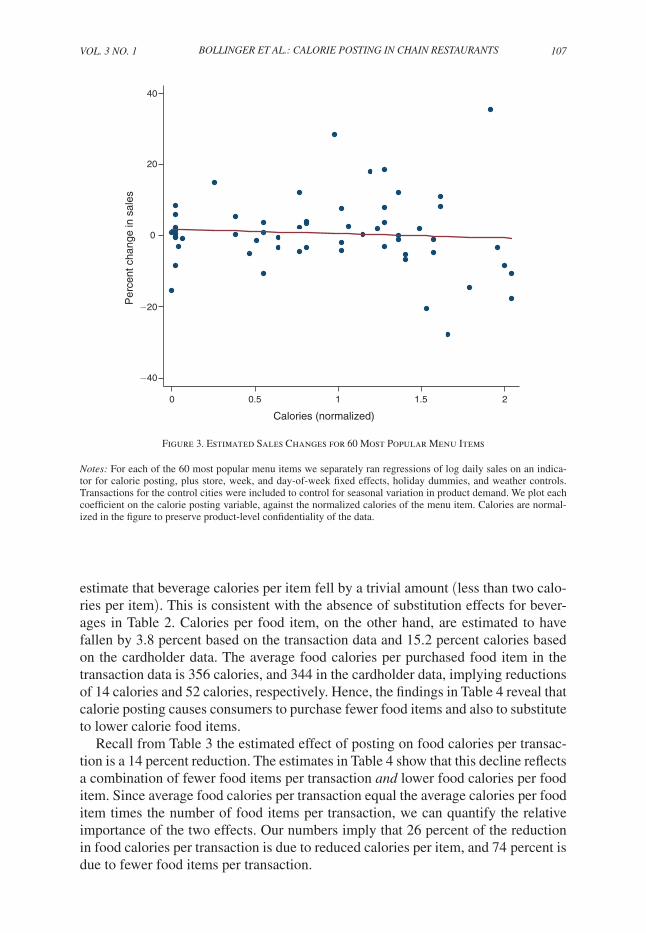
We expect that calorie posting may have caused substitution away from relatively high calorie beverage and food items (either to other products or to nothing). To quantify the impact on product-level sales, we regress log daily sales on an indi-cator for calorie posting, plus store, week, and day-of-week fixed effects, holiday dummies, and weather controls, with the regressions estimated separately for each menu item.34 Transactions for the control cities are included to control for seasonal variation in product demand. Rather than report all of the estimated effects, Figure 3 instead plots the estimated sales changes (as a function of normalized calories) for the 60 most popular menu items.35 Although the sales changes display a slight nega-tive correlation with calories (as indicated by the fitted regression line), the esti-mated effects are highly variable and do not demonstrate a statistically significant pattern of high calorie items losing market share.
While these sales changes may seem difficult to interpret, we should not expect products’ market shares to move in a way that is perfectly correlated with their calorie content. In principle, consumer responses should be driven by how much they are surprised by the information, rather than simply by the level of calories. For instance, a 16 oz. vanilla latte has a relatively high 250 calories, and we estimate calorie posting causes a small relative increase in its sales—which seems coun-ter-intuitive. But consumers may have previously believed a vanilla latte had even higher calories, and were thus surprised to learn it had only 250. Indeed, the survey evidence we analyze in Section VA shows that consumers tend to overestimate the calories in beverages.
In the analysis so far, we have not separated the changes in the intensive and extensive margins—reductions in calories per transaction occur because consumers substitute to lower calorie items (smaller sizes, different drinks or food items) and/or purchase fewer items. To examine the relative importance of these two effects, we again estimate versions of equation (1) with number of items per transaction and log (calories per item purchased) as the dependent variables (separately for beverages and food).36 The estimates are reported in Table 4. As in Table 3, each estimate in the table is based on a separate regression, and we again utilize both the transaction data and the cardholder data. Based on both datasets, we estimate that the number of beverages per transaction barely changes. We estimate that the number of food items per transaction fell by 0.029 or 0.022 with the transactions data and cardholder data, respectively.37
To assess substitution to lower calorie options, we estimate the impact on bever-age calories per beverage purchased (conditional on purchasing at least one bev-erage), and the impact on food calories per food item purchased (conditional on purchasing at least one food item). As shown in the bottom panel of Table 4, we
34 We aggregate across different sizes of each beverage.35 Calories are normalized in the figure to preserve product-level confidentiality of the data.36 We use the number of items rather than the log of the number of items because most transactions have zero
food items.37 Both estimates are significant at the 1 percent level. Due to confidentiality we are unable to report the percent
reduction implied by these estimates.
VoL. 3 no. 1 107BoLLingEr ET AL.: cALoriE PoSTing in chAin rESTAurAnTS
estimate that beverage calories per item fell by a trivial amount (less than two calo-ries per item). This is consistent with the absence of substitution effects for bever-ages in Table 2. Calories per food item, on the other hand, are estimated to have fallen by 3.8 percent based on the transaction data and 15.2 percent calories based on the cardholder data. The average food calories per purchased food item in the transaction data is 356 calories, and 344 in the cardholder data, implying reductions of 14 calories and 52 calories, respectively. Hence, the findings in Table 4 reveal that calorie posting causes consumers to purchase fewer food items and also to substitute to lower calorie food items.
Recall from Table 3 the estimated effect of posting on food calories per transac-tion is a 14 percent reduction. The estimates in Table 4 show that this decline reflects a combination of fewer food items per transaction and lower food calories per food item. Since average food calories per transaction equal the average calories per food item times the number of food items per transaction, we can quantify the relative importance of the two effects. Our numbers imply that 26 percent of the reduction in food calories per transaction is due to reduced calories per item, and 74 percent is due to fewer food items per transaction.
Figure 3. Estimated Sales Changes for 60 Most Popular Menu Items
notes: For each of the 60 most popular menu items we separately ran regressions of log daily sales on an indica-tor for calorie posting, plus store, week, and day-of-week fixed effects, holiday dummies, and weather controls. Transactions for the control cities were included to control for seasonal variation in product demand. We plot each coefficient on the calorie posting variable, against the normalized calories of the menu item. Calories are normal-ized in the figure to preserve product-level confidentiality of the data.
−40
−20
0
20
40
Per
cent
cha
nge
in s
ales
0 0.5 1 1.5 2
Calories (normalized)
108 AmEricAn Economic JournAL: Economic PoLicy FEBruAry 2011
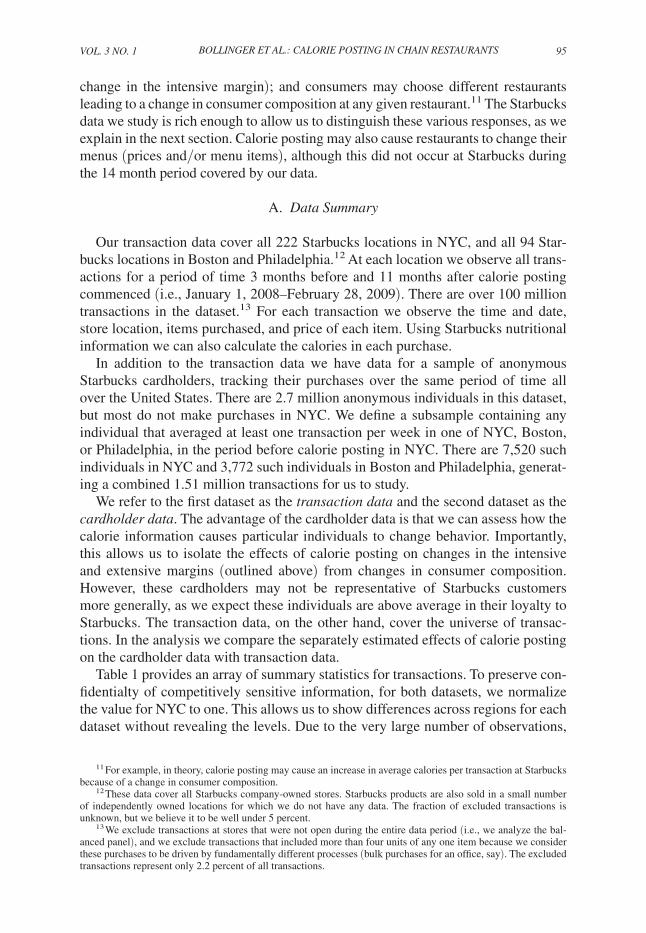
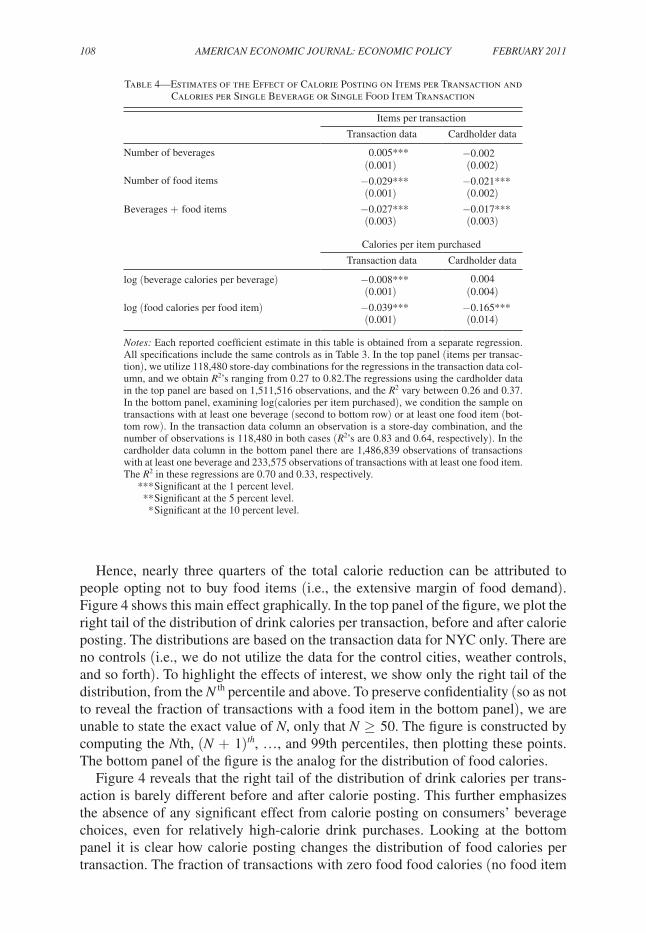
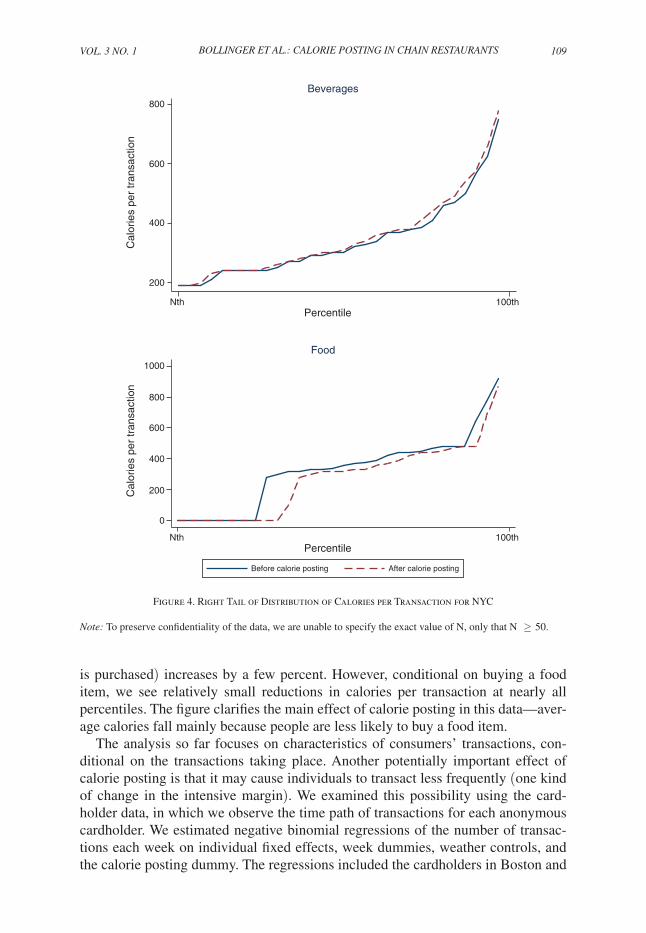
Hence, nearly three quarters of the total calorie reduction can be attributed to people opting not to buy food items (i.e., the extensive margin of food demand). Figure 4 shows this main effect graphically. In the top panel of the figure, we plot the right tail of the distribution of drink calories per transaction, before and after calorie posting. The distributions are based on the transaction data for NYC only. There are no controls (i.e., we do not utilize the data for the control cities, weather controls, and so forth). To highlight the effects of interest, we show only the right tail of the distribution, from the n th percentile and above. To preserve confidentiality (so as not to reveal the fraction of transactions with a food item in the bottom panel), we are unable to state the exact value of n, only that n ≥ 50. The figure is constructed by computing the nth, (n + 1)th, …, and 99th percentiles, then plotting these points. The bottom panel of the figure is the analog for the distribution of food calories.
Figure 4 reveals that the right tail of the distribution of drink calories per trans-action is barely different before and after calorie posting. This further emphasizes the absence of any significant effect from calorie posting on consumers’ beverage choices, even for relatively high-calorie drink purchases. Looking at the bottom panel it is clear how calorie posting changes the distribution of food calories per transaction. The fraction of transactions with zero food food calories (no food item
Table 4—Estimates of the Effect of Calorie Posting on Items per Transaction and Calories per Single Beverage or Single Food Item Transaction
Items per transaction
Transaction data Cardholder data
Number of beverages 0.005*** −0.002(0.001) (0.002)
Number of food items −0.029*** −0.021***(0.001) (0.002)
Beverages + food items −0.027*** −0.017***(0.003) (0.003)
Calories per item purchased
Transaction data Cardholder data
log (beverage calories per beverage) −0.008*** 0.004(0.001) (0.004)
log (food calories per food item) −0.039*** −0.165***(0.001) (0.014)
notes: Each reported coefficient estimate in this table is obtained from a separate regression. All specifications include the same controls as in Table 3. In the top panel (items per transac-tion), we utilize 118,480 store-day combinations for the regressions in the transaction data col-umn, and we obtain r 2 ’s ranging from 0.27 to 0.82.The regressions using the cardholder data in the top panel are based on 1,511,516 observations, and the r 2 vary between 0.26 and 0.37. In the bottom panel, examining log(calories per item purchased), we condition the sample on transactions with at least one beverage (second to bottom row) or at least one food item (bot-tom row). In the transaction data column an observation is a store-day combination, and the number of observations is 118,480 in both cases ( r 2 ’s are 0.83 and 0.64, respectively). In the cardholder data column in the bottom panel there are 1,486,839 observations of transactions with at least one beverage and 233,575 observations of transactions with at least one food item. The r 2 in these regressions are 0.70 and 0.33, respectively.
*** Significant at the 1 percent level. ** Significant at the 5 percent level. * Significant at the 10 percent level.
VoL. 3 no. 1 109BoLLingEr ET AL.: cALoriE PoSTing in chAin rESTAurAnTS
is purchased) increases by a few percent. However, conditional on buying a food item, we see relatively small reductions in calories per transaction at nearly all percentiles. The figure clarifies the main effect of calorie posting in this data—aver-age calories fall mainly because people are less likely to buy a food item.
The analysis so far focuses on characteristics of consumers’ transactions, con-ditional on the transactions taking place. Another potentially important effect of calorie posting is that it may cause individuals to transact less frequently (one kind of change in the intensive margin). We examined this possibility using the card-holder data, in which we observe the time path of transactions for each anonymous cardholder. We estimated negative binomial regressions of the number of transac-tions each week on individual fixed effects, week dummies, weather controls, and the calorie posting dummy. The regressions included the cardholders in Boston and
Figure 4. Right Tail of Distribution of Calories per Transaction for NYC
note: To preserve confidentiality of the data, we are unable to specify the exact value of N, only that N ≥ 50.
200
400
600
800
Cal
orie
s pe
r tr
ansa
ctio
n
Nth 100thPercentile
Beverages
0
200
400
600
800
1000
Cal
orie
s pe
r tr
ansa
ctio
n
Nth 100thPercentile
Before calorie posting After calorie posting
Food
110 AmEricAn Economic JournAL: Economic PoLicy FEBruAry 2011
Philadelphia as controls. We found no statistically significant change in the fre-quency of cardholders’ purchases in NYC relative to the control cities; indeed, the point estimate of the coefficient on calorie posting was very close to zero. We con-clude that while calorie posting clearly affected consumers’ choices in the store, it had little impact on how often they came to the store.
As noted in Section II, the transaction data and cardholder data have no informa-tion about milk that is added by consumers in the store. The milk order data provide aggregate information about milk usage, based on daily milk replenishments at the store level. We looked for evidence of changes in the level of milk usage, by type of milk (whole, two percent, or skim), and changes in the relative usage of different kinds of milk.38 In all cases, there was no statistically significant impact of calorie posting. This is consistent with the results reported above indicating that beverage consumption was largely unaffected by calorie posting.
C. heterogeneity in the Effect of mandatory calorie Posting
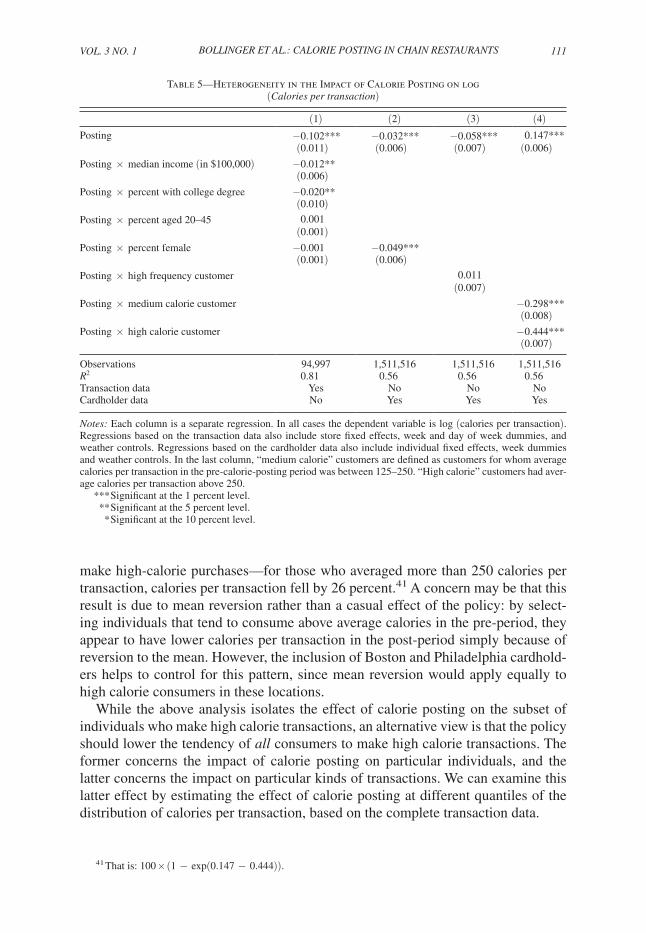
While we have focused primarily on average outcomes, people presumably vary in their responsiveness to the calorie information. In Table 5, we present estimates of how the effect of calorie posting on calories per transaction differs across sub-groups. The estimates in column 1 are based on the transaction data. Although the anonymous transaction data contain no information about the demographics of the consumers who made each transaction, we do know the store location of each transaction, and census data provide us with zip-level demographics. Using this information, we find that the decrease in calories per transaction was larger in zips with higher income and in zips with more education (i.e., more people with college degrees).39
Columns 2–4 of Table 5 are based on the anonymous cardholder data. These data actually include one demographic variable: the gender of each cardholder. We find that female cardholders were more responsive to posting than males.40 Based on their observed transactions prior to calorie posting, we also assigned cardholders to groups based on whether their purchase frequency was above or below the median frequency. As shown in column 3 of the table, we find that high frequency cardholders reduce calories per transaction by slightly less than low frequency cardholders.
If the policy goal is to address obesity, the most relevant question may be whether calorie posting disproportionately affects consumers who make high-calorie pur-chases. For each cardholder, we compute their average calories per transaction in the period before posting, assigning them to one of three categories: less than 125, between 125 and 250, or greater than 250. As shown in column 4 of Table 5, we find that calorie posting has an even greater influence on cardholders who tended to
38 The milk order data includes Boston and Philadelphia, allowing us to control for the strong seasonal variation in milk usage.
39 This result may partially explain why the study by Elbel et al. (2009), which focused on low-income neigh-borhoods, did not find statistically significant effects of calorie-posting.
40 The results in the first column, based on the transaction data, suggest no meaningful difference between males and females. However, the individual-level data is surely more convincing in this case.
VoL. 3 no. 1 111BoLLingEr ET AL.: cALoriE PoSTing in chAin rESTAurAnTS
make high-calorie purchases—for those who averaged more than 250 calories per transaction, calories per transaction fell by 26 percent.41 A concern may be that this result is due to mean reversion rather than a casual effect of the policy: by select-ing individuals that tend to consume above average calories in the pre-period, they appear to have lower calories per transaction in the post-period simply because of reversion to the mean. However, the inclusion of Boston and Philadelphia cardhold-ers helps to control for this pattern, since mean reversion would apply equally to high calorie consumers in these locations.
While the above analysis isolates the effect of calorie posting on the subset of individuals who make high calorie transactions, an alternative view is that the policy should lower the tendency of all consumers to make high calorie transactions. The former concerns the impact of calorie posting on particular individuals, and the latter concerns the impact on particular kinds of transactions. We can examine this latter effect by estimating the effect of calorie posting at different quantiles of the distribution of calories per transaction, based on the complete transaction data.
41 That is: 100 × (1 − exp(0.147 − 0.444)).
Table 5—Heterogeneity in the Impact of Calorie Posting on log (calories per transaction)
(1) (2) (3) (4)Posting −0.102*** −0.032*** −0.058*** 0.147***
(0.011) (0.006) (0.007) (0.006)Posting × median income (in $100,000) −0.012**
(0.006)Posting × percent with college degree −0.020**
(0.010)Posting × percent aged 20–45 0.001
(0.001)Posting × percent female −0.001 −0.049***
(0.001) (0.006)Posting × high frequency customer 0.011
(0.007)Posting × medium calorie customer −0.298***
(0.008)Posting × high calorie customer −0.444***
(0.007)
Observations 94,997 1,511,516 1,511,516 1,511,516 r 2 0.81 0.56 0.56 0.56Transaction data Yes No No NoCardholder data No Yes Yes Yes
notes: Each column is a separate regression. In all cases the dependent variable is log (calories per transaction). Regressions based on the transaction data also include store fixed effects, week and day of week dummies, and weather controls. Regressions based on the cardholder data also include individual fixed effects, week dummies and weather controls. In the last column, “medium calorie” customers are defined as customers for whom average calories per transaction in the pre-calorie-posting period was between 125–250. “High calorie” customers had aver-age calories per transaction above 250.
*** Significant at the 1 percent level. ** Significant at the 5 percent level. * Significant at the 10 percent level.
112 AmEricAn Economic JournAL: Economic PoLicy FEBruAry 2011
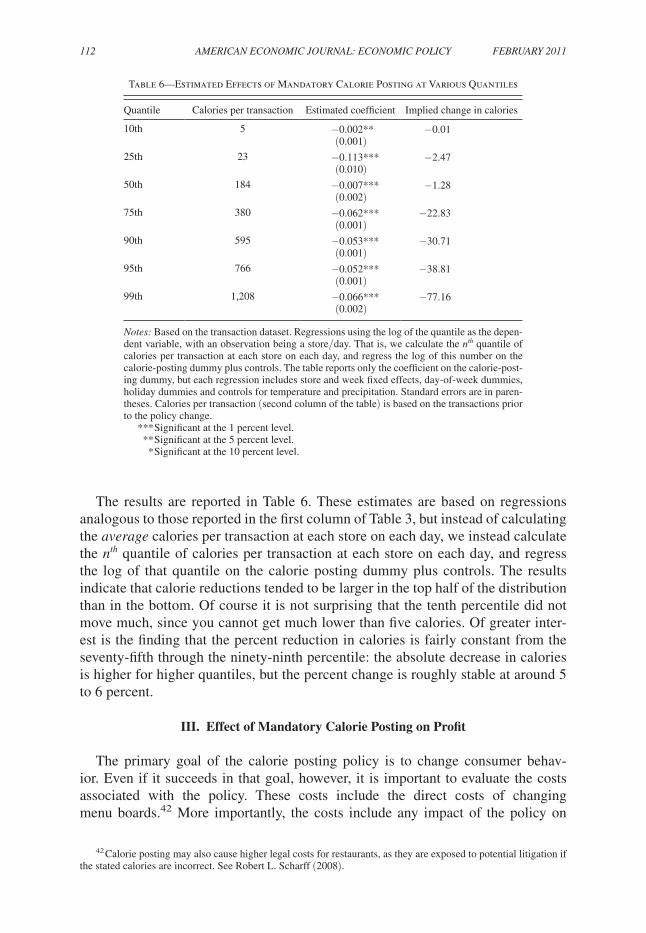
The results are reported in Table 6. These estimates are based on regressions analogous to those reported in the first column of Table 3, but instead of calculating the average calories per transaction at each store on each day, we instead calculate the nth quantile of calories per transaction at each store on each day, and regress the log of that quantile on the calorie posting dummy plus controls. The results indicate that calorie reductions tended to be larger in the top half of the distribution than in the bottom. Of course it is not surprising that the tenth percentile did not move much, since you cannot get much lower than five calories. Of greater inter-est is the finding that the percent reduction in calories is fairly constant from the seventy-fifth through the ninety-ninth percentile: the absolute decrease in calories is higher for higher quantiles, but the percent change is roughly stable at around 5 to 6 percent.
III. Effect of Mandatory Calorie Posting on Profit
The primary goal of the calorie posting policy is to change consumer behav-ior. Even if it succeeds in that goal, however, it is important to evaluate the costs associated with the policy. These costs include the direct costs of changing menu boards.42 More importantly, the costs include any impact of the policy on
42 Calorie posting may also cause higher legal costs for restaurants, as they are exposed to potential litigation if the stated calories are incorrect. See Robert L. Scharff (2008).
Table 6—Estimated Effects of Mandatory Calorie Posting at Various Quantiles
Quantile Calories per transaction Estimated coefficient Implied change in calories
10th 5 −0.002** −0.01(0.001)
25th 23 −0.113*** −2.47(0.010)
50th 184 −0.007*** −1.28(0.002)
75th 380 −0.062*** −22.83(0.001)
90th 595 −0.053*** −30.71(0.001)
95th 766 −0.052*** −38.81(0.001)
99th 1,208 −0.066*** −77.16(0.002)
notes: Based on the transaction dataset. Regressions using the log of the quantile as the depen-dent variable, with an observation being a store/day. That is, we calculate the nth quantile of calories per transaction at each store on each day, and regress the log of this number on the calorie-posting dummy plus controls. The table reports only the coefficient on the calorie-post-ing dummy, but each regression includes store and week fixed effects, day-of-week dummies, holiday dummies and controls for temperature and precipitation. Standard errors are in paren-theses. Calories per transaction (second column of the table) is based on the transactions prior to the policy change.
*** Significant at the 1 percent level. ** Significant at the 5 percent level. * Significant at the 10 percent level.
VoL. 3 no. 1 113BoLLingEr ET AL.: cALoriE PoSTing in chAin rESTAurAnTS
restaurants’ operating profits. In this section, we analyze the impact of calorie post-ing on Starbucks revenue. Although we have no cost data, and therefore cannot measure profit directly, we suspect revenue is highly correlated with profit for this firm, for reasons we explain below.
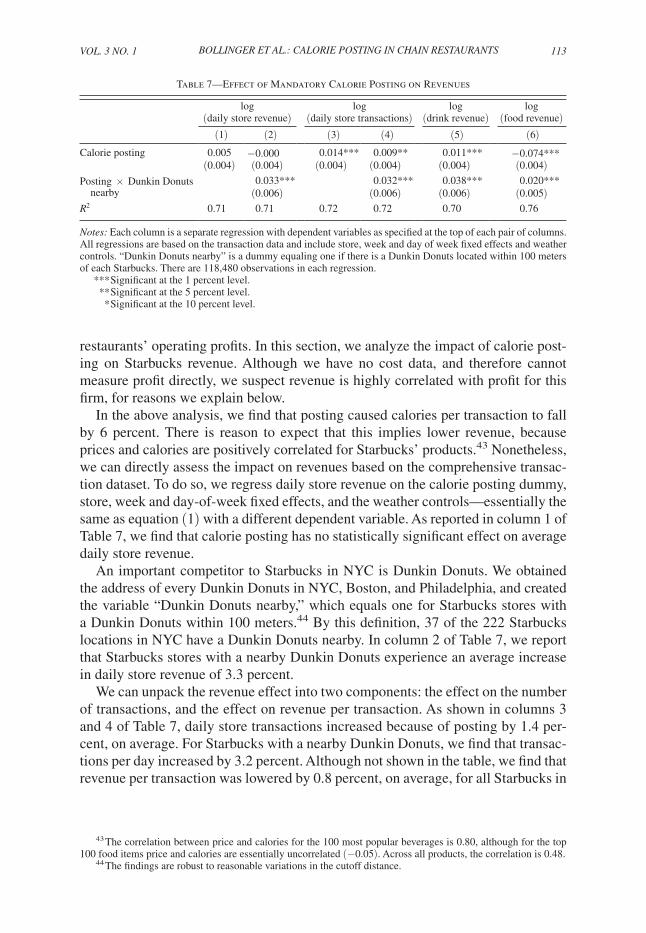
In the above analysis, we find that posting caused calories per transaction to fall by 6 percent. There is reason to expect that this implies lower revenue, because prices and calories are positively correlated for Starbucks’ products.43 Nonetheless, we can directly assess the impact on revenues based on the comprehensive transac-tion dataset. To do so, we regress daily store revenue on the calorie posting dummy, store, week and day-of-week fixed effects, and the weather controls—essentially the same as equation (1) with a different dependent variable. As reported in column 1 of Table 7, we find that calorie posting has no statistically significant effect on average daily store revenue.
An important competitor to Starbucks in NYC is Dunkin Donuts. We obtained the address of every Dunkin Donuts in NYC, Boston, and Philadelphia, and created the variable “Dunkin Donuts nearby,” which equals one for Starbucks stores with a Dunkin Donuts within 100 meters.44 By this definition, 37 of the 222 Starbucks locations in NYC have a Dunkin Donuts nearby. In column 2 of Table 7, we report that Starbucks stores with a nearby Dunkin Donuts experience an average increase in daily store revenue of 3.3 percent.
We can unpack the revenue effect into two components: the effect on the number of transactions, and the effect on revenue per transaction. As shown in columns 3 and 4 of Table 7, daily store transactions increased because of posting by 1.4 per-cent, on average. For Starbucks with a nearby Dunkin Donuts, we find that transac-tions per day increased by 3.2 percent. Although not shown in the table, we find that revenue per transaction was lowered by 0.8 percent, on average, for all Starbucks in
43 The correlation between price and calories for the 100 most popular beverages is 0.80, although for the top 100 food items price and calories are essentially uncorrelated (−0.05). Across all products, the correlation is 0.48.
44 The findings are robust to reasonable variations in the cutoff distance.
Table 7—Effect of Mandatory Calorie Posting on Revenues
log (daily store revenue)
log (daily store transactions)
log (drink revenue)
log (food revenue)
(1) (2) (3) (4) (5) (6) Calorie posting 0.005 −0.000 0.014*** 0.009** 0.011*** −0.074***
(0.004) (0.004) (0.004) (0.004) (0.004) (0.004) Posting × Dunkin Donuts 0.033*** 0.032*** 0.038*** 0.020*** nearby (0.006) (0.006) (0.006) (0.005) r 2 0.71 0.71 0.72 0.72 0.70 0.76
notes: Each column is a separate regression with dependent variables as specified at the top of each pair of columns. All regressions are based on the transaction data and include store, week and day of week fixed effects and weather controls. “Dunkin Donuts nearby” is a dummy equaling one if there is a Dunkin Donuts located within 100 meters of each Starbucks. There are 118,480 observations in each regression.
*** Significant at the 1 percent level. ** Significant at the 5 percent level. * Significant at the 10 percent level.
114 AmEricAn Economic JournAL: Economic PoLicy FEBruAry 2011
NYC. Hence, revenue per transaction is slightly down, and transactions per day are slightly up, leading to zero net impact of calorie posting on Starbucks’ revenues.
We interpret these results as evidence that calorie posting causes consumers to not only substitute products within stores, but also to substitute across stores. Dunkin Donuts was also required to post calories, and since donuts are very high in calories, this may have discouraged consumers from patronizing Dunkin Donuts. For example, consider the consumers that like to buy a coffee and a donut at Dunkin Donuts. After calories are posted, some of these consumers decide not to buy a donut any more, and if they are just going to have a coffee, then they prefer Starbuck’s coffee. If there is a Starbucks nearby, then the effect of calorie posting is to cause some of these customers to switch to buying a coffee at Starbucks. We see suggestive evidence of this when we look separately at the impact of posting on beverage revenues versus food revenues. Column 5 of Table 7 reports that drink revenues increased by 1.1 percent for Starbucks not near a Dunkin Donuts, and for Starbucks with a Dunkin Donuts nearby drink revenues increased by 5.0 percent (based on the estimates of 0.011 + 0.038). Column 6 shows that food revenues fell by 7.7 percent (based on the estimate of −0.074) for Starbucks without a nearby Dunkin Donuts, but fell by only 5.5 percent for those with a nearby Dunkin Donuts. Hence, not only did store revenue tend to increase for Starbucks located near a Dunkin Donuts, but the increase stemmed entirely from improved beverage sales.
The results in the table describe the impact of calorie posting on revenues, but profits are ultimately the relevant measure. Even if revenue did not change at all, it is possible that profits declined; consumers’ purchases could have shifted toward products with the same prices but smaller profit margins. However, the data suggest that the opposite is true. After calorie posting, the average price per item purchased increased in NYC relative to the control cities. We suspect that Starbucks’ product-level profit margins are positively correlated with prices, so the increase in average price per item suggests that purchases may have shifted toward products with higher profit margins, on average.
IV. Discussion
To summarize briefly, the analyses above show that mandatory calorie posting caused food calories per transaction to fall by 14 percent, on average, but had a negligible impact on beverage calories per transaction. Three quarters of the reduc-tion in food calories was due to consumers being less likely to purchase a food item (extensive margin), and one quarter of the effect was due to consumers substituting toward lower calorie food items (intensive margin). The effect is larger for individu-als that tended to make high-calorie purchases at Starbucks prior to calorie posting (we find a 26 percent reduction). There does not appear to have been any change in individuals’ transaction frequency. We also find that the impact of calorie posting on profits depends on whether there is a nearby Dunkin Donuts. Overall, however, there is no significant effect on Starbucks profit.
In this section, we discuss a number of questions that naturally arise in light of these findings. Why is there an effect? Is the effect big enough to matter? Does
VoL. 3 no. 1 115BoLLingEr ET AL.: cALoriE PoSTing in chAin rESTAurAnTS
mandatory calorie posting cause restaurants to offer low calorie options? And why is government intervention required?
A. Why is There an Effect?
One reason why calorie posting may affect consumer choice is a learning effect. If consumers were previously uninformed about the caloric content of the items, the information may alter their purchase decisions.45 Since the information was already available at the Starbucks website, this explanation presumes it is costly to learn about calories, with posting on menus reducing the cost of learning. The nutri-tion information at the website is in fact much more comprehensive than the simple calorie count shown on menus, but prior research shows that individuals may be inattentive when information is complex or opaque.46 Another possible explanation for the observed reduction in calories per transaction is a salience effect; consumers know the calories, but only incorporate this into decision-making when reminded at the point of purchase.47 Of course, behavior may be driven by a combination of learning and salience effects.
To examine the plausibility of these explanations, we designed and implemented a survey of Starbucks customers before and after calorie posting. We were not able to do this in NYC because we began the study after the introduction of posting in NYC. However, we learned in advance that Seattle would introduce calorie posting on January 1, 2009. An important difference with the calorie posting requirement in NYC is that the pastry case was exempt in Seattle. Hence, while beverages had calo-ries posted on the menu boards, food items sold in Starbucks in Seattle did not.48 On December 5, 2008 (prior to posting in Seattle), we performed in-store customer surveys at two locations in Seattle and two locations in San Francisco, and again on January 30, 2009 (after posting) in the same four locations. The inclusion of surveys in San Francisco is useful to control for time trends. The actual two-page question-naire is shown in the Appendix.
All surveys were completed between the hours of 9 am and 12 pm. Consumers were approached after making a purchase and offered a $5 Starbucks gift card to complete the survey. Generally these were customers waiting for barista-made beverages (e.g., caffè latte). Hence, we expect our sample under-represents consum-ers that ordered regular coffee (which is fulfilled immediately), but this was consistent across locations, and before and after posting. Respondents were positioned where they could not see the menu boards while answering the questions. We obtained 792 completed surveys in total (an average of 99 responses per store per wave).
45 Hongbin Cai, Yuyu Chen, and Hanming Fang (2009) also study a particular form of learning (i.e., social learning) in a restaurant context.
46 The nutrition information at Starbucks’ website includes calories, fat calories, total fat, saturated fat, trans fat, cholesterol, sodium, total carbohydrates, fiber, sugar, protein, vitamin A, vitamin B, vitamin C, calcium, iron, and caffeine. See Gill Cowburn and Lynn Stockley (2005) for a survey of the literature on consumer understanding and use of nutrition labeling on packaged foods. Stefano DellaVigna (2009) provides a review of the broader economic research into the limited abilities of individuals to utilize available information in decision making.
47 Salience effects have been found to be important in the context of taxation, see Raj Chetty, Adam Looney, and Kory Kroft (2009) and Amy Finkelstein (2009).
48 As noted in Section III, regression analysis of the transaction data for Seattle (and controls) shows no signifi-cant impact of calorie posting on either food or beverage calories per transaction.
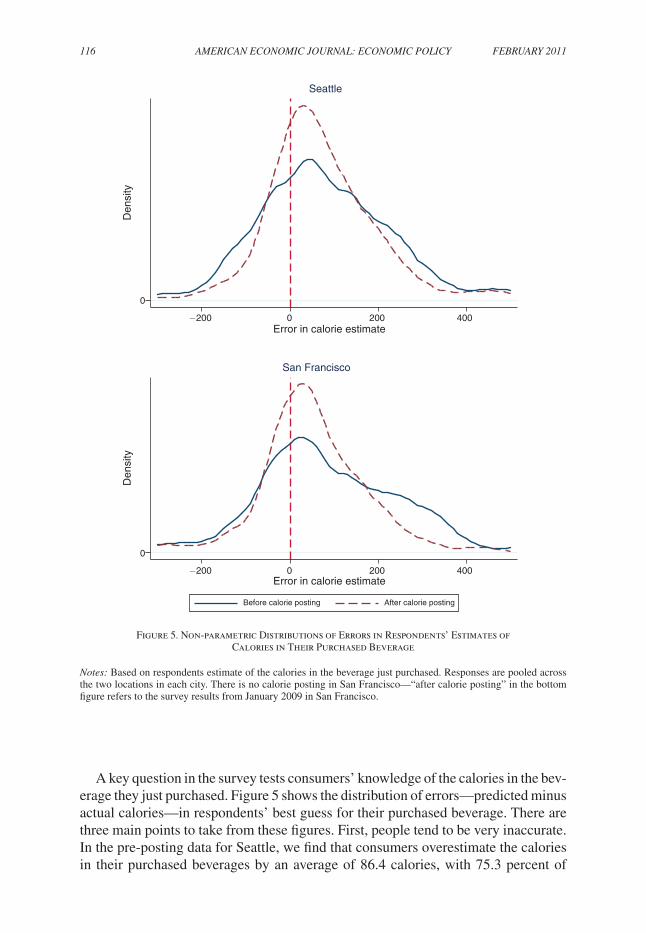
116 AmEricAn Economic JournAL: Economic PoLicy FEBruAry 2011
A key question in the survey tests consumers’ knowledge of the calories in the bev-erage they just purchased. Figure 5 shows the distribution of errors—predicted minus actual calories—in respondents’ best guess for their purchased beverage. There are three main points to take from these figures. First, people tend to be very inaccurate. In the pre-posting data for Seattle, we find that consumers overestimate the calories in their purchased beverages by an average of 86.4 calories, with 75.3 percent of
Figure 5. Non-parametric Distributions of Errors in Respondents’ Estimates of Calories in Their Purchased Beverage
notes: Based on respondents estimate of the calories in the beverage just purchased. Responses are pooled across the two locations in each city. There is no calorie posting in San Francisco—“after calorie posting” in the bottom figure refers to the survey results from January 2009 in San Francisco.
0
Den
sity
−200 0 200 400
0
−200 0 200 400
Error in calorie estimate
Seattle
Den
sity
Error in calorie estimate
Before calorie posting After calorie posting
San Francisco
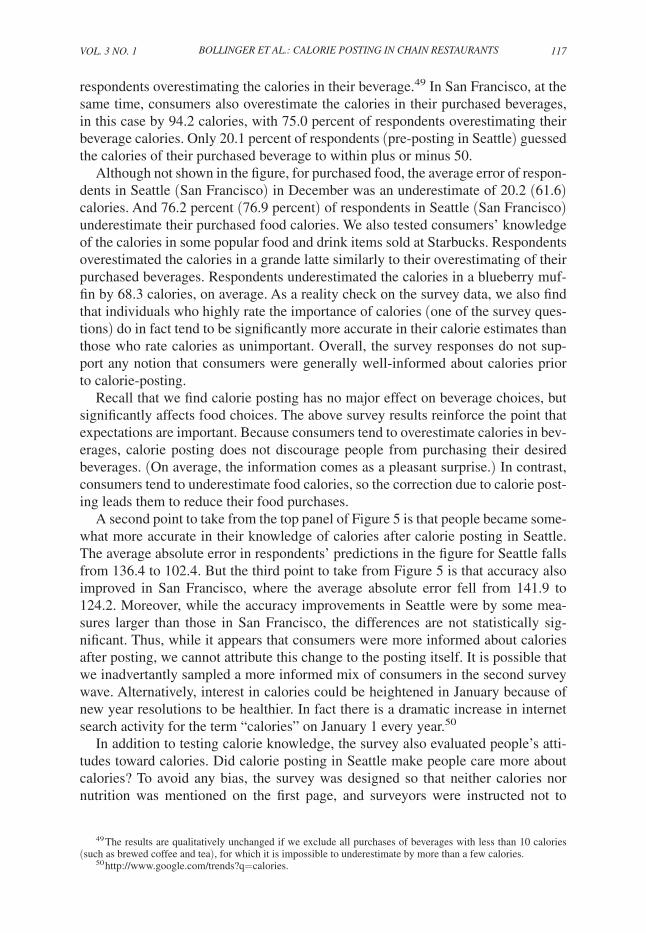
VoL. 3 no. 1 117BoLLingEr ET AL.: cALoriE PoSTing in chAin rESTAurAnTS
respondents overestimating the calories in their beverage.49 In San Francisco, at the same time, consumers also overestimate the calories in their purchased beverages, in this case by 94.2 calories, with 75.0 percent of respondents overestimating their beverage calories. Only 20.1 percent of respondents (pre-posting in Seattle) guessed the calories of their purchased beverage to within plus or minus 50.
Although not shown in the figure, for purchased food, the average error of respon-dents in Seattle (San Francisco) in December was an underestimate of 20.2 (61.6) calories. And 76.2 percent (76.9 percent) of respondents in Seattle (San Francisco) underestimate their purchased food calories. We also tested consumers’ knowledge of the calories in some popular food and drink items sold at Starbucks. Respondents overestimated the calories in a grande latte similarly to their overestimating of their purchased beverages. Respondents underestimated the calories in a blueberry muf-fin by 68.3 calories, on average. As a reality check on the survey data, we also find that individuals who highly rate the importance of calories (one of the survey ques-tions) do in fact tend to be significantly more accurate in their calorie estimates than those who rate calories as unimportant. Overall, the survey responses do not sup-port any notion that consumers were generally well-informed about calories prior to calorie-posting.
Recall that we find calorie posting has no major effect on beverage choices, but significantly affects food choices. The above survey results reinforce the point that expectations are important. Because consumers tend to overestimate calories in bev-erages, calorie posting does not discourage people from purchasing their desired beverages. (On average, the information comes as a pleasant surprise.) In contrast, consumers tend to underestimate food calories, so the correction due to calorie post-ing leads them to reduce their food purchases.
A second point to take from the top panel of Figure 5 is that people became some-what more accurate in their knowledge of calories after calorie posting in Seattle. The average absolute error in respondents’ predictions in the figure for Seattle falls from 136.4 to 102.4. But the third point to take from Figure 5 is that accuracy also improved in San Francisco, where the average absolute error fell from 141.9 to 124.2. Moreover, while the accuracy improvements in Seattle were by some mea-sures larger than those in San Francisco, the differences are not statistically sig-nificant. Thus, while it appears that consumers were more informed about calories after posting, we cannot attribute this change to the posting itself. It is possible that we inadvertantly sampled a more informed mix of consumers in the second survey wave. Alternatively, interest in calories could be heightened in January because of new year resolutions to be healthier. In fact there is a dramatic increase in internet search activity for the term “calories” on January 1 every year.50
In addition to testing calorie knowledge, the survey also evaluated people’s atti-tudes toward calories. Did calorie posting in Seattle make people care more about calories? To avoid any bias, the survey was designed so that neither calories nor nutrition was mentioned on the first page, and surveyors were instructed not to
49 The results are qualitatively unchanged if we exclude all purchases of beverages with less than 10 calories (such as brewed coffee and tea), for which it is impossible to underestimate by more than a few calories.
50 http://www.google.com/trends?q=calories.
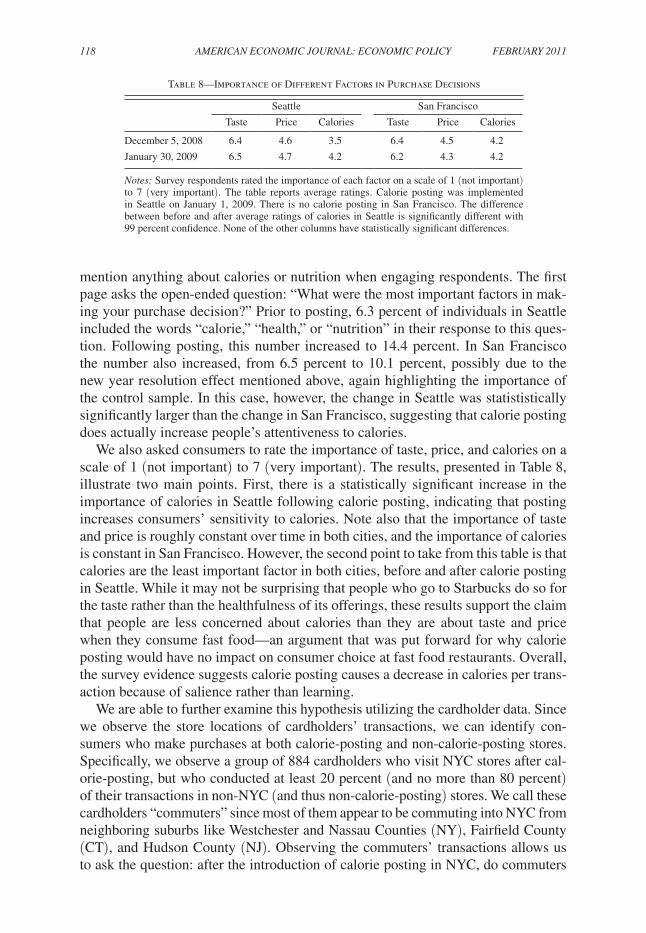
118 AmEricAn Economic JournAL: Economic PoLicy FEBruAry 2011
mention anything about calories or nutrition when engaging respondents. The first page asks the open-ended question: “What were the most important factors in mak-ing your purchase decision?” Prior to posting, 6.3 percent of individuals in Seattle included the words “calorie,” “health,” or “nutrition” in their response to this ques-tion. Following posting, this number increased to 14.4 percent. In San Francisco the number also increased, from 6.5 percent to 10.1 percent, possibly due to the new year resolution effect mentioned above, again highlighting the importance of the control sample. In this case, however, the change in Seattle was statististically significantly larger than the change in San Francisco, suggesting that calorie posting does actually increase people’s attentiveness to calories.
We also asked consumers to rate the importance of taste, price, and calories on a scale of 1 (not important) to 7 (very important). The results, presented in Table 8, illustrate two main points. First, there is a statistically significant increase in the importance of calories in Seattle following calorie posting, indicating that posting increases consumers’ sensitivity to calories. Note also that the importance of taste and price is roughly constant over time in both cities, and the importance of calories is constant in San Francisco. However, the second point to take from this table is that calories are the least important factor in both cities, before and after calorie posting in Seattle. While it may not be surprising that people who go to Starbucks do so for the taste rather than the healthfulness of its offerings, these results support the claim that people are less concerned about calories than they are about taste and price when they consume fast food—an argument that was put forward for why calorie posting would have no impact on consumer choice at fast food restaurants. Overall, the survey evidence suggests calorie posting causes a decrease in calories per trans-action because of salience rather than learning.
We are able to further examine this hypothesis utilizing the cardholder data. Since we observe the store locations of cardholders’ transactions, we can identify con-sumers who make purchases at both calorie-posting and non-calorie-posting stores. Specifically, we observe a group of 884 cardholders who visit NYC stores after cal-orie-posting, but who conducted at least 20 percent (and no more than 80 percent) of their transactions in non-NYC (and thus non-calorie-posting) stores. We call these cardholders “commuters” since most of them appear to be commuting into NYC from neighboring suburbs like Westchester and Nassau Counties (NY), Fairfield County (CT), and Hudson County (NJ). Observing the commuters’ transactions allows us to ask the question: after the introduction of calorie posting in NYC, do commuters
Table 8—Importance of Different Factors in Purchase Decisions
Seattle San Francisco
Taste Price Calories Taste Price Calories
December 5, 2008 6.4 4.6 3.5 6.4 4.5 4.2
January 30, 2009 6.5 4.7 4.2 6.2 4.3 4.2
notes: Survey respondents rated the importance of each factor on a scale of 1 (not important) to 7 (very important). The table reports average ratings. Calorie posting was implemented in Seattle on January 1, 2009. There is no calorie posting in San Francisco. The difference between before and after average ratings of calories in Seattle is significantly different with 99 percent confidence. None of the other columns have statistically significant differences.
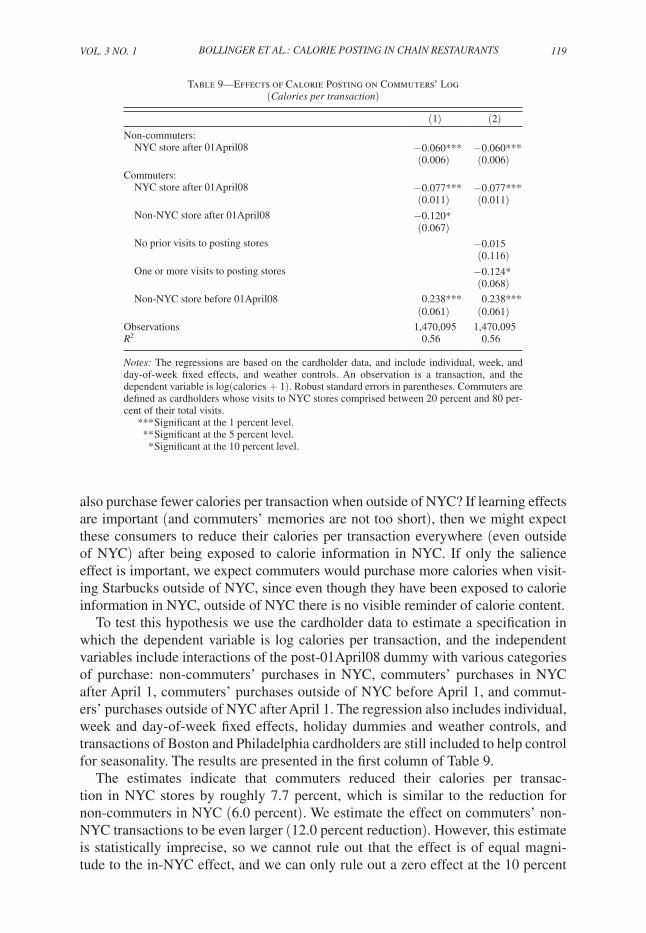
VoL. 3 no. 1 119BoLLingEr ET AL.: cALoriE PoSTing in chAin rESTAurAnTS
also purchase fewer calories per transaction when outside of NYC? If learning effects are important (and commuters’ memories are not too short), then we might expect these consumers to reduce their calories per transaction everywhere (even outside of NYC) after being exposed to calorie information in NYC. If only the salience effect is important, we expect commuters would purchase more calories when visit-ing Starbucks outside of NYC, since even though they have been exposed to calorie information in NYC, outside of NYC there is no visible reminder of calorie content.
To test this hypothesis we use the cardholder data to estimate a specification in which the dependent variable is log calories per transaction, and the independent variables include interactions of the post-01April08 dummy with various categories of purchase: non-commuters’ purchases in NYC, commuters’ purchases in NYC after April 1, commuters’ purchases outside of NYC before April 1, and commut-ers’ purchases outside of NYC after April 1. The regression also includes individual, week and day-of-week fixed effects, holiday dummies and weather controls, and transactions of Boston and Philadelphia cardholders are still included to help control for seasonality. The results are presented in the first column of Table 9.
The estimates indicate that commuters reduced their calories per transac-tion in NYC stores by roughly 7.7 percent, which is similar to the reduction for non-commuters in NYC (6.0 percent). We estimate the effect on commuters’ non-NYC transactions to be even larger (12.0 percent reduction). However, this estimate is statistically imprecise, so we cannot rule out that the effect is of equal magni-tude to the in-NYC effect, and we can only rule out a zero effect at the 10 percent
Table 9—Effects of Calorie Posting on Commuters’ Log (calories per transaction)
(1) (2)Non-commuters: NYC store after 01April08 −0.060*** −0.060***
(0.006) (0.006)Commuters: NYC store after 01April08 −0.077*** −0.077***
(0.011) (0.011) Non-NYC store after 01April08 −0.120*
(0.067) No prior visits to posting stores −0.015
(0.116) One or more visits to posting stores −0.124*
(0.068) Non-NYC store before 01April08 0.238*** 0.238***
(0.061) (0.061)Observations 1,470,095 1,470,095 r 2 0.56 0.56
notes: The regressions are based on the cardholder data, and include individual, week, and day-of-week fixed effects, and weather controls. An observation is a transaction, and the dependent variable is log(calories + 1). Robust standard errors in parentheses. Commuters are defined as cardholders whose visits to NYC stores comprised between 20 percent and 80 per-cent of their total visits.
*** Significant at the 1 percent level. ** Significant at the 5 percent level. * Significant at the 10 percent level.
120 AmEricAn Economic JournAL: Economic PoLicy FEBruAry 2011
significance level. The second column of estimates in Table 9 reports a regression in which commuters’ post-April, non-NYC transactions, are separated into two categories: those for which the individual had versus had not previously visited a calorie-posting store in NYC. If the primary explanation for the observed effects is learning, we would not expect any change in non-NYC transactions until after the individual has been exposed to calorie information in NYC. The point estimates are consistent with this story. Calorie reductions appear to occur at non-NYC stores only if the cardholder has made prior visits to calorie-posting stores in NYC.
The survey evidence and the analysis of commuters’ purchase patterns pro-vide mixed evidence concerning the role of learning and salience in explaining the observed effects of calorie posting. On the one hand, the survey results show that consumers knowledge of calories did not significantly improve because of posting, but consumers do report greater sensitivity to calories when making purchase deci-sions. These findings support the role of salience. On the other hand, the commuters also reduce their calories per transaction even when purchasing in locations that do not post calorie information, and indeed do so only after visiting a store that does post calories. These results support the role of learning. Hence, we find evidence in support of both learning and salience as part of the mechanism for why calorie post-ing causes consumers to reduce calories per transaction.
B. is the Effect Big Enough to matter?
Could a 6 percent decrease in average calories per transaction at Starbucks con-ceivably translate into a non-trivial reduction in obesity? We can attempt a very crude calculation to shed light on this question. Based on food intake surveys conducted by the US Department of Agriculture, along with census data regarding food expendi-tures at full-service restaurants, a reasonable estimate is that 25 percent of the aver-age Americans’ calorie consumption comes from chain restaurants.51 If we further assume that calorie consumption were reduced by 6 percent at all chain restaurants, and that this reduction is not offset by increases at other meals, then it would imply a decrease in total calorie consumption on the order of 1.5 percent. If average daily intake is around 2,000 calories, the implied calorie reduction is 30 calories per day.52
While a decrease of 30 calories per day seems small, the accumulated reduction over time is seemingly large (over 10,000 calories per year). However, the relationship between calorie reduction and weight loss is complicated because of physiological compensations that occur (such as changes in metabolism). Based on studies pub-lished in the medical literature (for example, Leanne M. Redman et al. 2009), we
51 It is actually rather challenging to find a direct estimate of the fraction of calories that come from chain res-taurants (or restaurants in general, for that matter). As best we can tell, the United States Department of Agriculture (USDA) food intake surveys were last conducted in the mid-1990s, at which point they estimated that 32 percent of the average person’s calories were consumed away from home. The same fraction was estimated to be 18 per-cent in the late 1970s. Given the trend, it seems likely that the fraction is even higher today (see Hayden Stewart, Noel Blisard, and Dean Jolliffe 2006 for a discussion). Separate surveys from 2004 indicate that chain restaurants account for between 50 and 75 percent of meals away from home (The Keystone Center 2006).
52 The USDA runs a survey of nutrient intake, and in the period 2005–2006 they report the average caloric intake of males and females aged two and over was 2,157. Males aged 30–39 consume the most calories, with an average intake of 2,978 calories.
VoL. 3 no. 1 121BoLLingEr ET AL.: cALoriE PoSTing in chAin rESTAurAnTS
could expect a permanent 1.5 percent reduction in caloric intake to decrease long-run body weight by no more than 1 percent. Martijn B. Katan and David S. Ludwig (2010) also argue that small permanent reductions in caloric intake are particularly futile in combating obesity. No wonder common weight loss programs recommend reductions of 500 to 1,000 calories per day, which are said to translate into weight loss of around one to two pounds per week. Hence, our back-of-the-envelope calculation suggests that average reductions resulting from calorie posting in chain restaurants will not by themselves have a major impact on obesity.
However, there are several reasons why this exercise may understate the poten-tial impact of calorie posting on obesity. First, looking at average effects could be misleading in the context of obesity. We showed above that the nintieth percentile of the distribution of calories per transaction is also lowered by around 5 to 6 percent because of calorie posting, and for individuals who averaged more than 250 calories per transaction, there is a 26 percent decrease in calories per transaction. Moreover, it is plausible these customers consume significantly more than 2,000 calories per day, leading to a much bigger reduction than 30 calories per day.
A second reason why the above calculation may understate the impact on obesity is that the effects we estimate for Starbucks may understate the impact at other chain restaurants (Dunkin Donuts being one likely example). Indeed, we find that consumer choices with respect to food are more sensitive to calorie posting (14 percent decrease in calories per transaction) than their choices with respect to beverages. This may be specific to Starbucks. Alternatively, it suggests the impact of calorie posting on calories per transaction at other chains may be significantly higher than at Starbucks.
Third, the long-run impact of calorie posting may be even greater if restaurants respond by offering more low-calorie items. If chains were to offer tasty, low-price, low-calorie options, then calorie posting may be significantly more impactful. Conceivably, by raising awareness of healthy eating, calorie posting may indeed cause chains to move in this direction. Of course, all three of these reasons are speculative, and indeed the true effect may be even smaller than our back-of-the-envelope calculation suggests (e.g., consumers may offset their calorie reductions at Starbucks by increasing their intake from other sources).53
C. Does mandatory calorie Posting cause restaurants to offer Low-calorie options?
Given our finding that consumers are responsive to calorie posting, restaurants have an economic incentive to offer low calorie options. Although the profitabil-ity of doing so also depends on the costs of such items, it is conceivable that the most meaningful effect of the calorie posting law will be its long-run impact on the products restaurants choose to offer.54 It would not be the first time that increas-ing the provision of information to consumers caused a supply-side response from
53 In fact Anderson and Matsa (2008) find evidence in support of this kind of offsetting behavior.54 In addition to adding low-calorie items from among the set of low-calorie products that are currently avail-
able, the supply-side response to calorie posting includes innovation to develop new tastier and/or lower cost low-calorie products.
122 AmEricAn Economic JournAL: Economic PoLicy FEBruAry 2011
restaurants—Ginger Zhe Jin and Phillip Leslie (2003) show that mandatory restau-rant hygiene grade cards cause restaurants to improve hygiene quality. Moreover, calorie posting may be much more effective at reducing obesity if it leads to consum-ers being presented with a wider range of tasty low-calorie drink and food choices.
There are a few challenges to assessing the effect of calorie posting on menu offerings by chain restaurants. First, we expect there is a pre-existing trend toward offering low-calorie options. For example, McDonalds introduced salad offerings in 2007, before calorie posting commenced. Second, changes in product offerings at chain restaurants tend to be implemented over broader geographies, if not nation-wide.55 Hence, even if chains face different disclosure regimes in different cities, researchers are unlikely to observe variation in menu offerings across cities. Third, while the consumer response to posting is rapid, we expect menu changes to take much longer. Chain restaurants have optimized their organizational designs around their product offerings, which are hard to change—especially given their large scale relative to stand-alone restaurants. Adding new products is a major organizational change for these firms, so even if the introduction of a new product was in fact driven by something like a calorie-posting law, the new product may not actually appear in the stores until many months after the law’s implementation. Detecting such gradual changes and isolating their causes is obviously a challenging task for empiricists.
Nevertheless, to provide some indication of whether calorie posting has caused restaurants to offer more low-calorie options, we did a phone survey of 33 restaurant managers in NYC.56 We wanted to include restaurants that are posting the calorie information on their menus and restaurants that are not. To help make these two groups of restaurants comparable, we targeted chains that have between 10 and 20 units nationwide, since chains with fewer than 15 units are not required to post. Managers were asked six questions, including: “Do you currently display calorie information on your menu?” “In approximately the last six months (since posting began, if applicable), have you added any low-calorie options to your menu?” “In a typical year, how many times do you add or remove items from your menu?” Among restaurants that reported changing menus at least once per year, but no more than once per week, we find that the probability of introducing a low-calorie option conditional on posting is 0.71, and conditional on not posting is 0.45. Hence, the survey provides a preliminary indication that posting may stimulate some restau-rants to introduce low-calorie items.
Lastly, it is noteworthy that in January 2010, after the period of our dataset, Starbucks did in fact introduce a variety of low-calorie beverage and food items to menus nationwide. Whether Starbucks would have done so in the absence of manda-tory calorie posting (in NYC or elsewhere) is an open question.
55 Examples of chains introducing low-calorie products nationwide in 2008 include Vivanno beverages at Starbucks, low-calorie egg-white breakfast sandwiches at Dunkin Donuts, and the reduction in calories of McDonald’s large french fries from 570 to 500 calories.
56 We also attempted to obtain menus from before and after the posting requirement, but only obtained a handful.
VoL. 3 no. 1 123BoLLingEr ET AL.: cALoriE PoSTing in chAin rESTAurAnTS
D. Why is government intervention required?
An important question in relation to any form of mandatory disclosure is why do we need government intervention? If consumers value the information (in this case caloric content), then profit-seeking firms may voluntarily provide it—there are market-driven incentives for information revelation.57 In the present context, it is important to understand why restaurants, and chain restaurants in particular, are not voluntarily putting calories on menus.58 Apparently the market incentives are not sufficiently powerful, and understanding why is important in order to assess the need for government intervention.
Perhaps the costs of acquiring calorie information and changing menus exceed the (private) benefits. Most chains, and especially the larger ones, already know the calorie content of their meals and make this information available via websites and brochures. The cost of changing menu boards is around $1,000 to $2,000 per store, which is small in comparison to store revenues (in the Starbucks data at least) and is a one-time cost. Hence, this seems an unlikely explanation. A second possible reason is the absence of a nutrition standard. Caloric content is not the only measure of nutrition. In the absence of a standard, it is conceivable that one chain would post total calories and another would post calories from fat, say. Each restaurant would favor the measure that puts their meals in the best light, and consumers would real-ize this and pay less attention. Viewed in this way, one of the most powerful aspects of the NYC calorie posting law may be that it sets a standard and removes restau-rants’ discretion over what information to provide.
V. Conclusion
Nutrition labeling on packaged food has been mandatory in the United States since the early 1990s, and has become an accepted practice—it is hard to imagine there would be much support for removing these labels at this stage. But the frac-tion of calories consumed in restaurants has been trending upward, and mandatory posting of calories on restaurant menus is a new policy that extends nutrition label-ing beyond packaged food for the first time.59 Many jurisdictions are following the lead of NYC, and the federal government has passed legislation to expand the policy nationwide (yet implemented at the time of writing). However, since nutritional information is already generally available to interested consumers, it is not obvious that such laws would have a meaningful impact on their behavior. In this study we examine comprehensive transaction data from Starbucks to determine whether calo-rie posting has the desired effect. With annual revenues around $10 billion, the sheer size of Starbucks makes it an important testing ground.
57 See Sanford J. Grossman (1981) and Paul Milgrom (1981). Reputations may be another market-based solu-tion for the absence of information (see, for example, Jin and Leslie 2009). In this case, restaurants may obtain a reputation for providing nutritious/healthy meals. See David Dranove and Jin (forthcoming) for a survey of the disclosure literature.
58 The same was true of nutrition labeling of packaged foods before it became mandatory in the 1990s. See Ippolito and Janis K. Pappalardo (2002) and Eliza M. Mojduszka and Julie A. Caswell (2000).
59 Biing-Hwan Lin, Elizabeth Frazão, and Joanne Guthrie (1999) examine the trend in eating away from home.
124 AmEricAn Economic JournAL: Economic PoLicy FEBruAry 2011
We find that mandatory calorie posting causes average calories per transaction to fall by 6 percent at Starbucks. The effect is long lasting. The effect is almost entirely related to changes in consumers’ food choices—there is almost no change in purchases of beverage calories (Starbucks’ core business). The effect is larger for high-calorie consumers. Learning appears to play an important role in explaining consumers’ responses. Our surveys show that consumers tend to be quite ignorant about calories, and the purchase data show that consumers exposed to calorie infor-mation in NYC stores reduce their calorie consumption even at noncalorie-posting stores. Survey respondents reported an increase in sensitivity to calories, suggesting that salience also plays a role. The impact on Starbucks’ profit is negligible, on aver-age, and for the subset of stores located close to their competitor Dunkin Donuts, the impact of calorie posting is actually to increase Starbucks revenue. To reiterate, these findings relate to a policy change in which all chain restaurants are required to post calories on menus. The effects of voluntary posting by an individual chain would likely be very different.
Ultimately, mandatory calorie posting is only a good policy if the benefits out-weigh the costs. Based on our back-of-the-envelope calculation in Section IVB, the direct effect of calorie posting on obesity may be small. Calorie reductions on the order of 6 percent at chain restaurants would yield only modest decreases in body weight, even if those reductions were not offset by increased caloric intake at other meals. However, as far as regulatory policies go, the costs of calorie posting are very low—so even these small benefits could outweigh the costs. Moreover, the long-run effects of calorie posting are potentially more dramatic. At the margin, calorie posting should encourage restaurants to innovate and offer low-calorie items. We document some preliminary evidence that this is happening in NYC. Also, there may be public education benefits from the policy; consumers’ exposure to calorie information may make them generally more aware and attentive to the nutritional value of the foods they eat.
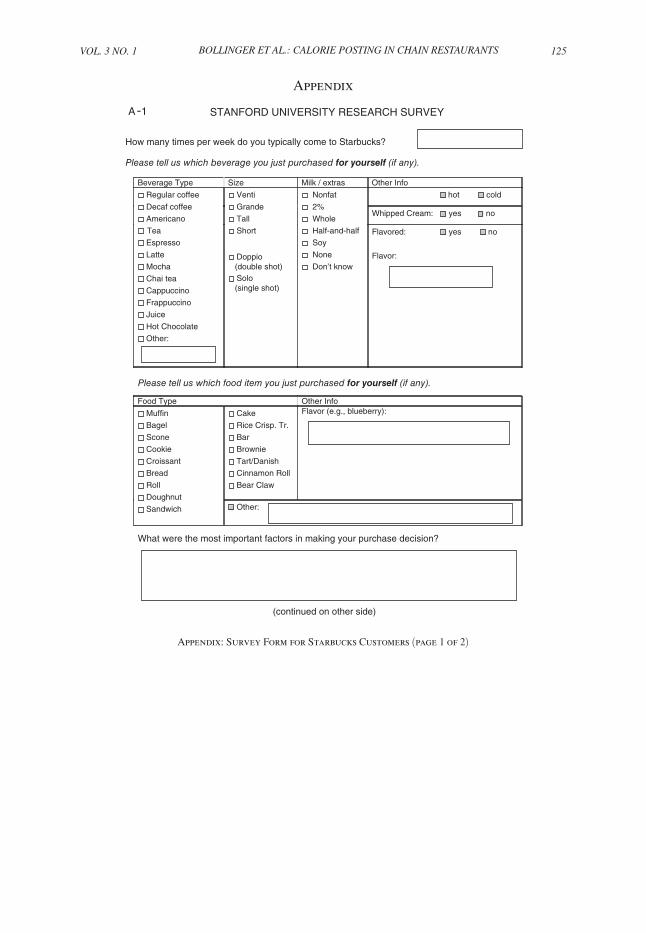
VoL. 3 no. 1 125BoLLingEr ET AL.: cALoriE PoSTing in chAin rESTAurAnTS
Appendix
Appendix: Survey Form for Starbucks Customers (page 1 of 2)
A 1 STANFORD UNIVERSITY RESEARCH SURVEY
(continued on other side)
How many times per week do you typically come to Starbucks?
Please tell us which beverage you just purchased for yourself (if any).
Please tell us which food item you just purchased for yourself (if any).
Beverage Type Size Milk / extras Other Info
Regular coffee
Decaf coffee
Americano
Tea
Espresso
Latte
Mocha
Chai tea
Cappuccino
Frappuccino
Juice
Hot Chocolate
Other:
Venti
Grande
Tall
Short
Doppio (double shot)
Solo (single shot)
Nonfat
2%
Whole
Half-and-half
Soy
None
Don’t know
hot cold
Whipped Cream: yes no
Flavored: yes no
Flavor:
ofnI rehtO epyT dooF
Muffin
Bagel
Scone
Cookie
Croissant
Bread
Roll
Doughnut
Sandwich
Cake
Rice Crisp. Tr.
Bar
Brownie
Tart/Danish
Cinnamon Roll
Bear Claw
Flavor (e.g., blueberry):
Other:
What were the most important factors in making your purchase decision?
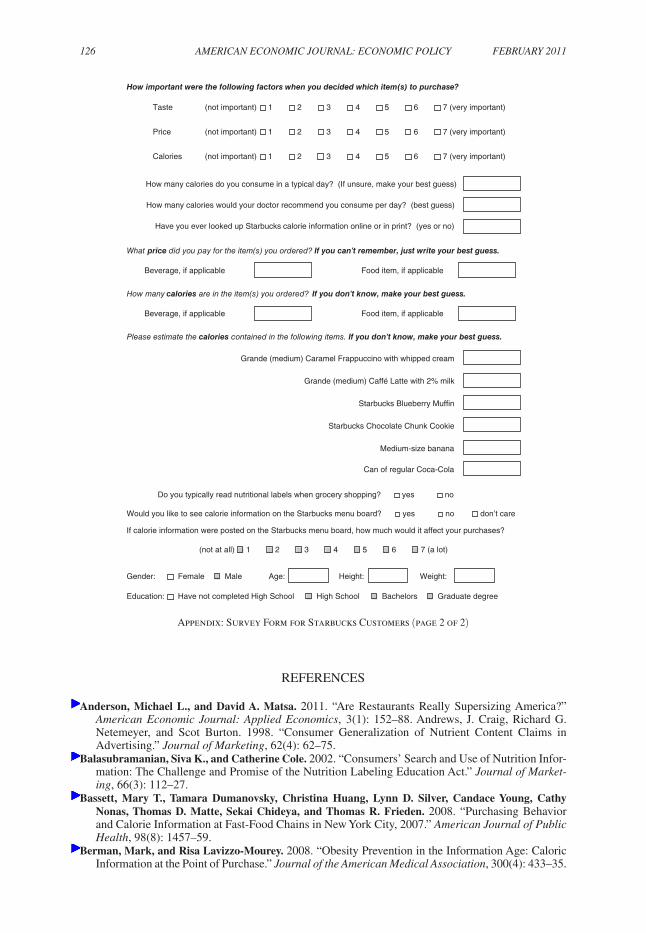
126 AmEricAn Economic JournAL: Economic PoLicy FEBruAry 2011
REFERENCES
Anderson, Michael L., and David A. Matsa. 2011. “Are Restaurants Really Supersizing America?” American Economic Journal: Applied Economics, 3(1): 152–88. Andrews, J. Craig, Richard G. Netemeyer, and Scot Burton. 1998. “Consumer Generalization of Nutrient Content Claims in Advertising.” Journal of marketing, 62(4): 62–75.
Balasubramanian, Siva K., and Catherine Cole. 2002. “Consumers’ Search and Use of Nutrition Infor-mation: The Challenge and Promise of the Nutrition Labeling Education Act.” Journal of market-ing, 66(3): 112–27.
Bassett, Mary T., Tamara Dumanovsky, Christina Huang, Lynn D. Silver, Candace Young, Cathy Nonas, Thomas D. Matte, Sekai Chideya, and Thomas R. Frieden. 2008. “Purchasing Behavior and Calorie Information at Fast-Food Chains in New York City, 2007.” American Journal of Public health, 98(8): 1457–59.
Berman, Mark, and Risa Lavizzo-Mourey. 2008. “Obesity Prevention in the Information Age: Caloric Information at the Point of Purchase.” Journal of the American medical Association, 300(4): 433–35.
Appendix: Survey Form for Starbucks Customers (page 2 of 2)
How many calories do you consume in a typical day? (If unsure, make your best guess)
How many calories would your doctor recommend you consume per day? (best guess)
Have you ever looked up Starbucks calorie information online or in print? (yes or no)
What price did you pay for the item(s) you ordered? If you can’t remember, just write your best guess.
Beverage, if applicable Food item, if applicable
How many calories are in the item(s) you ordered? If you don’t know, make your best guess.
Beverage, if applicable Food item, if applicable
Please estimate the calories contained in the following items. If you don’t know, make your best guess.
Grande (medium) Caramel Frappuccino with whipped cream
Grande (medium) Caffé Latte with 2% milk
Starbucks Blueberry Muffin
Starbucks Chocolate Chunk Cookie
Medium-size banana
Can of regular Coca-Cola
Do you typically read nutritional labels when grocery shopping? yes no
Would you like to see calorie information on the Starbucks menu board? yes no don’t care
If calorie information were posted on the Starbucks menu board, how much would it affect your purchases?
(not at all) 1 2 3 44 55 6 7 (a lot)
Gender: Female Male Age: Height: Weight:
Education: Have not completed High School High School Bachelors Graduate degree
How important were the following factors when you decided which item(s) to purchase?
Taste (not important) 1 2 3 44 55 6 7 (very important)
Price (not important) 1 2 3 44 55 6 7 (very important)
Calories (not important) 1 2 3 44 55 6 7 (very important)
VoL. 3 no. 1 127BoLLingEr ET AL.: cALoriE PoSTing in chAin rESTAurAnTS
Bhattacharya, Jay. 2008. “Who Pays for Obesity?” nBEr reporter: research Summary, 2008(3).Bleich, Sara N., David Cutler, Christopher Murray, and Alyce Adams. 2008. “Why Is the Developed
World Obese?” Annual review of Public health, 29(4): 273–95.Cai, Hongbin, Yuyu Chen, and Hanming Fang. 2009. “Observational Learning: Evidence from a Ran-
domized Natural Field Experiment.” American Economic review, 99(3): 864–82.Chetty, Raj, Adam Looney, and Kory Kroft. 2009. “Salience and Taxation: Theory and Evidence.”
American Economic review, 99(4): 1145–77.Chou, Shin-Yi, Inas Rashad, and Michael Grossman. 2008. “Fast-Food Restaurant Advertising on
Television and Its Influence on Childhood Obesity.” Journal of Law and Economics, 51(4): 599–618.
Colby, Sarah Elizabeth, Kimberly Heidal, Chad Johnson, Taft Stallings, and Kevin Gross. 2009. “Influence of Differing Types and Formats of Menu Labeling.” FASEB Journal, 23(S): S336.6.
Cowburn, Gill, and Lynn Stockley. 2005. “Consumer Understanding and Use of Nutrition Labelling: A Systematic Review.” Public health nutrition, 8(1): 21–28.
Currie, Janet, Stefano DellaVigna, Enrico Moretti, and Vikram Pathania. 2010. “The Effect of Fast Food Restaurants on Obesity and Weight Gain.” American Economic Journal: Economic Policy, 2(3): 32–63.
DellaVigna, Stefano. 2009. “Psychology and Economics: Evidence from the Field.” Journal of Eco-nomic Literature, 47(2): 315–72.
Downs, Julie S., George Loewenstein, and Jessica Wisdom. 2009. “Strategies for Promoting Healthier Food Choices.” American Economic review, 99(2): 159–64.
Dranove, David, and Ginger Zhe Jin. Forthcoming. “Quality Disclosure and Certification: Theory and Practice.” Journal of Economic Literature.
Elbel, Brian, Rogan Kersh, Victoria L. Brescoll, and L. Beth Dixon. 2009. “Calorie Labeling and Food Choices: A First Look at the Effects on Low-Income People in New York City.” health Affairs, 28(6): w1110–21.
Farley, Thomas A., Anna Caffarelli, Mary T. Bassett, Lynn Silver, and Thomas R. Frieden. 2009. “New York City’s Fight over Calorie Labeling.” health Affairs, 28(6): w1098–1109.
Finkelstein, Amy. 2009. “E-ZTax: Tax Salience and Tax Rates.” Quarterly Journal of Economics, 124(3): 969–1010.
Gerend, Mary A. 2009. “Does Calorie Information Promote Lower Calorie Fast Food Choices among College Students?” Journal of Adolescent health, 44(1): 84–86.
Grossman, Sanford J. 1981. “The Informational Role of Warranties and Private Disclosure about Prod-uct Quality.” Journal of Law and Economics, 24(3): 461–83.
Grunert, Klaus G., and Josephine M. Wills. 2007. “A Review of European Research on Consumer Response to Nutrition Information on Food Labels.” Journal of Public health, 15(5): 385–99.
Ippolito, Pauline M, and Alan D. Mathios. 1990. “Information, Advertising and Health Choices: A Study of the Cereal Market.” rAnD Journal of Economics, 21(3): 459–80.
Ippolito, Pauline M., and Alan D. Mathios. 1995. “Information and Advertising: The Case of Fat Con-sumption in the United States.” American Economic review, 85(2): 91–95.
Ippolito, Pauline M., and Janis K. Pappalardo. 2002. “Advertising, Nutrition, and Health: Evidence from Food Advertising 1977–1997.” Federal Trade Commission Bureau of Economics Staff Report. http://www.ftc.gov/be/healthcare/wp/20_Ippolito_AdvertisingNutrition&Health.pdf.
Jacoby, Jacob. 1974. “Consumer Reaction to Information Displays: Packaging and Advertising.” In Advertising and the Public interest, ed. Sal Divita, 101–18. Chicago: American Marketing Asso-ciation.
Jacoby, Jacob, Robert W. Chestnut, and William Silberman. 1977. “Consumer Use and Comprehen-sion of Nutrition Information.” Journal of consumer research, 4(2): 119–28.
Jin, Ginger Zhe, and Phillip Leslie. 2003. “The Effect of Information on Product Quality: Evidence from Restaurant Hygiene Grade Cards.” Quarterly Journal of Economics, 118(2): 409–51.
Jin, Ginger Zhe, and Phillip Leslie. 2009. “Reputational Incentives for Restaurant Hygiene.” American Economic Journal: microeconomics, 1(1): 237–67.
Katan, Martijn B., and David S. Ludwig. 2010. “Extra Calories Cause Weight Gain—But How Much?” Journal of the American medical Association, 303(1): 65–66.
Kiesel, Kristin, and Sofia B. Villas-Boas. 2008. “Another Nutritional Label: Experimenting with Gro-cery Store Shelf Labels and Consumer Choice.” University of California at Berkeley Department of Agricultural and Resource Economics and Policy (CUDARE) Working Paper 1060.
Lin, Biing-Hwan, Elizabeth Frazão, and Joanne Guthrie. 1999. “Away-from-Home Foods Increas-ingly Important to Quality of American Diet.” Agriculture Information Bulletin 749. http://www.ers.usda.gov/publications/aib749/aib749.pdf.
128 AmEricAn Economic JournAL: Economic PoLicy FEBruAry 2011
Mathios, Alan D. 2000. “The Impact of Mandatory Disclosure Laws on Product Choices: An Analysis of the Salad Dressing Market.” Journal of Law and Economics, 43(2): 651–77.
McGeary, Kerry Anne. 2009. “The Impact of State-Level Nutrition-Education Program Funding on BMI: Evidence from the Behavioral Risk Factor Surveillance System.” National Bureau of Eco-nomic Research Working Paper 15001.
Mello, Michelle M., David M. Studdert, and Troyen A. Brennan. 2006. “Obesity—The New Frontier of Public Health Law.” new England Journal of medicine, 354(24): 2601–10.
Milgrom, Paul R. 1981. “Good News and Bad News: Representation Theorems and Applications.” Bell Journal of Economics, 12(2): 380–91
Mojduszka, Eliza M., and Julie A. Caswell. 2000. “A Test of Nutritional Quality Signaling in Food Markets Prior to Implementation of Mandatory Labeling.” American Journal of Agricultural Eco-nomics, 82(2): 298–309.
Muller, Thomas E. 1985. “Structural Information Factors Which Stimulate the Use of Nutrition Infor-mation: A Field Experiment.” Journal of marketing research, 22(2): 143–57.
Organisation for Economic Co-operation and Development (OECD). 2009. oEcD Factbook 2009, 250–51. Paris, France: OECD.
Philipson, Tomas J., and Richard A. Posner. 2008. “Is the Obesity Epidemic a Public Health Problem? A Review of Zoltan J. Acs and Alan Lyles’s obesity, Business and Public Policy.” Journal of Eco-nomic Literature, 46(4): 974–82.
Phillips, Carl V., and Richard Zeckhauser. 1996. “Communicating the Health Effects of Consumer Products: The Case of Moderate Alcohol Consumption and Coronary Heart Disease.” managerial and Decision Economics, 17(5): 459–70.
Redman, Leanne M., Leonie K. Heilbronn, Corby K. Martin, Lilian de Jonge, Donald A. Williamson, James P. Delany, and Eric Ravussin. 2009. “Metabolic and Behavioral Compensations in Response to Caloric Restriction: Implications for the Maintenance of Weight Loss.” PLoS onE, 4(2): e4377.
Roberto, Christina A., Henry Agnew, and Kelly D. Brownell. 2009. “An Observational Study of Con-sumers’ Accessing of Nutrition Information in Chain Restaurants.” American Journal of Public health, 99(5): 820–21.
Russo, J. Edward, Richard Staelin, Catherine A. Nolan, Gary J. Russell, and Barbara L. Metcalf. 1986. “Nutrition Information in the Supermarket.” Journal of consumer research, 48–70.
Scharff, Robert L. 2008. “Obesity Suits: Fat Chance or Fat City?” Unpublished.Stewart, Hayden, Noel Blisard, and Dean Jolliffe. 2006. “Let’s Eat Out: Americans Weigh Taste, Con-
venience, and Nutrition.” United States Department of Agriculture Economic Information Bulletin 19. http://www.ers.usda.gov/publications/eib19/eib19.pdf.
The Keystone Center. 2006. The Keystone Forum on Away-from-home Foods: opportunities for Pre-venting Weight gain and obesity—Final report. Washington, DC: The Keystone Center.
Variyam, Jayachandran N., and John Cawley. 2006. “Nutrition Labels and Obesity.” National Bureau of Economic Research Working Paper 11956.
Wisdom, Jessica, Julie S. Downs, and George Loewenstein. 2010. “Promoting Healthy Choices: Infor-mation versus Convenience.” American Economic Journal: Applied Economics, 2(2): 164–78.
This article has been cited by:
1. Daria S. Ebneter, Janet D. Latner, Claudio R. Nigg. 2013. Is less always more? The effects oflow-fat labeling and caloric information on food intake, calorie estimates, taste preference, andhealth attributions. Appetite 68, 92-97. [CrossRef]
2. Fabian Grabenhorst, Frank P. Schulte, Stefan Maderwald, Matthias Brand. 2013. Food labelspromote healthy choices by a decision bias in the amygdala. NeuroImage 74, 152-163. [CrossRef]
3. James W. Krieger, Nadine L. Chan, Brian E. Saelens, Myduc L. Ta, David Solet, David W.Fleming. 2013. Menu Labeling Regulations and Calories Purchased at Chain Restaurants.American Journal of Preventive Medicine 44:6, 595-604. [CrossRef]
4. Anil R. Doshi, Glen W. S. Dowell, Michael W. Toffel. 2013. How firms respond to mandatoryinformation disclosure. Strategic Management Journal n/a-n/a. [CrossRef]
5. Ellen Peters, William Klein, Annette Kaufman, Louise Meilleur, Anna Dixon. 2013. More Is NotAlways Better: Intuitions About Effective Public Policy Can Lead to Unintended Consequences.Social Issues and Policy Review 7:1, 114-148. [CrossRef]
6. L. J. Unnevehr. 2013. Food and Health: Can Economics Contribute to Improved Outcomes?.American Journal of Agricultural Economics 95:2, 220-227. [CrossRef]
7. Peggy J. Liu, Christina A. Roberto, Linda J. Liu, Kelly D. Brownell. 2012. A test of differentmenu labeling presentations. Appetite 59:3, 770-777. [CrossRef]
8. Ryan D. Edwards. 2012. Population aging, the dependency burden, and challenges facingpreventive medicine. Preventive Medicine 55:6, 533-534. [CrossRef]
9. Mitesh S. Patel, Kevin G. Volpp. 2012. Leveraging Insights from Behavioral Economics toIncrease the Value of Health-Care Service Provision. Journal of General Internal Medicine 27:11,1544-1547. [CrossRef]
10. P. Chandon. 2012. How Package Design and Packaged-based Marketing Claims Lead toOvereating. Applied Economic Perspectives and Policy . [CrossRef]
11. Ryan D. Edwards. 2012. Sugar-sweetened beverage taxes raise demand for substitutes and couldeven raise caloric intake. Preventive Medicine 54:3-4, 284-285. [CrossRef]
12. Hunt Allcott,, Michael Greenstone. 2012. Is There an Energy Efficiency Gap?. Journal ofEconomic Perspectives 26:1, 3-28. [Abstract] [View PDF article] [PDF with links]
13. J. Roosen, S. Marette. 2011. Making the 'right' choice based on experiments: regulatory decisionsfor food and health. European Review of Agricultural Economics . [CrossRef]
14. Hunt Allcott. 2011. Consumers' Perceptions and Misperceptions of Energy Costs. AmericanEconomic Review 101:3, 98-104. [Abstract] [View PDF article] [PDF with links]
15. John Cawley, Christopher J. RuhmThe Economics of Risky Health Behaviors 2, 95-199.[CrossRef]
16. Marc Fleurbaey, Erik SchokkaertEquity in Health and Health Care 2, 1003-1092. [CrossRef]