Embed Size (px)
DESCRIPTION
call center 2
Citation preview
The Call Center Scheduling Problem using Spreadsheet Optimization and VBA
A thesis submitted in partial fulfillment of the requirements for the degree of Master of Science at Virginia Commonwealth University.
by
Katherine Marie Perry
Master of Mathematical Sciences with a concentration in Operations Research
J. Paul Brooks, Chair
José H. Dulá Jason R. W. Merrick
April 27, 2012 Richmond, Virginia
Keywords: Call Center Scheduling, Decision Support Systems, Spreadsheet Optimization
Copyright 2012, Katherine M. Perry

ii
Acknowledgement
This would not be possible without the support of many people. I would like to express my
gratitude to my advisor, Dr. J. Paul Brooks for his abundant help and assistance, support, and
guidance. I give a very special thanks to my parents, Randal and Barbara Perry, who have given
their love and support throughout my entire educational career and all other aspects of my life. I
would also like to thank Chris Eaheart for his continual motivation and encouragement
throughout the completion of this thesis; and to the rest of my friends and family for their endless
love and support.
iii
Table of Contents
Abstract ........................................................................................................................................ v
Chapter 1: Introduction ............................................................................................................... 1
1.1 Introduction to Math Modeling ................................................................................. 1
1.2 Literature Review ...................................................................................................... 5
1.2.1 The Scheduling Problem ............................................................................ 5
1.2.2 Formulations .............................................................................................. 6
1.2.3 Solution Methods ....................................................................................... 15
1.2.4 Heuristics ................................................................................................... 16
1.2.5 Mathematical Programming & Column Generation .................................. 19
1.3 Spreadsheet Optimization ......................................................................................... 21
1.4 Microsoft Excel & Visual Basic for Applications .................................................... 22
1.5 Overview ................................................................................................................... 24
Chapter 2: Integer Programming Formulation and Spreadsheet Implementation ...................... 26
2.1 Statement of Problem ................................................................................................ 26
2.2 Benchmark Goals for the Call Center ....................................................................... 28
2.3 Methodology ............................................................................................................. 29
2.3.1 The Integer Program – Set Covering ......................................................... 29
2.3.2 The Model .................................................................................................. 30
2.3.3 How the Tool Works .................................................................................. 34
2.3.4 Macros ........................................................................................................ 37
iv
2.3.5 Implementation Challenges ....................................................................... 38
Chapter 3: Empirical Evaluation of Spreadsheet Scheduling Tool ............................................ 41
3.1 Schedule Metrics ....................................................................................................... 41
3.2 Comparison ............................................................................................................... 42
3.2.1 Normal Staff Gap ....................................................................................... 42
3.2.2 Run-time Comparison ................................................................................ 50
3.3 Conclusions ............................................................................................................... 51
References ................................................................................................................................... 53
Chapter 4: Appendix ................................................................................................................... 55
4.1 User Manual .............................................................................................................. 55
4.1.1 Installing OpenSolver ................................................................................ 55
4.1.2 Installing Excel Solver ............................................................................... 59
4.1.3 Using the Model ......................................................................................... 62
4.2 Macros ....................................................................................................................... 68
4.2.1 Generate Schedules Macro ........................................................................ 68
4.2.2 Minimize Macro ......................................................................................... 75
4.2.3 Optimize Macro ......................................................................................... 84
4.2.4 Select Demand Macros .............................................................................. 93
v
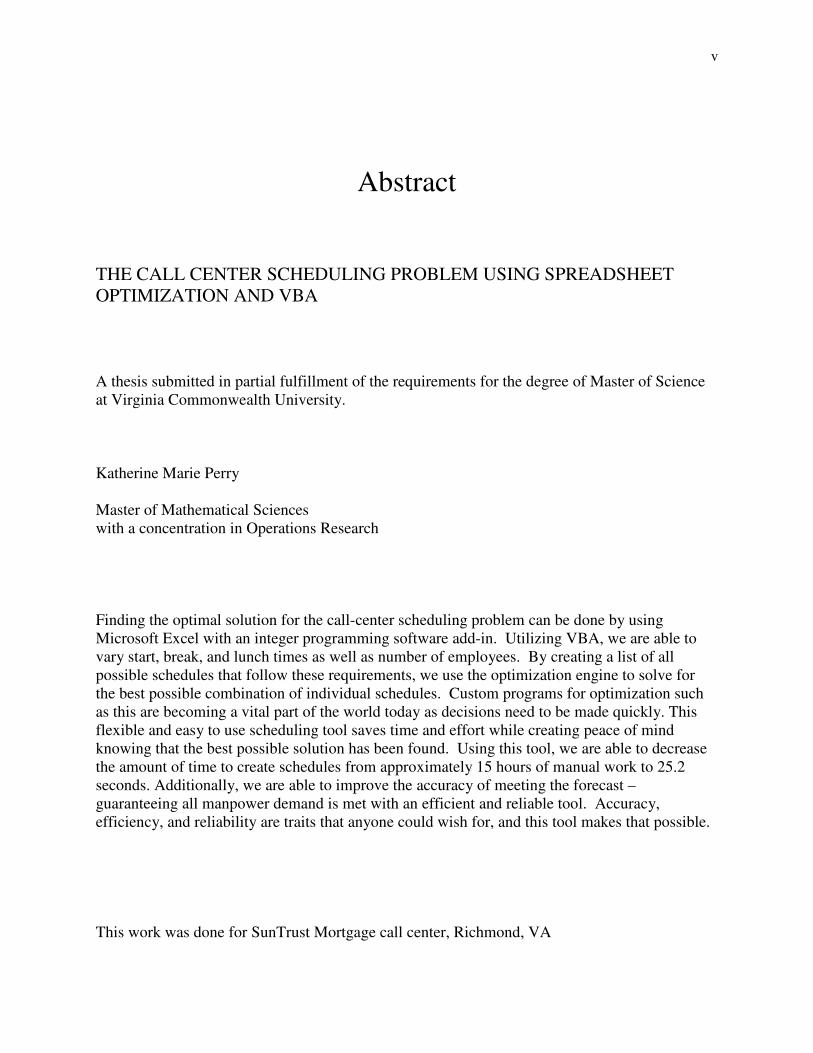
Abstract
THE CALL CENTER SCHEDULING PROBLEM USING SPREADSHEET OPTIMIZATION AND VBA
A thesis submitted in partial fulfillment of the requirements for the degree of Master of Science at Virginia Commonwealth University. Katherine Marie Perry Master of Mathematical Sciences with a concentration in Operations Research
Finding the optimal solution for the call-center scheduling problem can be done by using Microsoft Excel with an integer programming software add-in. Utilizing VBA, we are able to vary start, break, and lunch times as well as number of employees. By creating a list of all possible schedules that follow these requirements, we use the optimization engine to solve for the best possible combination of individual schedules. Custom programs for optimization such as this are becoming a vital part of the world today as decisions need to be made quickly. This flexible and easy to use scheduling tool saves time and effort while creating peace of mind knowing that the best possible solution has been found. Using this tool, we are able to decrease the amount of time to create schedules from approximately 15 hours of manual work to 25.2 seconds. Additionally, we are able to improve the accuracy of meeting the forecast – guaranteeing all manpower demand is met with an efficient and reliable tool. Accuracy, efficiency, and reliability are traits that anyone could wish for, and this tool makes that possible. This work was done for SunTrust Mortgage call center, Richmond, VA
Katherine M. Perry
1
Chapter 1: Introduction
1.1 Introduction to Math Modeling
The approach to decision making which involves developing a mathematical representation
of a real-life situation is called a mathematical model. An optimization mathematical model
helps us find the solution to our problem which will produce the best results according to the
goal [16]. The components of an optimization model include:
1. Decision variables
2. Objective function(s)
3. Constraints
Decision variables are the variables whose values are under our control and influence the
performance of the system. An example of a decision variable is:
�� = the number of resource � to produce for � = 1,2,…, �
Upon solution, for every type of resource, we will have values of ��, ��,…, �� prescribe
quantitative decisions.
Katherine M. Perry
2
The objective function is a function in which we wish to maximize or minimize. For
example:
1. Minimize total cost
2. Maximize profit
3. Minimize resources used
They can also be more complicated:
4. Minimize the maximum deviation from our target resources used
Constraints are the restrictions or requirements set for the situation. Some examples are:
• You cannot use more than 5 gallons of solution A
• Temperature must remain between 150 and 200 degrees Fahrenheit
• Number of employees must be at least 10
After all of these pieces are defined, we can turn them into a mathematical model ready for
optimization. Doing an example of a simple linear mathematical program, we can see how to
build a model:
Suppose you have a company that manufactures two products: widgets and gizmos. Widgets
sell for $6 per piece but cost $2 to make. Gizmos sell for $8 per piece and cost $5 to produce.
We also know that the company can only produce 25 widgets and 20 gizmos, and can only
produce 35 total items. How many of each product should you produce in order to maximize
profits?
Katherine M. Perry
3
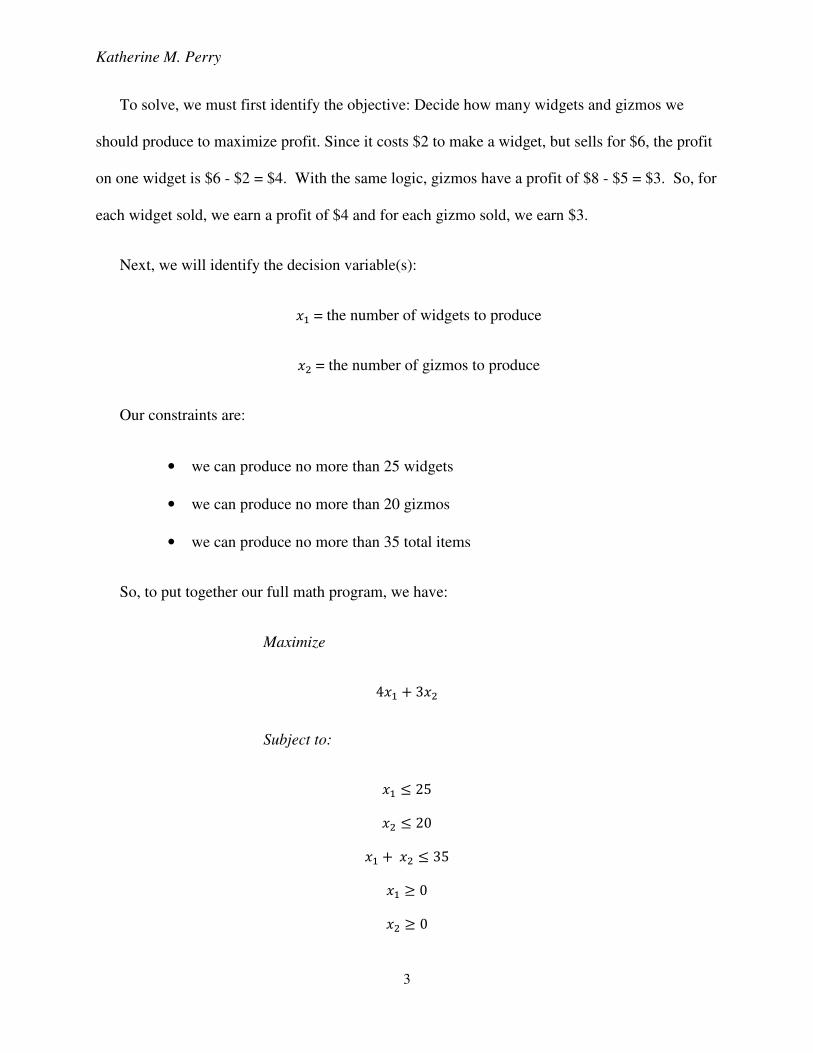
To solve, we must first identify the objective: Decide how many widgets and gizmos we
should produce to maximize profit. Since it costs $2 to make a widget, but sells for $6, the profit
on one widget is $6 - $2 = $4. With the same logic, gizmos have a profit of $8 - $5 = $3. So, for
each widget sold, we earn a profit of $4 and for each gizmo sold, we earn $3.
Next, we will identify the decision variable(s):
�� = the number of widgets to produce
�� = the number of gizmos to produce
Our constraints are:
• we can produce no more than 25 widgets
• we can produce no more than 20 gizmos
• we can produce no more than 35 total items
So, to put together our full math program, we have:
Maximize
4�� 3��
Subject to:
�� � 25
�� � 20
�� �� � 35
�� � 0
�� � 0
Katherine M. Perry
4
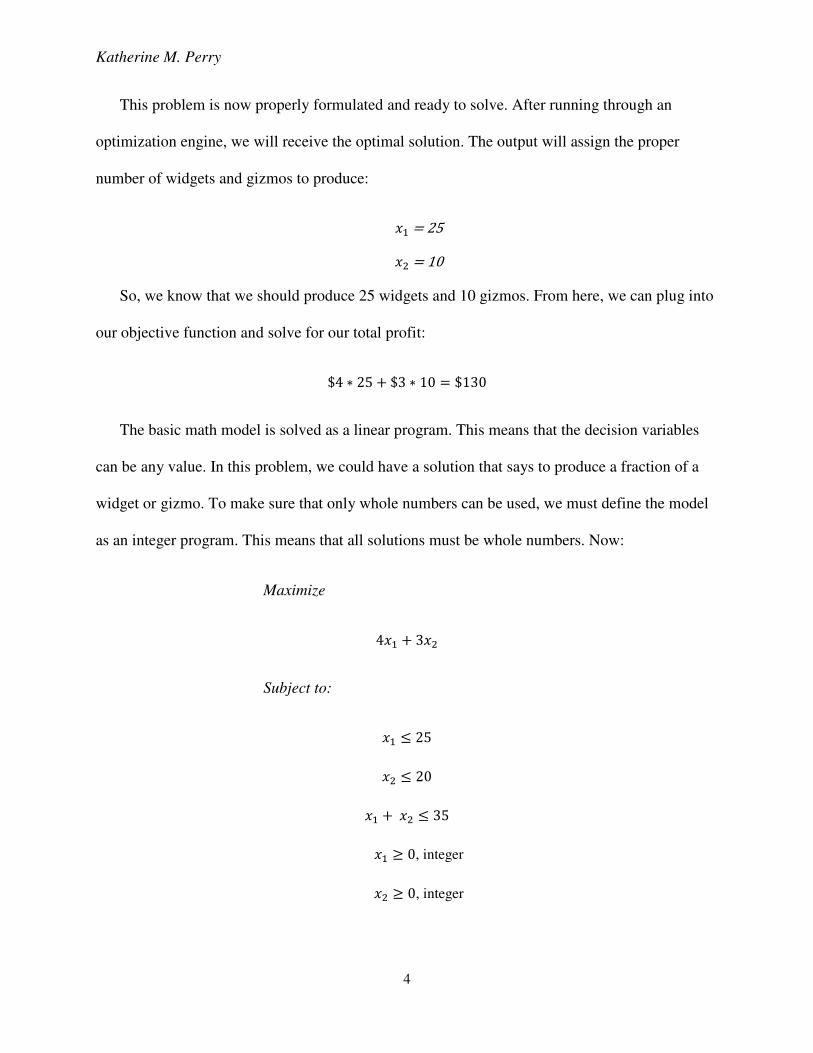
This problem is now properly formulated and ready to solve. After running through an
optimization engine, we will receive the optimal solution. The output will assign the proper
number of widgets and gizmos to produce:
�� = 25 �� = 10
So, we know that we should produce 25 widgets and 10 gizmos. From here, we can plug into
our objective function and solve for our total profit:
$4 � 25 $3 � 10 = $130
The basic math model is solved as a linear program. This means that the decision variables
can be any value. In this problem, we could have a solution that says to produce a fraction of a
widget or gizmo. To make sure that only whole numbers can be used, we must define the model
as an integer program. This means that all solutions must be whole numbers. Now:
Maximize
4�� 3��
Subject to:
�� � 25
�� � 20
�� �� � 35
�� � 0, integer
�� � 0, integer
Katherine M. Perry
5
The formulation is properly defined and the optimization engine knows that we are now
finding the optimal solution with integers. This is a more computationally complex problem, but
important in many real-life applications.
The goal of the optimization model is to find values of the decision variables that will
optimize (maximize or minimize) the objective function among the set of all values for the
decision variables that satisfy the given constraints [20]. It guarantees us the best solution and
also guarantees that all constraints will be satisfied, thus, instilling confidence in any decisions
made using this method.
1.2 Literature Review
1.2.1 The Scheduling Problem
Call centers are becoming increasingly popular and important. Whether it is to deal with
customers of a product or service, or to provide a specialists’ help to different businesses,
everyone deals with call centers from time to time. With this increase in call-center popularity
comes an increase in interest in operations research analysts to design and implement the best
schedules for these centers. Being able to reach a technician or call operator requires a lot of
thought and planning, including forecasting number of calls at different times of the day,
determining how many workers need to be working to handle these forecasted number of calls,
and lastly, how to assign employees to these shifts so that enough people are working to cover
the forecast. In small sizes, this problem can be fairly trivial, but once the requirements for
Katherine M. Perry
6
workers decreases in flexibility and more and more employees are available, the harder this
problem becomes to solve.
Because this is such a daunting task, it is necessary that we come up with an efficient and
accurate method of determining the schedule for employees based on this forecast. The general
model for this is an optimization problem [18], which defines the overall goal the program
(objective), and what rules it must abide by (constraints). The goal is to either minimize or
maximize the objective, � � �. The constraints are equations which bind the employees’
potential schedules, �� � � to meet the given forecast of employee requirements. By formulating
this math program, we can solve to find the optimal schedule allocation.
1.2.2 Formulations
There are many different approaches to solving the scheduling problem, each caters to the
problem at hand, and the specific goals of the manager making the decision. Tien and Kamiyama
[17] write about several algorithms which are common in manpower scheduling. This is based
on the assumption that the general scheduling problem can be divided into five sub-problems or
stages:
• Determination of temporal manpower requirements (forecast the demand)
• Total manpower requirement (how many workers need to work for the company)
• Recreation blocks (number of employees having recreation block t during a
planning period of i days)
• Recreation/work schedule (a function, f which defines the sequence of recreation
blocks to be followed in the worker’s schedule)
• Shift schedule (assigns schedule to each worker)
Katherine M. Perry
7
These steps are the building blocks of a formulation for scheduling. Basically, we must
define the objective and constraints of the particular problem. Every scheduling problem is
unique, and must have its formulation built around these requirements. In their paper, Ernst, et al.
[9] present several different types of staff scheduling and rostering problems. These all center
around finding a solution which minimizes cost while meeting employee/employer preferences,
while satisfying all workplace constraints by allocating staffs to shifts.
Abboud, et al. [1] present a scheduling problem which includes multiple objectives, and
several unknowns. They propose heuristics which are based on genetic annealing (a cross-breed
between genetic algorithm and simulated annealing) and compare by using small scale versions
of their method, integer programming, and metaheuristics. They modeled with three objectives,
as opposed to the common method of optimizing over a single objective. These are:
• Maximize total gross sales goal of all branches in company
• Maximize gross sales of each branch
• Maximize satisfaction of each salesman
Baker and Magazine [3] examine the problem of scheduling which days an employee has off
in a continuous (7-days a week) operation with a variety of day-off policies. Their objective is to
minimize the workforce size (or number of employees) and to construct a feasible schedule for
all employees. They propose an algorithm for specific constraint types. Assume:
• Demand is specified for number of employees required each workday
• Each employee works an average of five days per week
• Cyclical schedule (specify work tours for a single cycle and assume these will
repeat after a period of time)
Katherine M. Perry
8
These are some fairly common assumptions to make about a scheduling problem, but are still
important to clearly define before building the model. The primary contribution that they make is
the solving for the optimal workforce size which meets all of the parameters of the defined
demand profile. They test different workforce situations by consider four different types of
scheduling problems:
Employees are entitled to:
1. Two days off per week
2. Two consecutive days off each week
3. Every other weekend off and two to four days off every two weeks
4. Every other weekend off and two pairs of consecutive days off every two weeks
Each problem focuses on the objective of minimizing the total number of employees while
still meeting demand. Even though the objective remains the same, every one of these types of
problems will result in different optimal solutions because of these small changes in constraints.
This is a simple view of the general manpower scheduling problem, and exhibits just a small
taste of the variation we can find in this field.
Taylor and Huxley [16] discuss in their paper an optimization-based decision support system
for deploying patrol officers. This program consists of three main phases: (1) forecasting, (2)
scheduling, and (3) fine tuning. The scheduling phase is done using objective to minimize the
amount of shortages and then minimize the maximum shortage of any given hour of the week.
This is to keep from having a schedule that generally works well, but has time periods with
severe shortages in staff. Constraints are defined by the forecast created in the first phase. This
Katherine M. Perry
9
formulation is unique due to its complicated objective function. To minimize the maximum (or
to maximize the minimum), one needs to use a more complex method of solving.
Morris and Showalter [14] present computational experience to show how to implement an
application of linear programming which frequently produces an optimal solution to minimizing
the number of labor hours by employees to satisfy the demand constraints of the job. Consider a
continuous operation where there needs scheduling for 24 hours a day and 7 days a week. They
find that it is necessary to use a more integrative tour scheduling formulation than the typical
math formulations. After experiments over varying workforce requirement patterns, they were
able to use a simple heuristic which consistently produced a near-optimal solution.
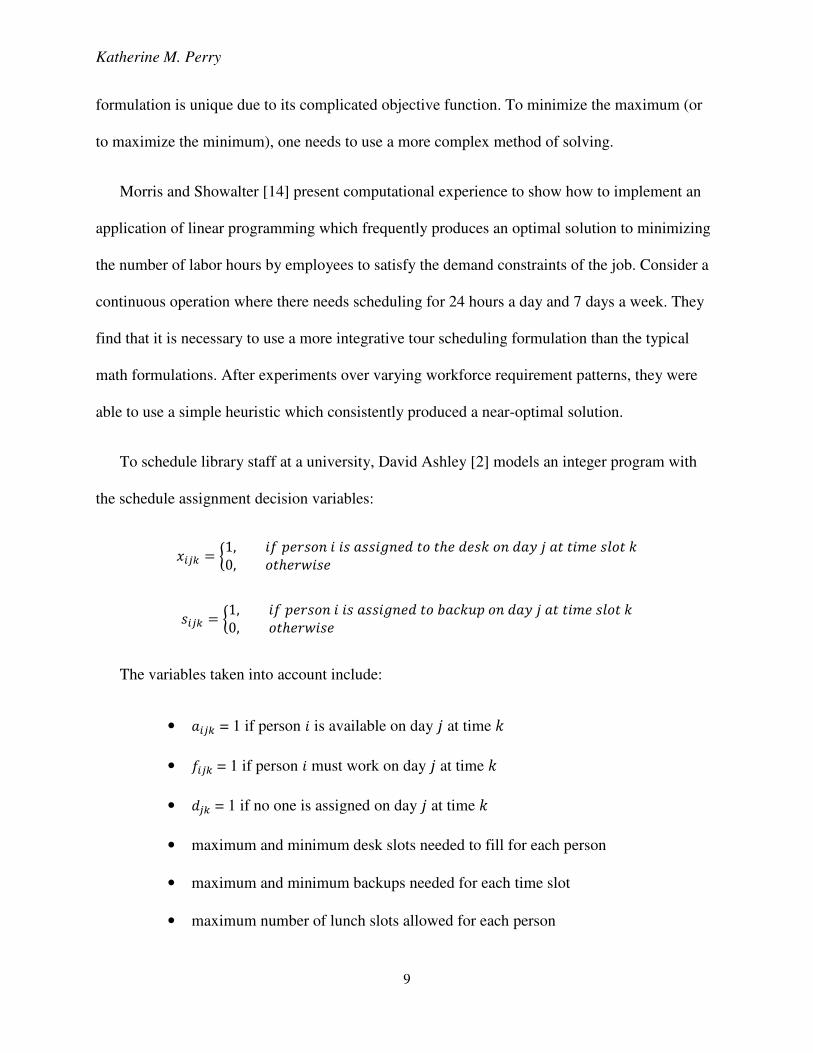
To schedule library staff at a university, David Ashley [2] models an integer program with
the schedule assignment decision variables:
���� = �1, �� ����� � �� !���" �# $� $%� #��� � #!& ' !$ $�(� �)�$ �0, �$%��*��� +
���� = �1, �� ����� � �� !���" �# $� �!,�-� � #!& ' !$ $�(� �)�$ �0, �$%��*��� +
The variables taken into account include:
• !��� = 1 if person � is available on day ' at time �
• ���� = 1 if person � must work on day ' at time �
• #�� = 1 if no one is assigned on day ' at time �
• maximum and minimum desk slots needed to fill for each person
• maximum and minimum backups needed for each time slot
• maximum number of lunch slots allowed for each person
Katherine M. Perry
10
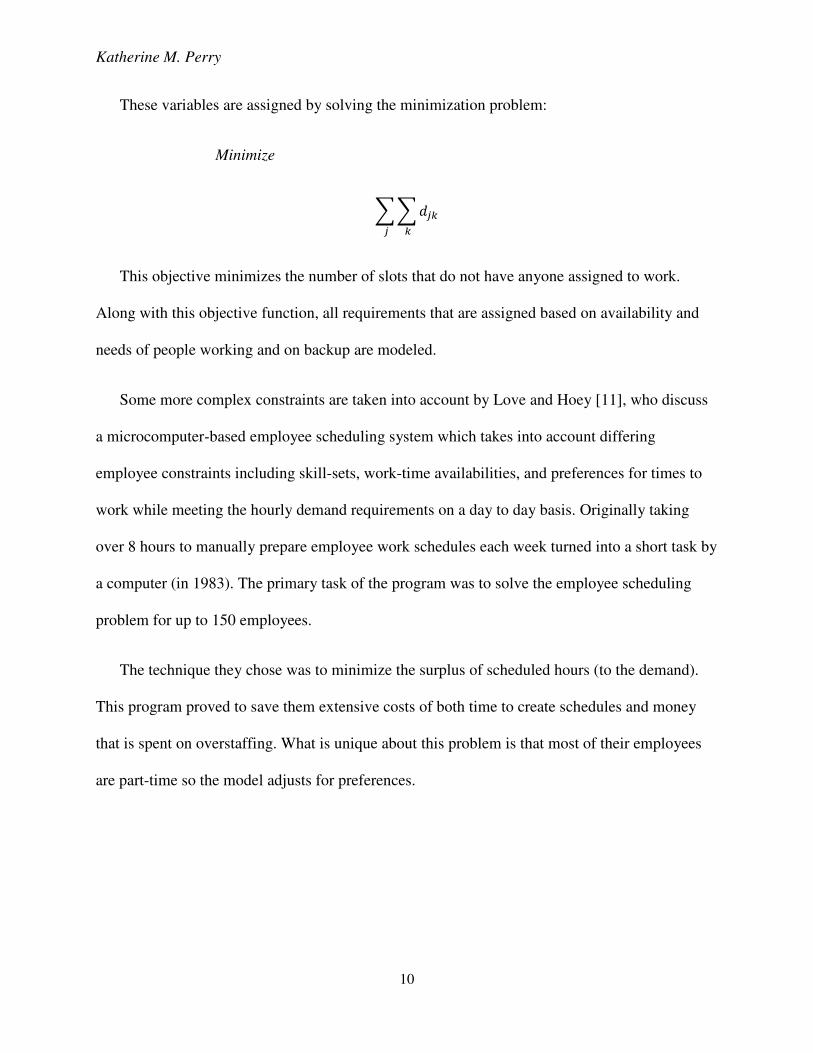
These variables are assigned by solving the minimization problem:
Minimize
..#�� � �
This objective minimizes the number of slots that do not have anyone assigned to work.
Along with this objective function, all requirements that are assigned based on availability and
needs of people working and on backup are modeled.
Some more complex constraints are taken into account by Love and Hoey [11], who discuss
a microcomputer-based employee scheduling system which takes into account differing
employee constraints including skill-sets, work-time availabilities, and preferences for times to
work while meeting the hourly demand requirements on a day to day basis. Originally taking
over 8 hours to manually prepare employee work schedules each week turned into a short task by
a computer (in 1983). The primary task of the program was to solve the employee scheduling
problem for up to 150 employees.
The technique they chose was to minimize the surplus of scheduled hours (to the demand).
This program proved to save them extensive costs of both time to create schedules and money
that is spent on overstaffing. What is unique about this problem is that most of their employees
are part-time so the model adjusts for preferences.
Katherine M. Perry
11
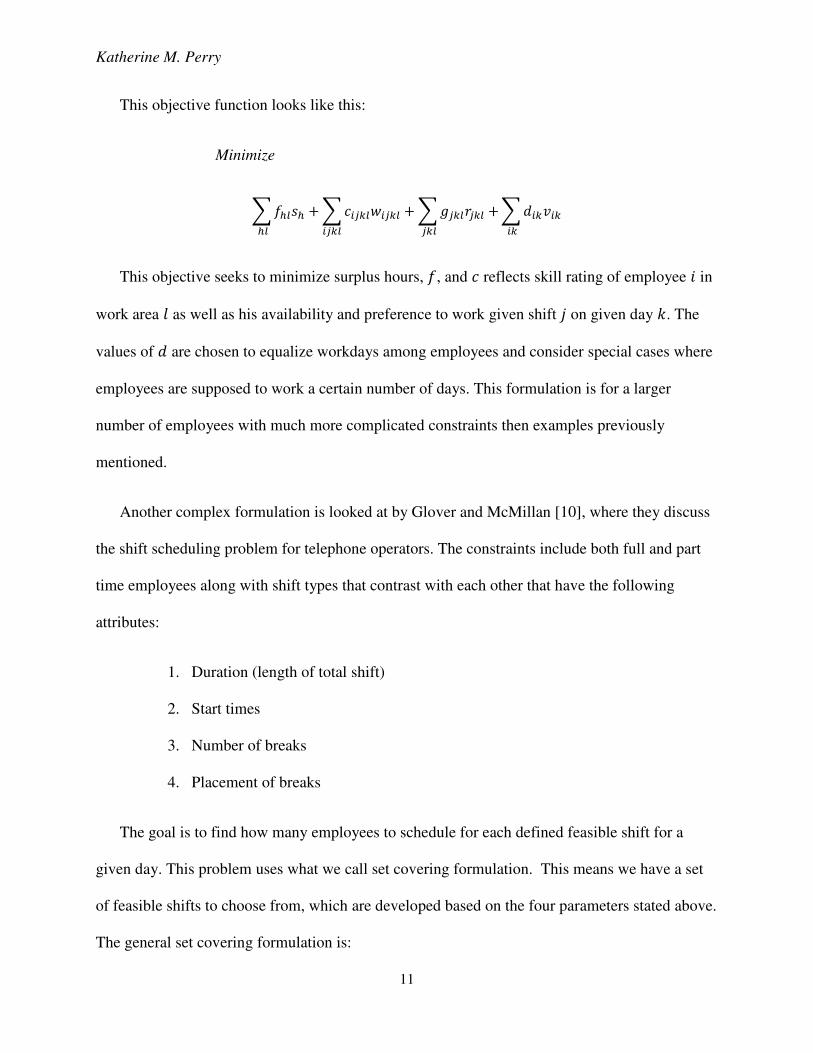
This objective function looks like this:
Minimize
.�/0�/ /0
.,���0*���0 ."��0���0 ��0
.#��1�� �����0
This objective seeks to minimize surplus hours, �, and , reflects skill rating of employee � in
work area ) as well as his availability and preference to work given shift ' on given day �. The
values of # are chosen to equalize workdays among employees and consider special cases where
employees are supposed to work a certain number of days. This formulation is for a larger
number of employees with much more complicated constraints then examples previously
mentioned.
Another complex formulation is looked at by Glover and McMillan [10], where they discuss
the shift scheduling problem for telephone operators. The constraints include both full and part
time employees along with shift types that contrast with each other that have the following
attributes:
1. Duration (length of total shift)
2. Start times
3. Number of breaks
4. Placement of breaks
The goal is to find how many employees to schedule for each defined feasible shift for a
given day. This problem uses what we call set covering formulation. This means we have a set
of feasible shifts to choose from, which are developed based on the four parameters stated above.
The general set covering formulation is:
Katherine M. Perry
12
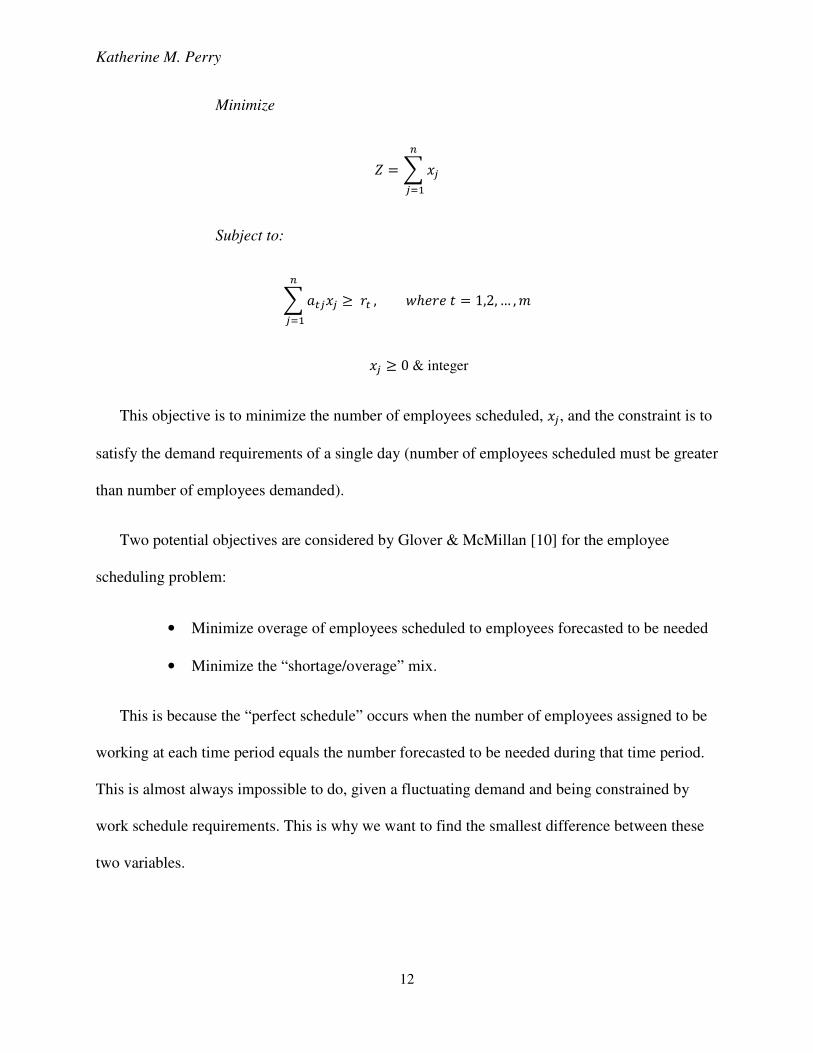
Minimize
2 = . ��3
�4�
Subject to:
.!5��� � �53
�4�, *%��� $ = 1,2,… ,(
�� � 0 & integer
This objective is to minimize the number of employees scheduled, ��, and the constraint is to
satisfy the demand requirements of a single day (number of employees scheduled must be greater
than number of employees demanded).
Two potential objectives are considered by Glover & McMillan [10] for the employee
scheduling problem:
• Minimize overage of employees scheduled to employees forecasted to be needed
• Minimize the “shortage/overage” mix.
This is because the “perfect schedule” occurs when the number of employees assigned to be
working at each time period equals the number forecasted to be needed during that time period.
This is almost always impossible to do, given a fluctuating demand and being constrained by
work schedule requirements. This is why we want to find the smallest difference between these
two variables.
Katherine M. Perry
13
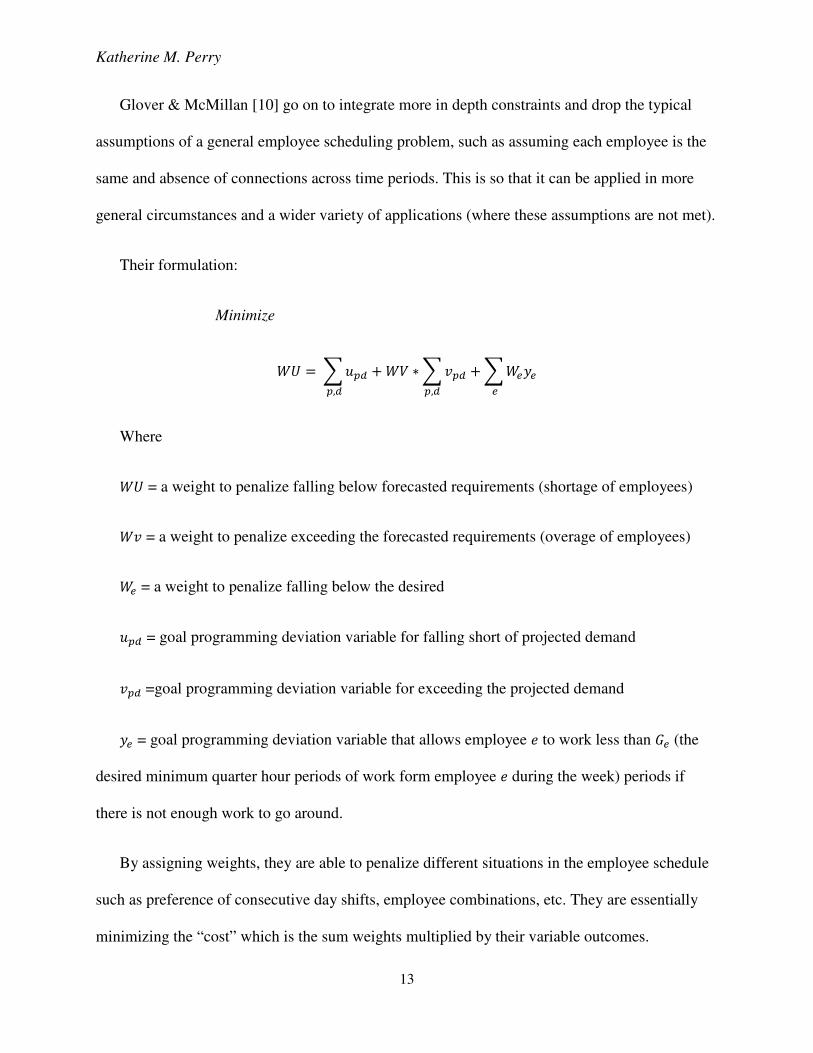
Glover & McMillan [10] go on to integrate more in depth constraints and drop the typical
assumptions of a general employee scheduling problem, such as assuming each employee is the
same and absence of connections across time periods. This is so that it can be applied in more
general circumstances and a wider variety of applications (where these assumptions are not met).
Their formulation:
Minimize
78 = .-9: 9,:
7; �.19: .7<&< <9,:
Where
78 = a weight to penalize falling below forecasted requirements (shortage of employees)
71 = a weight to penalize exceeding the forecasted requirements (overage of employees)
7< = a weight to penalize falling below the desired
-9: = goal programming deviation variable for falling short of projected demand
19: =goal programming deviation variable for exceeding the projected demand
&< = goal programming deviation variable that allows employee � to work less than =< (the
desired minimum quarter hour periods of work form employee � during the week) periods if
there is not enough work to go around.
By assigning weights, they are able to penalize different situations in the employee schedule
such as preference of consecutive day shifts, employee combinations, etc. They are essentially
minimizing the “cost” which is the sum weights multiplied by their variable outcomes.
Katherine M. Perry
14
Vijay Mehrotra [13] explained that with an increasing demand for call centers in a broad
spectrum of businesses, it is important to look further into the art of call center scheduling.
There is a strong need for properly staffing these call centers to find the best way to satisfy
callers while not overstaffing and having a large number of idle workers just waiting to have a
call to answer. Call forecasting is an integral part of figuring out how to schedule employees, and
this paper claims that the fundamental questions to be addressed are:
• How many calls will we get in a given time period on a given day?
• How many people do we need on staff?
• When and how should these agents be hired, trained, and scheduled?
• What will be the cost?
We can then make proper decision on scheduling. The main goal in call centers is to
maximize the “service level” and in this article – is stressed as our overall objective (as opposed
to minimizing cost or minimizing number of employees). This involved minimizing the
percentage of customers who wait less than some given target time (i.e. 30 seconds) before
reaching an agent. This involves queuing theory and a well-developed forecast.
Assumptions that are often made are:
• Every call is of the same type
• Every agent can handle calls equally fast
• Calls are queued on a first-in-first-out basis
• Call abandonment rates are known and independent of the time a customer spends
waiting
Katherine M. Perry
15
In the end, Mehrotra stresses the importance of operations research in the era of call centers.
Working with developing the correct constraints and basis for each type of call center is quite a
task and varies greatly. These formulations and views of scheduling are just a handful of the
infinite combination of constraints and objectives that are out there for call-center scheduling and
scheduling in general. Every situation is different and the variety of math models proves just
that.
1.2.3 Solution Methods
As demonstrated in the previous section, there are many different types of staff scheduling
and rostering problems. All of these problems center around finding a solution which minimizes
a general cost while meeting employee and/or employer preferences, while satisfying all
workplace constraints by allocating staff to shifts. Ernst, et al. [9] propose five types of solutions
methods:
1. Demand planning
2. Artificial intelligence
3. Metaheuristics
4. Constraint programming
5. Mathematical programming
We will focus mainly on the mathematical programming and heuristic approaches. When the
problem at hand is not computationally complex, the choice is almost unanimous in which is the
best: mathematical modeling. When a math program is feasible and computationally tractable,
we may be confident that the solution returned by an optimization engine is indeed optimal [9].
Katherine M. Perry
16
The reason that there are so many different methods of solving this scheduling problem is
because when the problem gets too large, it is not computationally feasible to guarantee finding
the best solution [9]. Instead, one often must implement various techniques of solving the
equation. Mathematical programming will yield a guaranteed global optimal solution, but may
not be possible to compute. This is when Artificial intelligence, heuristics, and metaheuristics
come into play. These are simply algorithms designed to find a near optimal solution to the
problem, or a “feasible” solution to the problem. A feasible solution is when all the constraints
are met, but the objective is not necessarily the smallest (in a minimization problem) or largest
(in a maximization problem). All this guarantees is that you have a schedule that meets all the
needs described in the problem.
1.2.4 Heuristics
When the problem is too computationally complex, it is important to not only find a
heuristic, but to find one that produces a near-optimal solution. Tien, et al. [17] tested several
algorithms to find the optimal solution and concluded that there are no efficient methods for
solving the general manpower scheduling problems that is such a combinatorial optimization
problem. One method proved to be as, if not more difficult to solve than the traveling salesperson
problem (which is a known NP-complete problem, and is generally assumed to be an unsolvable
problem in polynomial time). When the problem gets to a certain degree, it becomes far too
complex to solve. This tells us how easy it is for a generic manpower scheduling problem to
become too difficult to find an optimal solution to – and it is a necessity to lean towards
heuristics when the problem is too complex. This is just one example of how important the
search for a good heuristic can be in large, complex problems.
Katherine M. Perry
17
Abboud, et al. [1] implemented a heuristic to solve their scheduling problem. They came to
the conclusion that their modified approach of adopted genetic annealing metaheuristic yielded
the best overall results in a situation where all difficulties in manpower scheduling are assessed.
This method allows more uncertainty with the same level of accuracy. Also, Baker and Magazine
[3] found that after attempting mathematical programming to solve their integer program, it was
simply not efficient enough and had to use a heuristic to find a near-optimal solution.
A linear time heuristic was used by Vohra, [18] for the staffing problem which includes the
constraints of having specific breaks during the day. This heuristic’s quality increases as the
requirements for each period become more uniform. So, Vohra was able to identify a new class
of polynomially solvable set-covering problems. Vohra implements the round-off heuristic and
compares it to the Morris and Showalter [14] heuristic and finds that it is not as consistent in
finding a close to optimal solution. However, this heuristic is beneficial because you can find a
decent feasible solution which is very quick and easy to solve. He concludes that this heuristic is
better in the cases when requirements for each period become more uniform.
Morris and Showalter [14] solve this problem using a round-down heuristic and found very
low error with a method that guarantees an optimal solution. This is very rare for a heuristic,
since most only get close to the optimal solution. Unfortunately, this heuristic fails to represent
varying work categories such as team leaders, floaters, and part-timers. So, although they were
able to find an efficient way to find the optimal solution, they were forced to drop some of their
important constraints.
CAPS is a call processing simulator that was developed by AT&T to assess and evaluate
their inbound call centers. They did this because call centers’ growth increased 20% in the 90’s
Katherine M. Perry
18
thus proving to be a substantial investment when it comes to hiring workers for this task and
overall running of the call center [4]. The goal is to minimize the wait time between when a
person calls, and when they are greeted by a call center employee. Based on a study done, the
found that 44% of callers will hang up when faced with a delay of 15 seconds, and 69% would
hang up and not call back after 30 seconds of waiting. This forces the objective of minimizing
call abandonment.
CAPS is used to forecast calls based on simulations and heuristics and among other things is
used to propose optimal staffing. It bases simulations off of average agent talk time, number of
calls offered to center, which are both easily obtainable information, but in addition o that use the
rate and nature of abandonment. This development tool is a type of work-force management tool
that helps with forecasts, plans and schedules. It schedules by the ACD module which flows the
calls in a way that minimizes call abandonment. This means that by using simulation instead of
optimization by linear or integer programming, an effective scheduling program can be modeled
and implemented. This implementation of a simulation and heuristic approach has proved to be
incredibly beneficial for AT&T and this CAPS system was emulated in many businesses
afterwards.
Rottembourg [15] gives an example of specific call center scheduling for the company
“Bouygues Telecom” in France. In this model, he assumes a known number of calls (therefore
do not need to worry about flexibility of forecast). The objective here is to achieve a certain level
of service quality.
Katherine M. Perry
19
They test mathematical programming as well as several types of heuristics:
1. Integer programming (with branch and bound)
2. Insertion based heuristics (typical procedures for vehicle routing problems)
3. Matching and flow algorithms (with fixed schedules – viewing problem as a max-
cost flow problem)
After analyzing these, it was determined that integer programming was the easiest and best
way to add or change constraints without causing problems with answering time and overall
quality of Bouygues’ call center service. This means we get flexibility and a guaranteed optimal
solution.
1.2.5 Mathematical Programming & Column Generation
According to many investigators, mathematical programming is ideal for smaller, less
complex problems. You have the confidence of knowing that any solution it gives you will be
the best possible answer for the given problem. Love and Hoey [11] discussed how their math
program saved them both eight hours of manual scheduling each week, plus the luxury of having
all constraints met without the stress of doing it by hand.
In David Ashley’s [2] scheduling project, he was able to create an easy-to-understand and
easy-to-use technique to schedule library staff. For these reasons, and because of familiarity to
the common manager, Ashley focused on implementing the program in an electronic
spreadsheet: Lotus 123 (similar to Excel). It is modeled to allow for the manager to be involved
in the development of the program such as defining all constraints and different options of time.
It involves a basic linear programming add-in which provides weekly schedules for staffing the
Katherine M. Perry
20
reference and circulation desk at the University of Missouri library. The model solves a
scheduling problem for a work pattern of several different periods.
Functionality and flexibility are key components to this program. There are often more than
optimal solution which means that the constraints are not all tight. If an individual’s availability
changes, a different schedule which fits the new constraint can be easily computed and staff can
be rescheduled.
A very commonly used mathematical model is the integer program set covering formulation
[6]. But, in addition to that, a column generation algorithm is often used before hand to hide
much of the complexity of the problem. This develops a set of feasible schedules, and then a set
covering formulation is used with these options to define the optimal assignment of schedules for
the given forecast. Many applications of staff scheduling can build off of this general
mathematical model which is what makes it so versatile. Some of these are days-off, shift, tour
scheduling, crew scheduling, and crew rostering. So, if the application fits this type of
formulation without becoming too complex, mathematical programming will give the optimal
solution.
Easton and Rossin [7] also utilize the importance of column generation, but instead of
implementing a set-covering mathematical formulation afterwards, they apply a “working subset
heuristic” (SWSLP) to schedule employees. Theoretically, one can use mathematical programs
to schedule employees with the objective to minimize cost while meeting a feasible schedule
with integer variables. However, there are too many possible schedules (potentially millions) that
it becomes too large to optimize using an integer program. This is why a column generating
heuristic is needed. Easton and Rossin’s heuristic is generalized to accommodate both full and
Katherine M. Perry
21
part time employees. This heuristic is careful to not simply generate all possible tours, in order to
make it able to run optimization techniques on it, and through experiments, found that this
heuristic yielded objective values that were indistinguishable from other models which do
generate all feasible tours.
Column generation is very convenient because it makes many problems which were too
computationally complex to solve with just mathematical programming easy to handle. Simply
by generating possible shifts, the math program just needs to pick which of these pre-set
schedules will be used and assign an employee to that shift. We have seen that column
generation can also be used without math programming when the problem is too complex to
even generate all potential schedules. This tool is a helpful tool which can be used in almost all
shift scheduling problems.
1.3 Spreadsheet Optimization
Spreadsheets are used on a daily basis for most business analyses. Although it is not always
the fastest, it is the most widely familiar program which can plug into optimization software.
This is what makes spreadsheets so appealing when it comes to developing a scheduling tool for
a client. Microsoft Excel is likely the most well-known of the spreadsheet world, and is much
less intimidating to a new user. It makes someone who is uncomfortable with new programs
more confident in using this decision support system. The user is used to inputting data for
demand and constraint guidelines and does not have to go through the process of learning how to
use an entirely new program. Additionally, the output is generated in spreadsheet form which is
likely the form that a business employee prefers.
Katherine M. Perry
22
1.4 Microsoft Excel & Visual Basic for Applications
Visual Basic for Applications (VBA) is a program used in Excel that allows you to save
methods and formulations within an excel workbook by simply saving the computer code in
“macros” in the excel file. These can be nicely transformed into “buttons” throughout the
workbook that will run the correct command when clicked. Excel also has the availability of
Excel Solver, an optimization engine add-in that solves mathematical programs. In conjunction
with VBA, a model can be developed which requires minimal effort from the user – simply solve
by the click of a button.
Before being able to jump into modeling the call center scheduling problem in Excel, it is
important to understand how the program really works. This includes how cells are referenced,
conversions of time and date, how calculations are performed and stored, as well as how VBA
works with it. There are several uncommonly known features that need to be noted and taken
into consideration while developing the spreadsheet optimization model:
1. Time conversions
2. Every time has a date stored with it
3. Rounding errors for integer programming
Times are displayed in excel in many different formats, but are all stored in the same way.
The 24 hours of the military clock are represented by the time divided by 24. This decimal is the
time. If you type 1:00 AM, then the computer will store this value as 1/24 = 0.041666667. This
is a repeating decimal and technically continues with 6’s forever. When trying to use times for
Katherine M. Perry
23
calculations, there are often rounding errors. To combat this issue, we can multiply by 24 to
complete all calculations in terms of time. We then use 1 as 1:00 AM, 2 as 2:00 AM, … 13 as
1:00 PM, … and 24 as midnight. This is important in the generation of schedules and eliminates
the issue of rounding errors and after finished with all calculations can be divided by 24 again –
thus giving the cell the correct time format once more.
In addition to this, it is possible to have 1:00 PM and 1:00 PM not equal to the same value.
This is because a date is always stored with the time. If the time is typed, the date associated is
always 1/0/1900. This is the default day, so when using the excel function that imitates a pattern
(continues with the sequence 1:00 AM, 2:00 AM, … 11:00 PM, 12:00 AM,…) when the time
moves past midnight, the date increased to 1/1/1900. This means that the stored value for 1:00
AM is now 1.046666667. This becomes a huge problem when it comes to comparing values and
seeing if two values match. This is not an error, but something to be aware and cautious of while
building the spreadsheet tool.
The last item that is important to take into account is that when Excel Solver finds optimal
solutions for integer programs, the solutions are often valued at a decimal that is off of being an
integer by a tiny bit, i.e. 1.0000000000000000000001 instead of 1. This is an unimportant
difference that is considered arbitrary. Since this tiny discrepancy can occur, it is important to
account for this tiny value while using logic questions such as greater than, less than, or equal to.
To adjust, we can set an epsilon value, ε = .00000001. This arbitrary epsilon is implemented as
follows:
• Instead of comparing “is cell A1 <= 1:00 PM”, we check “is cell A1 <= 1:00 PM + ε”
• Instead of comparing “is cell A1 >= 1:00 PM”, we check “is cell A1 + ε >= 1:00 PM”
Katherine M. Perry
24
• Instead of comparing “is cell A1 = 1:00 PM”, we check “is cell A1 <= 1:00 PM + ε”
AND “is cell A1 + ε >= 1:00 PM”
This implementation is needed throughout the spreadsheet to adjust for any rounding errors
that could occur. As long as these tendencies are kept in mind, it should not be hard to produce a
flawless optimization model within Microsoft Excel.
1.5 Overview
In the following sections, we will look into an application of the call center scheduling
problem, its implementation, and goals. Chapter 2 describes the original scenario which brought
this problem to fruition for this paper. Also, we will see what drives the need for a call center
scheduling tool and what outcomes we aim to improve. Next, we will discuss the methodology
of the entire project. This includes the approach to developing the math program, how it is
implemented into the spreadsheet, and how each piece of the spreadsheet operates and interacts
with one another.
After describing the full formulation and implementation in chapter 2, we move on to
evaluate the performance of the scheduling tool in chapter 3. Here, we will discuss which metrics
are to be evaluated: the estimated understaffing of employees per half hour period and amount of
time taken to find a working schedule. This section proves that developing an optimization
program will benefit the user by coming closer to meeting metric goals as well as saving over 14
hours of work for the scheduler while removing almost all manual involvement required. The
only work necessary is to simply input the number of employees and the time spacing of breaks,

Katherine M. Perry
25
run the program, and forget all the hassle of trying to match up schedules to fit the forecast while
the program outputs the ideal schedule.
Katherine M. Perry
26
Chapter 2: Integer Programming Formulation and
Spreadsheet Implementation
2.1 Statement of problem
The problem of developing an employee scheduling tool came from a client who schedules
call center employees based on a 30-minute period forecast. His wishes were to find a faster,
more efficient way of scheduling his employees, and to hopefully be able to have better
performance outcomes for the call center as a result.
The following information was given to us:
• The call center is open Monday through Friday from 8:00 AM to 8:00 PM
• Calls are reported per 30-minute period of the day and this information is used to
define the necessary number of employees needed on the phones for each period
• There are 20 total employees: sixteen 8-hour employees and four 10-hour
employees
• 8-hour employees work 5 days a week
• 10-hour employees work only 4 days a week
Katherine M. Perry
27
• All employees get two 15-minute breaks during the day: one before lunch, and
one after
• 8-hour employees get 30 minutes for lunch
• 10-hour employees get 1 hour for lunch
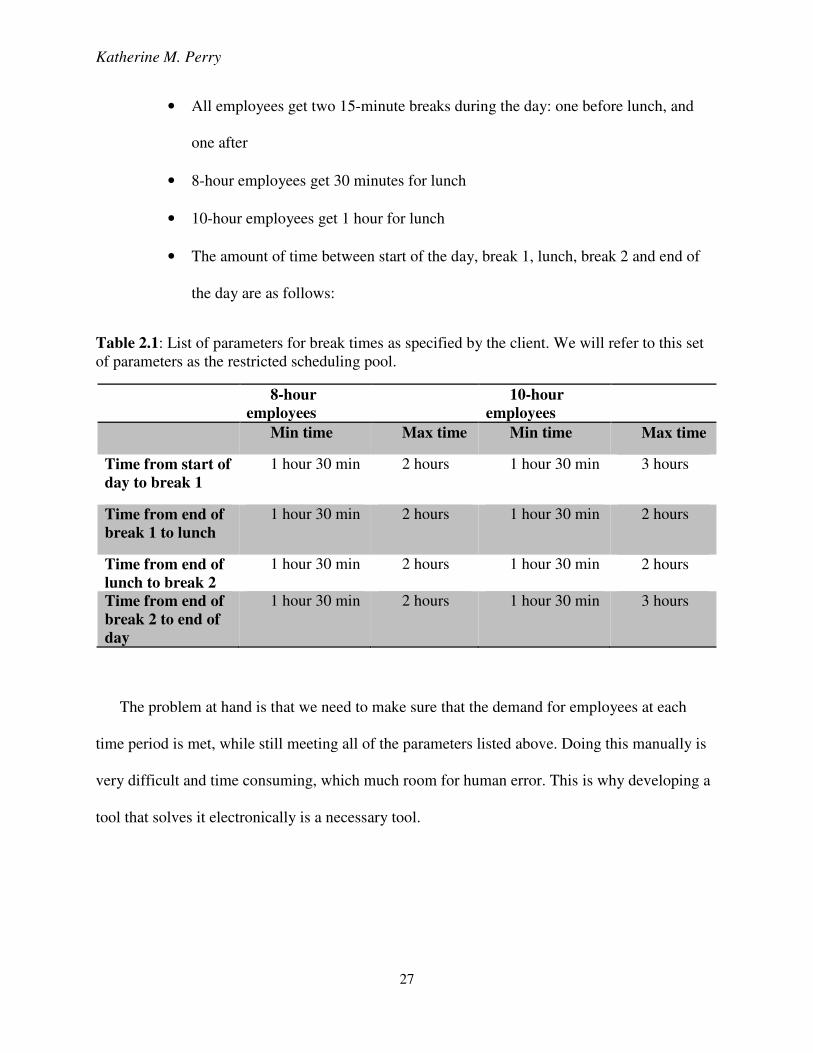
• The amount of time between start of the day, break 1, lunch, break 2 and end of
the day are as follows:
Table 2.1: List of parameters for break times as specified by the client. We will refer to this set of parameters as the restricted scheduling pool.
8-hour
employees
10-hour
employees
Min time Max time Min time Max time
Time from start of
day to break 1
1 hour 30 min 2 hours
1 hour 30 min 3 hours
Time from end of
break 1 to lunch
1 hour 30 min 2 hours
1 hour 30 min 2 hours
Time from end of
lunch to break 2
1 hour 30 min 2 hours
1 hour 30 min 2 hours
Time from end of
break 2 to end of
day
1 hour 30 min 2 hours
1 hour 30 min 3 hours
The problem at hand is that we need to make sure that the demand for employees at each
time period is met, while still meeting all of the parameters listed above. Doing this manually is
very difficult and time consuming, which much room for human error. This is why developing a
tool that solves it electronically is a necessary tool.
Katherine M. Perry
28
2.2 Benchmark Goals for the Call Center
The drive behind scheduling the correct number of employees at each time period is to
improve service levels. This includes having a call abandonment rate of less than 5%, having an
average answer speed less than 45 seconds, and having 80% of the calls answered in 40 seconds
or less. The call center manager has decided that the best way of reaching these goals is creating
a demand schedule which is based on average number of calls per time period. These average
calls are the same for each time period throughout the week, and are converted into number of
employees needed. We calculate this based on the statistic that one employee can complete an
average of 3.7 phone calls per 30-minute time period. So the average number of calls divided by
3.7 is the estimated number of employees needed. After a schedule is created, we assess the
metrics for accuracy, discussed in detail later.
For the purpose of familiarity and ease, we want our main interface to be Microsoft Excel.
From here, we want to use an optimization engine that is easily attainable, and does not cost
money for the client or others who may use the tool. The tool was originally built using Excel
Solver, but later found that using a more advanced one is more beneficial. We will learn more
about this additional optimization engine later in this paper. By keeping everything in the same
automated Excel file, we save an enormous amount of time, effort, and stress when it comes to
solving the scheduling problem.
Katherine M. Perry
29
2.3 Methodology
2.3.1 The Integer Program – Set Covering
Set covering is the math modeling method we use when we have a set of candidate schedules
(all the feasible schedules we generated previously) and we assign these schedules to cover a
particular requirement – which is the forecast. This means that for every forecast that is put in
(every 30 minute period), we must have at least the required number of employees working.
This way we will never be understaffed. The list of potential schedules is created before solving
the program and is based on the parameters defined by the user (breaks, lunches, time periods
between them, etc…).
With this list of all potential schedules, we run the set covering mathematical model to
choose the optimal combination of schedules to satisfy the defined objective. After discussion
with the client, we decided that his goal is to utilize all current employees in the best way
possible. After thinking over several possible formulations, it was decided that the most
appropriate objective would be:
• Minimize the sum of staff scheduled above demand for each 30-minute period
This means that every time we have more employees scheduled to answer calls than defined
as needed, which will be added to the objective value. So, when this is done for each time period
for each day of the week, we are finding the sum of all overstaffing. We also considered another
objective to determine if savings were possible through a reduction in staff.
• Minimize the number of employees who must be assigned a schedule
Katherine M. Perry
30
This objective function gives freedom to the number of 8 and 10 hour employees who are
scheduled. It will test to see if we have more employees employed than necessary to cover the
given forecast. This gives visibility to any need for layoffs and saving money by employing
fewer people.
2.3.2 The Model
The formulations of the two objective functions are quite different from one another;
however, the constraints remain nearly identical. The full models are shown below and are used
after already generating the list of all possible schedules.
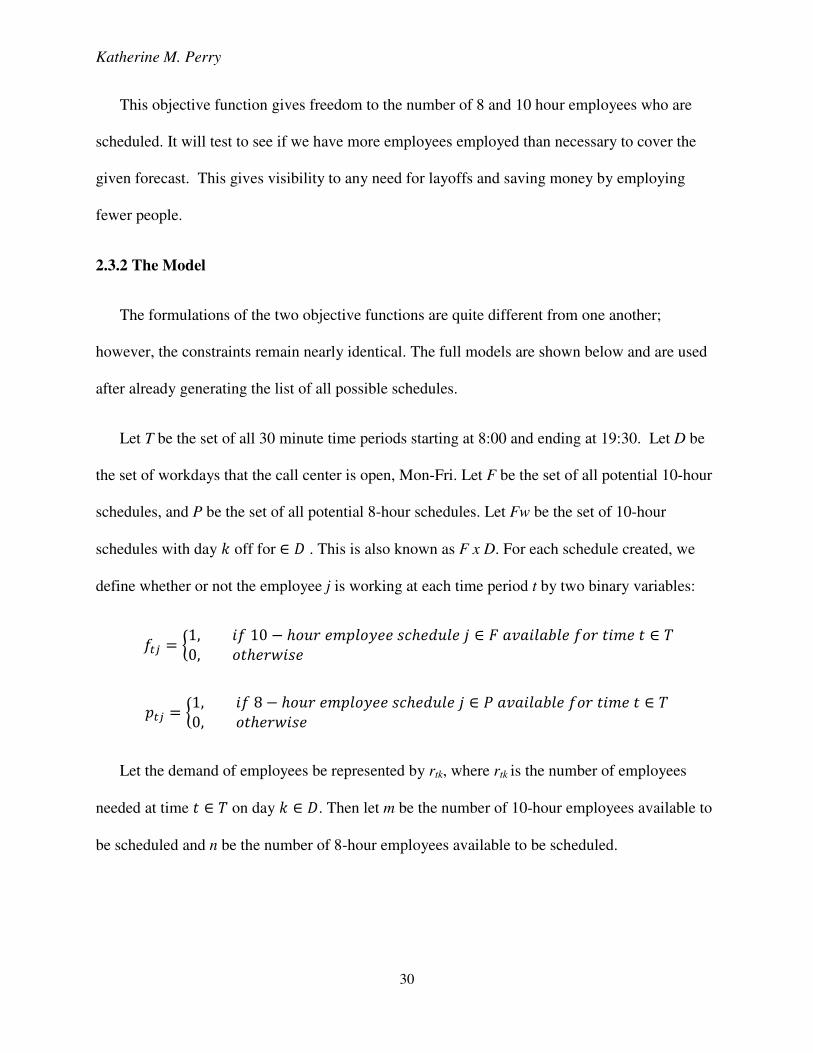
Let T be the set of all 30 minute time periods starting at 8:00 and ending at 19:30. Let D be
the set of workdays that the call center is open, Mon-Fri. Let F be the set of all potential 10-hour
schedules, and P be the set of all potential 8-hour schedules. Let Fw be the set of 10-hour
schedules with day � off for > ? . This is also known as F x D. For each schedule created, we
define whether or not the employee j is working at each time period t by two binary variables:
�5� = �1, �� 10 @ %�-� �(�)�&�� �,%�#-)� ' > A !1!�)!�)� ��� $�(� $ > B0, �$%��*��� +
�5� = �1, �� 8 @ %�-� �(�)�&�� �,%�#-)� ' > D !1!�)!�)� ��� $�(� $ > B0, �$%��*��� +
Let the demand of employees be represented by rtk, where rtk is the number of employees
needed at time $ > B on day � > ?. Then let m be the number of 10-hour employees available to
be scheduled and n be the number of 8-hour employees available to be scheduled.
Katherine M. Perry
31
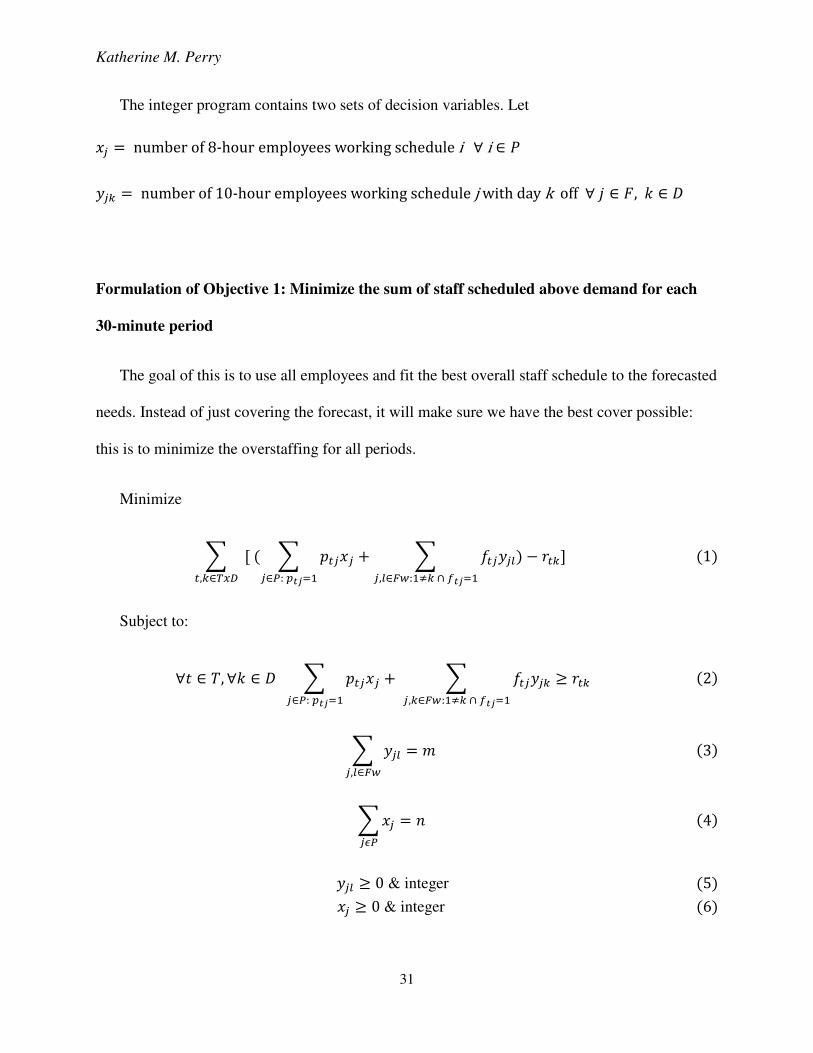
The integer program contains two sets of decision variables. Let
�� = number of 8‐hour employees working schedule i Y i > D
&�� = number of 10‐hour employees working schedule j with day k off Y ' > A, � > ?
Formulation of Objective 1: Minimize the sum of staff scheduled above demand for each
30-minute period
The goal of this is to use all employees and fit the best overall staff schedule to the forecasted
needs. Instead of just covering the forecast, it will make sure we have the best cover possible:
this is to minimize the overstaffing for all periods.
Minimize
. ] ^ . �5����>_: 9ab4�
. �5�&�0�,0>cd:�e� f gab4�5,�>hij
k @ �5�l ^1k
Subject to:
Y$ > B, Y� > ? . �5����>_: 9ab4�
. �5�&���,�>cd:�e� f gab4�
� �5� ^2k
. &�0�,0>cd
= ( ^3k
.���m_
= ^4k
&�0 � 0 & integer ^5k �� � 0 & integer ^6k
Katherine M. Perry
32
Formula (1) is the objective function. The equation is to minimize the sum of the difference
between number of employees scheduled and number of employees forecasted for all time
periods. Breaking down the equation, we see that we want to find the sum of all 8 and 10 hour
time periods that have an employee working at that time interval and subtract the number that is
demanded to be working at that time period. Then, we want to sum over every time period
difference calculated.
The constraints are formulas (2)-(6). These are he rules that determine what the decision
variables can look like at our solution. Formula (2) is the constraint to cover the defined forecast.
The equation requires that for each time interval on each day, the sum of all 8-hour employees
plus the sum of all 10-hour employees on the phone must be greater than or equal to the forecast.
Formula (3) requires that all 10-hour employees be utilized. The equation reads that the sum of
all employees assigned to a 10-hour schedule must be equal to the number of 10-hour employees
available. Formula (4) is similar to formula (3), but for 8-hour employees. It requires that the
sum of all employees assigned to an 8-hour schedule must be equal to the number of 8-hour
employees available. Equations (5) and (6) are to define the decision variables as non-negative
integer values. This is to make sure we do not have any fractional or negative answers.
Formulation of Objective 2: Minimize staff size
The goal of this is to only look at the forecast, and shows how small of a staff can be
employed in order to meet the forecast. This still meets all parameters set, but sees how much
better it could be.
Katherine M. Perry
33
Minimize
. �� . &���.� >cd
^1k� > _
Subject to:
Y$ > B, Y� > ? . �5����>_: 9ab4�
. �5�&���,�>cd:�e� f gab4�
� �5� ^2k
. &���,�>cd
� ( ^3k
.���m_
� ^4k
&�� � 0 & integer ^5k �� � 0 & integer ^6k
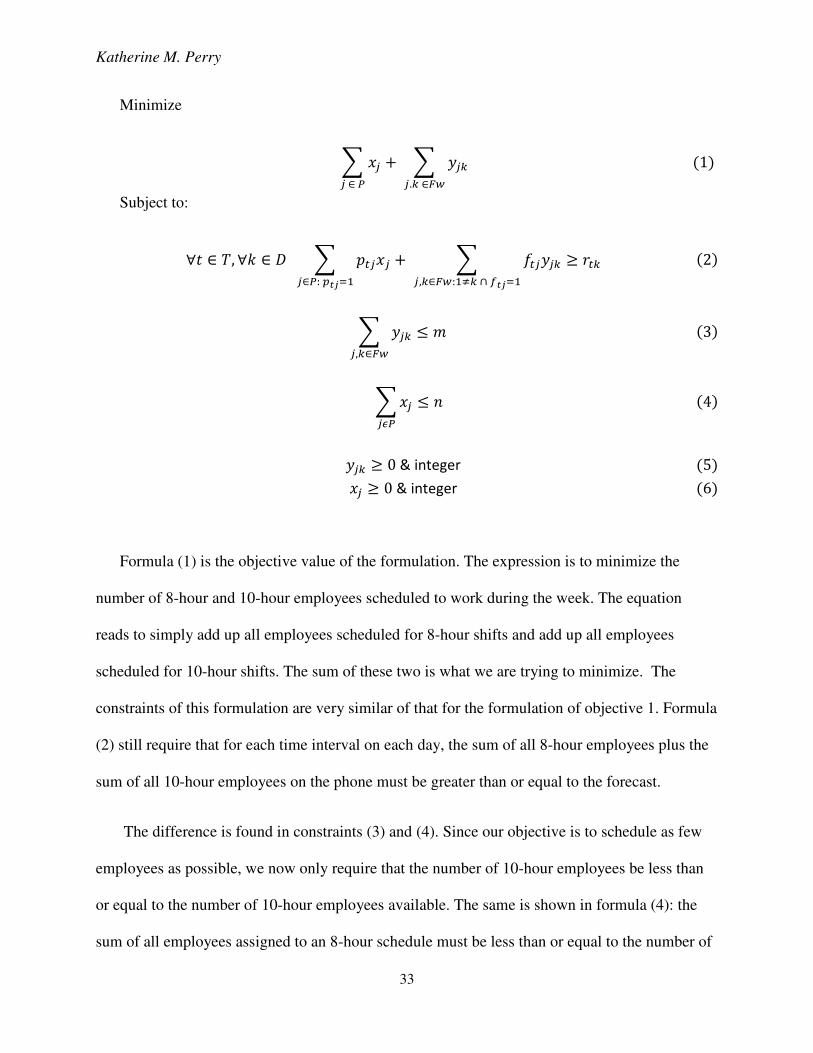
Formula (1) is the objective value of the formulation. The expression is to minimize the
number of 8-hour and 10-hour employees scheduled to work during the week. The equation
reads to simply add up all employees scheduled for 8-hour shifts and add up all employees
scheduled for 10-hour shifts. The sum of these two is what we are trying to minimize. The
constraints of this formulation are very similar of that for the formulation of objective 1. Formula
(2) still require that for each time interval on each day, the sum of all 8-hour employees plus the
sum of all 10-hour employees on the phone must be greater than or equal to the forecast.
The difference is found in constraints (3) and (4). Since our objective is to schedule as few
employees as possible, we now only require that the number of 10-hour employees be less than
or equal to the number of 10-hour employees available. The same is shown in formula (4): the
sum of all employees assigned to an 8-hour schedule must be less than or equal to the number of
Katherine M. Perry
34
8-hour employees available. Again, equations (5) and (6) define the decision variables as non-
negative integer values.
2.3.3 How the Tool Works
The spreadsheet is all inclusive and works as input, solver, and output for the optimization
problem. This means we never have to worry about moving things from program to program,
and keeps it neat and tidy. It consists of eight sheets which vary between inputs, calculations, and
outputs. It consists of eight sheets which are located at the bottom and are identified in the tab.
They are either user input tabs or calculation tabs. User input tabs are ones which need to have
information put into them by the user, and calculation tabs are ones which are not to be changed,
since they are strictly for use by the macros.
Actual Calls – This user input tab is the sheet where actual calls per 30-minute period per
week can be input and then the spreadsheet calculates the average number of calls per 30-minute
period. This calculated average is used to calculate demand in the program.
Format – This sheet is a calculation tab which requires no data input, but only a macro
selection by the user. It draws the average calls from the “Actual Calls” tab and rounds the
values into whole numbers to be used in the math program. Here, we have several choices of
whether we want to round up, round down, or just round normally. This gives us better options
if parameters do not allow for a feasible solution to be found. This would only happen because
there is no combination of schedules that can cover the forecast that was defined, so we must try
to use a different demand schedule. For instance, if using the “round up” numbers brings an
error, we can use either “round” or “round down” because there is a chance that these will come
Katherine M. Perry
35
up with solutions. Above each column is a button to choose that rounding function as the
demand. Simply press the gray button to choose your demand.
Also, built into this tab is an option to account for vacancy in the original demand. This is
based on the estimate that on any given day, 75% of scheduled employees will not show up for
some reason. Here, you can select the demand to be based on the number of employees needed
divided by 0.75. This means if a feasible solution exists for number of employees demanded with
vacancy, all of the staff gap with vacancy will show full coverage.
Demand – This calculation tab is here strictly for use by the macro for optimization. Nothing
is needed to be done by the user here. This is where the selected demand is put and later
extracted by the program.
Parameters – This user input tab has the options to choose the following parameters:
1. Number of 8-hour employees
2. Number of 10-hour employees
3. Maximum and minimum time between start time and break 1 for both 8 and 10-
hour employees
4. Maximum and minimum time between break 1 and lunch for both 8 and 10-hour
employees
5. Maximum and minimum time between lunch and break 2 for both 8 and 10-hour
employees
6. Maximum and minimum time between break 2 and end time for both 8 and 10-
hour employees
Katherine M. Perry
36
These parameters are the cells colored in gray. None of the other cells should be messed with
– they are for the program to use in schedule generation.
This sheet also contains the three main macros. These will be described in detail in the next
section, they are:
1. Generate Schedules
2. Optimize
3. Minimize Staff Size
Schedules – This is the sheet where all possible schedules are input. This is not to be changed
by the user. It is where the macro places schedules.
Detailed Schedules – This is another sheet involved strictly in the macro calculations and
optimization. It contains a binary description of the schedules, and contains the cells in which the
optimization program minimizes over. These binary schedules correspond to the parameters ���
and ��� in the model previously discussed in section 2.4.2 where i corresponds to the rows
containing 10-hour schedules, j corresponds to the rows containing 8-hour schedules, and t
corresponds to the columns with 30-minute periods. To the right of the schedules, it shows the
number of employees on schedule for each time period on each day, the number of employees
defined by the demand for each time period on each day, and finally it calculates the difference
in number of employees working and the number needed (the objective function for objective
#1).
Final Schedule – This sheet is for the user to get a good visual of the actual schedules. It
identifies each schedule by fifteen-minute period (which was requested by the original client),
and identifies 8 or 10-hour employee as well as what day the 10-hour employees have off. This is
Katherine M. Perry
37
designed in the original format the call center manager used before any automation was done.
This page is important mostly for its ease of reading schedules and its aesthetics.
Gap Analysis – This determines the accuracy of our schedule in terms of call-center metrics.
This compares the estimated metric results based on different schedules. It gives visibility of
which schedule combinations result in better service. The basis of these calculations is described
in the experiment chapter.
2.3.4 Macros
In order to minimize the work the user must do, there are three macros which have been
created. They do all of the work necessary with just the click of a button. Some basic
descriptions of what they do are:
Generate Schedules – This creates a list of every schedule possible that follows all
parameters of minimum and maximum time between start, breaks, and lunches for 8 and 10-hour
employees. This is the preparation step in the optimization process. The schedules which it
produces are the variables involved. This is typically the longest time commitment and will
continue until every possible schedule has been documented. It also checks to make sure that no
formulas have been messed up or deleted within the worksheet. More specifically, it checks to
make sure the length of time between the end of break 2 to the end of the day meets the
parameters defined by the user. This is necessary because the way the macro is built to generate
schedules, it builds all feasible schedules up to the last parameters, then must look back and
remove those which aren’t correct. Also, this macro re-prints all formulas which are found in the
“Detailed Schedules” and “Schedules” sheet. This guarantees that the optimization model will
still work properly even if formulas had been accidentally changed by the user.
Katherine M. Perry
38
Optimize – This macro will input the first math model into the optimization engine and run
the program. If an optimal solution is found, then it will neatly print the optimal schedule into the
“Final Schedule” tab as well as insert the right data into the “Gap Analysis” tab and calculate the
metrics.
Minimize Staff Size – This macro is very similar to the “Optimize” macro, but will input the
second math model into the optimization engine. If an optimal solution is found, it will print the
resulting schedule in to the “Final Schedule” and again input data into “Gap Analysis” and
calculate metrics associated.
This combination of macros is important to understand. For any set of minimum and
maximum parameters, the “Generate Schedules” tab only needs to be run once. As long as those
parameters remain the same, the user can change number of employees and run either math
program: “Optimize” or “Minimize Staff Size” without having to reproduce potential schedules.
This is important in terms of efficiency since one does not have to continually wait for schedules
to be generated. With the restricted scheduling parameters from table 2.1, it only takes less than
20 seconds to generate schedules, but depending on the number of schedules that can be created
by the defined set of parameters, it could take over an hour to produce all the schedules. Not
having to reproduce this step each time the program is run is crucial for efficiency.
2.3.5 Implementation Challenges
This work is an extension of a class project for OPER 639 Practical Optimization. The
macros for the project spreadsheet had less functionality and produced erroneous and poorly-
formatted output. The deficiencies of the project implementation prevented deployment. One
error was that the parameters for time between breaks were not satisfied by candidate schedule.
Katherine M. Perry
39
It quickly became apparent that the tool was not following these constraints in the schedule
generation step and was completely ignoring the parameter to choose the time between break 2
and the end of the day. Additionally, the time between breaks were based on the beginning of
breaks and the beginning of lunches. Doing so will shorten the minimum time between breaks by
however long the first break is. For example, if lunch is at 12:00 and the minimum time between
is 1 hour 30 minutes, then the scheduling tool would allow break 2 to begin at 1:30. This means
there is only a 1 hour break between the end of lunch and the beginning of the next break, thus
being an infeasible schedule.
Another error in the original tool was that it was taking too long to generate schedules. This
was due to the large amount of formulas that were changing within the spreadsheet. By
strategically placing automatic calculations to manual within the macro code, we can increase the
speed without losing any important calculations in the process. Generating schedules for the
restricted scheduling parameters (table 2.1) took approximately 10 minutes to finish, and this
time was shaved down to approximately 10.5 seconds after manipulating when calculations are
automatic and when they are manual.
Throughout the spreadsheet, there were multiple small errors including logic mistakes in
formulas, rounding errors, and ranges that did not extend far enough, which were simple fixes
and just required identifying that there was an issue in the first place. The last big problem
occurs when more than 200 potential schedules are created. The problem is that Excel Solver can
only optimize over 200 variables. So, when parameters are broadened, the program cannot be run
without deleting some of the schedules – thus losing the guarantee that the program will find the
optimal solution. To combat this issue, a new optimization engine needed to be implemented.
Katherine M. Perry
40
OpenSolver is an open source Excel plug-in which does not have bounds on number of
variables which makes it the perfect solution for this problem [12]. Installing the program is not
difficult and can be permanently kept in Excel as an add-in (see appendix for instructions). Only
small changes to the macros are necessary when switching to OpenSolver which made for a
smooth transition.
Now, with a fully functional program that we can rely on to produce correct schedules, it is
important to focus on ease of use and convenience for the user. This means we want the inputs
to all be in simple formats and the output to be in a format that mimics that of a real schedule.
Although these things are nonessential for solving the model, it is incredibly important for the
client to have a readable interface. This tool was created specifically to align with all current
data for demand inputs as well as output of the schedule and calculating metrics. On the front-
end, the input data for number of calls per time period keeps original format and automatically
calculates averages, sends these numbers to the demand input and allows for easy selection of the
proper demand to use for optimization. Inputting the parameters for number of employees and
time periods between breaks is also very easy to use and requires no further effort than simply
typing the information in the proper boxes. On the back-end of the tool, the schedules are
formatted in the original client spreadsheet layout for an easy view by the client as well as all
managers that need to make sure the schedule is being followed by employees. It also
automatically calculates all metrics that are wanted by the client, so no further analysis is needed
on his part. Having a constant view of this is very beneficial. The effort put in to formatting the
input and output functions of the tool is well worth it because it means that the client does not
need to adjust his current practices to implement the scheduling tool. Having a familiar interface
is very important for a smooth transition into the business.
Katherine M. Perry
41
Chapter 3: Empirical Evaluation of Spreadsheet
Scheduling Tool
3.1 Schedule Metrics
In comparing methods of generating schedules, we want to look at final metric calculations
(found in the “Gap Analysis” tab) as well as the length of time it takes to solve. The metric we
look for in Gap Analysis is called the normal staff gap. It is the difference between demand and
number of employees that are working at the 30-minute time period. This will define which
schedule sets are better than others. The goal is to have more employees than demanded for each
time period.
The normal staff gap should always be negative, since the math program requires the number
of employees scheduled be greater than the number of employees demanded at every time
period. However, there is a general rule of thumb that on any given day, there is a 25%
employee vacancy. This is when an employee is scheduled to come to work, but does not show
up at the last minute. Basically, it is an unexpected absence (not including vacations, holidays, or
planned time off). This is vital to calculations of metrics because we want to be able to cover the
calls for these vacant employees.
Katherine M. Perry
42
So, to calculate the normal staff gap while accounting for vacancies, we need to divide the
number of employees scheduled and multiply by 0.75. This will give us the estimated number of
employees that will be working at any time period. Now, we find the difference in number of
employees scheduled with vacancy and number of employees demanded. This is what we really
want to compare.
3.2 Comparison
Here, we will see how much better using the new spreadsheet model really is. We will
examine the two main areas for improvement:
1. Normal Staff Gap (with and without vacancy)
2. Time it takes to create schedules
With improvements in these two areas, we have addressed our core goals of ease, efficiency,
and accuracy.
3.2.1 Normal Staff Gap
Average normal staff gap is the average difference in number of employees demanded and
scheduled. A negative number is desirable, meaning that the number needed is less than that
available. Maximum staff gap is the maximum difference in employees demanded and
scheduled over all time periods.
Average staff gap with vacancy is the average difference in number of employees demanded
and scheduled including the 25% vacancy. Again, negative numbers are desirable, which this
Katherine M. Perry
43
means there are on average more employees scheduled than demanded per time period. The
maximum staff gap with vacancy is the maximum difference in employees demanded and
scheduled over all time periods while taking into account 25% vacancy. The metrics with
vacancy accounted for are the most important ones to compare, because they are the most likely
outcomes.
Gap Analysis Metric coloration:
To increase visibility of how well the schedule meets the goals, the cells have a color coded
circle to the left of the value. They are either red, yellow, or green – and the “very red” category
is a subset of the red and means the value is positive and thus we have fewer employees working
than demanded for the given time period. Very red is the only color which indicates a complete
miss in scheduling employees:
Red – Danger – staff gap is less than or equal to 0.0 and greater than -0.5
Yellow – Warning – staff gap is less than or equal to -0.5 and greater than -1.0
Green – Good – staff gap is less than or equal to -1.0
Very Red – Understaffed – staff gap is greater than 0
We will compare three scheduling plans:
1. The manual scheduling plan created by the call center manager
2. The automated scheduling plan using comprehensive scheduling pool
3. The automated scheduling plan using restricted scheduling pool
Katherine M. Perry
44
The manual plan (1) is the scheduling plan created by the call center manager which sparked
the need for this scheduling tool. It was created to meet certain parameters, but had to break
some of the rules of how long employees must work between breaks. Our goal is to improve the
metrics that came from this schedule. In order to compare how using this automated scheduling
tool will be more effective than manually, we needed to assess the parameters that were actually
used in the manual scheduling plan. The lengths of time between breaks by the manual schedule
were sometimes shorter and sometimes longer than what was requested for this program.
The automated scheduling plan using comprehensive scheduling pool (2) is the plan which
implements the same time parameters as the manual scheduling plan (1), but is scheduled by
using the optimization program. The automated scheduling plan using restricted scheduling pool
(3) is the set of parameters which were requested by the client while being introduced to this
problem (refer to table 2.1). The differences in the minimum and maximum times between
breaks for both 8 and 10 hour employees can be seen in the tables below:

Katherine M. Perry
45
Table 3.1: Parameters of comprehensive scheduling pool (plans 1 & 2) vs. parameters of restricted scheduling pool (plan 3) for 8-hour employees. Note that the parameters that were originally used for scheduling were much wider than what he asked for the times to be. This means there is a lack of uniformity and creates longer lengths of working without any break.
Parameters of comprehensive
scheduling pool
Parameters of restricted
scheduling pool
8-hour employees Minimum Maximum Minimum Maximum
Time from start of
day to break 1
1:30 3:00 1:30 2:00
Time from end of
break 1 to lunch
0:30 3:45 1:30 2:00
Time from end of
lunch to break 2
1:00 4:00 1:30 2:00
Time from end of
break 2 to end of
day
1:00 2:30 1:30 2:00
Table 3.2: Parameters of comprehensive scheduling pool (plans 1 & 2) vs. parameters of restricted scheduling pool (plan 3) for 10-hour employees. Again, these originally used parameters are much wider than what is wanted. It shows that employees can work over 4 hours without getting a break.
Parameters of comprehensive
scheduling pool
Parameters of restricted
scheduling pool
10-hour employees Minimum Maximum Minimum Maximum
Time from start of
day to break 1
1:00 2:00 1:30 3:00
Time from end of
break 1 to lunch
1:30 4:30 1:30 2:00
Time from end of
lunch to break 2
1:00 3:00 1:30 2:00
Time from end of
break 2 to end of day
1:00 4:00 1:30 3:00
Katherine M. Perry
46
As we can see, in the case of both 8 and 10 hour employees, the parameters has much smaller
minimum break times and larger maximum break times for scheduling plans (1) and (2), where
scheduling plan (3) will be the benchmark set of parameters as requested by the client.
On top of using different parameters for time between breaks, the client sometimes had the
human error of giving too many breaks as well as setting the end time 15 minutes too late in the
manual scheduling plan. His errors in breaks and length of work day have been adjusted for
accurate comparison.
The manual scheduling plan (1) completed by the client yielded the following:
Average Normal Staff Gap: -2.62
Max: 0.86
Number of time periods in the red: 3
Number of time periods in the yellow: 3
Number of time periods in the green: 18
Number of time periods in the VERY red (positive): 3
Average Staff Gap w/ Vacancy: 0.46
Max: 4.36
Number of time periods in the red: 16
Number of time periods in the yellow: 0
Number of time periods in the green: 8
Number of time periods in the VERY red (positive): 15
Using the scheduling tool, the automated scheduling plan using comprehensive scheduling
pool (2) yielded the following metrics:
Katherine M. Perry
47
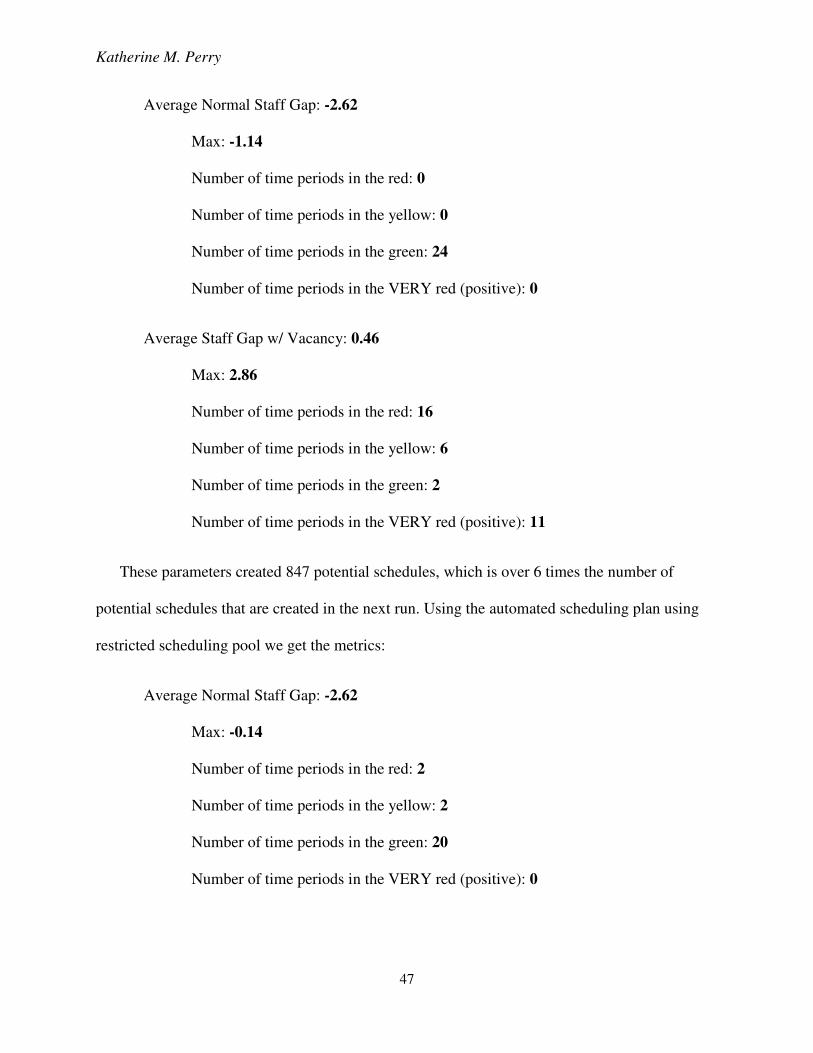
Average Normal Staff Gap: -2.62
Max: -1.14
Number of time periods in the red: 0
Number of time periods in the yellow: 0
Number of time periods in the green: 24
Number of time periods in the VERY red (positive): 0
Average Staff Gap w/ Vacancy: 0.46
Max: 2.86
Number of time periods in the red: 16
Number of time periods in the yellow: 6
Number of time periods in the green: 2
Number of time periods in the VERY red (positive): 11
These parameters created 847 potential schedules, which is over 6 times the number of
potential schedules that are created in the next run. Using the automated scheduling plan using
restricted scheduling pool we get the metrics:
Average Normal Staff Gap: -2.62
Max: -0.14
Number of time periods in the red: 2
Number of time periods in the yellow: 2
Number of time periods in the green: 20
Number of time periods in the VERY red (positive): 0
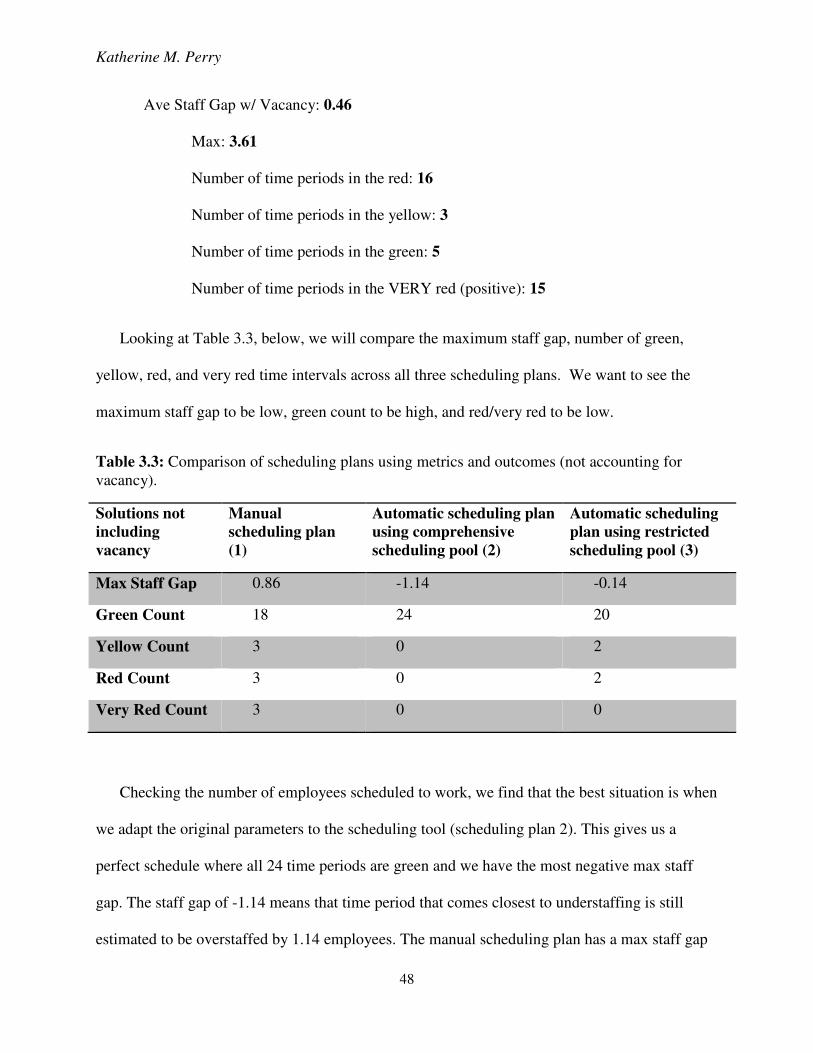
Katherine M. Perry
48
Ave Staff Gap w/ Vacancy: 0.46
Max: 3.61
Number of time periods in the red: 16
Number of time periods in the yellow: 3
Number of time periods in the green: 5
Number of time periods in the VERY red (positive): 15
Looking at Table 3.3, below, we will compare the maximum staff gap, number of green,
yellow, red, and very red time intervals across all three scheduling plans. We want to see the
maximum staff gap to be low, green count to be high, and red/very red to be low.
Table 3.3: Comparison of scheduling plans using metrics and outcomes (not accounting for vacancy).
Solutions not
including
vacancy
Manual
scheduling plan
(1)
Automatic scheduling plan
using comprehensive
scheduling pool (2)
Automatic scheduling
plan using restricted
scheduling pool (3)
Max Staff Gap 0.86 -1.14 -0.14
Green Count 18 24 20
Yellow Count 3 0 2
Red Count 3 0 2
Very Red Count 3 0 0
Checking the number of employees scheduled to work, we find that the best situation is when
we adapt the original parameters to the scheduling tool (scheduling plan 2). This gives us a
perfect schedule where all 24 time periods are green and we have the most negative max staff
gap. The staff gap of -1.14 means that time period that comes closest to understaffing is still
estimated to be overstaffed by 1.14 employees. The manual scheduling plan has a max staff gap
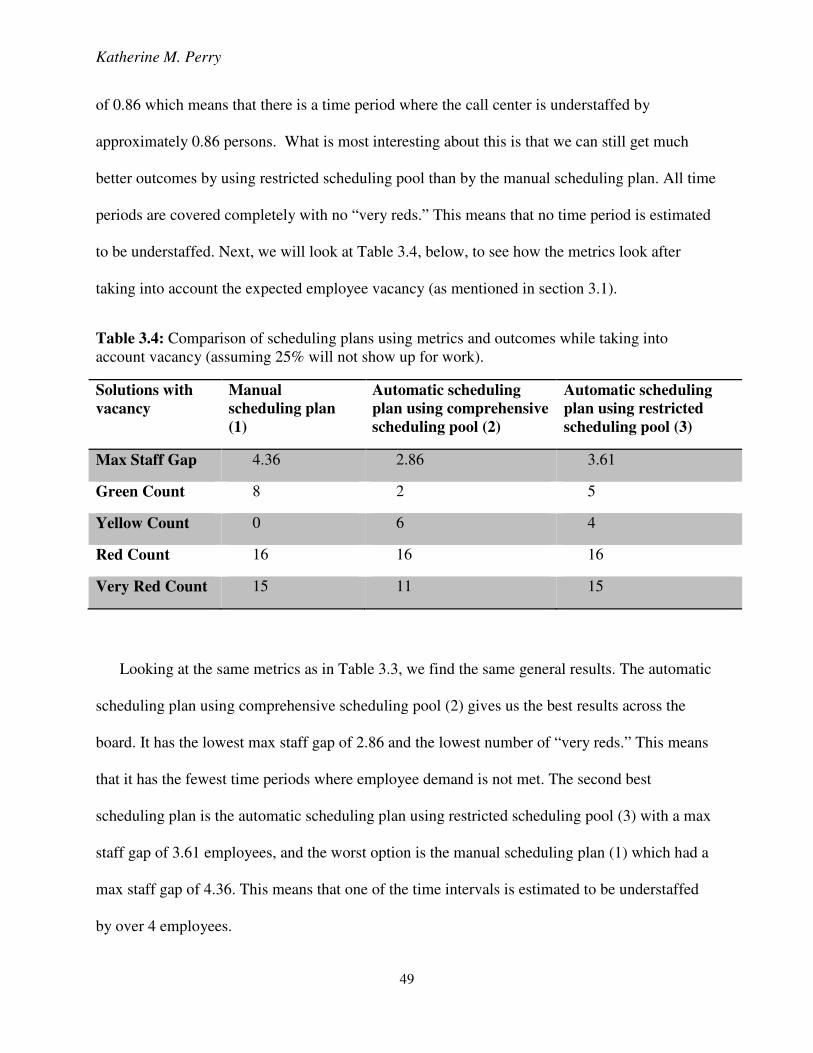
Katherine M. Perry
49
of 0.86 which means that there is a time period where the call center is understaffed by
approximately 0.86 persons. What is most interesting about this is that we can still get much
better outcomes by using restricted scheduling pool than by the manual scheduling plan. All time
periods are covered completely with no “very reds.” This means that no time period is estimated
to be understaffed. Next, we will look at Table 3.4, below, to see how the metrics look after
taking into account the expected employee vacancy (as mentioned in section 3.1).
Table 3.4: Comparison of scheduling plans using metrics and outcomes while taking into account vacancy (assuming 25% will not show up for work).
Solutions with
vacancy
Manual
scheduling plan
(1)
Automatic scheduling
plan using comprehensive
scheduling pool (2)
Automatic scheduling
plan using restricted
scheduling pool (3)
Max Staff Gap 4.36 2.86 3.61
Green Count 8 2 5
Yellow Count 0 6 4
Red Count 16 16 16
Very Red Count 15 11 15
Looking at the same metrics as in Table 3.3, we find the same general results. The automatic
scheduling plan using comprehensive scheduling pool (2) gives us the best results across the
board. It has the lowest max staff gap of 2.86 and the lowest number of “very reds.” This means
that it has the fewest time periods where employee demand is not met. The second best
scheduling plan is the automatic scheduling plan using restricted scheduling pool (3) with a max
staff gap of 3.61 employees, and the worst option is the manual scheduling plan (1) which had a
max staff gap of 4.36. This means that one of the time intervals is estimated to be understaffed
by over 4 employees.
Katherine M. Perry
50
Using the scheduling tool is guaranteed to give the same or better solutions than manually
given the same parameters. Also, we find that the broader the range of minimum and maximum
times between breaks, the better the metrics will be. This is based on the fact that scheduling
plan (2) has better outcomes than scheduling plan (3). Having broader parameters creates a
better solution because there are more variables (potential schedules) to be taken into account,
thus giving more options for a final schedule.
3.2.2 Run-time Comparison
The original tool was built and used the optimization software Excel Solver, which is add-in
that is commonly used for optimization. After trying a new optimization engine, OpenSolver, we
found that it significantly decreased the time elapsed for an optimal solution to be found.
The manual scheduling plan completed by the client took approximately 1 week off and on to
build by hand. When asked to estimate number of hours spent on strictly developing and
assigning schedules, the client estimated at least 15 hours.
With the new optimization tool with OpenSolver using the comprehensive scheduling pool, it
took approximately 19 minutes, 30 seconds to solve (16 minutes to generate schedules and 3
minutes 30 seconds to find optimal solution). This produced 837 potential schedules, so this set
of parameters could not be completed using the original tool’s Excel Solver because it yielded
too many potential schedules. Excel Solver can only handle 200 variables, so any set of potential
schedules that exceeds this cannot be completed with this add-in.
When running the scheduling tool with OpenSolver using the restricted scheduling pool, it
yields a run-time of 25.2 seconds (10.5 seconds to generate schedules and 14.7 seconds to find
optimal solution) and produced 134 potential schedules. Since these parameters produced less
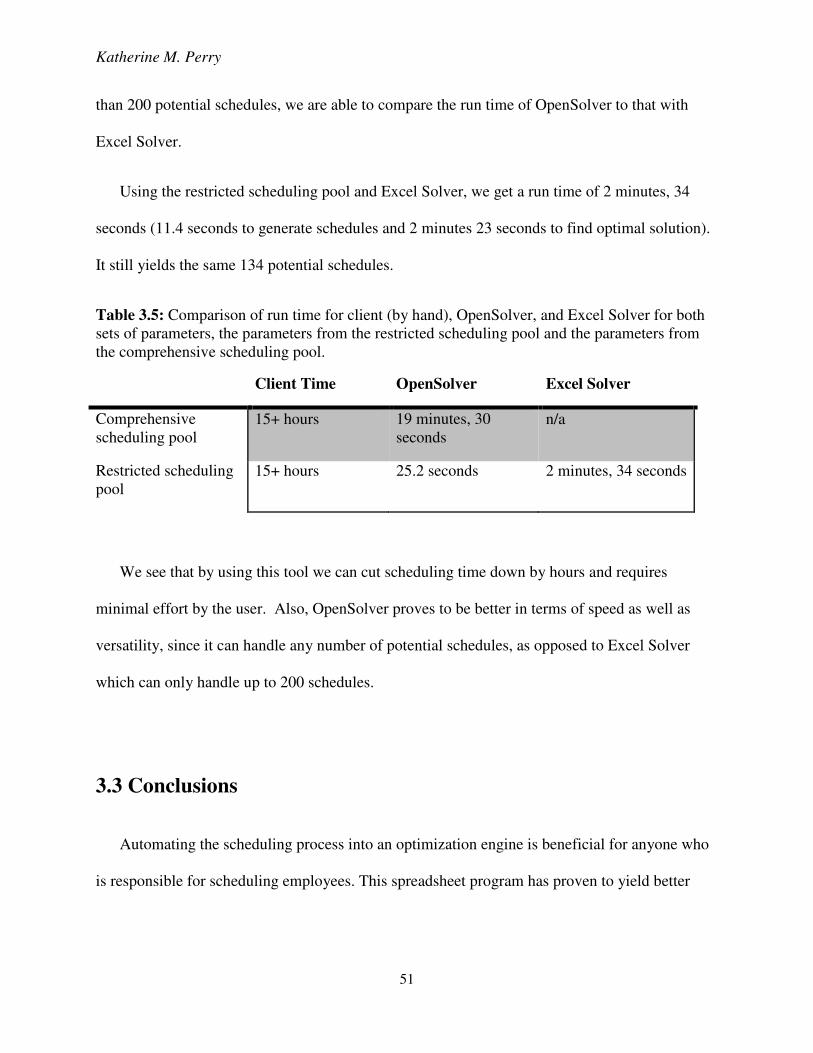
Katherine M. Perry
51
than 200 potential schedules, we are able to compare the run time of OpenSolver to that with
Excel Solver.
Using the restricted scheduling pool and Excel Solver, we get a run time of 2 minutes, 34
seconds (11.4 seconds to generate schedules and 2 minutes 23 seconds to find optimal solution).
It still yields the same 134 potential schedules.
Table 3.5: Comparison of run time for client (by hand), OpenSolver, and Excel Solver for both sets of parameters, the parameters from the restricted scheduling pool and the parameters from the comprehensive scheduling pool.
Client Time OpenSolver Excel Solver
Comprehensive scheduling pool
15+ hours 19 minutes, 30 seconds
n/a
Restricted scheduling pool
15+ hours 25.2 seconds 2 minutes, 34 seconds
We see that by using this tool we can cut scheduling time down by hours and requires
minimal effort by the user. Also, OpenSolver proves to be better in terms of speed as well as
versatility, since it can handle any number of potential schedules, as opposed to Excel Solver
which can only handle up to 200 schedules.
3.3 Conclusions
Automating the scheduling process into an optimization engine is beneficial for anyone who
is responsible for scheduling employees. This spreadsheet program has proven to yield better
Katherine M. Perry
52
metrics, shorten time spent creating schedules, and guarantee the best solutions which follow all
rules defined in the parameters. This eliminates the issue of human error when creating by hand.
Aside from finding the best solution, it is incredibly easy to use and easy to adjust. The user
gets flexibility in setting number of employees and time spacing requirements between breaks.
Other constraints are not as easy to adjust but certainly possible, such as length of breaks and
number of breaks. The custom output which caters to the needs of the original client is nicely
formatted and a good view for any manager that wishes to use it. The benefit of using this tool
far surpasses the costs – which are only the time it takes to install and learn. There are no costs in
any of the add-ins used as long as Microsoft Excel is available. The tool is fast, easy, and
contained in one excel spreadsheet to eliminate any confusion with multiple files. Custom
programs for optimization such as this are become a vital part of the world today as decisions
need to be made quickly, so that people can move onto other matters. Using this tool, we are
able to decrease the amount of time to create schedules from approximately 15 hours of manual
work to 25.2 seconds. When scheduling employees manually, it is easy to allow understaffing to
slip through the cracks. Now, we are able to improve the accuracy of meeting the forecast –
guaranteeing all manpower demand is met. This scheduling tool has proven the benefits of
analyzing current practice of call center scheduling and implementing a fast, accurate, and
reliable optimization program.
Katherine M. Perry
53
References
[1] Abboud, N., Inuiguchi, M., Sakawa, M. Uemura, Y. (1998) Manpower Allocation Using Genetic Annealing. European Journal of Operational Research, 111, 405-420.
[2] Ashley, David. (1995) A Spreadsheet Optimization System for Library Staff Scheduling.
Computers Operations Research, 22 No. 6, 615-624. [3] Baker, K. & Magazine, M. (1977) Workforce Scheduling with Cyclic Demands and Day-off
Constraints. Management Science, 24 No. 2. [4] Brigandi, A., Dargon, D., Sheehan, M., Spencer, T. III. (1994) AT&Ts Call Processing
Simulator (CAPS) Operational Design for Inbound Call Centers. Interfaces, 24 No. 1, 6-28.
[5] Caprara, A., Monaci, M., Toth, P. (2003) Models and Algorithms for a Staff Scheduling
Problem. Mathematical Programming, 98, 445-476. [6] Dantzig, George. (1954) Traffic Delays at Toll Booths. Journal of the Operations Research
Society of America, 2 No. 3, 339-341. [7] Easton, F., Rossin, D. (1991) Sufficient Working Subsets for the Tour Scheduling Problem.
Management Science, 37 No. 11, 1441-1451. [8] Eksioglu, S., Seref, M., Ahuja, R., & Winston, W. (2011) Developing Spreadsheet-Based
Decision Support Systems Using Excel and VBA for Excel: Second Edition. Dynamic
Ideas.
[9] Ernst, A.T., Jiang, H., Krishnamoorthy, M., Sier, D. (2003) Staff Scheduling and Rostering: A Review of Applications, Methods and Models. European Journal of Operational
Research, 153, 3-27. [10] Glover, F., McMillan, C. (1986) The General Employee Scheduling Problem: An
Integration of MS and AI. Computer & Operations Research, 13 No. 5, 563-573. [11] Love, R. & Hoey, J. (1990) Management Science Improves Fast-Food Operations.
Interfaces, 20 No. 2, 21-29. [12] Mason, A., & Dunning, I. (2010) OpenSolver: Open Source Optimisation for Excel.
Proceedings of the 45th Annual Conference of the ORSNZ, November 2010. Auckland,
181-190.
Katherine M. Perry
54
[13] Mehrotra, Vijay. (1997) Ringing Up Big Business. OR/MS Today, August, 1997, www.orms-today.org/orms-8-97/CallCenter.html.
[14] Morris, J. & Showalter, M. (1983) Simple Approaches to Shift, Days-off and Tour
Scheduling Problem. Management Science, 28 No. 8, 942-950. [15] Rottembourg, B. () Call Center Scheduling. Direction des Technologies Nouvelles,
www.decisioncraft.com. [16] Taylor, P. & Huxley, S. (1989) A Break from Tradition for the San Francisco Police: Patrol
Officer Scheduling Using an Optimization-Based Decision Support System. Interfaces, 19 No. 1, 4-24.
[17] Tien, J., Kamiyama, A. (1982) On Manpower Scheduling Algorithms. SIAM Review, 25 No.
3, 275-287. [18] Vohra, Rakesh. (1988) A Quick Heuristic for Some Cyclic Staffing Problems with Breaks.
The Journal of the Operational Research Society, 39 No. 11, 1057-1061. [19] Williams, H. Paul. (1999) Model Building in Mathematical Programming: Fourth Edition.
Wiley. [20] Winston, W. L., & Venkataramanan, M. (2003) Introduction to Mathematical Programming.
Operations Research: Volume 1. Thomson Brooks/Cole.
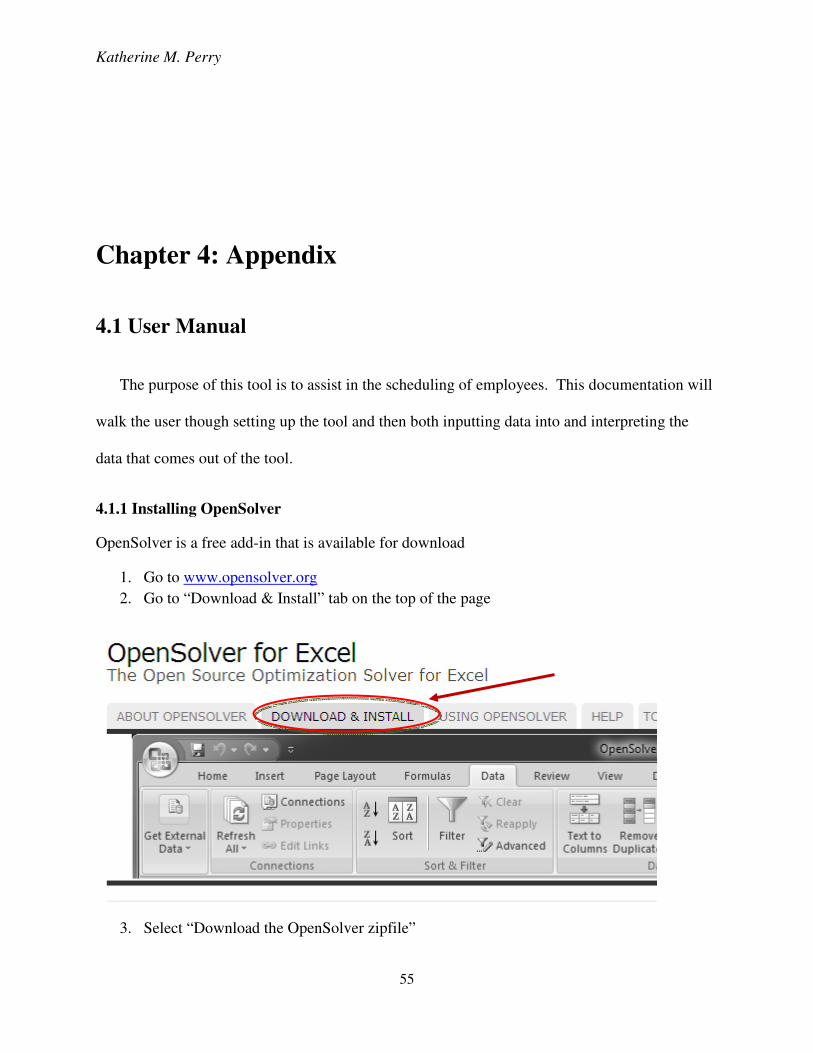
Katherine M. Perry
55
Chapter 4: Appendix
4.1 User Manual
The purpose of this tool is to assist in the scheduling of employees. This documentation will
walk the user though setting up the tool and then both inputting data into and interpreting the
data that comes out of the tool.
4.1.1 Installing OpenSolver
OpenSolver is a free add-in that is available for download
1. Go to www.opensolver.org
2. Go to “Download & Install” tab on the top of the page
3. Select “Download the OpenSolver zipfile”
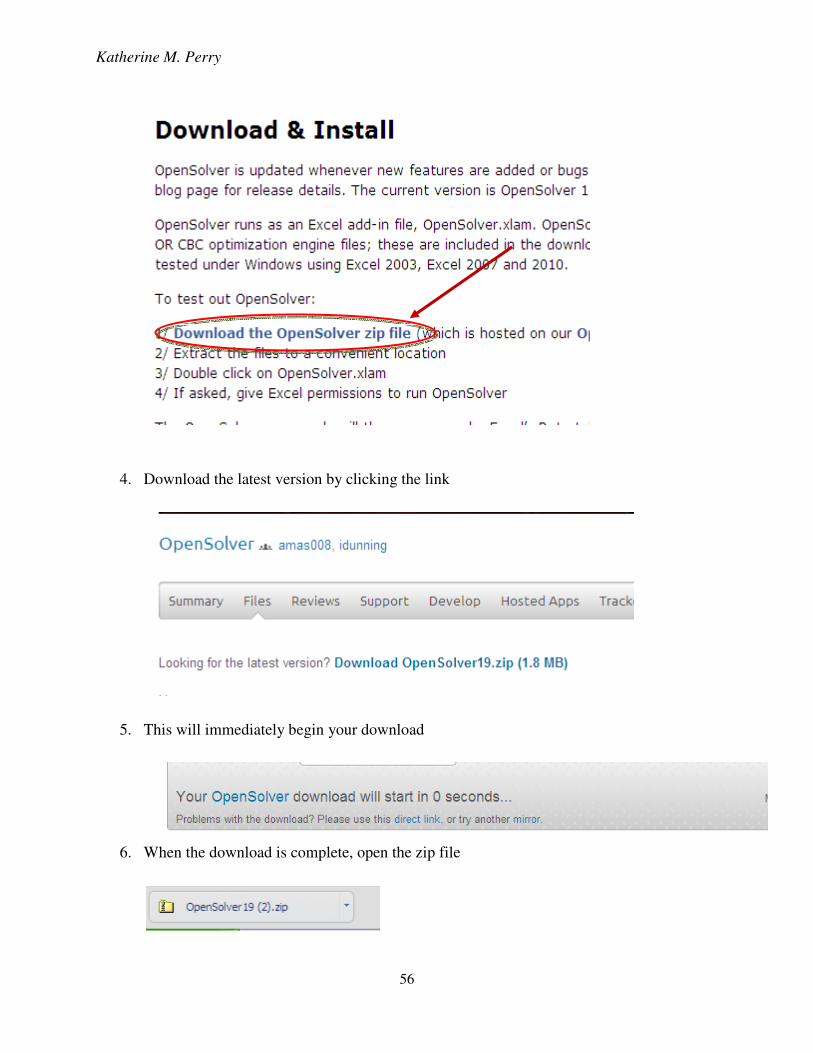
Katherine M. Perry
56
4. Download the latest version by clicking the link
5. This will immediately begin your download
6. When the download is complete, open the zip file
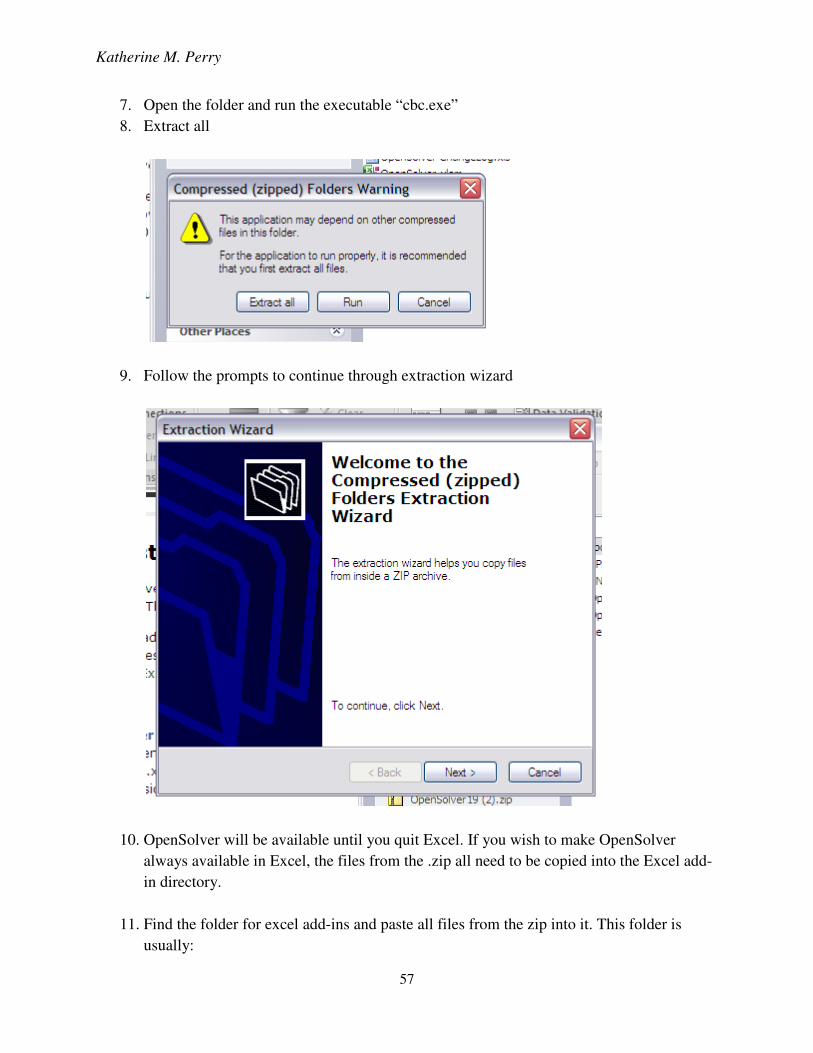
Katherine M. Perry
57
7. Open the folder and run the executable “cbc.exe”
8. Extract all
9. Follow the prompts to continue through extraction wizard
10. OpenSolver will be available until you quit Excel. If you wish to make OpenSolver
always available in Excel, the files from the .zip all need to be copied into the Excel add-
in directory.
11. Find the folder for excel add-ins and paste all files from the zip into it. This folder is
usually:
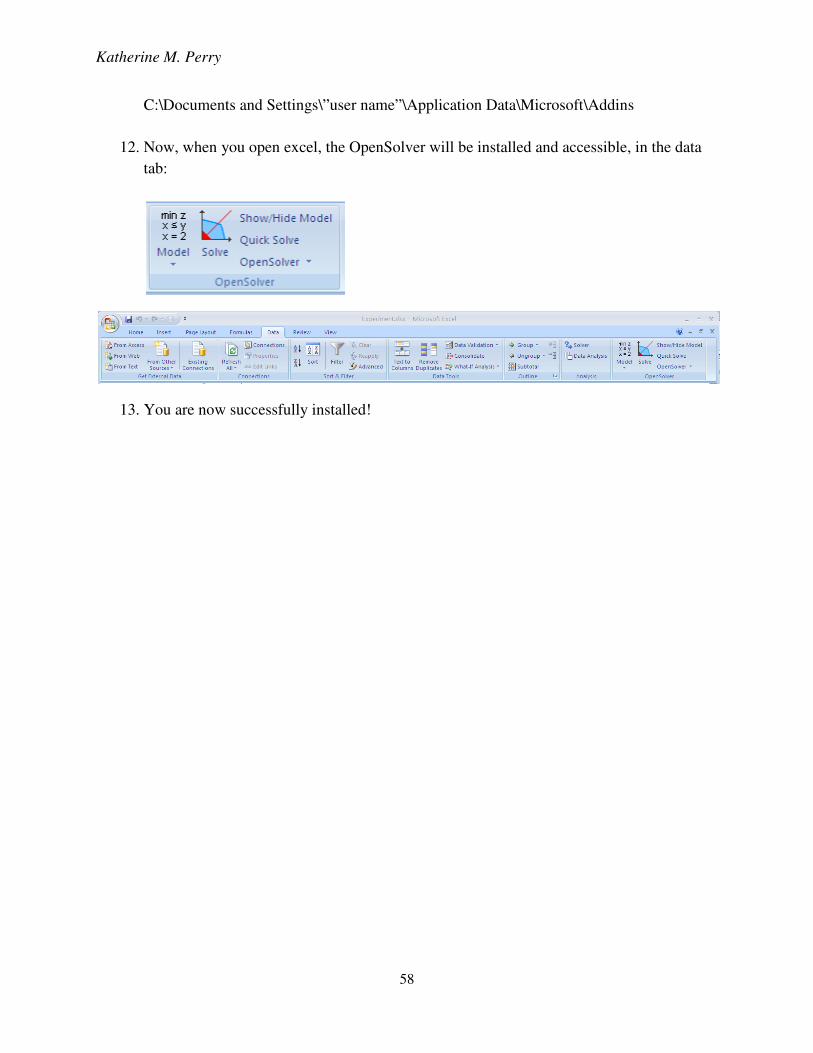
Katherine M. Perry
58
C:\Documents and Settings\”user name”\Application Data\Microsoft\Addins
12. Now, when you open excel, the OpenSolver will be installed and accessible, in the data
tab:
13. You are now successfully installed!
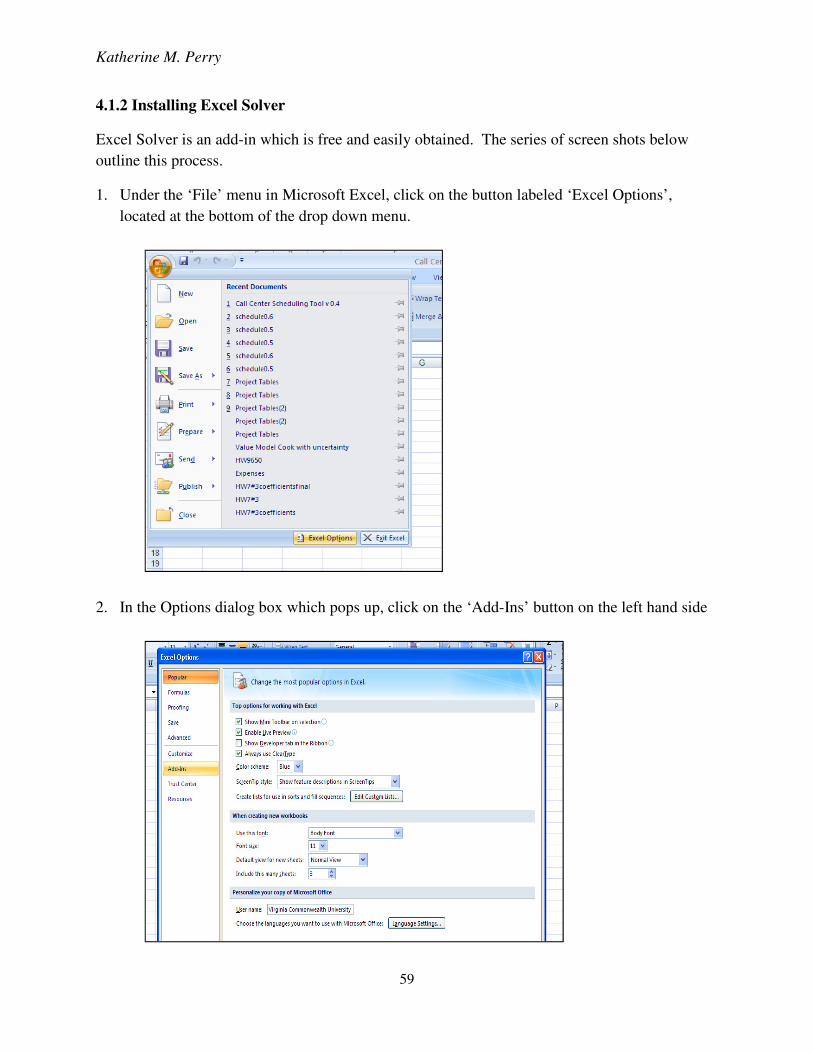
Katherine M. Perry
59
4.1.2 Installing Excel Solver
Excel Solver is an add-in which is free and easily obtained. The series of screen shots below
outline this process.
1. Under the ‘File’ menu in Microsoft Excel, click on the button labeled ‘Excel Options’,
located at the bottom of the drop down menu.
2. In the Options dialog box which pops up, click on the ‘Add-Ins’ button on the left hand side
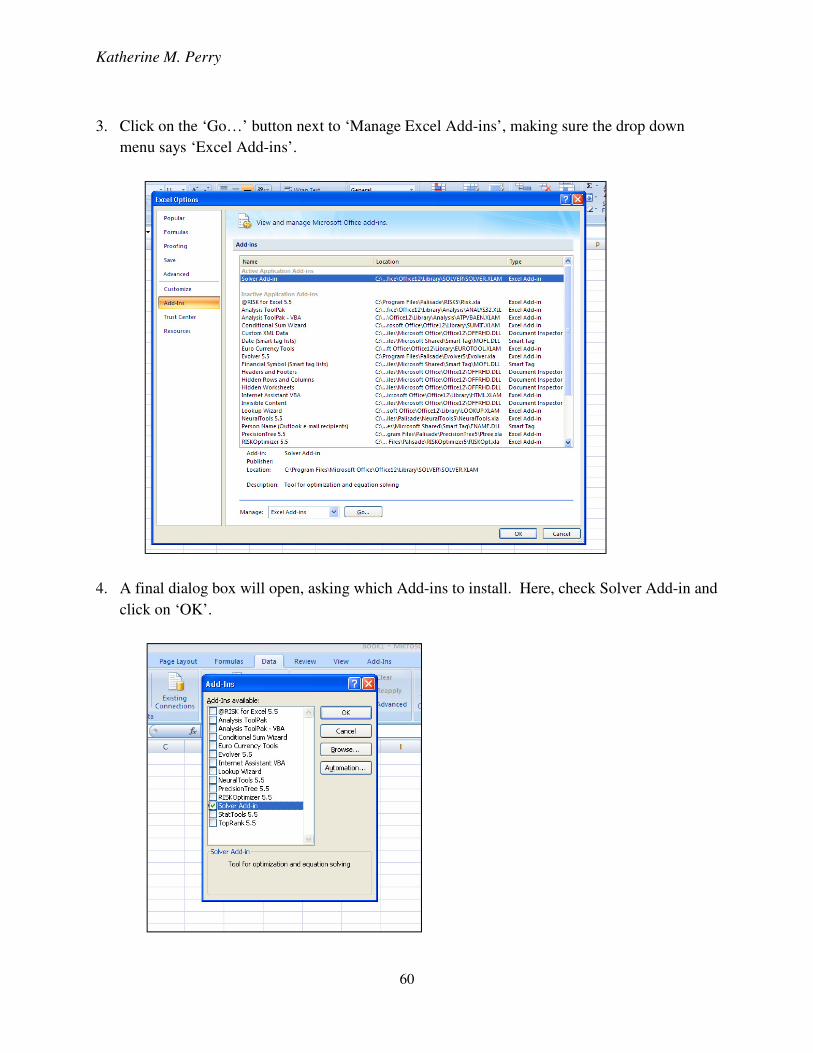
Katherine M. Perry
60
3. Click on the ‘Go…’ button next to ‘Manage Excel Add-ins’, making sure the drop down
menu says ‘Excel Add-ins’.
4. A final dialog box will open, asking which Add-ins to install. Here, check Solver Add-in and
click on ‘OK’.
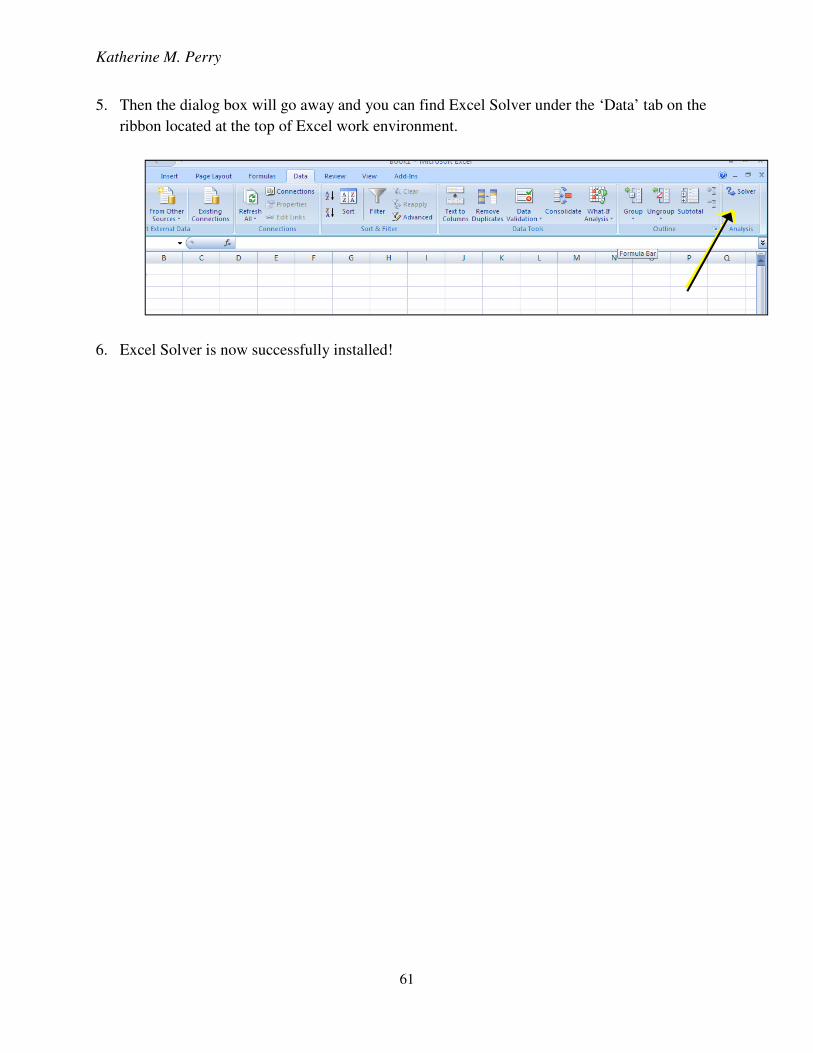
Katherine M. Perry
61
5. Then the dialog box will go away and you can find Excel Solver under the ‘Data’ tab on the
ribbon located at the top of Excel work environment.
6. Excel Solver is now successfully installed!
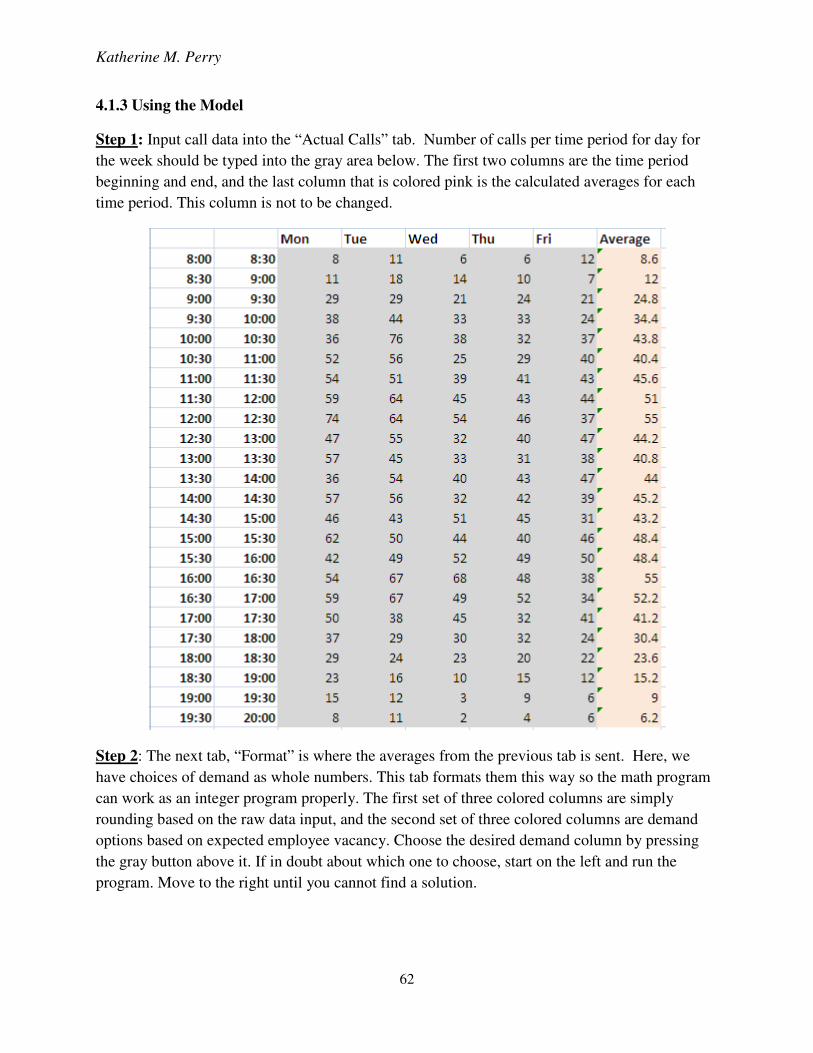
Katherine M. Perry
62
4.1.3 Using the Model
Step 1: Input call data into the “Actual Calls” tab. Number of calls per time period for day for
the week should be typed into the gray area below. The first two columns are the time period
beginning and end, and the last column that is colored pink is the calculated averages for each
time period. This column is not to be changed.
Step 2: The next tab, “Format” is where the averages from the previous tab is sent. Here, we
have choices of demand as whole numbers. This tab formats them this way so the math program
can work as an integer program properly. The first set of three colored columns are simply
rounding based on the raw data input, and the second set of three colored columns are demand
options based on expected employee vacancy. Choose the desired demand column by pressing
the gray button above it. If in doubt about which one to choose, start on the left and run the
program. Move to the right until you cannot find a solution.
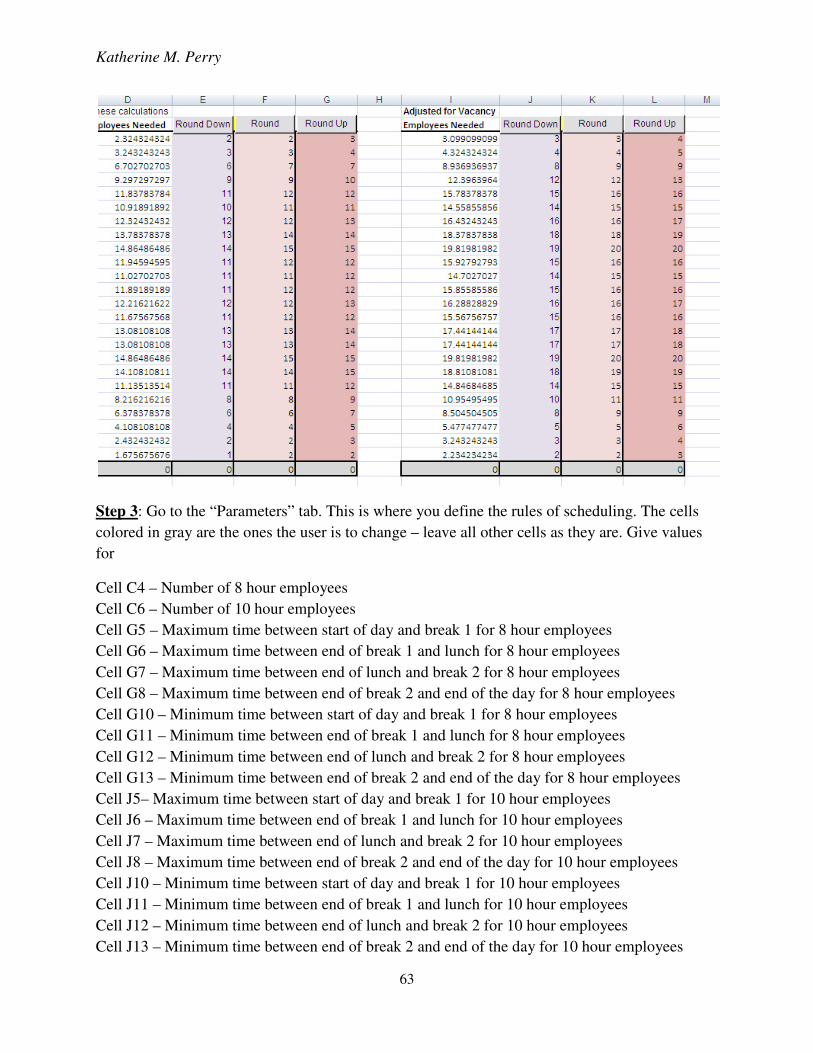
Katherine M. Perry
63
Step 3: Go to the “Parameters” tab. This is where you define the rules of scheduling. The cells
colored in gray are the ones the user is to change – leave all other cells as they are. Give values
for
Cell C4 – Number of 8 hour employees
Cell C6 – Number of 10 hour employees
Cell G5 – Maximum time between start of day and break 1 for 8 hour employees
Cell G6 – Maximum time between end of break 1 and lunch for 8 hour employees
Cell G7 – Maximum time between end of lunch and break 2 for 8 hour employees
Cell G8 – Maximum time between end of break 2 and end of the day for 8 hour employees
Cell G10 – Minimum time between start of day and break 1 for 8 hour employees
Cell G11 – Minimum time between end of break 1 and lunch for 8 hour employees
Cell G12 – Minimum time between end of lunch and break 2 for 8 hour employees
Cell G13 – Minimum time between end of break 2 and end of the day for 8 hour employees
Cell J5– Maximum time between start of day and break 1 for 10 hour employees
Cell J6 – Maximum time between end of break 1 and lunch for 10 hour employees
Cell J7 – Maximum time between end of lunch and break 2 for 10 hour employees
Cell J8 – Maximum time between end of break 2 and end of the day for 10 hour employees
Cell J10 – Minimum time between start of day and break 1 for 10 hour employees
Cell J11 – Minimum time between end of break 1 and lunch for 10 hour employees
Cell J12 – Minimum time between end of lunch and break 2 for 10 hour employees
Cell J13 – Minimum time between end of break 2 and end of the day for 10 hour employees
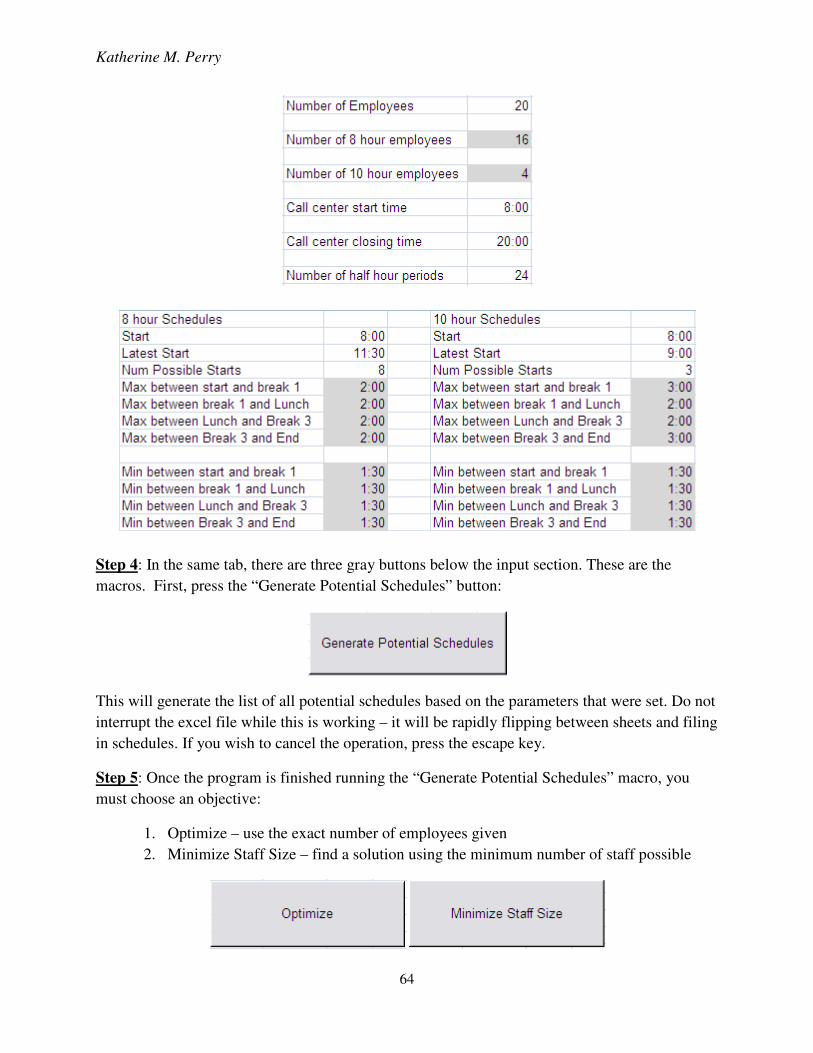
Katherine M. Perry
64
Step 4: In the same tab, there are three gray buttons below the input section. These are the
macros. First, press the “Generate Potential Schedules” button:
This will generate the list of all potential schedules based on the parameters that were set. Do not
interrupt the excel file while this is working – it will be rapidly flipping between sheets and filing
in schedules. If you wish to cancel the operation, press the escape key.
Step 5: Once the program is finished running the “Generate Potential Schedules” macro, you
must choose an objective:
1. Optimize – use the exact number of employees given
2. Minimize Staff Size – find a solution using the minimum number of staff possible
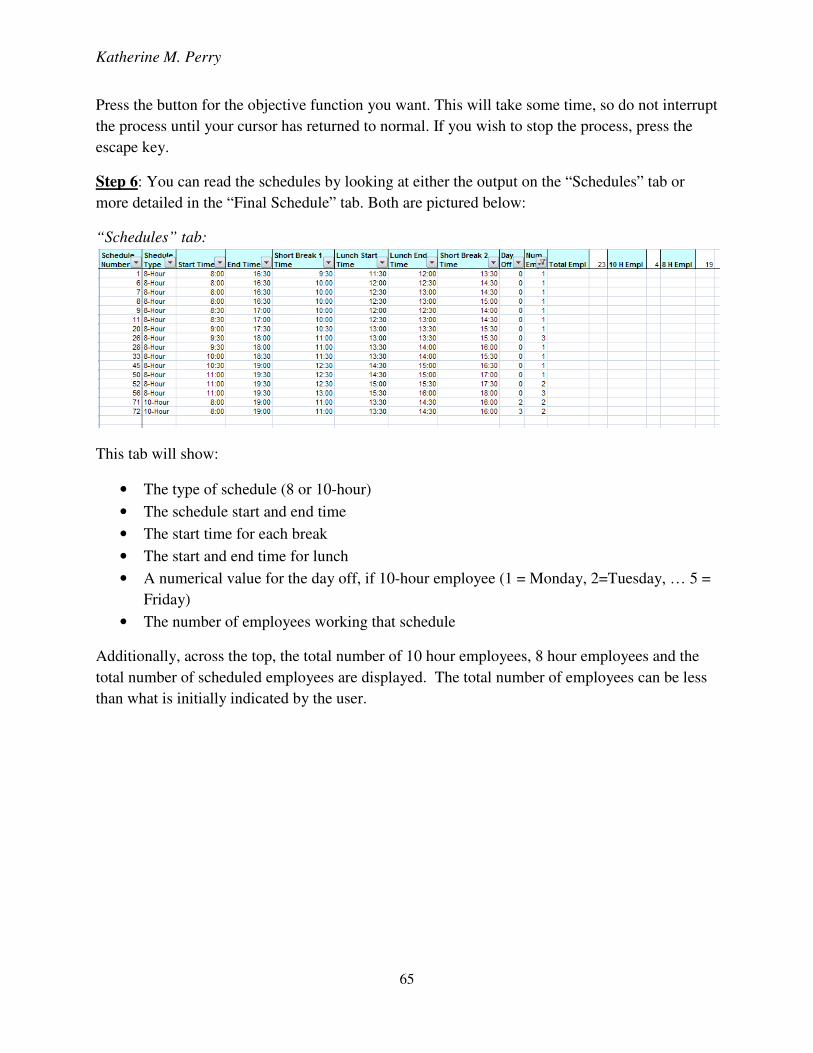
Katherine M. Perry
65
Press the button for the objective function you want. This will take some time, so do not interrupt
the process until your cursor has returned to normal. If you wish to stop the process, press the
escape key.
Step 6: You can read the schedules by looking at either the output on the “Schedules” tab or
more detailed in the “Final Schedule” tab. Both are pictured below:
“Schedules” tab:
This tab will show:
• The type of schedule (8 or 10-hour)
• The schedule start and end time
• The start time for each break
• The start and end time for lunch
• A numerical value for the day off, if 10-hour employee (1 = Monday, 2=Tuesday, … 5 =
Friday)
• The number of employees working that schedule
Additionally, across the top, the total number of 10 hour employees, 8 hour employees and the
total number of scheduled employees are displayed. The total number of employees can be less
than what is initially indicated by the user.
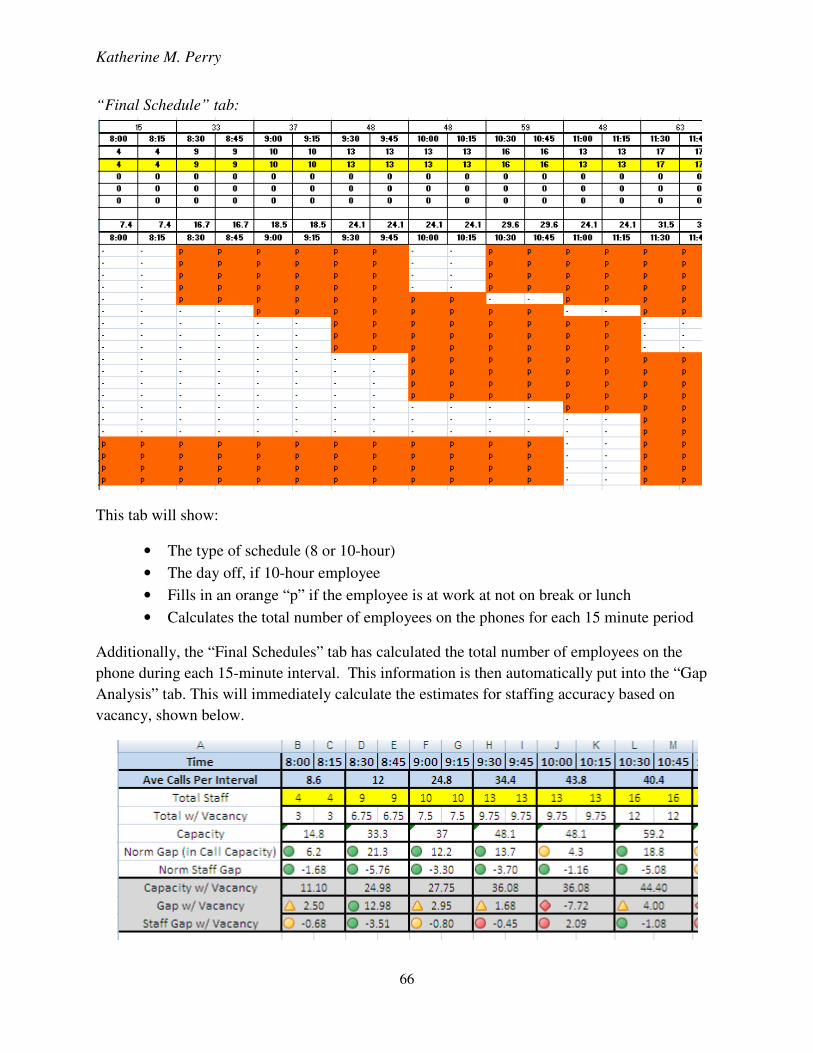
Katherine M. Perry
66
“Final Schedule” tab:
This tab will show:
• The type of schedule (8 or 10-hour)
• The day off, if 10-hour employee
• Fills in an orange “p” if the employee is at work at not on break or lunch
• Calculates the total number of employees on the phones for each 15 minute period
Additionally, the “Final Schedules” tab has calculated the total number of employees on the
phone during each 15-minute interval. This information is then automatically put into the “Gap
Analysis” tab. This will immediately calculate the estimates for staffing accuracy based on
vacancy, shown below.
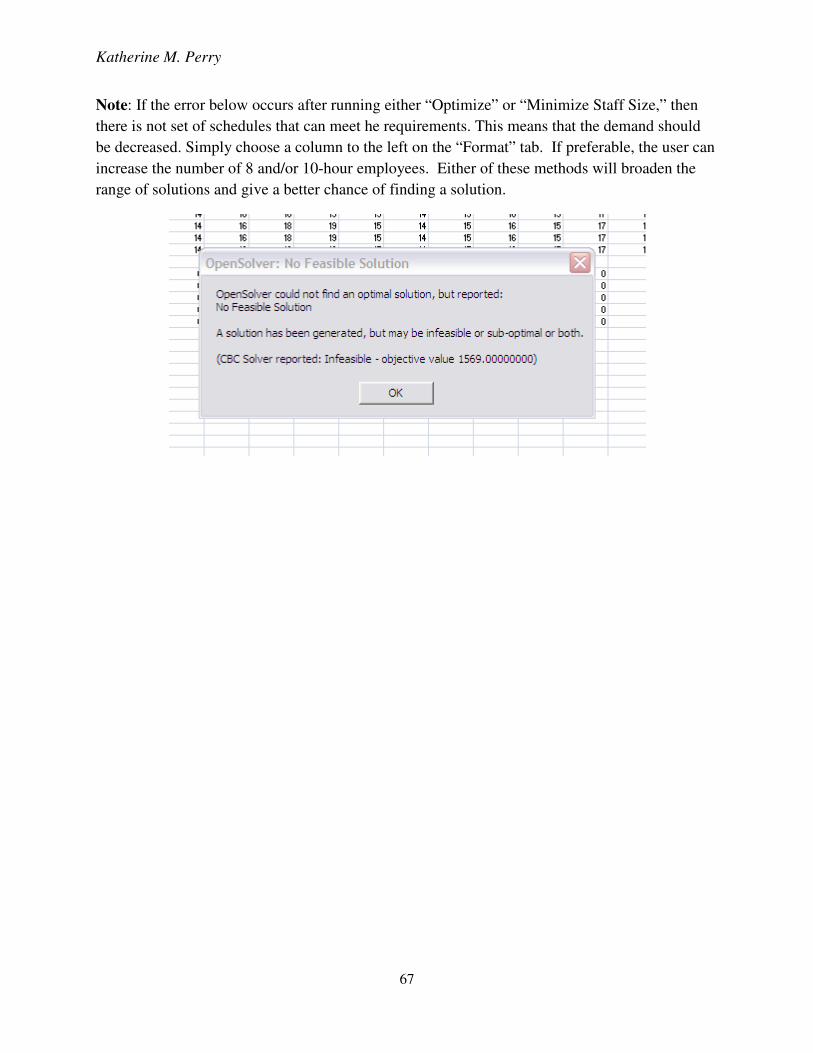
Katherine M. Perry
67
Note: If the error below occurs after running either “Optimize” or “Minimize Staff Size,” then
there is not set of schedules that can meet he requirements. This means that the demand should
be decreased. Simply choose a column to the left on the “Format” tab. If preferable, the user can
increase the number of 8 and/or 10-hour employees. Either of these methods will broaden the
range of solutions and give a better chance of finding a solution.
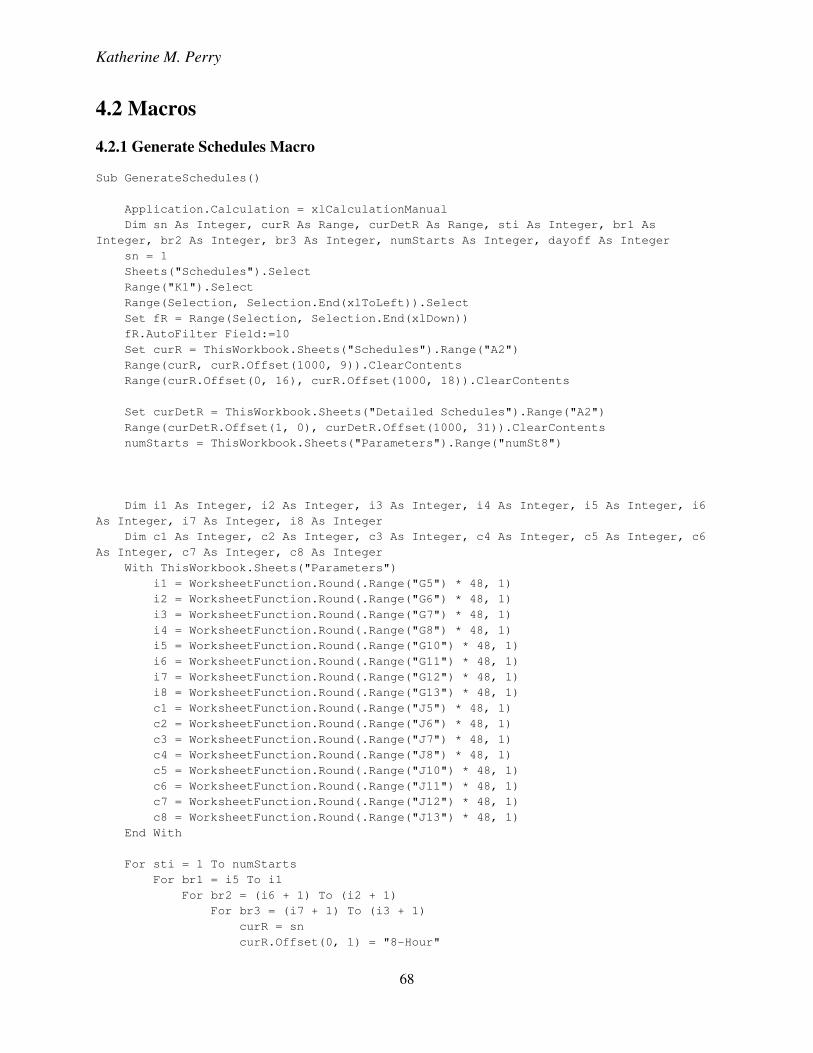
Katherine M. Perry
68
4.2 Macros
4.2.1 Generate Schedules Macro
Sub GenerateSchedules()
Application.Calculation = xlCalculationManual
Dim sn As Integer, curR As Range, curDetR As Range, sti As Integer, br1 As
Integer, br2 As Integer, br3 As Integer, numStarts As Integer, dayoff As Integer
sn = 1
Sheets("Schedules").Select
Range("K1").Select
Range(Selection, Selection.End(xlToLeft)).Select
Set fR = Range(Selection, Selection.End(xlDown))
fR.AutoFilter Field:=10
Set curR = ThisWorkbook.Sheets("Schedules").Range("A2")
Range(curR, curR.Offset(1000, 9)).ClearContents
Range(curR.Offset(0, 16), curR.Offset(1000, 18)).ClearContents
Set curDetR = ThisWorkbook.Sheets("Detailed Schedules").Range("A2")
Range(curDetR.Offset(1, 0), curDetR.Offset(1000, 31)).ClearContents
numStarts = ThisWorkbook.Sheets("Parameters").Range("numSt8")
Dim i1 As Integer, i2 As Integer, i3 As Integer, i4 As Integer, i5 As Integer, i6
As Integer, i7 As Integer, i8 As Integer
Dim c1 As Integer, c2 As Integer, c3 As Integer, c4 As Integer, c5 As Integer, c6
As Integer, c7 As Integer, c8 As Integer
With ThisWorkbook.Sheets("Parameters")
i1 = WorksheetFunction.Round(.Range("G5") * 48, 1)
i2 = WorksheetFunction.Round(.Range("G6") * 48, 1)
i3 = WorksheetFunction.Round(.Range("G7") * 48, 1)
i4 = WorksheetFunction.Round(.Range("G8") * 48, 1)
i5 = WorksheetFunction.Round(.Range("G10") * 48, 1)
i6 = WorksheetFunction.Round(.Range("G11") * 48, 1)
i7 = WorksheetFunction.Round(.Range("G12") * 48, 1)
i8 = WorksheetFunction.Round(.Range("G13") * 48, 1)
c1 = WorksheetFunction.Round(.Range("J5") * 48, 1)
c2 = WorksheetFunction.Round(.Range("J6") * 48, 1)
c3 = WorksheetFunction.Round(.Range("J7") * 48, 1)
c4 = WorksheetFunction.Round(.Range("J8") * 48, 1)
c5 = WorksheetFunction.Round(.Range("J10") * 48, 1)
c6 = WorksheetFunction.Round(.Range("J11") * 48, 1)
c7 = WorksheetFunction.Round(.Range("J12") * 48, 1)
c8 = WorksheetFunction.Round(.Range("J13") * 48, 1)
End With
For sti = 1 To numStarts
For br1 = i5 To i1
For br2 = (i6 + 1) To (i2 + 1)
For br3 = (i7 + 1) To (i3 + 1)
curR = sn
curR.Offset(0, 1) = "8-Hour"
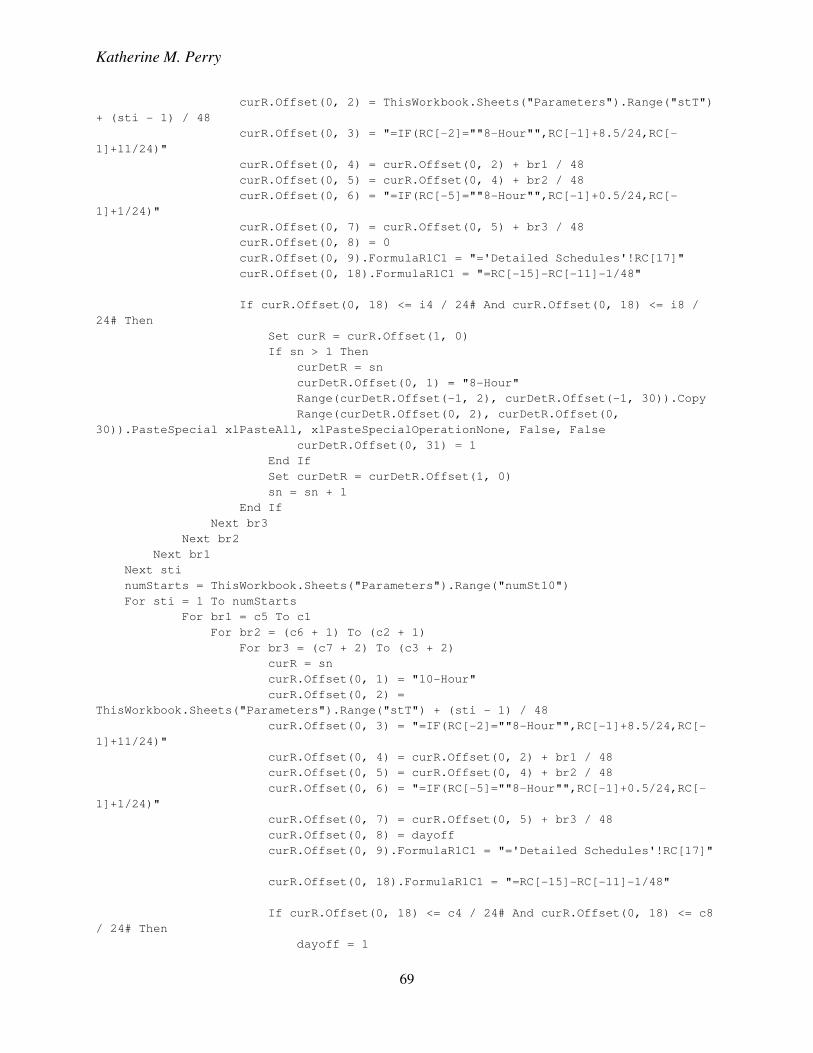
Katherine M. Perry
69
curR.Offset(0, 2) = ThisWorkbook.Sheets("Parameters").Range("stT")
+ (sti - 1) / 48
curR.Offset(0, 3) = "=IF(RC[-2]=""8-Hour"",RC[-1]+8.5/24,RC[-
1]+11/24)"
curR.Offset(0, 4) = curR.Offset(0, 2) + br1 / 48
curR.Offset(0, 5) = curR.Offset(0, 4) + br2 / 48
curR.Offset(0, 6) = "=IF(RC[-5]=""8-Hour"",RC[-1]+0.5/24,RC[-
1]+1/24)"
curR.Offset(0, 7) = curR.Offset(0, 5) + br3 / 48
curR.Offset(0, 8) = 0
curR.Offset(0, 9).FormulaR1C1 = "='Detailed Schedules'!RC[17]"
curR.Offset(0, 18).FormulaR1C1 = "=RC[-15]-RC[-11]-1/48"
If curR.Offset(0, 18) <= i4 / 24# And curR.Offset(0, 18) <= i8 /
24# Then
Set curR = curR.Offset(1, 0)
If sn > 1 Then
curDetR = sn
curDetR.Offset(0, 1) = "8-Hour"
Range(curDetR.Offset(-1, 2), curDetR.Offset(-1, 30)).Copy
Range(curDetR.Offset(0, 2), curDetR.Offset(0,
30)).PasteSpecial xlPasteAll, xlPasteSpecialOperationNone, False, False
curDetR.Offset(0, 31) = 1
End If
Set curDetR = curDetR.Offset(1, 0)
sn = sn + 1
End If
Next br3
Next br2
Next br1
Next sti
numStarts = ThisWorkbook.Sheets("Parameters").Range("numSt10")
For sti = 1 To numStarts
For br1 = c5 To c1
For br2 = (c6 + 1) To (c2 + 1)
For br3 = (c7 + 2) To (c3 + 2)
curR = sn
curR.Offset(0, 1) = "10-Hour"
curR.Offset(0, 2) =
ThisWorkbook.Sheets("Parameters").Range("stT") + (sti - 1) / 48
curR.Offset(0, 3) = "=IF(RC[-2]=""8-Hour"",RC[-1]+8.5/24,RC[-
1]+11/24)"
curR.Offset(0, 4) = curR.Offset(0, 2) + br1 / 48
curR.Offset(0, 5) = curR.Offset(0, 4) + br2 / 48
curR.Offset(0, 6) = "=IF(RC[-5]=""8-Hour"",RC[-1]+0.5/24,RC[-
1]+1/24)"
curR.Offset(0, 7) = curR.Offset(0, 5) + br3 / 48
curR.Offset(0, 8) = dayoff
curR.Offset(0, 9).FormulaR1C1 = "='Detailed Schedules'!RC[17]"
curR.Offset(0, 18).FormulaR1C1 = "=RC[-15]-RC[-11]-1/48"
If curR.Offset(0, 18) <= c4 / 24# And curR.Offset(0, 18) <= c8
/ 24# Then
dayoff = 1
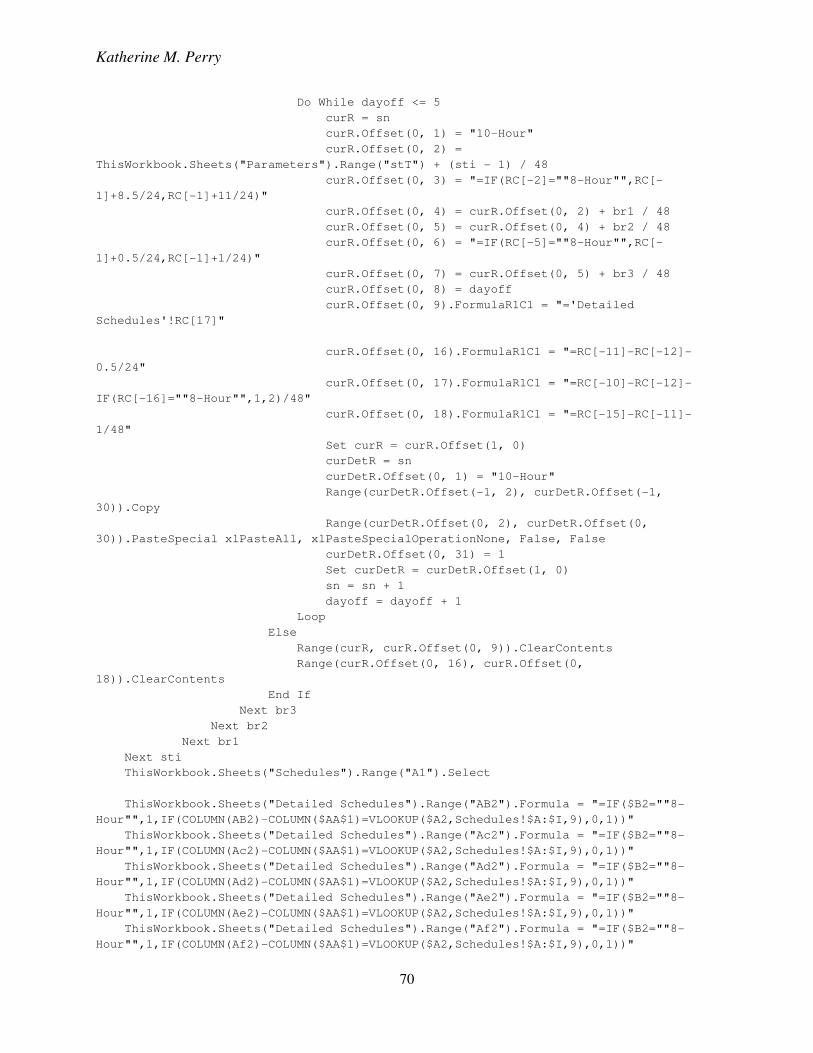
Katherine M. Perry
70
Do While dayoff <= 5
curR = sn
curR.Offset(0, 1) = "10-Hour"
curR.Offset(0, 2) =
ThisWorkbook.Sheets("Parameters").Range("stT") + (sti - 1) / 48
curR.Offset(0, 3) = "=IF(RC[-2]=""8-Hour"",RC[-
1]+8.5/24,RC[-1]+11/24)"
curR.Offset(0, 4) = curR.Offset(0, 2) + br1 / 48
curR.Offset(0, 5) = curR.Offset(0, 4) + br2 / 48
curR.Offset(0, 6) = "=IF(RC[-5]=""8-Hour"",RC[-
1]+0.5/24,RC[-1]+1/24)"
curR.Offset(0, 7) = curR.Offset(0, 5) + br3 / 48
curR.Offset(0, 8) = dayoff
curR.Offset(0, 9).FormulaR1C1 = "='Detailed
Schedules'!RC[17]"
curR.Offset(0, 16).FormulaR1C1 = "=RC[-11]-RC[-12]-
0.5/24"
curR.Offset(0, 17).FormulaR1C1 = "=RC[-10]-RC[-12]-
IF(RC[-16]=""8-Hour"",1,2)/48"
curR.Offset(0, 18).FormulaR1C1 = "=RC[-15]-RC[-11]-
1/48"
Set curR = curR.Offset(1, 0)
curDetR = sn
curDetR.Offset(0, 1) = "10-Hour"
Range(curDetR.Offset(-1, 2), curDetR.Offset(-1,
30)).Copy
Range(curDetR.Offset(0, 2), curDetR.Offset(0,
30)).PasteSpecial xlPasteAll, xlPasteSpecialOperationNone, False, False
curDetR.Offset(0, 31) = 1
Set curDetR = curDetR.Offset(1, 0)
sn = sn + 1
dayoff = dayoff + 1
Loop
Else
Range(curR, curR.Offset(0, 9)).ClearContents
Range(curR.Offset(0, 16), curR.Offset(0,
18)).ClearContents
End If
Next br3
Next br2
Next br1
Next sti
ThisWorkbook.Sheets("Schedules").Range("A1").Select
ThisWorkbook.Sheets("Detailed Schedules").Range("AB2").Formula = "=IF($B2=""8-
Hour"",1,IF(COLUMN(AB2)-COLUMN($AA$1)=VLOOKUP($A2,Schedules!$A:$I,9),0,1))"
ThisWorkbook.Sheets("Detailed Schedules").Range("Ac2").Formula = "=IF($B2=""8-
Hour"",1,IF(COLUMN(Ac2)-COLUMN($AA$1)=VLOOKUP($A2,Schedules!$A:$I,9),0,1))"
ThisWorkbook.Sheets("Detailed Schedules").Range("Ad2").Formula = "=IF($B2=""8-
Hour"",1,IF(COLUMN(Ad2)-COLUMN($AA$1)=VLOOKUP($A2,Schedules!$A:$I,9),0,1))"
ThisWorkbook.Sheets("Detailed Schedules").Range("Ae2").Formula = "=IF($B2=""8-
Hour"",1,IF(COLUMN(Ae2)-COLUMN($AA$1)=VLOOKUP($A2,Schedules!$A:$I,9),0,1))"
ThisWorkbook.Sheets("Detailed Schedules").Range("Af2").Formula = "=IF($B2=""8-
Hour"",1,IF(COLUMN(Af2)-COLUMN($AA$1)=VLOOKUP($A2,Schedules!$A:$I,9),0,1))"
Katherine M. Perry
71
ThisWorkbook.Sheets("Detailed Schedules").Range("AJ2").Formula =
"=SUMIF(B2:B10000,""10-Hour"",AA2:AA10000)"
ThisWorkbook.Sheets("Detailed Schedules").Range("AK2").Formula =
"=SUMIF(B2:B10000,""8-Hour"",AA2:AA10000)"
ThisWorkbook.Sheets("Detailed Schedules").Range("AB2:AF2").Copy
ThisWorkbook.Sheets("Detailed Schedules").Range("AB2:AF10000").PasteSpecial
xlPasteFormulas
Application.Calculation = xlCalculationAutomatic
ThisWorkbook.Sheets("Detailed Schedules").Range("AB2:AF10000").Copy
ThisWorkbook.Sheets("Detailed Schedules").Range("AB2:AF10000").PasteSpecial
xlPasteValues
ThisWorkbook.Sheets("Detailed Schedules").Range("AB2").Formula = "=IF($B2=""8-
Hour"",1,IF(COLUMN(AB2)-COLUMN($AA$1)=VLOOKUP($A2,Schedules!$A:$I,9),0,1))"
ThisWorkbook.Sheets("Detailed Schedules").Range("Ac2").Formula = "=IF($B2=""8-
Hour"",1,IF(COLUMN(Ac2)-COLUMN($AA$1)=VLOOKUP($A2,Schedules!$A:$I,9),0,1))"
ThisWorkbook.Sheets("Detailed Schedules").Range("Ad2").Formula = "=IF($B2=""8-
Hour"",1,IF(COLUMN(Ad2)-COLUMN($AA$1)=VLOOKUP($A2,Schedules!$A:$I,9),0,1))"
ThisWorkbook.Sheets("Detailed Schedules").Range("Ae2").Formula = "=IF($B2=""8-
Hour"",1,IF(COLUMN(Ae2)-COLUMN($AA$1)=VLOOKUP($A2,Schedules!$A:$I,9),0,1))"
ThisWorkbook.Sheets("Detailed Schedules").Range("Af2").Formula = "=IF($B2=""8-
Hour"",1,IF(COLUMN(Af2)-COLUMN($AA$1)=VLOOKUP($A2,Schedules!$A:$I,9),0,1))"
ThisWorkbook.Sheets("Schedules").Range("A1").Select
Application.Calculation = xlCalculationManual
Sheets("Schedules").Select
Dim n As Integer
With ThisWorkbook.Sheets("Parameters")
n = Application.CountA(Range("A:A"))
End With
Dim i As Integer, var1 As Integer, var2 As Integer
i = 2
' Range(.Range("A1"), .Range("A65535").End(xlUp)).Count
' MyCount = Application.CountA(Range("A:A"))
For i = 2 To n
With ThisWorkbook.Sheets("Schedules")
var1 = WorksheetFunction.Round(.Range("H" + CStr(i)).Value * 48, 1)
'var 1 = break 2 begin (need to add 1 half hour for calculations)
var2 = WorksheetFunction.Round(.Range("D" + CStr(i)).Value * 48, 1)
'var2 = end of day
var3 = Range("C" + CStr(i)).Value
End With
If ThisWorkbook.Sheets("Schedules").Range("B" + CStr(i)).Value = "8-Hour"
Then
If (var2 - (var1 + 1)) < i8 Then
'if (end of day) - (break 2 + 1) < min time
'break 2 = column h
'end of day = column d
ThisWorkbook.Sheets("Schedules").Range("M" + CStr(i)).Value =
"False"
Katherine M. Perry
72
ElseIf (var2 - (var1 + 1)) > i4 Then
'if (end of day) - (break 2 + 1) > max time
ThisWorkbook.Sheets("Schedules").Range("M" + CStr(i)).Value =
"False"
Else
ThisWorkbook.Sheets("Schedules").Range("M" + CStr(i)).Value =
"True"
End If
ElseIf ThisWorkbook.Sheets("Schedules").Range("B" + CStr(i)).Value = "10-
Hour" Then
If (var2 - (var1 + 1)) < c8 Then
'if (end of day) - (break 2 + 1) < min time
ThisWorkbook.Sheets("Schedules").Range("M" + CStr(i)).Value =
"False"
ElseIf (var2 - (var1 + 1)) > c4 Then
'if (end of day) - (break 2 + 1) > max time
ThisWorkbook.Sheets("Schedules").Range("M" + CStr(i)).Value =
"False"
Else
ThisWorkbook.Sheets("Schedules").Range("M" + CStr(i)).Value =
"True"
End If
Else
ThisWorkbook.Sheets("Schedules").Range("M" + CStr(i)).Value = "n/a"
End If
Next i
For i = n To 2 Step -1
If ThisWorkbook.Sheets("Schedules").Range("M" + CStr(i)).Value = "False"
Then
ThisWorkbook.Sheets("Schedules").Range("M" + CStr(i)).EntireRow.Delete
ThisWorkbook.Sheets("Detailed Schedules").Range("A" + CStr(i), "AF" +
CStr(i)).Delete
End If
Next i
'THIS IS TO BRING THE NUMBER OF POTENTIAL SCHEDULES DOWN TO 200 OR FEWER
'UNCOMMENT FOR EXCEL SOLVER
'LEAVE COMMENTED OUT FOR OPENSOLVER
' Dim x As Long
' x = Application.CountA(Range("A:A"))
' If x > 200 And x <= 300 Then
' For i = x To 2 Step -3
' ThisWorkbook.Sheets("Schedules").Range("A" +
CStr(i)).EntireRow.Delete
' ThisWorkbook.Sheets("Detailed Schedules").Range("A" + CStr(i), "AF" +
CStr(i)).Delete
' Next i
' ThisWorkbook.Sheets("Schedules").Range("N4").Value = "NOTE: More than 200
schedules generated"
' 'delete every third one (133.33 to 200)
' ElseIf x > 300 And x <= 400 Then
' For i = x To 2 Step -2
Katherine M. Perry
73
' ThisWorkbook.Sheets("Schedules").Range("A" +
CStr(i)).EntireRow.Delete
' ThisWorkbook.Sheets("Detailed Schedules").Range("A" + CStr(i), "AF" +
CStr(i)).Delete
' Next i
' ThisWorkbook.Sheets("Schedules").Range("N4").Value = "NOTE: More than 200
schedules generated"
' 'delete every other one (150 to 200)
' ElseIf x > 400 And x <= 500 Then
' For i = x To 2 Step -2
' ThisWorkbook.Sheets("Schedules").Range("A" +
CStr(i)).EntireRow.Delete
' ThisWorkbook.Sheets("Detailed Schedules").Range("A" + CStr(i), "AF" +
CStr(i)).Delete
' Next i
' For i = x To 2 Step -5
' ThisWorkbook.Sheets("Schedules").Range("A" +
CStr(i)).EntireRow.Delete
' ThisWorkbook.Sheets("Detailed Schedules").Range("A" + CStr(i), "AF" +
CStr(i)).Delete
' Next i
' ThisWorkbook.Sheets("Schedules").Range("N4").Value = "NOTE: More than 200
schedules generated"
' 'delete every other one (200 to 250)
' 'delete every 5th one (up to 200)
' ElseIf x > 500 And x <= 600 Then
' For i = x To 2 Step -2
' ThisWorkbook.Sheets("Schedules").Range("A" +
CStr(i)).EntireRow.Delete
' ThisWorkbook.Sheets("Detailed Schedules").Range("A" + CStr(i), "AF" +
CStr(i)).Delete
' Next i
' For i = x To 2 Step -3
' ThisWorkbook.Sheets("Schedules").Range("A" +
CStr(i)).EntireRow.Delete
' ThisWorkbook.Sheets("Detailed Schedules").Range("A" + CStr(i), "AF" +
CStr(i)).Delete
' Next i
' ThisWorkbook.Sheets("Schedules").Range("N4").Value = "NOTE: More than 200
schedules generated"
' 'delete every other one (250 to 300)
' 'delete every other one (250 to 300)
' ElseIf x > 600 And x <= 700 Then
' For i = x To 2 Step -2
' ThisWorkbook.Sheets("Schedules").Range("A" +
CStr(i)).EntireRow.Delete
' ThisWorkbook.Sheets("Detailed Schedules").Range("A" + CStr(i), "AF" +
CStr(i)).Delete
' Next i
' For i = x To 2 Step -2
' ThisWorkbook.Sheets("Schedules").Range("A" +
CStr(i)).EntireRow.Delete
' ThisWorkbook.Sheets("Detailed Schedules").Range("A" + CStr(i), "AF" +
CStr(i)).Delete
' Next i
Katherine M. Perry
74
' ThisWorkbook.Sheets("Schedules").Range("N4").Value = "NOTE: More than 200
schedules generated"
' 'delete everyother one (300 to 350)
' 'delete everyother one (150 to 175)
' ElseIf x > 700 And x <= 800 Then
' For i = n To 2 Step -2
' ThisWorkbook.Sheets("Schedules").Range("A" +
CStr(i)).EntireRow.Delete
' ThisWorkbook.Sheets("Detailed Schedules").Range("A" + CStr(i), "AF" +
CStr(i)).Delete
' Next i
' For i = x To 2 Step -2
' ThisWorkbook.Sheets("Schedules").Range("A" +
CStr(i)).EntireRow.Delete
' ThisWorkbook.Sheets("Detailed Schedules").Range("A" + CStr(i), "AF" +
CStr(i)).Delete
' Next i
' ThisWorkbook.Sheets("Schedules").Range("N4").Value = "NOTE: More than 200
schedules generated"
' 'delete everyother one (350 to 400)
' 'delete everyother one (175 to 200)
' ElseIf x > 800 Then
' ThisWorkbook.Sheets("Schedules").Range("A202",
"A10000").EntireRow.ClearContents
' ThisWorkbook.Sheets("Detailed Schedules").Range("A202",
"A10000").EntireRow.ClearContents
' ThisWorkbook.Sheets("Schedules").Range("N4").Value = "NOTE: More than 200
schedules generated"
' Else
' ThisWorkbook.Sheets("Schedules").Range("N4").ClearContents
' End If
ThisWorkbook.Sheets("Detailed Schedules").Range("AM2").Formula =
"=SUMPRODUCT($AB$2:$AB$10000,C2:C10000)"
ThisWorkbook.Sheets("Detailed Schedules").Range("AM3").Formula =
"=SUMPRODUCT($Ac$2:$Ac$10000,C2:C10000)"
ThisWorkbook.Sheets("Detailed Schedules").Range("AM4").Formula =
"=SUMPRODUCT($Ad$2:$Ad$10000,C2:C10000)"
ThisWorkbook.Sheets("Detailed Schedules").Range("AM5").Formula =
"=SUMPRODUCT($Ae$2:$Ae$10000,C2:C10000)"
ThisWorkbook.Sheets("Detailed Schedules").Range("AM6").Formula =
"=SUMPRODUCT($Af$2:$Af$10000,C2:C10000)"
ThisWorkbook.Sheets("Detailed Schedules").Range("AM2:AM6").Copy
ThisWorkbook.Sheets("Detailed Schedules").Range("AN2:BJ6").PasteSpecial
xlPasteFormulas
ThisWorkbook.Sheets("Schedules").Range("M2", "M10000").ClearContents
Dim y As Long
y = Application.CountA(ThisWorkbook.Sheets("Detailed Schedules").Range("A:A"))
ThisWorkbook.Sheets("Detailed Schedules").Range("A" + CStr(y + 1),
"A10000").EntireRow.ClearContents
Katherine M. Perry
75
Application.Calculation = xlCalculationAutomatic
End Sub
4.2.2 Minimize Macro
Sub Minimize()
Application.DisplayAlerts = False
Dim numP As Integer, num10 As Integer, num8 As Integer
ThisWorkbook.Sheets("Schedules").Select
Range("K1").Select
Range(Selection, Selection.End(xlToLeft)).Select
Set fR = Range(Selection, Selection.End(xlDown))
fR.AutoFilter Field:=11
numP = ThisWorkbook.Sheets("Parameters").Range("numPer")
num10 = ThisWorkbook.Sheets("Parameters").Range("_num10")
num8 = ThisWorkbook.Sheets("Parameters").Range("_num8")
ThisWorkbook.Sheets("Detailed Schedules").Activate
Set curDetR = Range("A2")
i = 1
Do Until curDetR = ""
i = i + 1
Set curDetR = curDetR.Offset(1, 0)
Loop
Range(curDetR.Offset(0, 26), curDetR.Offset(0, 26).End(xlDown)).ClearContents
SolverReset
SolverOk SetCell:="$AG$2", MaxMinVal:=2, ValueOf:="0", ByChange:="$AA$2:$AA$" & i
SolverOptions MaxTime:=10000, Iterations:=10000, Precision:=0.000001,
AssumeLinear:=True, StepThru:=False, Estimates:=1, Derivatives:=1, SearchOption:=1,
IntTolerance:=5, Scaling:=False, Convergence:=0.0001, AssumeNonNeg:=True
SolverAdd CellRef:="$AA$2:$AA$" & i, Relation:=3, FormulaText:="0"
SolverAdd CellRef:="$AA$2:$AA$" & i, Relation:=4, FormulaText:="integer"
'SolverAdd CellRef:="$AI$2", Relation:=3, FormulaText:="0"
SolverAdd CellRef:="$AM$15:$BJ$19", Relation:=3, FormulaText:="0"
SolverAdd CellRef:="$AJ$2", Relation:=1, FormulaText:=CStr(num10)
SolverAdd CellRef:="$AK$2", Relation:=1, FormulaText:=CStr(num8)
SolverOk SetCell:="$AG$2", MaxMinVal:=2, ValueOf:="0", ByChange:="$AA$2:$AA$" & i
'SolverSolve
RunOpenSolver False
Sheets("Schedules").Select
Range("K1").Select
Range(Selection, Selection.End(xlToLeft)).Select
Set fR = Range(Selection, Selection.End(xlDown))
fR.AutoFilter
fR.AutoFilter Field:=10, Criteria1:=">=0.5", Operator:=xlAnd
Application.DisplayAlerts = True
ThisWorkbook.Sheets("Schedules").Range("A1").Select
Katherine M. Perry
76
Application.Calculation = xlCalculationAutomatic
Application.Calculation = xlCalculationManual
ThisWorkbook.Sheets("Final Schedule").Range("J12:BH100").ClearContents
ThisWorkbook.Sheets("Final Schedule").Range("J12:BH100").Interior.ColorIndex =
xlNone
With ThisWorkbook.Sheets("Detailed Schedules")
Dim location As Integer
location = 12
Dim endrow As Integer, rownum As Integer, numemployees As Integer
Dim timeC As Integer, timeD As Integer, timeE As Integer, timeF As Integer,
timeG As Integer, timeH As Integer, timeI As Integer, timeJ As Integer, timeK As
Integer, timeL As Integer, timeM As Integer, timeN As Integer, timeO As Integer, timeP
As Integer, timeQ As Integer, timeR As Integer, timeS As Integer, timeT As Integer,
timeU As Integer, timeV As Integer, timeW As Integer, timeX As Integer, timeY As
Integer, timeZ As Integer
endrow = Application.CountA(ThisWorkbook.Sheets("Detailed
Schedules").Range("A:A"))
For rownum = 2 To endrow
numemployees = WorksheetFunction.Round(.Range("AA" + CStr(rownum)), 1)
If numemployees > 0 Then
'scheduletype = Range("B" + CStr(rownum))
timeC = WorksheetFunction.Round(.Range("C" + CStr(rownum)), 1)
timeD = WorksheetFunction.Round(.Range("D" + CStr(rownum)), 1)
timeE = WorksheetFunction.Round(.Range("E" + CStr(rownum)), 1)
timeF = WorksheetFunction.Round(.Range("F" + CStr(rownum)), 1)
timeG = WorksheetFunction.Round(.Range("G" + CStr(rownum)), 1)
timeH = WorksheetFunction.Round(.Range("H" + CStr(rownum)), 1)
timeI = WorksheetFunction.Round(.Range("I" + CStr(rownum)), 1)
timeJ = WorksheetFunction.Round(.Range("J" + CStr(rownum)), 1)
timeK = WorksheetFunction.Round(.Range("K" + CStr(rownum)), 1)
timeL = WorksheetFunction.Round(.Range("L" + CStr(rownum)), 1)
timeM = WorksheetFunction.Round(.Range("M" + CStr(rownum)), 1)
timeN = WorksheetFunction.Round(.Range("N" + CStr(rownum)), 1)
timeO = WorksheetFunction.Round(.Range("O" + CStr(rownum)), 1)
timeP = WorksheetFunction.Round(.Range("P" + CStr(rownum)), 1)
timeQ = WorksheetFunction.Round(.Range("Q" + CStr(rownum)), 1)
timeR = WorksheetFunction.Round(.Range("R" + CStr(rownum)), 1)
timeS = WorksheetFunction.Round(.Range("S" + CStr(rownum)), 1)
timeT = WorksheetFunction.Round(.Range("T" + CStr(rownum)), 1)
timeU = WorksheetFunction.Round(.Range("U" + CStr(rownum)), 1)
timeV = WorksheetFunction.Round(.Range("V" + CStr(rownum)), 1)
timeW = WorksheetFunction.Round(.Range("W" + CStr(rownum)), 1)
timeX = WorksheetFunction.Round(.Range("X" + CStr(rownum)), 1)
timeY = WorksheetFunction.Round(.Range("Y" + CStr(rownum)), 1)
timeZ = WorksheetFunction.Round(.Range("Z" + CStr(rownum)), 1)
Dim j As Integer
For j = 1 To numemployees
'insert printing cells running through columns of time periods
If timeC > 0.5 Then
ThisWorkbook.Sheets("Final Schedule").Range("M" +
CStr(location)).Value = "p"
ThisWorkbook.Sheets("Final Schedule").Range("M" +
CStr(location)).Interior.ColorIndex = 46
Katherine M. Perry
77
ThisWorkbook.Sheets("Final Schedule").Range("N" +
CStr(location)).Value = "p"
ThisWorkbook.Sheets("Final Schedule").Range("N" +
CStr(location)).Interior.ColorIndex = 46
Else
ThisWorkbook.Sheets("Final Schedule").Range("M" +
CStr(location)).Value = "-"
ThisWorkbook.Sheets("Final Schedule").Range("N" +
CStr(location)).Value = "-"
End If
If timeD > 0.5 Then
ThisWorkbook.Sheets("Final Schedule").Range("O" +
CStr(location)).Value = "p"
ThisWorkbook.Sheets("Final Schedule").Range("O" +
CStr(location)).Interior.ColorIndex = 46
ThisWorkbook.Sheets("Final Schedule").Range("P" +
CStr(location)).Value = "p"
ThisWorkbook.Sheets("Final Schedule").Range("P" +
CStr(location)).Interior.ColorIndex = 46
Else
ThisWorkbook.Sheets("Final Schedule").Range("O" +
CStr(location)).Value = "-"
ThisWorkbook.Sheets("Final Schedule").Range("P" +
CStr(location)).Value = "-"
End If
If timeE > 0.5 Then
ThisWorkbook.Sheets("Final Schedule").Range("Q" +
CStr(location)).Value = "p"
ThisWorkbook.Sheets("Final Schedule").Range("Q" +
CStr(location)).Interior.ColorIndex = 46
ThisWorkbook.Sheets("Final Schedule").Range("R" +
CStr(location)).Value = "p"
ThisWorkbook.Sheets("Final Schedule").Range("R" +
CStr(location)).Interior.ColorIndex = 46
Else
ThisWorkbook.Sheets("Final Schedule").Range("Q" +
CStr(location)).Value = "-"
ThisWorkbook.Sheets("Final Schedule").Range("R" +
CStr(location)).Value = "-"
End If
If timeF > 0.5 Then
ThisWorkbook.Sheets("Final Schedule").Range("S" +
CStr(location)).Value = "p"
ThisWorkbook.Sheets("Final Schedule").Range("S" +
CStr(location)).Interior.ColorIndex = 46
ThisWorkbook.Sheets("Final Schedule").Range("T" +
CStr(location)).Value = "p"
ThisWorkbook.Sheets("Final Schedule").Range("T" +
CStr(location)).Interior.ColorIndex = 46
Else
ThisWorkbook.Sheets("Final Schedule").Range("S" +
CStr(location)).Value = "-"
ThisWorkbook.Sheets("Final Schedule").Range("T" +
CStr(location)).Value = "-"
End If
Katherine M. Perry
78
If timeG > 0.5 Then
ThisWorkbook.Sheets("Final Schedule").Range("U" +
CStr(location)).Value = "p"
ThisWorkbook.Sheets("Final Schedule").Range("U" +
CStr(location)).Interior.ColorIndex = 46
ThisWorkbook.Sheets("Final Schedule").Range("V" +
CStr(location)).Value = "p"
ThisWorkbook.Sheets("Final Schedule").Range("V" +
CStr(location)).Interior.ColorIndex = 46
Else
ThisWorkbook.Sheets("Final Schedule").Range("U" +
CStr(location)).Value = "-"
ThisWorkbook.Sheets("Final Schedule").Range("V" +
CStr(location)).Value = "-"
End If
If timeH > 0.5 Then
ThisWorkbook.Sheets("Final Schedule").Range("W" +
CStr(location)).Value = "p"
ThisWorkbook.Sheets("Final Schedule").Range("W" +
CStr(location)).Interior.ColorIndex = 46
ThisWorkbook.Sheets("Final Schedule").Range("X" +
CStr(location)).Value = "p"
ThisWorkbook.Sheets("Final Schedule").Range("X" +
CStr(location)).Interior.ColorIndex = 46
Else
ThisWorkbook.Sheets("Final Schedule").Range("W" +
CStr(location)).Value = "-"
ThisWorkbook.Sheets("Final Schedule").Range("X" +
CStr(location)).Value = "-"
End If
If timeI > 0.5 Then
ThisWorkbook.Sheets("Final Schedule").Range("Y" +
CStr(location)).Value = "p"
ThisWorkbook.Sheets("Final Schedule").Range("Y" +
CStr(location)).Interior.ColorIndex = 46
ThisWorkbook.Sheets("Final Schedule").Range("Z" +
CStr(location)).Value = "p"
ThisWorkbook.Sheets("Final Schedule").Range("Z" +
CStr(location)).Interior.ColorIndex = 46
Else
ThisWorkbook.Sheets("Final Schedule").Range("Y" +
CStr(location)).Value = "-"
ThisWorkbook.Sheets("Final Schedule").Range("Z" +
CStr(location)).Value = "-"
End If
If timeJ > 0.5 Then
ThisWorkbook.Sheets("Final Schedule").Range("AA" +
CStr(location)).Value = "p"
ThisWorkbook.Sheets("Final Schedule").Range("AA" +
CStr(location)).Interior.ColorIndex = 46
ThisWorkbook.Sheets("Final Schedule").Range("AB" +
CStr(location)).Value = "p"
ThisWorkbook.Sheets("Final Schedule").Range("AB" +
CStr(location)).Interior.ColorIndex = 46
Else

Katherine M. Perry
79
ThisWorkbook.Sheets("Final Schedule").Range("AA" +
CStr(location)).Value = "-"
ThisWorkbook.Sheets("Final Schedule").Range("AB" +
CStr(location)).Value = "-"
End If
If timeK > 0.5 Then
ThisWorkbook.Sheets("Final Schedule").Range("AC" +
CStr(location)).Value = "p"
ThisWorkbook.Sheets("Final Schedule").Range("AC" +
CStr(location)).Interior.ColorIndex = 46
ThisWorkbook.Sheets("Final Schedule").Range("AD" +
CStr(location)).Value = "p"
ThisWorkbook.Sheets("Final Schedule").Range("AD" +
CStr(location)).Interior.ColorIndex = 46
Else
ThisWorkbook.Sheets("Final Schedule").Range("AC" +
CStr(location)).Value = "-"
ThisWorkbook.Sheets("Final Schedule").Range("AD" +
CStr(location)).Value = "-"
End If
If timeL > 0.5 Then
ThisWorkbook.Sheets("Final Schedule").Range("AE" +
CStr(location)).Value = "p"
ThisWorkbook.Sheets("Final Schedule").Range("AE" +
CStr(location)).Interior.ColorIndex = 46
ThisWorkbook.Sheets("Final Schedule").Range("AF" +
CStr(location)).Value = "p"
ThisWorkbook.Sheets("Final Schedule").Range("AF" +
CStr(location)).Interior.ColorIndex = 46
Else
ThisWorkbook.Sheets("Final Schedule").Range("AE" +
CStr(location)).Value = "-"
ThisWorkbook.Sheets("Final Schedule").Range("AF" +
CStr(location)).Value = "-"
End If
If timeM > 0.5 Then
ThisWorkbook.Sheets("Final Schedule").Range("AG" +
CStr(location)).Value = "p"
ThisWorkbook.Sheets("Final Schedule").Range("AG" +
CStr(location)).Interior.ColorIndex = 46
ThisWorkbook.Sheets("Final Schedule").Range("AH" +
CStr(location)).Value = "p"
ThisWorkbook.Sheets("Final Schedule").Range("AH" +
CStr(location)).Interior.ColorIndex = 46
Else
ThisWorkbook.Sheets("Final Schedule").Range("AG" +
CStr(location)).Value = "-"
ThisWorkbook.Sheets("Final Schedule").Range("AH" +
CStr(location)).Value = "-"
End If
If timeN > 0.5 Then
ThisWorkbook.Sheets("Final Schedule").Range("AI" +
CStr(location)).Value = "p"
ThisWorkbook.Sheets("Final Schedule").Range("AI" +
CStr(location)).Interior.ColorIndex = 46
Katherine M. Perry
80
ThisWorkbook.Sheets("Final Schedule").Range("AJ" +
CStr(location)).Value = "p"
ThisWorkbook.Sheets("Final Schedule").Range("AJ" +
CStr(location)).Interior.ColorIndex = 46
Else
ThisWorkbook.Sheets("Final Schedule").Range("AI" +
CStr(location)).Value = "-"
ThisWorkbook.Sheets("Final Schedule").Range("AJ" +
CStr(location)).Value = "-"
End If
If timeO > 0.5 Then
ThisWorkbook.Sheets("Final Schedule").Range("AK" +
CStr(location)).Value = "p"
ThisWorkbook.Sheets("Final Schedule").Range("AK" +
CStr(location)).Interior.ColorIndex = 46
ThisWorkbook.Sheets("Final Schedule").Range("AL" +
CStr(location)).Value = "p"
ThisWorkbook.Sheets("Final Schedule").Range("AL" +
CStr(location)).Interior.ColorIndex = 46
Else
ThisWorkbook.Sheets("Final Schedule").Range("AK" +
CStr(location)).Value = "-"
ThisWorkbook.Sheets("Final Schedule").Range("AL" +
CStr(location)).Value = "-"
End If
If timeP > 0.5 Then
ThisWorkbook.Sheets("Final Schedule").Range("AM" +
CStr(location)).Value = "p"
ThisWorkbook.Sheets("Final Schedule").Range("AM" +
CStr(location)).Interior.ColorIndex = 46
ThisWorkbook.Sheets("Final Schedule").Range("AN" +
CStr(location)).Value = "p"
ThisWorkbook.Sheets("Final Schedule").Range("AN" +
CStr(location)).Interior.ColorIndex = 46
Else
ThisWorkbook.Sheets("Final Schedule").Range("AM" +
CStr(location)).Value = "-"
ThisWorkbook.Sheets("Final Schedule").Range("AN" +
CStr(location)).Value = "-"
End If
If timeQ > 0.5 Then
ThisWorkbook.Sheets("Final Schedule").Range("AO" +
CStr(location)).Value = "p"
ThisWorkbook.Sheets("Final Schedule").Range("AO" +
CStr(location)).Interior.ColorIndex = 46
ThisWorkbook.Sheets("Final Schedule").Range("AP" +
CStr(location)).Value = "p"
ThisWorkbook.Sheets("Final Schedule").Range("AP" +
CStr(location)).Interior.ColorIndex = 46
Else
ThisWorkbook.Sheets("Final Schedule").Range("AO" +
CStr(location)).Value = "-"
ThisWorkbook.Sheets("Final Schedule").Range("AP" +
CStr(location)).Value = "-"
End If
Katherine M. Perry
81
If timeR > 0.5 Then
ThisWorkbook.Sheets("Final Schedule").Range("AQ" +
CStr(location)).Value = "p"
ThisWorkbook.Sheets("Final Schedule").Range("AQ" +
CStr(location)).Interior.ColorIndex = 46
ThisWorkbook.Sheets("Final Schedule").Range("AR" +
CStr(location)).Value = "p"
ThisWorkbook.Sheets("Final Schedule").Range("AR" +
CStr(location)).Interior.ColorIndex = 46
Else
ThisWorkbook.Sheets("Final Schedule").Range("AQ" +
CStr(location)).Value = "-"
ThisWorkbook.Sheets("Final Schedule").Range("AR" +
CStr(location)).Value = "-"
End If
If timeS > 0.5 Then
ThisWorkbook.Sheets("Final Schedule").Range("AS" +
CStr(location)).Value = "p"
ThisWorkbook.Sheets("Final Schedule").Range("AS" +
CStr(location)).Interior.ColorIndex = 46
ThisWorkbook.Sheets("Final Schedule").Range("AT" +
CStr(location)).Value = "p"
ThisWorkbook.Sheets("Final Schedule").Range("AT" +
CStr(location)).Interior.ColorIndex = 46
Else
ThisWorkbook.Sheets("Final Schedule").Range("AS" +
CStr(location)).Value = "-"
ThisWorkbook.Sheets("Final Schedule").Range("AT" +
CStr(location)).Value = "-"
End If
If timeT > 0.5 Then
ThisWorkbook.Sheets("Final Schedule").Range("AU" +
CStr(location)).Value = "p"
ThisWorkbook.Sheets("Final Schedule").Range("AU" +
CStr(location)).Interior.ColorIndex = 46
ThisWorkbook.Sheets("Final Schedule").Range("AV" +
CStr(location)).Value = "p"
ThisWorkbook.Sheets("Final Schedule").Range("AV" +
CStr(location)).Interior.ColorIndex = 46
Else
ThisWorkbook.Sheets("Final Schedule").Range("AU" +
CStr(location)).Value = "-"
ThisWorkbook.Sheets("Final Schedule").Range("AV" +
CStr(location)).Value = "-"
End If
If timeU > 0.5 Then
ThisWorkbook.Sheets("Final Schedule").Range("AW" +
CStr(location)).Value = "p"
ThisWorkbook.Sheets("Final Schedule").Range("AW" +
CStr(location)).Interior.ColorIndex = 46
ThisWorkbook.Sheets("Final Schedule").Range("AX" +
CStr(location)).Value = "p"
ThisWorkbook.Sheets("Final Schedule").Range("AX" +
CStr(location)).Interior.ColorIndex = 46
Else

Katherine M. Perry
82
ThisWorkbook.Sheets("Final Schedule").Range("AW" +
CStr(location)).Value = "-"
ThisWorkbook.Sheets("Final Schedule").Range("AX" +
CStr(location)).Value = "-"
End If
If timeV > 0.5 Then
ThisWorkbook.Sheets("Final Schedule").Range("AY" +
CStr(location)).Value = "p"
ThisWorkbook.Sheets("Final Schedule").Range("AY" +
CStr(location)).Interior.ColorIndex = 46
ThisWorkbook.Sheets("Final Schedule").Range("AZ" +
CStr(location)).Value = "p"
ThisWorkbook.Sheets("Final Schedule").Range("AZ" +
CStr(location)).Interior.ColorIndex = 46
Else
ThisWorkbook.Sheets("Final Schedule").Range("AY" +
CStr(location)).Value = "-"
ThisWorkbook.Sheets("Final Schedule").Range("AZ" +
CStr(location)).Value = "-"
End If
If timeW > 0.5 Then
ThisWorkbook.Sheets("Final Schedule").Range("BA" +
CStr(location)).Value = "p"
ThisWorkbook.Sheets("Final Schedule").Range("BA" +
CStr(location)).Interior.ColorIndex = 46
ThisWorkbook.Sheets("Final Schedule").Range("BB" +
CStr(location)).Value = "p"
ThisWorkbook.Sheets("Final Schedule").Range("BB" +
CStr(location)).Interior.ColorIndex = 46
Else
ThisWorkbook.Sheets("Final Schedule").Range("BA" +
CStr(location)).Value = "-"
ThisWorkbook.Sheets("Final Schedule").Range("BB" +
CStr(location)).Value = "-"
End If
If timeX > 0.5 Then
ThisWorkbook.Sheets("Final Schedule").Range("BC" +
CStr(location)).Value = "p"
ThisWorkbook.Sheets("Final Schedule").Range("BC" +
CStr(location)).Interior.ColorIndex = 46
ThisWorkbook.Sheets("Final Schedule").Range("BD" +
CStr(location)).Value = "p"
ThisWorkbook.Sheets("Final Schedule").Range("BD" +
CStr(location)).Interior.ColorIndex = 46
Else
ThisWorkbook.Sheets("Final Schedule").Range("BC" +
CStr(location)).Value = "-"
ThisWorkbook.Sheets("Final Schedule").Range("BD" +
CStr(location)).Value = "-"
End If
If timeY > 0.5 Then
ThisWorkbook.Sheets("Final Schedule").Range("BE" +
CStr(location)).Value = "p"
ThisWorkbook.Sheets("Final Schedule").Range("BE" +
CStr(location)).Interior.ColorIndex = 46
Katherine M. Perry
83
ThisWorkbook.Sheets("Final Schedule").Range("BF" +
CStr(location)).Value = "p"
ThisWorkbook.Sheets("Final Schedule").Range("BF" +
CStr(location)).Interior.ColorIndex = 46
Else
ThisWorkbook.Sheets("Final Schedule").Range("BE" +
CStr(location)).Value = "-"
ThisWorkbook.Sheets("Final Schedule").Range("BF" +
CStr(location)).Value = "-"
End If
If timeZ > 0.5 Then
ThisWorkbook.Sheets("Final Schedule").Range("BG" +
CStr(location)).Value = "p"
ThisWorkbook.Sheets("Final Schedule").Range("BG" +
CStr(location)).Interior.ColorIndex = 46
ThisWorkbook.Sheets("Final Schedule").Range("BH" +
CStr(location)).Value = "p"
ThisWorkbook.Sheets("Final Schedule").Range("BH" +
CStr(location)).Interior.ColorIndex = 46
Else
ThisWorkbook.Sheets("Final Schedule").Range("BG" +
CStr(location)).Value = "-"
ThisWorkbook.Sheets("Final Schedule").Range("BH" +
CStr(location)).Value = "-"
End If
If ThisWorkbook.Sheets("Detailed Schedules").Range("B" +
CStr(rownum)).Value = "8-Hour" Then
ThisWorkbook.Sheets("Final Schedule").Range("K" +
CStr(location)).Value = "8-Hour"
Else
'ThisWorkbook.Sheets("Detailed Schedules").Range("B" +
CStr(rownum)).Value = "10-hour" Then
ThisWorkbook.Sheets("Final Schedule").Range("K" +
CStr(location)).Value = "10-Hour"
If ThisWorkbook.Sheets("Detailed Schedules").Range("AB" +
CStr(rownum)).Value = "0" Then
ThisWorkbook.Sheets("Final Schedule").Range("J" +
CStr(location)).Value = "Monday"
ElseIf ThisWorkbook.Sheets("Detailed Schedules").Range("AC" +
CStr(rownum)).Value = "0" Then
ThisWorkbook.Sheets("Final Schedule").Range("J" +
CStr(location)).Value = "Tuesday"
ElseIf ThisWorkbook.Sheets("Detailed Schedules").Range("AD" +
CStr(rownum)).Value = "0" Then
ThisWorkbook.Sheets("Final Schedule").Range("J" +
CStr(location)).Value = "Wednesday"
ElseIf ThisWorkbook.Sheets("Detailed Schedules").Range("AE" +
CStr(rownum)).Value = "0" Then
ThisWorkbook.Sheets("Final Schedule").Range("J" +
CStr(location)).Value = "Thursday"
ElseIf ThisWorkbook.Sheets("Detailed Schedules").Range("AF" +
CStr(rownum)).Value = "0" Then
ThisWorkbook.Sheets("Final Schedule").Range("J" +
CStr(location)).Value = "Friday"
End If
Katherine M. Perry
84
End If
location = location + 1
Next j
End If
Next rownum
End With
Application.Calculation = xlCalculationAutomatic
ThisWorkbook.Sheets("Final Schedule").Range("M5:BH5").Copy
ThisWorkbook.Sheets("Gap Analysis").Range("B3:AW3").PasteSpecial xlPasteValues
End Sub
4.2.3 Optimize Macro
Sub Optimize()
Application.DisplayAlerts = False
Dim numP As Integer, num10 As Integer, num8 As Integer
ThisWorkbook.Sheets("Schedules").Select
Range("K1").Select
Range(Selection, Selection.End(xlToLeft)).Select
Set fR = Range(Selection, Selection.End(xlDown))
fR.AutoFilter Field:=10
numP = ThisWorkbook.Sheets("Parameters").Range("numPer")
num10 = ThisWorkbook.Sheets("Parameters").Range("_num10")
num8 = ThisWorkbook.Sheets("Parameters").Range("_num8")
ThisWorkbook.Sheets("Detailed Schedules").Activate
Set curDetR = Range("A2")
i = 1
Do Until curDetR = ""
i = i + 1
Set curDetR = curDetR.Offset(1, 0)
Loop
Range(curDetR.Offset(0, 26), curDetR.Offset(0, 26).End(xlDown)).ClearContents
SolverReset
SolverOk SetCell:="$AH$2", MaxMinVal:=2, ValueOf:="0", ByChange:="$AA$2:$AA$" & i
SolverOptions MaxTime:=10000, Iterations:=10000, Precision:=0.000001,
AssumeLinear:=True, StepThru:=False, Estimates:=1, Derivatives:=1, SearchOption:=1,
IntTolerance:=5, Scaling:=False, Convergence:=0.0001, AssumeNonNeg:=True
SolverAdd CellRef:="$AA$2:$AA$" & i, Relation:=3, FormulaText:="0"
SolverAdd CellRef:="$AA$2:$AA$" & i, Relation:=4, FormulaText:="integer"
'SolverAdd CellRef:="$AI$2", Relation:=3, FormulaText:="0"
SolverAdd CellRef:="$AM$15:$BJ$19", Relation:=3, FormulaText:="0"
SolverAdd CellRef:="$AJ$2", Relation:=2, FormulaText:=CStr(num10)
SolverAdd CellRef:="$AK$2", Relation:=2, FormulaText:=CStr(num8)
SolverOk SetCell:="$AH$2", MaxMinVal:=2, ValueOf:="0", ByChange:="$AA$2:$AA$" & i
'SolverSolve
Katherine M. Perry
85
RunOpenSolver False
Sheets("Schedules").Select
Range("K1").Select
Range(Selection, Selection.End(xlToLeft)).Select
Set fR = Range(Selection, Selection.End(xlDown))
fR.AutoFilter
fR.AutoFilter Field:=10, Criteria1:=">=0.5", Operator:=xlAnd
Application.DisplayAlerts = True
ThisWorkbook.Sheets("Schedules").Range("A1").Select
Application.Calculation = xlCalculationAutomatic
Application.Calculation = xlCalculationManual
ThisWorkbook.Sheets("Final Schedule").Range("J12:BH100").ClearContents
ThisWorkbook.Sheets("Final Schedule").Range("J12:BH100").Interior.ColorIndex =
xlNone
With ThisWorkbook.Sheets("Detailed Schedules")
Dim location As Integer
location = 12
Dim endrow As Integer, rownum As Integer, numemployees As Integer
Dim timeC As Integer, timeD As Integer, timeE As Integer, timeF As Integer,
timeG As Integer, timeH As Integer, timeI As Integer, timeJ As Integer, timeK As
Integer, timeL As Integer, timeM As Integer, timeN As Integer, timeO As Integer, timeP
As Integer, timeQ As Integer, timeR As Integer, timeS As Integer, timeT As Integer,
timeU As Integer, timeV As Integer, timeW As Integer, timeX As Integer, timeY As
Integer, timeZ As Integer
endrow = Application.CountA(ThisWorkbook.Sheets("Detailed
Schedules").Range("A:A"))
For rownum = 2 To endrow
numemployees = WorksheetFunction.Round(.Range("AA" + CStr(rownum)), 1)
If numemployees > 0 Then
'scheduletype = Range("B" + CStr(rownum))
timeC = WorksheetFunction.Round(.Range("C" + CStr(rownum)), 1)
timeD = WorksheetFunction.Round(.Range("D" + CStr(rownum)), 1)
timeE = WorksheetFunction.Round(.Range("E" + CStr(rownum)), 1)
timeF = WorksheetFunction.Round(.Range("F" + CStr(rownum)), 1)
timeG = WorksheetFunction.Round(.Range("G" + CStr(rownum)), 1)
timeH = WorksheetFunction.Round(.Range("H" + CStr(rownum)), 1)
timeI = WorksheetFunction.Round(.Range("I" + CStr(rownum)), 1)
timeJ = WorksheetFunction.Round(.Range("J" + CStr(rownum)), 1)
timeK = WorksheetFunction.Round(.Range("K" + CStr(rownum)), 1)
timeL = WorksheetFunction.Round(.Range("L" + CStr(rownum)), 1)
timeM = WorksheetFunction.Round(.Range("M" + CStr(rownum)), 1)
timeN = WorksheetFunction.Round(.Range("N" + CStr(rownum)), 1)
timeO = WorksheetFunction.Round(.Range("O" + CStr(rownum)), 1)
timeP = WorksheetFunction.Round(.Range("P" + CStr(rownum)), 1)
timeQ = WorksheetFunction.Round(.Range("Q" + CStr(rownum)), 1)
timeR = WorksheetFunction.Round(.Range("R" + CStr(rownum)), 1)
timeS = WorksheetFunction.Round(.Range("S" + CStr(rownum)), 1)
timeT = WorksheetFunction.Round(.Range("T" + CStr(rownum)), 1)
timeU = WorksheetFunction.Round(.Range("U" + CStr(rownum)), 1)
timeV = WorksheetFunction.Round(.Range("V" + CStr(rownum)), 1)
timeW = WorksheetFunction.Round(.Range("W" + CStr(rownum)), 1)
Katherine M. Perry
86
timeX = WorksheetFunction.Round(.Range("X" + CStr(rownum)), 1)
timeY = WorksheetFunction.Round(.Range("Y" + CStr(rownum)), 1)
timeZ = WorksheetFunction.Round(.Range("Z" + CStr(rownum)), 1)
Dim j As Integer
For j = 1 To numemployees
'insert printing cells running through columns of time periods
If timeC > 0.5 Then
ThisWorkbook.Sheets("Final Schedule").Range("M" +
CStr(location)).Value = "p"
ThisWorkbook.Sheets("Final Schedule").Range("M" +
CStr(location)).Interior.ColorIndex = 46
ThisWorkbook.Sheets("Final Schedule").Range("N" +
CStr(location)).Value = "p"
ThisWorkbook.Sheets("Final Schedule").Range("N" +
CStr(location)).Interior.ColorIndex = 46
Else
ThisWorkbook.Sheets("Final Schedule").Range("M" +
CStr(location)).Value = "-"
ThisWorkbook.Sheets("Final Schedule").Range("N" +
CStr(location)).Value = "-"
End If
If timeD > 0.5 Then
ThisWorkbook.Sheets("Final Schedule").Range("O" +
CStr(location)).Value = "p"
ThisWorkbook.Sheets("Final Schedule").Range("O" +
CStr(location)).Interior.ColorIndex = 46
ThisWorkbook.Sheets("Final Schedule").Range("P" +
CStr(location)).Value = "p"
ThisWorkbook.Sheets("Final Schedule").Range("P" +
CStr(location)).Interior.ColorIndex = 46
Else
ThisWorkbook.Sheets("Final Schedule").Range("O" +
CStr(location)).Value = "-"
ThisWorkbook.Sheets("Final Schedule").Range("P" +
CStr(location)).Value = "-"
End If
If timeE > 0.5 Then
ThisWorkbook.Sheets("Final Schedule").Range("Q" +
CStr(location)).Value = "p"
ThisWorkbook.Sheets("Final Schedule").Range("Q" +
CStr(location)).Interior.ColorIndex = 46
ThisWorkbook.Sheets("Final Schedule").Range("R" +
CStr(location)).Value = "p"
ThisWorkbook.Sheets("Final Schedule").Range("R" +
CStr(location)).Interior.ColorIndex = 46
Else
ThisWorkbook.Sheets("Final Schedule").Range("Q" +
CStr(location)).Value = "-"
ThisWorkbook.Sheets("Final Schedule").Range("R" +
CStr(location)).Value = "-"
End If
If timeF > 0.5 Then
ThisWorkbook.Sheets("Final Schedule").Range("S" +
CStr(location)).Value = "p"
Katherine M. Perry
87
ThisWorkbook.Sheets("Final Schedule").Range("S" +
CStr(location)).Interior.ColorIndex = 46
ThisWorkbook.Sheets("Final Schedule").Range("T" +
CStr(location)).Value = "p"
ThisWorkbook.Sheets("Final Schedule").Range("T" +
CStr(location)).Interior.ColorIndex = 46
Else
ThisWorkbook.Sheets("Final Schedule").Range("S" +
CStr(location)).Value = "-"
ThisWorkbook.Sheets("Final Schedule").Range("T" +
CStr(location)).Value = "-"
End If
If timeG > 0.5 Then
ThisWorkbook.Sheets("Final Schedule").Range("U" +
CStr(location)).Value = "p"
ThisWorkbook.Sheets("Final Schedule").Range("U" +
CStr(location)).Interior.ColorIndex = 46
ThisWorkbook.Sheets("Final Schedule").Range("V" +
CStr(location)).Value = "p"
ThisWorkbook.Sheets("Final Schedule").Range("V" +
CStr(location)).Interior.ColorIndex = 46
Else
ThisWorkbook.Sheets("Final Schedule").Range("U" +
CStr(location)).Value = "-"
ThisWorkbook.Sheets("Final Schedule").Range("V" +
CStr(location)).Value = "-"
End If
If timeH > 0.5 Then
ThisWorkbook.Sheets("Final Schedule").Range("W" +
CStr(location)).Value = "p"
ThisWorkbook.Sheets("Final Schedule").Range("W" +
CStr(location)).Interior.ColorIndex = 46
ThisWorkbook.Sheets("Final Schedule").Range("X" +
CStr(location)).Value = "p"
ThisWorkbook.Sheets("Final Schedule").Range("X" +
CStr(location)).Interior.ColorIndex = 46
Else
ThisWorkbook.Sheets("Final Schedule").Range("W" +
CStr(location)).Value = "-"
ThisWorkbook.Sheets("Final Schedule").Range("X" +
CStr(location)).Value = "-"
End If
If timeI > 0.5 Then
ThisWorkbook.Sheets("Final Schedule").Range("Y" +
CStr(location)).Value = "p"
ThisWorkbook.Sheets("Final Schedule").Range("Y" +
CStr(location)).Interior.ColorIndex = 46
ThisWorkbook.Sheets("Final Schedule").Range("Z" +
CStr(location)).Value = "p"
ThisWorkbook.Sheets("Final Schedule").Range("Z" +
CStr(location)).Interior.ColorIndex = 46
Else
ThisWorkbook.Sheets("Final Schedule").Range("Y" +
CStr(location)).Value = "-"
Katherine M. Perry
88
ThisWorkbook.Sheets("Final Schedule").Range("Z" +
CStr(location)).Value = "-"
End If
If timeJ > 0.5 Then
ThisWorkbook.Sheets("Final Schedule").Range("AA" +
CStr(location)).Value = "p"
ThisWorkbook.Sheets("Final Schedule").Range("AA" +
CStr(location)).Interior.ColorIndex = 46
ThisWorkbook.Sheets("Final Schedule").Range("AB" +
CStr(location)).Value = "p"
ThisWorkbook.Sheets("Final Schedule").Range("AB" +
CStr(location)).Interior.ColorIndex = 46
Else
ThisWorkbook.Sheets("Final Schedule").Range("AA" +
CStr(location)).Value = "-"
ThisWorkbook.Sheets("Final Schedule").Range("AB" +
CStr(location)).Value = "-"
End If
If timeK > 0.5 Then
ThisWorkbook.Sheets("Final Schedule").Range("AC" +
CStr(location)).Value = "p"
ThisWorkbook.Sheets("Final Schedule").Range("AC" +
CStr(location)).Interior.ColorIndex = 46
ThisWorkbook.Sheets("Final Schedule").Range("AD" +
CStr(location)).Value = "p"
ThisWorkbook.Sheets("Final Schedule").Range("AD" +
CStr(location)).Interior.ColorIndex = 46
Else
ThisWorkbook.Sheets("Final Schedule").Range("AC" +
CStr(location)).Value = "-"
ThisWorkbook.Sheets("Final Schedule").Range("AD" +
CStr(location)).Value = "-"
End If
If timeL > 0.5 Then
ThisWorkbook.Sheets("Final Schedule").Range("AE" +
CStr(location)).Value = "p"
ThisWorkbook.Sheets("Final Schedule").Range("AE" +
CStr(location)).Interior.ColorIndex = 46
ThisWorkbook.Sheets("Final Schedule").Range("AF" +
CStr(location)).Value = "p"
ThisWorkbook.Sheets("Final Schedule").Range("AF" +
CStr(location)).Interior.ColorIndex = 46
Else
ThisWorkbook.Sheets("Final Schedule").Range("AE" +
CStr(location)).Value = "-"
ThisWorkbook.Sheets("Final Schedule").Range("AF" +
CStr(location)).Value = "-"
End If
If timeM > 0.5 Then
ThisWorkbook.Sheets("Final Schedule").Range("AG" +
CStr(location)).Value = "p"
ThisWorkbook.Sheets("Final Schedule").Range("AG" +
CStr(location)).Interior.ColorIndex = 46
ThisWorkbook.Sheets("Final Schedule").Range("AH" +
CStr(location)).Value = "p"
Katherine M. Perry
89
ThisWorkbook.Sheets("Final Schedule").Range("AH" +
CStr(location)).Interior.ColorIndex = 46
Else
ThisWorkbook.Sheets("Final Schedule").Range("AG" +
CStr(location)).Value = "-"
ThisWorkbook.Sheets("Final Schedule").Range("AH" +
CStr(location)).Value = "-"
End If
If timeN > 0.5 Then
ThisWorkbook.Sheets("Final Schedule").Range("AI" +
CStr(location)).Value = "p"
ThisWorkbook.Sheets("Final Schedule").Range("AI" +
CStr(location)).Interior.ColorIndex = 46
ThisWorkbook.Sheets("Final Schedule").Range("AJ" +
CStr(location)).Value = "p"
ThisWorkbook.Sheets("Final Schedule").Range("AJ" +
CStr(location)).Interior.ColorIndex = 46
Else
ThisWorkbook.Sheets("Final Schedule").Range("AI" +
CStr(location)).Value = "-"
ThisWorkbook.Sheets("Final Schedule").Range("AJ" +
CStr(location)).Value = "-"
End If
If timeO > 0.5 Then
ThisWorkbook.Sheets("Final Schedule").Range("AK" +
CStr(location)).Value = "p"
ThisWorkbook.Sheets("Final Schedule").Range("AK" +
CStr(location)).Interior.ColorIndex = 46
ThisWorkbook.Sheets("Final Schedule").Range("AL" +
CStr(location)).Value = "p"
ThisWorkbook.Sheets("Final Schedule").Range("AL" +
CStr(location)).Interior.ColorIndex = 46
Else
ThisWorkbook.Sheets("Final Schedule").Range("AK" +
CStr(location)).Value = "-"
ThisWorkbook.Sheets("Final Schedule").Range("AL" +
CStr(location)).Value = "-"
End If
If timeP > 0.5 Then
ThisWorkbook.Sheets("Final Schedule").Range("AM" +
CStr(location)).Value = "p"
ThisWorkbook.Sheets("Final Schedule").Range("AM" +
CStr(location)).Interior.ColorIndex = 46
ThisWorkbook.Sheets("Final Schedule").Range("AN" +
CStr(location)).Value = "p"
ThisWorkbook.Sheets("Final Schedule").Range("AN" +
CStr(location)).Interior.ColorIndex = 46
Else
ThisWorkbook.Sheets("Final Schedule").Range("AM" +
CStr(location)).Value = "-"
ThisWorkbook.Sheets("Final Schedule").Range("AN" +
CStr(location)).Value = "-"
End If
If timeQ > 0.5 Then
Katherine M. Perry
90
ThisWorkbook.Sheets("Final Schedule").Range("AO" +
CStr(location)).Value = "p"
ThisWorkbook.Sheets("Final Schedule").Range("AO" +
CStr(location)).Interior.ColorIndex = 46
ThisWorkbook.Sheets("Final Schedule").Range("AP" +
CStr(location)).Value = "p"
ThisWorkbook.Sheets("Final Schedule").Range("AP" +
CStr(location)).Interior.ColorIndex = 46
Else
ThisWorkbook.Sheets("Final Schedule").Range("AO" +
CStr(location)).Value = "-"
ThisWorkbook.Sheets("Final Schedule").Range("AP" +
CStr(location)).Value = "-"
End If
If timeR > 0.5 Then
ThisWorkbook.Sheets("Final Schedule").Range("AQ" +
CStr(location)).Value = "p"
ThisWorkbook.Sheets("Final Schedule").Range("AQ" +
CStr(location)).Interior.ColorIndex = 46
ThisWorkbook.Sheets("Final Schedule").Range("AR" +
CStr(location)).Value = "p"
ThisWorkbook.Sheets("Final Schedule").Range("AR" +
CStr(location)).Interior.ColorIndex = 46
Else
ThisWorkbook.Sheets("Final Schedule").Range("AQ" +
CStr(location)).Value = "-"
ThisWorkbook.Sheets("Final Schedule").Range("AR" +
CStr(location)).Value = "-"
End If
If timeS > 0.5 Then
ThisWorkbook.Sheets("Final Schedule").Range("AS" +
CStr(location)).Value = "p"
ThisWorkbook.Sheets("Final Schedule").Range("AS" +
CStr(location)).Interior.ColorIndex = 46
ThisWorkbook.Sheets("Final Schedule").Range("AT" +
CStr(location)).Value = "p"
ThisWorkbook.Sheets("Final Schedule").Range("AT" +
CStr(location)).Interior.ColorIndex = 46
Else
ThisWorkbook.Sheets("Final Schedule").Range("AS" +
CStr(location)).Value = "-"
ThisWorkbook.Sheets("Final Schedule").Range("AT" +
CStr(location)).Value = "-"
End If
If timeT > 0.5 Then
ThisWorkbook.Sheets("Final Schedule").Range("AU" +
CStr(location)).Value = "p"
ThisWorkbook.Sheets("Final Schedule").Range("AU" +
CStr(location)).Interior.ColorIndex = 46
ThisWorkbook.Sheets("Final Schedule").Range("AV" +
CStr(location)).Value = "p"
ThisWorkbook.Sheets("Final Schedule").Range("AV" +
CStr(location)).Interior.ColorIndex = 46
Else

Katherine M. Perry
91
ThisWorkbook.Sheets("Final Schedule").Range("AU" +
CStr(location)).Value = "-"
ThisWorkbook.Sheets("Final Schedule").Range("AV" +
CStr(location)).Value = "-"
End If
If timeU > 0.5 Then
ThisWorkbook.Sheets("Final Schedule").Range("AW" +
CStr(location)).Value = "p"
ThisWorkbook.Sheets("Final Schedule").Range("AW" +
CStr(location)).Interior.ColorIndex = 46
ThisWorkbook.Sheets("Final Schedule").Range("AX" +
CStr(location)).Value = "p"
ThisWorkbook.Sheets("Final Schedule").Range("AX" +
CStr(location)).Interior.ColorIndex = 46
Else
ThisWorkbook.Sheets("Final Schedule").Range("AW" +
CStr(location)).Value = "-"
ThisWorkbook.Sheets("Final Schedule").Range("AX" +
CStr(location)).Value = "-"
End If
If timeV > 0.5 Then
ThisWorkbook.Sheets("Final Schedule").Range("AY" +
CStr(location)).Value = "p"
ThisWorkbook.Sheets("Final Schedule").Range("AY" +
CStr(location)).Interior.ColorIndex = 46
ThisWorkbook.Sheets("Final Schedule").Range("AZ" +
CStr(location)).Value = "p"
ThisWorkbook.Sheets("Final Schedule").Range("AZ" +
CStr(location)).Interior.ColorIndex = 46
Else
ThisWorkbook.Sheets("Final Schedule").Range("AY" +
CStr(location)).Value = "-"
ThisWorkbook.Sheets("Final Schedule").Range("AZ" +
CStr(location)).Value = "-"
End If
If timeW > 0.5 Then
ThisWorkbook.Sheets("Final Schedule").Range("BA" +
CStr(location)).Value = "p"
ThisWorkbook.Sheets("Final Schedule").Range("BA" +
CStr(location)).Interior.ColorIndex = 46
ThisWorkbook.Sheets("Final Schedule").Range("BB" +
CStr(location)).Value = "p"
ThisWorkbook.Sheets("Final Schedule").Range("BB" +
CStr(location)).Interior.ColorIndex = 46
Else
ThisWorkbook.Sheets("Final Schedule").Range("BA" +
CStr(location)).Value = "-"
ThisWorkbook.Sheets("Final Schedule").Range("BB" +
CStr(location)).Value = "-"
End If
If timeX > 0.5 Then
ThisWorkbook.Sheets("Final Schedule").Range("BC" +
CStr(location)).Value = "p"
ThisWorkbook.Sheets("Final Schedule").Range("BC" +
CStr(location)).Interior.ColorIndex = 46
Katherine M. Perry
92
ThisWorkbook.Sheets("Final Schedule").Range("BD" +
CStr(location)).Value = "p"
ThisWorkbook.Sheets("Final Schedule").Range("BD" +
CStr(location)).Interior.ColorIndex = 46
Else
ThisWorkbook.Sheets("Final Schedule").Range("BC" +
CStr(location)).Value = "-"
ThisWorkbook.Sheets("Final Schedule").Range("BD" +
CStr(location)).Value = "-"
End If
If timeY > 0.5 Then
ThisWorkbook.Sheets("Final Schedule").Range("BE" +
CStr(location)).Value = "p"
ThisWorkbook.Sheets("Final Schedule").Range("BE" +
CStr(location)).Interior.ColorIndex = 46
ThisWorkbook.Sheets("Final Schedule").Range("BF" +
CStr(location)).Value = "p"
ThisWorkbook.Sheets("Final Schedule").Range("BF" +
CStr(location)).Interior.ColorIndex = 46
Else
ThisWorkbook.Sheets("Final Schedule").Range("BE" +
CStr(location)).Value = "-"
ThisWorkbook.Sheets("Final Schedule").Range("BF" +
CStr(location)).Value = "-"
End If
If timeZ > 0.5 Then
ThisWorkbook.Sheets("Final Schedule").Range("BG" +
CStr(location)).Value = "p"
ThisWorkbook.Sheets("Final Schedule").Range("BG" +
CStr(location)).Interior.ColorIndex = 46
ThisWorkbook.Sheets("Final Schedule").Range("BH" +
CStr(location)).Value = "p"
ThisWorkbook.Sheets("Final Schedule").Range("BH" +
CStr(location)).Interior.ColorIndex = 46
Else
ThisWorkbook.Sheets("Final Schedule").Range("BG" +
CStr(location)).Value = "-"
ThisWorkbook.Sheets("Final Schedule").Range("BH" +
CStr(location)).Value = "-"
End If
If ThisWorkbook.Sheets("Detailed Schedules").Range("B" +
CStr(rownum)).Value = "8-Hour" Then
ThisWorkbook.Sheets("Final Schedule").Range("K" +
CStr(location)).Value = "8-Hour"
Else
'ThisWorkbook.Sheets("Detailed Schedules").Range("B" +
CStr(rownum)).Value = "10-hour" Then
ThisWorkbook.Sheets("Final Schedule").Range("K" +
CStr(location)).Value = "10-Hour"
If ThisWorkbook.Sheets("Detailed Schedules").Range("AB" +
CStr(rownum)).Value = "0" Then
ThisWorkbook.Sheets("Final Schedule").Range("J" +
CStr(location)).Value = "Monday"
ElseIf ThisWorkbook.Sheets("Detailed Schedules").Range("AC" +
CStr(rownum)).Value = "0" Then
Katherine M. Perry
93
ThisWorkbook.Sheets("Final Schedule").Range("J" +
CStr(location)).Value = "Tuesday"
ElseIf ThisWorkbook.Sheets("Detailed Schedules").Range("AD" +
CStr(rownum)).Value = "0" Then
ThisWorkbook.Sheets("Final Schedule").Range("J" +
CStr(location)).Value = "Wednesday"
ElseIf ThisWorkbook.Sheets("Detailed Schedules").Range("AE" +
CStr(rownum)).Value = "0" Then
ThisWorkbook.Sheets("Final Schedule").Range("J" +
CStr(location)).Value = "Thursday"
ElseIf ThisWorkbook.Sheets("Detailed Schedules").Range("AF" +
CStr(rownum)).Value = "0" Then
ThisWorkbook.Sheets("Final Schedule").Range("J" +
CStr(location)).Value = "Friday"
End If
End If
location = location + 1
Next j
End If
Next rownum
End With
Application.Calculation = xlCalculationAutomatic
ThisWorkbook.Sheets("Final Schedule").Range("M5:BH5").Copy
ThisWorkbook.Sheets("Gap Analysis").Range("B3:AW3").PasteSpecial xlPasteValues
End Sub
4.2.4 Select Demand Macros
Sub RoundUp()
ThisWorkbook.Sheets("Format").Range("E3:E26").Copy
ThisWorkbook.Sheets("Demand").Range("B2:F25").PasteSpecial xlPasteValues
End Sub
Sub Round()
ThisWorkbook.Sheets("Format").Range("F3:F26").Copy
ThisWorkbook.Sheets("Demand").Range("B2:F25").PasteSpecial xlPasteValues
End Sub
Sub RoundDown()
ThisWorkbook.Sheets("Format").Range("G3:G26").Copy
ThisWorkbook.Sheets("Demand").Range("B2:F25").PasteSpecial xlPasteValues
Katherine M. Perry
94
End Sub
Sub RoundUpwithVacancy()
ThisWorkbook.Sheets("Format").Range("J3:J26").Copy
ThisWorkbook.Sheets("Demand").Range("B2:F25").PasteSpecial xlPasteValues
End Sub
Sub RoundwithVacancy()
ThisWorkbook.Sheets("Format").Range("K3:K26").Copy
ThisWorkbook.Sheets("Demand").Range("B2:F25").PasteSpecial xlPasteValues
End Sub
Sub RoundDownwithVacancy()
ThisWorkbook.Sheets("Format").Range("L3:L26").Copy
ThisWorkbook.Sheets("Demand").Range("B2:F25").PasteSpecial xlPasteValues
End Sub

Katherine M. Perry
95