Embed Size (px)
Citation preview
California’s North Coast Fishing CommunitiesHistorical Perspective and Recent Trends
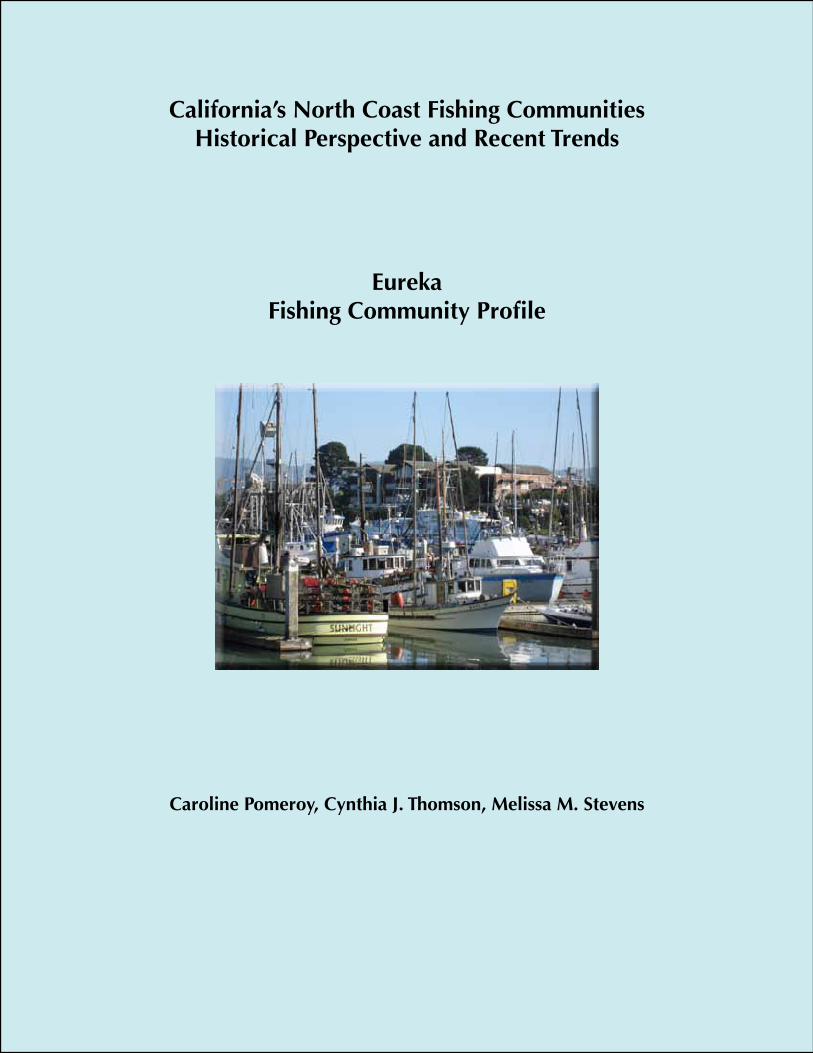
EurekaFishing Community Profile
Caroline Pomeroy, Cynthia J. Thomson, Melissa M. Stevens
Published by California Sea Grant College ProgramScripps Institution of OceanographyUniversity of California San Diego
9500 Gilman Drive #0231La Jolla CA 92093-0231
(858) 534-4446www.csgc.ucsd.edu
Publication No. T-072e
This document was supported in part by the National Sea Grant College Program of the U.S. Department of Commerce’s National Oceanic and Atmospheric Administration, and produced under NOAA grant number NA10OAR4170060, project number C/P-1 through the California Sea Grant College Program. The views expressed herein do not necessarily reflect the views of any of those organizations.
Sea Grant is a unique partnership of public and private sectors, combining research, education, and outreach for public service. It is a national network of universities meeting changing environmental and economic needs of people in our coastal, ocean, and Great Lakes regions.
California’s North Coast Fishing CommunitiesHistorical Perspective and Recent Trends
EurekaFishing Community Profile
Final Reportto the
California State Coastal ConservancyAward 06–128
Online November 2011
Original Report August 2010
Caroline Pomeroy1, Cynthia J. Thomson2, Melissa M. Stevens1,2
1 California Sea Grant, University of California, Santa Cruz, Center for Ocean Health, 100 Shaffer Road, Santa Cruz, CA 95060
2 NOAA, National Marine Fisheries Service, Southwest Fisheries Science Center, Fisheries Ecology Division, 110 Shaffer Road, Santa Cruz, CA 95060
Eureka Fishing Community Profile
Contents
Executive Summary ........................................................................................................................ iAcknowledgements ........................................................................................................................ viIntroduction ......................................................................................................................................1
History of the Port and the Surrounding Area .............................................................................2History of Eureka Area Fisheries ................................................................................................3
The Expansion of Local Fisheries .........................................................................................3The Expansion of Fishery Management .................................................................................7
A Brief History of Humboldt Bay Aquaculture .......................................................................10The Eureka Fishing Community Today .........................................................................................12
Commercial Fisheries ...............................................................................................................12Eureka Area Seafood Receiving, Processing and Marketing ....................................................13Ocean Recreational Fisheries ....................................................................................................14Harbor Infrastructure and Fishery-Support Businesses ............................................................15Fishing Organizations ..............................................................................................................17
Commercial Fishery Activity in the Eureka Area .........................................................................20Activity Within Commercial Fisheries......................................................................................24
The Groundfish Trawl Fishery .............................................................................................24The Dungeness Crab Pot Fishery .........................................................................................26The Salmon Troll Fishery .....................................................................................................27The Albacore Troll Fishery ..................................................................................................29The Sablefish Hook-and-Line Fishery .................................................................................30The Whiting (Hake) Trawl Fishery ......................................................................................32The Pink (Ocean) Shrimp Trawl Fishery .............................................................................33The Rockfish/Lingcod Hook-and-Line Fishery ...................................................................34
Commercial Fishery Combinations...........................................................................................35Revenue Per Boat ......................................................................................................................37
Recreational Fishery Activity in the Eureka Area .........................................................................39Recreational Fishing Effort .......................................................................................................39
Key Factors Affecting Eureka Area Fisheries ................................................................................41Regulatory Factors ...................................................................................................................41
Commercial Fisheries ...........................................................................................................41Recreational Fisheries ..........................................................................................................42Cumulative Effects of Regulatory Change ..........................................................................42
Economic Factors ......................................................................................................................44Infrastructure: Maintaining the Working Waterfront ................................................................45
Current Situation and Outlook .......................................................................................................47References ......................................................................................................................................49Endnotes .........................................................................................................................................53
Eureka Fishing Community Profile
Tables
Table 1. Current aquaculture facilities in the Humboldt Bay area .................................................11
Table 2. Seasonality of selected commercial fisheries at Eureka ...................................................12
Table 3. Product forms, processing location and destination of seafood landed at Eureka ...........15
Table 4. Seasonality of major recreational fisheries at Eureka ......................................................15
Table 5. Major Eureka area ocean fisheries infrastructure .............................................................16
Table 6. Eureka Area user groups, infrastructure and services, as of July 2008 ............................17
Table 7. Local support businesses used by Eureka fishery participants.........................................18
Table 8. Long-term and recent annual average, percent difference, and highs and lows in selected measures for commercial fisheries in the Eureka area, 1981–2007 .................................21
Table 9. Long-term and recent annual average, percent difference, and highs and lows in selected measures for the groundfish trawl fishery in the Eureka area, 1981–2007 ......................25
Table 10. Long-term and recent annual average, percent difference, and highs and lows in selected measures for the commercial crab pot fishery in the Eureka area, 1981–2007 ...............27
Table 11. Long-term and recent annual average, percent difference, and highs and (nonzero) lows in selected measures for the commercial salmon troll fishery in the Eureka area, 1981–2007 .............................................................................................................................28
Table 12. Long-term and recent annual average, percent difference, and highs and lows in selected measures for the commercial albacore troll fishery in the Eureka area, 1981–2007 .......30
Table 13. Long-term and recent annual average, percent difference, and highs and lows in selected measures for the commercial sablefish hook-and-line fishery in the Eureka area, 1981–2007......................................................................................................................................31
Table 14. Long-term and recent annual average, percent difference, and highs and lows in selected measures for the commercial whiting trawl fishery in the Eureka area, 1981–2007 .......32
Table 15. Long-term and recent annual average, percent difference, and highs and lows in selected measures for the commercial shrimp trawl fishery in the Eureka area, 1981–2007 ........34
Table 16. Long-term and recent annual average, percent difference, and highs and lows in selected measures for the commercial rockfish/lingcod hook-and-line fishery in the Eureka area, 1981–2007 .............................................................................................................................35
Table 17. Major three- and four-way fishery combinations utilized by Eureka area boats in each of three periods ......................................................................................................................37
Table 18. Average annual revenue per boat (2007$) for Eureka area boats, by major fishery and overall, 1981–1983, 1993–1995 and 2005–2007 ....................................................................38
Eureka Fishing Community Profile
Figures
Figure 1. Map of Eureka and Humboldt Bay, California .................................................................1
Figure 2. Pounds and ex-vessel value of commercial fishery landings at Eureka and Fields Landing combined, 1947–2007 .......................................................................................................5
Figure 3. Pathways of seafood landed at Eureka. Note: thicker arrows indicate most common pathways .........................................................................................................................14
Figure 4. Commercial fishery landings (millions of pounds) in the Eureka area for selected fisheries and overall, 1981–2007 ...................................................................................................21
Figure 5. Ex-vessel value (2007$) of commercial fishery landings in the Eureka area for selected fisheries and overall, 1981–2007 .....................................................................................22
Figure 6. Number of boats with commercial fishery landings in the Eureka area for selected fisheries and overall, 1981–2007 ...................................................................................................22
Figure 7. Number of trips by commercial fishing vessels landing in the Eureka area for selected fisheries and overall, 1981–2007 .....................................................................................23
Figure 8. Landings, ex-vessel value (2007$), and number of boats and buyers for the commercial groundfish trawl fishery in the Eureka area, 1981–2007 ...........................................25
Figure 9. Landings, ex-vessel value (2007$), and number of boats and buyers for the commercial Dungeness crab pot fishery in the Eureka area, 1981–2007 ......................................26
Figure 10. Landings, ex-vessel value (2007$), and number of boats and buyers for the commercial salmon troll fishery in the Eureka area, 1981–2007 ...................................................28
Figure 11. Landings, ex-vessel value (2007$), and number of boats and buyers for the commercial albacore troll fishery in the Eureka area, 1981–2007. ................................................29
Figure 12. Landings, ex-vessel value (2007$), and number of boats and buyers for the commercial sablefish hook-and-line fishery in the Eureka area, 1981–2007 ................................31
Figure 13. Landings, ex-vessel value (2007$), and number of boats and buyers for the commercial shrimp trawl fishery in the Eureka area, 1981–2007 .................................................33
Figure 14. Landings, ex-vessel value (2007$), and number of boats and buyers for the commercial rockfish/lingcod hook-and-line fishery in the Eureka area, 1981–2007 ....................35
Figure 15. Major one- and two-way fishery combinations utilized by Eureka area boats based on three-year averages for 1981–1983, 1993–1995 and 2005–2007 ...................................36
Figure 16. Number of boats with the plurality of revenue from landings in the Eureka area, and average annual revenue per boat, 1981–2007 .........................................................................37
Eureka Fishing Community Profile i
ExECuTivE Summary
Background
National Standard 8 of the Magnuson-Stevens Fishery Conservation and Management Act requires that fishery managers consider the importance of fishery resources to fishing communities, to provide for their sustained participation and to minimize adverse economic impacts on them, consistent with conservation objectives. Similarly, California’s Marine Life Management Act mandates the use of socioeconomic as well as biophysical Essential Fishery Information to meet fishery management goals. Information on how individual fisheries and port communities operate is important to meeting these mandates. Yet, such social science information on Northern California port communities has been sparse until recently.
This profile of the Eureka fishing community describes the history of the area and its fisheries, present-day fishery operations, activities and associated infrastructure. It identifies some of the key regulatory and economic factors highlighted by study participants that interact with and affect the local fishing community. It is intended for use in a range of processes, from local planning and education to state and regional management.
The information presented is based on the collection and integrated analysis of archival and field data to interpret patterns, variability and change within and across fisheries and the fishing community over time. Data sources include:
• Commercial fish landing receipt data for 1981–2007 reconfigured into 34 distinct species/gear combinations;
• Commercial Passenger Fishing Vessel (CPFV) logbook data for 1980–2007;
• An extensive review of the published and gray literature, including fishery status reports and historical fishery statistics (as available); and
• Field observation and interviews with about 50 fishery participants and knowledgeable others.
History of the Eureka Fishing Community
Located about 270 miles north of San Francisco, the city of Eureka and surrounding communities have supported commercial and recreational fisheries for well over a century. Eureka is situated on the shore of Humboldt Bay, a 25-square mile coastal estuary that supports a diverse ecosystem as well as fishing, recreation and shipping activities. Once home to the Wiyot peoples, Eureka became a hub for the gold mining and timber industries beginning in 1850, and for fishing shortly thereafter. Commercial fisheries for salmon, groundfish, crab, and shark (mainly for their livers) supported the growth of the industry. By the 1970s, over half of the fish (including shellfish such as oysters) produced and consumed in California were landed in the Humboldt Bay area. Recreational private boat and charter fisheries targeted salmon and other species, further supporting the local economy.
Over the past 30 years, growing concerns about the status of West Coast salmon and groundfish stocks prompted the Pacific Fishery Management Council (PFMC) and the state to implement increasingly stringent management measures for commercial and recreational fisheries. Cumulatively, these measures have discouraged (nontribal) fishing along much of the North Coast, resulting in substantial
Eureka Fishing Community Profile ii
reductions in both commercial and recreational fishing activity, and contributing to social and economic impacts in the area.
The Eureka Fishing Community Today
About 100–120 commercial fishing vessels are homeported at Eureka. The resident fleet includes 8–10 trawlers, 15–20 salmon trollers, 5–10 smaller groundfish vessels (sablefish and nearshore species) and about 80 crabbers (including some crabber/trollers), which employ skippers and one to three crew each. Local fish receiving and processing capacity consists of four buyers with receiving stations located at various sites along the Eureka waterfront, including two on-site receiver/processors. Some fish receiving occurs at Fields Landing, located about six miles south of Eureka.
Commercial and/or recreational infrastructure consists of several acres of dock/pier offloading and boat slip facilities, as well as buildings, parking and storage areas, and service facilities (launch ramps, fish cleaning station, work docks, etc.) located at Woodley Island Marina, along the city waterfront, and at Fields Landing. More than 20 Eureka area businesses (and many others outside the area) provide goods and services that directly support both resident and nonresident commercial and recreational fishery operations. The primary berthing facilities are Woodley Island Marina, managed by the Humboldt Bay Harbor, Recreation and Conservation District (Harbor District), and the city-managed Eureka Boat Basin, with limited additional berthing at various docks along the Eureka waterfront, at Fields Landing and at King Salmon. Numerous private vessels and three resident charter operations (and at least two others that move among local ports) make up the recreational fleet.
Commercial Fishing Activity Highlights
Relative to the long term (1981–2007), average annual fishing activity in the Eureka area (Eureka and Fields Landing combined) has declined in recent years (2003–2007) in terms of landings (-14%), ex-vessel value (-13%), boats (-50%), buyers (-2%) and trips (-45%).
• Total landings (all species) ranged from a high of 36.9 million pounds (in 1981) to a low of 9.4 million pounds (in 2001). Annual landings in recent years averaged 16.9 million pounds, down from the long- term average of 19.7 million pounds. This difference reflects a 62% reduction in groundfish landings, partially offset by a 144% increase in whiting landings and a 79% increase in crab landings.
• The ex-vessel value of commercial fishery landings in the Eureka area ranged from a high of $27 million (in 1981) to a low of $6.7 million (in 2001), averaging $13.7 million over the long term and $11.9 million in recent years.
• The number of boats with landings in the Eureka area ranged from a high of 858 (in 1981) to a low of 118 (in 2005). The annual average for recent years (153 boats) is half that for the long term (306 boats).
• Although the average number of buyers in the long term (41) and recent years (40) is relatively unchanged, fewer fish houses (receiver/processors) operate locally. Of the 30 buyers that received commercially-caught seafood in the Eureka area in 2007, at least five were locally-based (nonfisherman) businesses, at least nine were local fishermen, and seven were buyers based in other locations.
Eureka Fishing Community Profile iii
Over the long term, groundfish trawl, crab and albacore (in that order) were the top three fisheries in terms of ex-vessel value. In recent years, crab ranked first, accounting for 57% of ex-vessel revenue, followed by groundfish trawl (24%) and albacore troll (5%).
Trends in average annual ex-vessel price per pound have varied widely among fisheries, with prices higher in recent years compared to the long term in the rockfish (+45%), sablefish (+32%), salmon (+10%) and groundfish trawl (+5%) fisheries, and lower in the whiting (-40%), shrimp trawl (-36%), crab (-12%) and albacore (-5%) fisheries.
The number of ‘Eureka area boats’, defined as those boats that earned a plurality (i.e., the greatest proportion) of their annual ex-vessel revenues from landings in the Eureka area, declined from 439 in 1981 to 88 in 2007. However, the average annual revenue per boat (based on their landings at all ports for all fisheries) increased from less than $65,000 prior to 1985 to greater than $100,000 since 2003.
Over the recent decade (1998–2007), revenue concentration has shown no apparent trend, with 34%–47% of boats accounting for 90% of landed value. Revenue concentration among buyers increased, with 9%–17% of buyers accounting for 90% of landed value during the period 2001–2007, compared to 21%–26% during the period 1998–2000.
Recreational Fishing Activity
Eureka has supported extensive ocean recreational fisheries for a variety of species. Although the ocean salmon fishery remains most highly valued by anglers, they increasingly have targeted crab, halibut and albacore, as fishing opportunities for salmon and rockfish have become more limited.
The primary modes of recreational fishing at Eureka are private boat and CPFV, both of which were more active in the 1980s and 1990s than in recent years, according to study participants. While port-specific data on CPFV effort and harvest levels are available (from logbooks), port-specific estimates of private boat effort are not available. Salmon effort and harvest estimates for the ‘Eureka area’ are available from CDFG’s Ocean Salmon Project (OSP); however, these estimates are not specific to Eureka as they also include Trinidad, a separate community 25 miles north.
• Based on CPFV logbook data for all fisheries, charter boat fishing activity at Humboldt Bay ports generally increased from 1981 to 1990, when 12 boats reported 407 boats days and 3,636 angler days.
• CPFV effort dropped sharply in the early 1990s and has remained low, averaging 2 boats, 73 boat trips and 543 angler trips per year between 1991 and 2007.
• Based on OSP data, CPFV activity accounted for 7% of recreational ocean salmon fishing activity in the Eureka area during the period 1981–2007.
Key Factors Affecting Eureka Area Fisheries
Salmon fishery management: The implementation of stringent regulations on (and at times, complete closure of) the commercial salmon fishery by the PFMC – as well as the state’s limited entry program initiated in the early 1980s – led to a sharp decline in activity, and an overall shift of the salmon fishery away from Eureka. Reduced allocations to nontribal fisheries in the early 1990s led to further reductions in fishing opportunities, and sharply curtailed fishery-related economic activity on which many local businesses depended.
Eureka Fishing Community Profile iv
Groundfish fishery management: Increasingly strict federal catch limits since the 1990s, together with the 2003 federal groundfish trawl buyback (in which 14 of 23 Eureka-based vessels participated) and implementation of restricted access in the state’s Nearshore Fishery, have curtailed commercial fishery participation. Whereas as many as five receiver/processors handled groundfish (and other species) locally at one time, only one does presently. The loss of local processing capacity has resulted in fewer market options for fishermen, and fewer jobs and economic benefits for the community. The reduction in nearshore fishing opportunities has made it cost-prohibitive for out-of-area buyers to purchase and transport relatively small amounts of fish landed, especially in the live fish fishery.
Economic factors: Rising costs, especially for fuel and insurance, were cited as one of the biggest challenges faced by commercial fishermen (and other community members). At the same time, average price per pound for all fisheries combined is has barely changed between the long term and recent years. Price trends have varied among fisheries – declining in fisheries such as crab and increasing in others such as sablefish. The net effect of these changes and the overall declines in vessel participation and landings on still-active vessels has varied by fishery. Average revenue per boat during the period 2005–2007 was greater compared to the mid-1990s and early 1980s for Eureka-based boats whose primary fishery was groundfish trawl, crab, or albacore but lower for Eureka-based boats whose primary fishery was shrimp trawl, sablefish, salmon or rockfish. It is not clear, however, how these changes in revenue per boat compare to costs, which have likely also increased over time.
Increasing costs and less favorable economic conditions also have affected fishery-support businesses, both directly and indirectly. The reduction in fishing opportunities and activity has reduced demand for goods and services, leading several businesses to cease operations, while others have diversified or shifted emphasis.
Working waterfront: Aging infrastructure, the closure of support businesses such as Eureka Fisheries in 2000 and Eureka Ice and Cold Storage in 2008, and increasingly expensive real estate and permitting requirements, have complicated efforts by fishermen and others to maintain viable operations. Receiving and processing capacity has contracted geographically and become consolidated. Where multiple providers of goods and services (e.g., marine supply, fuel dock, vessel maintenance and repair) once were needed to meet local demand, only one or two of each type remain, serving communities elsewhere along the North Coast as well as Eureka.
While this consolidation suggests increased efficiency, the limited number of goods and service providers makes the local fishing community vulnerable to further regulatory, economic and environmental change. The abrupt closure of Eureka Ice and Cold Storage in 2008 is a reminder of that vulnerability.
The development of the Fishermen’s Terminal, a stretch of city waterfront formerly occupied by fish houses, addresses some basic infrastructure needs for local commercial fisheries. Originally conceived in the early 1980s by local fishermen and the city, the project faced spiraling costs and other challenges. However, in 2006 the first phase of the project was completed (providing dock space and hoists), and in late 2009 the city received federal stimulus funds to help with completion of the project. The Fishermen’s
Eureka Fishing Community Profile v
Terminal will provide a fish offloading area, seafood market and café, as well as receiving and processing space for two businesses.Current Situation and Outlook
Eureka area fisheries have changed markedly over the past three decades. Expansion through the 1970s and early 1980s was followed by contraction as regulatory, economic and other factors played out during the 1990s and into the 2000s. Commercial fishery participants (fishermen and buyers alike) have become particularly dependent on crab, although groundfish, albacore and other fisheries continue to play a role. Recreational fisheries have shifted from a primary focus on salmon to albacore, groundfish, halibut and crab, even as salmon fishing remains highly valued.
The fishing community has long been concerned about maintaining Eureka’s working waterfront infrastructure, both for the functionality of local fisheries and to preserve the area’s maritime heritage. More than 30 years after the idea of a Fishermen’s Terminal was conceived to help meet these needs, the project is nearing completion.
At the same time, study participants are concerned about recent and pending events in the larger policy arena including the North Coast Marine Life Protection Act process, begun in late 2009, the individual quota program for the federal groundfish trawl fishery, to be implemented in 2011, and potential offshore energy development, which have the potential to fundamentally change local fisheries and the community. Despite these challenges, the Eureka fishing community is strengthened by the political will of its citizens and leaders, and existing and future infrastructure assets such as two well-maintained harbors, a boatyard and fuel station, and the developing Fishermen’s Terminal. These features lend the Eureka fishing community a degree of resilience that may enable it to effectively address the challenges and opportunities that lie ahead.
Eureka Fishing Community Profile vi
We gratefully acknowledge the support and input provided by Eureka fishing community members, including local fishermen, fish buyers and fishery-support business owners and staff. We thank Humboldt Bay Harbor, Recreation and Conservation District CEO David Hull and staff, especially Suzie Howser; Humboldt State University Humboldt Room librarians Joan Berman and Edie Butler, Katie Glover for note-taking; and California Sea Grant Marine Advisor Susan Schlosser and Assistant Debbie Marshall for their input and support. We also thank Rebecca Rizzo and Holly Davis, UC Santa Cruz and National Marine Fisheries Service (NMFS), and Debbie Marshall, California Sea Grant Extension Program (SGEP), for assistance with graphics and other elements of this report; and Brad Stenberg, Pacific States Marine Fisheries Commission, for access to the Pacific Fisheries Information Network (PacFIN) data; and community members, Sea Grant colleagues and others for their feedback on drafts of this document. The information presented here is based on work supported by the California State Coastal Conservancy, the California SGEP, the NMFS Economics and Social Sciences Program in Silver Spring, MD and the NMFS Southwest Fisheries Science Center in Santa Cruz, CA.
Cover photo by C. Pomeroy.
Corresponding author: Carrie Pomeroy, 831-459-4173, [email protected].
aCknowlEdgEmEnTS
Eureka Fishing Community Profile 1
crossing the bar still requires a great deal of caution.
With rich fishing grounds nearby and substantial infrastructure along the waterfront, Eureka continues to be an active fishing port. The City of Eureka, the Humboldt Bay Harbor, Recreation and Conservation District (‘Harbor District’), and various private entities own and manage port infrastructure, which occupies approximately 15% of the bay’s shoreline (HBHRCD 2007b). Most of this infrastructure is located in the City of Eureka, although some remains at King Salmon and Fields Landing, which used to figure more prominently in local fisheries. Some of the infrastructure dates to the development of the timber industry in the late 1800s, while other infrastructure was built between the 1960s and 1980s specifically to support fishing.
Eureka’s commercial fisheries target groundfish (various flatfishes, roundfishes and rockfishes, Sebastes spp.), Dungeness crab (Cancer magister), Chinook salmon (Oncorhynchus tschawytscha), 3 albacore tuna (Thunnus alalunga), Pacific Whiting
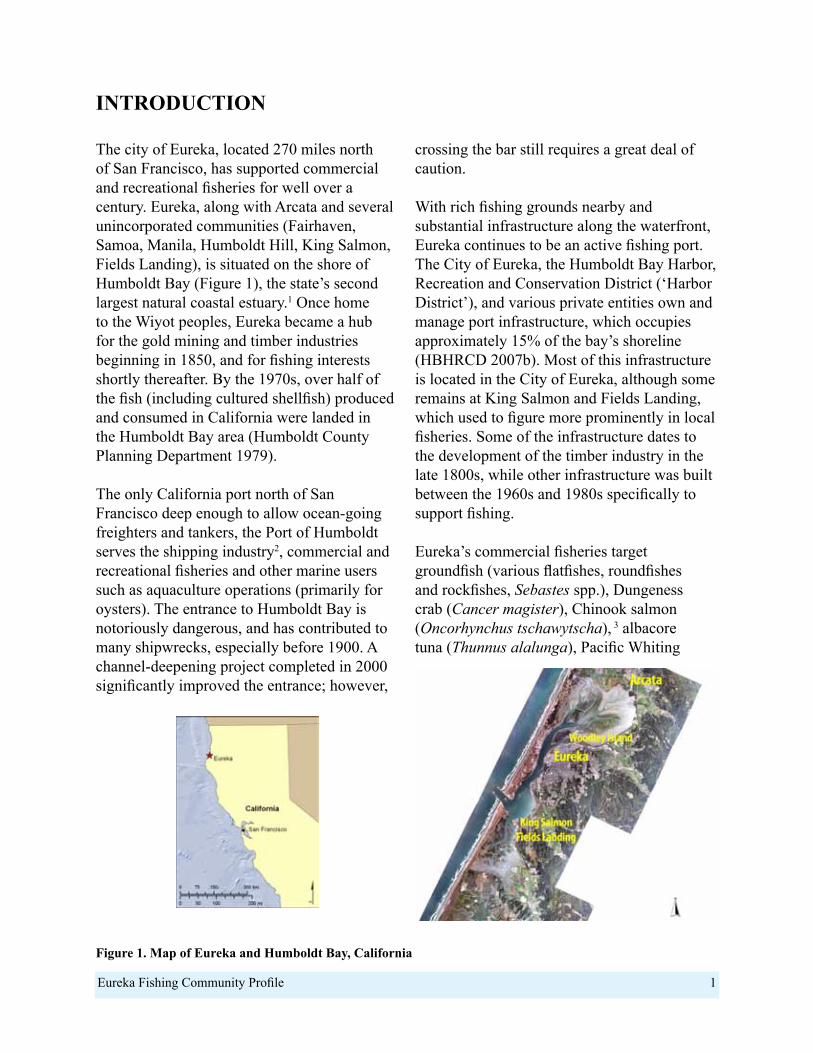
The city of Eureka, located 270 miles north of San Francisco, has supported commercial and recreational fisheries for well over a century. Eureka, along with Arcata and several unincorporated communities (Fairhaven, Samoa, Manila, Humboldt Hill, King Salmon, Fields Landing), is situated on the shore of Humboldt Bay (Figure 1), the state’s second largest natural coastal estuary.1 Once home to the Wiyot peoples, Eureka became a hub for the gold mining and timber industries beginning in 1850, and for fishing interests shortly thereafter. By the 1970s, over half of the fish (including cultured shellfish) produced and consumed in California were landed in the Humboldt Bay area (Humboldt County Planning Department 1979). The only California port north of San Francisco deep enough to allow ocean-going freighters and tankers, the Port of Humboldt serves the shipping industry2, commercial and recreational fisheries and other marine users such as aquaculture operations (primarily for oysters). The entrance to Humboldt Bay is notoriously dangerous, and has contributed to many shipwrecks, especially before 1900. A channel-deepening project completed in 2000 significantly improved the entrance; however,
inTroduCTion
Figure 1. Map of Eureka and Humboldt Bay, California
Eureka Fishing Community Profile 2
(Merluccius productus) and Pacific Ocean shrimp, or pink shrimp (Pandalus jordani). A fishery for Pacific hagfish (Eptatretus stoutii) has occurred at times, including in recent years, and there are small-scale fisheries within the bay including those for herring (Clupea pallasii, for bait and roe) and northern anchovy (Engraulis mordax, for live bait for commercial and recreational tuna fisheries). Recreational fisheries for several species including salmon, rockfish, halibut, sharks and rays, clams and surf perch occur from boats, beach and other manmade structures.4 Aquaculture operations have been active in Humboldt Bay since the 1950s.
This profile provides an historic and contemporary description of the Eureka fishing community, focusing on the development of capture fisheries and related infrastructure, with particular emphasis on the period 1981–2007 (for which detailed landings data are available). We describe present-day fishery operations, activities and associated infrastructure, and discuss some of the key regulatory and economic factors highlighted by study participants that interact with and affect the local fishing community.
The information presented here is based on archival and field research conducted between July 2007 and March 2009.5 Fieldwork included site visits, informal and formal interviews, and group meetings. These activities engaged approximately 50 people, including 22 local commercial and recreational fishermen, four fish buyers, owners and employees of five fishery-support businesses, Harbor District managers and staff, and City Harbor and Marina Operations staff, as well as other community members who have experience and knowledge of local fisheries. Field data were analyzed together with commercial fishery landings data from the Pacific Fisheries Information Network
(PacFIN) database, recreational fishery data from the California Recreational Fisheries Survey (CRFS) and Commercial Passenger Fishing Vessel (CPFV, or charter) logbooks, and information from other primary and secondary sources, to interpret patterns, variability and change within and across fisheries and the fishing community over time.
History of the Port and the Surrounding AreaThe Wiyot Indians, whose presence in the area dates back some 2,000 years, are the first known peoples to have occupied the lands around Humboldt Bay (Planwest Partners 2008). They lived in villages around the bay and along the Eel River, and were sustained by local marine and land resources. At the beginning of the 19th century, Russian-American fur traders were the first nonnative people on record to enter the bay (Scofield 1954), and were followed by an influx of settlers upon discovery of gold in 1849. In the spring of 1850, three European-American groups – the Laura Virginia party, the Union Company, and the Mendocino Company – laid claim to the bay and its surrounding lands (Glatzel 1982). At that time an estimated 1,000 Wiyot Indians lived in the area (Planwest Partners 2008).
Monumental changes occurred in the Humboldt Bay area in the 1850s, as the developing gold mining and timber industries brought thousands of settlers to the area. Four communities were established around the bay: Eureka, Union (later Arcata), Bucksport, and short-lived Humboldt City (today’s King Salmon; (Humboldt County Planning Department 1979). In addition to substantially altering the land, the settlers displaced, often by violent means, the local Wiyot peoples. By the late 1860s few, if any, remaining Wiyot people lived freely in the area; most were either killed or moved to reservations (Norman et al. 2007, Planwest Partners 2008).
Eureka Fishing Community Profile 3
Eureka became the shipping center for the region, serving gold mining and timber harvesting interests in Trinity and Siskiyou counties (Monroe at el. 1973). By 1854, there were nine sawmills on the bay capable of processing approximately 220,000 board feet of lumber per day (Planwest Partners 2008). By the late 1850s, there were eight mills within the Eureka city limits alone, along with a burgeoning service industry of hotels, saloons, and brothels. By the late 1880s, the bayside commercial district of Eureka was heavily developed: “nearly all of the alphabet streets…ended in a dock, a wharf, a sawmill, a warehouse or a shipyard” (Planwest Partners 2008 p.47). In addition to the burgeoning lumber industry, fishing in the bay for salmon, shark, and shellfish also began to flourish.
History of Eureka Area Fisheries
The Expansion of Local Fisheries According to Glatzel (1982), the Humboldt Bay fishing industry was started near Fairhaven (on the Samoa Peninsula west of Eureka) by two Finnish fishermen. Scofield (1954) reports that a colony of Chinese fishermen settled at Humboldt Bay in 1857, sending dried fish by steamer to San Francisco markets. The Chinese were later expelled from the area during a wave of anti-immigrant sentiment (Planwest Partners 2008). Also around this time, a shark fishery developed for liver oil; however, the shark population in the bay was diminished within about 10 years, and the fishery lasted only until 1868 (Scofield 1954).6
The increase in commercial fishing activity was largely a function of developing land transportation routes. Until the early 20th
century, the only way to get fish from Eureka to San Francisco markets was by sea, which often proved hazardous due to rough seas and the bay’s dangerous entrance (Planwest Partners 2008). Beginning in 1914, the Northwestern Pacific Railroad linked the North Coast with cities further south, facilitating the transport to market of higher volumes of salmon, crab and groundfish (caught mostly in Humboldt Bay at that time).
With the advent of motorized troll vessels in the 1920s, the commercial fishing fleet grew and began to exploit rich fishing grounds outside the bay on the continental shelf. In the late 1920s, the construction of Highway 101 brought tourists in automobiles, including sport fishermen, to the area (Planwest Partners 2008).
According to Scofield (1954), trawlers were active along the North Coast and specifically in the Eureka area by 1929, where they delivered their catch for shipment to larger population centers by rail. Over the next several years, Eureka became a center of trawling activity:
By 1935 it had become customary for most of the San Francisco fleet to fish north of Point Reyes in the summer fair weather (May to October) and make deliveries at Eureka where fish could be shipped out by rail. During the bad weather of the winter months, fishing was mostly south of Point Reyes with deliveries at San Francisco. Gradually boats were spending more and more time at Eureka and fishermen began to look upon that port as their headquarters. Thus in the period, roughly 1935 to 1940, the center of trawling operations shifted from San Francisco to Eureka (p.32).
Eureka Fishing Community Profile 4
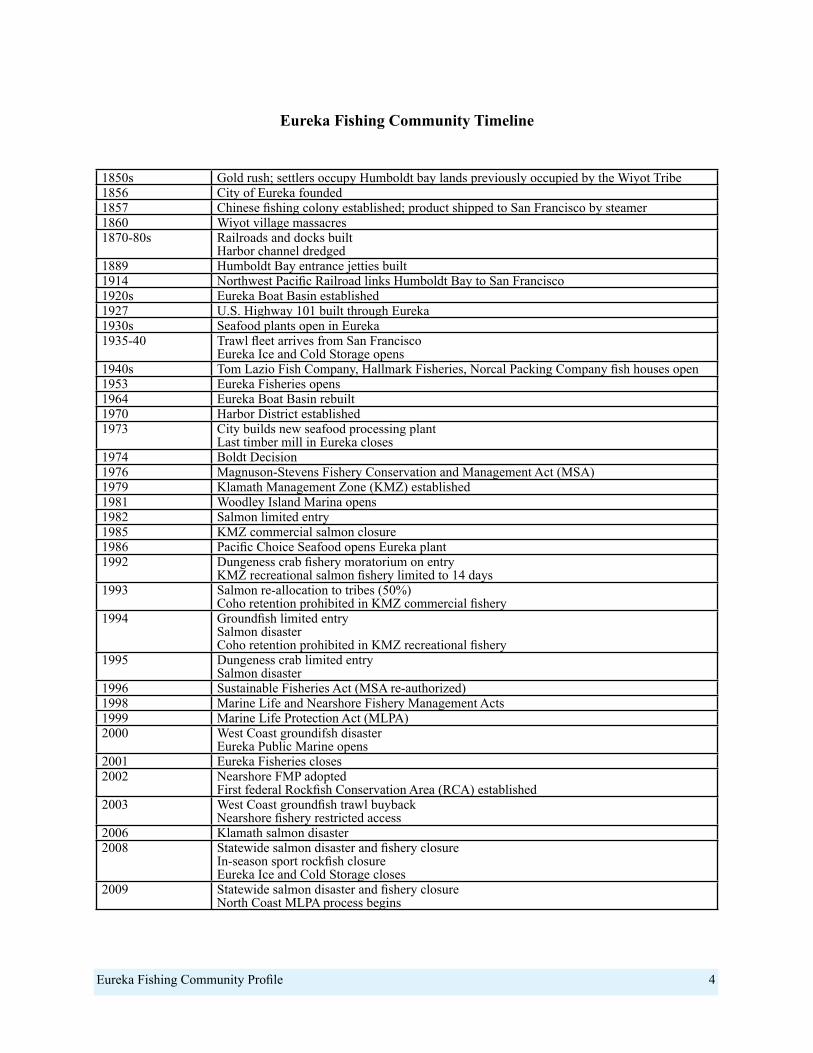
Eureka Fishing Community Timeline
1850s Gold rush; settlers occupy Humboldt bay lands previously occupied by the Wiyot Tribe1856 City of Eureka founded1857 Chinese fishing colony established; product shipped to San Francisco by steamer1860 Wiyot village massacres1870-80s Railroads and docks built
Harbor channel dredged1889 Humboldt Bay entrance jetties built1914 Northwest Pacific Railroad links Humboldt Bay to San Francisco1920s Eureka Boat Basin established1927 U.S. Highway 101 built through Eureka1930s Seafood plants open in Eureka1935-40 Trawl fleet arrives from San Francisco
Eureka Ice and Cold Storage opens1940s Tom Lazio Fish Company, Hallmark Fisheries, Norcal Packing Company fish houses open1953 Eureka Fisheries opens1964 Eureka Boat Basin rebuilt1970 Harbor District established1973 City builds new seafood processing plant
Last timber mill in Eureka closes1974 Boldt Decision1976 Magnuson-Stevens Fishery Conservation and Management Act (MSA)1979 Klamath Management Zone (KMZ) established1981 Woodley Island Marina opens1982 Salmon limited entry1985 KMZ commercial salmon closure1986 Pacific Choice Seafood opens Eureka plant1992 Dungeness crab fishery moratorium on entry
KMZ recreational salmon fishery limited to 14 days1993 Salmon re-allocation to tribes (50%)
Coho retention prohibited in KMZ commercial fishery1994 Groundfish limited entry
Salmon disasterCoho retention prohibited in KMZ recreational fishery
1995 Dungeness crab limited entrySalmon disaster
1996 Sustainable Fisheries Act (MSA re-authorized)1998 Marine Life and Nearshore Fishery Management Acts1999 Marine Life Protection Act (MLPA)2000 West Coast groundifsh disaster
Eureka Public Marine opens2001 Eureka Fisheries closes2002 Nearshore FMP adopted
First federal Rockfish Conservation Area (RCA) established2003 West Coast groundfish trawl buyback
Nearshore fishery restricted access2006 Klamath salmon disaster2008 Statewide salmon disaster and fishery closure
In-season sport rockfish closureEureka Ice and Cold Storage closes
2009 Statewide salmon disaster and fishery closureNorth Coast MLPA process begins
Eureka Fishing Community Profile 5
Also around that time many seafood companies (some of which originated in San Francisco) started businesses along the waterfront in Eureka and Fields Landing. These included A. Paladini, Joe Ballestrieri & Company, Hallmark Fisheries, Consolidated Factors and Lazio Fish Company (Anon. 1945). The efforts of these companies in concert with the newly established trawl fleet led to dramatically increased catches of groundfish, particularly Dover sole, which was purchased in large quantities by the U.S. Government to feed soldiers overseas during World War II (Hagerman 1952). The catch of Dover sole steadily increased through the 1940s and by 1950 landings in the Eureka and Fort Bragg areas combined topped 9.5 million pounds.
One of the biggest wholesale fish houses that handled groundfish in the area was Eureka Fisheries, which began operations at Fields Landing in 1953. By 1958 the company
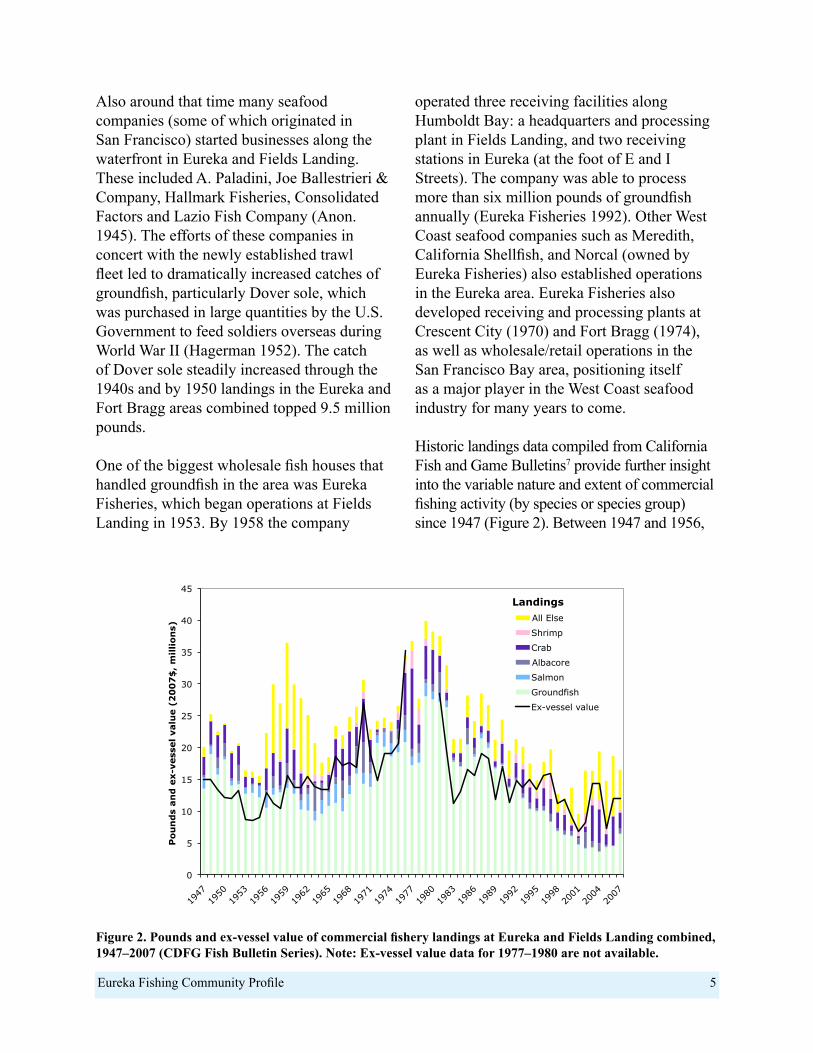
operated three receiving facilities along Humboldt Bay: a headquarters and processing plant in Fields Landing, and two receiving stations in Eureka (at the foot of E and I Streets). The company was able to process more than six million pounds of groundfish annually (Eureka Fisheries 1992). Other West Coast seafood companies such as Meredith, California Shellfish, and Norcal (owned by Eureka Fisheries) also established operations in the Eureka area. Eureka Fisheries also developed receiving and processing plants at Crescent City (1970) and Fort Bragg (1974), as well as wholesale/retail operations in the San Francisco Bay area, positioning itself as a major player in the West Coast seafood industry for many years to come. Historic landings data compiled from California Fish and Game Bulletins7 provide further insight into the variable nature and extent of commercial fishing activity (by species or species group) since 1947 (Figure 2). Between 1947 and 1956,
Figure 2. Pounds and ex-vessel value of commercial fishery landings at Eureka and Fields Landing combined, 1947–2007 (CDFG Fish Bulletin Series). Note: Ex-vessel value data for 1977–1980 are not available.
0
5
10
15
20
25
30
35
40
45
1947
1950
1953
1956
1959
1962
1965
1968
1971
1974
1977
1980
1983
1986
1989
1992
1995
1998
2001
2004
2007
Po
un
ds
an
d e
x-v
ess
el valu
e (
20
07
$,
millio
ns)
All Else
Shrimp
Crab
Albacore
Salmon
Groundfish
Ex-vessel value
Landings
Eureka Fishing Community Profile 6
landings and ex-vessel value averaged just over 20 million pounds and about $12 million (2007$), respectively, with declines in both measures over the period. Both measures then increased through 1959, with more than 36 million pounds worth more than $15.6 million landed. Over the next two decades, landings continued to vary, with peaks in 1970, 1976 and 1977, and reaching their highest on record, 39.9 million pounds, in 1979 (ex-vessel value is not available for that year). Landings and value subsequently declined most years, reaching a low of 9.6 million pounds worth $8.8 million in 2001, before increasing again in recent years. Over this 61-year period, groundfish, salmon and crab together accounted for 63%–97% of ex-vessel value. In most years, groundfish accounted for the majority of landings, peaking at more than 26 million pounds annually between 1979 and 1982. Salmon landings exceeded one million pounds in 26 of 33 years between 1947 and 1980.
Sport fisheries also have played an important role in the Eureka area. According to Miller and Gotshall (1965), more skiffs operated out of Humboldt Bay than any other site between Pt. Arguello and the Oregon border. During the late 1940s, rockfish and miscellaneous flatfish accounted for at least 60% of the catch. After that, the focus shifted to salmon, which accounted for 85%–99% of the catch between 1949 and 1956. Over the next decade, salmon accounted for 62%–91% of the catch, except in 1958, when it accounted for 41%, and rockfish accounted for the balance.
Although pier and shore fishing (including clamming) were popular and some skin diving occurred, skiff fishing was the dominant mode of sport fishing (Monroe at el. 1973). In 1952 there were four party boats and two charter boats operating out of Eureka (Scofield 1954). In 1963, five charter boats, three of which fished commercially during other parts of the year, operated from Humboldt Bay;
90% of their trips occurred between June and September (Monroe et al. 1973). Young (1969) reported a relatively low level of charter activity for 1947–1967, but noted substantial growth in the number of fish caught and number of angler trips through the early 1950s. Activity peaked at more than 5,500 fish in 1953 and more than 2,800 angler trips in 1955. After dropping sharply through 1958, activity increased again to about 1,500 angler trips, and catches of 1,500–2,300 fish per year through the rest of the period.
By the 1970s much of the recreational (and some commercial) fishing was based at King Salmon, a small community about seven miles south of Eureka. At least three privately owned marinas offered berthing, marine supplies, fuel, and RV parking/camping.
From 1960 through 1980, commercial and recreational fishing activity generally increased. Smith (1973) reported that “approximately 450 commercial vessels operate[d] from Humboldt Bay in the mid 1960s with many more using it as a place of refuge during inclement weather” (p.57; see also Monroe et al.1973). With only about 250 slips available then, fishing boats were tied up all along the waterfront, sometimes several deep. Dean et al. (1973, p. 26) characterize the Humboldt Bay commercial fishing fleet at that time: “The vessels are small by commercial standards (generally less than 30 feet) and … are equipped to fish for at least three species, usually salmon, albacore and crab, with the rest concentrating on groundfish”. Both the larger vessels (primarily trawlers that targeted groundfish and shrimp) and those smaller vessels delivered most of the catch to local fish houses for processing. One exception, albacore, was processed not by Eureka fish buyers; rather it was shipped to canneries in Oregon (Hoopes 1969). The five major seafood companies at that time employed an estimated 1,310 people.8
Eureka Fishing Community Profile 7
In the early 1970s, commercial fishery infrastructure consisted of six to eight receiving stations, four major fish processing plants and a boat basin along the Eureka waterfront (Monroe et al. 1973, Smith 1973). Study participants reported that there were four gear stores, four fuel docks, and two electronics shops. The two city-owned fish receiving docks were “declared unsafe and in need of complete rebuilding” (Dean et al. 1973 p.26). Meanwhile, the area experienced an increase in sport fishing and other private recreational boat use, for which Dean et al. (1973) characterized the existing mooring facilities as inadequate to meet the growing demand.
In 1967, the Cities of Eureka and Arcata and the Eureka Harbor Commission formed the Humboldt Bay Development Commission to better address the opportunities and challenges facing the Humboldt Bay community regarding fisheries and other uses (Monroe et al. 1973). Legislation to establish the Harbor District was passed in 1970; in 1972 the Harbor District was officially adopted by area citizens (Monroe et al. 1973). By the mid-1970s, improving and expanding fishery-related facilities was recognized as a long-term goal of Humboldt Bay area residents (Humboldt County Overall Economic Development Program Committee 1977, Ray 1982).
Over the next several years, the Harbor District and the city sponsored several studies to characterize current conditions, and identify and evaluate options for development and redevelopment of harbor infrastructure. The recent completion of large infrastructure improvement projects at Crescent City Harbor to the north and Noyo Harbor to the south increased concerns that Eureka’s fisheries and fishing economy would lose out as fishermen, receivers and processors moved to better equipped and maintained ports.
Several sites around the bay were evaluated for the development of a new marina and other fishery-support facilities (Hansel 1978). Ultimately, Woodley Island, located across the channel from the city, was selected as the preferred site, albeit amid some controversy (Life and Times 1977). Construction began in 1978; the 237-slip Woodley Island Marina opened in 1981.
Meanwhile, the Eureka area fishing community benefited from various federal programs aimed at encouraging the development of the nation’s fisheries. The 1971 reauthorization of the Farm Credit Act enabled commercial fishermen to obtain loans through local Production Credit Associations, which had been making such loans to farmers and ranchers since 1933 (Dewees 1976, NOAA 1999). Additionally, the Capital Construction Fund and Fishing Vessel Obligation Guarantee program (authorized by the Federal Ship Financing Act of 1972) offered low interest or government-backed loans, tax-deferred vessel repair and construction programs, fuel tax relief, gear replacement funds, market expansion programs and technical assistance (NOAA 1999). These opportunities helped to substantially increase fleet size and capacity.
The Expansion of Fishery ManagementThrough the late 1970s, Eureka area fisheries were subject to fairly modest and stable management9, and landings were driven largely by resource availability and market demand. With the passage of the Magnuson-Stevens Fishery Conservation and Management Act in 1976, and the creation of the Pacific Fishery Management Council (PFMC), things began to change.
Following development of a Salmon Fishery Management Plan (FMP) in 1977, the PFMC began implementing regulations to protect West Coast salmon runs. In 1979, to better
Eureka Fishing Community Profile 8
address concerns regarding fishery impacts on Klamath River fall Chinook, the PFMC established the Klamath Management Zone (KMZ; Pierce 1998), which encompassed Eureka fishermen’s primary fishing grounds.10 In 1982, California adopted a statewide limited entry program for commercial trollers. By 1984, the PFMC had shortened the commercial salmon season in the KMZ to approximately two months, much shorter than the five- to six-month seasons in other areas of the state. This action reflected the PFMC policy of imposing tighter restrictions in areas with greater impacts on Klamath fall Chinook (the KMZ) in lieu of lesser restrictions over a larger geographic area. As a result, commercial salmon seasons in the California portion of the KMZ have at times been only days or weeks in duration, and in some years have been completely closed (e.g., in 1985).11
Beginning in 1992, the PFMC prohibited retention of coho in the commercial salmon fishery south of Cape Falcon, Oregon due to conservation concerns regarding Oregon coastal natural coho (PFMC 1992). This led to fishery disaster declarations for California and Oregon fishing communities in 1994 and 1995, which afforded relief programs for affected communities.12 Although the KMZ commercial fishery was not nearly as dependent on coho as fisheries further north, the California KMZ was completely closed between 1992 and 1995, largely due to more localized factors that compounded the effects of the coho nonretention policy. In 1993, Klamath fall Chinook was declared overfished (PFMC 1994), and the Department of Interior Solicitor issued an opinion allocating 50% of Klamath-Trinity River salmon to the Yurok and Hoopa tribes. This was significantly higher than the 30% tribal allocation brokered by the Klamath Fishery Management Council in a previous 1987–1991 agreement, and required reduced allocations to nontribal fisheries,
including the KMZ fishery (Pierce 1998).13 The cumulative effect of these management actions was to discourage (nontribal) salmon fishing along much of the North Coast, resulting in substantial reductions in both commercial and recreational fishing activity at Eureka, as elsewhere.
In 2006, failure of Klamath fall Chinook to meet its escapement floor for the third consecutive year prompted closure of the commercial salmon fishery in the California KMZ. In 2008 and 2009 the commercial fishery was again closed – this time statewide – due to low escapement of Sacramento River fall Chinook.
Fishing opportunities for West Coast groundfish also have been curtailed by state and federal management. Commercial groundfish landings in Eureka peaked during the early 1980s (see Figure 2). In 1982, the PFMC implemented the West Coast Groundfish FMP and managed the commercial fishery with measures such as harvest guidelines, trip landing and frequency limits, size limits, and gear restrictions. In 1992, the PFMC adopted a harvest rate policy based on the assumption that West Coast groundfish were similar in productivity to other well-studied groundfish stocks. Over the next eight years, as growing scientific evidence indicated that rockfish (Sebastes spp.) had productivity rates much lower than other groundfish species, the PFMC adopted increasingly restrictive management measures for rockfishes.14 However, these measures came too late to reverse the effects of longstanding harvest policies based on inaccurate assumptions, and between 1999 and 2002, eight groundfish stocks were declared overfished.15 In 2000, a federal disaster was declared in the West Coast groundfish fishery. In order to rebuild overfished stocks, optimum yields (OYs) and trip landing limits for
Eureka Fishing Community Profile 9
healthy stocks typically taken with overfished species were cut further for both limited entry and open access vessels. To afford fishery participants more flexibility and enable them to reduce regulatory-induced discards, trip limits were subsequently replaced with cumulative landing limits that gradually expanded in duration (weekly, biweekly, monthly, bimonthly). In 2002 the PFMC implemented rockfish conservation areas (RCAs), which closed a wide swath of continental shelf and slope waters to commercial groundfish fishing from near Cape Mendocino north to the Canadian border. The extreme decline in harvest opportunities exacerbated the problem of excess harvest capacity, leading to measures such as the industry-funded West Coast Groundfish Trawl Buyback program in 2003. In subsequent years, limited entry and open access vessels have been subject to area closures to protect groundfish Essential Fish Habitat and required to carry vessel monitoring systems (VMS).16
The pink shrimp fishery, active at Eureka since the early 1970s, is largely managed by the state with some federal involvement. Over the years, the fishery has been subject to federal regulations including finfish excluder devices to minimize groundfish bycatch (2002), area closures to protect groundfish EFH (2006), and VMS (2007). In addition, vessels are subject to state management including limited entry (for vessels north of Point Conception), a November-March closure (to protect egg-bearing females), and maximum count-per-pound and minimum mesh size regulations (to protect juvenile shrimp; CDFG 2007). Prior to 2008, shrimp trawling was allowed in state waters two to three miles from shore between Point Reyes and False Cape; since then, ocean shrimp trawl grounds in state waters have been closed.17 Of the 85 pink shrimp permits retired by the 2003 groundfish trawl buyback (which required vessels bought out of the groundfish
fishery to retire all of their permits for West Coast fisheries), 31 were linked to California vessels (CDFG 2007).
State management of the groundfish fishery also unfolded during this time. The passage of the Nearshore Fishery Management Act (within the state’s Marine Life Management Act) in 1998 established minimum size limits for 10 commonly caught nearshore species, and mandated the development of a Nearshore FMP. In 2001, the nearshore rockfish fishery was closed outside 20 fathoms from March through June. Two years later, the state implemented the FMP, which specified management measures for 19 nearshore species including gear and seasonal restrictions, as well as a restricted access program to achieve the statewide capacity goal of 61 participants (down from 1,128 in 1999). Of the 215 transferable permits issued in 2003, 29 (13.5%) were allocated to the North Coast (Cape Mendocino north to the Oregon border).18
The Dungeness crab fishery, long an important fishery for Eureka-based operations, has not undergone the significant management changes that have occurred in the salmon and groundfish fisheries. In managing the fishery, the state has used the “three S” (sex, size, season) strategy that includes male-only harvest (since 1897), a minimum size limit (since 1911) and a limited season (since 1957). In 1992, a moratorium on entry was established, and a restricted access program was implemented in 1995. The Northern California crab season usually runs from December 1 through July 15, although its start has been delayed in some years because of price disputes, or to insure that male crabs have completed molting, as occurred in 2005. In 2009, the state convened a Dungeness Crab Task Force in response to concerns about recent increases in participation and gear usage. Following the recommendation of the
Eureka Fishing Community Profile 10
Task Force (California Dungeness Crab Task Force 2010), a bill that would establish a pilot crab pot allocation program to address those concerns (SB 1039, Wiggins) is pending in the State Legislature.
Recreational fisheries at Eureka, which primarily targeted salmon, similarly have been affected by KMZ restrictions related to management of Klamath River fall Chinook, tribal allocation changes, and rebuilding requirements for overfished rockfishes (which include a number of recreationally important species). However, the KMZ recreational fishery has generally been less constrained than the commercial fishery (though more constrained than the recreational fishery elsewhere in the state). In 1986, the season in the California KMZ was reduced from about nine to five months. Since then, seasons in the California KMZ have generally ranged from one to six months, with several notable exceptions (i.e., the 14-, 0-, and 10-day openings in 1992, 2008, and 2009 respectively) This is in contrast to other parts of the state, where the recreational season generally extended for six to nine months through 2007 (PFMC 2009). While the KMZ recreational fishery is much reduced from the peak periods of the 1970s and 1980s, it remains an active fishery that attracts both resident and nonresident anglers, at least in those years when recreational opportunity is available.
The recreational groundfish fishery has been increasingly constrained since the late 1990s to address concerns regarding depleted or overfished groundfish stocks. Measures have included bag limit reductions first implemented in 1998, inseason closures since 2001, and depth-based closures starting in 2004. In 2008, the once year-round season was compressed to four months. In 2008, California Department of Fish and Game (CDFG) considered establishing yelloweye RCAs in addition to
existing depth-based closures, but ultimately did not implement them. Instead, the nearshore recreational groundfish fishery was closed four months early.
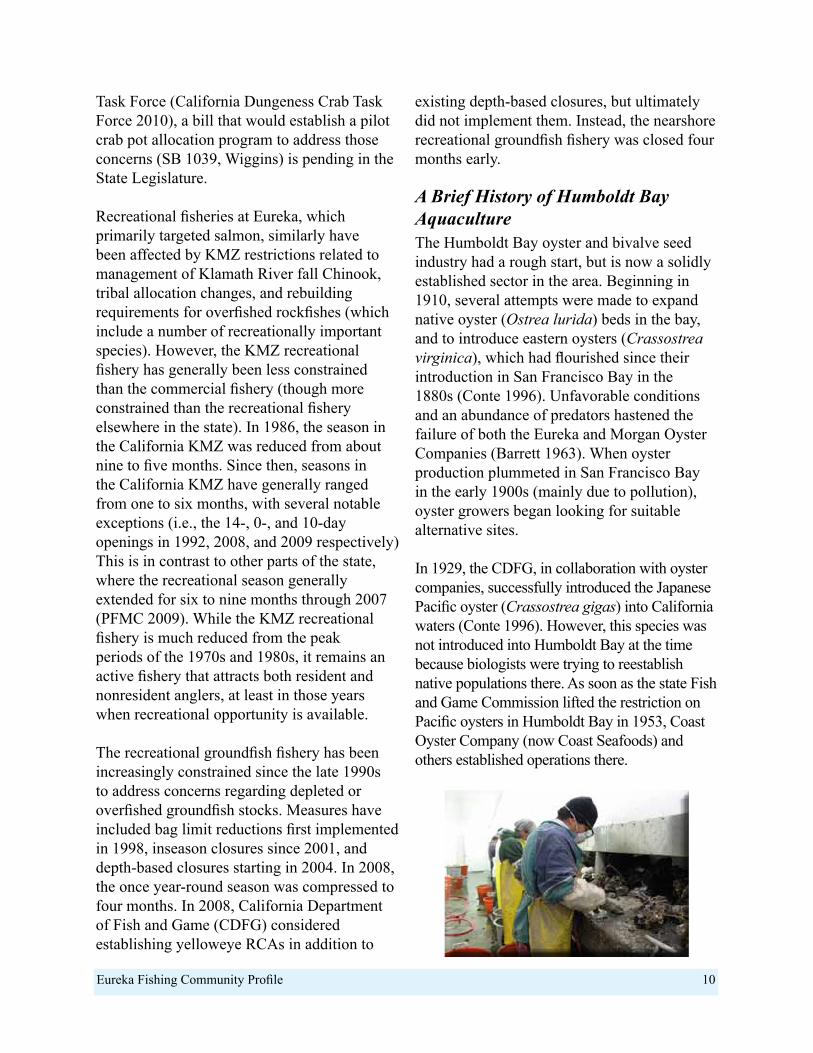
A Brief History of Humboldt Bay Aquaculture The Humboldt Bay oyster and bivalve seed industry had a rough start, but is now a solidly established sector in the area. Beginning in 1910, several attempts were made to expand native oyster (Ostrea lurida) beds in the bay, and to introduce eastern oysters (Crassostrea virginica), which had flourished since their introduction in San Francisco Bay in the 1880s (Conte 1996). Unfavorable conditions and an abundance of predators hastened the failure of both the Eureka and Morgan Oyster Companies (Barrett 1963). When oyster production plummeted in San Francisco Bay in the early 1900s (mainly due to pollution), oyster growers began looking for suitable alternative sites.
In 1929, the CDFG, in collaboration with oyster companies, successfully introduced the Japanese Pacific oyster (Crassostrea gigas) into California waters (Conte 1996). However, this species was not introduced into Humboldt Bay at the time because biologists were trying to reestablish native populations there. As soon as the state Fish and Game Commission lifted the restriction on Pacific oysters in Humboldt Bay in 1953, Coast Oyster Company (now Coast Seafoods) and others established operations there.
Eureka Fishing Community Profile 11
Between 1956 and 1965, average annual production of Pacific oysters in Humboldt Bay was just over 7.6 million pounds worth $179,376 (roughly $1 million in 2007$; Gotshall 1966). Nearly 700,000 pounds of Pacific oyster meat was produced in 1971, representing approximately 70% of California’s oyster production that year (Monroe et al. 1973). Oysters were primarily bottom-cultured until environmental concerns led to the adoption of off-bottom long lines and ‘French style’ rack-and-bag techniques beginning in the 1980s.19
Variability in production has been a function of water quality and conditions in the bay, the supply of seed oysters from other areas, and market demand (Barrett 1963, Monroe et al. 1973). According to one long-time shellfish grower, Humboldt Bay is the primary source for bivalve seed to other California farms and is a key supplier of manila clams and Pacific and Kumamoto Oyster seed to Washington.
Ocean acidification and Vibrio tubiashii blooms have challenged seed and larvae producers in recent years, and demand for seed
and market shellstock oysters from Humboldt Bay consistently exceeds supply.
In 2004, more than 600,000 pounds of oysters were harvested from Humboldt Bay (Prosperity Network 2007), the majority by Coast Seafoods, the largest producer in Humboldt Bay.20 Five businesses currently produce oysters and/or oyster seed (primarily for Pacific oyster, Crassotrea gigas) and Manila clams (Venerupis philippinarum), largely in Northern Humboldt Bay (Table 1). In 2009, Taylor Mariculture LLC purchased Kuiper Mariculture, and continues to expand Humboldt Bay’s role in supply of bivalve seed to farms domestically and overseas. North Bay Oyster Company operates an off-bottom shellstock oyster company on tidelands leased from the City of Arcata and has two tenant farms, Humboldt Bay Oyster Company and Aqua Rodeo Farms, which also culture oysters. In addition, Humboldt Bay Oyster Company produces large oyster seed for other California and Washington farms (Kuiper 2009). Annual gross sales of these operations combined currently average more than $6 million (Kuiper 2009).
Business name Product(s) Employees
Aqua Rodeo Farms Pacific and Kumamoto oysters 1 FT
Coast Seafoods Pacific and Kumamoto oysters, Manila clams 30–40
Humboldt Bay Oyster Co. Oysters and oyster seed 2FT, 1PT
Kuiper Mariculture* Pacific and Kumamoto oyster seed, Manila clam seed 6FT, 2 PT
North Bay Shellfish Market oyster, mussels 1FT, 1PT
* In 2009, Washington-based Taylor Mariculture LLC purchased Kuiper Mariculture.
Table 1. Current aquaculture facilities in the Humboldt Bay area.
Eureka Fishing Community Profile 12
The Eureka fishing community is comprised of commercial and recreational fishery participants (e.g., fishermen, receivers, processors) and their families, as well as fishery-support businesses that provide goods and services that fishery participants need to operate safely and effectively. Local commercial fisheries include a diversity of participants engaged in a range of fisheries and fishery-related activities. Recreational fisheries include private boat and charter operations that involve locals and nonlocals alike.
Commercial Fisheries The primary commercial fisheries at Eureka include the pot fishery for Dungeness crab, and the trawl, hook-and-line and trap fisheries for various groundfish species.21 The salmon troll fishery, when regulations permit, is also active. Other current fisheries include the trawl fisheries for pink shrimp and Pacific whiting22, the troll fishery for albacore tuna, and the hook-and-line (longline) fishery for sablefish (blackcod, Anaploma fimbria), and a small and variably active bucket (or Korean trap) fishery for Pacific hagfish (slime eel, Eptatretus stoutii).23 Within Humboldt Bay, there are also small-scale gillnet fisheries for herring and northern anchovy.
Most of these fisheries are seasonal as a function of resource availability, regulations that define when, where and how each fishery is allowed to operate, the availability of buyers, and market demand (Table 2). However, the actual temporal distribution of activity is often more compressed, variable and complex than suggested by the table. For instance, the availability of albacore varies widely from year to year. The salmon fishery in California’s KMZ was completely closed in 2006, 2008 and 2009, and opened only briefly in 2007. The Dungeness crab fishery is concentrated in the winter months due to peak holiday demand. Groundfish seasons tend to be defined in two-month increments (reflecting the use of bimonthly vessel cumulative landing limits), vary by species and fishery sector, and are sometimes subject to inseason closure to prevent optimum yield (OY) of selected species from being exceeded.
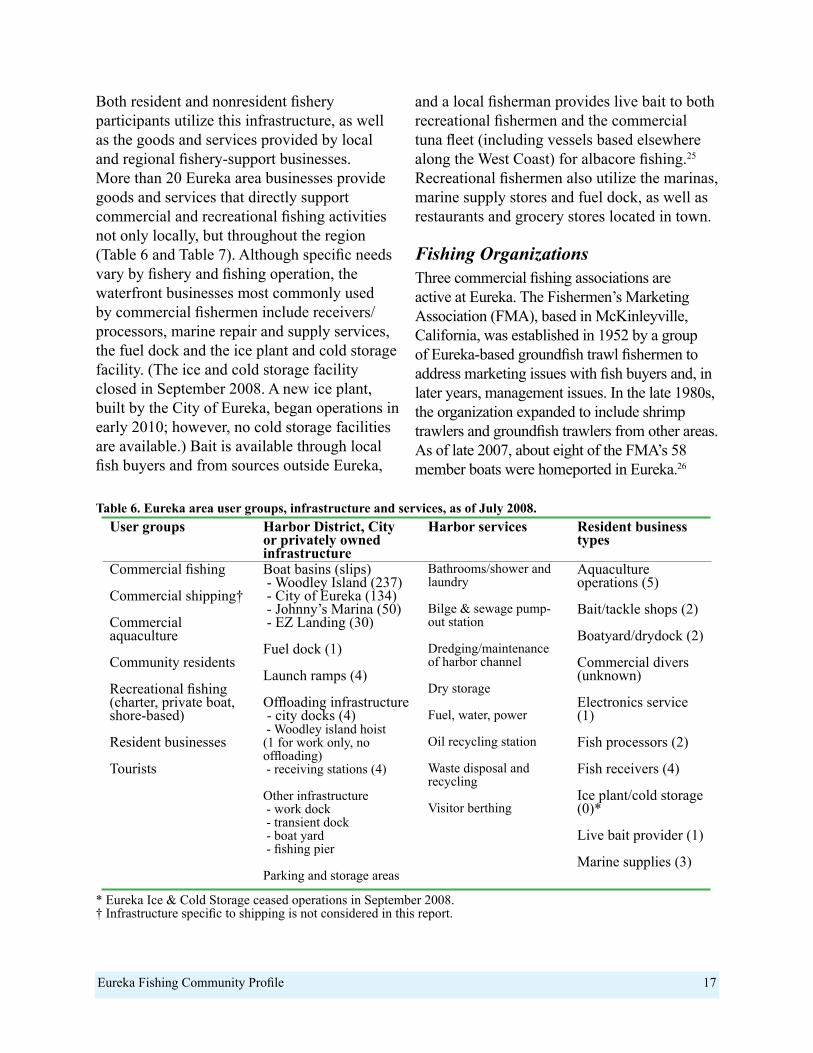
JAN
FEB
MA
R
APR
MAY
JUN
E
JULY
AU
G
SEP
OC
T
NO
V
DEC
Albacore CrabGroundfishPink shrimpSalmonWhiting
Table 2. Seasonality of selected commercial fisheries at Eureka.
ThE EurEka FiShing CommuniTy Today
Eureka Fishing Community Profile 13
About 100–120 commercial fishing vessels are homeported at Eureka. Commercial fishery participants described the make-up of the resident fleet as including 8–10 trawlers, 15–20 salmon trollers, 5–10 smaller groundfish vessels (which target sablefish and nearshore species) and about 80 crabbers (or combination crabber/trollers). Although some fishermen in these groups are specialized, most participate in multiple fisheries. Some are full-time, while others are part-time fishermen. Full-time skippers depend on fishing for their livelihood and fish year-round, as resource availability, weather and regulations permit. Part-time skippers fish part of the year, often focusing on a single fishery, and may pursue other activities (on or off the water) as part of their livelihood.
Vessels are characterized as either ‘big boats’ (55 feet long or larger) or ‘small boats’ (less than 55 feet). Big boats include trawlers and larger crabber/trollers. These vessels may also be called ‘trip-boats’, as they are equipped with comfort and safety features that enable them to venture as far south as the San Francisco Bay area, north into Oregon and Washington, and further offshore for a few days to several weeks to follow the fish. Small boats tend to fish for some combination of crab, groundfish (including sablefish), and perhaps salmon. These smaller vessels may make short trips (up to five days), but often work as ‘day-boats’, leaving port early in the morning to fish nearby, then returning to Eureka the same day to unload their catch. Larger boats may carry two to four crew (including the skipper), while smaller operations may carry a crew of one to three.
The frequency and duration of fishing trips varies within and among fisheries. Most of Eureka’s hook-and-line groundfish fishing operations work as day-boats, while most groundfish, shrimp and whiting trawlers are trip-boats. For the crab fishery, small and big
boats alike usually make day trips for the local fishery. However, some travel to the San Francisco Bay area for the mid- November opening of the fishery in that region. Those trollers that travel for salmon generally leave Eureka for part of the season, making three- to five-day fishing trips in areas that are open to salmon fishing, and delivering their catch to buyers at ports in those areas.
A number of transient vessels also use Humboldt Bay’s fishery support infrastructure. Vessels such as those from the offshore tuna fleet periodically visit the port to offload fish and/or re-provision, and some receivers have arrangements with nonresident vessels (especially whiting vessels) to deliver at Eureka. According to Eureka Public Marina staff, on average 15% of berths are used by transient vessels (combination of commercial and recreational). In addition, vessels from Trinidad (25 miles to the north) move their boats to Eureka for refuge when marine conditions are severe.
Eureka Area Seafood Receiving, Processing and MarketingPresently, local fish receiving and processing capacity consists of four buyers with receiving stations located at various sites along the Eureka waterfront, including two on-site receiver/processors. Pacific Choice Seafood, the larger of these, processes a wide range of species landed at Eureka and other Northern
Eureka Fishing Community Profile 14
California ports and currently is the only pink shrimp processor in the region. Caito Fisheries processes some crab locally, and trucks the remainder of the catch as well as groundfish to its plant in Fort Bragg for processing. These two firms, together with Carvalho Fisheries, accounted for more than 90% of the ex-vessel value of the catch at Eureka and Fields Landing in 2005 and 2006, and 82% in 2007. The fourth receiver, Humboldt Seafood Unloaders, offloads for other nonresident seafood buyers.
The chain of custody generally follows from fishing vessel to receiver to processors, with most of the catch transported out of Eureka for distribution (Figure 3). Some buyers receive fish on behalf of other entities based elsewhere along the West Coast as well as their own business. In 2007, at least 15 (37%) of the 41 entities that received fish at Eureka, including fishermen who sold their own and
in some cases others’ catch, were based in the area. Some businesses are vertically integrated and function in multiple roles (e.g., receiver and distributor). Some local buyers sell crab, salmon and groundfish directly to the public through retail outlets and/or online sales. In addition, at least three local groceries sell locally landed seafood. Between 6 and 12 fishermen engage in off-the-boat sales for albacore, some crab and some other finfish species.24
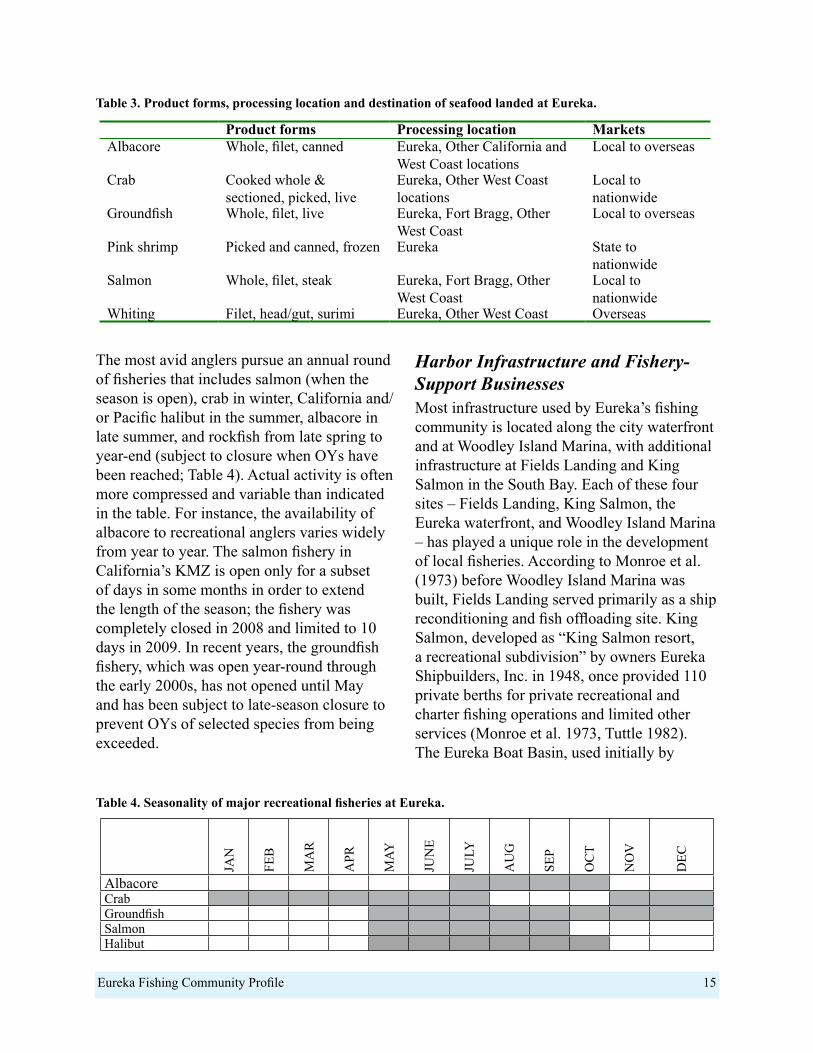
Product forms vary within and across fisheries (Table 3). Pacific whiting, groundfish, salmon, shrimp and crab are processed locally. Live crab has become more common over the past decade, largely due to growing demand in the San Francisco Bay area. Some albacore and salmon are processed on a small scale elsewhere in the Eureka area for local and regional distribution.
Ocean Recreational FisheriesRecreational fishing in Humboldt Bay and the ocean is done mainly from private boats; additionally, at least three charter operations serve resident and nonresident anglers. A reported 50%–70% of charter operators’ clients are residents or friends and family of residents. The remaining 30%–50% visit from outside the area, and thus support local hotels, campgrounds and restaurants during their stay.
Figure 3. Pathways of seafood landed at Eureka. Note: thicker arrows indicate most common pathways.
Eureka Fishing Community Profile 15
The most avid anglers pursue an annual round of fisheries that includes salmon (when the season is open), crab in winter, California and/or Pacific halibut in the summer, albacore in late summer, and rockfish from late spring to year-end (subject to closure when OYs have been reached; Table 4). Actual activity is often more compressed and variable than indicated in the table. For instance, the availability of albacore to recreational anglers varies widely from year to year. The salmon fishery in California’s KMZ is open only for a subset of days in some months in order to extend the length of the season; the fishery was completely closed in 2008 and limited to 10 days in 2009. In recent years, the groundfish fishery, which was open year-round through the early 2000s, has not opened until May and has been subject to late-season closure to prevent OYs of selected species from being exceeded.
Harbor Infrastructure and Fishery-Support BusinessesMost infrastructure used by Eureka’s fishing community is located along the city waterfront and at Woodley Island Marina, with additional infrastructure at Fields Landing and King Salmon in the South Bay. Each of these four sites – Fields Landing, King Salmon, the Eureka waterfront, and Woodley Island Marina – has played a unique role in the development of local fisheries. According to Monroe et al. (1973) before Woodley Island Marina was built, Fields Landing served primarily as a ship reconditioning and fish offloading site. King Salmon, developed as “King Salmon resort, a recreational subdivision” by owners Eureka Shipbuilders, Inc. in 1948, once provided 110 private berths for private recreational and charter fishing operations and limited other services (Monroe et al. 1973, Tuttle 1982). The Eureka Boat Basin, used initially by
Product forms Processing location marketsAlbacore Whole, filet, canned Eureka, Other California and
West Coast locationsLocal to overseas
Crab Cooked whole & sectioned, picked, live
Eureka, Other West Coast locations
Local to nationwide
Groundfish Whole, filet, live Eureka, Fort Bragg, Other West Coast
Local to overseas
Pink shrimp Picked and canned, frozen Eureka State to nationwide
Salmon Whole, filet, steak Eureka, Fort Bragg, Other West Coast
Local to nationwide
Whiting Filet, head/gut, surimi Eureka, Other West Coast Overseas
Table 3. Product forms, processing location and destination of seafood landed at Eureka.
JAN
FEB
MA
R
APR
MAY
JUN
E
JULY
AU
G
SEP
OC
T
NO
V
DEC
Albacore CrabGroundfishSalmonHalibut
Table 4. Seasonality of major recreational fisheries at Eureka.
Eureka Fishing Community Profile 16
commercial fishermen in the 1920s and 1930s, provided public facilities, including 138 berths as of the early 1970s (Monroe et al. 1973).
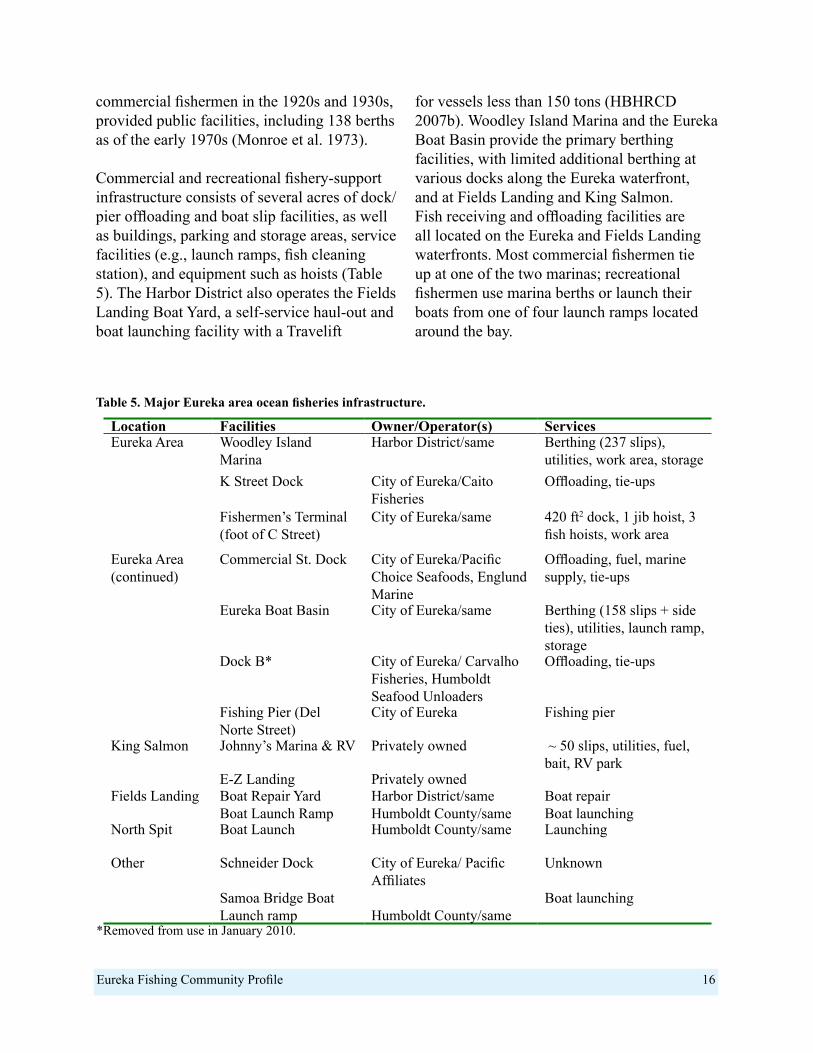
Commercial and recreational fishery-support infrastructure consists of several acres of dock/pier offloading and boat slip facilities, as well as buildings, parking and storage areas, service facilities (e.g., launch ramps, fish cleaning station), and equipment such as hoists (Table 5). The Harbor District also operates the Fields Landing Boat Yard, a self-service haul-out and boat launching facility with a Travelift
for vessels less than 150 tons (HBHRCD 2007b). Woodley Island Marina and the Eureka Boat Basin provide the primary berthing facilities, with limited additional berthing at various docks along the Eureka waterfront, and at Fields Landing and King Salmon. Fish receiving and offloading facilities are all located on the Eureka and Fields Landing waterfronts. Most commercial fishermen tie up at one of the two marinas; recreational fishermen use marina berths or launch their boats from one of four launch ramps located around the bay.
Table 5. Major Eureka area ocean fisheries infrastructure.
location Facilities Owner/Operator(s) ServicesEureka Area Woodley Island
Marina Harbor District/same Berthing (237 slips),
utilities, work area, storageK Street Dock City of Eureka/Caito
FisheriesOffloading, tie-ups
Fishermen’s Terminal (foot of C Street)
City of Eureka/same 420 ft2 dock, 1 jib hoist, 3 fish hoists, work area
Eureka Area (continued)
Commercial St. Dock City of Eureka/Pacific Choice Seafoods, Englund Marine
Offloading, fuel, marine supply, tie-ups
Eureka Boat Basin City of Eureka/same Berthing (158 slips + side ties), utilities, launch ramp, storage
Dock B* City of Eureka/ Carvalho Fisheries, Humboldt Seafood Unloaders
Offloading, tie-ups
Fishing Pier (Del Norte Street)
City of Eureka Fishing pier
King Salmon Johnny’s Marina & RV Privately owned ~ 50 slips, utilities, fuel, bait, RV park
E-Z Landing Privately ownedFields Landing Boat Repair Yard
Boat Launch RampHarbor District/sameHumboldt County/same
Boat repairBoat launching
North Spit Boat Launch Humboldt County/same Launching
Other Schneider Dock
Samoa Bridge Boat Launch ramp
City of Eureka/ Pacific Affiliates
Humboldt County/same
Unknown
Boat launching
*Removed from use in January 2010.
Eureka Fishing Community Profile 17
Both resident and nonresident fishery participants utilize this infrastructure, as well as the goods and services provided by local and regional fishery-support businesses. More than 20 Eureka area businesses provide goods and services that directly support commercial and recreational fishing activities not only locally, but throughout the region (Table 6 and Table 7). Although specific needs vary by fishery and fishing operation, the waterfront businesses most commonly used by commercial fishermen include receivers/processors, marine repair and supply services, the fuel dock and the ice plant and cold storage facility. (The ice and cold storage facility closed in September 2008. A new ice plant, built by the City of Eureka, began operations in early 2010; however, no cold storage facilities are available.) Bait is available through local fish buyers and from sources outside Eureka,
and a local fisherman provides live bait to both recreational fishermen and the commercial tuna fleet (including vessels based elsewhere along the West Coast) for albacore fishing.25 Recreational fishermen also utilize the marinas, marine supply stores and fuel dock, as well as restaurants and grocery stores located in town.
Fishing Organizations Three commercial fishing associations are active at Eureka. The Fishermen’s Marketing Association (FMA), based in McKinleyville, California, was established in 1952 by a group of Eureka-based groundfish trawl fishermen to address marketing issues with fish buyers and, in later years, management issues. In the late 1980s, the organization expanded to include shrimp trawlers and groundfish trawlers from other areas. As of late 2007, about eight of the FMA’s 58 member boats were homeported in Eureka.26
Table 6. Eureka area user groups, infrastructure and services, as of July 2008.user groups Harbor District, City
or privately owned infrastructure
Harbor services resident business types
Commercial fishing
Commercial shipping†
Commercial aquaculture
Community residents
Recreational fishing (charter, private boat, shore-based)
Resident businesses
Tourists
Boat basins (slips) - Woodley Island (237) - City of Eureka (134) - Johnny’s Marina (50) - EZ Landing (30)
Fuel dock (1)
Launch ramps (4)
Offloading infrastructure - city docks (4) - Woodley island hoist (1 for work only, no offloading) - receiving stations (4)
Other infrastructure - work dock - transient dock - boat yard - fishing pier
Parking and storage areas
Bathrooms/shower and laundry
Bilge & sewage pump-out station
Dredging/maintenance of harbor channel
Dry storage
Fuel, water, power
Oil recycling station
Waste disposal and recycling
Visitor berthing
Aquaculture operations (5)
Bait/tackle shops (2)
Boatyard/drydock (2)
Commercial divers (unknown)
Electronics service (1)
Fish processors (2)
Fish receivers (4)
Ice plant/cold storage (0)*
Live bait provider (1)
Marine supplies (3)
* Eureka Ice & Cold Storage ceased operations in September 2008.† Infrastructure specific to shipping is not considered in this report.
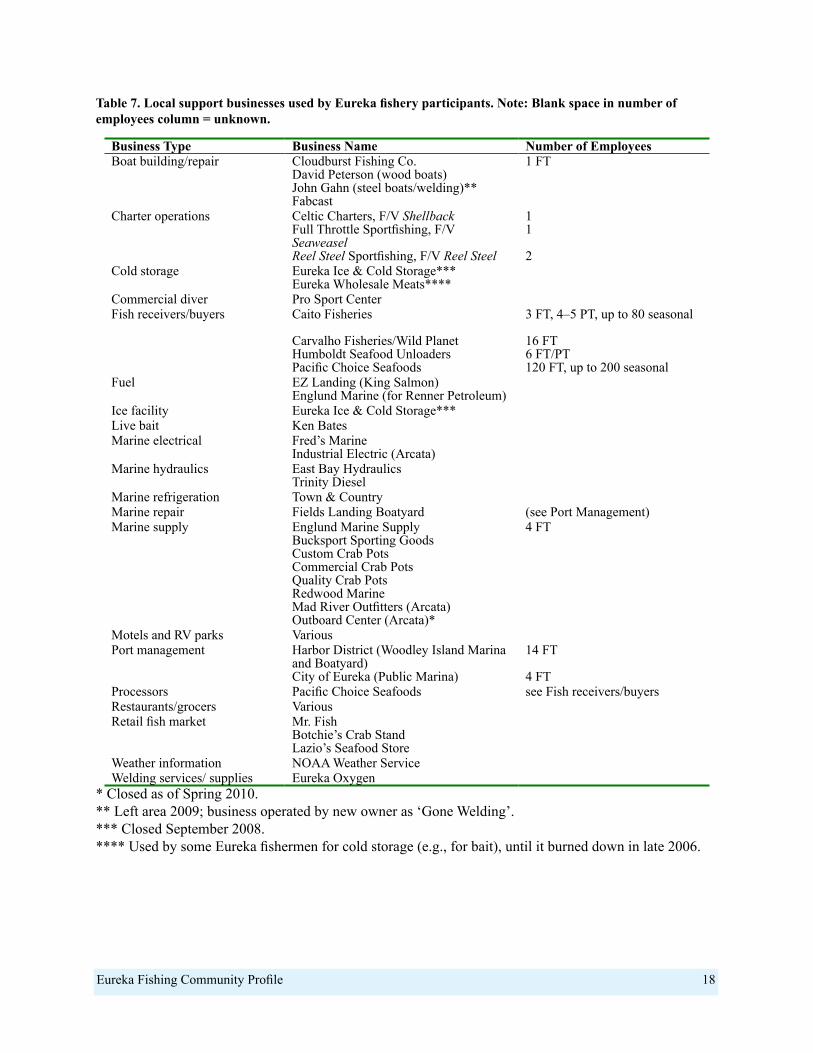
Eureka Fishing Community Profile 18
Business Type Business name Number of EmployeesBoat building/repair Cloudburst Fishing Co.
David Peterson (wood boats)John Gahn (steel boats/welding)**Fabcast
1 FT
Charter operations Celtic Charters, F/V ShellbackFull Throttle Sportfishing, F/V Seaweasel Reel Steel Sportfishing, F/V Reel Steel
11
2Cold storage Eureka Ice & Cold Storage***
Eureka Wholesale Meats****Commercial diver Pro Sport CenterFish receivers/buyers Caito Fisheries
Carvalho Fisheries/Wild PlanetHumboldt Seafood UnloadersPacific Choice Seafoods
3 FT, 4–5 PT, up to 80 seasonal
16 FT6 FT/PT120 FT, up to 200 seasonal
Fuel EZ Landing (King Salmon)Englund Marine (for Renner Petroleum)
Ice facility Eureka Ice & Cold Storage*** Live bait Ken BatesMarine electrical Fred’s Marine
Industrial Electric (Arcata)Marine hydraulics East Bay Hydraulics
Trinity DieselMarine refrigeration Town & CountryMarine repair Fields Landing Boatyard (see Port Management)Marine supply Englund Marine Supply
Bucksport Sporting GoodsCustom Crab PotsCommercial Crab PotsQuality Crab PotsRedwood MarineMad River Outfitters (Arcata)Outboard Center (Arcata)*
4 FT
Motels and RV parks VariousPort management Harbor District (Woodley Island Marina
and Boatyard)City of Eureka (Public Marina)
14 FT
4 FTProcessors Pacific Choice Seafoods see Fish receivers/buyersRestaurants/grocers VariousRetail fish market Mr. Fish
Botchie’s Crab StandLazio’s Seafood Store
Weather information NOAA Weather ServiceWelding services/ supplies Eureka Oxygen
* Closed as of Spring 2010.** Left area 2009; business operated by new owner as ‘Gone Welding’.*** Closed September 2008.**** Used by some Eureka fishermen for cold storage (e.g., for bait), until it burned down in late 2006.
Table 7. Local support businesses used by Eureka fishery participants. Note: Blank space in number of employees column = unknown.
Eureka Fishing Community Profile 19
The Western Fishboat Owners’ Association (WFOA), established in 1970 and based in Redding, California, represents an estimated 400 albacore trollers and support businesses from British Columbia to Southern California, Hawaii and New Zealand. About 15 of its members are homeported in the Eureka area.27 The WFOA focuses its efforts on marketing and product pricing for the boats, and represents its members in fishery management issues at the state, federal, and international level.
The Humboldt Fishermen’s Marketing Association (HFMA), established in 1955, primarily represents salmon trollers and crabbers in the Humboldt Bay area. It has long worked with the city, the Harbor District and the community to address local infrastructure needs and other topics, and with state and federal legislators and agencies to address issues of concern, most notably salmon management.
The Fishermen’s Wives Association was active for several decades, providing a variety of fishing community support functions.28 For example, in 1979, it commissioned the fishermen’s memorial at Woodley Island Marina (Trauth 2001). More recently, women associated with Eureka’s commercial fisheries
have been active in Humboldt Women for Commercial Fisheries, a countywide organization. Among other activities, the group has developed a “Humboldt Wild Seafood” campaign to promote local seafood sales.
Two local sport fishing organizations are active in the Humboldt Bay area. The Humboldt Tuna Club (or Bay Area Tuna Club) represents local sport fishermen, most of whom are based in the Eureka area. Although albacore fishing is the organization’s central focus, most of its members are active in other fisheries year-round. The group has a strong social network, and engages in a variety of fishery-related and community activities. In early 2009, Humboldt Tuna Club members and others established Humboldt Area Saltwater Anglers (HASA) to educate members and the public about local sport fisheries, and address a range of issues, including salmon and rockfish management and the Marine Life Protection Act Initiative process. HASA represents about 300 North Coast recreational fishermen.
The Arcata Bay Oyster Festival, organized by Humboldt Bay oyster growers and others, and held annually in June since 1991, celebrates the long history of the local oyster industry. The annual one-day event attracts tourists and residents, promotes aquaculture in Humboldt Bay, and generates revenue for the city.
Eureka Fishing Community Profile 20
This section focuses on commercial fishery activity in Eureka and Fields Landing combined (hereafter termed the ‘Eureka area’) between 1981 and 2007.29 The information presented is based on customized summaries of Pacific Fisheries Information Network (PacFIN) landings receipt data, augmented by earlier and/or longer-term data, as well as data from fieldwork. Eureka and Fields Landing (the area’s primary offloading sites) are combined in this analysis to enable more complete reporting of fishery activity while meeting confidentiality requirements, and because the two locations are closely linked in terms of their fisheries and participants.
We use five measures of fishing activity derived from the landings receipt data. Landings are reported as ‘round weight’ (in pounds), reflecting the total weight of the fish caught. (For species like salmon and sablefish, which are gutted at sea, landed weights are converted to round weights to provide comparability with other species.) Ex-vessel values represent the amount paid to fishermen at the first point of sale (usually to a dockside buyer or receiver). Prices are calculated as the total ex-vessel value divided by total pounds landed. Both ex-vessel values and prices are adjusted for inflation using US$ 2007 values as a base. Boat counts represent individual (resident and nonresident) fishing operations, though not necessarily individual fishermen, as some fishermen may own and/or operate multiple boats, and most boats have crew (and possibly multiple skippers) that these counts do not include. Buyer counts are based on the number of unique buyer IDs in the landings data, and include fishermen who land their own catch (e.g., for off-the-boat sales, direct sales to restaurants) as well as receivers, fish houses and other types of fish buyers who purchase
the catch from fishermen delivering at the docks.30 The number of trips provides a count of the deliveries each boat makes at the port.31 To insure confidentiality, data are not reported for some fisheries and/or years if fewer than three vessels or buyers participated.
In the discussion that follows, the long term is the period 1981–2007, whereas recent years pertains to the most recent five years of the time series (2003–2007), unless otherwise noted. The purpose of focusing on these two time periods is to demonstrate how recent activity compares to longer-term historical levels. While the long-term trends described in this section begin in 1981, it should be noted that some local fisheries (e.g., groundfish, salmon) were established well before that year.
Overall fishing activity in the Eureka area has declined since 1981. Several fisheries – most notably groundfish trawl and crab – have been major contributors, as measured by pounds landed, ex-vessel value, number of boats, buyers and trips. Total landings (all species) ranged between a high of 36.9 million pounds (in 1981) and a low of about 9.4 million pounds (in 2001) (Figure 4, Table 8). Average annual landings were 14% lower in recent years (16.9 million pounds) relative to the long-term average (19.7 million pounds). This difference reflects a 62% reduction in groundfish landings, partially offset by a 144% increase in whiting landings and a 79% increase in crab landings between the long term and recent years.
The ex-vessel value of commercial fishery landings in the Eureka area ranged from a high of $27 million (in 1981) to a low of $6.7 million (in 2001), averaging $13.7 million over the long term and $11.9 million in recent
CommErCial FiShEry aCTiviTy in ThE EurEka arEa
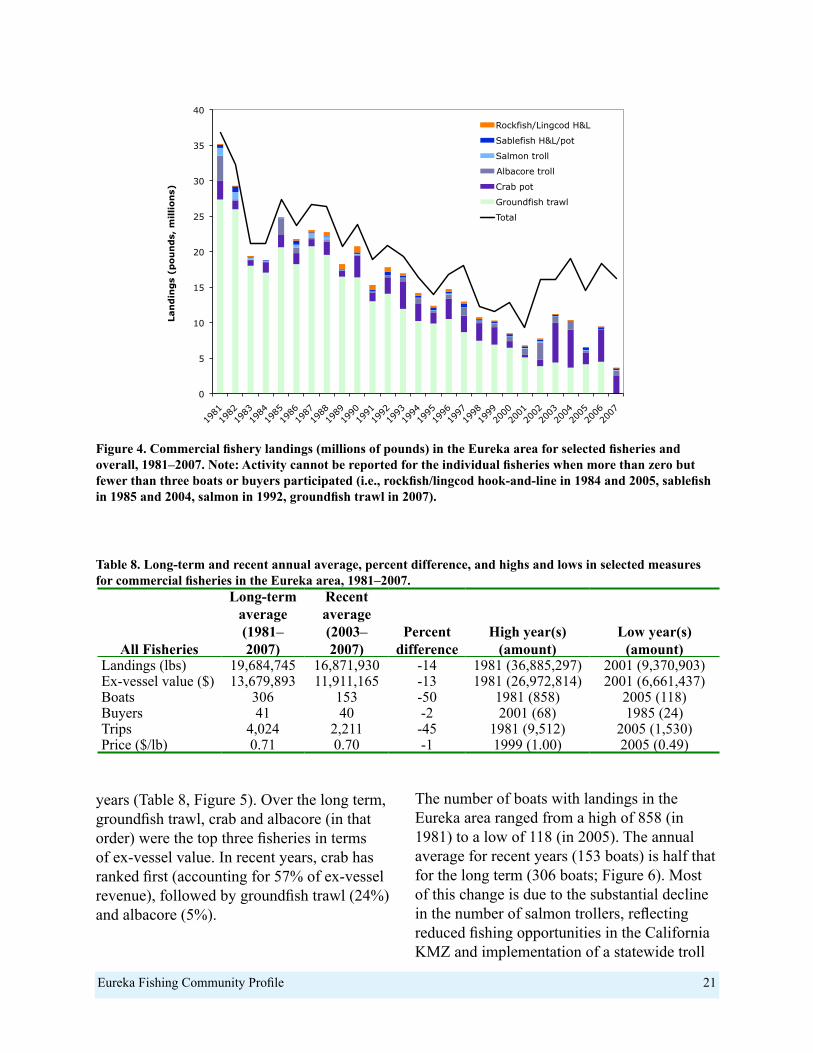
Eureka Fishing Community Profile 21
years (Table 8, Figure 5). Over the long term, groundfish trawl, crab and albacore (in that order) were the top three fisheries in terms of ex-vessel value. In recent years, crab has ranked first (accounting for 57% of ex-vessel revenue), followed by groundfish trawl (24%) and albacore (5%).
The number of boats with landings in the Eureka area ranged from a high of 858 (in 1981) to a low of 118 (in 2005). The annual average for recent years (153 boats) is half that for the long term (306 boats; Figure 6). Most of this change is due to the substantial decline in the number of salmon trollers, reflecting reduced fishing opportunities in the California KMZ and implementation of a statewide troll
0
5
10
15
20
25
30
35
40
1981
1982
1983
1984
1985
1986
1987
1988
1989
1990
1991
1992
1993
1994
1995
1996
1997
1998
1999
2000
2001
2002
2003
2004
2005
2006
2007
Lan
din
gs
(po
un
ds,
millio
ns)
Rockfish/Lingcod H&L
Sablefish H&L/pot
Salmon troll
Albacore troll
Crab pot
Groundfish trawl
Total
Figure 4. Commercial fishery landings (millions of pounds) in the Eureka area for selected fisheries and overall, 1981–2007. Note: Activity cannot be reported for the individual fisheries when more than zero but fewer than three boats or buyers participated (i.e., rockfish/lingcod hook-and-line in 1984 and 2005, sablefish in 1985 and 2004, salmon in 1992, groundfish trawl in 2007).
All Fisheries
Long-term average(1981–2007)
recent average(2003–2007)
Percent difference
High year(s) (amount)
Low year(s) (amount)
Landings (lbs) 19,684,745 16,871,930 -14 1981 (36,885,297) 2001 (9,370,903)Ex-vessel value ($) 13,679,893 11,911,165 -13 1981 (26,972,814) 2001 (6,661,437)Boats 306 153 -50 1981 (858) 2005 (118)Buyers 41 40 -2 2001 (68) 1985 (24)Trips 4,024 2,211 -45 1981 (9,512) 2005 (1,530)Price ($/lb) 0.71 0.70 -1 1999 (1.00) 2005 (0.49)
Table 8. Long-term and recent annual average, percent difference, and highs and lows in selected measures for commercial fisheries in the Eureka area, 1981–2007.
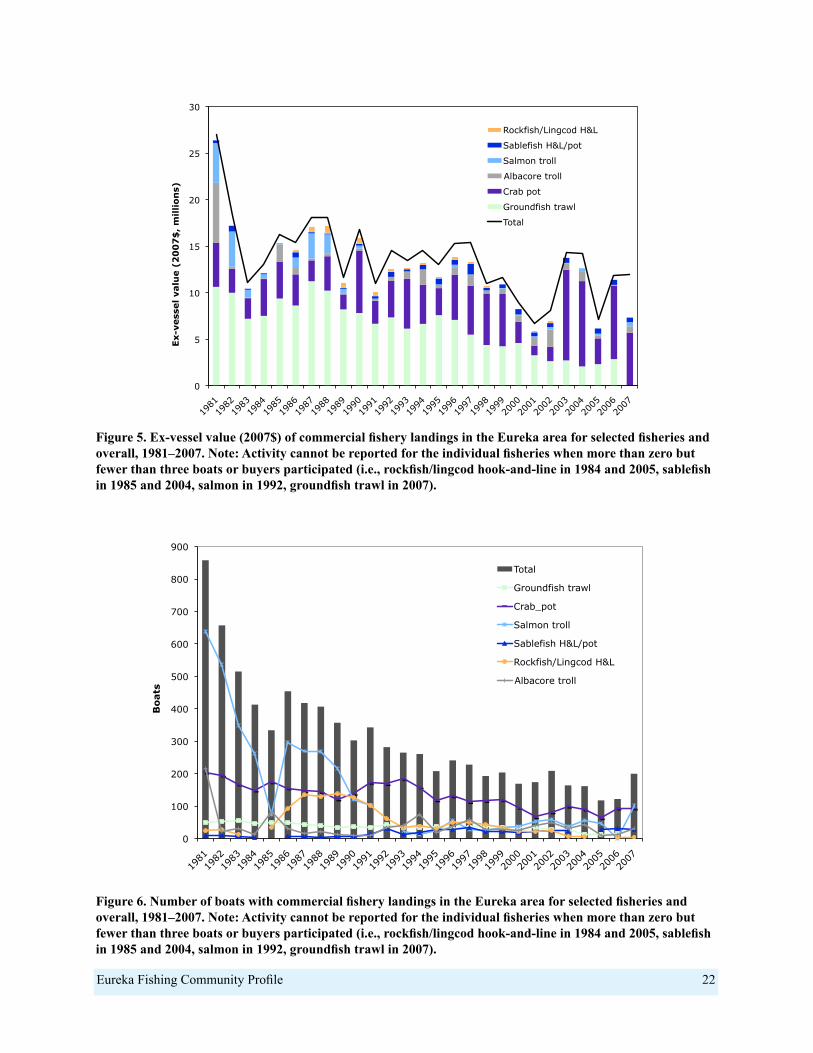
Eureka Fishing Community Profile 22
0
5
10
15
20
25
30
1981
1982
1983
1984
1985
1986
1987
1988
1989
1990
1991
1992
1993
1994
1995
1996
1997
1998
1999
2000
2001
2002
2003
2004
2005
2006
2007
Ex-v
ess
el va
lue (
20
07
$,
millio
ns)
Rockfish/Lingcod H&L
Sablefish H&L/pot
Salmon troll
Albacore troll
Crab pot
Groundfish trawl
Total
Figure 5. Ex-vessel value (2007$) of commercial fishery landings in the Eureka area for selected fisheries and overall, 1981–2007. Note: Activity cannot be reported for the individual fisheries when more than zero but fewer than three boats or buyers participated (i.e., rockfish/lingcod hook-and-line in 1984 and 2005, sablefish in 1985 and 2004, salmon in 1992, groundfish trawl in 2007).
0
100
200
300
400
500
600
700
800
900
1981
1982
1983
1984
1985
1986
1987
1988
1989
1990
1991
1992
1993
1994
1995
1996
1997
1998
1999
2000
2001
2002
2003
2004
2005
2006
2007
Bo
ats
Total
Groundfish trawl
Crab_pot
Salmon troll
Sablefish H&L/pot
Rockfish/Lingcod H&L
Albacore troll
Figure 6. Number of boats with commercial fishery landings in the Eureka area for selected fisheries and overall, 1981–2007. Note: Activity cannot be reported for the individual fisheries when more than zero but fewer than three boats or buyers participated (i.e., rockfish/lingcod hook-and-line in 1984 and 2005, sablefish in 1985 and 2004, salmon in 1992, groundfish trawl in 2007).
Eureka Fishing Community Profile 23
limited entry program in the early 1980s. However, the number of boats participating in other fisheries has declined as well. Recent average participation was lower than long-term average participation by about 30% for crab and groundfish trawl and by 89% for rockfish. An exception to this decline is the sablefish fishery, where the average number of boats in recent years is 47% higher than the long-term average.
The Eureka area also experienced an overall decrease in the number of fishing trips (or deliveries; Figure 7). Average annual activity in recent years (2,200 trips) is down 45% from the long-term average of just over 4,000 trips. This decline is largely due to the greater than 70% declines in salmon and groundfish trips, a 22% decline in crab trips (even as landings and revenues increased), and reduced activity in most other fisheries. One exception is the whiting fishery, where average activity in recent years is 53% greater than the long-term
average, although the absolute numbers of trips and boats involved are small.
In all but three years between 1981 and 2007, crab trips accounted for a plurality (i.e., the greatest proportion, 25%–72%) of all trips in the Eureka area. On average, crab trips accounted for 46% of all deliveries over the long term and 62% in recent years. Groundfish trawl trips also have figured prominently, averaging 22% of all trips over the long term, and 10% in recent years. Salmon trips, which peaked at 37% of deliveries in 1982, declined from an average of 12% over the long term to 8% in recent years, whereas sablefish trips played an increasing role from 1992 onward.
Between 1981 and 1987, 24–35 buyers per year participated in Eureka area fisheries. The numbers trended upward to a peak of 68 in 2001, then declined to 30–36 between 2005 and 2007. Over the long term, an average of 60% of Eureka area buyers participated in the
Figure 7. Number of trips by commercial fishing vessels landing in the Eureka area for selected fisheries and overall, 1981–2007. Note: Activity cannot be reported for the individual fisheries when more than zero but fewer than three boats or buyers participated (i.e., rockfish/lingcod hook-and-line in 1984 and 2005, sablefish in 1985 and 2004, salmon in 1992, groundfish trawl in 2007).
0
1
2
3
4
5
6
7
8
9
10
1981
1982
1983
1984
1985
1986
1987
1988
1989
1990
1991
1992
1993
1994
1995
1996
1997
1998
1999
2000
2001
2002
2003
2004
2005
2006
2007
Tri
ps
(th
ou
san
ds)
Rockfish/Lingcod H&L
Sablefish H&L/pot
Salmon troll
Albacore troll
Crab pot
Groundfish trawl
Total
Eureka Fishing Community Profile 24
crab fishery, and at least 25% participated in the salmon, rockfish and albacore fisheries. Of the 30 buyers that received commercially-caught seafood in the Eureka area in 2007, at least five were locally-based nonfisherman businesses, at least nine were local fishermen, and seven were buyers based in other locations in California, and in Oregon and Washington.
Average annual ex-vessel price per pound for all fisheries combined is nearly the same in recent years ($0.70) compared to the long term ($0.71; see Table 8). These averages, however, mask substantial differences among fisheries. Prices are lower in recent years relative to the long term in the whiting (-40%), shrimp trawl (-36%), crab (-12%) and albacore (-5%) fisheries. In contrast, average annual ex-vessel prices were greater in recent years compared to the long term for several fisheries including rockfish (+45%), sablefish (+32%), salmon (+10%) and groundfish trawl (+5%).
The distribution of ex-vessel value among fishermen and buyers provides insights into the extent to which consolidation of fishing activity has occurred.32 Over the recent decade (1998–2007), even as the number of boats landing in the Eureka area varied between 114 and 197, revenue concentration changed little, with 34%–47% of boats accounting for 90% of landed value. Among buyers, revenue concentration is higher, with 21%–26% of buyers accounting for 90% of landed value between 1998 and 2000, and 9%–17% accounting for 90% of value between 2001 and 2007.
Activity Within Commercial Fisheries
The Groundfish Trawl FisheryMany study participants consider groundfish trawl the backbone of the industry, keeping people and bills paid and filet lines active throughout the year. In 1981, more than 27
million pounds of trawl-caught groundfish valued at $10.7 million were landed in the Eureka area (Figure 8, Table 9). At that time, and as far back as 1947, the fishery ranked first in terms of both landings and ex-vessel value. However, activity in the fishery has declined substantially, with average annual landings in recent years (4.7 million pounds) 62% lower compared to the long-term average of 12.3 million pounds. Most of this change can be attributed to declines in activity at Fields Landing, which accounted for about half of groundfish trawl activity in the early 1980s, but declined to zero by 2002, the year after Eureka Fisheries ceased operations.
Through the mid-1980s, ex-vessel value varied between $7.2 million (in 1983) and $11.3 million (in 1987), then declined fairly steadily to a low of $2.1 million in 2004. Ex-vessel value increased only slightly thereafter. The average value of landings in recent years ($2.7 million) is 57% lower than the long-term average ($6.3 million).
Participation in the fishery by boats and buyers is 50% lower in recent years relative to the long term. Vessel participation declined steadily from 50–56 boats in the early 1980s to 35–38 boats in the late 1990s. Between 2003 and 2004, the number of boats in the fishery dropped by nearly half (27 to 14) due to participation in the trawl buyback program, then increased modestly to 19 boats by 2007. The number of buyers increased from 6–10 during the period 1981–1996 to 10–13 during the period 1997–2002, then declined to 2–7 in recent years.
The most marked change in groundfish trawl activity pertains to the number of trips, which is 70% lower in recent years (271 trips) relative to the long term (908 trips). Fishing activity declined steadily from 1,658 trips in 1981 to 522 trips in 2002. A marked decline
Eureka Fishing Community Profile 25
occurred between 2003 (373 trips) and 2004 (208 trips), followed by an increase to 296 trips by 2007.
Average annual prices for trawl-caught groundfish in recent years are slightly higher compared to the long term, although this may be due to changes in the mix of species landed. Prices increased gradually from $0.39 per pound in 1981 to $0.51 in 1993, then to $0.77
by 1995, and fluctuated between $0.56 and $0.71 in subsequent years.
The proportion of Eureka area landings accounted for by groundfish trawlers ranged from 48% to 85% during the period 1981–2002, then dropped to 19%–27% during the period 2003–2006 before increasing in 2007. The fishery accounted for 36%–71% of ex-vessel value between 1981 and 2001, and
0
10
20
30
40
50
60
0
5
10
15
20
25
30
1981
1982
1983
1984
1985
1986
1987
1988
1989
1990
1991
1992
1993
1994
1995
1996
1997
1998
1999
2000
2001
2002
2003
2004
2005
2006
2007
Bo
ats
an
d b
uye
rs
Po
un
ds
an
d e
x-v
ess
el va
lue (
millio
ns,
20
07
$) Pounds
Ex-vessel value
Boats
Buyers
Non-reportable
Groundfish trawl Groundfish FMP
Limited entry
Groundfish disaster
Trawl buyback
Figure 8. Landings, ex-vessel value (2007$), and number of boats and buyers for the commercial groundfish trawl fishery in the Eureka area, 1981–2007. Note: Activity cannot be reported in 2007, when more than zero but fewer than three boats or buyers participated.
Groundfish trawl
Long-term average
(1981–2007)
recent average
(2003–2007)Percent
differenceHigh year(s)
(amount)Low year(s)
(amount)Landings (lbs) 12,315,890 4,653,293 -62 1981 (27,388,638) 2004 (3,699,406)Ex-vessel value ($) 6,339,241 2,741,236 -57 1987 (11,253,697) 2004 (2,103,863)Boats 36 18 -50 1983 (56) 2004 (14)Buyers 8 4 -50 1999 (13) 2006 (3)Trips 908 271 -70 1981 (1,658) 2004 (208)Price ($/lb) 0.56 0.59 +5 1995 (0.77) 1981, 1982 (0.39)
Table 9. Long-term and recent annual average, percent difference, and highs and lows in selected measures for the groundfish trawl fishery in the Eureka area, 1981–2007. Note: Years when more than zero but fewer than three boats or buyers participated are included in averages, but excluded from highs and lows.
Eureka Fishing Community Profile 26
19%–33% between 2002 and 2007. Groundfish trawl trips accounted for 19%–32% of all trips between 1981 and 2002, declining to 9%–15% in recent years. The proportion of Eureka area buyers participating in the fishery generally declined from 24%–33% during the period 1981–1985 to 7% in 2007. The proportion of Eureka area boats participating in the fishery increased from 6% in 1981 to 21% in 2000, then declined to 10% by 2007.
The Dungeness Crab Pot FisheryActivity in the Dungeness crab fishery has been highly variable, with landings and value substantially greater in most recent years than over the long term (Figure 9, Table 10).33 Landings ranged from about 355,000 pounds valued at $1 million (in 2001) to nearly 5.6 million pounds valued at $9.7 million (in 2003). Average annual landings in recent years (3.9 million pounds) are 79% higher compared to the long-term average of 2.2 million pounds, while landed value is 65% higher in recent
years ($7.1 million) compared to the long-term average of $4.3 million. By contrast, numbers of boats and trips are 33% and 22% lower, respectively, in recent years relative to the long term.
Aside from an upward trend in the early 1990s, the number of boats participating in the crab fishery has varied, but generally declined from 205 in 1981 to 94 in 2007. The average number of participating boats in recent years (89) is about a third less than the long-term average (133).
0
50
100
150
200
250
0
2
4
6
8
10
12
1981
1982
1983
1984
1985
1986
1987
1988
1989
1990
1991
1992
1993
1994
1995
1996
1997
1998
1999
2000
2001
2002
2003
2004
2005
2006
2007
Bo
ats
an
d b
uye
rs
Po
un
ds
an
d e
x-v
ess
el va
lue (
millio
ns,
20
07
$) Pounds
Ex-vessel value
Boats
Buyers
Crab pot
Moratorium on entry
Limited entry
Figure 9. Landings, ex-vessel value (2007$), and number of boats and buyers for the commercial Dungeness crab pot fishery in the Eureka area, 1981–2007.
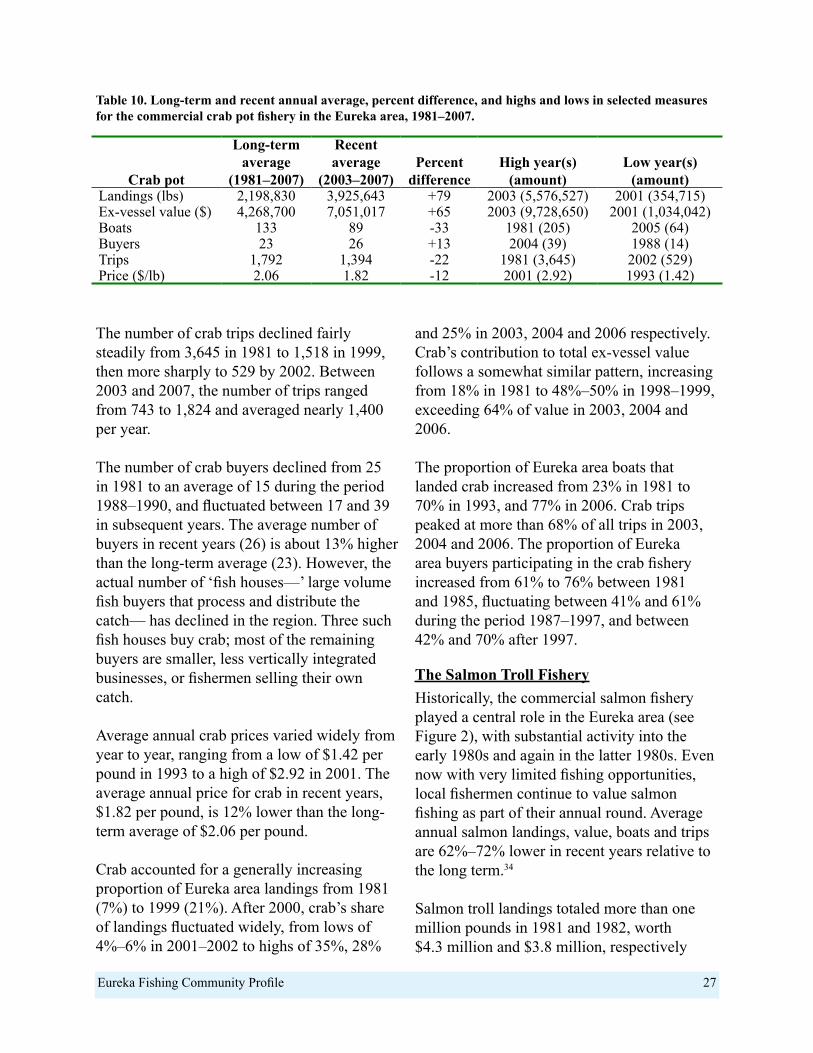
Eureka Fishing Community Profile 27
The number of crab trips declined fairly steadily from 3,645 in 1981 to 1,518 in 1999, then more sharply to 529 by 2002. Between 2003 and 2007, the number of trips ranged from 743 to 1,824 and averaged nearly 1,400 per year.
The number of crab buyers declined from 25 in 1981 to an average of 15 during the period 1988–1990, and fluctuated between 17 and 39 in subsequent years. The average number of buyers in recent years (26) is about 13% higher than the long-term average (23). However, the actual number of ‘fish houses—’ large volume fish buyers that process and distribute the catch— has declined in the region. Three such fish houses buy crab; most of the remaining buyers are smaller, less vertically integrated businesses, or fishermen selling their own catch.
Average annual crab prices varied widely from year to year, ranging from a low of $1.42 per pound in 1993 to a high of $2.92 in 2001. The average annual price for crab in recent years, $1.82 per pound, is 12% lower than the long-term average of $2.06 per pound.
Crab accounted for a generally increasing proportion of Eureka area landings from 1981 (7%) to 1999 (21%). After 2000, crab’s share of landings fluctuated widely, from lows of 4%–6% in 2001–2002 to highs of 35%, 28%
and 25% in 2003, 2004 and 2006 respectively. Crab’s contribution to total ex-vessel value follows a somewhat similar pattern, increasing from 18% in 1981 to 48%–50% in 1998–1999, exceeding 64% of value in 2003, 2004 and 2006.
The proportion of Eureka area boats that landed crab increased from 23% in 1981 to 70% in 1993, and 77% in 2006. Crab trips peaked at more than 68% of all trips in 2003, 2004 and 2006. The proportion of Eureka area buyers participating in the crab fishery increased from 61% to 76% between 1981 and 1985, fluctuating between 41% and 61% during the period 1987–1997, and between 42% and 70% after 1997.
The Salmon Troll FisheryHistorically, the commercial salmon fishery played a central role in the Eureka area (see Figure 2), with substantial activity into the early 1980s and again in the latter 1980s. Even now with very limited fishing opportunities, local fishermen continue to value salmon fishing as part of their annual round. Average annual salmon landings, value, boats and trips are 62%–72% lower in recent years relative to the long term.34
Salmon troll landings totaled more than one million pounds in 1981 and 1982, worth $4.3 million and $3.8 million, respectively
Crab pot
Long-term average
(1981–2007)
recent average
(2003–2007)Percent
differenceHigh year(s)
(amount)Low year(s)
(amount)Landings (lbs) 2,198,830 3,925,643 +79 2003 (5,576,527) 2001 (354,715)Ex-vessel value ($) 4,268,700 7,051,017 +65 2003 (9,728,650) 2001 (1,034,042)Boats 133 89 -33 1981 (205) 2005 (64)Buyers 23 26 +13 2004 (39) 1988 (14)Trips 1,792 1,394 -22 1981 (3,645) 2002 (529)Price ($/lb) 2.06 1.82 -12 2001 (2.92) 1993 (1.42)
Table 10. Long-term and recent annual average, percent difference, and highs and lows in selected measures for the commercial crab pot fishery in the Eureka area, 1981–2007.
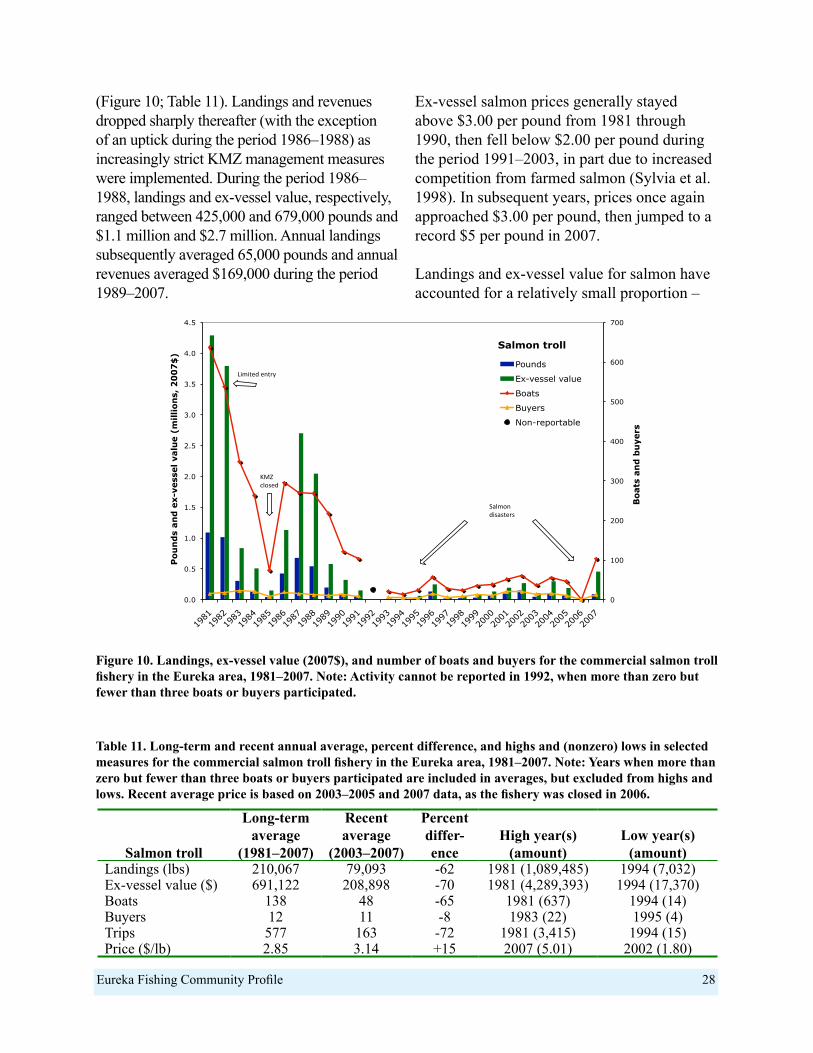
Eureka Fishing Community Profile 28
(Figure 10; Table 11). Landings and revenues dropped sharply thereafter (with the exception of an uptick during the period 1986–1988) as increasingly strict KMZ management measures were implemented. During the period 1986–1988, landings and ex-vessel value, respectively, ranged between 425,000 and 679,000 pounds and $1.1 million and $2.7 million. Annual landings subsequently averaged 65,000 pounds and annual revenues averaged $169,000 during the period 1989–2007.
Ex-vessel salmon prices generally stayed above $3.00 per pound from 1981 through 1990, then fell below $2.00 per pound during the period 1991–2003, in part due to increased competition from farmed salmon (Sylvia et al. 1998). In subsequent years, prices once again approached $3.00 per pound, then jumped to a record $5 per pound in 2007.
Landings and ex-vessel value for salmon have accounted for a relatively small proportion –
0
100
200
300
400
500
600
700
0.0
0.5
1.0
1.5
2.0
2.5
3.0
3.5
4.0
4.5
1981
1982
1983
1984
1985
1986
1987
1988
1989
1990
1991
1992
1993
1994
1995
1996
1997
1998
1999
2000
2001
2002
2003
2004
2005
2006
2007
Bo
ats
and
bu
yers
Po
un
ds
and
ex-
vess
el v
alu
e (m
illio
ns,
20
07
$)
Pounds
Ex-vessel value
Boats
Buyers
Non-reportable
Salmon troll
Limited entry
KMZ closed
Salmon disasters
Figure 10. Landings, ex-vessel value (2007$), and number of boats and buyers for the commercial salmon troll fishery in the Eureka area, 1981–2007. Note: Activity cannot be reported in 1992, when more than zero but fewer than three boats or buyers participated.
Salmon troll
Long-term average
(1981–2007)
recent average
(2003–2007)
Percent differ-ence
High year(s) (amount)
Low year(s) (amount)
Landings (lbs) 210,067 79,093 -62 1981 (1,089,485) 1994 (7,032)Ex-vessel value ($) 691,122 208,898 -70 1981 (4,289,393) 1994 (17,370)Boats 138 48 -65 1981 (637) 1994 (14)Buyers 12 11 -8 1983 (22) 1995 (4)Trips 577 163 -72 1981 (3,415) 1994 (15)Price ($/lb) 2.85 3.14 +15 2007 (5.01) 2002 (1.80)
Table 11. Long-term and recent annual average, percent difference, and highs and (nonzero) lows in selected measures for the commercial salmon troll fishery in the Eureka area, 1981–2007. Note: Years when more than zero but fewer than three boats or buyers participated are included in averages, but excluded from highs and lows. Recent average price is based on 2003–2005 and 2007 data, as the fishery was closed in 2006.
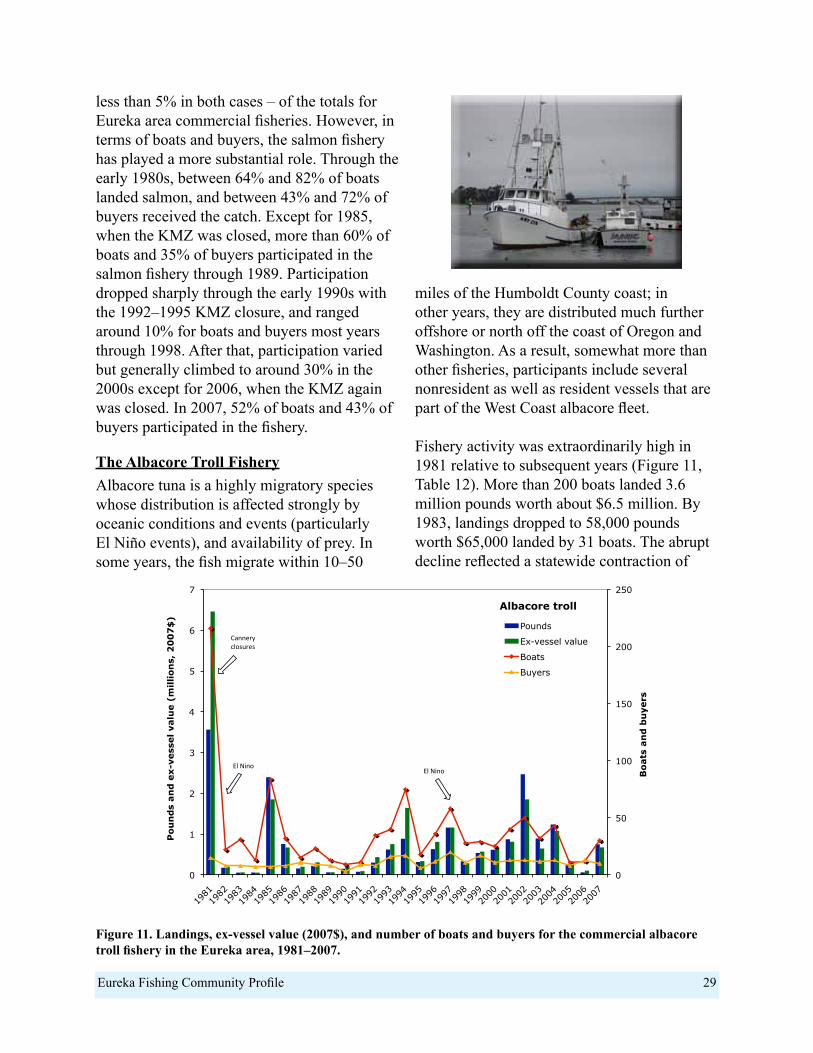
Eureka Fishing Community Profile 29
less than 5% in both cases – of the totals for Eureka area commercial fisheries. However, in terms of boats and buyers, the salmon fishery has played a more substantial role. Through the early 1980s, between 64% and 82% of boats landed salmon, and between 43% and 72% of buyers received the catch. Except for 1985, when the KMZ was closed, more than 60% of boats and 35% of buyers participated in the salmon fishery through 1989. Participation dropped sharply through the early 1990s with the 1992–1995 KMZ closure, and ranged around 10% for boats and buyers most years through 1998. After that, participation varied but generally climbed to around 30% in the 2000s except for 2006, when the KMZ again was closed. In 2007, 52% of boats and 43% of buyers participated in the fishery.
The Albacore Troll FisheryAlbacore tuna is a highly migratory species whose distribution is affected strongly by oceanic conditions and events (particularly El Niño events), and availability of prey. In some years, the fish migrate within 10–50
miles of the Humboldt County coast; in other years, they are distributed much further offshore or north off the coast of Oregon and Washington. As a result, somewhat more than other fisheries, participants include several nonresident as well as resident vessels that are part of the West Coast albacore fleet.
Fishery activity was extraordinarily high in 1981 relative to subsequent years (Figure 11, Table 12). More than 200 boats landed 3.6 million pounds worth about $6.5 million. By 1983, landings dropped to 58,000 pounds worth $65,000 landed by 31 boats. The abrupt decline reflected a statewide contraction of
0
50
100
150
200
250
0
1
2
3
4
5
6
7
1981
1982
1983
1984
1985
1986
1987
1988
1989
1990
1991
1992
1993
1994
1995
1996
1997
1998
1999
2000
2001
2002
2003
2004
2005
2006
2007
Bo
ats
an
d b
uye
rs
Po
un
ds
an
d e
x-v
ess
el va
lue (
millio
ns,
20
07
$)
Pounds
Ex-vessel value
Boats
Buyers
Albacore troll
El Nino
Cannery closures
El Nino
Figure 11. Landings, ex-vessel value (2007$), and number of boats and buyers for the commercial albacore troll fishery in the Eureka area, 1981–2007.
Eureka Fishing Community Profile 30
the tuna fishery following the relocation of most major Southern California tuna canneries offshore (e.g., to American Samoa). As a result, many fishery participants now market their catch through direct sales or deliver to one of the few remaining canneries in Oregon or Washington.35
After 1981, activity in the fishery continued to be highly variable, with lesser peaks in 1985, 1994, 1997 and 2002. Average annual ex-vessel value of landings and number of boats in the fishery are 32% lower in recent years compared to the long term. More modest declines in landings, trips and prices occurred as well.
The number of boats landing albacore at Eureka has varied, largely in parallel with landings and value. Following 1981 high of 216 boats in the fishery, participation varied between 9 and 84 boats (in 1990 and 1985, respectively). The number of buyers was less variable, averaging 11 for both periods, and ranging between three in 1990 and 20 in 1997. These numbers include several fishermen who market their own catch through off-the-boat sales and other means.
The average annual ex-vessel price in recent years, $1.08 per pound, is 5% lower than the long-term average of $1.14 per pound, although prices ranged widely, between $0.72 and $1.85 per pound.
During the period 1982–2007, albacore landings, ex-vessel value and trips accounted for an annual average of 2%–5% of activity at the port. Over the same period, an average 5% of boats (peaking at 29% in 1994) and 21% of buyers participated in the albacore fishery.
The Sablefish Hook-and-Line FisheryThe sablefish hook-and-line (longline) fishery has played a modest role at Eureka, accounting on average for less than 5% of landings and ex-vessel value, and less than 10% of trips at Eureka and Fields Landing combined. Historically, most sablefish was landed in the groundfish trawl fishery. When sablefish became more valuable in response to the growing Asian market, and as the trawl fishery became more heavily regulated, they were targeted more in the hook-and-line fishery, particularly in the Open Access sector. Vessel participation, ex-vessel revenues and prices in the fishery have increased in recent years relative to the long term (Figure 12, Table 13). Given the limited change in landings over these same time periods, recent revenue increases are largely due to price increases in the fishery overall.
Sablefish landings varied considerably between 1981 and 1989, with exceptionally high landings in 1982 and 1986 (848,000 and 592,000 pounds, respectively) and exceptionally low landings (29,000–121,000
Table 12. Long-term and recent annual average, percent difference, and highs and lows in selected measures for the commercial albacore troll fishery in the Eureka area, 1981–2007.
albacore troll
Long-term average
(1981–2007)
recent average
(2003–2007)Percent
differenceHigh year(s)
(amount)Low year(s)
(amount)Landings (lbs) 728,882 642,313 -12 1981 (3,563,725) 1983 (58,278)Ex-vessel value ($) 828,538 566,694 -32 1981 (6,461,020) 1984 (56,650)Boats 38 26 -32 1981 (216) 1990 (9)Buyers 11 11 0 1997 (20) 1990 (3)Trips 84 73 -13 1981 (278) 1984 (19)Price ($/lb) 1.14 1.08 -5 1994 (1.85) 2003 (0.72)
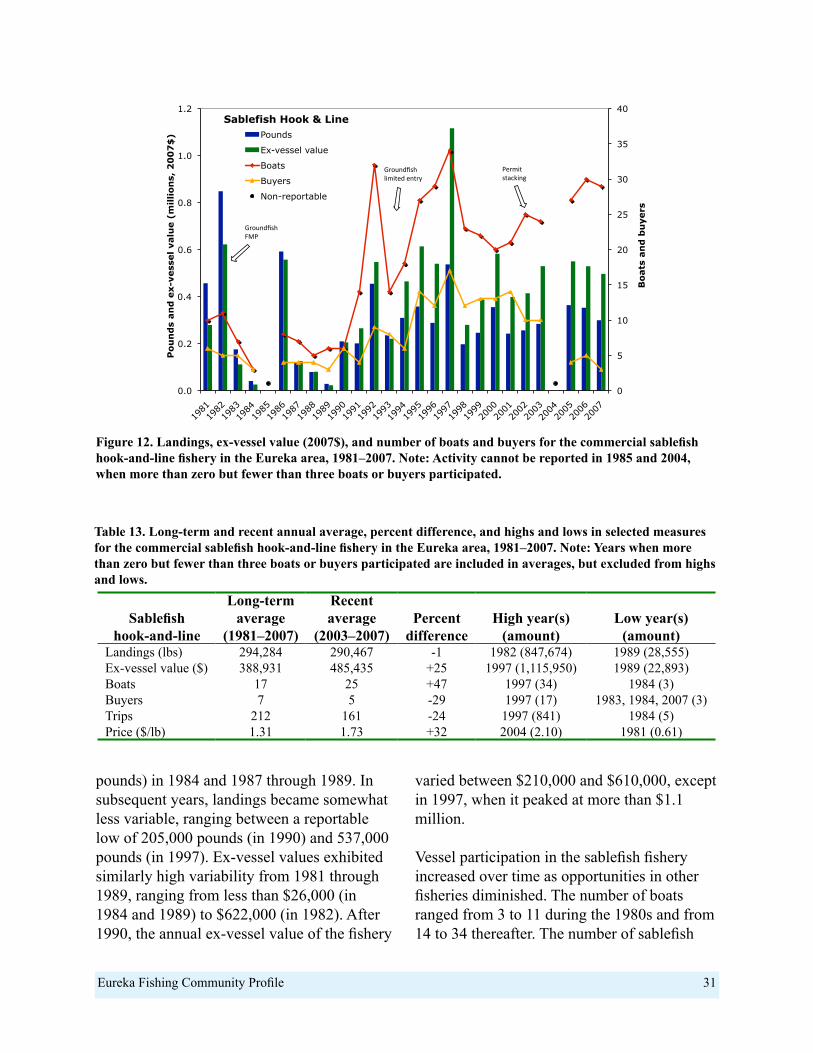
Eureka Fishing Community Profile 31
pounds) in 1984 and 1987 through 1989. In subsequent years, landings became somewhat less variable, ranging between a reportable low of 205,000 pounds (in 1990) and 537,000 pounds (in 1997). Ex-vessel values exhibited similarly high variability from 1981 through 1989, ranging from less than $26,000 (in 1984 and 1989) to $622,000 (in 1982). After 1990, the annual ex-vessel value of the fishery
varied between $210,000 and $610,000, except in 1997, when it peaked at more than $1.1 million.
Vessel participation in the sablefish fishery increased over time as opportunities in other fisheries diminished. The number of boats ranged from 3 to 11 during the 1980s and from 14 to 34 thereafter. The number of sablefish
0
5
10
15
20
25
30
35
40
0.0
0.2
0.4
0.6
0.8
1.0
1.2
1981
1982
1983
1984
1985
1986
1987
1988
1989
1990
1991
1992
1993
1994
1995
1996
1997
1998
1999
2000
2001
2002
2003
2004
2005
2006
2007
Bo
ats
an
d b
uye
rs
Po
un
ds
an
d e
x-v
ess
el va
lue (
millio
ns,
20
07
$) Pounds
Ex-vessel value
Boats
Buyers
Non-reportable
Sablefish Hook & Line
Groundfish FMP
Groundfish limited entry
Permit stacking
Figure 12. Landings, ex-vessel value (2007$), and number of boats and buyers for the commercial sablefish hook-and-line fishery in the Eureka area, 1981–2007. Note: Activity cannot be reported in 1985 and 2004, when more than zero but fewer than three boats or buyers participated.
Sablefishhook-and-line
Long-term average
(1981–2007)
recent average
(2003–2007)Percent
differenceHigh year(s)
(amount)Low year(s)
(amount)Landings (lbs) 294,284 290,467 -1 1982 (847,674) 1989 (28,555)Ex-vessel value ($) 388,931 485,435 +25 1997 (1,115,950) 1989 (22,893)Boats 17 25 +47 1997 (34) 1984 (3)Buyers 7 5 -29 1997 (17) 1983, 1984, 2007 (3)Trips 212 161 -24 1997 (841) 1984 (5)Price ($/lb) 1.31 1.73 +32 2004 (2.10) 1981 (0.61)
Table 13. Long-term and recent annual average, percent difference, and highs and lows in selected measures for the commercial sablefish hook-and-line fishery in the Eureka area, 1981–2007. Note: Years when more than zero but fewer than three boats or buyers participated are included in averages, but excluded from highs and lows.
Eureka Fishing Community Profile 32
trips ranged from 5 to 177 during the period 1981–1991, increased to a peak of 841 in 1997, and ranged from 56 to 333 in subsequent years.
Through 1991, fewer than seven buyers participated in the sablefish fishery each year. The number increased thereafter to a peak of 17 buyers in 1997, declining to fewer than six since 2004.
The average annual price per pound for line-caught sablefish has increased over time, from a low of between $0.61 and $0.73 per pound during the period 1981–1984 to at least $1.50 per pound in most years since 1994, peaking at more than $2.00 per pound in 1997 and 2004.
The sablefish fishery has consistently accounted for less than 3% of Eureka area landings and less than 8% of ex-vessel value. The contribution to boats, trips and buyers, however, has been more variable. Prior to 1992, sablefish boats comprised less than 4% of all Eureka area boats. That proportion subsequently increased to 23% by 2005–2006, then declined to 15% in 2007. Sablefish trips exhibited a somewhat similar pattern. The proportion of Eureka area buyers receiving sablefish ranged from 8% to 22% through 1995, peaked at 37% in 1995, declined to 4% in 2004, and ranged from 10% to 14% thereafter.
The Whiting (Hake) Trawl FisheryThe whiting trawl fishery is managed under the federal Groundfish FMP, but is distinct from the groundfish trawl fishery in its use of midwater rather than bottom trawl gear as well as the species targeted. The small number of participants precludes reporting of annual activity in the fishery in all but two years: 1987 and 2001. Thus only average estimates of fishing activity computed over multiple years are provided here.
Average landings, revenues and trips are, respectively, 144%, 71% and 53% higher in recent years relative to the long term (Table 14). Whereas the number of buyers is unchanged, both the number of boats and average price per pound are 40% lower in recent years relative to the long term.
During the period 1981–1999, whiting landings averaged 1.4 million pounds with an ex-vessel value of $177,000. Activity diminished considerably during the period 1992–1999 relative to the previous period, due in part to the expansion in whiting fishing and processing capacity in Oregon and Washington, where whiting stocks are more abundant (Freese et al. 1995, Leet et al. 2001). From 2000 on, however, activity in the Eureka area has increased substantially, averaging 5.2 million pounds and $333,000 in value, although the number of participants remained low.
Whiting trawl
Long-term average
(1981–2007)
recent average
(2003–2007)Percent
differenceHigh year(s)
(amount)Low year(s)
(amount)Landings (lbs) 2,532,663 6,180,985 +144 2006 (8,816,849) 1995 (209,789)Ex-vessel value ($) 223,265 382,689 +71 2004 (567,318) 1999 (12,874)Boats 5 3 -40 1983 (13) 2001 (3)Buyers 2 2 0 1987 (5) 2001 (3)Trips 38 58 +53 2004 (80) 2001 (14)Price ($/lb) 0.10 0.06 -40 1981 (0.16) 2001 (0.05)
Table 14. Long-term and recent annual average, percent difference, and highs and lows in selected measures for the commercial whiting trawl fishery in the Eureka area, 1981–2007. Note: Years when more than zero but fewer than three boats or buyers participated are included in averages, but excluded from highs and lows.
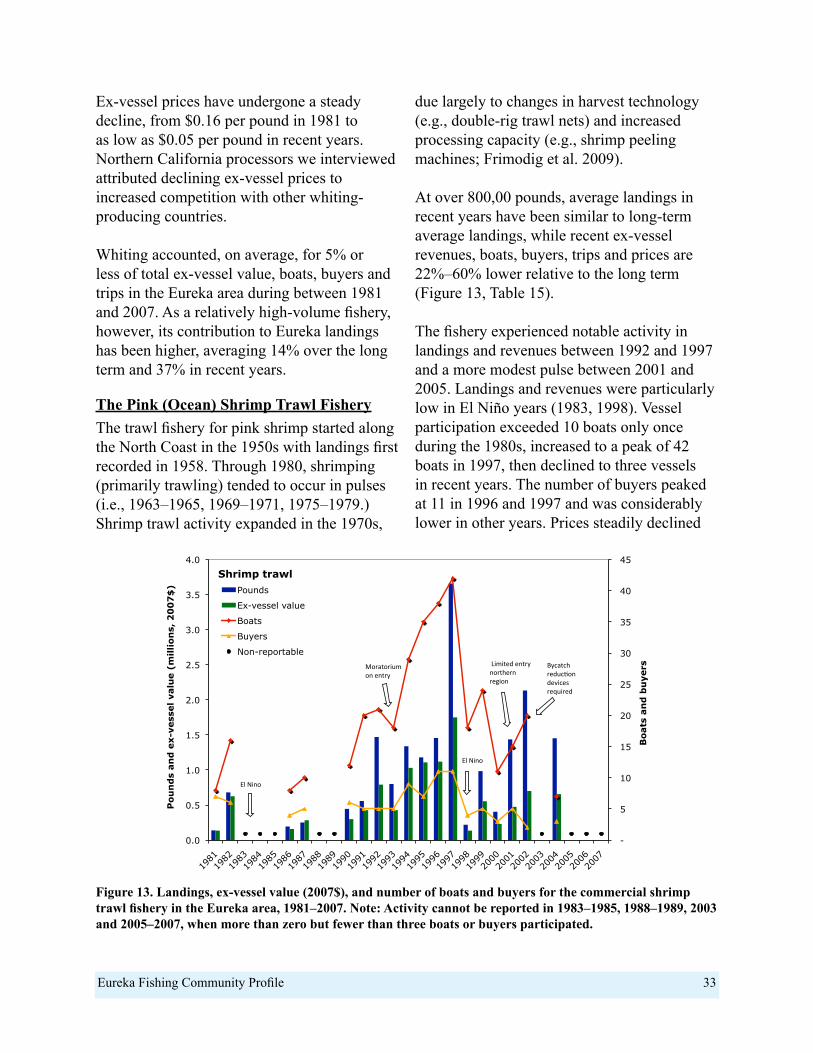
Eureka Fishing Community Profile 33
Ex-vessel prices have undergone a steady decline, from $0.16 per pound in 1981 to as low as $0.05 per pound in recent years. Northern California processors we interviewed attributed declining ex-vessel prices to increased competition with other whiting-producing countries.
Whiting accounted, on average, for 5% or less of total ex-vessel value, boats, buyers and trips in the Eureka area during between 1981 and 2007. As a relatively high-volume fishery, however, its contribution to Eureka landings has been higher, averaging 14% over the long term and 37% in recent years.
The Pink (Ocean) Shrimp Trawl FisheryThe trawl fishery for pink shrimp started along the North Coast in the 1950s with landings first recorded in 1958. Through 1980, shrimping (primarily trawling) tended to occur in pulses (i.e., 1963–1965, 1969–1971, 1975–1979.) Shrimp trawl activity expanded in the 1970s,
due largely to changes in harvest technology (e.g., double-rig trawl nets) and increased processing capacity (e.g., shrimp peeling machines; Frimodig et al. 2009).
At over 800,00 pounds, average landings in recent years have been similar to long-term average landings, while recent ex-vessel revenues, boats, buyers, trips and prices are 22%–60% lower relative to the long term (Figure 13, Table 15).
The fishery experienced notable activity in landings and revenues between 1992 and 1997 and a more modest pulse between 2001 and 2005. Landings and revenues were particularly low in El Niño years (1983, 1998). Vessel participation exceeded 10 boats only once during the 1980s, increased to a peak of 42 boats in 1997, then declined to three vessels in recent years. The number of buyers peaked at 11 in 1996 and 1997 and was considerably lower in other years. Prices steadily declined
-
5
10
15
20
25
30
35
40
45
0.0
0.5
1.0
1.5
2.0
2.5
3.0
3.5
4.0
1981
1982
1983
1984
1985
1986
1987
1988
1989
1990
1991
1992
1993
1994
1995
1996
1997
1998
1999
2000
2001
2002
2003
2004
2005
2006
2007
Bo
ats
an
d b
uye
rs
Po
un
ds
an
d e
x-v
ess
el va
lue (
millio
ns,
20
07
$) Pounds
Ex-vessel value
Boats
Buyers
Non-reportable
Shrimp trawl
El Nino
Moratorium on entry
El Nino
Limited entry northern region
Bycatch reduc6on devices required
Figure 13. Landings, ex-vessel value (2007$), and number of boats and buyers for the commercial shrimp trawl fishery in the Eureka area, 1981–2007. Note: Activity cannot be reported in 1983–1985, 1988–1989, 2003 and 2005–2007, when more than zero but fewer than three boats or buyers participated.
Eureka Fishing Community Profile 34
from $0.92–$1.38 per pound during the period 1981–1983 to $0.33–$0.49 per pound since 2001.
The shrimp trawl fishery accounted, on average, for less than 6% of landings, revenues and trips, with less than 6% of boat participating between 1981 and 2007. Approximately 11% of Eureka area buyers received shrimp over the same period. However, during the surge that occurred in the mid-1990s, the shrimp trawl fishery accounted for as much as 20% of landings and 11% of value, and involved up to 18% of boats and 25% of buyers.
The Rockfish/Lingcod Hook-and-Line FisheryThe Eureka area commercial hook-and-line fishery for rockfish and lingcod is relatively small in terms of landings and ex-vessel value (less than 2% of activity overall), but participation has been more substantial, averaging 15% of boats and 30% of buyers over the long term. The fishery grew rapidly in the 1980s with general growth of the Asian market for fresh fish and the expansion of the live fish market in the San Francisco Bay area in the 1990s (McKee-Lewis 1996). During the peak of the fishery (1987–1992), annual landings ranged between 296,000 and 832,000 pounds and ex-vessel value ranged between
$383,000 and $913,000 (Figure 14, Table 16). Fishing activity, on all measures, has declined significantly in recent years relative to the long term. Landings and value declined through the 1990s, and then dropped sharply with the implementation of a moratorium on entry in 1999 and restricted access in 2003, along with significant reductions in quotas for key species through the federal groundfish management process. From 2004 on, annual participation did not exceed five boats and 13 trips, and annual landings and revenues remained below 15,400 pounds and $27,300 respectively.Between 1981 and 2007, 9–20 buyers participated annually in the fishery, with the notable exception of 1984, when fewer than three buyers participated. Since 2003, however, 3–7 buyers have participated, reflecting declines in both the number of fishermen selling their catch directly to local groceries and restaurants and the number of dedicated fish buyers. Study participants attributed this change to the sharp reduction in fishing opportunities and activity in recent years, which made it untenable for small buyers from the San Francisco Bay area to travel to Eureka to buy the catch.
Average annual price per pound varied between $0.89 and $2.14 through 1987, fell to $0.59–$0.97 per pound during the period 1989–1998, and increased to a high of $3.02 per pound by
Shrimp trawl
Long-term average
(1981–2007)
recent average
(2003–2007)Percent
differenceHigh year(s)
(amount)Low year(s)
(amount)Landings (lbs) 819,800 840,430 +3 1997 (3,657,626) 1983 (160)Ex-vessel value ($) 459,305 359,178 -22 1997 (1,749,391) 1983 (221)Boats 15 6 -60 1997 (42) 2006, 2007 (3)Buyers 4 2 -50 1996 (11) 2000, 2004 (3)Trips 65 28 -57 1997 (202) 2000 (24)Price ($/lb) 0.66 0.42 -36 1983 (1.38) 2001 (0.33)
Table 15. Long-term and recent annual average, percent difference, and highs and lows in selected measures for the commercial shrimp trawl fishery in the Eureka area, 1981–2007. Note: Years when greater than zero but fewer than three boats or buyers participated are included in averages, but excluded from highs and lows.
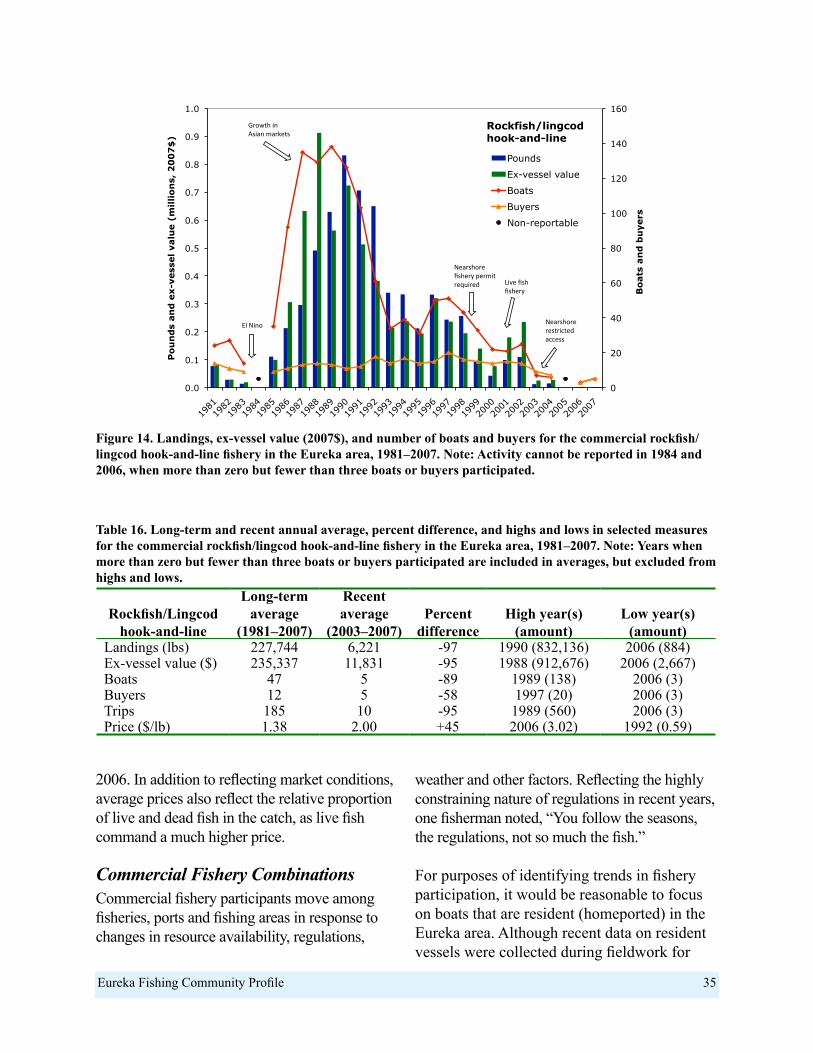
Eureka Fishing Community Profile 35
2006. In addition to reflecting market conditions, average prices also reflect the relative proportion of live and dead fish in the catch, as live fish command a much higher price.
Commercial Fishery CombinationsCommercial fishery participants move among fisheries, ports and fishing areas in response to changes in resource availability, regulations,
weather and other factors. Reflecting the highly constraining nature of regulations in recent years, one fisherman noted, “You follow the seasons, the regulations, not so much the fish.”
For purposes of identifying trends in fishery participation, it would be reasonable to focus on boats that are resident (homeported) in the Eureka area. Although recent data on resident vessels were collected during fieldwork for
Figure 14. Landings, ex-vessel value (2007$), and number of boats and buyers for the commercial rockfish/lingcod hook-and-line fishery in the Eureka area, 1981–2007. Note: Activity cannot be reported in 1984 and 2006, when more than zero but fewer than three boats or buyers participated.
0
20
40
60
80
100
120
140
160
0.0
0.1
0.2
0.3
0.4
0.5
0.6
0.7
0.8
0.9
1.0
1981
1982
1983
1984
1985
1986
1987
1988
1989
1990
1991
1992
1993
1994
1995
1996
1997
1998
1999
2000
2001
2002
2003
2004
2005
2006
2007
Bo
ats
an
d b
uye
rs
Po
un
ds
an
d e
x-v
ess
el va
lue (
millio
ns,
20
07
$)
Pounds
Ex-vessel value
Boats
Buyers
Non-reportable
Rockfish/lingcod hook-and-line
El Nino
Growth in Asian markets
Nearshore fishery permit required Live fish
fishery
Nearshore restricted access
Table 16. Long-term and recent annual average, percent difference, and highs and lows in selected measures for the commercial rockfish/lingcod hook-and-line fishery in the Eureka area, 1981–2007. Note: Years when more than zero but fewer than three boats or buyers participated are included in averages, but excluded from highs and lows.
Rockfish/Lingcodhook-and-line
Long-term average
(1981–2007)
recent average
(2003–2007)Percent
differenceHigh year(s)
(amount)Low year(s)
(amount)Landings (lbs) 227,744 6,221 -97 1990 (832,136) 2006 (884)Ex-vessel value ($) 235,337 11,831 -95 1988 (912,676) 2006 (2,667)Boats 47 5 -89 1989 (138) 2006 (3)Buyers 12 5 -58 1997 (20) 2006 (3)Trips 185 10 -95 1989 (560) 2006 (3)Price ($/lb) 1.38 2.00 +45 2006 (3.02) 1992 (0.59)
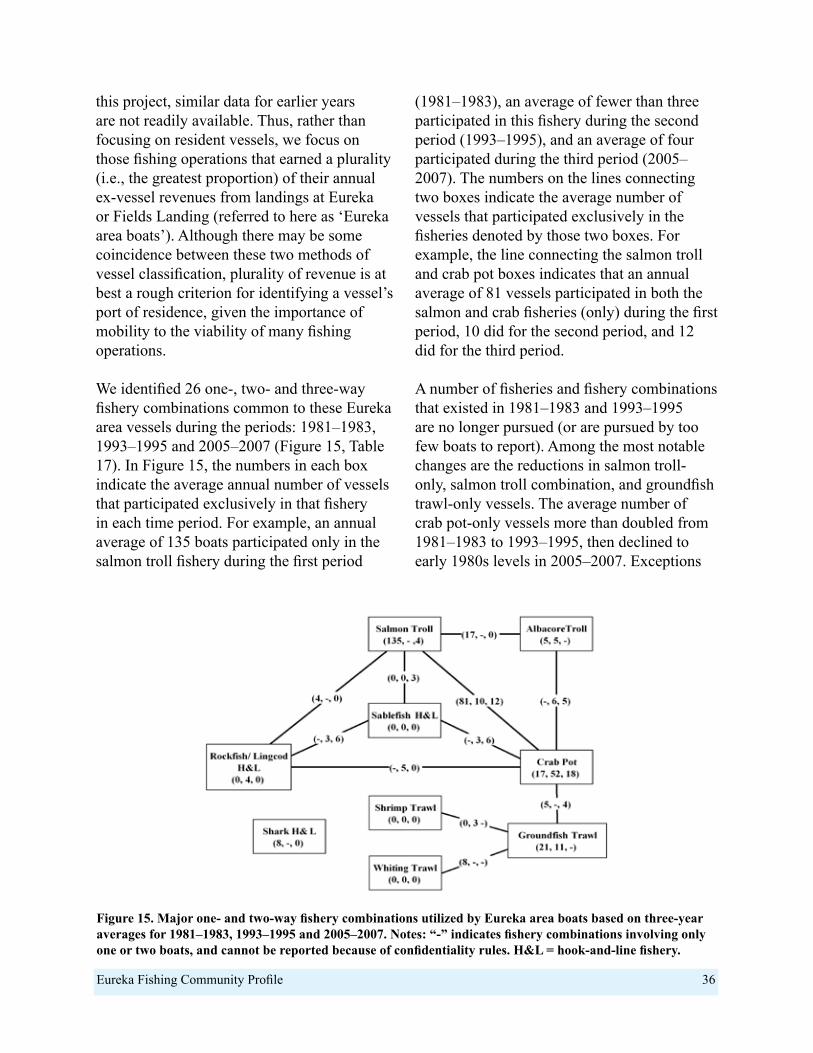
Eureka Fishing Community Profile 36
this project, similar data for earlier years are not readily available. Thus, rather than focusing on resident vessels, we focus on those fishing operations that earned a plurality (i.e., the greatest proportion) of their annual ex-vessel revenues from landings at Eureka or Fields Landing (referred to here as ‘Eureka area boats’). Although there may be some coincidence between these two methods of vessel classification, plurality of revenue is at best a rough criterion for identifying a vessel’s port of residence, given the importance of mobility to the viability of many fishing operations.
We identified 26 one-, two- and three-way fishery combinations common to these Eureka area vessels during the periods: 1981–1983, 1993–1995 and 2005–2007 (Figure 15, Table 17). In Figure 15, the numbers in each box indicate the average annual number of vessels that participated exclusively in that fishery in each time period. For example, an annual average of 135 boats participated only in the salmon troll fishery during the first period
(1981–1983), an average of fewer than three participated in this fishery during the second period (1993–1995), and an average of four participated during the third period (2005–2007). The numbers on the lines connecting two boxes indicate the average number of vessels that participated exclusively in the fisheries denoted by those two boxes. For example, the line connecting the salmon troll and crab pot boxes indicates that an annual average of 81 vessels participated in both the salmon and crab fisheries (only) during the first period, 10 did for the second period, and 12 did for the third period.
A number of fisheries and fishery combinations that existed in 1981–1983 and 1993–1995 are no longer pursued (or are pursued by too few boats to report). Among the most notable changes are the reductions in salmon troll-only, salmon troll combination, and groundfish trawl-only vessels. The average number of crab pot-only vessels more than doubled from 1981–1983 to 1993–1995, then declined to early 1980s levels in 2005–2007. Exceptions
Figure 15. Major one- and two-way fishery combinations utilized by Eureka area boats based on three-year averages for 1981–1983, 1993–1995 and 2005–2007. Notes: “-” indicates fishery combinations involving only one or two boats, and cannot be reported because of confidentiality rules. H&L = hook-and-line fishery.
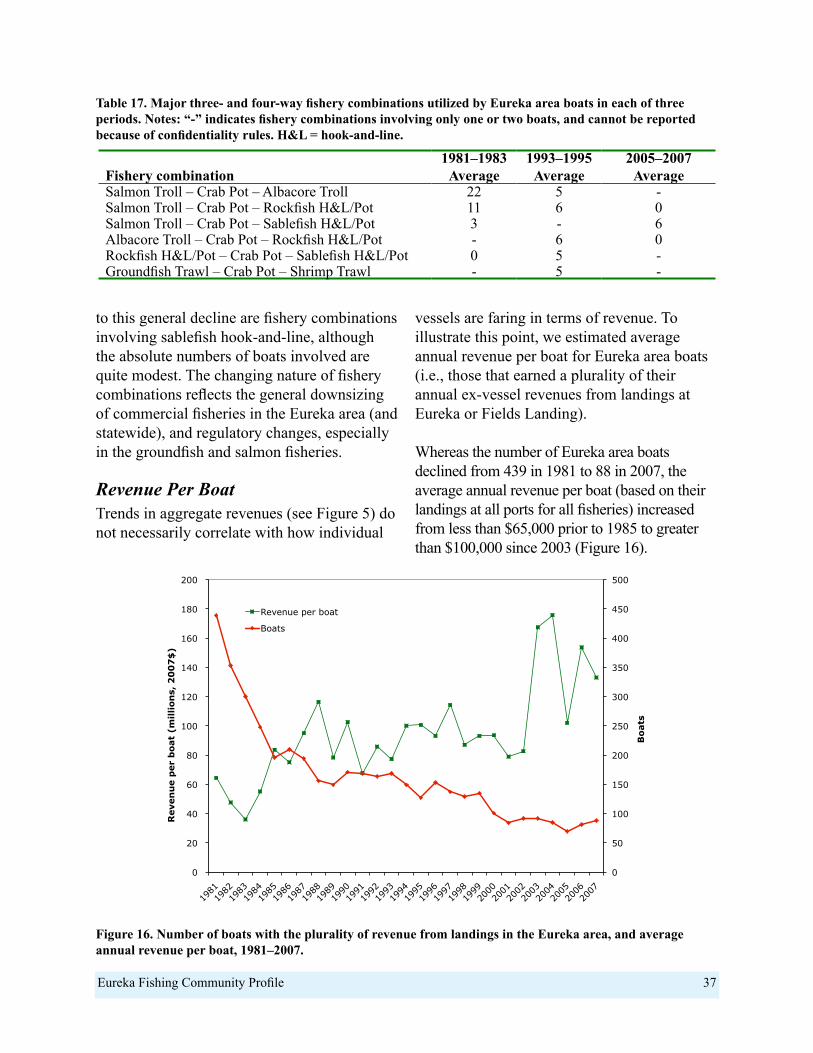
Eureka Fishing Community Profile 37
to this general decline are fishery combinations involving sablefish hook-and-line, although the absolute numbers of boats involved are quite modest. The changing nature of fishery combinations reflects the general downsizing of commercial fisheries in the Eureka area (and statewide), and regulatory changes, especially in the groundfish and salmon fisheries.
Revenue Per BoatTrends in aggregate revenues (see Figure 5) do not necessarily correlate with how individual
vessels are faring in terms of revenue. To illustrate this point, we estimated average annual revenue per boat for Eureka area boats (i.e., those that earned a plurality of their annual ex-vessel revenues from landings at Eureka or Fields Landing).
Whereas the number of Eureka area boats declined from 439 in 1981 to 88 in 2007, the average annual revenue per boat (based on their landings at all ports for all fisheries) increased from less than $65,000 prior to 1985 to greater than $100,000 since 2003 (Figure 16).
Fishery combination1981–1983
Average1993–1995
Average2005–2007
AverageSalmon Troll – Crab Pot – Albacore Troll 22 5 -Salmon Troll – Crab Pot – Rockfish H&L/Pot 11 6 0Salmon Troll – Crab Pot – Sablefish H&L/Pot 3 - 6Albacore Troll – Crab Pot – Rockfish H&L/Pot - 6 0Rockfish H&L/Pot – Crab Pot – Sablefish H&L/Pot 0 5 -Groundfish Trawl – Crab Pot – Shrimp Trawl - 5 -
Table 17. Major three- and four-way fishery combinations utilized by Eureka area boats in each of three periods. Notes: “-” indicates fishery combinations involving only one or two boats, and cannot be reported because of confidentiality rules. H&L = hook-and-line.
0
50
100
150
200
250
300
350
400
450
500
0
20
40
60
80
100
120
140
160
180
200
1981
1982
1983
1984
1985
1986
1987
1988
1989
1990
1991
1992
1993
1994
1995
1996
1997
1998
1999
2000
2001
2002
2003
2004
2005
2006
2007
Bo
ats
Reve
nu
e p
er
bo
at
(millio
ns,
20
07
$)
Revenue per boat
Boats
Figure 16. Number of boats with the plurality of revenue from landings in the Eureka area, and average annual revenue per boat, 1981–2007.
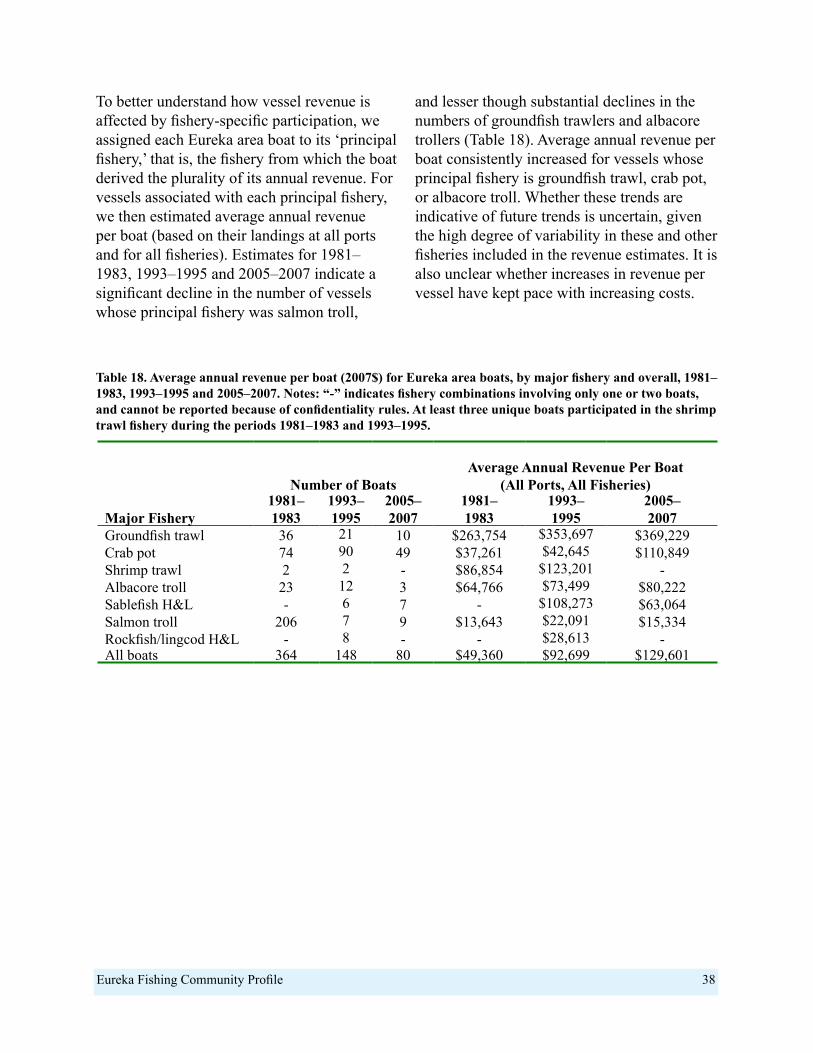
Eureka Fishing Community Profile 38
To better understand how vessel revenue is affected by fishery-specific participation, we assigned each Eureka area boat to its ‘principal fishery,’ that is, the fishery from which the boat derived the plurality of its annual revenue. For vessels associated with each principal fishery, we then estimated average annual revenue per boat (based on their landings at all ports and for all fisheries). Estimates for 1981–1983, 1993–1995 and 2005–2007 indicate a significant decline in the number of vessels whose principal fishery was salmon troll,
and lesser though substantial declines in the numbers of groundfish trawlers and albacore trollers (Table 18). Average annual revenue per boat consistently increased for vessels whose principal fishery is groundfish trawl, crab pot, or albacore troll. Whether these trends are indicative of future trends is uncertain, given the high degree of variability in these and other fisheries included in the revenue estimates. It is also unclear whether increases in revenue per vessel have kept pace with increasing costs.
Table 18. Average annual revenue per boat (2007$) for Eureka area boats, by major fishery and overall, 1981–1983, 1993–1995 and 2005–2007. Notes: “-” indicates fishery combinations involving only one or two boats, and cannot be reported because of confidentiality rules. At least three unique boats participated in the shrimp trawl fishery during the periods 1981–1983 and 1993–1995.
number of BoatsAverage Annual Revenue Per Boat
(All Ports, All Fisheries)
Major Fishery1981–1983
1993–1995
2005–2007
1981–1983
1993–1995
2005–2007
Groundfish trawl 36 21 10 $263,754 $353,697 $369,229Crab pot 74 90 49 $37,261 $42,645 $110,849Shrimp trawl 2 2 - $86,854 $123,201 -Albacore troll 23 12 3 $64,766 $73,499 $80,222Sablefish H&L - 6 7 - $108,273 $63,064Salmon troll 206 7 9 $13,643 $22,091 $15,334Rockfish/lingcod H&L - 8 - - $28,613 -All boats 364 148 80 $49,360 $92,699 $129,601
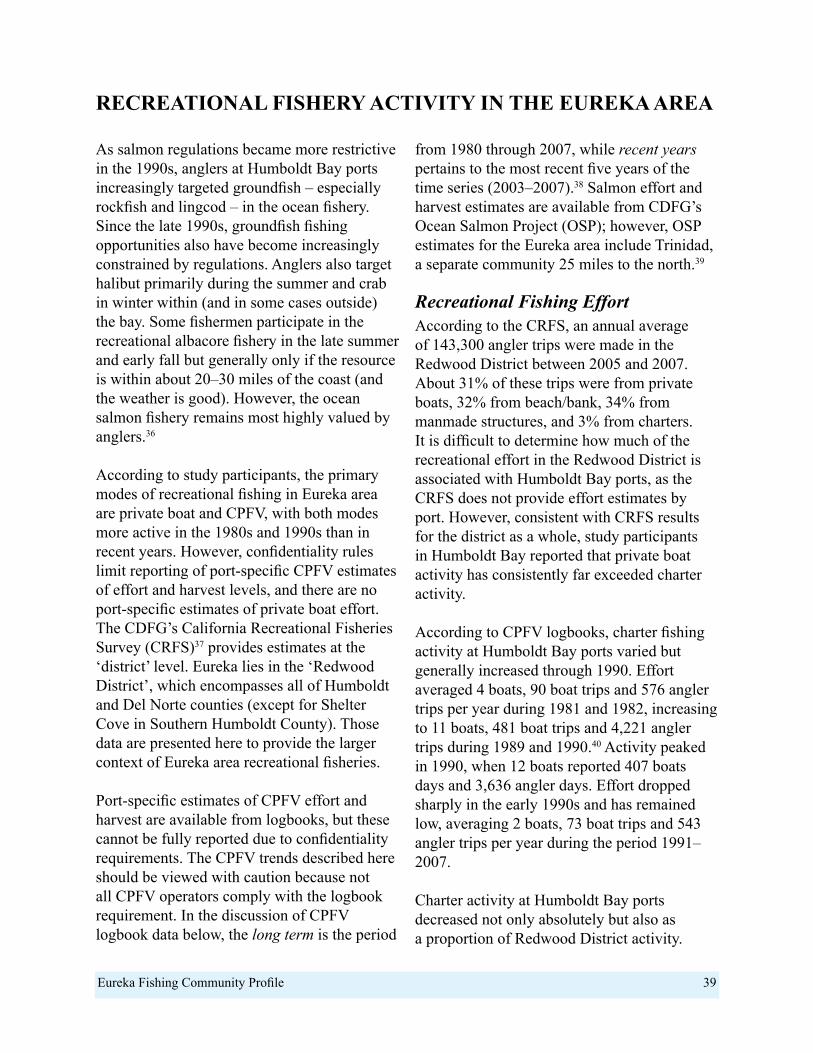
Eureka Fishing Community Profile 39
As salmon regulations became more restrictive in the 1990s, anglers at Humboldt Bay ports increasingly targeted groundfish – especially rockfish and lingcod – in the ocean fishery. Since the late 1990s, groundfish fishing opportunities also have become increasingly constrained by regulations. Anglers also target halibut primarily during the summer and crab in winter within (and in some cases outside) the bay. Some fishermen participate in the recreational albacore fishery in the late summer and early fall but generally only if the resource is within about 20–30 miles of the coast (and the weather is good). However, the ocean salmon fishery remains most highly valued by anglers.36
According to study participants, the primary modes of recreational fishing in Eureka area are private boat and CPFV, with both modes more active in the 1980s and 1990s than in recent years. However, confidentiality rules limit reporting of port-specific CPFV estimates of effort and harvest levels, and there are no port-specific estimates of private boat effort. The CDFG’s California Recreational Fisheries Survey (CRFS)37 provides estimates at the ‘district’ level. Eureka lies in the ‘Redwood District’, which encompasses all of Humboldt and Del Norte counties (except for Shelter Cove in Southern Humboldt County). Those data are presented here to provide the larger context of Eureka area recreational fisheries.
Port-specific estimates of CPFV effort and harvest are available from logbooks, but these cannot be fully reported due to confidentiality requirements. The CPFV trends described here should be viewed with caution because not all CPFV operators comply with the logbook requirement. In the discussion of CPFV logbook data below, the long term is the period
from 1980 through 2007, while recent years pertains to the most recent five years of the time series (2003–2007).38 Salmon effort and harvest estimates are available from CDFG’s Ocean Salmon Project (OSP); however, OSP estimates for the Eureka area include Trinidad, a separate community 25 miles to the north.39
Recreational Fishing EffortAccording to the CRFS, an annual average of 143,300 angler trips were made in the Redwood District between 2005 and 2007. About 31% of these trips were from private boats, 32% from beach/bank, 34% from manmade structures, and 3% from charters. It is difficult to determine how much of the recreational effort in the Redwood District is associated with Humboldt Bay ports, as the CRFS does not provide effort estimates by port. However, consistent with CRFS results for the district as a whole, study participants in Humboldt Bay reported that private boat activity has consistently far exceeded charter activity.
According to CPFV logbooks, charter fishing activity at Humboldt Bay ports varied but generally increased through 1990. Effort averaged 4 boats, 90 boat trips and 576 angler trips per year during 1981 and 1982, increasing to 11 boats, 481 boat trips and 4,221 angler trips during 1989 and 1990.40 Activity peaked in 1990, when 12 boats reported 407 boats days and 3,636 angler days. Effort dropped sharply in the early 1990s and has remained low, averaging 2 boats, 73 boat trips and 543 angler trips per year during the period 1991–2007.
Charter activity at Humboldt Bay ports decreased not only absolutely but also as a proportion of Redwood District activity.
rECrEaTional FiShEry aCTiviTy in ThE EurEka arEa
Eureka Fishing Community Profile 40
Humboldt Bay accounted for an average of 48%, 40% and 17% of all party/charter boats operating in the Redwood District during the periods 1980–1990, 1991–2000 and 2001–2007, respectively.
According to the OSP, recreational salmon effort in the Eureka area averaged 27,800 angler trips between 1981 and 1991 and 13,000 trips between 1992 and 2002. These estimates provide a somewhat inflated representation of Eureka’s salmon fishery, as they include data from Trinidad as well. The dominance of private boat relative to CPFV activity is also apparent from OSP, in that CPFV activity accounted for no more than 15% of total activity during the years 1981–2007.
Eureka Fishing Community Profile 41
kEy FaCTorS aFFECTing EurEka arEa FiShEriES
Eureka’s fisheries and fishing community have experienced considerable social and economic change over the past 30 years. Regulatory, market and environmental factors have influenced individuals and communities, sometimes gradually and at other times more abruptly. Some of these factors originated locally, while others are regional, national or even international in nature. Moreover, they do not operate in isolation. Rather, they interact in complex and cumulative ways, posing both challenges and opportunities to the viability and resilience of the Eureka fishing community. The following discussion focuses on factors highlighted by study participants as having most influenced local fisheries, infrastructure and the community as a whole.
Regulatory Factors
Commercial FisheriesThe first commercial fishery to be heavily restricted along the North Coast of California was the ocean salmon troll fishery. Participants discussed the establishment of the KMZ in 1979 (and subsequent restrictions on seasons and catch), the implementation of limited entry in 1982, and the 1993 changes to the tribal allocation as key factors influencing the fishing community.
The effect of these regulations was a decrease in fishery participants and activity over time, and an overall shift of the salmon fishery away from Eureka. Some fishermen shifted their effort into other local fisheries, including groundfish and crab. Those who chose to remain in the fishery traveled as far south as Monterey Bay, or north to Oregon and even southeast Alaska. One study participant explained:
Starting in 1993, the tribes got 50%, and we began fishing farther from the Klamath River. One of the social consequences of mobility was that we [now] have good friends who live in other ports. But there was also estrangement from the local community. Mobility was attractive. Marriages [were affected]…you became a gypsy.
Of the estimated 45 commercial trollers based at Eureka in recent years, about two dozen travel north and south for salmon (except during the 2008 and 2009 statewide salmon fishery closures), landing their catch at other ports within and outside the state. In addition to catch being sold elsewhere, while in port fishermen also purchase provisions, goods and services. As a result, the direct economic benefits of their salmon fishing activity are realized at those other ports rather than at Eureka.
Regulatory changes in the groundfish fishery beginning in the 1990s, including increasingly restrictive harvest measures, an industry-funded groundfish trawl buyback (in which 14 of 27 Eureka-based trawlers participated), additional vessel monitoring requirements, and the establishment of RCAs, affected the community through an overall decrease in activity. Shoreside, the reductions in the amount of fish landed in the salmon and groundfish fisheries made it difficult for some processors to maintain sufficient production to keep employees busy year-round, and ultimately to stay in business. According to one participant, “they used to say, you pay the bills with groundfish and you make money with salmon.” With recent production less than half of long-term levels, local receiving capacity has become more consolidated (i.e., a smaller proportion of buyers now accounts
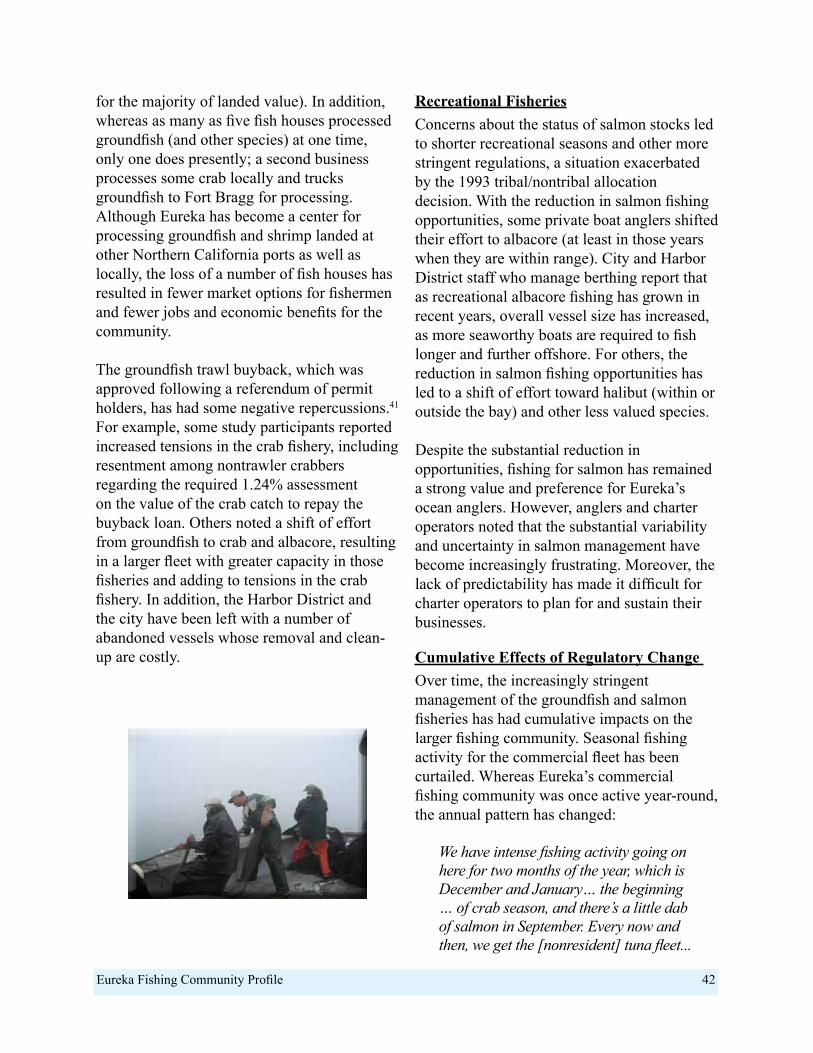
Eureka Fishing Community Profile 42
for the majority of landed value). In addition, whereas as many as five fish houses processed groundfish (and other species) at one time, only one does presently; a second business processes some crab locally and trucks groundfish to Fort Bragg for processing. Although Eureka has become a center for processing groundfish and shrimp landed at other Northern California ports as well as locally, the loss of a number of fish houses has resulted in fewer market options for fishermen and fewer jobs and economic benefits for the community.
The groundfish trawl buyback, which was approved following a referendum of permit holders, has had some negative repercussions.41 For example, some study participants reported increased tensions in the crab fishery, including resentment among nontrawler crabbers regarding the required 1.24% assessment on the value of the crab catch to repay the buyback loan. Others noted a shift of effort from groundfish to crab and albacore, resulting in a larger fleet with greater capacity in those fisheries and adding to tensions in the crab fishery. In addition, the Harbor District and the city have been left with a number of abandoned vessels whose removal and clean-up are costly.
Recreational FisheriesConcerns about the status of salmon stocks led to shorter recreational seasons and other more stringent regulations, a situation exacerbated by the 1993 tribal/nontribal allocation decision. With the reduction in salmon fishing opportunities, some private boat anglers shifted their effort to albacore (at least in those years when they are within range). City and Harbor District staff who manage berthing report that as recreational albacore fishing has grown in recent years, overall vessel size has increased, as more seaworthy boats are required to fish longer and further offshore. For others, the reduction in salmon fishing opportunities has led to a shift of effort toward halibut (within or outside the bay) and other less valued species.
Despite the substantial reduction in opportunities, fishing for salmon has remained a strong value and preference for Eureka’s ocean anglers. However, anglers and charter operators noted that the substantial variability and uncertainty in salmon management have become increasingly frustrating. Moreover, the lack of predictability has made it difficult for charter operators to plan for and sustain their businesses.
Cumulative Effects of Regulatory Change Over time, the increasingly stringent management of the groundfish and salmon fisheries has had cumulative impacts on the larger fishing community. Seasonal fishing activity for the commercial fleet has been curtailed. Whereas Eureka’s commercial fishing community was once active year-round, the annual pattern has changed:
We have intense fishing activity going on here for two months of the year, which is December and January… the beginning … of crab season, and there’s a little dab of salmon in September. Every now and then, we get the [nonresident] tuna fleet...
Eureka Fishing Community Profile 43
Recreational fishermen also are less active through the year as their salmon and rockfish seasons have been truncated as well, and other fisheries (e.g., albacore, halibut) are dependent upon weather and species availability from year to year. For example, the small community of King Salmon had been a focal point of recreational – and some commercial – salmon fishing through the 1980s. Following salmon management restrictions of the mid- 1980s and early-1990s, however, activity declined significantly. According to one long-time charter operator:
King Salmon was the sport fishing center up here; there were three trailer parks, people fished in the [Elk] river, with their fish caught and canned [by local businesses]. … Between 1986 and 1989, there were three 50-foot charter boats, each capable of carrying 40 passengers, a 36-foot boat licensed to carry 12, and no 6-packs. 1996 was my last season with [a] big boat. …Between 1997 and 2003, there were no charters at Eureka and only one operating out of King Salmon.
Today, two RV parks and a restaurant remain, and a handful of boats tie up along Fishermen’s Channel, but charter boats are no longer based at King Salmon and there is little other fishery-related activity there. One RV Park operator described the change in clientele from “fishing folks” to “residents looking for affordable housing.”
The number of fishery-support businesses that serve the commercial fleet has diminished over the last 30 years. According to study participants, in the late 1970s there were at least four marine supply stores, three fuel docks, and two electronics shops. As the salmon fishery contracted in the early 1980s, the Fishermen’s Marketing Association (FMA)
closed the marine supply and fuel business it had owned since the 1970s:
The FMA owned a gear store and fuel dock, Eureka Marine, started in the 1970s. … The gear store had 500,000 gallons of diesel in fuel sales per year. Salmon closures meant that fuel sales dropped. Hardware sales weren’t enough to keep things going as they had been.
Soon afterward, Davenport Marine leased the space from the city, where it operated a gear store (which had been located in another space nearby) and the fuel dock. When Davenport Marine closed in 1995, Englund Marine bought the business and leased the site from the city. Since then, Englund Marine has run Eureka’s only waterfront commercial marine supply and fuel dock. (A second fuel dock located at EZ Landing in King Salmon is available to smaller boats.)
The recent salmon season closures have affected use patterns at Woodley Island Marina. Historically, as commercial fishermen left for summer salmon and albacore fishing, recreational fishing boats would fill their slips, benefiting the harbor, support businesses and the larger community. With the 2008 statewide closure, commercial salmon boats did not head out for the season, leaving less room for recreational boats that usually occupy those slips during the summer. At the same time, with the high cost of fuel and the larger economic downturn, as well as the constraints on recreational fishing, fewer recreational boats booked space at the marina. As a result, the marina faced an overall reduction in activity and revenues, with similar effects on local support businesses. Meanwhile, according to Harbor District staff, the harbor has become somewhat of a “storage yard for Southern California boats” during the summer because
Eureka Fishing Community Profile 44
slip fees are relatively inexpensive. Although the revenue from this use is beneficial to the Harbor District, it is of limited benefit to other businesses in the community.
Other businesses have diversified or shifted emphasis. For example, Englund Marine experienced a shift toward more recreational (salt and freshwater) business: “Ten years ago, [business] was 90% commercial [fishing]; now it’s 60% sport and 40% commercial.” With the closure of the commercial salmon fishery in 2007, several commercial (as well as recreational) fishermen participated in the recreational fishery, increasing the demand for sport fishing gear. With the renewed interested in the hagfish fishery, Englund also increased its inventory of gear for the fishery. Looking ahead to the 2008 salmon fishery closure, Englund staff reported: “This season will be nonexistent compared to last year. Salmon is about half of our business. Because we had a good year last year we bought a lot of inventory this fall – $250,000 worth – that we will have to sit on.”
In 2008, Eureka Ice and Cold Storage closed abruptly, following years of deferred maintenance. Although not entirely due to regulatory factors, the loss of this key provider has had substantial and far-reaching impacts on fishermen, fish buyers and others in the region who relied on it for bait and product storage, and for processing. The city secured funding and built a flake-ice plant on the finger dock adjacent to the city-owned seafood processing plant operated by Pacific Choice Seafoods. The new ice plant opened in early 2010, is maintained and operated by Pacific Choice Seafood through a public/private partnership with the city, and provides ice to the local fleet and local businesses. However, the cold storage facility has not been replaced. One local fisherman commented, “I have a little trouble seeing how we can call ourselves a fishing port if we don’t have a cold storage” (Driscoll 2008).
Economic FactorsFor fishing operations, costs include fixed items such as vessels, gear and equipment (for navigation, safety and maintaining the quality of the catch), slip fees, permit fees, insurance and general vessel maintenance. They also include variable (operating) costs such as fuel, ice and other provisions, as well as crew. Fish buyers and processors, support businesses, the Harbor District and the city likewise have fixed and variable costs including facilities, equipment, labor (and associated costs such as workers’ compensation), supplies, and maintenance, repair and services, which are needed to keep their operations functioning safely and effectively.
Rising costs, especially those for fuel and insurance, were cited as among the biggest challenges commercial fishermen (and other community members) are facing. According to the Pacific States Marine Fisheries Commission’s (PSMFC) annual West Coast Marine Fuel Price Survey, average pretax fuel prices at Northern California ports increased more than three-fold from $1.00 per gallon in December 1999 ($1.22 in 2007$) to $3.19 in December 2007, and about 21% between January and December 2007 (PSMFC 2000, 2008).
At the same time, many commercial fishermen commented on stagnant or declining prices in several fisheries. Our analysis of the landings data suggests this is true in the whiting trawl, shrimp trawl, crab and albacore fisheries, where average price per pound in recent years is lower (-40%, -36%, -12%, -5%, respectively) relative to the long term. However, average annual ex-vessel prices are higher in recent years relative to the long term for hook-and-line-caught rockfish (+45%), line-caught sablefish (+32%), salmon (+15%) and trawl-caught groundfish (+5%). The larger declines in the whiting and shrimp
Eureka Fishing Community Profile 45
trawl fisheries are likely due to competition in international markets. The drop in crab prices may be attributed to the substantial growth in crab production, with the majority of landings still being purchased for the lower-price cooked (rather than live) crab market. Albacore troll prices have declined slightly (-5%), despite the shift toward more (local) off-the-boat sales, which tend to afford higher ex-vessel prices for fishermen. However the bulk of the albacore landed at Eureka continues to be destined for international markets, with a lower ex-vessel price per pound. The apparent increase in rockfish and sablefish prices suggests the influence of the fresh market for the small number of participants remaining in the fishery. The upturn in salmon prices in recent years follows a long period of decline, which is attributed to the growing supply and popularity of farmed salmon in both domestic and international markets (Sylvia et al. 1998). One study participant identified three factors that led to the increase in salmon prices: a fleet-wide increase in quality of the catch, a campaign against farmed salmon, and marketing efforts of the California Salmon Council.
Increased costs and less favorable economic conditions also have affected fishery-support businesses, both directly and indirectly. The reduction in fishing opportunities and activity also has reduced demand for goods and services provided by these support businesses. As a result, several businesses have ceased operations, while others have diversified or shifted emphasis. Through the early 1980s, four marine supply stores and four fuel docks supported local fishing activity; today, only Englund Marine remains, and serves both functions. In the late 1990s, following years of reduced use by local and out-of-town fishermen, the Fields Landing boatyard prepared to close. Unable to find a viable
tenant to run the business, the Harbor District, which owns the facility, assumed responsibility for its operation.
Infrastructure: Maintaining the Working WaterfrontStudy participants highlighted the importance of fishery-support infrastructure, and discussed long-standing efforts to maintain and enhance Eureka’s working waterfront. Of critical concern are fish receiving and processing facilities, ice and cold storage, and work areas and facilities for loading and unloading gear and associated activities.
Although some reduction in local receiving and processing occurred through the 1980s and 1990s, the closure of Eureka Fisheries in 2001 seems to have had a particularly strong impact on local fisheries. Having endured changes in the salmon, shrimp and groundfish fisheries, the company had long played a central role in the fishing community. In 2001, Pacific Choice Seafoods purchased most of the company’s fish receiving and processing assets. The closure of Eureka Fisheries meant the loss of two receiving and processing facilities in the county, along with extensive facilities in Crescent City, and at other ports. Fields Landing was especially affected, as Eureka Fisheries accounted for nearly all of the landings there. (It also had been a major buyer at Trinidad.) Although Pacific Choice Seafoods has to some extent filled the void left by the closure of Eureka Fisheries by
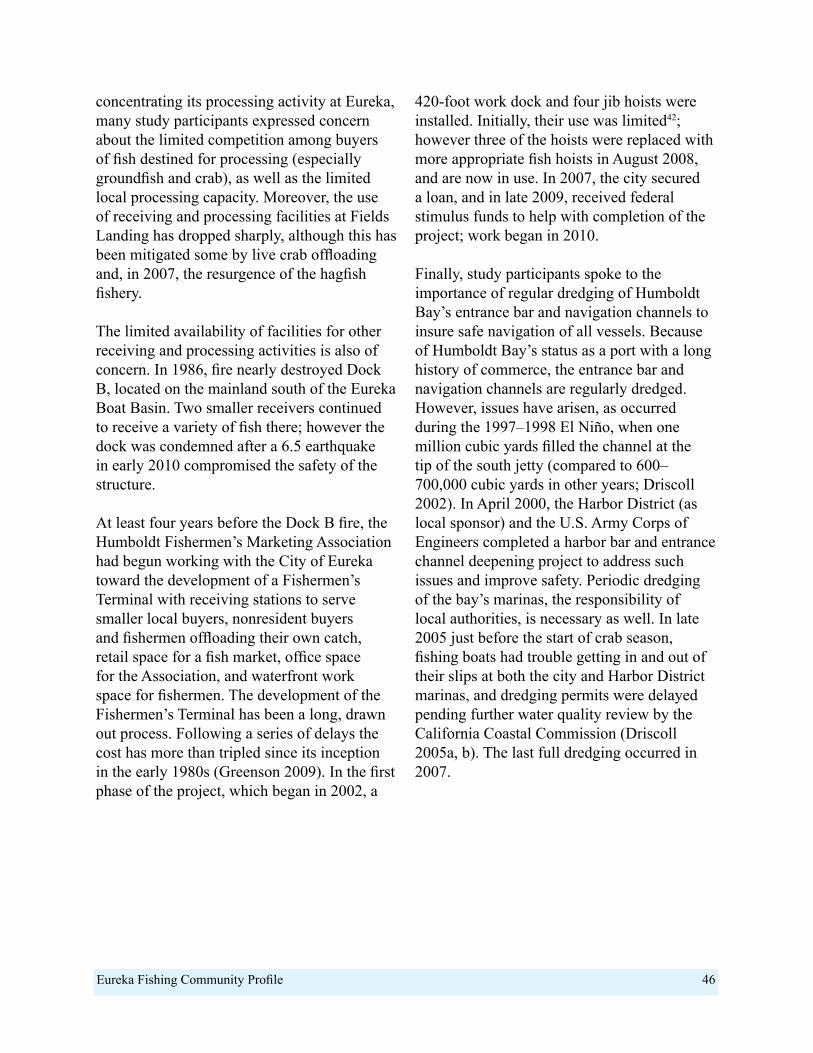
Eureka Fishing Community Profile 46
concentrating its processing activity at Eureka, many study participants expressed concern about the limited competition among buyers of fish destined for processing (especially groundfish and crab), as well as the limited local processing capacity. Moreover, the use of receiving and processing facilities at Fields Landing has dropped sharply, although this has been mitigated some by live crab offloading and, in 2007, the resurgence of the hagfish fishery.
The limited availability of facilities for other receiving and processing activities is also of concern. In 1986, fire nearly destroyed Dock B, located on the mainland south of the Eureka Boat Basin. Two smaller receivers continued to receive a variety of fish there; however the dock was condemned after a 6.5 earthquake in early 2010 compromised the safety of the structure.
At least four years before the Dock B fire, the Humboldt Fishermen’s Marketing Association had begun working with the City of Eureka toward the development of a Fishermen’s Terminal with receiving stations to serve smaller local buyers, nonresident buyers and fishermen offloading their own catch, retail space for a fish market, office space for the Association, and waterfront work space for fishermen. The development of the Fishermen’s Terminal has been a long, drawn out process. Following a series of delays the cost has more than tripled since its inception in the early 1980s (Greenson 2009). In the first phase of the project, which began in 2002, a
420-foot work dock and four jib hoists were installed. Initially, their use was limited42; however three of the hoists were replaced with more appropriate fish hoists in August 2008, and are now in use. In 2007, the city secured a loan, and in late 2009, received federal stimulus funds to help with completion of the project; work began in 2010.
Finally, study participants spoke to the importance of regular dredging of Humboldt Bay’s entrance bar and navigation channels to insure safe navigation of all vessels. Because of Humboldt Bay’s status as a port with a long history of commerce, the entrance bar and navigation channels are regularly dredged. However, issues have arisen, as occurred during the 1997–1998 El Niño, when one million cubic yards filled the channel at the tip of the south jetty (compared to 600–700,000 cubic yards in other years; Driscoll 2002). In April 2000, the Harbor District (as local sponsor) and the U.S. Army Corps of Engineers completed a harbor bar and entrance channel deepening project to address such issues and improve safety. Periodic dredging of the bay’s marinas, the responsibility of local authorities, is necessary as well. In late 2005 just before the start of crab season, fishing boats had trouble getting in and out of their slips at both the city and Harbor District marinas, and dredging permits were delayed pending further water quality review by the California Coastal Commission (Driscoll 2005a, b). The last full dredging occurred in 2007.
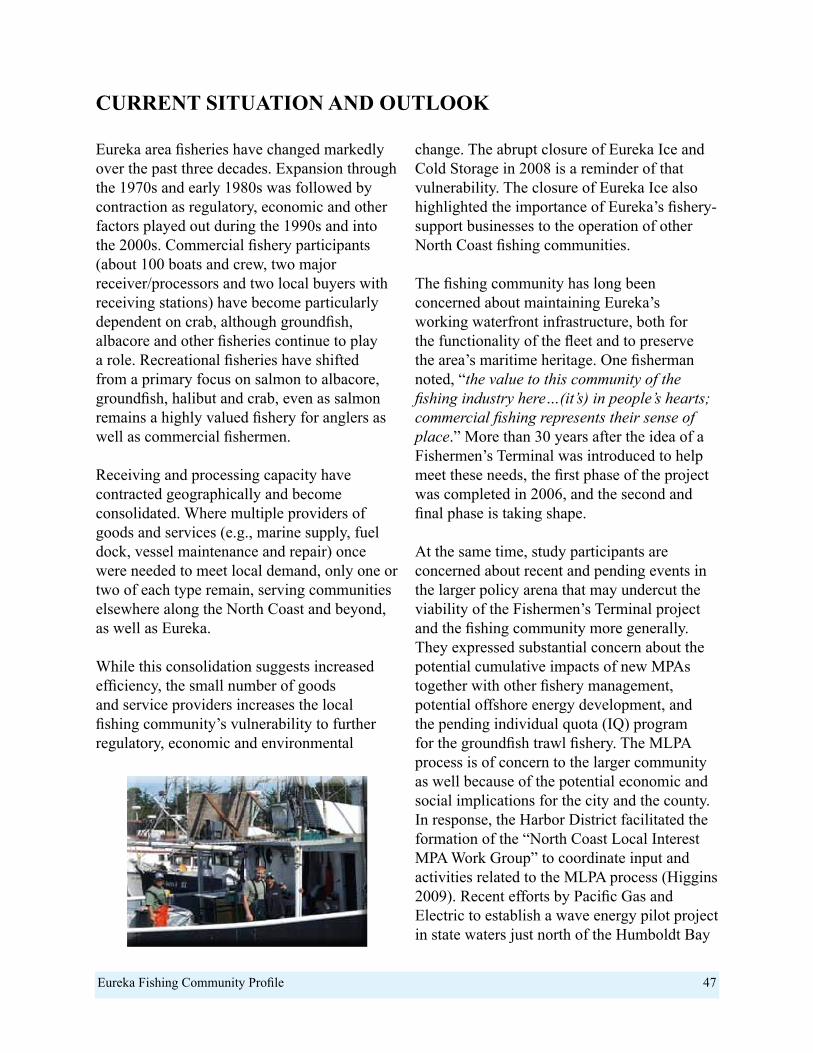
Eureka Fishing Community Profile 47
Eureka area fisheries have changed markedly over the past three decades. Expansion through the 1970s and early 1980s was followed by contraction as regulatory, economic and other factors played out during the 1990s and into the 2000s. Commercial fishery participants (about 100 boats and crew, two major receiver/processors and two local buyers with receiving stations) have become particularly dependent on crab, although groundfish, albacore and other fisheries continue to play a role. Recreational fisheries have shifted from a primary focus on salmon to albacore, groundfish, halibut and crab, even as salmon remains a highly valued fishery for anglers as well as commercial fishermen.
Receiving and processing capacity have contracted geographically and become consolidated. Where multiple providers of goods and services (e.g., marine supply, fuel dock, vessel maintenance and repair) once were needed to meet local demand, only one or two of each type remain, serving communities elsewhere along the North Coast and beyond, as well as Eureka.
While this consolidation suggests increased efficiency, the small number of goods and service providers increases the local fishing community’s vulnerability to further regulatory, economic and environmental
change. The abrupt closure of Eureka Ice and Cold Storage in 2008 is a reminder of that vulnerability. The closure of Eureka Ice also highlighted the importance of Eureka’s fishery-support businesses to the operation of other North Coast fishing communities.
The fishing community has long been concerned about maintaining Eureka’s working waterfront infrastructure, both for the functionality of the fleet and to preserve the area’s maritime heritage. One fisherman noted, “the value to this community of the fishing industry here…(it’s) in people’s hearts; commercial fishing represents their sense of place.” More than 30 years after the idea of a Fishermen’s Terminal was introduced to help meet these needs, the first phase of the project was completed in 2006, and the second and final phase is taking shape.
At the same time, study participants are concerned about recent and pending events in the larger policy arena that may undercut the viability of the Fishermen’s Terminal project and the fishing community more generally. They expressed substantial concern about the potential cumulative impacts of new MPAs together with other fishery management, potential offshore energy development, and the pending individual quota (IQ) program for the groundfish trawl fishery. The MLPA process is of concern to the larger community as well because of the potential economic and social implications for the city and the county. In response, the Harbor District facilitated the formation of the “North Coast Local Interest MPA Work Group” to coordinate input and activities related to the MLPA process (Higgins 2009). Recent efforts by Pacific Gas and Electric to establish a wave energy pilot project in state waters just north of the Humboldt Bay
CurrEnT SiTuaTion and ouTlook
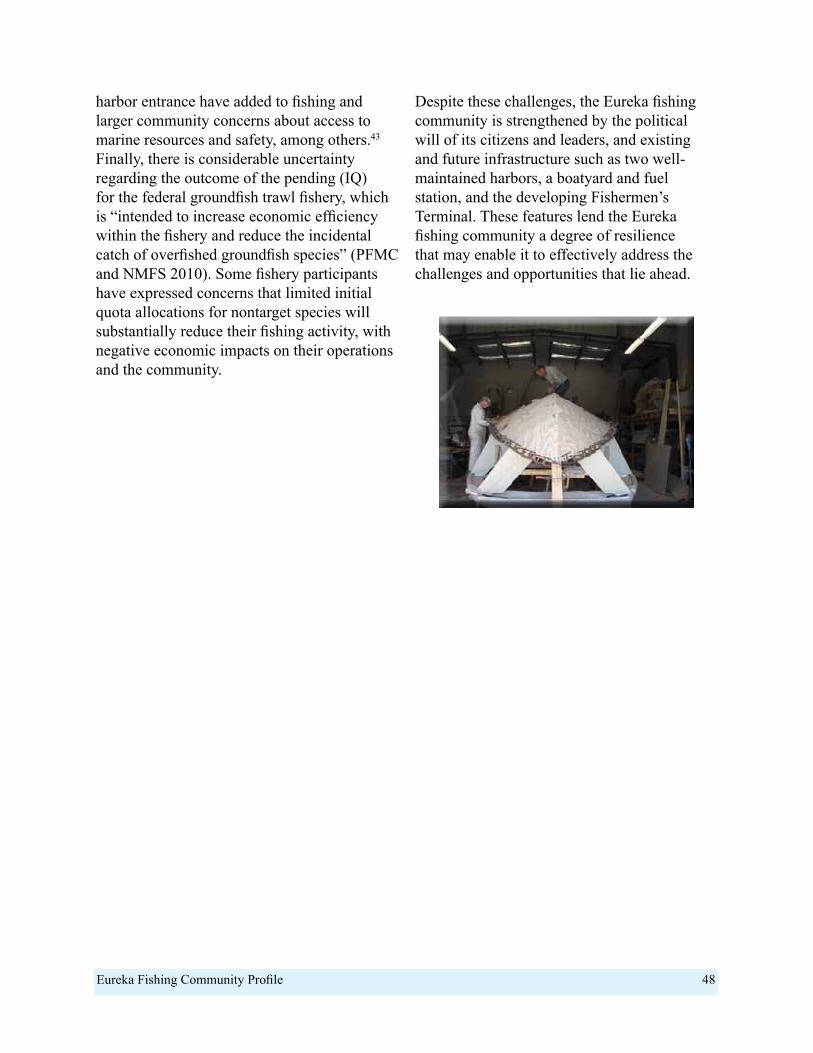
Eureka Fishing Community Profile 48
Despite these challenges, the Eureka fishing community is strengthened by the political will of its citizens and leaders, and existing and future infrastructure such as two well-maintained harbors, a boatyard and fuel station, and the developing Fishermen’s Terminal. These features lend the Eureka fishing community a degree of resilience that may enable it to effectively address the challenges and opportunities that lie ahead.
harbor entrance have added to fishing and larger community concerns about access to marine resources and safety, among others.43 Finally, there is considerable uncertainty regarding the outcome of the pending (IQ) for the federal groundfish trawl fishery, which is “intended to increase economic efficiency within the fishery and reduce the incidental catch of overfished groundfish species” (PFMC and NMFS 2010). Some fishery participants have expressed concerns that limited initial quota allocations for nontarget species will substantially reduce their fishing activity, with negative economic impacts on their operations and the community.
Eureka Fishing Community Profile 49
rEFErEnCES
Anon. 1945. Humboldt Fish Companies. Humboldt Standard. Eureka, CA.
Barrett, E. M. 1963. The California Oyster Industry. Fish Bulletin 123. http://content.cdlib.org/view?docId=kt629004n3&brand=calisphere&doc.view=entire_text.
CDFG. 2007. Information Concerning the Pink Shrimp Trawl Fishery off Northern California. California Department of Fish and Game: http://www.dfg.ca.gov/marine/pdfs/pinkshrimp.pdf.
California Dungeness Crab Task Force. 2010. Report #2: Recommendations from the California Dungeness Crab Task Force regarding management of the fishery in accordance with SB 1690. California Ocean Protection Council: Oakland, CA, 17 p.
Conte, F. 1996. California Oyster Culture. ASAQ-A07. University of California (Davis), Department of Animal Science: 7 p.
Dean, G., H. Carter, E. Nickerson and R. Adams. 1973. Structure and projections of the Humboldt County economy: Economic growth versus environmental quality.
Dewees, C. 2003. Trawl fleet buy-back referendum passes. California Sea Grant Fisheries News. Fall 2003. http://www-csgc.ucsd.edu/BOOKSTORE/Resources/SGFNewsFall03.pdf.
Dewees, C. M. 1976. The farm credit system: A new source of fishery loans. Davis, CA: California Sea Grant Extension Program. 2 p.
Driscoll, J. 2001. Board OK’s live crab sales at Woodley Island. Times-Standard. Eureka, CA:A1.
Driscoll, J. 2002. Army Corps surveyors plumb harbor’s depths. Times-Standard. Eureka, CA.
Driscoll, J. 2005a. Dredge spoils testing under way. Times-Standard. Eureka, CA, November 5.
Driscoll, J. 2005b. Fishermen worry dredging holdup may affect crab season. Times-Standard. Eureka, CA, October 18.
Driscoll, J. 2008. Eureka on Ice. Eureka Times-Standard. Eureka, CA, September 10. http://www.times-standard.com/localnews/ci_10425978.
Eureka Fisheries. 1992. Eureka Fisheries, Inc: Reaping a Harvest from the Sea.
Freese, S., J. Glock and D. Squires. 1995. Direct allocation of resources and cost-benefit analysis in fisheries: An application to Pacific whiting. Marine Policy 19(3):13.
Frimodig, A. J., M. C. Horeczko, M. W. Prall, T. J. Mason, B. C. Owens and S. P. Wertz. 2009. Review of the California trawl fishery for Pacific Ocean shrimp, Pandalus jordani, from 1992 to 2007. Marine Fisheries Review 17(2):1-14. http://spo.nmfs.noaa.gov/mfr712/mfr7121.pdf.
Glatzel, K. A. 1982. An historical overview of land use surrounding Humboldt Bay. Humboldt Bay Symposium. C. Toole and C. Diebel. Eureka, CA. 68-76.
Eureka Fishing Community Profile 50
Gotshall, D. W. 1966. Marine resources of Humboldt Bay: A Symposium on Humboldt Bay Eureka, CA.
Greenson, T. 2009. Council steps forward with Fisherman’s Terminal. Times-Standard. Eureka, CA, December 16. http://www.times-standard.com/ci_14007972.
Hagerman, F. B. 1952. The Biology of the Dover Sole, Microstomus pacificus (Lockington). Fish Bulletin 85. http://content.cdlib.org/view?docId=kt587003w7&brand=calisphere&doc.view=entire_text.
Hankin, D., R. Warner, W. Leet, C. Dewees, R. Klingbeil and E. Larson. 2001. Dungeness crab. pp. 107-111 in California’s Living Marine Resources: A Status Report. W. Leet, C. Dewees, R. Klingbeil and E. Larson, Eds. Sacramento, CA: California Department of Fish and Game.
Hansel, J. F. 1978. Humboldt Bay Harbor Recreation and Conservation District Marina: Draft Supplemental Environmental Impact Statement. FTS-377-4208. U.S. Department of Commerce, Economic Development Administration, Washington, D.C. 20230: 90 p.
HBHRCD. 2007a. Humboldt Bay Harbor of Safe Refuge Vessel Simulation. Final Report Agreement #P0775034. HBHRCD: Eureka, CA, 10 p.
HBHRCD. 2007b. Humboldt Bay Management Plan. Bug Press: Eureka, CA, 221 p., http://www.humboldtbay.org/harbordistrict/documents/.
Higgins, P. 2009. Harbor District forms committee for ocean conservation planning. Times-Standard. Eureka, CA, May 21.
Hoopes, G. 1969. The Commercial Fishing Industry in Humboldt County, California: Prospects for Development. Economic Development Administration, USDOC: 65 p.
Humboldt County Overall Economic Development Program Committee. 1977. Overall Economic Development Program.
Humboldt County Planning Department. 1979. Technical Studies: Commercial Fishery and Beach Use. 52 p.
Kuiper, T. 2009. Industry survey: California bivalve shellfish. Unpublished report: Eureka, CA, 6 p.
Leet, W. S., C. M. Dewees, R. Klingbeil and E. J. Larson, Eds. 2001. California’s Living Marine Resources: A Status Report. Sacramento, CA: CDFG.
Life and Times. 1977. Woodley Island Marina: Asset or atrocity? Life and Times 2 (1): p. 3-4.
McKee-Lewis, K. K. 1996. Rapid changes and growth of California’s live finfish fishery. Marketing and shipping live aquatic products: Proceedings from Marketing and Shipping Live Aquatic Products. Seattle, WA.
Miller, D. and D. Gotshall. 1965. Ocean Sportfish Catch and Effort from Oregon to Point Arguello, California July 1, 1957 - June 30, 1961. Fish Bulletin 130. http://content.cdlib.org/ark:/13030/kt1g5001fm/.
Eureka Fishing Community Profile 51
Monroe, G. M., S. J. Thompson, P. G. Swartzell, B. M. Browning, J. W. Speth and G. R. Arnett. 1973. The Natural Resources of Humboldt Bay. http://aquacomm.fcla.edu/557/1/the_natural_resources_of_humboldt_bay_1.pdf.
NOAA. 1999. Federal Fisheries Investment Task Force Report to Congress. National Oceanic and Atmospheric Administration.
Norman, K., J. Sepez, H. Lazrus, N. Milne, C. Package, S. Russell, K. Grant, R. P. Lewis, J. Primo, E. Springer, M. Styles, B. Tilt and I. Vaccaro. 2007. Community Profiles for West Coast and North Pacific Fisheries: Washington, Oregon, California, and Other U.S. States. NMFS Northwest Fisheries Science Center. Seattle, WA, 602 p.
PFMC. 1992. Oregon Coastal Natural coho review team report. PFMC: Portland, OR, 25 p.
PFMC. 1994. Review of 1993 Ocean Salmon Fisheries. PFMC: Portland, OR, 294 p.
PFMC. 2009. Review of 2008 Ocean Salmon Fisheries: Appendix C: Ocean Salmon Fishery Regulations and Chronology of Events. PFMC: Portland, OR.
PFMC and NMFS. 2010. Rationalization of the Pacific Coast groundfish limited entry trawl fishery, Amendment 20, Implementation, WA, OR and CA. Final Environmental Impact Statement. EIS No. 2010027. NOAA: Portland, OR, 703 p., http://www.pcouncil.org/groundfish/fishery-management-plan/fmp-amendment-20/.
Pierce, R. M. 1998. Klamath Salmon: Understanding Allocation. Klamath River Basin Fisheries Task Force, U.S. Fish and Wildlife Service Yreka, CA, 34 p.
Planwest Partners. 2008. Humboldt Bay Historic and Cultural Resource Characterization and Roundtable. Center for Indian Community Development, Humboldt State University: 165 p.
Prosperity Network. 2007. State of the Industry Report 2007. The Humboldt County Export Economy: Fisheries, Fish Processing and Aquaculture. Prosperity! The North Coast Strategy for Economic Development: 4 p.
PSMFC. 2000. 1999 Marine Fuel Price Summary. Fisheries Economics Data Program, EFIN, PSMFC: Portland, OR, http://www.psmfc.org/efin/docs/1999FuelPriceReport.pdf.
PSMFC. 2008. West Coast and Alaska Marine Fuel Prices 2005-2007 Economic Fisheries Information Network (EFIN), PSMFC: Portland, OR, http://www.psmfc.org/efin/docs/2007FuelPriceReport.pdf.
Ralston, S. 2002. West Coast groundfish harvest policy. North American Journal of Fisheries Management 22 (1): 249-50.
Ray, D. 1982. Present and future use and management of Humboldt Bay. Humboldt Bay Symposium. C. Toole and C. Diebel, eds. Eureka, CA. 77-83.
Scofield, W. L. 1948. Trawling Gear in California. Fish Bulletin 72. http://repositories.cdlib.org/sio/lib/fb/72/.
Scofield, W. L. 1954. California Fishing Ports Fish Bulletin 96. http://content.cdlib.org/view?docId=kt667nb1cg&brand=calisphere&doc.view=entire_text.
Eureka Fishing Community Profile 52
Smith, E. 1973. Coastal county fish and wildlife resources and their utilization: Humboldt County synopsis. California Department of Fish and Game.
Starr, R. M., J. M. Cope, and L. A. Kerr. 2002. Trends in Fisheries and Fishery Resources Associated with the Monterey Bay National Marine Sanctuary From 1981-2000. Publication No. T-046, California Sea Grant College Program, La Jolla, California.
Sylvia, G., M. T. Morrissey, T. Graham and S. Garcia. 1998. Changing trends in seafood markets: The case of farmed and wild salmon. Journal of Food Products Marketing 3(2):49-63.
Trauth, B. 2001. 20th Anniversary of Woodley Island’s opening to be celebrated Saturday. Times-Standard. Eureka, CA, September 28.
Tuttle, D. C. 1982. History of Erosion at King Salmon, Buhne Point from 1854-1982. Humboldt Bay Symposium. C. Toole and C. Diebel, eds. Eureka, CA. 32-38.
Warner, R. 1982. Overview of Commercial and Sport Fisheries in Humboldt Bay Humboldt Bay Symposium. C. Toole and C. Diebel, eds. Eureka, CA. 107.
Young, P. H. 1969. The California Partyboat Fishery 1947–1967. Fish Bulletin 145. http://content.cdlib.org/ark:/13030/kt0g5000s0/.
Eureka Fishing Community Profile 53
1 The bay historically covered 27,000 acres; today it covers 13,000 acres, following diking, drainage and filling (Norman et al. 2007).
2 The port can accommodate vessels up to 950 feet length (HBHRCD 2007a).3 Historically, fishermen also targeted coho (Oncorhynchus kisutch) salmon, however retention
has been prohibited since the early 1990s.4 Aquaculture and both tribal and nontribal shore-based ocean, inland and river fisheries, clam
digging and other collecting activities are also important to the community and the region, but are beyond the scope of this report.
5 See Appendix C for methodological detail.6 In the 1800s, shark liver oil was valued for a variety of medicinal purposes. The fishery
reemerged during World War II following the discovery that shark livers contained high-potency vitamin A. When a synthetic form was produced in the 1950s, the market for shark livers collapsed.
7 See http://ceo.ucsd.edu/fishbull/, accessed 10/28/09.8 Hoopes (1969) estimated employment by company as follows: Eureka Fisheries, 625; A.
Paladini, 150; Tom Lazio, 340; Coast Oyster, 50; and Humboldt Seafoods, Inc., 145.9 State regulations have prohibited the use of trawl nets since 1917 (Scofield 1948) and the
commercial take of salmon and crabs within Humboldt Bay since at least 1973 (Monroe et al. 1973), and have limited catch in the anchovy bait fishery since 1971 (Warner 1982).
10 The KMZ extends from Humbug Mountain near Port Orford, Oregon to Horse Mountain in southern Humboldt County.
11 Regulations have generally been more restrictive in the California KMZ than in the Oregon KMZ, reflecting somewhat different policies regarding how much fishing opportunity each state is willing to forego in the KMZ to maintain opportunity in other areas.
12 See Appendix B for a glossary with definitions of this and other key terms used throughout this report.
13 The tribal allocation was upheld in Parravano v. Babbitt, 70 F.3d 539 (9th Cir. 1995), cert. denied, 518 US. 1016 (1996).
14 See Ralston (2002) for a discussion of the biology of West Coast groundfish and how growing understanding of that biology affected PFMC management.
15 Pacific ocean perch, bocaccio and lingcod were declared overfished in 1999, canary rockfish and cowcod in 2000; darkblotched and widow rockfish in 2001; and yelloweye rockfish in 2002. Lingcod was declared rebuilt in 2005.
EndnoTES
Eureka Fishing Community Profile 54
16 Vessel monitoring systems are electronic transmitters placed on fishing vessels that transmit information about a vessel’s position to enforcement agencies via satellite to determine, for example, whether a vessel is in a closed area (http://www.pcouncil.org/groundfish/gfvms.html, accessed 12/7/09).
17 California Code of Regulations, 2008. Title 14, Sections 120.1 and 120.218 http://www.dfg.ca.gov/licensing/pdffiles/cf_items_10yr.pdf, accessed 6/21/1019 http://www.oysters.us/french-terms.html, accessed 7/30/10.20 According to a local grower, over 99% of Humboldt Bay bivalve landings are farmed product
originating from larvae supplied by hatcheries in Oregon, Washington and Hawaii.21 See Leet et al. 2001 and Starr et al. 2002 for descriptions of these fisheries and gear types.22 Although the trawl fishery for whiting is managed under the Groundfish FMP, it is a distinct
fishery in many respects, and is discussed separately. 23 Throughout we abbreviate the names of these fisheries as follows: albacore for albacore troll,
crab for crab pot, rockfish for rockfish/lingcod hook-and-line/pot, sablefish for sablefish hook-and-line/pot, and salmon for salmon troll.
24 Off-the-boat sales have been allowed at the Eureka Boat Basin for several years (Driscoll 2001). At Woodley Island Marina, off-the-boat sales have been allowed for finfish since 1998, and for crab since 2001.
25 According to the local live bait provider, Humboldt Bay is the only location between Santa Cruz and Westport, Washington that the fleet can buy or catch live bait. He reported supplying a total of about 32,000 pounds of live anchovy to several recreational and 24 commercial albacore boats in 2009. Nonlocal bait suppliers noted by study participants include Katy’s Smokehouse in Trinidad, Sea Wave (Monterey Fish Company) in Monterey and Mike’s Baits, Bait in Oregon.
26 http://www.trawl.org/Member%20Boats.html, accessed 1/10/10.27 http://wfoa-tuna.org/members/members010510.pdf, accessed 1/10/10.28 The organization has gone by different names over time including the Humboldt Fishermen’s
Wives Association, and Humboldt Women for Commercial Fishing. 29 The 1981 start date for this analysis is based on the availability the Pacific States Marine
Fisheries Commission’s PacFIN database, which integrates Washington, Oregon and California commercial fishery landings data to provide a consistent coast-wide electronic record of landings from 1981 forward. The PacFIN data for California are based on the C-MASTER data provided by CDFG to the PacFIN program.
30 An entity is counted as a buyer in a given year if it receives at least one delivery. In reality, the number of active buyers capable of regularly receiving the catch from multiple boats is considerably smaller.
Eureka Fishing Community Profile 55
31 Because multiple species may be caught during a fishing trip, trips are measured by assigning each delivery to the fishery accounting for the greatest (i.e., plurality of) ex-vessel value associated with that delivery. In some cases, fishing for particular combinations of species and/or using multiple gear types on a single trip is prohibited.
32 Consolidation refers to the concentration of fish catch or fish receiving among a smaller number of entities.
33 Note that crab season straddles the calendar year (December through July), and most landings occur within the first one to two months of the season (Hankin et al. 2001). As a result, activity reported for a given year may not correspond to that of a season, per se. We analyzed the data by calendar year for consistency with analyses for other fisheries, most of which have seasons that lie within the calendar year.
34 Commercial salmon troll data exclude landings at King Salmon and other Humboldt Bay sites because these are reported in PacFIN as part of, and not distinguishable from, ‘Other Humboldt County’ data.
35 Community members also highlighted local dock (offloading) fees and container weight limits on California Highway 101 as deterrents to offloading albacore frozen at sea.
36 Port-specific catch and effort estimates for these species are not available.37 Initiated by the state in 2004, the CRFS provides comprehensive estimates of effort and catch
for all recreational fishing modes and species. (Modes are the locations/facilities anglers fish from, and include: manmade structures, beaches and banks, CPFVs or charter boats, and private boats.)
38 The 1980 start date for this analysis is based on the availability of electronic CDFG logbook data.
39 See the Trinidad Harbor Fishing Community Profile.40 ‘Boats’ are counted as the number of unique vessels that operate in a given year. A ‘boat
trip’ represents a combined departure and return of a boat, regardless of trip length. An ‘angler trip’ is defined as one angler spending part or all of one or more days fishing before returning to the location where the trip began. An ‘angler day’ is defined as one person’s fishing on a given day. For example, two anglers each fishing for three days are counted as six angler days.
41 Permit holders in seven fisheries (i.e., the federal groundfish and the Washington, Oregon, and California pink shrimp and Dungeness crab fisheries) participated in the referendum. The vote, weighted by debt obligation on the buyback loan for each fishery (as prescribed by the statute), was 85.5% in favor of the buyback, including 90% of the trawl, 80% of the pink shrimp, and 55% of the crab fleets (Dewees 2003).
42 Fishing community members noted that the jib hoists were not ideal for fishery use and were expensive to operate, and that the facility lacked bumpers to protect docking boats.
43 See http://www.pge.com/about/environment/pge/cleanenergy/waveconnect/projects.shtml (accessed 6/30/10) for information about the Humboldt WaveConnectTM Pilot Project.