Embed Size (px)
Citation preview

California WIA Program Year 2013 Annual Report Tables ADULT PROGRAM
Table B - Adult Program Results At-A-Glance
Reported Information Negotiated Performance Level
Actual Performance Level
numerator denominator
Entered Employment Rate 63.4% 64.7% 19,028 29,403
Employment Retention Rate 83.0% 82.5% 22,424 27,181
Average Earnings $14,200 $14,610 $320,536,142
21,940
Table C - Outcomes for Adult Special Populations
Reported Information
Public Assistance Recipients Receiving Intensive or Training
Services
Veterans Individuals With Disabilities Older Individuals
Entered Employment Rate
62.4% 4,901
63.9% 1,912
52.3% 1,127
51.9% 2,082
7,855 2,994 2,153 4,008
Employment Retention Rate 79.0%
4,964 80.7%
2,259 76.7%
1,072 80.1%
2,248 6,283 2,799 1,397 2,808
Average Earnings $11,605
$56,216,802 $17,571
$38,479,430 $13,665
14,266,462 $15,143
$33,237,954
4,844 2,190 1,044 2,195
Table D - Other Outcome Information for the Adult Program
Reported Information Individuals Who Only
Received Core Services
Individuals Who Only Received
Core & Intensive Services
Individuals Who Received Training Services
Entered Employment Rate 61.1% 3,561
60.0% 8,318
73.7% 7,147
5,827 13,874 9,698
Employment Retention Rate 82.3% 4,336 80.5% 9,242 84.8% 8,841 5,270 11,474 10,431
Average Earnings $13,292 $56,584,632 $13,242 $120,778,681 $16,726 $143,142,480 4,257 9,121 8,558
1
California WIA Program Year 2013 Annual Report Tables
All Adults PublicAssistance Veterans Individuals
w/DisabilitiesOlder
IndividualsReceivedTraining
Core/IntensiveOnly
Participant Groups 64.7% 62.4% 63.9% 52.3% 51.9% 73.7% 60.0%
0.0%
20.0%
40.0%
60.0%
80.0%
100.0%
Fiqure 1 Adult Entered Employment Rate
All Adults PublicAssistance Veterans Individuals w/
DisabilitiesOlder
IndividualsReceivedTraining
Core/IntensiveOnly
Participant Groups 82.5% 79.0% 80.7% 76.7% 80.1% 84.8% 80.5%
0.0%
20.0%
40.0%
60.0%
80.0%
100.0%
Figure 2 Adult Employment Retention Rate
2

California WIA Program Year 2013 Annual Report Tables
All Adults PublicAssistance Veterans Individuals w/
DisabilitiesOlder
IndividualsReceivedTraining
Core/IntensiveOnly
Participant Groups $14,610 $11,605 $17,571 $13,665 $15,143 $16,726 $13,242
$0
$5,000
$10,000
$15,000
$20,000
Figure 3 Adult Average Earnings
3
California WIA Program Year 2013 Annual Report Tables
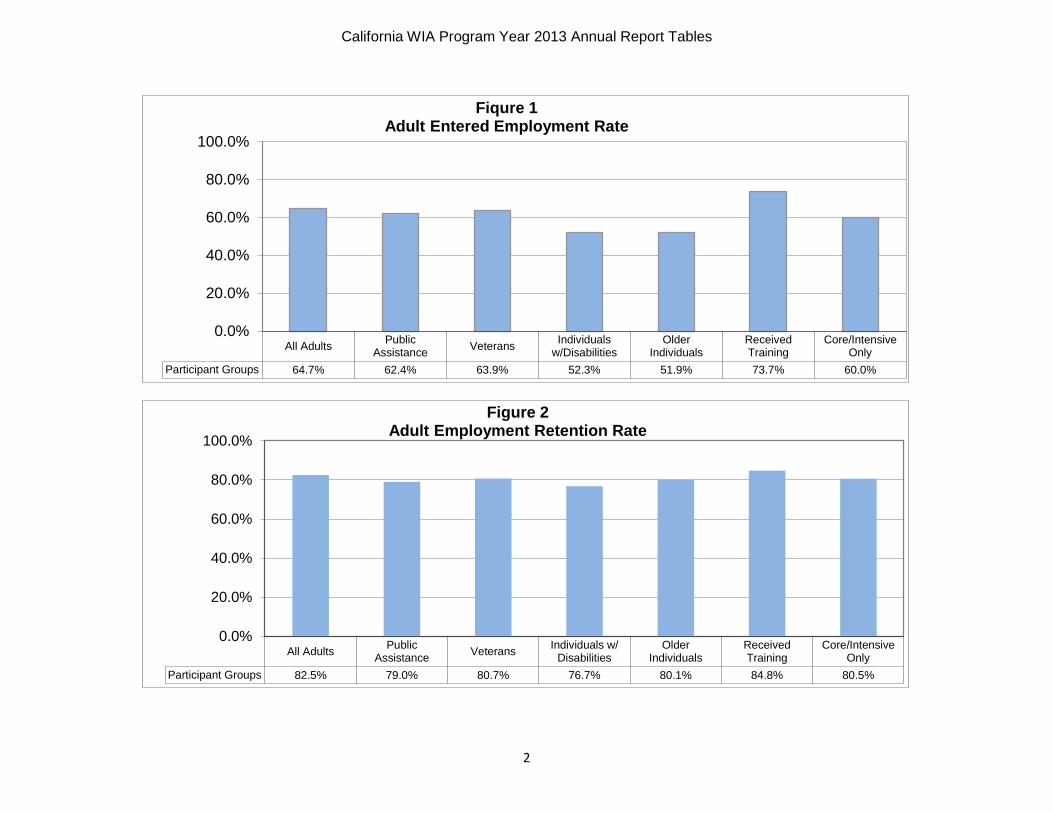
DISLOCATED WORKER PROGRAM
Table E - Dislocated Worker Program Results At-A-Glance
Reporting Information Negotiated Actual numerator Performance Level Performance Level denominator
Entered Employment Rate 72.0% 72.0% 16,929 23,508
Employment Retention Rate 89.5% 86.1% 14,522 16,864
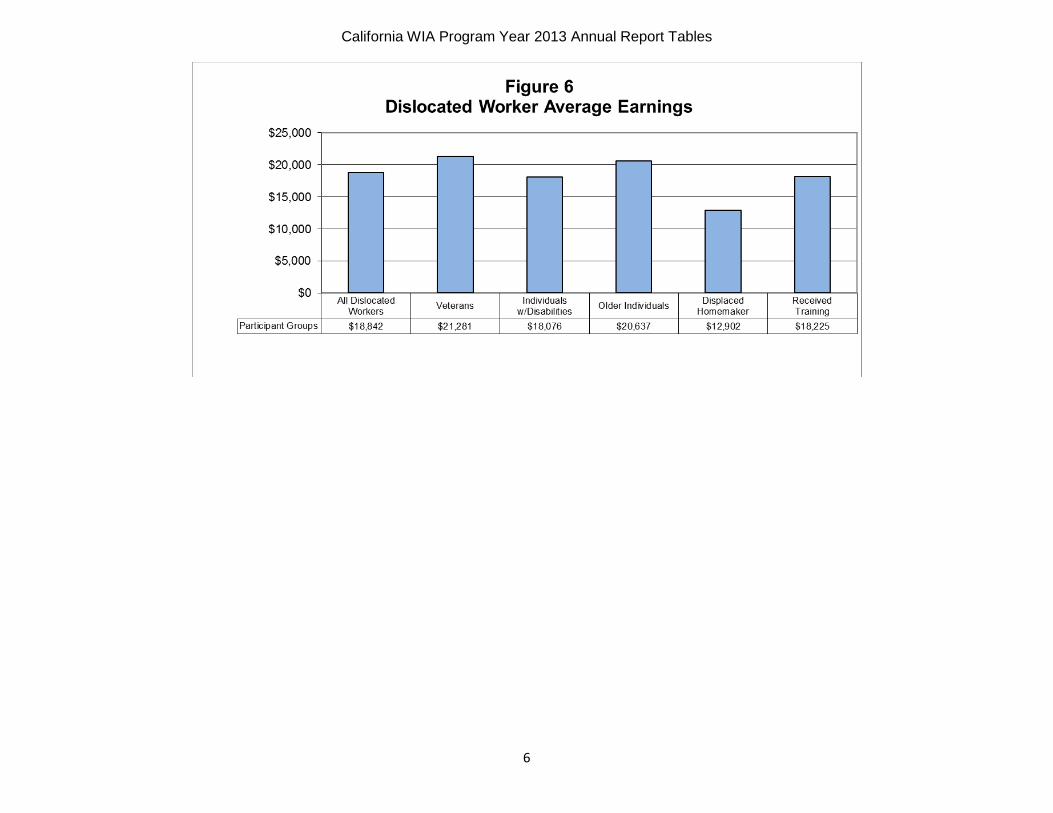
Average Earnings $19,178 $18,842 $267,047,518.08 14,173
Table F - Outcomes for Dislocated Worker Special Populations
Reporting Information Veterans Individuals With
Disabilities Older Individuals Displaced Homemakers
Entered Employment Rate 68.0%
1,176 65.1%
714 59.0%
2,810 52.5%
62 1,730 1,097 4,760 118
Employment 81.1%
1,011 82.5%
532 82.4%
2,192 82.7%
67 Retention Rate 1,246 645 2,659 81
Average Earnings $21,281 $21,025,905 $18,076 $9,218,858 $20,637 $43,977,788 $12,902 $825,712 988 510 2,131 64
Table G - Other Outcome Information for the Dislocated Worker Program
Reported Information Individuals Who Only
Received Core Services
Individuals Who Only Received
Core & Intensive Services
Individuals Who Received
Training Services
Entered Employment Rate 66.7% 3,167 68.8% 6,552 78.1% 7,209 4,750 9,529 9,228
Employment Retention Rate 85.7% 2,705 84.3% 5,573 88.0% 6,242 3,157 6,611 7,094
Average Earnings $22,328 $58,521,220 $17,864 $97,857,007 $18,225 $110,661,822 2,621 5,478 6,072
4

California WIA Program Year 2013 Annual Report Tables
5
California WIA Program Year 2013 Annual Report Tables
6

California WIA Program Year 2013 Annual Report Tables
YOUTH (14 - 21) PROGRAM
Table H - Youth (14 - 21) Program Results
Reported Information Negotiated Performance Level
Actual Performance Level
numerator denominator
Placement in Employment or Education
74.0% 66.2% 9,245 13,965
Attainment of Degree or Certificate
60.0% 67.7% 8,184 12,088
Literacy and Numeracy Gains 60.5% 61.6% 4,359
7,082
Table H.1.A - Outcomes for Youth Special Populations
Reported Information Public Assistance Recipients
Veterans Individuals With Disabilities
Out-of-School Youth
Placement in Employment or Education 64.3% 3,454 62.5% 10 61.7% 756 67.4% 5,470
5,374 16 1,225 8,112 Attainment of Degree or Certificate
68.3% 3,094 57.1% 8 74.6% 853 58.8% 3,543 4,530 14 1,143 6,025
Literacy and Numeracy Gains 57.2% 1,291 45.5% 5 61.8% 323 61.6% 4,358
2,258 11 523 7,070
7

California WIA Program Year 2013 Annual Report Tables
8

California WIA Program Year 2013 Annual Report Tables
9

California WIA Program Year 2013 Annual Report Tables
OTHER REPORTED INFORMATION
Table L - Other Reported Information
Reported Information
12 Month Employment
Retention Rate
12 Month Earnings Change (Adults)
or 12 Months Earnings
Replacement (Dislocated Workers)
Placement in Non-
Traditional Employment
Wages At Entry Into Employment For those
Individuals Who Entered Unsubsidized Employment
Entry Into Unsubsidized Employment Related to the Training Received of Those Who Completed
Training Services
Adults 81.8% 23,034
$6,618.5 $182,007,656.3
2.3% 434
$5,931.24 $110,872,711.7
52.2% 3,731
28,169 27,500 19,028 18,693 7,147
Dislocated Workers 85.9%
14,949 $124.4
$283,712,722.6 2.2%
366 $8,717.58
$144,214,941.4 47.0%
3,387
17,411 2279772.63 16,929 16,543.0 7,209
Table M - Participation Levels Reported Information Total Participants Served Total Exiters
Total Adult Customers 940,722 889,911 Total Adults (self-service Only) 862,697 838,430 WIA Adults 908,598 868,385 WIA Dislocated Workers 33,619 22,546 Total Youth (14-21) 25,390 14,440 Out-of-School Youth 13,456 8,505 In-school Youth 11,921 5,922
10

California WIA Program Year 2013 Annual Report Tables
Table N - Cost of Program Activities
Program Activity Total Federal Spending
Local Adults $93,855,441
Local Dislocated Workers $103,083,873
Local Youth $103,088,061
Rapid Response $62,261,471
Statewide Required Activities $0
Statewide Allowable Activities Pr
ogra
m A
ctiv
ity D
escr
iptio
n
Removing Barriers $3,518,205
Statewide Need $1,336,825
Growth Industries $495,925
Miscellaneous $8,929,714
Total of All Federal Spending $376,569,515
11

California WIA Program Year 2013 Annual Report Tables
Local Area Name Adults* 19,283
Dislocated Workers 1,117
Youth 327ETA Assigned # 6185 Adults* 19,431
Dislocated Workers 1,746Youth 197
Negotiated Actual Performance Level Performance Level Success Rate
Adults 58.5% 57.8% 99%Dislocated Workers 67.8% 70.6% 104%
Adults 81.8% 83.8% 102%Dislocated Workers 87.0% 86.0% 99%
Adults $15,900 $19,180 121%Dislocated Workers $19,500 $20,621 106%
Placement in Employment or Education Youth (14-21) 59.2% 58.3% 98%
Attainment of Degree or Certificate Youth (14-21) 40.0% 44.6% 112%
Literacy or Numeracy Gains Youth (14-21) 25.0% 28.4% 114%
*Adult Participants include WIA Adults and WIA Self Service
*Adult exiters include WIA Adults and WIA Self Service
The literacy and numeracy cohort is July 1, 2013 through June 30, 2014.
Table O - Local Performance
Total Participants Served
Total ExitersAlameda
Entered Employment Rate
Retention Rate
Average Earnings
Total participants served are clients in the program between July 1, 2013 and June 30, 2014.
Total exiters include clients leaving the program during the period from April 1, 2013 to March 31, 2014.
The cohort for entered employment rates is October 1, 2012 through September 30, 2013.The average earnings and retention measures are based on the clients leaving the program between April 1, 2012 and March 31, 2013.The cohort for placement in employment or education and attainment of a degree or certificate measures is October 1, 2012 through September 30, 2013.
12

California WIA Program Year 2013 Annual Report Tables
Local Area Name Adults* 19,484
Dislocated Workers 50Youth 195
ETA Assigned # 6265 Adults* 19,035Dislocated Workers 30
Youth 106
Negotiated ActualPerformance Level Performance Level Success Rate
Adults 77.0% 88.8% 115%Dislocated Workers 82.5% 90.5% 110%
Adults 84.0% 90.0% 107%Dislocated Workers 88.1% 92.6% 105%
Adults $13,500 $15,168 112%Dislocated Workers $17,000 $16,897 99%
Placement in Employment or Education
Youth (14-21) 72.0% 86.0% 119%Attainment of Degree or
Certificate Youth (14-21) 70.0% 95.4% 136%
Literacy or Numeracy Gains Youth (14-21) 61.9% 87.9% 142%
*Adult Participants include WIA Adults and WIA Self Service
*Adult exiters include WIA Adults and WIA Self Service
The literacy and numeracy cohort is July 1, 2013 through June 30, 2014.
Table O - Local Performance
Total Participants Served
Total ExitersCity of Anaheim WIB
Entered Employment Rate
Retention Rate
Average Earnings
Total participants served are clients in the program between July 1, 2013 and June 30, 2014.
Total exiters include clients leaving the program during the period from April 1, 2013 to March 31, 2014.
The cohort for entered employment rates is October 1, 2012 through September 30, 2013.The average earnings and retention measures are based on the clients leaving the program between April 1, 2012 and March 31, 2013.The cohort for placement in employment or education and attainment of a degree or certificate measures is October 1, 2012 through September 30, 2013.
13

California WIA Program Year 2013 Annual Report Tables
Local Area Name Adults* 17,280Dislocated Workers 532
Youth 502ETA Assigned # 6070 Adults* 15,893
Total Exiters Dislocated Workers 282Youth 305
Negotiated Actual Performance Level Performance Level Success Rate
Adults 79.2% 80.6% 102%Dislocated Workers 80.4% 83.5% 104%
Adults 84.0% 91.1% 108%Dislocated Workers 89.3% 91.3% 102%
Adults $14,581 $14,719 101%Dislocated Workers $19,500 $20,493 105%
Placement in Employment or Education Youth (14-21) 65.2% 77.2% 118%
Attainment of Degree or Certificate Youth (14-21) 43.6% 74.6% 171%
Literacy or Numeracy Gains Youth (14-21) 34.3% 55.0% 160%
*Adult Participants include WIA Adults and WIA Self Service
*Adult exiters include WIA Adults and WIA Self Service
The literacy and numeracy cohort is July 1, 2013 through June 30, 2014.
Table O - Local Performance
Total Participants Served
Contra Costa Workforce
Entered Employment Rate
Retention Rate
Average Earnings
Total exiters include clients leaving the program during the period from April 1, 2013 to March 31, 2014.
The average earnings and retention measures are based on the clients leaving the program
is October 1, 2012 through September 30, 2013.
Total participants served are clients in the program between July 1, 2013 and June 30, 2014.
The cohort for entered employment rates is October 1, 2012 through September 30, 2013.
between April 1, 2012 and March 31, 2013.
The cohort for placement in employment or education and attainment of a degree or certificate measures
14

California WIA Program Year 2013 Annual Report Tables
Local Area Name Adults* 7,140Dislocated Workers 181
Youth 126ETA Assigned # 6030 Adults* 6,639
Dislocated Workers 94Youth 61
Negotiated Actual Performance Level Performance Level Success Rate
Adults 76.7% 77.6% 101%Dislocated Workers 71.9% 82.5% 115%
Adults 83.0% 90.3% 109%Dislocated Workers 87.5% 83.8% 96%
Adults $13,408 $17,698 132%Dislocated Workers $19,200 $21,694 113%
Placement in Employment or Education Youth (14-21) 71.5% 58.4% 82%
Attainment of Degree or Certificate Youth (14-21) 57.3% 53.5% 93%
Literacy or Numeracy Gains Youth (14-21) 55.0% 71.4% 130%
*Adult Participants include WIA Adults and WIA Self Service
*Adult exiters include WIA Adults and WIA Self Service
The literacy and numeracy cohort is July 1, 2013 through June 30, 2014.
Table O - Local Performance
Total Participants Served
Total ExitersFoothill Employment & Training Consortium
Total exiters include clients leaving the program during the period from April 1, 2013 to March 31, 2014.
The cohort for entered employment rates is October 1, 2012 through September 30, 2013.
The average earnings and retention measures are based on the clients leaving the program
between April 1, 2012 and March 31, 2013.
Entered Employment Rate
Retention Rate
Average Earnings
Total participants served are clients in the program between July 1, 2013 and June 30, 2014.
The cohort for placement in employment or education and attainment of a degree or certificate measures is October 1, 2012 through September 30, 2013.
15

California WIA Program Year 2013 Annual Report Tables
Local Area Name Adults* 24,773Dislocated Workers 738
Youth 1,336ETA Assigned # 6160 Adults* 23,953
Dislocated Workers 409Youth 878
Negotiated Actual
Performance Level Performance Level Success RateAdults 70.1% 66.1% 94%
Dislocated Workers 78.5% 76.1% 97%Adults 80.8% 82.9% 103%
Dislocated Workers 84.7% 84.7% 100%Adults $12,726 $13,767 108%
Dislocated Workers $13,467 $16,432 122%Placement in Employment or
Education Youth (14-21) 70.0% 62.9% 90%
Attainment of Degree or Certificate Youth (14-21) 59.6% 65.1% 109%
Literacy or Numeracy Gains Youth (14-21) 76.2% 50.7% 67%
*Adult Participants include WIA Adults and WIA Self Service
*Adult exiters include WIA Adults and WIA Self Service
The literacy and numeracy cohort is July 1, 2013 through June 30, 2014.
Table O - Local Performance
Entered Employment Rate
Retention Rate
Average Earnings
Total Participants Served
Total ExitersFresno County WIB
Total participants served are clients in the program between July 1, 2013 and June 30, 2014.
The cohort for placement in employment or education and attainment of a degree or certificate measures is October 1, 2012 through September 30, 2013.
Total exiters include clients leaving the program during the period from April 1, 2013 to March 31, 2014.
The cohort for entered employment rates is October 1, 2012 through September 30, 2013.
The average earnings and retention measures are based on the clients leaving the program
between April 1, 2012 and March 31, 2013.
16
California WIA Program Year 2013 Annual Report Tables
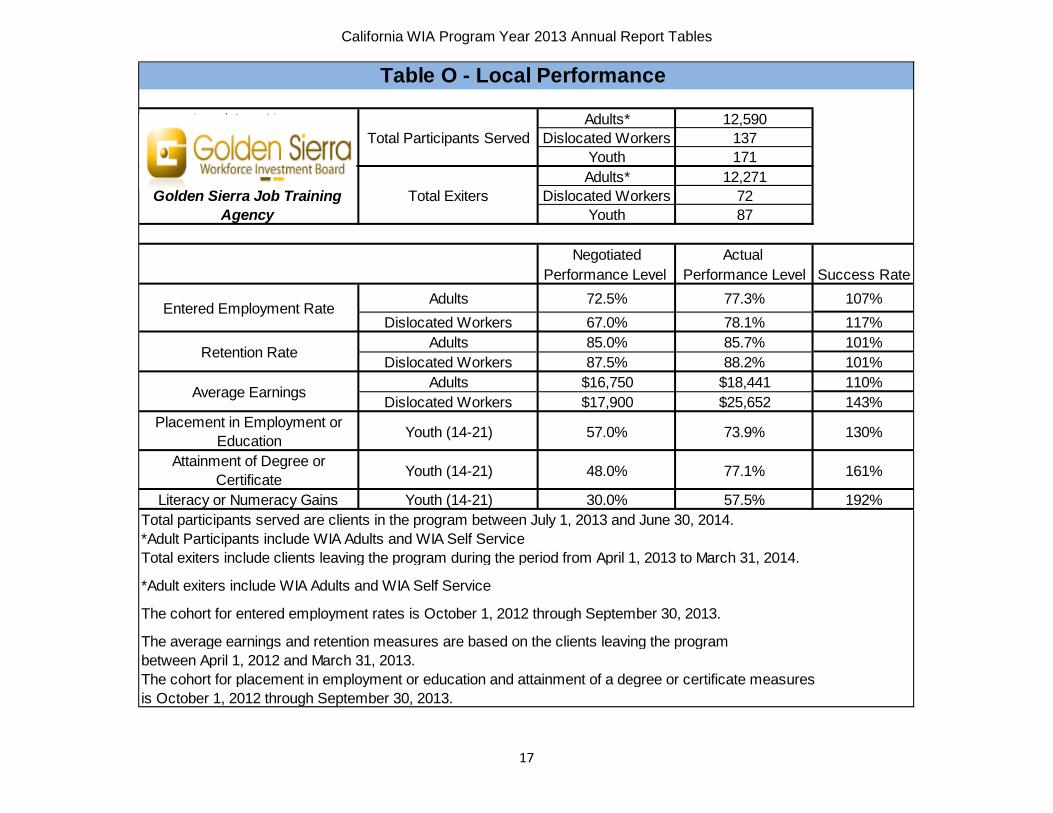
Local Area Name Adults* 12,590Dislocated Workers 137
Youth 171ETA Assigned # 6200 Adults* 12,271
Total Exiters Dislocated Workers 72Youth 87
Negotiated Actual Performance Level Performance Level Success Rate
Adults 72.5% 77.3% 107%Dislocated Workers 67.0% 78.1% 117%
Adults 85.0% 85.7% 101%Dislocated Workers 87.5% 88.2% 101%
Adults $16,750 $18,441 110%Dislocated Workers $17,900 $25,652 143%
Placement in Employment or Education Youth (14-21) 57.0% 73.9% 130%
Attainment of Degree or Certificate Youth (14-21) 48.0% 77.1% 161%
Literacy or Numeracy Gains Youth (14-21) 30.0% 57.5% 192%
*Adult Participants include WIA Adults and WIA Self Service
*Adult exiters include WIA Adults and WIA Self Service
Table O - Local Performance
Average Earnings
Total Participants Served
Golden Sierra Job Training Agency
Entered Employment Rate
Retention Rate
The average earnings and retention measures are based on the clients leaving the program between April 1, 2012 and March 31, 2013.
The cohort for entered employment rates is October 1, 2012 through September 30, 2013.
Total exiters include clients leaving the program during the period from April 1, 2013 to March 31, 2014.
The cohort for placement in employment or education and attainment of a degree or certificate measures is October 1, 2012 through September 30, 2013.
Total participants served are clients in the program between July 1, 2013 and June 30, 2014.
17

California WIA Program Year 2013 Annual Report Tables
Local Area Name Adults* 4,802Dislocated Workers 99
Youth 151ETA Assigned # 6060 Adults* 4,119
Total Exiters Dislocated Workers 40Youth 102
Negotiated Actual Performance Level Performance Level Success Rate
Adults 63.4% 52.3% 82%Dislocated Workers 68.0% 71.7% 105%
Adults 81.0% 79.8% 99%Dislocated Workers 84.5% 88.5% 105%
Adults $14,400 $12,277 85%Dislocated Workers $15,500 $14,658 95%
Placement in Employment or Education Youth (14-21) 64.0% 53.8% 84%
Attainment of Degree or Certificate Youth (14-21) 68.0% 71.3% 105%
Literacy or Numeracy Gains Youth (14-21) 60.5% 0.0% 0%
*Adult Participants include WIA Adults and WIA Self Service
*Adult exiters include WIA Adults and WIA Self Service
Humboldt County WIB
Entered Employment Rate
Retention Rate
Average Earnings
Table O - Local Performance
Total Participants Served
Total exiters include clients leaving the program during the period from April 1, 2013 to March 31, 2014.
The cohort for entered employment rates is October 1, 2012 through September 30, 2013.
The average earnings and retention measures are based on the clients leaving the program between April 1, 2012 and March 31, 2013.
Total participants served are clients in the program between July 1, 2013 and June 30, 2014.
The cohort for placement in employment or education and attainment of a degree or certificate measures is October 1, 2012 through September 30, 2013.
18

California WIA Program Year 2013 Annual Report Tables
Local Area Name Adults* 13,556Dislocated Workers 80
Youth 370ETA Assigned # 6195 Adults* 11,758
Total Exiters Dislocated Workers 36Youth 184
Negotiated Actual Performance Level Performance Level Success Rate
Adults 73.6% 73.3% 100%Dislocated Workers 73.1% 79.6% 109%
Adults 80.0% 87.6% 110%Dislocated Workers 83.0% 90.5% 109%
Adults $10,000 $10,835 108%Dislocated Workers $10,500 $14,211 135%
Placement in Employment or Education Youth (14-21) 55.0% 50.4% 92%
Attainment of Degree or Certificate Youth (14-21) 55.0% 76.4% 139%
Literacy or Numeracy Gains Youth (14-21) 55.0% 33.0% 60%
*Adult Participants include WIA Adults and WIA Self Service
*Adult exiters include WIA Adults and WIA Self Service
Imperial County WIB
The cohort for entered employment rates is October 1, 2012 through September 30, 2013.
The average earnings and retention measures are based on the clients leaving the program between April 1, 2012 and March 31, 2013.
Entered Employment Rate
Retention Rate
Average Earnings
Total exiters include clients leaving the program during the period from April 1, 2013 to March 31, 2014.
The cohort for placement in employment or education and attainment of a degree or certificate measures is October 1, 2012 through September 30, 2013.
Total participants served are clients in the program between July 1, 2013 and June 30, 2014.
Table O - Local Performance
Total Participants Served
19

California WIA Program Year 2013 Annual Report Tables
Local Area Name Adults* 36,055Dislocated Workers 524
Youth 1,522ETA Assigned # 6075 Adults* 34,467
Total Exiters Dislocated Workers 325Youth 452
Negotiated Actual Performance Level Performance Level Success Rate
Adults 72.0% 73.3% 102%Dislocated Workers 76.0% 75.8% 100%
Adults 82.0% 86.9% 106%Dislocated Workers 84.5% 82.8% 98%
Adults $12,700 $13,360 105%Dislocated Workers $15,000 $15,662 104%
Placement in Employment or Education Youth (14-21) 64.6% 62.8% 97%
Attainment of Degree or Certificate Youth (14-21) 60.0% 82.4% 137%
Literacy or Numeracy Gains Youth (14-21) 25.0% 45.7% 183%
*Adult Participants include WIA Adults and WIA Self Service
*Adult exiters include WIA Adults and WIA Self Service
Table O - Local Performance
Retention Rate
Average Earnings
Total Participants Served
Kern/Inyo/Mono Consortium
is October 1, 2012 through September 30, 2013.
Total exiters include clients leaving the program during the period from April 1, 2013 to March 31, 2014.
Total participants served are clients in the program between July 1, 2013 and June 30, 2014.
The cohort for placement in employment or education and attainment of a degree or certificate measures
The cohort for entered employment rates is October 1, 2012 through September 30, 2013.
The average earnings and retention measures are based on the clients leaving the program between April 1, 2012 and March 31, 2013.
Entered Employment Rate
20

California WIA Program Year 2013 Annual Report Tables
Local Area Name Adults* 4,051Dislocated Workers 80
Youth 159ETA Assigned # 6215 Adults* 2,815
Total Exiters Dislocated Workers 33Youth 65
Negotiated Actual Performance Level Performance Level Success Rate
Adults 61.0% 79.8% 131%Dislocated Workers 65.0% 71.1% 109%
Adults 83.3% 79.1% 95%Dislocated Workers 83.0% 83.0% 100%
Adults $12,700 $13,642 107%Dislocated Workers $16,350 $15,385 94%
Placement in Employment or Education Youth (14-21) 72.0% 72.6% 101%
Attainment of Degree or Certificate Youth (14-21) 67.0% 90.0% 134%
Literacy or Numeracy Gains Youth (14-21) 60.5% 83.3% 138%
*Adult Participants include WIA Adults and WIA Self Service
*Adult exiters include WIA Adults and WIA Self Service
Table O - Local Performance
Total Participants Served
Kings County Job Training Office
Entered Employment Rate
Retention Rate
Average Earnings
The cohort for placement in employment or education and attainment of a degree or certificate measures is October 1, 2012 through September 30, 2013.
Total participants served are clients in the program between July 1, 2013 and June 30, 2014.
Total exiters include clients leaving the program during the period from April 1, 2013 to March 31, 2014.
The cohort for entered employment rates is October 1, 2012 through September 30, 2013.
The average earnings and retention measures are based on the clients leaving the program between April 1, 2012 and March 31, 2013.
21

California WIA Program Year 2013 Annual Report Tables
Local Area Name Adults* 48,816Dislocated Workers 3,188
Youth 2,860ETA Assigned # 6020 Adults* 45,220
Total Exiters Dislocated Workers 1,263Youth 2,429
Negotiated Actual Performance Level Performance Level Success Rate
Adults 77.0% 84.5% 110%Dislocated Workers 78.5% 84.6% 108%
Adults 79.0% 85.2% 108%Dislocated Workers 84.0% 86.0% 102%
Adults $12,500 $14,420 115%Dislocated Workers $15,000 $16,718 111%
Placement in Employment or Education Youth (14-21) 72.0% 65.5% 91%
Attainment of Degree or Certificate Youth (14-21) 60.0% 59.3% 99%
Literacy or Numeracy Gains Youth (14-21) 60.5% 59.8% 99%
*Adult Participants include WIA Adults and WIA Self Service
*Adult exiters include WIA Adults and WIA Self Service
Entered Employment Rate
Retention Rate
Average Earnings
Table O - Local Performance
Total Participants Served
City of Los Angeles
The cohort for entered employment rates is October 1, 2012 through September 30, 2013.
The average earnings and retention measures are based on the clients leaving the program between April 1, 2012 and March 31, 2013.
Total exiters include clients leaving the program during the period from April 1, 2013 to March 31, 2014.
The cohort for placement in employment or education and attainment of a degree or certificate measures is October 1, 2012 through September 30, 2013.
Total participants served are clients in the program between July 1, 2013 and June 30, 2014.
22

California WIA Program Year 2013 Annual Report Tables
Local Area Name Adults* 145,497Dislocated Workers 1,734
Youth 4,090ETA Assigned # 6275 Adults* 139,268
Total Exiters Dislocated Workers 926Youth 1,731
Negotiated Actual Performance Level Performance Level Success Rate
Adults 55.0% 80.8% 147%Dislocated Workers 60.0% 84.4% 141%
Adults 67.0% 84.8% 127%Dislocated Workers 71.6% 86.0% 120%
Adults $12,800 $13,903 109%Dislocated Workers $15,119 $16,539 109%
Placement in Employment or Education Youth (14-21) 65.9% 66.4% 101%
Attainment of Degree or Certificate Youth (14-21) 60.0% 69.0% 115%
Literacy or Numeracy Gains Youth (14-21) 57.1% 62.5% 109%
*Adult Participants include WIA Adults and WIA Self Service
*Adult exiters include WIA Adults and WIA Self Service
Entered Employment Rate
Retention Rate
Table O - Local Performance
The average earnings and retention measures are based on the clients leaving the program between April 1, 2012 and March 31, 2013.
The cohort for entered employment rates is October 1, 2012 through September 30, 2013.
The cohort for placement in employment or education and attainment of a degree or certificate measures is October 1, 2012 through September 30, 2013.
Total exiters include clients leaving the program during the period from April 1, 2013 to March 31, 2014.
Total participants served are clients in the program between July 1, 2013 and June 30, 2014.
Average Earnings
Total Participants Served
Los Angeles County WIB
23

California WIA Program Year 2013 Annual Report Tables
Local Area Name Adults* 32,382Dislocated Workers 839
Youth 239ETA Assigned # 6015 Adults* 30,682
Total Exiters Dislocated Workers 537Youth 88
Negotiated Actual Performance Level Performance Level Success Rate
Adults 50.8% 55.6% 109%Dislocated Workers 59.2% 64.6% 109%
Adults 76.9% 80.5% 105%Dislocated Workers 82.0% 86.3% 105%
Adults $13,324 $13,934 105%Dislocated Workers $16,500 $19,163 116%
Placement in Employment or Education Youth (14-21) 72.0% 85.9% 119%
Attainment of Degree or Certificate Youth (14-21) 60.0% 95.4% 159%
Literacy or Numeracy Gains Youth (14-21) 80.0% 94.9% 119%
*Adult Participants include WIA Adults and WIA Self Service
*Adult exiters include WIA Adults and WIA Self Service
Table O - Local Performance
Total Participants Served
Pacific Gateway Workforce Investment Network
Total exiters include clients leaving the program during the period from April 1, 2013 to March 31, 2014.
The cohort for entered employment rates is October 1, 2012 through September 30, 2013.
The average earnings and retention measures are based on the clients leaving the program between April 1, 2012 and March 31, 2013.
Entered Employment Rate
Retention Rate
Average Earnings
Total participants served are clients in the program between July 1, 2013 and June 30, 2014.
The cohort for placement in employment or education and attainment of a degree or certificate measures is October 1, 2012 through September 30, 2013.
24

California WIA Program Year 2013 Annual Report Tables
Local Area Name Adults* 4,131Dislocated Workers 193
Youth 169ETA Assigned # 6220 Adults* 4,016
Total Exiters Dislocated Workers 129Youth 103
Negotiated Actual
Performance Level Performance Level Success RateAdults 55.0% 54.3% 99%
Dislocated Workers 64.5% 73.0% 113%Adults 72.0% 74.4% 103%
Dislocated Workers 82.1% 76.5% 106%Adults $11,500 $12,019 105%
Dislocated Workers $12,500 $14,248 114%Placement in Employment or
Education Youth (14-21) 52.3% 53.0% 101%
Attainment of Degree or Certificate Youth (14-21) 54.5% 66.1% 121%
Literacy or Numeracy Gains Youth (14-21) 51.6% 78.8% 153%
*Adult Participants include WIA Adults and WIA Self Service
*Adult exiters include WIA Adults and WIA Self Service
Table O - Local Performance
Total Participants Served
Madera County Workforce Development Office
Entered Employment Rate
The cohort for entered employment rates is October 1, 2012 through September 30, 2013.
The average earnings and retention measures are based on the clients leaving the program between April 1, 2012 and March 31, 2013.The cohort for placement in employment or education and attainment of a degree or certificate measures is October 1, 2012 through September 30, 2013.
Total exiters include clients leaving the program during the period from April 1, 2013 to March 31, 2014.
Total participants served are clients in the program between July 1, 2013 and June 30, 2014.
Retention Rate
Average Earnings
25
California WIA Program Year 2013 Annual Report Tables
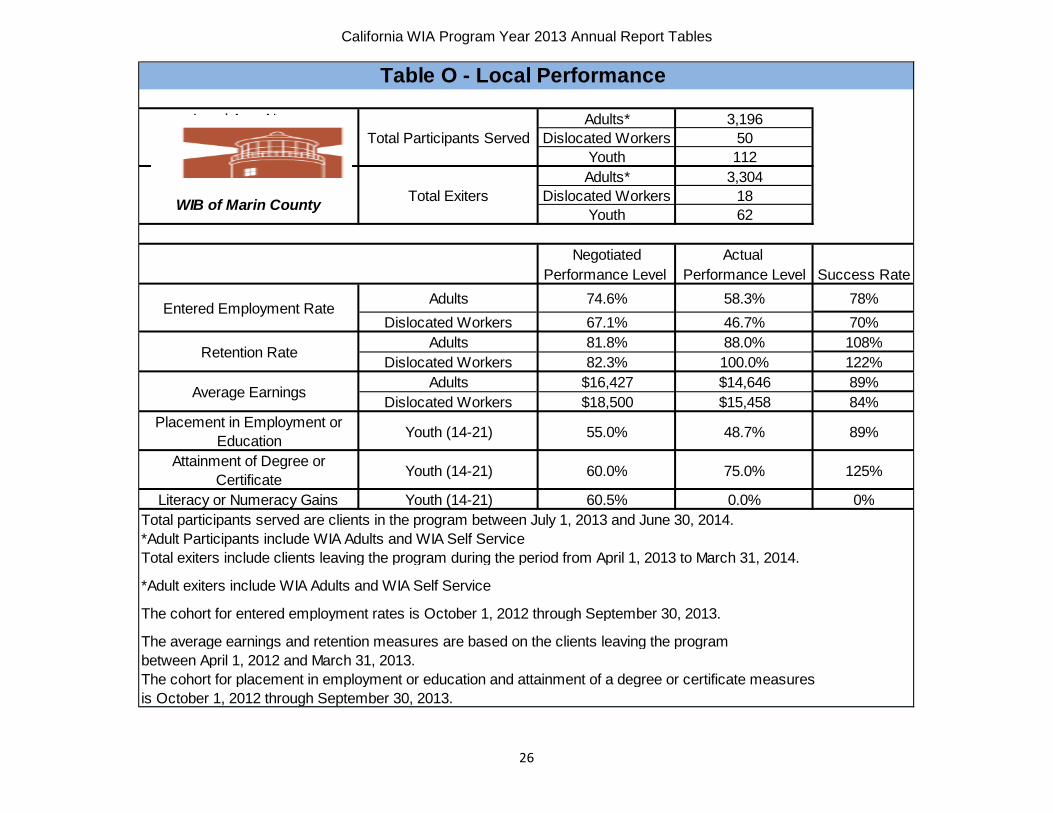
Local Area Name Adults* 3,196Dislocated Workers 50
Youth 112ETA Assigned # 6085 Adults* 3,304
Total Exiters Dislocated Workers 18Youth 62
Negotiated Actual Performance Level Performance Level Success Rate
Adults 74.6% 58.3% 78%Dislocated Workers 67.1% 46.7% 70%
Adults 81.8% 88.0% 108%Dislocated Workers 82.3% 100.0% 122%
Adults $16,427 $14,646 89%Dislocated Workers $18,500 $15,458 84%
Placement in Employment or Education Youth (14-21) 55.0% 48.7% 89%
Attainment of Degree or Certificate Youth (14-21) 60.0% 75.0% 125%
Literacy or Numeracy Gains Youth (14-21) 60.5% 0.0% 0%
*Adult Participants include WIA Adults and WIA Self Service
*Adult exiters include WIA Adults and WIA Self Service
Table O - Local Performance
Total Participants Served
WIB of Marin County
Entered Employment Rate
Retention Rate
Average Earnings
The cohort for placement in employment or education and attainment of a degree or certificate measures is October 1, 2012 through September 30, 2013.
Total participants served are clients in the program between July 1, 2013 and June 30, 2014.
Total exiters include clients leaving the program during the period from April 1, 2013 to March 31, 2014.
The cohort for entered employment rates is October 1, 2012 through September 30, 2013.
The average earnings and retention measures are based on the clients leaving the program between April 1, 2012 and March 31, 2013.
26

California WIA Program Year 2013 Annual Report Tables
Adults* 1,946Dislocated Workers 65
Youth 35ETA Assigned # 6235 Adults* 1,743
Total Exiters Dislocated Workers 41Youth 7
Negotiated Actual Performance Level Performance Level Success Rate
Adults 80.0% 100.0% 125%Dislocated Workers 82.5% 93.8% 114%
Adults 85.0% 100.0% 118%Dislocated Workers 85.0% 90.3% 106%
Adults $15,500 $12,536 81%Dislocated Workers $16,000 $18,331 115%
Placement in Employment or Education Youth (14-21) 67.0% 100.0% 149%
Attainment of Degree or Certificate Youth (14-21) 61.0% 50.0% 82%
Literacy or Numeracy Gains Youth (14-21) 47.0% 50.0% 106%
*Adult Participants include WIA Adults and WIA Self Service
*Adult exiters include WIA Adults and WIA Self Service
Entered Employment Rate
Retention Rate
Average Earnings
Table O - Local Performance
Total Participants Served
Mendocino WIB
The cohort for entered employment rates is October 1, 2012 through September 30, 2013.
The average earnings and retention measures are based on the clients leaving the program between April 1, 2012 and March 31, 2013.
Total exiters include clients leaving the program during the period from April 1, 2013 to March 31, 2014.
Total participants served are clients in the program between July 1, 2013 and June 30, 2014.
The cohort for placement in employment or education and attainment of a degree or certificate measures is October 1, 2012 through September 30, 2013.
27

California WIA Program Year 2013 Annual Report Tables
Local Area Name Adults* 10,931Dislocated Workers 349
Youth 417ETA Assigned # 6090 Adults* 10,484
Total Exiters Dislocated Workers 246Youth 128
Negotiated Actual Performance Level Performance Level Success Rate
Adults 76.0% 76.7% 115%
Dislocated Workers 79.0% 77.8% 98%Adults 81.9% 83.8% 102%
Dislocated Workers 83.5% 84.9% 102%Adults $14,200 $11,850 83%
Dislocated Workers $15,600 $15,609 100%Placement in Employment or
Education Youth (14-21) 74.0% 69.6% 94%
Attainment of Degree or Certificate Youth (14-21) 70.0% 84.0% 120%
Literacy or Numeracy Gains Youth (14-21) 46.8% 36.7% 78%
*Adult Participants include WIA Adults and WIA Self Service
*Adult exiters include WIA Adults and WIA Self Service
Entered Employment Rate
Retention Rate
Table O - Local Performance
The average earnings and retention measures are based on the clients leaving the program between April 1, 2012 and March 31, 2013.
The cohort for entered employment rates is October 1, 2012 through September 30, 2013.
The cohort for placement in employment or education and attainment of a degree or certificate measures is October 1, 2012 through September 30, 2013.
Total exiters include clients leaving the program during the period from April 1, 2013 to March 31, 2014.
Total participants served are clients in the program between July 1, 2013 and June 30, 2014.
Average Earnings
Total Participants Served
Merced County WIB
28

California WIA Program Year 2013 Annual Report Tables
Local Area Name Adults* 5,316Dislocated Workers 137
Youth 63ETA Assigned # 6240 Adults* 5,336
Dislocated Workers 101Youth 33
Negotiated Actual Performance Level Performance Level Success Rate
Adults 69.5% 78.5% 113%Dislocated Workers 77.0% 81.0% 105%
Adults 81.0% 85.1% 105%Dislocated Workers 81.0% 87.2% 108%
Adults $12,000 $13,362 111%Dislocated Workers $15,000 $16,611 111%
Placement in Employment or Education Youth (14-21) 74.0% 76.9% 104%
Attainment of Degree or Certificate Youth (14-21) 62.0% 70.0% 113%
Literacy or Numeracy Gains Youth (14-21) 55.0% 50.0% 91%
*Adult Participants include WIA Adults and WIA Self Service
*Adult exiters include WIA Adults and WIA Self Service
Table O - Local Performance
Total Participants Served
Total ExitersJob Connection of the Mother Lode
Total exiters include clients leaving the program during the period from April 1, 2013 to March 31, 2014.
The cohort for entered employment rates is October 1, 2012 through September 30, 2013.
The average earnings and retention measures are based on the clients leaving the program between April 1, 2012 and March 31, 2013.
Entered Employment Rate
Retention Rate
Average Earnings
Total participants served are clients in the program between July 1, 2013 and June 30, 2014.
The cohort for placement in employment or education and attainment of a degree or certificate measures is October 1, 2012 through September 30, 2013.
29

California WIA Program Year 2013 Annual Report Tables
Local Area Name Adults* 8,032Dislocated Workers 308
Youth 289ETA Assigned # 6095 Adults* 7,853
Total Exiters Dislocated Workers 258Youth 268
Negotiated Actual Performance Level Performance Level Success Rate
Adults 62.1% 74.4% 120%Dislocated Workers 61.8% 74.5% 121%
Adults 74.0% 75.2% 102%Dislocated Workers 75.6% 83.5% 110%
Adults $10,129 $10,581 104%Dislocated Workers $13,122 $19,518 149%
Placement in Employment or Education Youth (14-21) 70.1% 72.4% 103%
Attainment of Degree or Certificate Youth (14-21) 64.3% 83.1% 129%
Literacy or Numeracy Gains Youth (14-21) 61.0% 81.3% 133%
*Adult Participants include WIA Adults and WIA Self Service
*Adult exiters include WIA Adults and WIA Self Service
Table O - Local Performance
Total Participants Served
Monterey County WIB
Entered Employment Rate
The cohort for entered employment rates is October 1, 2012 through September 30, 2013.
The average earnings and retention measures are based on the clients leaving the program between April 1, 2012 and March 31, 2013.The cohort for placement in employment or education and attainment of a degree or certificate measures is October 1, 2012 through September 30, 2013.
Total exiters include clients leaving the program during the period from April 1, 2013 to March 31, 2014.
Total participants served are clients in the program between July 1, 2013 and June 30, 2014.
Retention Rate
Average Earnings
30
California WIA Program Year 2013 Annual Report Tables
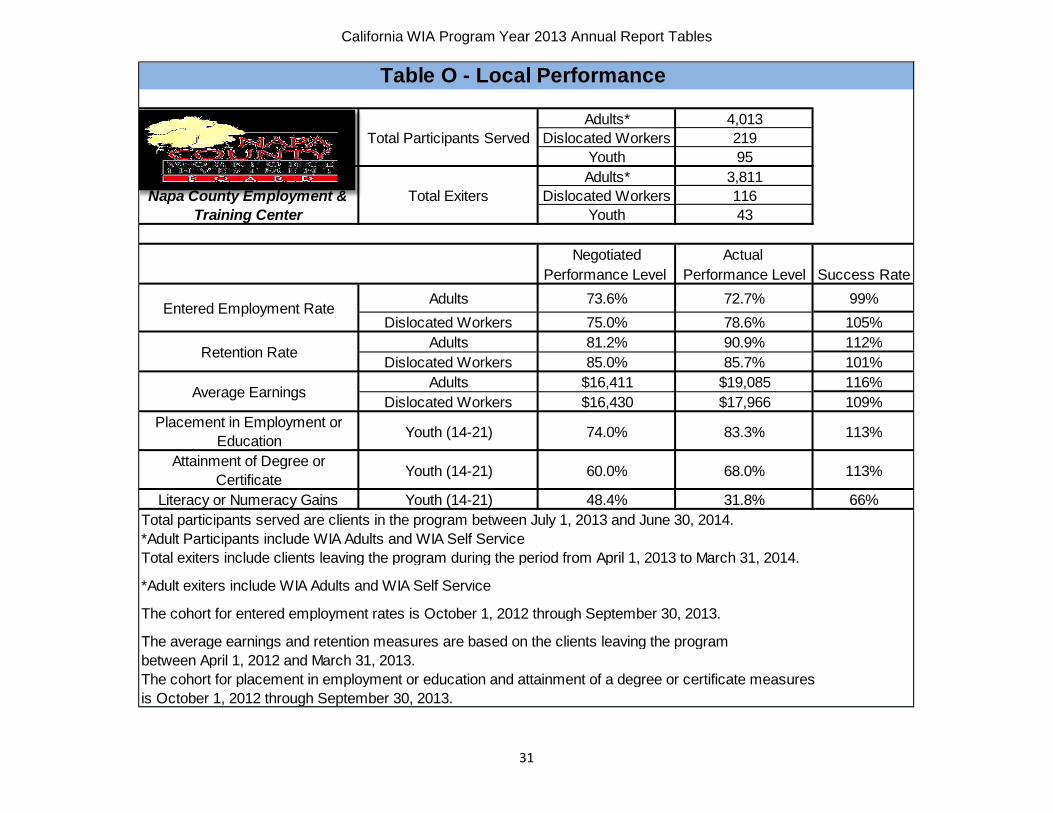
Local Area Name Adults* 4,013Dislocated Workers 219
Youth 95ETA Assigned # 6230 Adults* 3,811
Total Exiters Dislocated Workers 116Youth 43
Negotiated Actual Performance Level Performance Level Success Rate
Adults 73.6% 72.7% 99%Dislocated Workers 75.0% 78.6% 105%
Adults 81.2% 90.9% 112%Dislocated Workers 85.0% 85.7% 101%
Adults $16,411 $19,085 116%Dislocated Workers $16,430 $17,966 109%
Placement in Employment or Education Youth (14-21) 74.0% 83.3% 113%
Attainment of Degree or Certificate Youth (14-21) 60.0% 68.0% 113%
Literacy or Numeracy Gains Youth (14-21) 48.4% 31.8% 66%
*Adult Participants include WIA Adults and WIA Self Service
*Adult exiters include WIA Adults and WIA Self Service
Table O - Local Performance
Total Participants Served
Total participants served are clients in the program between July 1, 2013 and June 30, 2014.
Total exiters include clients leaving the program during the period from April 1, 2013 to March 31, 2014.
The cohort for entered employment rates is October 1, 2012 through September 30, 2013.
The average earnings and retention measures are based on the clients leaving the program
Napa County Employment & Training Center
Entered Employment Rate
Retention Rate
Average Earnings
between April 1, 2012 and March 31, 2013.The cohort for placement in employment or education and attainment of a degree or certificate measures is October 1, 2012 through September 30, 2013.
31
California WIA Program Year 2013 Annual Report Tables
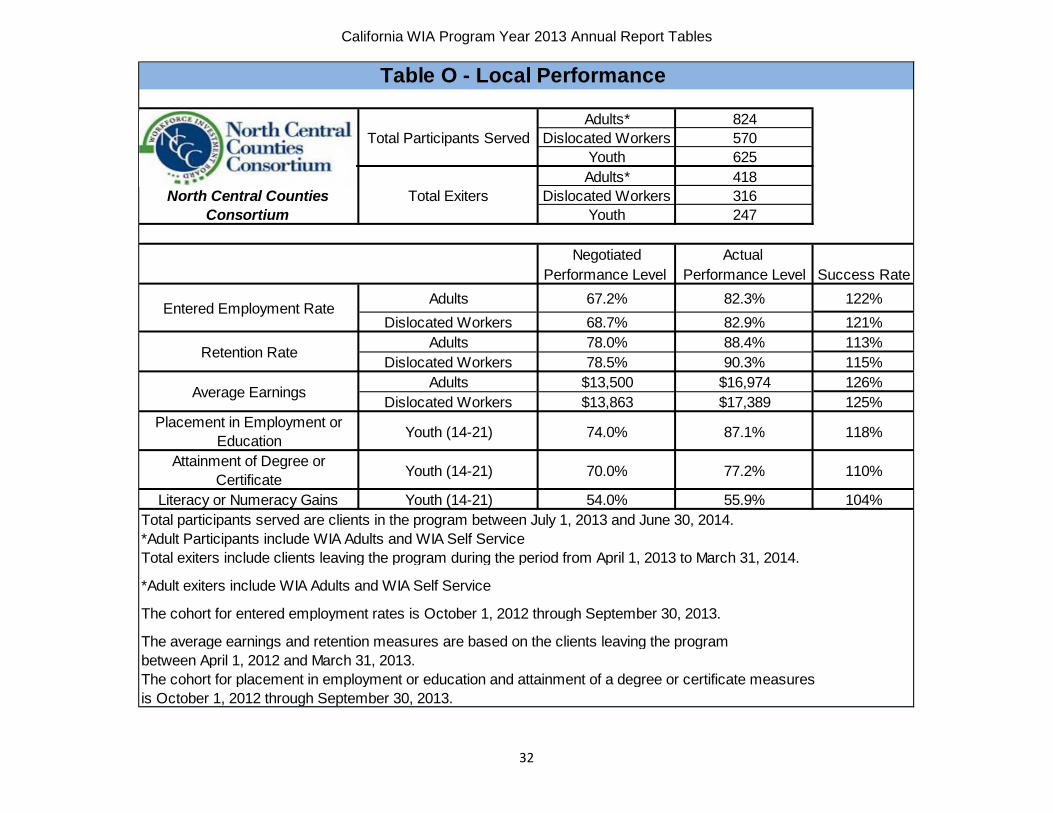
Local Area Name Adults* 824Dislocated Workers 570
Youth 625ETA Assigned # 6245 Adults* 418
Total Exiters Dislocated Workers 316Youth 247
Negotiated Actual Performance Level Performance Level Success Rate
Adults 67.2% 82.3% 122%Dislocated Workers 68.7% 82.9% 121%
Adults 78.0% 88.4% 113%Dislocated Workers 78.5% 90.3% 115%
Adults $13,500 $16,974 126%Dislocated Workers $13,863 $17,389 125%
Placement in Employment or Education Youth (14-21) 74.0% 87.1% 118%
Attainment of Degree or Certificate Youth (14-21) 70.0% 77.2% 110%
Literacy or Numeracy Gains Youth (14-21) 54.0% 55.9% 104%
*Adult Participants include WIA Adults and WIA Self Service
*Adult exiters include WIA Adults and WIA Self Service
Entered Employment Rate
Retention Rate
Average Earnings
Table O - Local Performance
Total Participants Served
North Central Counties Consortium
The cohort for entered employment rates is October 1, 2012 through September 30, 2013.
The average earnings and retention measures are based on the clients leaving the program between April 1, 2012 and March 31, 2013.The cohort for placement in employment or education and attainment of a degree or certificate measures is October 1, 2012 through September 30, 2013.
Total exiters include clients leaving the program during the period from April 1, 2013 to March 31, 2014.
Total participants served are clients in the program between July 1, 2013 and June 30, 2014.
32
California WIA Program Year 2013 Annual Report Tables
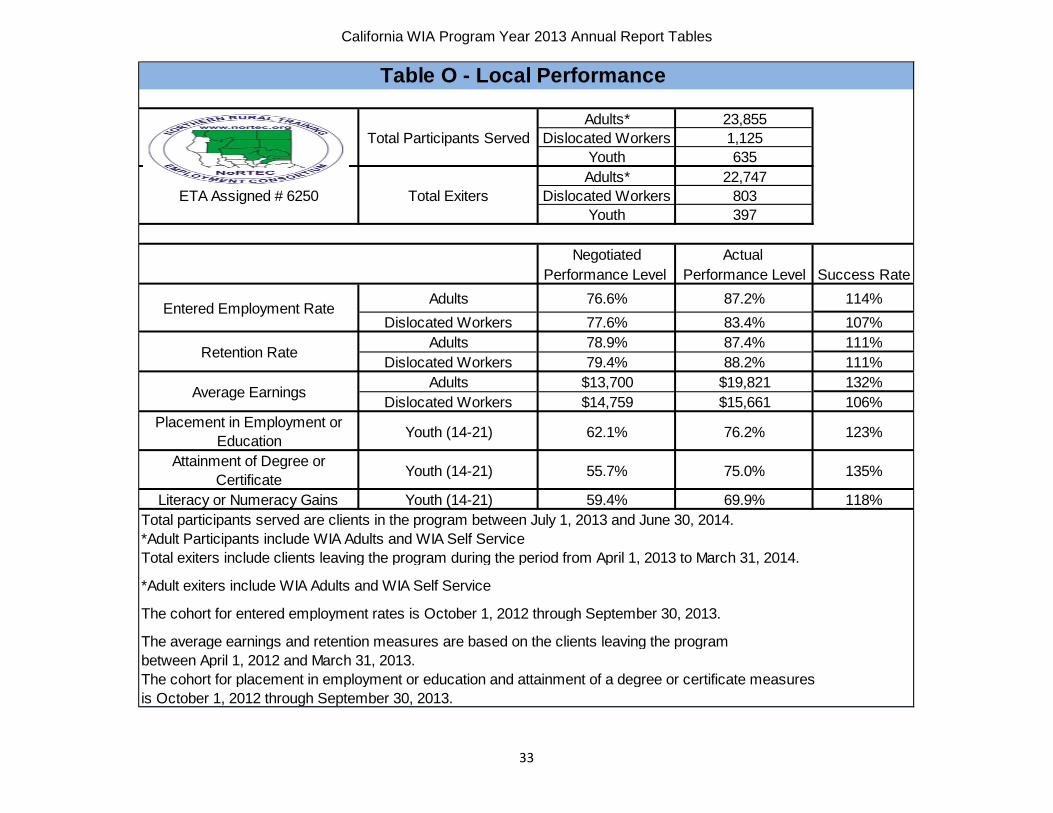
Local Area Name Adults* 23,855Dislocated Workers 1,125
Youth 635Adults* 22,747
ETA Assigned # 6250 Total Exiters Dislocated Workers 803Youth 397
Negotiated Actual Performance Level Performance Level Success Rate
Adults 76.6% 87.2% 114%Dislocated Workers 77.6% 83.4% 107%
Adults 78.9% 87.4% 111%Dislocated Workers 79.4% 88.2% 111%
Adults $13,700 $19,821 132%Dislocated Workers $14,759 $15,661 106%
Placement in Employment or Education Youth (14-21) 62.1% 76.2% 123%
Attainment of Degree or Certificate Youth (14-21) 55.7% 75.0% 135%
Literacy or Numeracy Gains Youth (14-21) 59.4% 69.9% 118%
*Adult Participants include WIA Adults and WIA Self Service
*Adult exiters include WIA Adults and WIA Self Service
Table O - Local Performance
Total participants served are clients in the program between July 1, 2013 and June 30, 2014.
Total exiters include clients leaving the program during the period from April 1, 2013 to March 31, 2014.
The cohort for entered employment rates is October 1, 2012 through September 30, 2013.
The average earnings and retention measures are based on the clients leaving the program
Total Participants Served
Entered Employment Rate
Retention Rate
Average Earnings
between April 1, 2012 and March 31, 2013.The cohort for placement in employment or education and attainment of a degree or certificate measures is October 1, 2012 through September 30, 2013.
33
California WIA Program Year 2013 Annual Report Tables
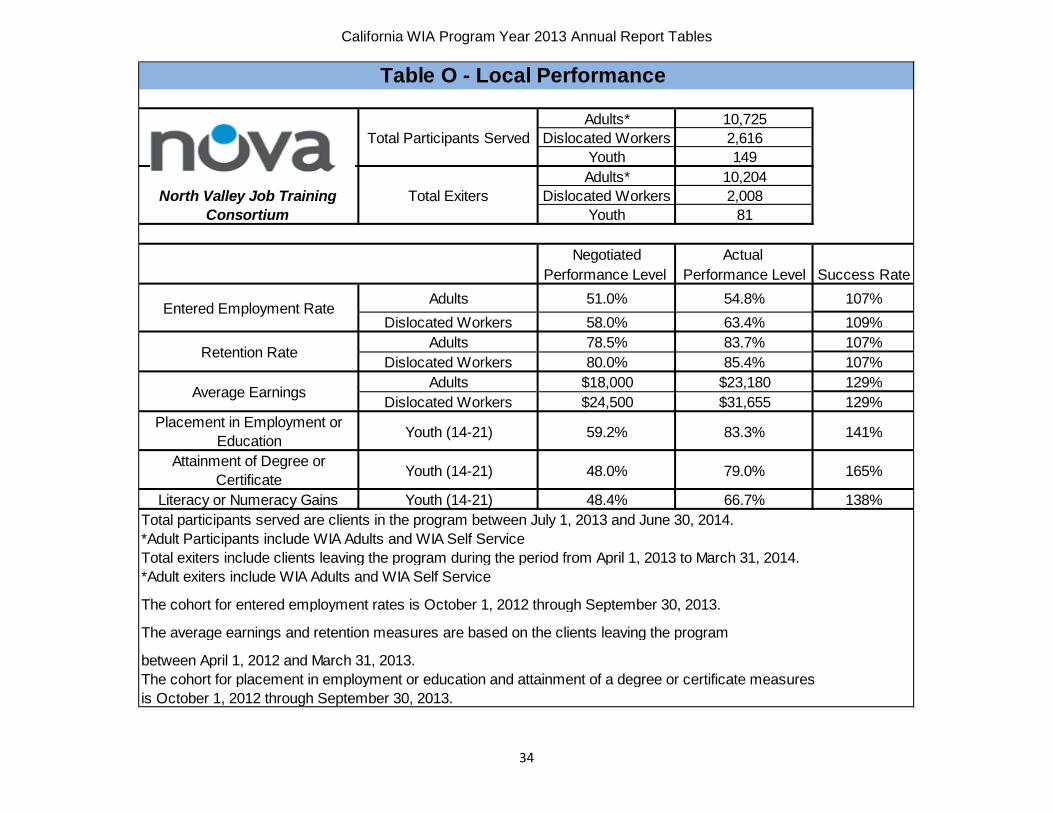
Local Area Name Adults* 10,725Dislocated Workers 2,616
Youth 149ETA Assigned # 6005 Adults* 10,204
Total Exiters Dislocated Workers 2,008Youth 81
Negotiated Actual Performance Level Performance Level Success Rate
Adults 51.0% 54.8% 107%Dislocated Workers 58.0% 63.4% 109%
Adults 78.5% 83.7% 107%Dislocated Workers 80.0% 85.4% 107%
Adults $18,000 $23,180 129%Dislocated Workers $24,500 $31,655 129%
Placement in Employment or Education Youth (14-21) 59.2% 83.3% 141%
Attainment of Degree or Certificate Youth (14-21) 48.0% 79.0% 165%
Literacy or Numeracy Gains Youth (14-21) 48.4% 66.7% 138%
*Adult Participants include WIA Adults and WIA Self Service
*Adult exiters include WIA Adults and WIA Self Service
Table O - Local Performance
Total Participants Served
North Valley Job Training Consortium
Total exiters include clients leaving the program during the period from April 1, 2013 to March 31, 2014.
The cohort for entered employment rates is October 1, 2012 through September 30, 2013.
The average earnings and retention measures are based on the clients leaving the program
between April 1, 2012 and March 31, 2013.
Entered Employment Rate
Retention Rate
Average Earnings
Total participants served are clients in the program between July 1, 2013 and June 30, 2014.
The cohort for placement in employment or education and attainment of a degree or certificate measures is October 1, 2012 through September 30, 2013.
34

California WIA Program Year 2013 Annual Report Tables
Local Area Name Adults* 16,069Dislocated Workers 712
Youth 609ETA Assigned # 6025 Adults* 14,665
Total Exiters Dislocated Workers 216Youth 160
Negotiated Actual Performance Level Performance Level Success Rate
Adults 68.0% 67.3% 99%Dislocated Workers 68.1% 76.3% 112%
Adults 78.0% 81.3% 104%Dislocated Workers 82.6% 85.0% 103%
Adults $11,800 $11,087 94%Dislocated Workers $16,370 $16,084 98%
Placement in Employment or Education Youth (14-21) 59.2% 46.3% 78%
Attainment of Degree or Certificate Youth (14-21) 55.0% 24.3% 44%
Literacy or Numeracy Gains Youth (14-21) 25.0% 7.4% 30%
*Adult Participants include WIA Adults and WIA Self Service
*Adult exiters include WIA Adults and WIA Self Service
Average Earnings
Table O - Local Performance
Total Participants Served
City of Oakland WIB
Retention Rate
The cohort for entered employment rates is October 1, 2012 through September 30, 2013.
The average earnings and retention measures are based on the clients leaving the program between April 1, 2012 and March 31, 2013.
Total exiters include clients leaving the program during the period from April 1, 2013 to March 31, 2014.
Total participants served are clients in the program between July 1, 2013 and June 30, 2014.
Entered Employment Rate
The cohort for placement in employment or education and attainment of a degree or certificate measures is October 1, 2012 through September 30, 2013.
35

California WIA Program Year 2013 Annual Report Tables
Local Area Name Adults* 12,556Dislocated Workers 1,876
Youth 1,190ETA Assigned # 6270 Adults* 11,580
Total Exiters Dislocated Workers 1044Youth 732
Negotiated Actual Performance Level Performance Level Success Rate
Adults 78.2% 80.7% 103%Dislocated Workers 80.0% 86.9% 109%
Adults 82.3% 84.9% 103%Dislocated Workers 86.0% 90.3% 105%
Adults $15,841 $16,040 101%Dislocated Workers $19,581 $21,500 110%
Placement in Employment or Education Youth (14-21) 70.8% 75.8% 107%
Attainment of Degree or Certificate Youth (14-21) 51.7% 80.4% 156%
Literacy or Numeracy Gains Youth (14-21) 68.2% 77.3% 113%
*Adult Participants include WIA Adults and WIA Self Service
*Adult exiters include WIA Adults and WIA Self Service
Average Earnings
Table O - Local Performance
Total Participants Served
Total participants served are clients in the program between July 1, 2013 and June 30, 2014.
Total exiters include clients leaving the program during the period from April 1, 2013 to March 31, 2014.
The cohort for entered employment rates is October 1, 2012 through September 30, 2013.
The average earnings and retention measures are based on the clients leaving the program
Orange County WIB
Entered Employment Rate
Retention Rate
between April 1, 2012 and March 31, 2013.The cohort for placement in employment or education and attainment of a degree or certificate measures is October 1, 2012 through September 30, 2013.
36

California WIA Program Year 2013 Annual Report Tables
Local Area Name Adults* 5,124Dislocated Workers 102
Youth 74ETA Assigned # 6055 Adults* 4,585
Total Exiters Dislocated Workers 48Youth 40
Negotiated Actual Performance Level Performance Level Success Rate
Adults 73.4% 86.1% 117%Dislocated Workers 76.6% 91.7% 120%
Adults 87.5% 84.6% 97%Dislocated Workers 87.3% 86.4% 99%
Adults $15,100 $15,872 105%Dislocated Workers $18,200 $19,988 110%
Placement in Employment or Education Youth (14-21) 70.0% 59.1% 84%
Attainment of Degree or Certificate Youth (14-21) 42.7% 34.8% 81%
Literacy or Numeracy Gains Youth (14-21) 33.0% 20.0% 61%
*Adult Participants include WIA Adults and WIA Self Service
*Adult exiters include WIA Adults and WIA Self Service
Entered Employment Rate
Retention Rate
Average Earnings
Table O - Local Performance
Total Participants Served
City of Richmond WIB
Total exiters include clients leaving the program during the period from April 1, 2013 to March 31, 2014.
Total participants served are clients in the program between July 1, 2013 and June 30, 2014.
The cohort for placement in employment or education and attainment of a degree or certificate measures is October 1, 2012 through September 30, 2013.
The cohort for entered employment rates is October 1, 2012 through September 30, 2013.
The average earnings and retention measures are based on the clients leaving the program between April 1, 2012 and March 31, 2013.
37

California WIA Program Year 2013 Annual Report Tables
Adults* 48,082Dislocated Workers 1,749
Youth 1,025ETA Assigned # 6145 Adults* 47,459
Total Exiters Dislocated Workers 1,172Youth 502
Negotiated Actual Performance Level Performance Level Success Rate
Adults 50.7% 51.1% 101%Dislocated Workers 57.6% 60.6% 105%
Adults 74.0% 78.4% 106%Dislocated Workers 75.0% 83.9% 112%
Adults $10,776 $12,444 115%Dislocated Workers $13,748 $15,208 111%
Placement in Employment or Education Youth (14-21) 45.0% 66.4% 148%
Attainment of Degree or Certificate Youth (14-21) 54.8% 81.7% 149%
Literacy or Numeracy Gains Youth (14-21) 65.0% 77.2% 119%
*Adult Participants include WIA Adults and WIA Self Service
*Adult exiters include WIA Adults and WIA Self Service
Average Earnings
Total Participants Served
Riverside County Economic Development Agency
Entered Employment Rate
Retention Rate
The average earnings and retention measures are based on the clients leaving the program between April 1, 2012 and March 31, 2013.
The cohort for entered employment rates is October 1, 2012 through September 30, 2013.
Total exiters include clients leaving the program during the period from April 1, 2013 to March 31, 2014.
The cohort for placement in employment or education and attainment of a degree or certificate measures is October 1, 2012 through September 30, 2013.
Total participants served are clients in the program between July 1, 2013 and June 30, 2014.
Table O - Local Performance
38

California WIA Program Year 2013 Annual Report Tables
Local Area Name Adults* 44,625Dislocated Workers 1,203
Youth 580ETA Assigned # 6170 Adults* 42,838
Total Exiters Dislocated Workers 582Youth 530
Negotiated Actual Performance Level Performance Level Success Rate
Adults 51.0% 64.6% 127%Dislocated Workers 57.6% 76.4% 133%
Adults 78.0% 81.5% 104%Dislocated Workers 79.7% 87.5% 110%
Adults $12,177 $14,336 118%Dislocated Workers $15,500 $19,446 125%
Placement in Employment or Education Youth (14-21) 64.3% 78.0% 121%
Attainment of Degree or Certificate Youth (14-21) 60.5% 81.3% 134%
Literacy or Numeracy Gains Youth (14-21) 55.0% 66.9% 122%
*Adult Participants include WIA Adults and WIA Self Service
*Adult exiters include WIA Adults and WIA Self Service
Average Earnings
Table O - Local Performance
Total Participants Served
Sacramento Works, Inc.
Total exiters include clients leaving the program during the period from April 1, 2013 to March 31, 2014.
The cohort for entered employment rates is October 1, 2012 through September 30, 2013.
The average earnings and retention measures are based on the clients leaving the program between April 1, 2012 and March 31, 2013.
is October 1, 2012 through September 30, 2013.
Total participants served are clients in the program between July 1, 2013 and June 30, 2014.
The cohort for placement in employment or education and attainment of a degree or certificate measures
Entered Employment Rate
Retention Rate
39

California WIA Program Year 2013 Annual Report Tables
Local Area Name Adults* 6,925Dislocated Workers 246
Youth 136ETA Assigned # 6260 Adults* 6,508
Total Exiters Dislocated Workers 200Youth 109
Negotiated Actual Performance Level Performance Level Success Rate
Adults 64.0% 77.6% 121%Dislocated Workers 65.0% 70.8% 109%
Adults 82.0% 78.9% 96%Dislocated Workers 85.0% 85.5% 101%
Adults $12,000 $12,164 101%Dislocated Workers $14,750 $14,376 97%
Placement in Employment or Education Youth (14-21) 74.0% 72.0% 97%
Attainment of Degree or Certificate Youth (14-21) 65.0% 86.0% 132%
Literacy or Numeracy Gains Youth (14-21) 67.0% 83.1% 124%
*Adult Participants include WIA Adults and WIA Self Service
*Adult exiters include WIA Adults and WIA Self Service
Total Participants Served
City of Santa Ana
Table O - Local Performance
The cohort for entered employment rates is October 1, 2012 through September 30, 2013.
The average earnings and retention measures are based on the clients leaving the program between April 1, 2012 and March 31, 2013.
Entered Employment Rate
Retention Rate
Average Earnings
Total participants served are clients in the program between July 1, 2013 and June 30, 2014.
Total exiters include clients leaving the program during the period from April 1, 2013 to March 31, 2014.
The cohort for placement in employment or education and attainment of a degree or certificate measures is October 1, 2012 through September 30, 2013.
40
California WIA Program Year 2013 Annual Report Tables
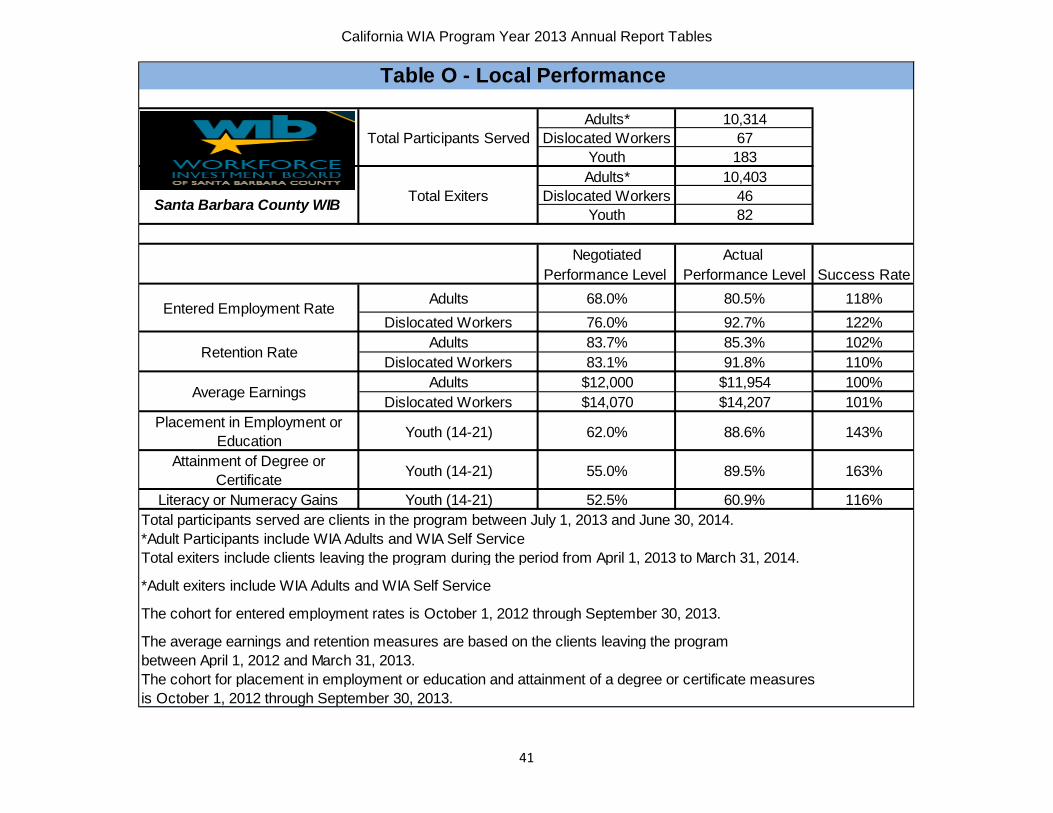
Local Area Name Adults* 10,314Dislocated Workers 67
Youth 183ETA Assigned # 6105 Adults* 10,403
Total Exiters Dislocated Workers 46Youth 82
Negotiated Actual Performance Level Performance Level Success Rate
Adults 68.0% 80.5% 118%Dislocated Workers 76.0% 92.7% 122%
Adults 83.7% 85.3% 102%Dislocated Workers 83.1% 91.8% 110%
Adults $12,000 $11,954 100%Dislocated Workers $14,070 $14,207 101%
Placement in Employment or Education Youth (14-21) 62.0% 88.6% 143%
Attainment of Degree or Certificate Youth (14-21) 55.0% 89.5% 163%
Literacy or Numeracy Gains Youth (14-21) 52.5% 60.9% 116%
*Adult Participants include WIA Adults and WIA Self Service
*Adult exiters include WIA Adults and WIA Self Service
Table O - Local Performance
Average Earnings
Total Participants Served
Santa Barbara County WIB
Entered Employment Rate
Retention Rate
The average earnings and retention measures are based on the clients leaving the program between April 1, 2012 and March 31, 2013.The cohort for placement in employment or education and attainment of a degree or certificate measures is October 1, 2012 through September 30, 2013.
Total exiters include clients leaving the program during the period from April 1, 2013 to March 31, 2014.
Total participants served are clients in the program between July 1, 2013 and June 30, 2014.
The cohort for entered employment rates is October 1, 2012 through September 30, 2013.
41
California WIA Program Year 2013 Annual Report Tables
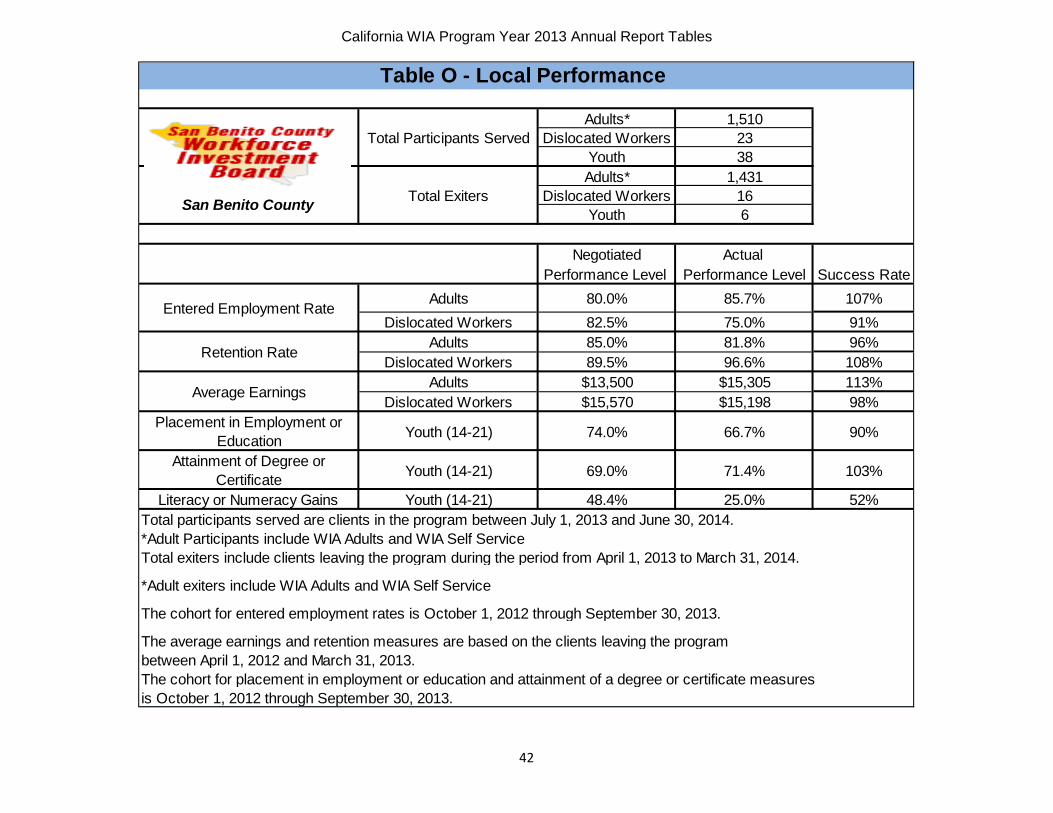
Adults* 1,510Dislocated Workers 23
Youth 38ETA Assigned # 6225 Adults* 1,431
Total Exiters Dislocated Workers 16Youth 6
Negotiated Actual Performance Level Performance Level Success Rate
Adults 80.0% 85.7% 107%Dislocated Workers 82.5% 75.0% 91%
Adults 85.0% 81.8% 96%Dislocated Workers 89.5% 96.6% 108%
Adults $13,500 $15,305 113%Dislocated Workers $15,570 $15,198 98%
Placement in Employment or Education Youth (14-21) 74.0% 66.7% 90%
Attainment of Degree or Certificate Youth (14-21) 69.0% 71.4% 103%
Literacy or Numeracy Gains Youth (14-21) 48.4% 25.0% 52%
*Adult Participants include WIA Adults and WIA Self Service
*Adult exiters include WIA Adults and WIA Self Service
Table O - Local Performance
Total Participants Served
San Benito County
Total exiters include clients leaving the program during the period from April 1, 2013 to March 31, 2014.
The cohort for entered employment rates is October 1, 2012 through September 30, 2013.
The average earnings and retention measures are based on the clients leaving the program between April 1, 2012 and March 31, 2013.
Entered Employment Rate
Retention Rate
Average Earnings
The cohort for placement in employment or education and attainment of a degree or certificate measures is October 1, 2012 through September 30, 2013.
Total participants served are clients in the program between July 1, 2013 and June 30, 2014.
42

California WIA Program Year 2013 Annual Report Tables
Local Area Name Adults* 25,084Dislocated Workers 68
Youth 136ETA Assigned # 6150 Adults* 24,793
Total Exiters Dislocated Workers 17Youth 63
Negotiated Actual Performance Level Performance Level Success Rate
Adults 77.0% 85.0% 110%Dislocated Workers 82.5% 96.3% 117%
Adults 86.0% 95.0% 110%Dislocated Workers 85.0% 86.7% 102%
Adults $11,300 $17,946 159%Dislocated Workers $13,500 $16,299 121%
Placement in Employment or Education Youth (14-21) 74.0% 79.7% 108%
Attainment of Degree or Certificate Youth (14-21) 60.0% 98.5% 164%
Literacy or Numeracy Gains Youth (14-21) 63.0% 78.3% 124%
*Adult Participants include WIA Adults and WIA Self Service
*Adult exiters include WIA Adults and WIA Self Service
Entered Employment Rate
Retention Rate
Average Earnings
Table O - Local Performance
Total Participants Served
San Bernardino City Employment & Training
The cohort for entered employment rates is October 1, 2012 through September 30, 2013.
The average earnings and retention measures are based on the clients leaving the program between April 1, 2012 and March 31, 2013.The cohort for placement in employment or education and attainment of a degree or certificate measures is October 1, 2012 through September 30, 2013.
Total exiters include clients leaving the program during the period from April 1, 2013 to March 31, 2014.
Total participants served are clients in the program between July 1, 2013 and June 30, 2014.
43

California WIA Program Year 2013 Annual Report Tables
Local Area Name Adults* 31,503Dislocated Workers 1,911
Youth 636ETA Assigned # 6155 Adults* 28,752
Total Exiters Dislocated Workers 2,049Youth 507
Negotiated Actual Performance Level Performance Level Success Rate
Adults 50.7% 51.8% 102%Dislocated Workers 57.6% 57.2% 99%
Adults 74.7% 80.9% 108%Dislocated Workers 79.9% 84.6% 106%
Adults $12,780 $13,135 103%Dislocated Workers $12,500 $15,958 128%
Placement in Employment or Education Youth (14-21) 68.0% 58.0% 85%
Attainment of Degree or Certificate Youth (14-21) 53.5% 80.6% 151%
Literacy or Numeracy Gains Youth (14-21) 60.5% 57.1% 94%
*Adult Participants include WIA Adults and WIA Self Service
*Adult exiters include WIA Adults and WIA Self Service
Table O - Local Performance
Average Earnings
Total Participants Served
San Bernardino County Jobs & Employment Services
Entered Employment Rate
Retention Rate
The average earnings and retention measures are based on the clients leaving the program between April 1, 2012 and March 31, 2013.
The cohort for entered employment rates is October 1, 2012 through September 30, 2013.
Total exiters include clients leaving the program during the period from April 1, 2013 to March 31, 2014.
The cohort for placement in employment or education and attainment of a degree or certificate measures is October 1, 2012 through September 30, 2013.
Total participants served are clients in the program between July 1, 2013 and June 30, 2014.
44

California WIA Program Year 2013 Annual Report Tables
Local Area Name Adults* 2,668Dislocated Workers 466
Youth 429ETA Assigned # 6045 Adults* 2,511
Total Exiters Dislocated Workers 147Youth 178
Negotiated Actual Performance Level Performance Level Success Rate
Adults 80.0% 94.0% 118%Dislocated Workers 82.5% 88.9% 108%
Adults 85.0% 82.7% 97%Dislocated Workers 87.0% 87.3% 100%
Adults $11,450 $11,851 104%Dislocated Workers $15,500 $19,402 125%
Placement in Employment or Education Youth (14-21) 72.0% 89.4% 124%
Attainment of Degree or Certificate Youth (14-21) 65.0% 87.6% 135%
Literacy or Numeracy Gains Youth (14-21) 48.0% 71.6% 149%
*Adult Participants include WIA Adults and WIA Self Service
*Adult exiters include WIA Adults and WIA Self Service
Table O - Local Performance
Total Participants Served
South Bay WIB
Total exiters include clients leaving the program during the period from April 1, 2013 to March 31, 2014.
The cohort for entered employment rates is October 1, 2012 through September 30, 2013.
The average earnings and retention measures are based on the clients leaving the program between April 1, 2012 and March 31, 2013.
Entered Employment Rate
Retention Rate
Average Earnings
The cohort for placement in employment or education and attainment of a degree or certificate measures is October 1, 2012 through September 30, 2013.
Total participants served are clients in the program between July 1, 2013 and June 30, 2014.
45

California WIA Program Year 2013 Annual Report Tables
Local Area Name Adults* 16,843Dislocated Workers 209
Youth 151ETA Assigned # 6110 Adults* 22,564
Total Exiters Dislocated Workers 158Youth 125
Negotiated Actual Performance Level Performance Level Success Rate
Adults 74.7% 87.0% 116%Dislocated Workers 72.7% 73.6% 101%
Adults 83.0% 87.2% 105%Dislocated Workers 86.0% 86.8% 101%
Adults $15,000 $16,449 110%Dislocated Workers $14,500 $17,177 118%
Placement in Employment or Education Youth (14-21) 70.5% 79.3% 112%
Attainment of Degree or Certificate Youth (14-21) 70.0% 81.2% 116%
Literacy or Numeracy Gains Youth (14-21) 75.0% 94.3% 126%
*Adult Participants include WIA Adults and WIA Self Service
*Adult exiters include WIA Adults and WIA Self Service
Average Earnings
Table O - Local Performance
Total Participants Served
Santa Cruz County WIB
The cohort for entered employment rates is October 1, 2012 through September 30, 2013.
The average earnings and retention measures are based on the clients leaving the program between April 1, 2012 and March 31, 2013.
Total exiters include clients leaving the program during the period from April 1, 2013 to March 31, 2014.
The cohort for placement in employment or education and attainment of a degree or certificate measures is October 1, 2012 through September 30, 2013.
Total participants served are clients in the program between July 1, 2013 and June 30, 2014.
Entered Employment Rate
Retention Rate
46

California WIA Program Year 2013 Annual Report Tables
Adults* 73,869Dislocated Workers 3045
Youth 1,733ETA Assigned # 6135 Adults* 72,568
Total Exiters Dislocated Workers 1712Youth 875
Negotiated Actual Performance Level Performance Level Success Rate
Adults 51.6% 67.1% 130%Dislocated Workers 61.0% 75.4% 124%
Adults 78.5% 83.7% 107%Dislocated Workers 79.7% 87.3% 110%
Adults $12,500 $15,087 121%Dislocated Workers $16,700 $19,244 115%
Placement in Employment or Education Youth (14-21) 72.0% 58.6% 81%
Attainment of Degree or Certificate Youth (14-21) 60.0% 66.2% 110%
Literacy or Numeracy Gains Youth (14-21) 54.5% 73.3% 134%
*Adult Participants include WIA Adults and WIA Self Service
*Adult exiters include WIA Adults and WIA Self Service
Entered Employment Rate
Retention Rate
Table O - Local Performance
San Diego Workforce Partnership, Inc.
The average earnings and retention measures are based on the clients leaving the program
between April 1, 2012 and March 31, 2013.
The cohort for entered employment rates is October 1, 2012 through September 30, 2013.
The cohort for placement in employment or education and attainment of a degree or certificate measures is October 1, 2012 through September 30, 2013.
Total exiters include clients leaving the program during the period from April 1, 2013 to March 31, 2014.
Total participants served are clients in the program between July 1, 2013 and June 30, 2014.
Average Earnings
Total Participants Served
47

California WIA Program Year 2013 Annual Report Tables
Local Area Name Adults* 10,255Dislocated Workers 300
Youth 264ETA Assigned # 6280 Adults* 9,759
Total Exiters Dislocated Workers 108Youth 104
Negotiated Actual Performance Level Performance Level Success Rate
Adults 76.8% 75.5% 98%Dislocated Workers 76.7% 72.2% 94%
Adults 81.7% 90.8% 111%Dislocated Workers 86.9% 95.6% 110%
Adults $14,500 $23,169 160%Dislocated Workers $16,500 $15,009 91%
Placement in Employment or Education Youth (14-21) 67.7% 57.7% 94%
Attainment of Degree or Certificate Youth (14-21) 34.3% 51.6% 150%
Literacy or Numeracy Gains Youth (14-21) 50.5% 47.4% 94%
*Adult Participants include WIA Adults and WIA Self Service
*Adult exiters include WIA Adults and WIA Self Service
Table O - Local Performance
Total Participants Served
Southeast LA County WIB
Total exiters include clients leaving the program during the period from April 1, 2013 to March 31, 2014.
The cohort for entered employment rates is October 1, 2012 through September 30, 2013.
The average earnings and retention measures are based on the clients leaving the program between April 1, 2012 and March 31, 2013.
Entered Employment Rate
Retention Rate
Average Earnings
Total participants served are clients in the program between July 1, 2013 and June 30, 2014.
The cohort for placement in employment or education and attainment of a degree or certificate measures is October 1, 2012 through September 30, 2013.
48

California WIA Program Year 2013 Annual Report Tables
Local Area Name Adults* 16,442Dislocated Workers 397
Youth 367ETA Assigned # 6050 Adults* 15,491
Dislocated Workers 379Youth 265
Negotiated Actual Performance Level Performance Level Success Rate
Adults 73.2% 74.3% 102%Dislocated Workers 75.0% 74.0% 99%
Adults 80.0% 85.4% 107%Dislocated Workers 88.0% 87.6% 100%
Adults $12,950 $11,574 89%Dislocated Workers $16,500 $18,698 113%
Placement in Employment or Education Youth (14-21) 50.0% 49.1% 98%
Attainment of Degree or Certificate Youth (14-21) 40.0% 48.1% 120%
Literacy or Numeracy Gains Youth (14-21) 35.0% 23.1% 66%
*Adult Participants include WIA Adults and WIA Self Service
*Adult exiters include WIA Adults and WIA Self Service
Entered Employment Rate
Retention Rate
Average Earnings
Table O - Local Performance
Total Participants Served
Total ExitersSan Francisco WIB
The average earnings and retention measures are based on the clients leaving the program between April 1, 2012 and March 31, 2013.The cohort for placement in employment or education and attainment of a degree or certificate measures is October 1, 2012 through September 30, 2013.
Total exiters include clients leaving the program during the period from April 1, 2013 to March 31, 2014.
Total participants served are clients in the program between July 1, 2013 and June 30, 2014.
The cohort for entered employment rates is October 1, 2012 through September 30, 2013.
49
California WIA Program Year 2013 Annual Report Tables
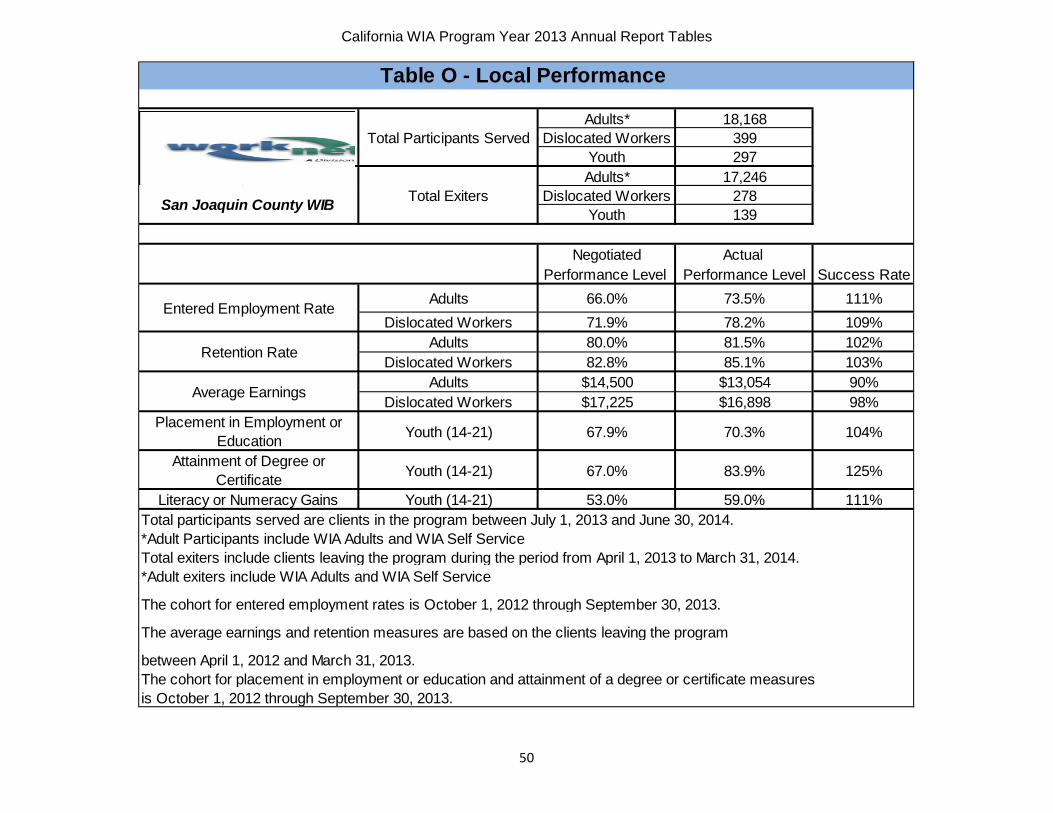
Local Area Name Adults* 18,168Dislocated Workers 399
Youth 297ETA Assigned # 6175 Adults* 17,246
Total Exiters Dislocated Workers 278Youth 139
Negotiated Actual Performance Level Performance Level Success Rate
Adults 66.0% 73.5% 111%Dislocated Workers 71.9% 78.2% 109%
Adults 80.0% 81.5% 102%Dislocated Workers 82.8% 85.1% 103%
Adults $14,500 $13,054 90%Dislocated Workers $17,225 $16,898 98%
Placement in Employment or Education Youth (14-21) 67.9% 70.3% 104%
Attainment of Degree or Certificate Youth (14-21) 67.0% 83.9% 125%
Literacy or Numeracy Gains Youth (14-21) 53.0% 59.0% 111%
*Adult Participants include WIA Adults and WIA Self Service
*Adult exiters include WIA Adults and WIA Self Service
Table O - Local Performance
Average Earnings
Total Participants Served
San Joaquin County WIB
Entered Employment Rate
Retention Rate
The average earnings and retention measures are based on the clients leaving the program
between April 1, 2012 and March 31, 2013.
The cohort for entered employment rates is October 1, 2012 through September 30, 2013.
Total exiters include clients leaving the program during the period from April 1, 2013 to March 31, 2014.
The cohort for placement in employment or education and attainment of a degree or certificate measures is October 1, 2012 through September 30, 2013.
Total participants served are clients in the program between July 1, 2013 and June 30, 2014.
50

California WIA Program Year 2013 Annual Report Tables
Local Area Name Adults* 15,978Dislocated Workers 1,555
Youth 311ETA Assigned # 6290 Adults* 10,455
Total Exiters Dislocated Workers 1,388Youth 300
Negotiated Actual Performance Level Performance Level Success Rate
Adults 50.7% 53.3% 105%Dislocated Workers 57.6% 60.6% 105%
Adults 78.7% 82.1% 104%Dislocated Workers 82.4% 84.7% 103%
Adults $13,724 $15,042 110%Dislocated Workers $19,460 $22,193 114%
Placement in Employment or Education Youth (14-21) 67.% 65.1% 97%
Attainment of Degree or Certificate Youth (14-21) 41.4% 79.0% 191%
Literacy or Numeracy Gains Youth (14-21) 60.5% 63.3% 105%
*Adult Participants include WIA Adults and WIA Self Service
*Adult exiters include WIA Adults and WIA Self Service
Average Earnings
Table O - Local Performance
Total Participants Served
San Jose/Silicon Valley WIB
Total exiters include clients leaving the program during the period from April 1, 2013 to March 31, 2014.
The cohort for entered employment rates is October 1, 2012 through September 30, 2013.
The average earnings and retention measures are based on the clients leaving the program between April 1, 2012 and March 31, 2013.
is October 1, 2012 through September 30, 2013.
Total participants served are clients in the program between July 1, 2013 and June 30, 2014.
The cohort for placement in employment or education and attainment of a degree or certificate measures
Entered Employment Rate
Retention Rate
51

California WIA Program Year 2013 Annual Report Tables
Adults* 1,380Dislocated Workers 215
Youth 127ETA Assigned # 6190 Adults* 1,272
Total Exiters Dislocated Workers 212Youth 49
Negotiated Actual Performance Level Performance Level Success Rate
Adults 76.5% 58.6% 77%Dislocated Workers 82.5% 64.0% 78%
Adults 80.9% 77.2% 95%Dislocated Workers 89.6% 87.1% 97%
Adults $12,950 $13,012 100%Dislocated Workers $15,975 $14,805 93%
Placement in Employment or Education Youth (14-21) 67.1% 61.2% 91%
Attainment of Degree or Certificate Youth (14-21) 68.7% 74.5% 108%
Literacy or Numeracy Gains Youth (14-21) 78.7% 95.0% 121%
*Adult Participants include WIA Adults and WIA Self Service
*Adult exiters include WIA Adults and WIA Self Service
Total Participants Served
San Luis Obispo County WIB
Table O - Local Performance
The cohort for entered employment rates is October 1, 2012 through September 30, 2013.
The average earnings and retention measures are based on the clients leaving the program between April 1, 2012 and March 31, 2013.
Entered Employment Rate
Retention Rate
Average Earnings
Total participants served are clients in the program between July 1, 2013 and June 30, 2014.
Total exiters include clients leaving the program during the period from April 1, 2013 to March 31, 2014.
The cohort for placement in employment or education and attainment of a degree or certificate measures is October 1, 2012 through September 30, 2013.
52

California WIA Program Year 2013 Annual Report Tables
Local Area Name Adults* 12,065Dislocated Workers 292
Youth 219ETA Assigned # 6100 Adults* 10,982
Total Exiters Dislocated Workers 194Youth 104
Negotiated Actual Performance Level Performance Level Success Rate
Adults 65.0% 70.1% 108%Dislocated Workers 70.5% 76.1% 108%
Adults 82.0% 80.4% 98%Dislocated Workers 85.0% 81.2% 96%
Adults $14,122 $14,760 105%Dislocated Workers $17,528 $18,500 106%
Placement in Employment or Education Youth (14-21) 68.0% 71.6% 105%
Attainment of Degree or Certificate Youth (14-21) 62.7% 78.0% 124%
Literacy or Numeracy Gains Youth (14-21) 40.0% 14.3% 36%
*Adult Participants include WIA Adults and WIA Self Service
*Adult exiters include WIA Adults and WIA Self Service
Table O - Local Performance
Average Earnings
Total Participants Served
San Mateo County WIB
Entered Employment Rate
Retention Rate
The average earnings and retention measures are based on the clients leaving the program between April 1, 2012 and March 31, 2013.The cohort for placement in employment or education and attainment of a degree or certificate measures is October 1, 2012 through September 30, 2013.
Total exiters include clients leaving the program during the period from April 1, 2013 to March 31, 2014.
Total participants served are clients in the program between July 1, 2013 and June 30, 2014.
The cohort for entered employment rates is October 1, 2012 through September 30, 2013.
53
California WIA Program Year 2013 Annual Report Tables
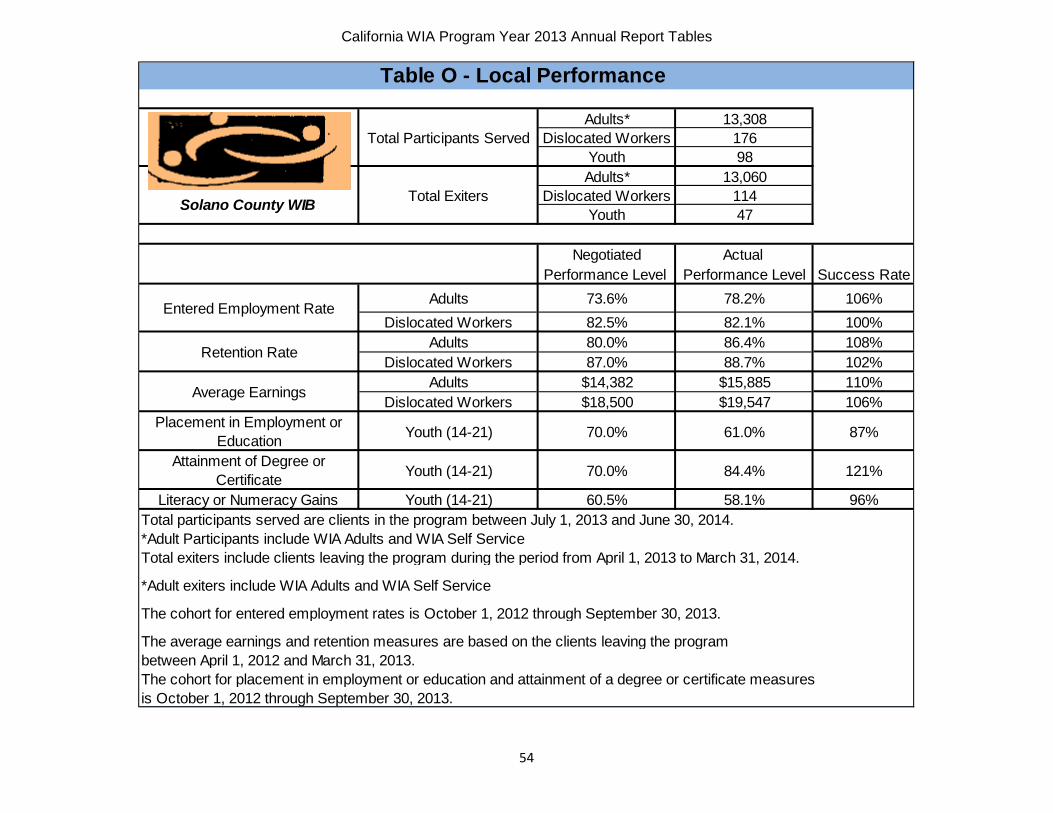
Local Area Name Adults* 13,308Dislocated Workers 176
Youth 98ETA Assigned # 6115 Adults* 13,060
Total Exiters Dislocated Workers 114Youth 47
Negotiated Actual Performance Level Performance Level Success Rate
Adults 73.6% 78.2% 106%Dislocated Workers 82.5% 82.1% 100%
Adults 80.0% 86.4% 108%Dislocated Workers 87.0% 88.7% 102%
Adults $14,382 $15,885 110%Dislocated Workers $18,500 $19,547 106%
Placement in Employment or Education Youth (14-21) 70.0% 61.0% 87%
Attainment of Degree or Certificate Youth (14-21) 70.0% 84.4% 121%
Literacy or Numeracy Gains Youth (14-21) 60.5% 58.1% 96%
*Adult Participants include WIA Adults and WIA Self Service
*Adult exiters include WIA Adults and WIA Self Service
Table O - Local Performance
Total Participants Served
Solano County WIB
Total exiters include clients leaving the program during the period from April 1, 2013 to March 31, 2014.
The cohort for entered employment rates is October 1, 2012 through September 30, 2013.
The average earnings and retention measures are based on the clients leaving the program between April 1, 2012 and March 31, 2013.
Entered Employment Rate
Retention Rate
Average Earnings
The cohort for placement in employment or education and attainment of a degree or certificate measures is October 1, 2012 through September 30, 2013.
Total participants served are clients in the program between July 1, 2013 and June 30, 2014.
54

California WIA Program Year 2013 Annual Report Tables
Local Area Name Adults* 7,916Dislocated Workers 288
Youth 279ETA Assigned # 6120 Adults* 7,661
Total Exiters Dislocated Workers 196Youth 71
Negotiated Actual Performance Level Performance Level Success Rate
Adults 53.9% 59.1% 110%Dislocated Workers 57.6% 68.8% 119%
Adults 78.3% 83.6% 107%Dislocated Workers 81.9% 87.6% 107%
Adults $12,600 $16,647 132%Dislocated Workers $16,615 $15,471 93%
Placement in Employment or Education Youth (14-21) 59.2% 69.2% 117%
Attainment of Degree or Certificate Youth (14-21) 41.8% 41.0% 98%
Literacy or Numeracy Gains Youth (14-21) 22.0% 29.6% 135%
*Adult Participants include WIA Adults and WIA Self Service
*Adult exiters include WIA Adults and WIA Self Service
Entered Employment Rate
Retention Rate
Average Earnings
Table O - Local Performance
Total Participants Served
Sonoma County WIB
The cohort for entered employment rates is October 1, 2012 through September 30, 2013.
The average earnings and retention measures are based on the clients leaving the program between April 1, 2012 and March 31, 2013.The cohort for placement in employment or education and attainment of a degree or certificate measures is October 1, 2012 through September 30, 2013.
Total exiters include clients leaving the program during the period from April 1, 2013 to March 31, 2014.
Total participants served are clients in the program between July 1, 2013 and June 30, 2014.
55

California WIA Program Year 2013 Annual Report Tables
Adults* 11,210Dislocated Workers 464
Youth 313ETA Assigned # 6125 Adults* 11,238
Total Exiters Dislocated Workers 361Youth 323
Negotiated Actual Performance Level Performance Level Success Rate
Adults 69.5% 74.0% 106%Dislocated Workers 76.9% 86.0% 112%
Adults 75.7% 81.6% 108%Dislocated Workers 80.0% 89.3% 112%
Adults $11,133 $12,998 117%Dislocated Workers $14,700 $16,511 112%
Placement in Employment or Education Youth (14-21) 70.5% 60.1% 85%
Attainment of Degree or Certificate Youth (14-21) 62.0% 49.5% 80%
Literacy or Numeracy Gains Youth (14-21) 60.5% 66.0% 109%
*Adult Participants include WIA Adults and WIA Self Service
*Adult exiters include WIA Adults and WIA Self Service
Table O - Local Performance
Average Earnings
Total Participants Served
Stanislaus County WIB
Entered Employment Rate
Retention Rate
The average earnings and retention measures are based on the clients leaving the program between April 1, 2012 and March 31, 2013.
The cohort for entered employment rates is October 1, 2012 through September 30, 2013.
Total exiters include clients leaving the program during the period from April 1, 2013 to March 31, 2014.
The cohort for placement in employment or education and attainment of a degree or certificate measures is October 1, 2012 through September 30, 2013.
Total participants served are clients in the program between July 1, 2013 and June 30, 2014.
56

California WIA Program Year 2013 Annual Report Tables
Local Area Name Adults* 7,933Dislocated Workers 2,079
Youth 958ETA Assigned # 6165 Adults* 7,172
Total Exiters Dislocated Workers 1,273Youth 574
Negotiated Actual
Performance Level Performance Level Success RateAdults 50.8% 52.9% 104%
Dislocated Workers 57.6% 65.2% 113%Adults 77.4% 79.5% 103%
Dislocated Workers 78.0% 80.9% 104%Adults $9,950 $11,128 112%
Dislocated Workers $11,900 $13,543 114%Placement in Employment or
Education Youth (14-21) 67.5% 65.0% 96%
Attainment of Degree or Certificate Youth (14-21) 46.1% 56.3% 122%
Literacy or Numeracy Gains Youth (14-21) 48.4% 67.1% 139%
*Adult Participants include WIA Adults and WIA Self Service
*Adult exiters include WIA Adults and WIA Self Service
Table O - Local Performance
Total Participants Served
Tulare County WIB, Inc.
Total exiters include clients leaving the program during the period from April 1, 2013 to March 31, 2014.
The cohort for entered employment rates is October 1, 2012 through September 30, 2013.
The average earnings and retention measures are based on the clients leaving the program between April 1, 2012 and March 31, 2013.
Entered Employment Rate
Retention Rate
Average Earnings
The cohort for placement in employment or education and attainment of a degree or certificate measures is October 1, 2012 through September 30, 2013.
Total participants served are clients in the program between July 1, 2013 and June 30, 2014.
57

California WIA Program Year 2013 Annual Report Tables
Local Area Name Adults* 18,141Dislocated Workers 232
Youth 386ETA Assigned # 6130 Adults* 16,915
Total Exiters Dislocated Workers 121Youth 333
Negotiated Actual Performance Level Performance Level Success Rate
Adults 72.0% 79.2% 110%Dislocated Workers 75.0% 80.2% 107%
Adults 81.0% 85.9% 106%Dislocated Workers 84.0% 92.8% 110%
Adults $13,251 $14,369 108%Dislocated Workers $16,000 $18,772 117%
Placement in Employment or Education Youth (14-21) 70.0% 71.3% 102%
Attainment of Degree or Certificate Youth (14-21) 60.0% 80.7% 135%
Literacy or Numeracy Gains Youth (14-21) 60.5% 78.5% 130%
*Adult Participants include WIA Adults and WIA Self Service
*Adult exiters include WIA Adults and WIA Self Service
Average Earnings
Table O - Local Performance
Total Participants Served
Ventura County WIB
The cohort for entered employment rates is October 1, 2012 through September 30, 2013.
The average earnings and retention measures are based on the clients leaving the program between April 1, 2012 and March 31, 2013.The cohort for placement in employment or education and attainment of a degree or certificate measures is October 1, 2012 through September 30, 2013.
Total exiters include clients leaving the program during the period from April 1, 2013 to March 31, 2014.
Total participants served are clients in the program between July 1, 2013 and June 30, 2014.
Entered Employment Rate
Retention Rate
58

California WIA Program Year 2013 Annual Report Tables
Local Area Name Adults* 14,862Dislocated Workers 138
Youth 148ETA Assigned # 6010 Adults* 14,016
Total Exiters Dislocated Workers 102Youth 114
Negotiated Actual Performance Level Performance Level Success Rate
Adults 53.0% 75.4% 142%Dislocated Workers 60.0% 75.8% 126%
Adults 82.0% 83.5% 102%Dislocated Workers 82.5% 80.8% 98%
Adults $14,033 $14,331 102%Dislocated Workers $17,000 $20,314 119%
Placement in Employment or Education Youth (14-21) 70.5% 74.0% 105%
Attainment of Degree or Certificate Youth (14-21) 52.1% 68.8% 132%
Literacy or Numeracy Gains Youth (14-21) 65.0% 83.1% 128%
*Adult Participants include WIA Adults and WIA Self Service
*Adult exiters include WIA Adults and WIA Self Service
Table O - Local Performance
The cohort for placement in employment or education and attainment of a degree or certificate measures is October 1, 2012 through September 30, 2013.
Average Earnings
Total Participants Served
Verdugo WIB
Entered Employment Rate
Retention Rate
The average earnings and retention measures are based on the clients leaving the program between April 1, 2012 and March 31, 2013.
The cohort for entered employment rates is October 1, 2012 through September 30, 2013.
Total exiters include clients leaving the program during the period from April 1, 2013 to March 31, 2014.
Total participants served are clients in the program between July 1, 2013 and June 30, 2014.
59

California WIA Program Year 2013 Annual Report Tables
Local Area Name Adults* 3,982Dislocated Workers 60
Youth 62ETA Assigned # 6210 Adults* 3810
Total Exiters Dislocated Workers 48Youth 36
Negotiated Actual Performance Level Performance Level Success Rate
Adults 75.8% 81.0% 107%Dislocated Workers 77.1% 79.4% 103%
Adults 82.4% 71.4% 87%Dislocated Workers 89.3% 88.5% 99%
Adults $14,000 $11,083 79%Dislocated Workers $16,900 $21,598 128%
Placement in Employment or Education Youth (14-21) 72.0% 94.4% 131%
Attainment of Degree or Certificate Youth (14-21) 70.0% 78.1% 112%
Literacy or Numeracy Gains Youth (14-21) 75.0% 0.0% 0%
*Adult Participants include WIA Adults and WIA Self Service
*Adult exiters include WIA Adults and WIA Self Service
Yolo County WIB
The cohort for entered employment rates is October 1, 2012 through September 30, 2013.The average earnings and retention measures are based on the clients leaving the program between April 1, 2012 and March 31, 2013.
Entered Employment Rate
Retention Rate
Average Earnings
Total exiters include clients leaving the program during the period from April 1, 2013 to March 31, 2014.
Table O - Local Performance
Total participants served are clients in the program between July 1, 2013 and June 30, 2014.
Total Participants Served
The cohort for placement in employment or education and attainment of a degree or certificate measures is October 1, 2012 through September 30, 2013.
60

California WIA Program Year 2013 Annual Report Tables
Table P - Veteran Priority of Service Total Percent Served Covered Entrants Who Reached the End of the Entry Period 40,069 Covered Entrants Who Received a Service During the Entry Period 40,069 100.0% Covered Entrants Who Received a Staff-Assisted Service During the Entry Period 3,237 8.08%
Table Q - Veterans' Outcomes by Special Populations
Reported Information Post 9/11 Era Veterans Post 9/11 Era Veterans who Received at least Intensive
Services
Entered Employment Rate 70.28% 544
70.45% 503
774 714
Employment Retention Rate 83.4% 598
83.73% 561
717 670
Six Months Average Earnings $18,362.57 $10,668,654.58
$18,435.19 $10,028,742.63
581 544
61