Embed Size (px)
Citation preview

2015-16 School Accountability Report Card for California Virtual Academy at Los Angeles Page 1 of 20
California Virtual Academy at Los Angeles
School Accountability Report Card
Reported Using Data from the 2015-16 School Year
Published During 2016-17
By February 1 of each year, every school in California is required by state law to publish a School Accountability Report Card (SARC). The SARC contains information about the condition and performance of each California public school. Under the Local Control Funding Formula (LCFF) all local educational agencies (LEAs) are required to prepare a Local Control and Accountability Plan (LCAP), which describes how they intend to meet annual school-specific goals for all pupils, with specific activities to address state and local priorities. Additionally, data reported in an LCAP is to be consistent with data reported in the SARC. • For more information about SARC requirements, see the California Department of Education (CDE) SARC Web page at
http://www.cde.ca.gov/ta/ac/sa/. • For more information about the LCFF or LCAP, see the CDE LCFF Web page at http://www.cde.ca.gov/fg/aa/lc/. • For additional information about the school, parents/guardians and community members should contact the school principal or
the district office. DataQuest DataQuest is an online data tool located on the CDE DataQuest Web page at http://dq.cde.ca.gov/dataquest/ that contains additional information about this school and comparisons of the school to the district and the county. Specifically, DataQuest is a dynamic system that provides reports for accountability (e.g., test data, enrollment, high school graduates, dropouts, course enrollments, staffing, and data regarding English learners). Internet Access Internet access is available at public libraries and other locations that are publicly accessible (e.g., the California State Library). Access to the Internet at libraries and public locations is generally provided on a first-come, first-served basis. Other use restrictions may include the hours of operation, the length of time that a workstation may be used (depending on availability), the types of software programs available on a workstation, and the ability to print documents.
About This School Contact Information (School Year 2016-17)
School Contact Information
School Name------- California Virtual Academy at Los Angeles
Street------- 50 Moreland Road
City, State, Zip------- Simi Valley, CA 93065
Phone Number------- 805-581-0202
Principal------- Suzanne McCarty
E-mail Address------- [email protected]
Web Site------- http://cava.k12.com/
CDS Code 19650940112706

2015-16 School Accountability Report Card for California Virtual Academy at Los Angeles Page 2 of 20
District Contact Information
District Name------- California Virtual Academy at Los Angeles
Phone Number------- 805.581.0202
Superintendent-------
April Waren
E-mail Address------- [email protected]
Web Site------- http://cava.k12.com/
School Description and Mission Statement (School Year 2016-17)
California Virtual Academy @ Los Angeles believes that, given a comprehensive and mastery-based curriculum, high expectations, access to technology, strong instructional support, a significant amount of off-line work, guidance from experienced teachers, and a strong commitment from parents or other caring adults, a well-conceived virtual education program will boost student achievement, serve the unique needs of students and families, and offer a new model for effective public education in the 21st century. The goals of our educational program include: • Enabling all students to become self-motivated, competent and lifelong learners • Empowering the parent as the teacher through a guided program and training • Offering flexibility and choices to increase student interest in learning • Using a variety of lessons, activities, and modalities to improve student achievement • Striving for mastery of all skills by every student • Developing reflective learners • Developing technology literate students Our Mission Statement California Virtual Academy at Los Angeles is an online, public charter school with a mission to provide a comprehensive standards-based program to diverse student learners who seek an individualized, engaging educational setting. In partnership with parents and Learning Coaches, our dedicated teachers affirm and inspire students to become life-long learners. We model and instill independence, self-advocacy, and critical thinking in order to educate the whole child. Our goal is to develop a self-disciplined and accountable individual who is prepared to enter the workforce or higher education and be a contributing member of the community. Student Enrollment by Grade Level (School Year 2015-16)
Grade Number of
Level Students
Kindergarten 131
Grade 1 136
Grade 2 143
Grade 3 161
Grade 4 190
Grade 5 177
Grade 6 244
Grade 7 260
Grade 8 361
Grade 9 286
Grade 10 361
Grade 11 393
Grade 12 304
Total Enrollment 3,147

2015-16 School Accountability Report Card for California Virtual Academy at Los Angeles Page 3 of 20
Student Enrollment by Group (School Year 2015-16)
Student Percent of
Group Total Enrollment
Black or African American 16.1
American Indian or Alaska Native 0.3
Asian 3.3
Filipino 1.7
Hispanic or Latino 35.6
Native Hawaiian or Pacific Islander 0.5
White 34
Two or More Races 7.3
Socioeconomically Disadvantaged 58.8
English Learners 2.6
Students with Disabilities 12.9
Foster Youth 0.4
A. Conditions of Learning
State Priority: Basic The SARC provides the following information relevant to the Basic State Priority (Priority 1): • Degree to which teachers are appropriately assigned and fully credentialed in the subject area and for the pupils they are
teaching; • Pupils have access to standards-aligned instructional materials; and • School facilities are maintained in good repair. Teacher Credentials
Teachers School District
2014-15 2015-16 2016-17 2016-17
With Full Credential 100% 100% 100% N/A
Without Full Credential 0 0 0 N/A
Teaching Outside Subject Area of Competence (with full credential) 0 0 0 N/A
Teacher Misassignments and Vacant Teacher Positions
Indicator 2014-15 2015-16 2016-17
Misassignments of Teachers of English Learners 0 0 0
Total Teacher Misassignments * 0 0 0
Vacant Teacher Positions 0 0 0 Note: “Misassignments” refers to the number of positions filled by teachers who lack legal authorization to teach that grade level, subject area, student group, etc. * Total Teacher Misassignments includes the number of Misassignments of Teachers of English Learners. Core Academic Classes Taught by Highly Qualified Teachers (School Year 2015-16)
Location of Classes Percent of Classes In Core Academic Subjects
Taught by Highly Qualified Teachers Not Taught by Highly Qualified Teachers
This School 100.0 0.0
All Schools in District 99.3 0.7
High-Poverty Schools in District 99.3 0.7
Low-Poverty Schools in District 0.0 0.0 Note: High-poverty schools are defined as those schools with student eligibility of approximately 40 percent or more in the free and reduced price meals program. Low-poverty schools are those with student eligibility of approximately 39 percent or less in the free and reduced price meals program.

2015-16 School Accountability Report Card for California Virtual Academy at Los Angeles Page 4 of 20
Quality, Currency, Availability of Textbooks and Instructional Materials (School Year 2016-17) Year and month in which data were collected: August 2016 CAVA is a public charter school. Students are provided new curriculum each year.
Subject Textbooks and Instructional Materials/
Year of Adoption
From Most Recent
Adoption?
Percent of Students Lacking Own
Assigned Copy
Reading/Language Arts Embark Plus (TK), Language Arts Blue (K), Green (1st), Orange (2nd), and Purple(3rd), Language Arts/Language Skills 4 & 5
English/Language Arts 6, English/Language Arts 7, English/Language Arts 8
Summit English 9, Summit English 10; Core, Comprehensive, Honors, AP, Credit Recovery American Literature, British/World Literature; Journalism, Creative Writing
Yes 0%
Mathematics Embark Plus (TK), Math+Blue (K), Math+Green (1st), Math+Orange (2nd), Math+Purple (3rd), Math+Read(4th), Math+Yellow (5th), Math 6 (6th), Math 7 (7th), Math 8 (8th) Pre-Algebra, Algebra 1, Geometry, Algebra 2, Pre-Cal/Trig, Personal Finance, Consumer Math, AP Stats, AP Calculus
Yes 0%
Science Embark Plus (TK), Science K-5
Earth Science (6th), Life Science (7th), Physical Science (8th)
Core, Comprehensive, Honors, Earth Science; Core, Comprehensive, Honors, AP, Biology; Core, Comp, Honors, AP Chemistry; Comp & Honors Physics
Yes 0%
History-Social Science Embark Plus (TK), History K-4, CA State History, American History A (5th), World History A (6th) World History B (7th), American History (8th)
Core, Comprehensive, AP, and Honors, World and US History; Core, Comp, Core, Credit Recovery Government and Economics; Credit Recovery US History
Yes 0%
Foreign Language Spanish, French, German Year 1 & Year 2 (3rd-5th), Latin Year 1 (3rd-5th)
Middle School Spanish, French, German, Latin, and Chinese Year 1 & Year 2 (6th - 8th) Spanish 1, 2, 3, & AP (HS), French 1-3 (HS)
Yes 0%
Health High School Skills for Health and Health Science Yes 0%
2015-16 School Accountability Report Card for California Virtual Academy at Los Angeles Page 5 of 20
Subject Textbooks and Instructional Materials/
Year of Adoption
From Most Recent
Adoption?
Percent of Students Lacking Own
Assigned Copy
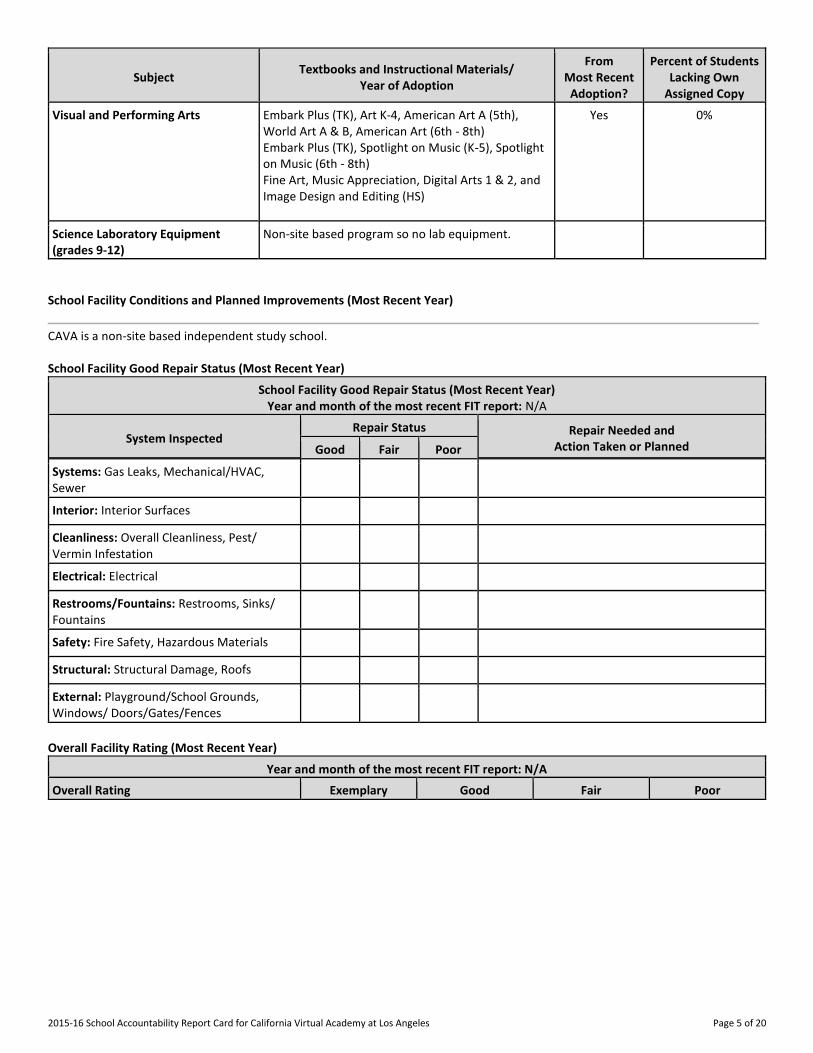
Visual and Performing Arts Embark Plus (TK), Art K-4, American Art A (5th), World Art A & B, American Art (6th - 8th) Embark Plus (TK), Spotlight on Music (K-5), Spotlight on Music (6th - 8th)
Fine Art, Music Appreciation, Digital Arts 1 & 2, and Image Design and Editing (HS)
Yes 0%
Science Laboratory Equipment (grades 9-12)
Non-site based program so no lab equipment.
School Facility Conditions and Planned Improvements (Most Recent Year)
CAVA is a non-site based independent study school. School Facility Good Repair Status (Most Recent Year)
School Facility Good Repair Status (Most Recent Year) Year and month of the most recent FIT report: N/A
System Inspected Repair Status Repair Needed and
Action Taken or Planned Good Fair Poor
Systems: Gas Leaks, Mechanical/HVAC, Sewer
Interior: Interior Surfaces
Cleanliness: Overall Cleanliness, Pest/ Vermin Infestation
Electrical: Electrical
Restrooms/Fountains: Restrooms, Sinks/ Fountains
Safety: Fire Safety, Hazardous Materials
Structural: Structural Damage, Roofs
External: Playground/School Grounds, Windows/ Doors/Gates/Fences
Overall Facility Rating (Most Recent Year)
Year and month of the most recent FIT report: N/A
Overall Rating Exemplary Good Fair Poor

2015-16 School Accountability Report Card for California Virtual Academy at Los Angeles Page 6 of 20
B. Pupil Outcomes
State Priority: Pupil Achievement The SARC provides the following information relevant to the State priority: Pupil Achievement (Priority 4): • Statewide assessments (i.e., California Assessment of Student Performance and Progress [CAASPP] System, which includes the
Smarter Balanced Summative Assessments for students in the general education population and the California Alternate Assessments [CAAs] for English language arts/literacy [ELA] and mathematics given in grades three through eight and grade eleven. The CAAs have replaced the California Alternate Performance Assessment [CAPA] for ELA and mathematics, which were eliminated in 2015. Only eligible students may participate in the administration of the CAAs. CAA items are aligned with alternate achievement standards, which are linked with the Common Core State Standards [CCSS] for students with significant cognitive disabilities); and
• The percentage of students who have successfully completed courses that satisfy the requirements for entrance to the University of California and the California State University, or career technical education sequences or programs of study
CAASPP Test Results in English Language Arts/Literacy (ELA) and Mathematics for All Students
Subject
Percent of Students Meeting or Exceeding the State Standards (grades 3-8 and 11)
School District State
2014-15 2015-16 2014-15 2015-16 2014-15 2015-16
English Language Arts/Literacy 45 43 50 52 44 48
Mathematics 25 21 35 37 34 36 Note: Percentages are not calculated when the number of students tested is ten or less, either because the number of students in this category is too small for statistical accuracy or to protect student privacy.
CAASPP Test Results in ELA by Student Group Grades Three through Eight and Grade Eleven (School Year 2015-16)
Student Group Grade
Number of Students Percent of Students
Enrolled Tested Tested Standard Met or
Exceeded
All Students 3 162 129 79.6 38.8
4 209 180 86.1 31.7
5 172 141 82.0 36.2
6 279 243 87.1 32.9
7 307 260 84.7 39.6
8 379 315 83.1 45.1
11 405 300 74.1 63.7
Male 3 78 63 80.8 38.1
4 114 97 85.1 29.9
5 99 83 83.8 38.5
6 144 120 83.3 27.5
7 152 127 83.5 34.6
8 191 157 82.2 39.5
11 149 109 73.2 53.2
Female 3 84 66 78.6 39.4
4 95 83 87.4 33.7
5 73 58 79.5 32.8
6 135 123 91.1 38.2
7 155 133 85.8 44.4

2015-16 School Accountability Report Card for California Virtual Academy at Los Angeles Page 7 of 20
Student Group Grade
Number of Students Percent of Students
Enrolled Tested Tested Standard Met or
Exceeded
8 188 158 84.0 50.6
11 256 191 74.6 69.6
Black or African American 3 22 16 72.7 25.0
4 43 35 81.4 25.7
5 36 28 77.8 14.3
6 41 34 82.9 14.7
7 52 41 78.8 14.6
8 51 39 76.5 15.4
11 57 38 66.7 52.6
American Indian or Alaska Native 3 -- -- -- --
4 -- -- -- --
6 -- -- -- --
7 -- -- -- --
8 -- -- -- --
11 -- -- -- --
Asian 3 -- -- -- --
4 -- -- -- --
5 -- -- -- --
6 12 12 100.0 58.3
7 12 12 100.0 58.3
8 13 12 92.3 83.3
11 -- -- -- --
Filipino 3 -- -- -- --
4 -- -- -- --
5 -- -- -- --
6 -- -- -- --
7 -- -- -- --
8 -- -- -- --
11 14 11 78.6 81.8
Hispanic or Latino 3 63 54 85.7 38.9
4 85 76 89.4 32.9
5 59 47 79.7 36.2
6 93 85 91.4 22.4
7 101 87 86.1 39.1
8 126 108 85.7 35.2
11 140 117 83.6 61.5
Native Hawaiian or Pacific Islander
3 -- -- -- --
5 -- -- -- --

2015-16 School Accountability Report Card for California Virtual Academy at Los Angeles Page 8 of 20
Student Group Grade
Number of Students Percent of Students
Enrolled Tested Tested Standard Met or
Exceeded
6 -- -- -- --
7 -- -- -- --
8 -- -- -- --
11 -- -- -- --
White 3 47 32 68.1 34.4
4 57 48 84.2 37.5
5 52 47 90.4 48.9
6 94 77 81.9 46.8
7 112 96 85.7 49.0
8 158 131 82.9 56.5
11 145 97 66.9 69.1
Two or More Races 3 18 16 88.9 62.5
4 15 13 86.7 23.1
5 16 11 68.8 45.5
6 22 20 90.9 35.0
7 21 18 85.7 38.9
8 20 17 85.0 41.2
11 24 21 87.5 66.7
Socioeconomically Disadvantaged 3 102 82 80.4 31.7
4 121 105 86.8 26.7
5 112 92 82.1 27.2
6 166 145 87.3 26.2
7 175 148 84.6 30.4
8 198 165 83.3 36.4
11 217 168 77.4 58.9
English Learners 3 -- -- -- --
4 -- -- -- --
5 -- -- -- --
6 -- -- -- --
7 -- -- -- --
8 -- -- -- --
11 -- -- -- --
Students with Disabilities 3 16 11 68.8 9.1
4 29 24 82.8 4.2
5 26 21 80.8 9.5
6 32 25 78.1 16.0
7 45 33 73.3 21.2
8 44 32 72.7 21.9

2015-16 School Accountability Report Card for California Virtual Academy at Los Angeles Page 9 of 20
Student Group Grade
Number of Students Percent of Students
Enrolled Tested Tested Standard Met or
Exceeded
11 43 24 55.8 20.8
Foster Youth 3 -- -- -- --
4 -- -- -- --
5 -- -- -- --
6 -- -- -- --
7 -- -- -- --
8 -- -- -- --
11 -- -- -- --
Note: ELA test results include the Smarter Balanced Summative Assessment and the CAA. The “Percent Met or Exceeded” is calculated by taking the total number of students who met or exceeded the standard on the Smarter Balanced Summative Assessment plus the total number of students who met the standard on the CAAs divided by the total number of students who participated in both assessments. Double dashes (--) appear in the table when the number of students is ten or less, either because the number of students in this category is too small for statistical accuracy or to protect student privacy. Note: The number of students tested includes all students who participated in the test whether they received a score or not; however, the number of students tested is not the number that was used to calculate the achievement level percentages. The achievement level percentages are calculated using only students who received scores.
CAASPP Test Results in Mathematics by Student Group Grades Three through Eight and Grade Eleven (School Year 2015-16)
Student Group Grade
Number of Students Percent of Students
Enrolled Tested Tested Standard Met or
Exceeded
All Students 3 162 129 79.6 24.8
4 209 180 86.1 23.3
5 172 141 82.0 15.6
6 279 243 87.1 21.8
7 307 260 84.7 24.6
8 379 315 83.1 21.6
11 405 299 73.8 15.1
Male 3 78 63 80.8 23.8
4 114 97 85.1 23.7
5 99 83 83.8 19.3
6 144 120 83.3 23.3
7 152 127 83.5 25.2
8 191 157 82.2 26.1
11 149 108 72.5 16.7
Female 3 84 66 78.6 25.8
4 95 83 87.4 22.9
5 73 58 79.5 10.3
6 135 123 91.1 20.3
7 155 133 85.8 24.1
8 188 158 84.0 17.1

2015-16 School Accountability Report Card for California Virtual Academy at Los Angeles Page 10 of 20
Student Group Grade
Number of Students Percent of Students
Enrolled Tested Tested Standard Met or
Exceeded
11 256 191 74.6 14.1
Black or African American 3 22 16 72.7 6.3
4 43 35 81.4 14.3
5 36 28 77.8 7.1
6 41 34 82.9 11.8
7 52 41 78.8 4.9
8 51 39 76.5 10.3
11 57 38 66.7 7.9
American Indian or Alaska Native 3 -- -- -- --
4 -- -- -- --
6 -- -- -- --
7 -- -- -- --
8 -- -- -- --
11 -- -- -- --
Asian 3 -- -- -- --
4 -- -- -- --
5 -- -- -- --
6 12 12 100.0 58.3
7 12 12 100.0 58.3
8 13 12 92.3 75.0
11 -- -- -- --
Filipino 3 -- -- -- --
4 -- -- -- --
5 -- -- -- --
6 -- -- -- --
7 -- -- -- --
8 -- -- -- --
11 14 11 78.6 18.2
Hispanic or Latino 3 63 54 85.7 24.1
4 85 76 89.4 23.7
5 59 47 79.7 10.6
6 93 85 91.4 10.6
7 101 87 86.1 19.5
8 126 108 85.7 13.0
11 140 117 83.6 13.7
Native Hawaiian or Pacific Islander
3 -- -- -- --
5 -- -- -- --
6 -- -- -- --

2015-16 School Accountability Report Card for California Virtual Academy at Los Angeles Page 11 of 20
Student Group Grade
Number of Students Percent of Students
Enrolled Tested Tested Standard Met or
Exceeded
7 -- -- -- --
8 -- -- -- --
11 -- -- -- --
White 3 47 32 68.1 25.0
4 57 48 84.2 29.2
5 52 47 90.4 25.5
6 94 77 81.9 31.2
7 112 96 85.7 34.4
8 158 131 82.9 27.5
11 145 96 66.2 17.7
Two or More Races 3 18 16 88.9 43.8
4 15 13 86.7 15.4
5 16 11 68.8 9.1
6 22 20 90.9 30.0
7 21 18 85.7 22.2
8 20 17 85.0 17.6
11 24 21 87.5 19.1
Socioeconomically Disadvantaged 3 102 82 80.4 24.4
4 121 105 86.8 20.0
5 112 92 82.1 13.0
6 166 145 87.3 15.2
7 175 148 84.6 15.5
8 198 165 83.3 10.3
11 217 168 77.4 12.5
English Learners 3 -- -- -- --
4 -- -- -- --
5 -- -- -- --
6 -- -- -- --
7 -- -- -- --
8 -- -- -- --
11 -- -- -- --
Students with Disabilities 3 16 11 68.8
4 29 24 82.8 8.3
5 26 21 80.8
6 32 25 78.1 12.0
7 45 33 73.3 12.1
8 44 32 72.7 21.9
11 43 23 53.5

2015-16 School Accountability Report Card for California Virtual Academy at Los Angeles Page 12 of 20
Student Group Grade
Number of Students Percent of Students
Enrolled Tested Tested Standard Met or
Exceeded
Foster Youth 3 -- -- -- --
4 -- -- -- --
5 -- -- -- --
6 -- -- -- --
7 -- -- -- --
8 -- -- -- --
11 -- -- -- --
Note: Mathematics test results include the Smarter Balanced Summative Assessment and the CAA. The “Percent Met or Exceeded” is calculated by taking the total number of students who met or exceeded the standard on the Smarter Balanced Summative Assessment plus the total number of students who met the standard on the CAAs divided by the total number of students who participated in both assessments. Double dashes (--) appear in the table when the number of students is ten or less, either because the number of students in this category is too small for statistical accuracy or to protect student privacy. --Note: The number of students tested includes all students who participated in the test whether they received a score or not; however, the number of students tested is not the number that was used to calculate the achievement level percentages. The achievement level percentages are calculated using only students who received scores.
CAASPP Test Results in Science for All Students
Subject
Percent of Students Scoring at Proficient or Advanced (meeting or exceeding the state standards)
School District State
2013-14 2014-15 2015-16 2013-14 2014-15 2015-16 2013-14 2014-15 2015-16
Science (grades 5, 8, and 10) 48 42 43 63 62 54 60 56 54 Note: Science test results include California Standards Tests (CSTs), California Modified Assessment (CMA), and California Alternate Performance Assessment (CAPA) in grades five, eight, and ten. --Note: Scores are not shown when the number of students tested is ten or less, either because the number of students in this category is too small for statistical accuracy or to protect student privacy.
CAASPP Test Results in Science by Student Group Grades Five, Eight, and Ten (School Year 2015-16)
Student Group
Total Enrollment
# of Students with Valid Scores
% of Students with Valid Scores
% of Students Proficient or
Advanced
All Students 942 743 78.9 42.7
Male 445 348 78.2 47.7
Female 497 395 79.5 38.2
Black or African American 165 123 74.6 26.8
Asian 25 23 92.0 73.9
Filipino 13 13 100.0 46.2
Hispanic or Latino 312 251 80.5 37.5
White 349 278 79.7 50.7
Two or More Races 62 47 75.8 46.8
Socioeconomically Disadvantaged 524 416 79.4 34.4
English Learners 20 15 75.0 20.0
Students with Disabilities 124 89 71.8 33.7 Note: Science test results include CSTs, CMA, and CAPA in grades five, eight, and ten. The “Proficient or Advanced” is calculated by taking the total number of students who scored at Proficient or Advanced on the science assessment divided by the total number of students with valid scores. --Note: Scores are not shown when the number of students tested is ten or less, either because the number of students in this category is too small for statistical accuracy or to protect student privacy.

2015-16 School Accountability Report Card for California Virtual Academy at Los Angeles Page 13 of 20
Career Technical Education Programs (School Year 2015-16)
This section provides information about the Career Technical Education (CTE) programs and lists programs offered by the school district that are aligned to the model curriculum standards. The list should identify courses conducted by regional occupational centers or programs and those conducted directly by the school district. This section provides a listing of the primary representative of the career technical advisory committee of the school district and industries represented. We do not offer CTE. Career Technical Education Participation (School Year 2015-16)
Measure CTE Program Participation
Number of pupils participating in CTE 0
% of pupils completing a CTE program and earning a high school diploma 0
% of CTE courses sequenced or articulated between the school and institutions of postsecondary education 0
Courses for University of California (UC) and/or California State University (CSU) Admission
UC/CSU Course Measure Percent
2015-16 Pupils Enrolled in Courses Required for UC/CSU Admission 28.52
2014-15 Graduates Who Completed All Courses Required for UC/CSU Admission 0.45
State Priority: Other Pupil Outcomes The SARC provides the following information relevant to the Other Pupil Outcomes State Priority (Priority 8): • Pupil outcomes in the subject areas of physical education. California Physical Fitness Test Results (School Year 2015-16)
Grade Level
Percent of Students Meeting Fitness Standards
Four of Six Standards Five of Six Standards Six of Six Standards
---5--- 32.5 20.3 4.9
---7--- 23 25.7 14
---9--- 19.6 23.5 15.1 Note: Percentages are not calculated when the number of students tested is ten or less, either because the number of students in this category is too small for statistical accuracy or to protect student privacy.

2015-16 School Accountability Report Card for California Virtual Academy at Los Angeles Page 14 of 20
C. Engagement
State Priority: Parental Involvement The SARC provides the following information relevant to the Parental Involvement State Priority (Priority 3): • Efforts the school district makes to seek parent input in making decisions for the school district and each schoolsite. Opportunities for Parental Involvement (School Year 2016-17)
Parents are an extremely important part of California Virtual Academy @ Los Angeles (CAVA). Parents will help us to evaluate the school’s program each year through meetings and surveys. Each year when surveyed, parents of California Virtual Academy @ Los Angeles students state that they are more involved in their child’s education than they were at their previous school. Some parents will also serve as mentors to new families and families that are struggling with technology complications or curriculum problems. The mentors support and encourage families in learning to navigate the day-to-day management of home education. Parents are given an opportunity to make their voices heard (both online and offline) and provide their opinions on the direction of the school. Some parents will be asked to give critiques and/or testimonials about the program. Direct parental involvement is fundamental to the school’s success. Parents are involved from the start of the school year by researching our program and choosing to enroll their child in our school. Parents attend a registration conference and agree to the enrollment requirements. By completing these steps, parents show they are committed to being an active member of their student's education team in our program. Parental involvement is enhanced by the fact that the school will be educating not only students, but also its parents. Parents will be trained on the K12 instructional system, and taught how to be effective instructional coaches under the guidance of highly qualified and certificated teachers. Many parents will learn how to use computers for the first time, become expert e-mail and Internet users and will be exposed to a content-rich curriculum, including classic literature, a comprehensive re-telling of the story of history, various musical genres, and great works of art. Parents will have a rich social networking experience with the school Facebook site and Yahoo Groups. We have many resources available both online and offline. There are ongoing Parent/Learning Coach training opportunities through K12 Speaker Series, Online School tutorials, In Person and Virtual New Parent Orientations, School Effectively at Home workshops and staff-presented Learning Coach workshops. Elementary teachers contact all families within 24 hours of being assigned as their teacher and document their contact as a Welcome Activity Note. An individualized learning plan is provided to students within 2 weeks of their start in our school or the beginning of each semester. Goals are discussed with parents and provided as well during the ILP process. Our Family Support Coordinator offers orientations to families at the start of the year and start of the semester to support families with onboarding. Our FAST team also does check-in and provide onboarding support for their first few weeks of enrollment. Our elementary department also sends out pulse checks and surveys to families frequently to identify areas of support that is needed. Teachers are also offering orientations to their classes during the first few weeks of each quarter to support new families and address upcoming goals/standards for instruction. Middle School teachers are offering our middle school parents Parent Education sessions. These sessions provide support to our parents with understanding and working with their students in the common core curriculum for mathematics and English language arts. We have a very detailed Parent Student Handbook, Special Education handbook and CAVA New Parent Resource Guide. We have a Parent Mentor program to provide the ultimate one on one experience for Learning Coaches who would like a mentor to support them in their journey. At the high school level, parent communications will begin in August with Welcome Calls from teachers. They will also be receiving a copy of their Individualized Learning Plans in an email from the counseling team over the summer. Parent-Teacher conferences will take place November 4 – November 10. Welcome Back calls will take place again at the start of the spring semester, with a focus on ILP goals and accomplishments. Parent-Teacher conferences will take place April 17 – April 21. Live in-person Family Orientations will be held throughout LA the first week of school. In addition, RLT-led Virtual Parent Orientations will be held the first few weeks of every semester (both day and evening).Parent Workshops will be led by RLTs and PRINCIPALs once each month, focused on specific topics. All LA area families will be invited and encouraged to attend. Parent Support Sessions will be led by RLTs and offered 4 times per year (both day and evening), 2 weeks before closing date to target families of struggling students. Families will be identified using the HS tracker and personally invited to the session. Attendance will be tracked, via google survey.

2015-16 School Accountability Report Card for California Virtual Academy at Los Angeles Page 15 of 20
At each Community Day site, parents are invited to attend in-person parent support sessions. These sessions are practical, hands-on workshops that provide relevant information to parents so they can better understand the curriculum and support their students. Topics include: writing process/expectations, student organization/motivation, understanding common core math, supporting/developing reading fluency/building comprehension, and CAASPP. These sessions encourage collaboration and connection with other parents. Parents are also invited to observe classroom instruction. Parents are actively encouraged to participate in California Virtual Academy @ Los Angeles planning, organizational, Board of Directors, and other meetings. They are also encouraged to offer ideas and planning assistance with field trips, social events, and other outings. We have parent representatives on the California Virtual Academy @ Los Angeles school board and the School Site Council. The local Community Day sites have active parent-organized leadership teams that supports activities at the sites. We offer community-building at the school and state level, as well as the national level with other virtual academies. The California Virtual Academy @ Los Angeles community encourages parents to discover the resource that best meets their needs. We have many layers of support in place, as well as opportunities for parent leadership.
State Priority: Pupil Engagement The SARC provides the following information relevant to the Pupil Engagement State Priority (Priority 5): • High school dropout rates; and • High school graduation rates. Dropout Rate and Graduation Rate (Four-Year Cohort Rate)
Indicator School District State
2012-13 2013-14 2014-15 2012-13 2013-14 2014-15 2012-13 2013-14 2014-15
Dropout Rate 25.90 24.80 27.60 0.20 3.70 3.20 11.40 11.50 10.70
Graduation Rate 61.16 58.50 59.12 96.54 91.82 91.95 80.44 80.95 82.27
Completion of High School Graduation Requirements - Graduating Class of 2015 (One-Year Rate)
Group Graduating Class of 2015
School District State
All Students 85 92 86
Black or African American 73 90 78
American Indian or Alaska Native 100 100 78
Asian 100 100 93
Filipino 100 100 93
Hispanic or Latino 81 89 83
Native Hawaiian/Pacific Islander 100 100 85
White 84 91 91
Two or More Races 0 88 89
Socioeconomically Disadvantaged 71 61 66
English Learners 25 55 54
Students with Disabilities 21 78 78
2015-16 School Accountability Report Card for California Virtual Academy at Los Angeles Page 16 of 20
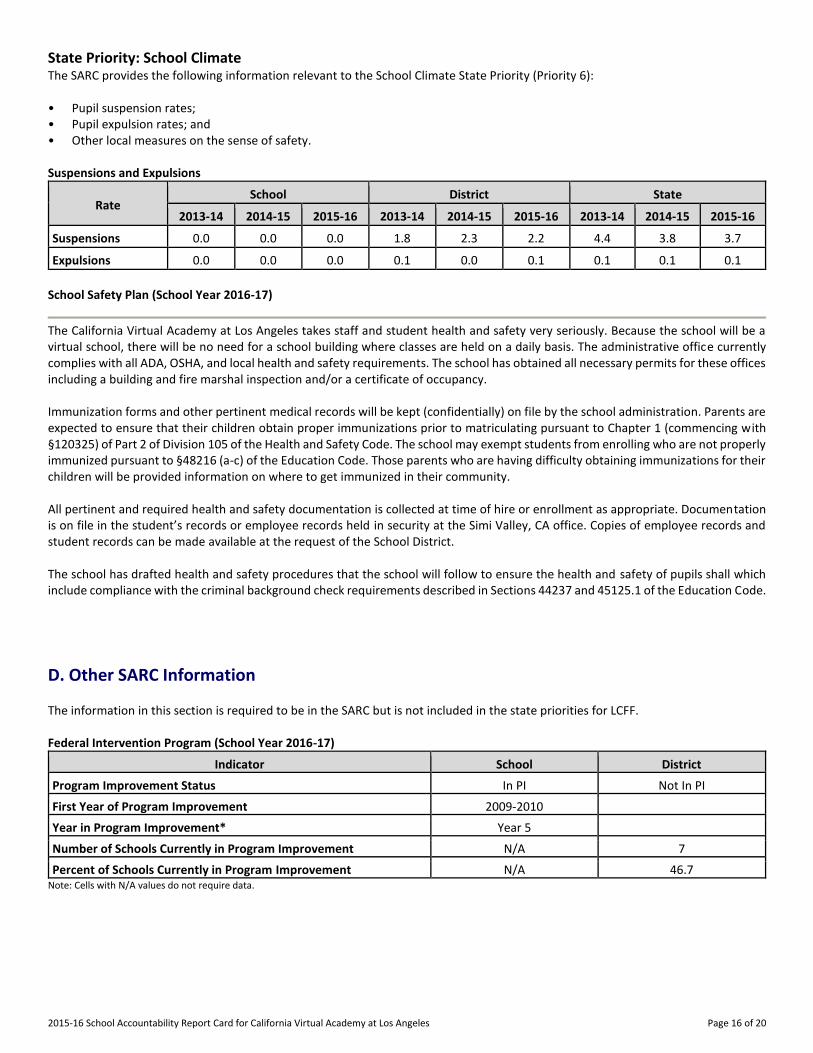
State Priority: School Climate The SARC provides the following information relevant to the School Climate State Priority (Priority 6): • Pupil suspension rates; • Pupil expulsion rates; and • Other local measures on the sense of safety. Suspensions and Expulsions
Rate School District State
2013-14 2014-15 2015-16 2013-14 2014-15 2015-16 2013-14 2014-15 2015-16
Suspensions------- 0.0 0.0 0.0 1.8 2.3 2.2 4.4 3.8 3.7
Expulsions------- 0.0 0.0 0.0 0.1 0.0 0.1 0.1 0.1 0.1
School Safety Plan (School Year 2016-17)
The California Virtual Academy at Los Angeles takes staff and student health and safety very seriously. Because the school will be a virtual school, there will be no need for a school building where classes are held on a daily basis. The administrative office currently complies with all ADA, OSHA, and local health and safety requirements. The school has obtained all necessary permits for these offices including a building and fire marshal inspection and/or a certificate of occupancy. Immunization forms and other pertinent medical records will be kept (confidentially) on file by the school administration. Parents are expected to ensure that their children obtain proper immunizations prior to matriculating pursuant to Chapter 1 (commencing with §120325) of Part 2 of Division 105 of the Health and Safety Code. The school may exempt students from enrolling who are not properly immunized pursuant to §48216 (a-c) of the Education Code. Those parents who are having difficulty obtaining immunizations for their children will be provided information on where to get immunized in their community. All pertinent and required health and safety documentation is collected at time of hire or enrollment as appropriate. Documentation is on file in the student’s records or employee records held in security at the Simi Valley, CA office. Copies of employee records and student records can be made available at the request of the School District. The school has drafted health and safety procedures that the school will follow to ensure the health and safety of pupils shall which include compliance with the criminal background check requirements described in Sections 44237 and 45125.1 of the Education Code.
D. Other SARC Information
The information in this section is required to be in the SARC but is not included in the state priorities for LCFF. Federal Intervention Program (School Year 2016-17)
Indicator School District
Program Improvement Status In PI Not In PI
First Year of Program Improvement 2009-2010
Year in Program Improvement* Year 5
Number of Schools Currently in Program Improvement N/A 7
Percent of Schools Currently in Program Improvement N/A 46.7 Note: Cells with N/A values do not require data.
2015-16 School Accountability Report Card for California Virtual Academy at Los Angeles Page 17 of 20
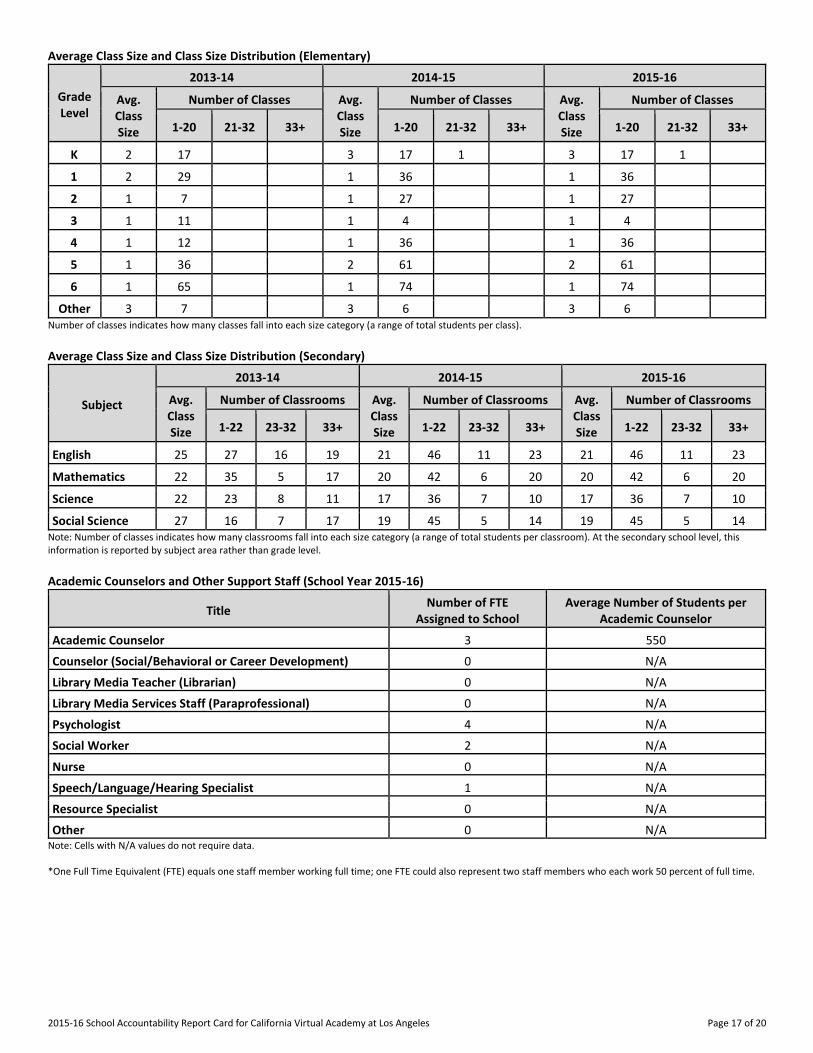
Average Class Size and Class Size Distribution (Elementary)
Grade Level
2013-14 2014-15 2015-16
Avg. Class Size
Number of Classes Avg. Class Size
Number of Classes Avg. Class Size
Number of Classes
1-20 21-32 33+ 1-20 21-32 33+ 1-20 21-32 33+
K
2 17 3 17 1 3 17 1
1
2 29 1 36 1 36
2
1 7 1 27 1 27
3
1 11 1 4 1 4
4
1 12 1 36 1 36
5
1 36 2 61 2 61
6
1 65 1 74 1 74
Other
3 7 3 6 3 6 Number of classes indicates how many classes fall into each size category (a range of total students per class).
Average Class Size and Class Size Distribution (Secondary)
Subject
2013-14 2014-15 2015-16
Avg. Class Size
Number of Classrooms Avg. Class Size
Number of Classrooms Avg. Class Size
Number of Classrooms
1-22 23-32 33+ 1-22 23-32 33+ 1-22 23-32 33+
English------- ----------
25 27 16 19 21 46 11 23 21 46 11 23
Mathematics ----------
22 35 5 17 20 42 6 20 20 42 6 20
Science------- ----------
22 23 8 11 17 36 7 10 17 36 7 10
Social Science ----------
27 16 7 17 19 45 5 14 19 45 5 14 Note: Number of classes indicates how many classrooms fall into each size category (a range of total students per classroom). At the secondary school level, this information is reported by subject area rather than grade level. Academic Counselors and Other Support Staff (School Year 2015-16)
Title Number of FTE
Assigned to School Average Number of Students per
Academic Counselor
Academic Counselor------- 3 550
Counselor (Social/Behavioral or Career Development) 0 N/A
Library Media Teacher (Librarian) 0 N/A
Library Media Services Staff (Paraprofessional) 0 N/A
Psychologist------- 4 N/A
Social Worker------- 2 N/A
Nurse------- 0 N/A
Speech/Language/Hearing Specialist 1 N/A
Resource Specialist------- 0 N/A
Other------- 0 N/A Note: Cells with N/A values do not require data. *One Full Time Equivalent (FTE) equals one staff member working full time; one FTE could also represent two staff members who each work 50 percent of full time.

2015-16 School Accountability Report Card for California Virtual Academy at Los Angeles Page 18 of 20
Expenditures per Pupil and School Site Teacher Salaries (Fiscal Year 2014-15)
Level
Expenditures Per Pupil Average Teacher Salary Total
Supplemental/ Restricted
Basic/ Unrestricted
School Site------- $8,786 $1,232 $7,554 $49,093
District------- N/A N/A $7,792 $70,256
Percent Difference: School Site and District N/A N/A -3.1 -30.1
State------- N/A N/A $5,677 $71,517
Percent Difference: School Site and State N/A N/A 33.1 -31.4 Note: Cells with N/A values do not require data.
Types of Services Funded (Fiscal Year 2015-16)
CAVA ensures that resources are allocated to support learning for all students while adhering to state and federal regulations. We receive Title I, Part A, Title II, Part A, and Special Education funds. Title I funds are primarily used to provide a 3-tiered intervention program for students who need extra support. Title II funds are used for professional development for staff. Special Education services are offered within our full- inclusion, general education, independent study model. These services are available for all students who have been identified as qualifying for special services. All English Language Learners are provided an English Language Development program that includes online instruction and an online program, ESL Reading Smart. Teacher and Administrative Salaries (Fiscal Year 2014-15)
Category District Amount State Average for Districts In Same Category
Beginning Teacher Salary $44,130 $43,821
Mid-Range Teacher Salary $71,435 $69,131
Highest Teacher Salary $88,386 $89,259
Average Principal Salary (Elementary) $112,333 $108,566
Average Principal Salary (Middle) $115,940 $115,375
Average Principal Salary (High) $135,548 $125,650
Superintendent Salary $230,000 $198,772
Percent of Budget for Teacher Salaries 38% 37%
Percent of Budget for Administrative Salaries 6% 6% For detailed information on salaries, see the CDE Certificated Salaries & Benefits Web page at http://www.cde.ca.gov/ds/fd/cs/. Advanced Placement (AP) Courses (School Year 2015-16)
Subject Number of AP Courses Offered* Percent of Students In AP Courses
Computer Science 0 N/A
English------- 2 N/A
Fine and Performing Arts 0 N/A
Foreign Language 2 N/A
Mathematics 2 N/A
Science------- 3 N/A
Social Science 5 N/A
All courses 14 .1 Cells with N/A values do not require data. *Where there are student course enrollments of at least one student.

2015-16 School Accountability Report Card for California Virtual Academy at Los Angeles Page 19 of 20
Professional Development (Most Recent Three Years)
California Virtual Academy @ Los Angeles's professional development activities for the TK-12th grade staff are designed to be pertinent to staff professional needs and to enhance student instruction and learning. A variety of staff development opportunities are provided to increase interest and expertise, acquire new ideas and materials, and develop instructional techniques, strategies, organization, and classroom management skills. California Virtual Academy @ Los Angeles’s administration staff holds meetings in person, as well as virtually, various time of the year to provide staff professional development. In Person professional development meetings occur at the beginning of the school year, and quarterly thereafter. Virtual teacher meetings also occur regularly throughout the year. Teachers are also welcome to research and attend workshops they feel will be beneficial to the enhancement of their profession. Administration provides surveys to both staff members and parents to determine areas of need in Professional Development for teachers on a regular basis (monthly and at the end of each school year). Lead teachers provide expertise in areas of strength through ongoing training and support to staff. Each department within the school provides specific professional development for teachers. The Elementary Department staff participates in both in-person and virtual professional development throughout the year. A one-day, in-person professional development conference is held in August prior to students starting school. This conference provides dynamic opportunities for all elementary staff to engage in collaboration, professional development, and preparation for the upcoming school year. It also provides a unique venue for teachers and leaders alike to work together in person, both in large and small groups, to focus on program updates, instructional excellence, and student achievement. Professional Development topics for each school year are selected based on feedback provided by staff on surveys and from our Student Achievement Plans, which are grade-level curriculum and support maps to help teachers guide their instruction and support students on their individual path to success. Virtual professional developments are held monthly and 2015-16 topics include: i-Ready: Understanding the Data and Utilizing the Resources for Effective Instruction, Effective Instruction: Planning with the End in Mind (using rubrics and anchors to teach effectively), Student Engagement in the Virtual Classroom, Student Referral Processes; Standards Mastery/Mid-Year Diagnostic; Instructional Grouping, Common Core State Standards Valentine Party, and Planning for a Strong Finish to the 15-16 school year. In addition, staff has utilized the book Teach Like A Champion for two years as part of ongoing professional development. For the 16-17 school year, the Elementary Department also participated in an in-person professional development meeting in August focused on creating individualized learning plans, tracking of attendance, curriculum updates, and grade level collaboration/lesson planning. We then met again in October in-person again. This time our professional development was focused on Common Core Instruction, Instructional grouping, and grade level collaboration. During this collaboration, teachers evaluated student work together and reviewed data to make decisions regarding their instructional program. A virtual professional development was held in December where teachers had the opportunity to choose their areas of focus/growth individualized to meet teachers' needs. Sessions offered focused on student engagement, Common Core Instruction, and supporting advanced learners. Teachers were also provided professional development from our curriculum team on Mark12 and utilizing benchmarks for assessment purposes in grades K-1. Another in-person professional development is planned for March and a survey will be sent to teachers to collect feedback on what they would like to see as part of this meeting. Professional Learning Communities (PLCs) were initiated in January of 2015. These monthly collaborative group meetings allow grade level/content specific teachers to meet together, dive into and dissect the Common Core State Standards, and plan for effective instruction “with the end result in mind.” Based on the amount of positive teacher feedback received, PLCs have continued for the 2015-2016 school year. Locally-based, in-person Teacher Collaboration Days are held each quarter. These meetings provide an opportunity for teachers to meet with regional teaching teams, discuss student engagement and achievement, plan for upcoming events, and share best teaching practices with a hands-on approach. Elementary staff are encouraged and supported with attending professional development opportunities outside of California Virtual Academy @ Los Angeles. Staff that attend an outside conference present an overview of what was learned and/or provide training to colleagues. PD events that have been attended by the elementary staff include: Southern CA Kindergarten Conference, California Reading Association Conference, Common Core Math (Building Partnerships with Families) Conference, and the STEM Conference.

2015-16 School Accountability Report Card for California Virtual Academy at Los Angeles Page 20 of 20
Middle school staff professional development is determined by survey feedback of all middle school staff. Administration chose specific topics of focus based on the results of the survey, which specifically included: Meaningful Instruction Based on Student Data, Rescuing At Risk Students,Setting High Student Expectations, and Monitoring Student Growth and Potential. Based on teacher's area of focus of student academic needs through the course of the school year, strategic professional development was provided to support teachers in student engagement and academic achievement. The structure of the professional development meetings was research based in an adult learner format, along with the "CAVA Connection" for each topic. From the results of each monthly survey, administration continued to ensure that this professional development remained relevant for teachers and students achievement. Further, the Los Angeles Middle School teachers and administrators meet quarterly in person. These in person meetings are designed for teachers to collaborate on student achievement and instructional planning. High School Professional Development was developed in response to feedback obtained from staff through surveys and conversations with staff. All high school teachers will participate in quarterly Professional Learning Communities (PLCs). These cooperative groups will be led by Curriculum Specialists. This will afford the teachers an opportunity to brainstorm new ideas, work with current data, share best practices, and learn from one another. In-person Teacher Collaboration Days, led by the RLT of each region, will take place in November and March. These Professional Development opportunities will provide guidance on developing and monitoring personal SMART goals, sharing of best practices, learning about new trends and resources available to teachers, analyzing performance and perception data gathered from the Campus 3 students and families, and collaborative work time. Every high school will meet monthly with their Regional Lead Teacher to work on their own personal Professional Development passions and goals. These 30-minute meetings will be teacher-directed and topics will vary from month to month and teacher to teacher. Teachers will be informally observed by their assigned Regional Lead Teacher or Curriculum Specialist monthly. There will be feedback and coaching provided after each observation. High school teachers will attend yearly professional development on testing to include, but not limited to, CAASPP overview, Proctor Responsibilities, Testing walk through, Technology Training, and Special Education. High school teachers are also encouraged to find professional development opportunities outside of CAVA that will help develop their skills as an online educator. Completion of the designated PD proposal form and approval by the Principal will need to happen prior to the teacher enrolling. California Virtual Academy @ Los Angeles's Intervention Specialists work closely with those students who are struggling with math and language arts. Professional development for this team has focused on instructional strategies for improving the quality of instruction, closely monitoring progress, and adapting lessons to meet the needs of individual learners. The intervention department partnered with an expert from the National Center on Intensive Intervention to provide professional development tailored to the unique needs of this team. Professional development is in-person once per semester, and occurs virtually monthly. These events encourage staff to collaborate and participate in case studies to strengthen the impact of instruction with California Virtual Academy @ Los Angeles students.