Embed Size (px)
Citation preview

California Transportation Fuel Trends in Historical Demand
Joint Lead Commissioner Workshop on Transportation Energy Demand Forecasts
June 24, 2015
Gordon SchrempEnergy Assessments Division
California Energy Commission
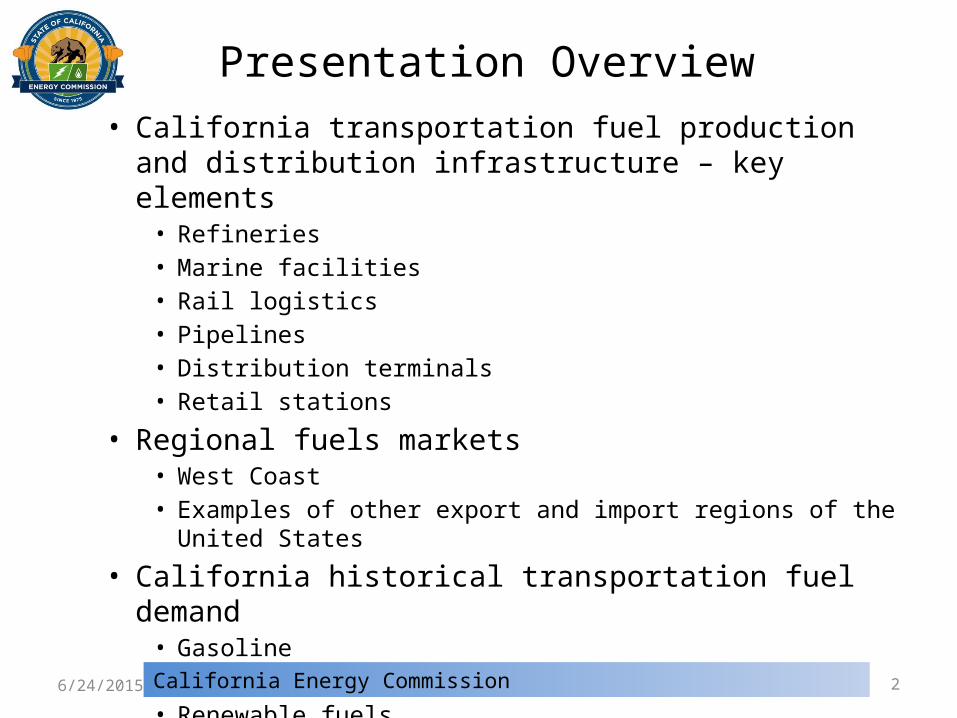
Presentation Overview• California transportation fuel production and distribution
infrastructure – key elements• Refineries• Marine facilities• Rail logistics• Pipelines• Distribution terminals• Retail stations
• Regional fuels markets• West Coast• Examples of other export and import regions of the United States
• California historical transportation fuel demand• Gasoline• Diesel fuel• Renewable fuels
6/24/2015 California Energy Commission 2

Transportation FuelInfrastructure Overview
California Energy Commission6/24/2015 3

Fuel Infrastructure – Key Elements
• The California transportation fuel “infrastructure” consists of several interconnected assets operated by a combination of refiner and third-party companies:
• Refineries• Marine facilities• Rail logistics• Pipelines• Distribution terminals• Retail stations
• Crude oil and petroleum product infrastructure assets separate and distinct from one another – not interchangeable
• Unlike electricity distribution system, Northern California is not directly connected to Southern California
6/24/2015 California Energy Commission 4
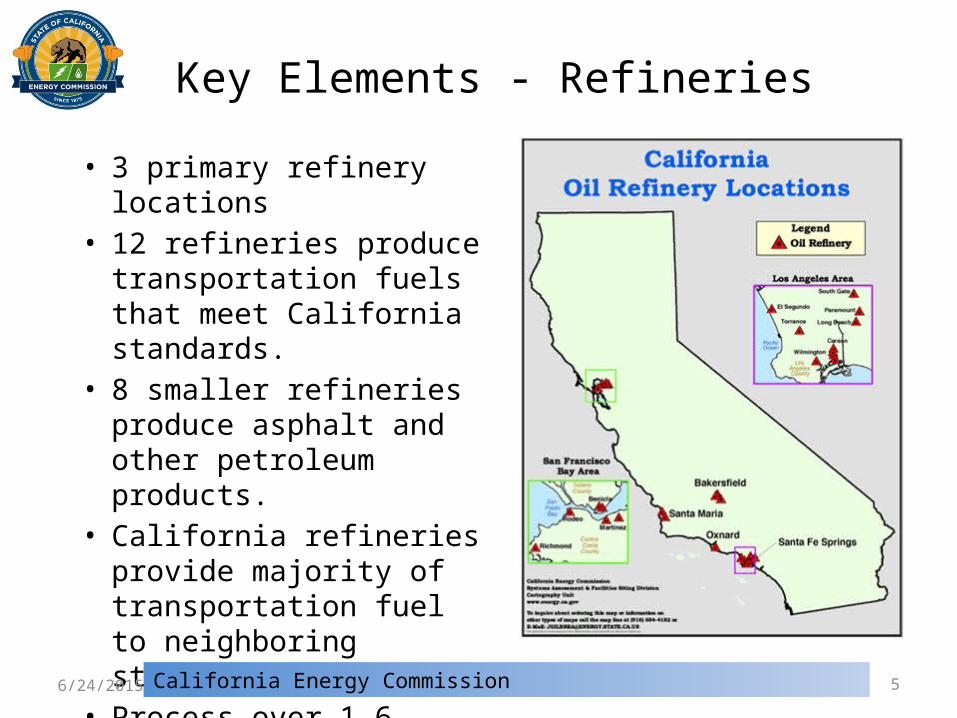
Key Elements - Refineries
• 3 primary refinery locations• 12 refineries produce
transportation fuels that meet California standards.
• 8 smaller refineries produce asphalt and other petroleum products.
• California refineries provide majority of transportation fuel to neighboring states.
• Process over 1.6 million barrels per day of crude oil
6/24/2015 California Energy Commission 5
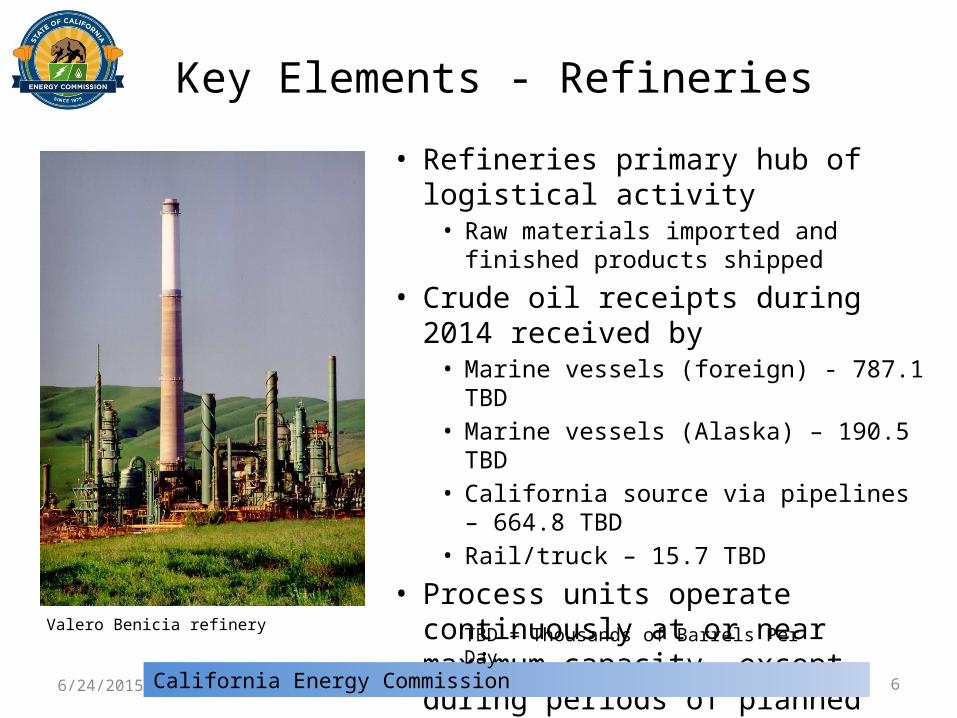
Key Elements - Refineries
• Refineries primary hub of logistical activity• Raw materials imported and finished products
shipped• Crude oil receipts during 2014 received by
• Marine vessels (foreign) - 787.1 TBD• Marine vessels (Alaska) – 190.5 TBD• California source via pipelines – 664.8 TBD• Rail/truck – 15.7 TBD
• Process units operate continuously at or near maximum capacity, except during periods of planned maintenance or unplanned outages.
6/24/2015 California Energy Commission 6
TBD = Thousands of Barrels Per DayValero Benicia refinery

Key Elements – Marine Facilities
• Marine facilities located in sheltered harbors with adequate draught to accommodate typical sizes of petroleum product tankers and crude oil vessels.
• Wharves usually have adjacent storage tanks that are used to temporarily hold petroleum products prior to transfer to a subsequent location.
• Most refiners operate a proprietary dock.• Third party storage provides access to majors and independents.
• Kinder Morgan• Pacific Atlantic• NuStar• Petro-Diamond
6/24/2015 California Energy Commission 7

Key Elements - Rail Logistics• Refiners use rail cars to routinely ship propane and seasonally
send out and receive butane.• Rail cars are also used to deliver refinery feedstock such as gas
oils and sulfuric acid for alkylation units.• More recently, California refiners have started using rail cars to
import crude oil from Canada and domestic sources outside the state due to changing trends of increasing oil production and discounted prices.
6/24/2015 California Energy Commission 8

Key Elements – Pipelines• Pipelines used throughout the distribution infrastructure to
interconnect key elements• Intra-state pipelines used to convey petroleum products within
California’s borders to distribution terminals• Interstate pipelines used to export transportation fuels to
Arizona and Nevada• NV – Over 90% of supply• AZ – Over 50% of supply
• Like refineries, pipeline systems normally operate on a continuous basis.
• Pipelines can only operate if transportation fuels are available to push liquid through the system.
6/24/2015 California Energy Commission 9

Key Elements - Pipelines (cont)
• The pipeline infrastructure in California is controlled by a combination of common carrier and private companies.
• Kinder Morgan is the sole common carrier of petroleum product pipelines in the State and transports the majority of fuels through its system every day.
• Other companies, such as Chevron, ExxonMobil, Shell, and Tesoro operate proprietary systems or segments that handle the balance of transportation fuels.
6/24/2015 California Energy Commission 10
Kinder Morgan northern system

Key Elements – Distribution Terminals• Output from the refineries is usually placed in intermediate
tanks prior to blending the finished products.• The majority of gasoline, diesel and jet fuel is shipped from the
refinery by pipeline to over 60 distribution terminals.• Tanker trucks then transport fuel to retail & non-retail stations.• Several truck trips during 2014:
• Gasoline – 40.28 MM gal/day• 5,035 tanker deliveries/day
• Diesel fuel – 9.68 MM gal/day• 1,210 tanker deliveries/day
6/24/2015 California Energy Commission 11

Key Elements – Retail Stations
• Consumers obtain transportation fuels mainly from retail locations accessible to the public, along with card-lock facilities that require membership.
• Approximately 10,000 locations available during 2012.• Projections based on Energy Commission’s annual A15 survey• Monthly sales can vary significantly by location
• Statewide average of 120,718 gallons per month per location• Example below from SF Bay Area counties illustrates that hyper-marts can
average over 12 times higher volumes per location
6/24/2015 California Energy Commission 12
Average Retail Sites Average Retail Sites AverageCalifornia Gasoline 500,000 to Gasoline Greater Than GasolineBay Area Retail Throughput 1,000,000 Throughput 1,000,000 ThroughputCounty Sites Gallons/Month Gallons/Month Gallons/Month Gallons/Month Gallons/MonthAlameda 371 127,583 32 671,635 15 1,572,757Contra Costa 291 119,989 37 695,126 8 1,678,949Marin 68 131,127 8 661,454 2 1,822,102Napa 37 130,631 5 649,739 1 2,102,774San Francisco 100 124,167 12 701,016 2 1,187,214San Mateo 197 129,442 19 651,417 6 1,777,563Santa Clara 393 147,795 28 651,525 13 1,660,441Subtotals 1,457 131,778 141 672,228 47 1,646,712Source: California Energy Commission
Analysis of A15 Retail Survey Data From CY 2012
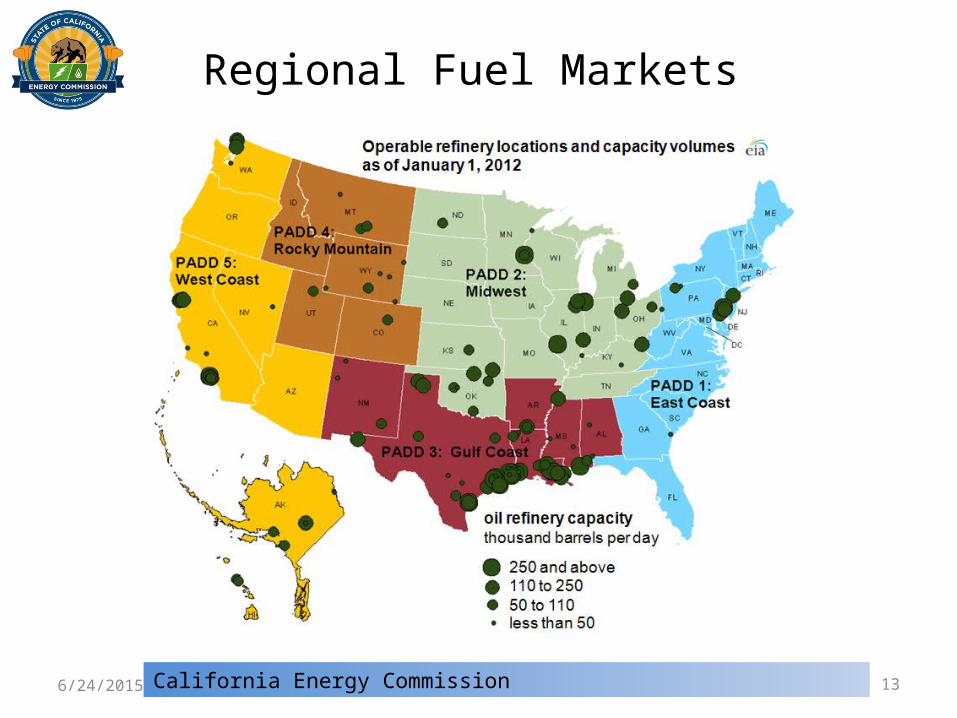
Regional Fuel Markets
California Energy Commission6/24/2015 13

Western States More Isolated than Rest of U.S.
California Energy Commission6/24/2015 14
Significant unplanned refinery outages can create price spikes due to isolated market.

California Fuels Market is Balanced• California is nearly self-sufficient
• Marine imports normally account for less than 5 percent of gasoline supply• Primary sources of transportation fuels originate from inside the state
• Other regions of the United States vary significantly compared to California
• Price spikes following significant unplanned refinery outages less common
6/24/2015 California Energy Commission 15
Large net exporting region Large net importing region

California Historical TransportationFuel Demand
California Energy Commission6/24/2015 16
First Anaheim service station - 1920 Mobil station attendant - 1925

0
2,000,000
4,000,000
6,000,000
8,000,000
10,000,000
12,000,000
14,000,000
16,000,000
18,000,000
1945
1948
1951
1954
1957
1960
1963
1966
1969
1972
1975
1978
1981
1984
1987
1990
1993
1996
1999
2002
2005
2008
2011
2014
Thou
sand
s of G
allo
ns
Source: California Energy Commission
Since the peak in 2004, gasoline consumption declined seven of the next eight years.
Gasoline consumption dropped 8.94 percent between 2004 and 2012.
2014 consumption up 1.11 percent compared to 2013.
Long-term California Gasoline Consumption
California Energy Commission6/24/2015 17
Gasoline demand rebound following 2008 recession lagged that of diesel fuel due to slower job recovery.

Near-term Gasoline & Renewable Demand• 14.70 billion gallons of
finished gasoline consumed in 2014.
• Base gasoline demand down 12.43 percent between 2003 and 2014
• Ethanol use increasing due to Renewable Fuel Standard
• Ethanol use up to 1.48 billion gallons during 2014
• 151 percent increase since 2003
• Ethanol accounted for 10.06 percent of total gasoline gallon during 2014
• Due to 11.1 MM gallons of E85 use during 2014
6/24/2015 California Energy Commission 18
0
2,000,000,000
4,000,000,000
6,000,000,000
8,000,000,000
10,000,000,000
12,000,000,000
14,000,000,000
16,000,000,000
18,000,000,000
2003 2004 2005 2006 2007 2008 2009 2010 2011 2012 2013 2014
Gal
lons
California Gasoline & Ethanol Demand2003 - 2014
Base Gasoline Ethanol

525
381
814
596
0
100
200
300
400
500
600
700
800
900
1945
1948
1951
1954
1957
1960
1963
1966
1969
1972
1975
1978
1981
1984
1987
1990
1993
1996
1999
2002
2005
2008
2011
Gal
lons
of G
asol
ine
Per P
erso
n Pe
r Yea
r
Per CapitaPer Driver
Between 1978 and 2013 Per Capita Consumption Has Decreased 27.4 Percent
Population Source: California Department of Finance Demographic Research Unit, December 2013
Gasoline Source: California Energy Commission Analysis of Federal Highway Administration and CA Board of Equalization Data
Between 1973 and 2013 Per Driver Consumption Has Decreased 26.7 Percent
Improving Efficiency of Calif. Gasoline Use
California Energy Commission6/24/2015 19

1,301,025
2,785,942
2,201,614
3,805,503
3,200,244
3,533,890
0
500,000
1,000,000
1,500,000
2,000,000
2,500,000
3,000,000
3,500,000
4,000,000
1976 1978 1980 1982 1984 1986 1988 1990 1992 1994 1996 1998 2000 2002 2004 2006 2008 2010 2012 2014
Thou
sand
s of
Gal
lons
Sources: California Energy Commission analysis of data from the Board of Equalization and Energy Information Administration.
Compound Annual Growth Rate (CAGR) of 6.55 percent between 1978 and 1988.
CAGR of 3.99 percent between 1993 and 2007.
CAGR of 2.00 percent between 2009 and 2014.
Trend - diesel fuel demand growth rates declining over time.
Long-term California Diesel Fuel Consumption
California Energy Commission6/24/2015 20

0
500,000,000
1,000,000,000
1,500,000,000
2,000,000,000
2,500,000,000
3,000,000,000
3,500,000,000
4,000,000,000
2003 2004 2005 2006 2007 2008 2009 2010 2011 2012 2013 2014
Gal
lons
California Diesel, Biodiesel & Renewable Diesel Demand 2003 - 2014
Diesel Fuel Renewable Diesel Biodiesel
Near-term Diesel and Renewable Demand• 3.53 billion gallons diesel
consumed during 2014.• Base diesel fuel demand up
2.33 percent between 2003 and 2014.
• Biodiesel use increasing due to Renewable Fuel Standard and the Low Carbon Fuel Standard (LCFS.)
• 57 MM gallons during 2014• Renewable diesel fuel use up
to 105 MM gallons during 2014 due to LCFS.
• Combined renewable component accounted for 4.6 percent of total diesel gallon during 2014.
6/24/2015 California Energy Commission 21

Questions?
California Energy Commission6/24/2015 22