Embed Size (px)
Citation preview
MEMBERS
JOHN CHIANG, CHAIRMAN State Treasurer
BETTY YEE State Controller
MICHAEL COHEN Director of Finance
EXECUTIVE DIRECTOR Mark Stivers
915 Capitol Mall, Suite 485 Sacramento, CA 95814 p (916) 654-6340 f (916) 654-6033 [email protected] www.treasurer.ca.gov/ctcac
CALIFORNIA TAX CREDIT ALLOCATION COMMITTEE
DATE: January 19, 2018 TO: Tax Credit Applicants FROM: Mark Stivers, Executive Director RE: Methodology for Determining Rural Status of Project Site for 2018 Applications Pursuant to California law, the California Tax Credit Allocation Committee (“TCAC” or “Committee”) shall set aside twenty percent (20%) of all annual nine percent (9%) federal credits for projects in rural areas.1 With certain limited exceptions, TCAC regulations require all projects located in rural areas to compete for credits in the rural set-aside.2 Therefore, all applicants competing for nine percent (9%) tax credits must document, to the Committee’s satisfaction, the rural or non-rural status of their projects. Section 50199.21 of the Health and Safety Code defines “rural area” as an area that satisfies one of three criteria on January 1 of any calendar year. A project competing in the rural set-aside must demonstrate that the project area is rural under one of the three methodologies listed under Section 50199.21 of the Health and Safety Code and detailed in this memo:
1. Non-metropolitian Counties; 2. Rural Housing Service (RHS) Eligible Area; or 3. Small City Status.
Continue reading for complete instructions on determining rural status via the three methodologies. See also attached Exhibits:
Exhibit A: Health and Safety Code Sections 50199.20 and 50199.21 Exhibit B: USDA Section 515 Designated Places List Exhibit C: Department of Finance 2017 Population Estimates (as available May 2017)
1 REV.& TAX. § 23610.5(j)(5); HEALTH & SAFETY § 50199.20. 2 CAL. CODE. REGS. tit. 4, § 10315(c).
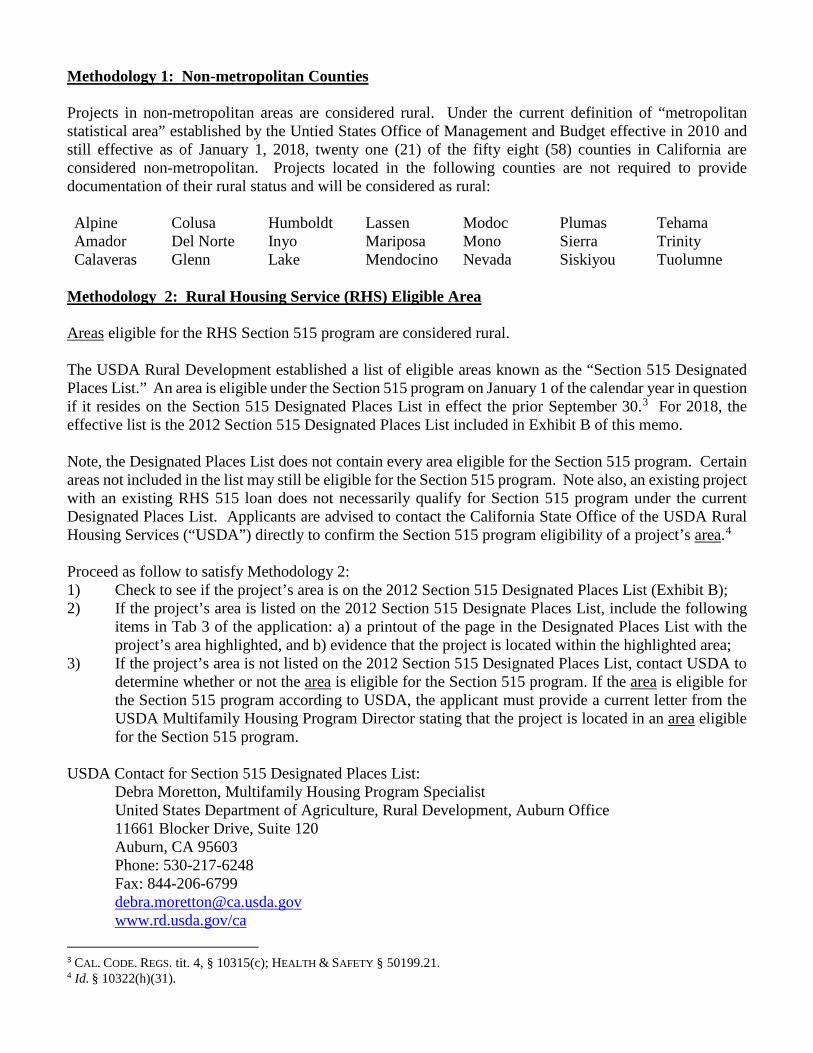
Methodology 1: Non-metropolitan Counties Projects in non-metropolitan areas are considered rural. Under the current definition of “metropolitan statistical area” established by the Untied States Office of Management and Budget effective in 2010 and still effective as of January 1, 2018, twenty one (21) of the fifty eight (58) counties in California are considered non-metropolitan. Projects located in the following counties are not required to provide documentation of their rural status and will be considered as rural: Alpine Colusa Humboldt Lassen Modoc Plumas Tehama Amador Del Norte Inyo Mariposa Mono Sierra Trinity Calaveras Glenn Lake Mendocino Nevada Siskiyou Tuolumne
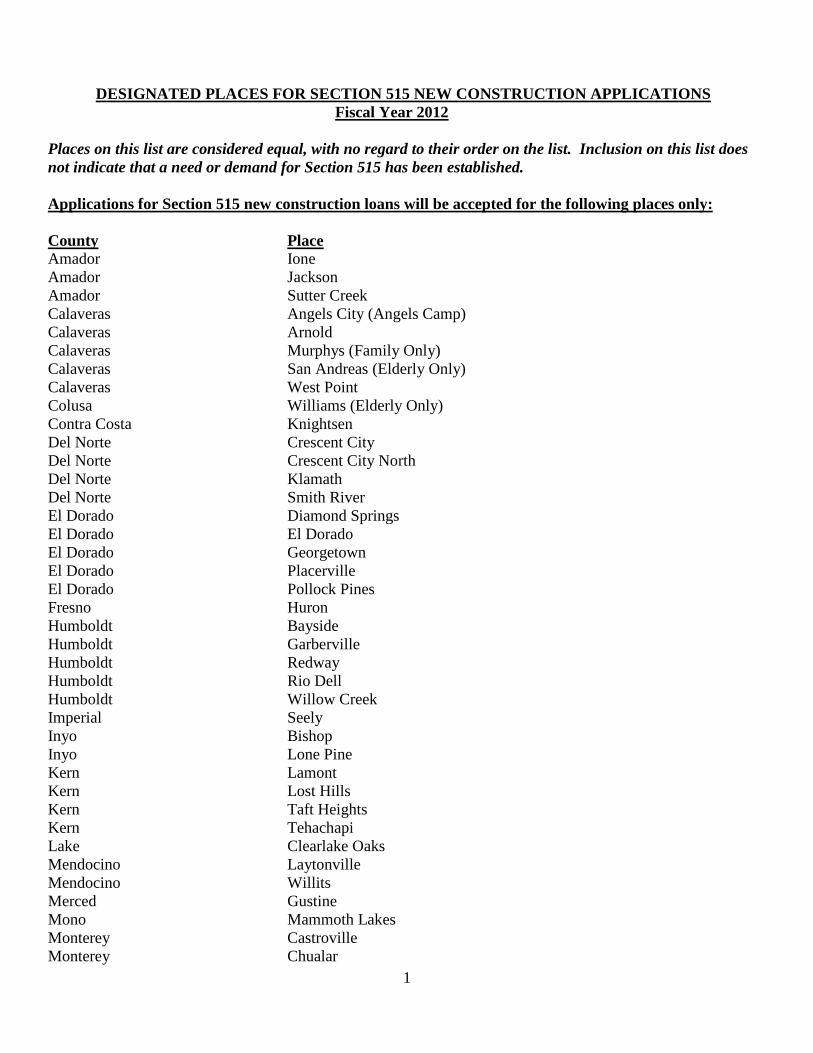
Methodology 2: Rural Housing Service (RHS) Eligible Area Areas eligible for the RHS Section 515 program are considered rural. The USDA Rural Development established a list of eligible areas known as the “Section 515 Designated Places List.” An area is eligible under the Section 515 program on January 1 of the calendar year in question if it resides on the Section 515 Designated Places List in effect the prior September 30.3 For 2018, the effective list is the 2012 Section 515 Designated Places List included in Exhibit B of this memo. Note, the Designated Places List does not contain every area eligible for the Section 515 program. Certain areas not included in the list may still be eligible for the Section 515 program. Note also, an existing project with an existing RHS 515 loan does not necessarily qualify for Section 515 program under the current Designated Places List. Applicants are advised to contact the California State Office of the USDA Rural Housing Services (“USDA”) directly to confirm the Section 515 program eligibility of a project’s area.4 Proceed as follow to satisfy Methodology 2: 1) Check to see if the project’s area is on the 2012 Section 515 Designated Places List (Exhibit B); 2) If the project’s area is listed on the 2012 Section 515 Designate Places List, include the following
items in Tab 3 of the application: a) a printout of the page in the Designated Places List with the project’s area highlighted, and b) evidence that the project is located within the highlighted area;
3) If the project’s area is not listed on the 2012 Section 515 Designated Places List, contact USDA to determine whether or not the area is eligible for the Section 515 program. If the area is eligible for the Section 515 program according to USDA, the applicant must provide a current letter from the USDA Multifamily Housing Program Director stating that the project is located in an area eligible for the Section 515 program.
USDA Contact for Section 515 Designated Places List:
Debra Moretton, Multifamily Housing Program Specialist United States Department of Agriculture, Rural Development, Auburn Office 11661 Blocker Drive, Suite 120 Auburn, CA 95603 Phone: 530-217-6248 Fax: 844-206-6799 [email protected] www.rd.usda.gov/ca
3 CAL. CODE. REGS. tit. 4, § 10315(c); HEALTH & SAFETY § 50199.21. 4 Id. § 10322(h)(31).
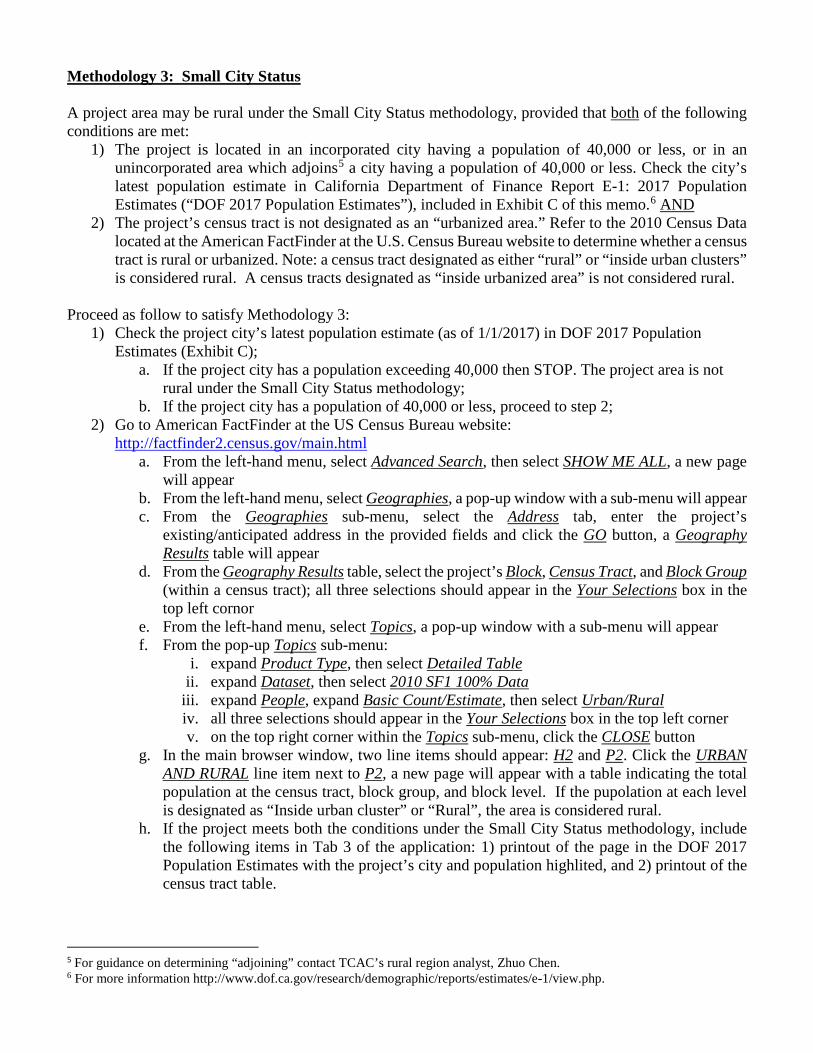
Methodology 3: Small City Status A project area may be rural under the Small City Status methodology, provided that both of the following conditions are met:
1) The project is located in an incorporated city having a population of 40,000 or less, or in an unincorporated area which adjoins5 a city having a population of 40,000 or less. Check the city’s latest population estimate in California Department of Finance Report E-1: 2017 Population Estimates (“DOF 2017 Population Estimates”), included in Exhibit C of this memo.6 AND
2) The project’s census tract is not designated as an “urbanized area.” Refer to the 2010 Census Data located at the American FactFinder at the U.S. Census Bureau website to determine whether a census tract is rural or urbanized. Note: a census tract designated as either “rural” or “inside urban clusters” is considered rural. A census tracts designated as “inside urbanized area” is not considered rural.
Proceed as follow to satisfy Methodology 3:
1) Check the project city’s latest population estimate (as of 1/1/2017) in DOF 2017 Population Estimates (Exhibit C);
a. If the project city has a population exceeding 40,000 then STOP. The project area is not rural under the Small City Status methodology;
b. If the project city has a population of 40,000 or less, proceed to step 2; 2) Go to American FactFinder at the US Census Bureau website:
http://factfinder2.census.gov/main.html a. From the left-hand menu, select Advanced Search, then select SHOW ME ALL, a new page
will appear b. From the left-hand menu, select Geographies, a pop-up window with a sub-menu will appear c. From the Geographies sub-menu, select the Address tab, enter the project’s
existing/anticipated address in the provided fields and click the GO button, a Geography Results table will appear
d. From the Geography Results table, select the project’s Block, Census Tract, and Block Group (within a census tract); all three selections should appear in the Your Selections box in the top left cornor
e. From the left-hand menu, select Topics, a pop-up window with a sub-menu will appear f. From the pop-up Topics sub-menu:
i. expand Product Type, then select Detailed Table ii. expand Dataset, then select 2010 SF1 100% Data
iii. expand People, expand Basic Count/Estimate, then select Urban/Rural iv. all three selections should appear in the Your Selections box in the top left corner v. on the top right corner within the Topics sub-menu, click the CLOSE button
g. In the main browser window, two line items should appear: H2 and P2. Click the URBAN AND RURAL line item next to P2, a new page will appear with a table indicating the total population at the census tract, block group, and block level. If the pupolation at each level is designated as “Inside urban cluster” or “Rural”, the area is considered rural.
h. If the project meets both the conditions under the Small City Status methodology, include the following items in Tab 3 of the application: 1) printout of the page in the DOF 2017 Population Estimates with the project’s city and population highlited, and 2) printout of the census tract table.
5 For guidance on determining “adjoining” contact TCAC’s rural region analyst, Zhuo Chen. 6 For more information http://www.dof.ca.gov/research/demographic/reports/estimates/e-1/view.php.

Technical Assistance: For assistance or information regarding TCAC’s rural status determination, contact TCAC’s rural region analyst, Zhuo Chen, at 916-651-7708 or [email protected].

EXHIBIT A
Health and Safety Code Sections 50199.20 and 50199.21
(Attached)
Health and Safety Code
Sections 50199.20 and 50199.21
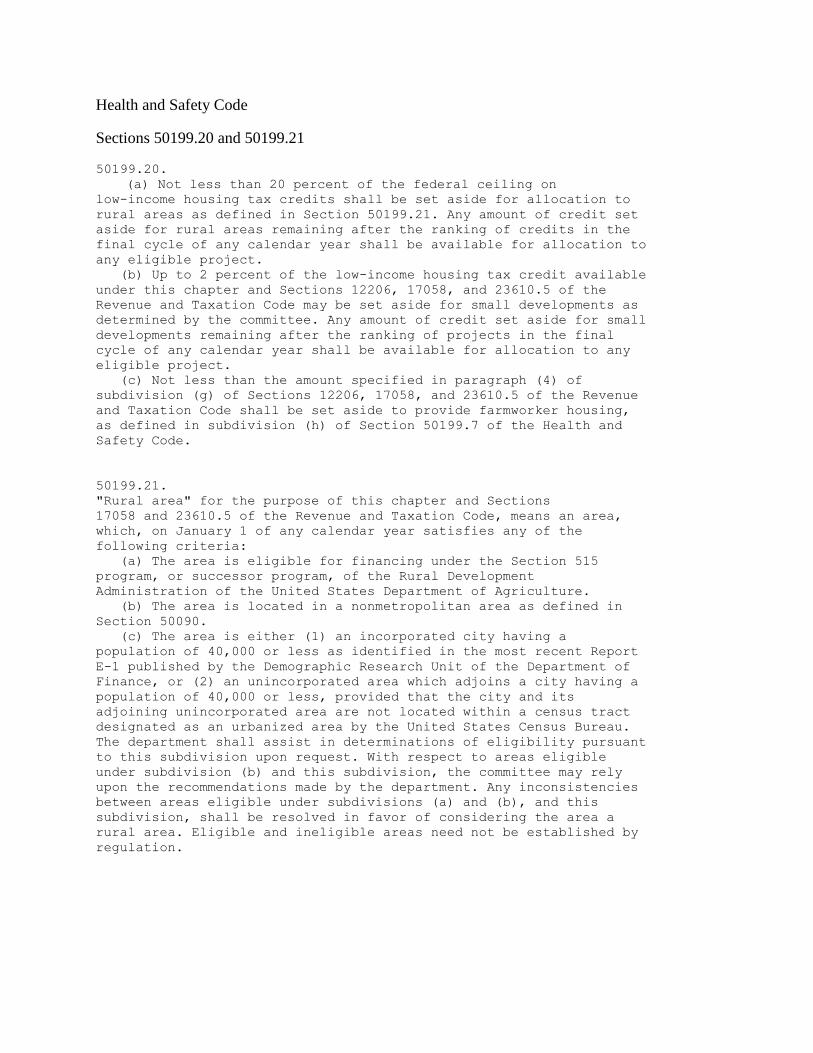
50199.20.
(a) Not less than 20 percent of the federal ceiling on
low-income housing tax credits shall be set aside for allocation to
rural areas as defined in Section 50199.21. Any amount of credit set
aside for rural areas remaining after the ranking of credits in the
final cycle of any calendar year shall be available for allocation to
any eligible project.
(b) Up to 2 percent of the low-income housing tax credit available
under this chapter and Sections 12206, 17058, and 23610.5 of the
Revenue and Taxation Code may be set aside for small developments as
determined by the committee. Any amount of credit set aside for small
developments remaining after the ranking of projects in the final
cycle of any calendar year shall be available for allocation to any
eligible project.
(c) Not less than the amount specified in paragraph (4) of
subdivision (g) of Sections 12206, 17058, and 23610.5 of the Revenue
and Taxation Code shall be set aside to provide farmworker housing,
as defined in subdivision (h) of Section 50199.7 of the Health and
Safety Code.
50199.21.
"Rural area" for the purpose of this chapter and Sections
17058 and 23610.5 of the Revenue and Taxation Code, means an area,
which, on January 1 of any calendar year satisfies any of the
following criteria:
(a) The area is eligible for financing under the Section 515
program, or successor program, of the Rural Development
Administration of the United States Department of Agriculture.
(b) The area is located in a nonmetropolitan area as defined in
Section 50090.
(c) The area is either (1) an incorporated city having a
population of 40,000 or less as identified in the most recent Report
E-1 published by the Demographic Research Unit of the Department of
Finance, or (2) an unincorporated area which adjoins a city having a
population of 40,000 or less, provided that the city and its
adjoining unincorporated area are not located within a census tract
designated as an urbanized area by the United States Census Bureau.
The department shall assist in determinations of eligibility pursuant
to this subdivision upon request. With respect to areas eligible
under subdivision (b) and this subdivision, the committee may rely
upon the recommendations made by the department. Any inconsistencies
between areas eligible under subdivisions (a) and (b), and this
subdivision, shall be resolved in favor of considering the area a
rural area. Eligible and ineligible areas need not be established by
regulation.
EXHIBIT B
USDA Section 515 Designated Places List
(Attached)
1
DESIGNATED PLACES FOR SECTION 515 NEW CONSTRUCTION APPLICATIONS Fiscal Year 2012
Places on this list are considered equal, with no regard to their order on the list. Inclusion on this list does not indicate that a need or demand for Section 515 has been established. Applications for Section 515 new construction loans will be accepted for the following places only: County Place Amador Ione Amador Jackson Amador Sutter Creek Calaveras Angels City (Angels Camp) Calaveras Arnold Calaveras Murphys (Family Only) Calaveras San Andreas (Elderly Only) Calaveras West Point Colusa Williams (Elderly Only) Contra Costa Knightsen Del Norte Crescent City Del Norte Crescent City North Del Norte Klamath Del Norte Smith River El Dorado Diamond Springs El Dorado El Dorado El Dorado Georgetown El Dorado Placerville El Dorado Pollock Pines Fresno Huron Humboldt Bayside Humboldt Garberville Humboldt Redway Humboldt Rio Dell Humboldt Willow Creek Imperial Seely Inyo Bishop Inyo Lone Pine Kern Lamont Kern Lost Hills Kern Taft Heights Kern Tehachapi Lake Clearlake Oaks Mendocino Laytonville Mendocino Willits Merced Gustine Mono Mammoth Lakes Monterey Castroville Monterey Chualar
2
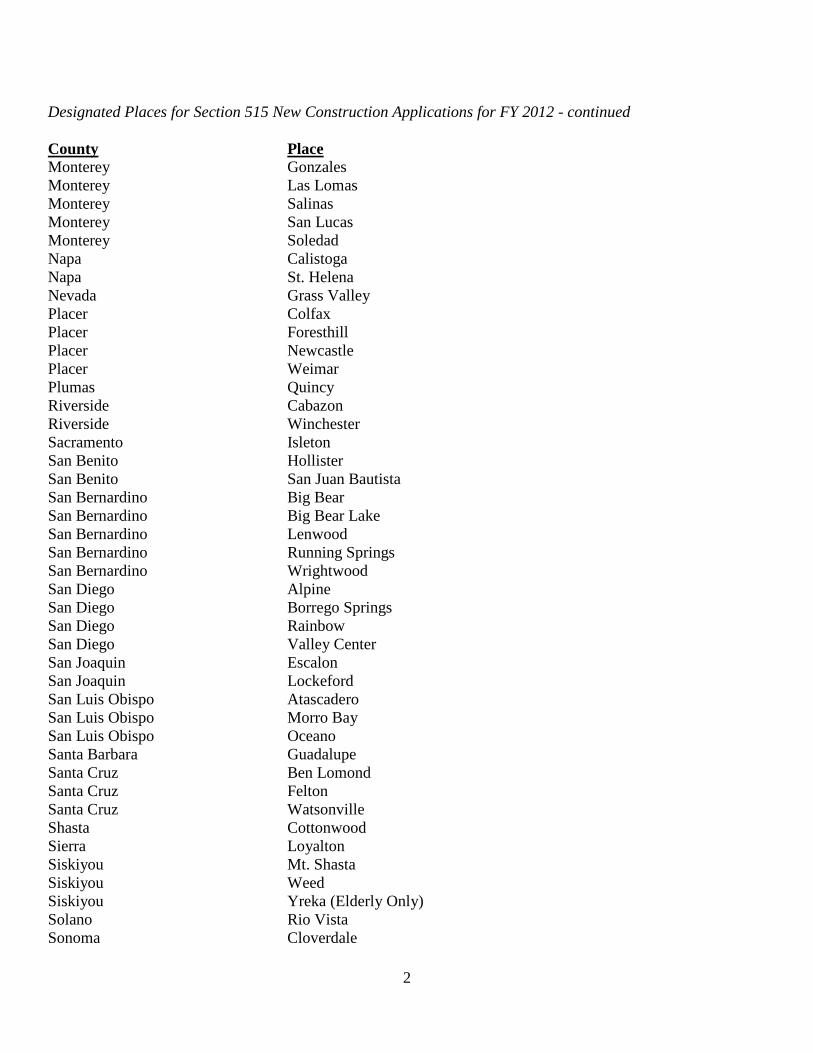
Designated Places for Section 515 New Construction Applications for FY 2012 - continued County Place Monterey Gonzales Monterey Las Lomas Monterey Salinas Monterey San Lucas Monterey Soledad Napa Calistoga Napa St. Helena Nevada Grass Valley Placer Colfax Placer Foresthill Placer Newcastle Placer Weimar Plumas Quincy Riverside Cabazon Riverside Winchester Sacramento Isleton San Benito Hollister San Benito San Juan Bautista San Bernardino Big Bear San Bernardino Big Bear Lake San Bernardino Lenwood San Bernardino Running Springs San Bernardino Wrightwood San Diego Alpine San Diego Borrego Springs San Diego Rainbow San Diego Valley Center San Joaquin Escalon San Joaquin Lockeford San Luis Obispo Atascadero San Luis Obispo Morro Bay San Luis Obispo Oceano Santa Barbara Guadalupe Santa Cruz Ben Lomond Santa Cruz Felton Santa Cruz Watsonville Shasta Cottonwood Sierra Loyalton Siskiyou Mt. Shasta Siskiyou Weed Siskiyou Yreka (Elderly Only) Solano Rio Vista Sonoma Cloverdale
3
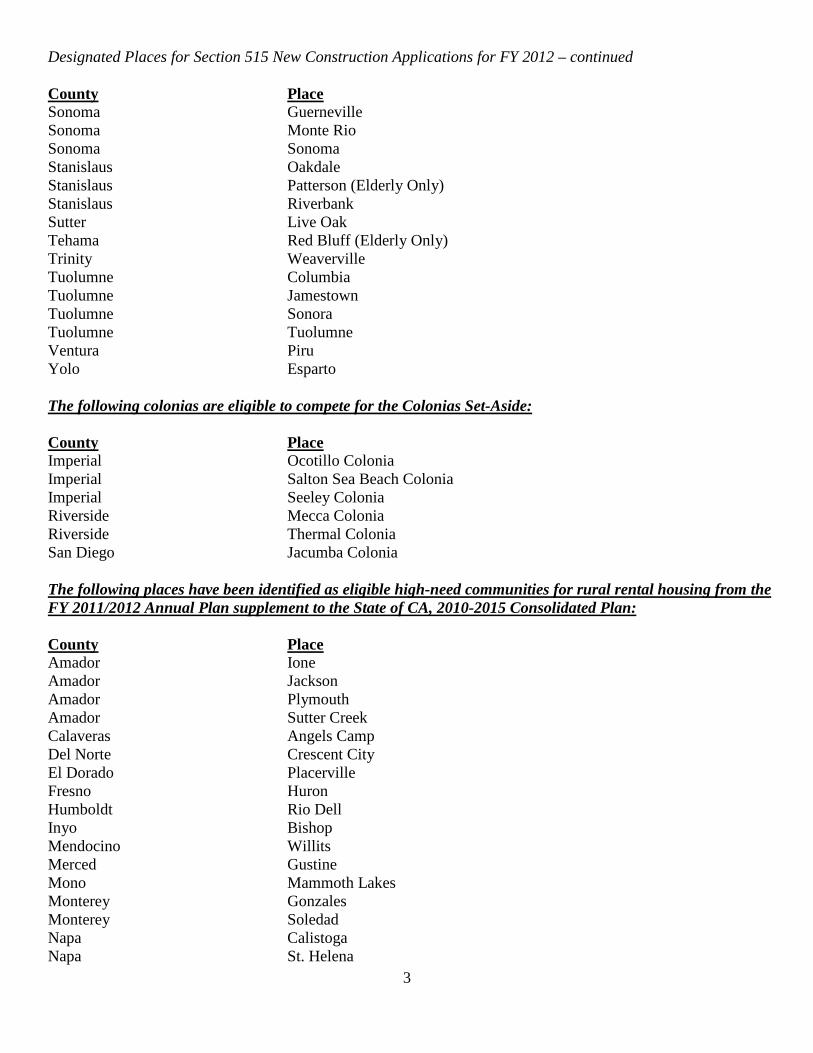
Designated Places for Section 515 New Construction Applications for FY 2012 – continued County Place Sonoma Guerneville Sonoma Monte Rio Sonoma Sonoma Stanislaus Oakdale Stanislaus Patterson (Elderly Only) Stanislaus Riverbank Sutter Live Oak Tehama Red Bluff (Elderly Only) Trinity Weaverville Tuolumne Columbia Tuolumne Jamestown Tuolumne Sonora Tuolumne Tuolumne Ventura Piru Yolo Esparto The following colonias are eligible to compete for the Colonias Set-Aside: County Place Imperial Ocotillo Colonia Imperial Salton Sea Beach Colonia Imperial Seeley Colonia Riverside Mecca Colonia Riverside Thermal Colonia San Diego Jacumba Colonia The following places have been identified as eligible high-need communities for rural rental housing from the FY 2011/2012 Annual Plan supplement to the State of CA, 2010-2015 Consolidated Plan: County Place Amador Ione Amador Jackson Amador Plymouth Amador Sutter Creek Calaveras Angels Camp Del Norte Crescent City El Dorado Placerville Fresno Huron Humboldt Rio Dell Inyo Bishop Mendocino Willits Merced Gustine Mono Mammoth Lakes Monterey Gonzales Monterey Soledad Napa Calistoga Napa St. Helena
4
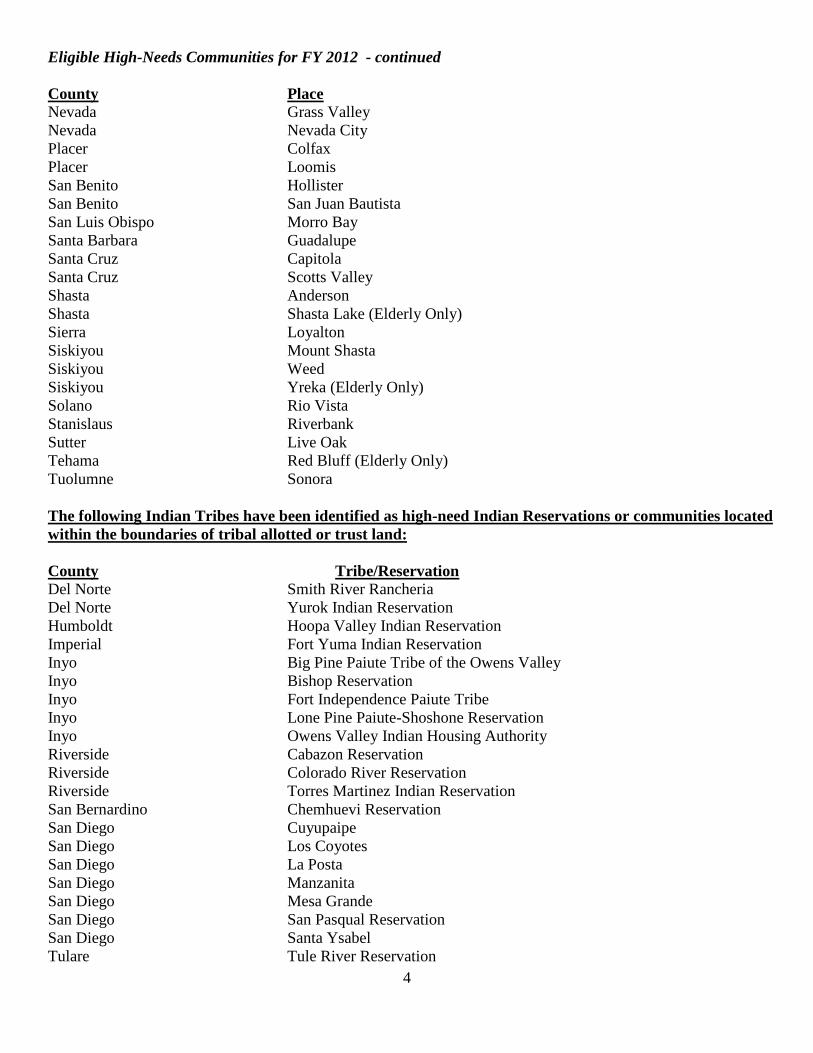
Eligible High-Needs Communities for FY 2012 - continued County Place Nevada Grass Valley Nevada Nevada City Placer Colfax Placer Loomis San Benito Hollister San Benito San Juan Bautista San Luis Obispo Morro Bay Santa Barbara Guadalupe Santa Cruz Capitola Santa Cruz Scotts Valley Shasta Anderson Shasta Shasta Lake (Elderly Only) Sierra Loyalton Siskiyou Mount Shasta Siskiyou Weed Siskiyou Yreka (Elderly Only) Solano Rio Vista Stanislaus Riverbank Sutter Live Oak Tehama Red Bluff (Elderly Only) Tuolumne Sonora The following Indian Tribes have been identified as high-need Indian Reservations or communities located within the boundaries of tribal allotted or trust land: County Tribe/Reservation Del Norte Smith River Rancheria Del Norte Yurok Indian Reservation Humboldt Hoopa Valley Indian Reservation Imperial Fort Yuma Indian Reservation Inyo Big Pine Paiute Tribe of the Owens Valley Inyo Bishop Reservation Inyo Fort Independence Paiute Tribe Inyo Lone Pine Paiute-Shoshone Reservation Inyo Owens Valley Indian Housing Authority Riverside Cabazon Reservation Riverside Colorado River Reservation Riverside Torres Martinez Indian Reservation San Bernardino Chemhuevi Reservation San Diego Cuyupaipe San Diego Los Coyotes San Diego La Posta San Diego Manzanita San Diego Mesa Grande San Diego San Pasqual Reservation San Diego Santa Ysabel Tulare Tule River Reservation

EXHIBIT C
California Department of Finance Report-E1: 2017 Population Estimates
(as available May 2017)
(Attached)
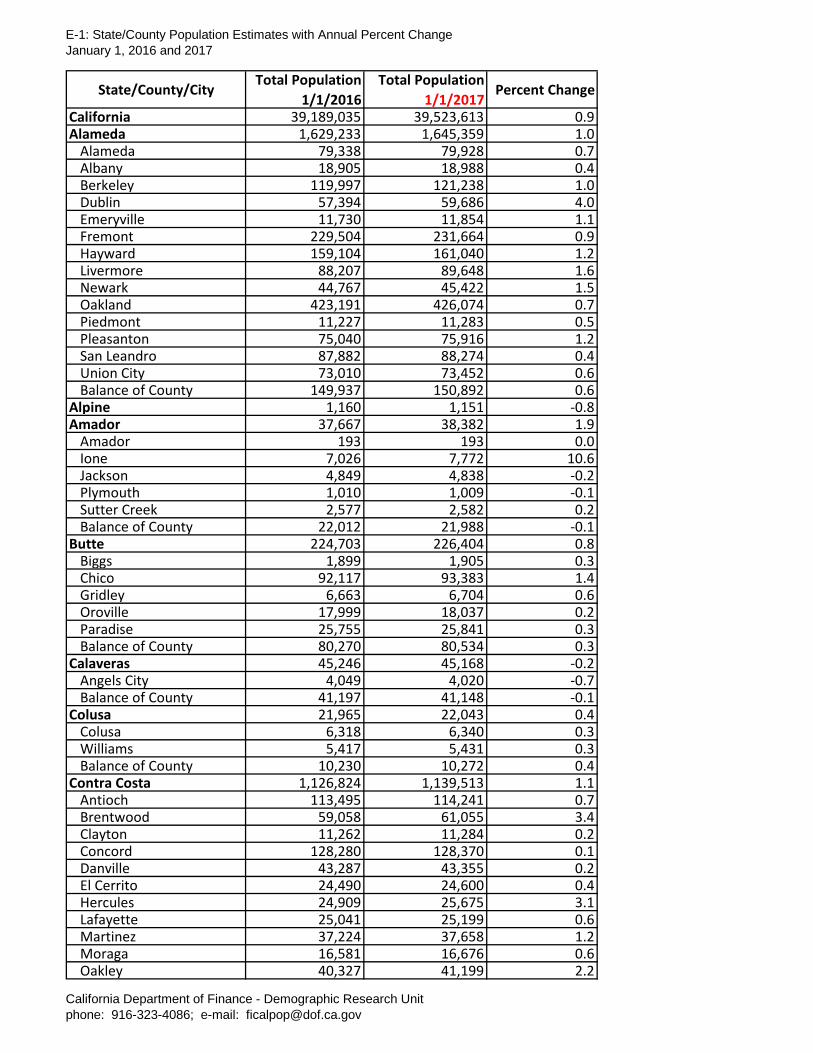
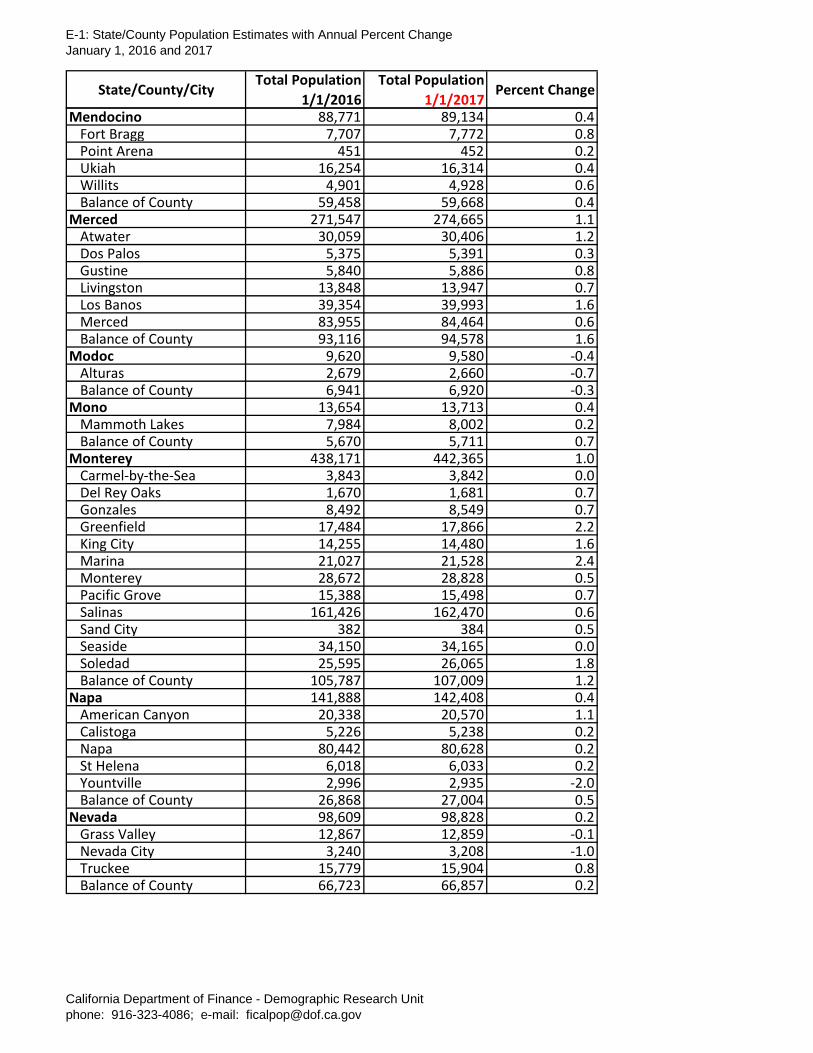
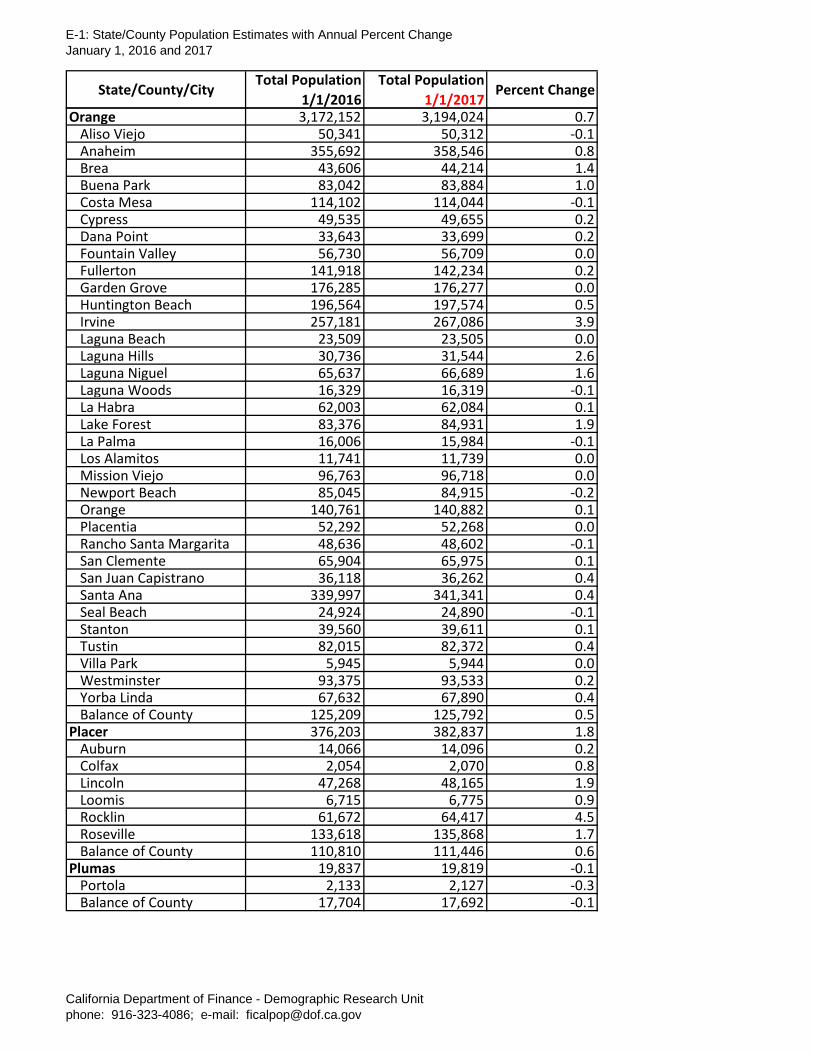
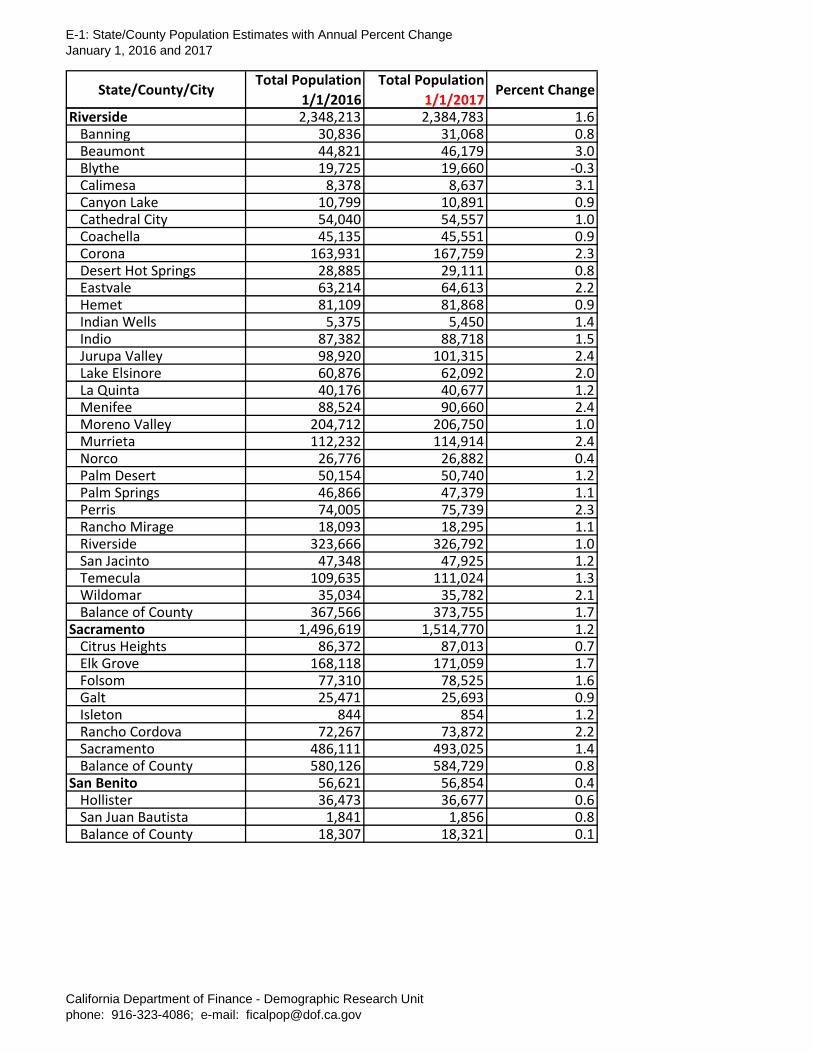
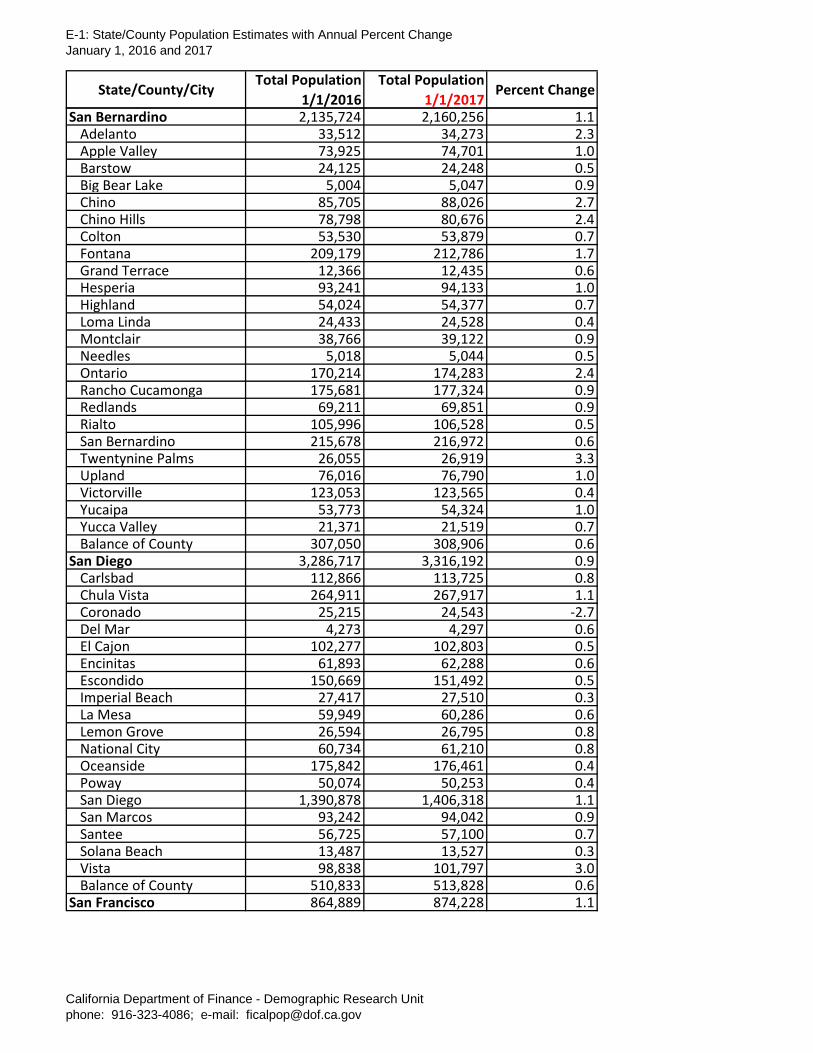
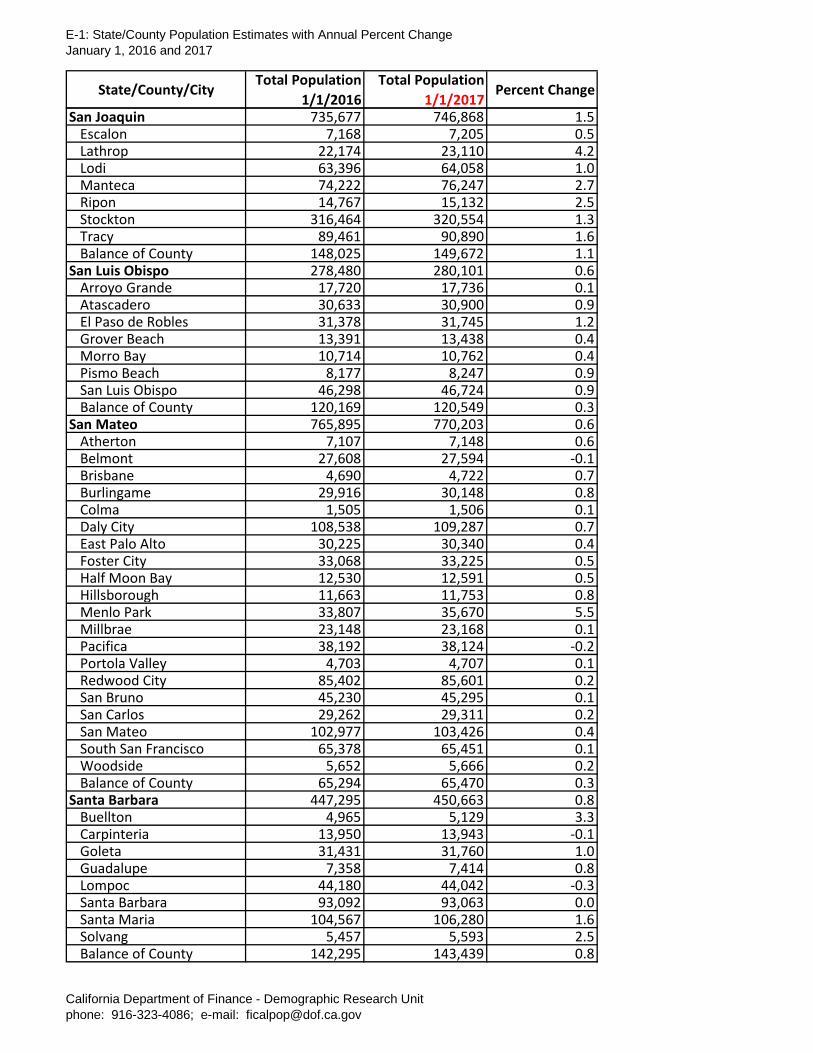
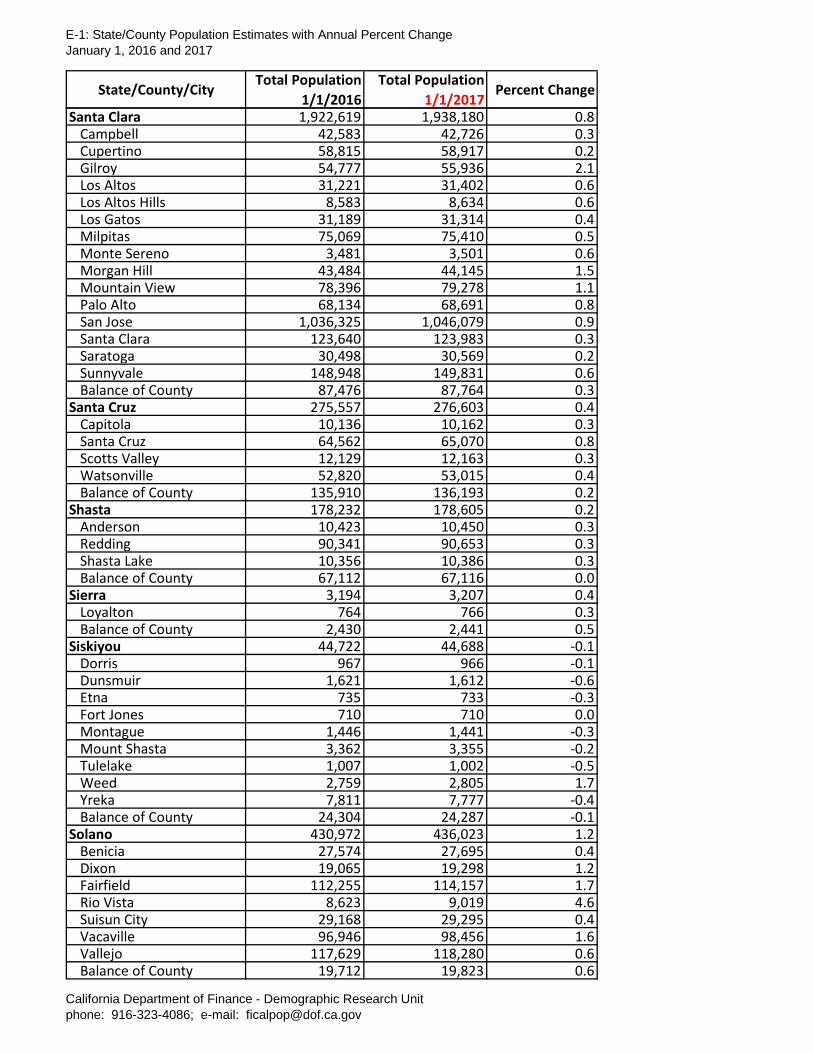
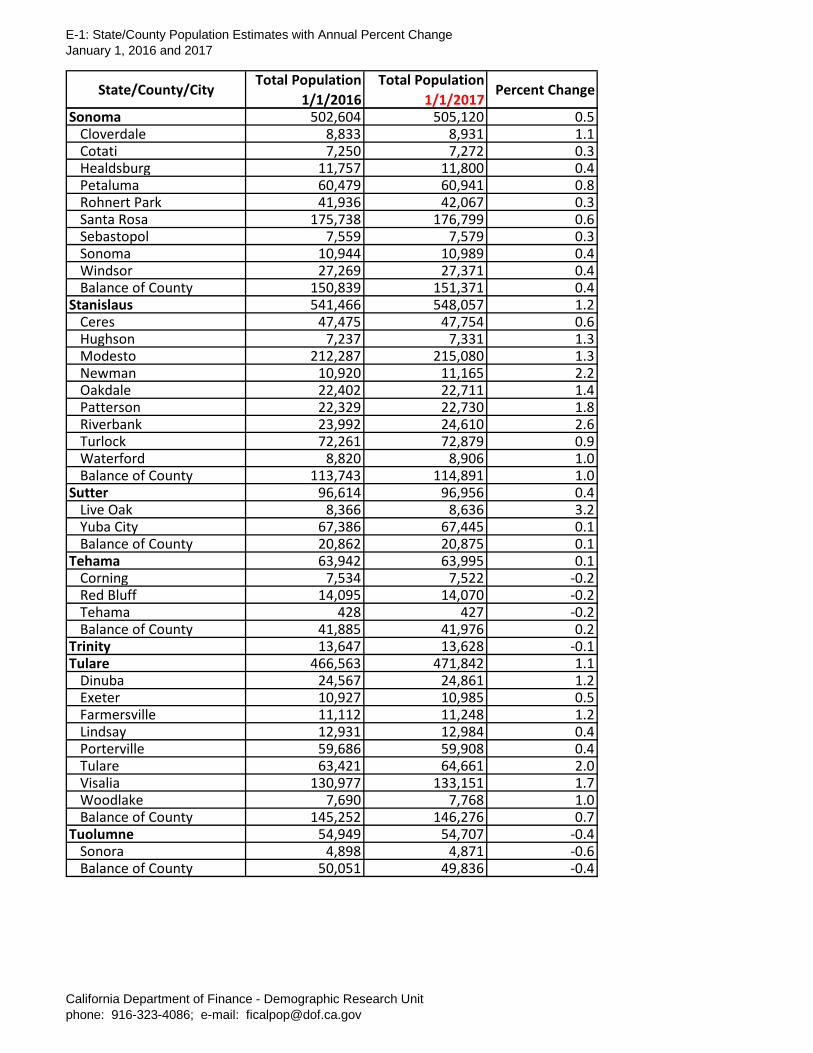
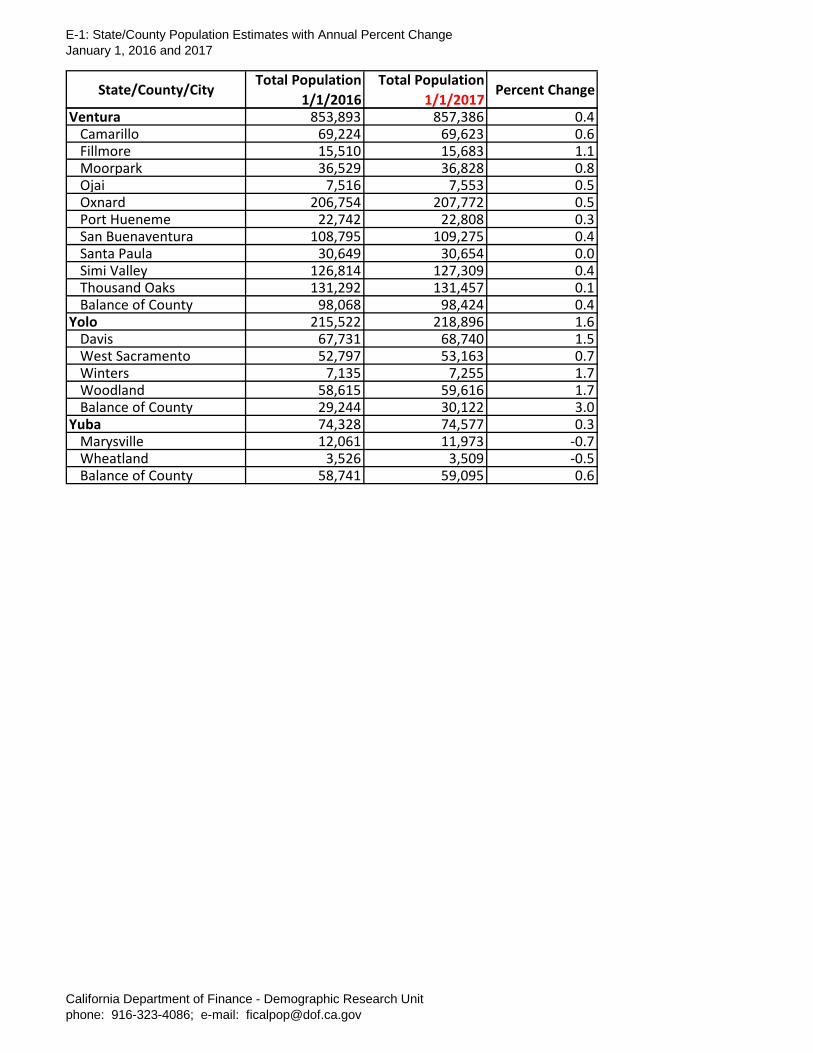
E-1: State/County Population Estimates with Annual Percent ChangeJanuary 1, 2016 and 2017
California Department of Finance - Demographic Research Unitphone: 916-323-4086; e-mail: [email protected]
State/County/CityTotal Population
1/1/2016 Total Population
1/1/2017Percent Change
California 39,189,035 39,523,613 0.9Alameda 1,629,233 1,645,359 1.0
Alameda 79,338 79,928 0.7Albany 18,905 18,988 0.4Berkeley 119,997 121,238 1.0Dublin 57,394 59,686 4.0Emeryville 11,730 11,854 1.1Fremont 229,504 231,664 0.9Hayward 159,104 161,040 1.2Livermore 88,207 89,648 1.6Newark 44,767 45,422 1.5Oakland 423,191 426,074 0.7Piedmont 11,227 11,283 0.5Pleasanton 75,040 75,916 1.2San Leandro 87,882 88,274 0.4Union City 73,010 73,452 0.6Balance of County 149,937 150,892 0.6
Alpine 1,160 1,151 -0.8Amador 37,667 38,382 1.9
Amador 193 193 0.0Ione 7,026 7,772 10.6Jackson 4,849 4,838 -0.2Plymouth 1,010 1,009 -0.1Sutter Creek 2,577 2,582 0.2Balance of County 22,012 21,988 -0.1
Butte 224,703 226,404 0.8Biggs 1,899 1,905 0.3Chico 92,117 93,383 1.4Gridley 6,663 6,704 0.6Oroville 17,999 18,037 0.2Paradise 25,755 25,841 0.3Balance of County 80,270 80,534 0.3
Calaveras 45,246 45,168 -0.2Angels City 4,049 4,020 -0.7Balance of County 41,197 41,148 -0.1
Colusa 21,965 22,043 0.4Colusa 6,318 6,340 0.3Williams 5,417 5,431 0.3Balance of County 10,230 10,272 0.4
Contra Costa 1,126,824 1,139,513 1.1Antioch 113,495 114,241 0.7Brentwood 59,058 61,055 3.4Clayton 11,262 11,284 0.2Concord 128,280 128,370 0.1Danville 43,287 43,355 0.2El Cerrito 24,490 24,600 0.4Hercules 24,909 25,675 3.1Lafayette 25,041 25,199 0.6Martinez 37,224 37,658 1.2Moraga 16,581 16,676 0.6Oakley 40,327 41,199 2.2
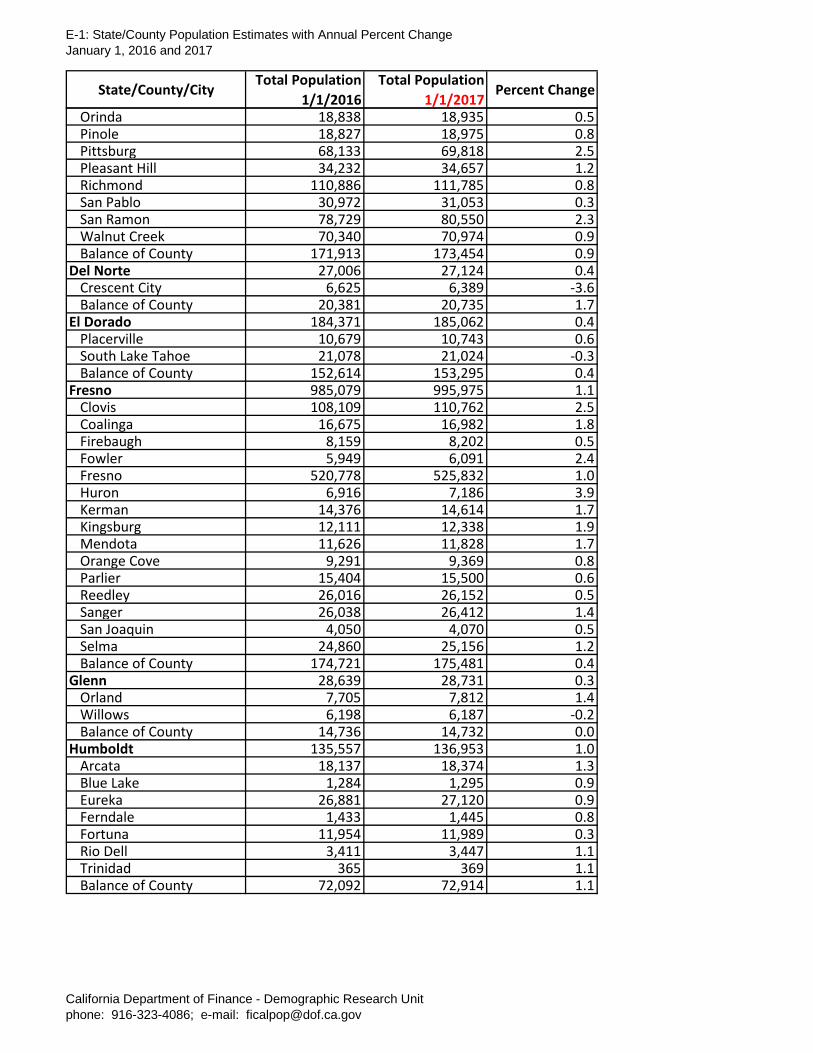
E-1: State/County Population Estimates with Annual Percent ChangeJanuary 1, 2016 and 2017
California Department of Finance - Demographic Research Unitphone: 916-323-4086; e-mail: [email protected]
State/County/CityTotal Population
1/1/2016 Total Population
1/1/2017Percent Change
Orinda 18,838 18,935 0.5Pinole 18,827 18,975 0.8Pittsburg 68,133 69,818 2.5Pleasant Hill 34,232 34,657 1.2Richmond 110,886 111,785 0.8San Pablo 30,972 31,053 0.3San Ramon 78,729 80,550 2.3Walnut Creek 70,340 70,974 0.9Balance of County 171,913 173,454 0.9
Del Norte 27,006 27,124 0.4Crescent City 6,625 6,389 -3.6Balance of County 20,381 20,735 1.7
El Dorado 184,371 185,062 0.4Placerville 10,679 10,743 0.6South Lake Tahoe 21,078 21,024 -0.3Balance of County 152,614 153,295 0.4
Fresno 985,079 995,975 1.1Clovis 108,109 110,762 2.5Coalinga 16,675 16,982 1.8Firebaugh 8,159 8,202 0.5Fowler 5,949 6,091 2.4Fresno 520,778 525,832 1.0Huron 6,916 7,186 3.9Kerman 14,376 14,614 1.7Kingsburg 12,111 12,338 1.9Mendota 11,626 11,828 1.7Orange Cove 9,291 9,369 0.8Parlier 15,404 15,500 0.6Reedley 26,016 26,152 0.5Sanger 26,038 26,412 1.4San Joaquin 4,050 4,070 0.5Selma 24,860 25,156 1.2Balance of County 174,721 175,481 0.4
Glenn 28,639 28,731 0.3Orland 7,705 7,812 1.4Willows 6,198 6,187 -0.2Balance of County 14,736 14,732 0.0
Humboldt 135,557 136,953 1.0Arcata 18,137 18,374 1.3Blue Lake 1,284 1,295 0.9Eureka 26,881 27,120 0.9Ferndale 1,433 1,445 0.8Fortuna 11,954 11,989 0.3Rio Dell 3,411 3,447 1.1Trinidad 365 369 1.1Balance of County 72,092 72,914 1.1
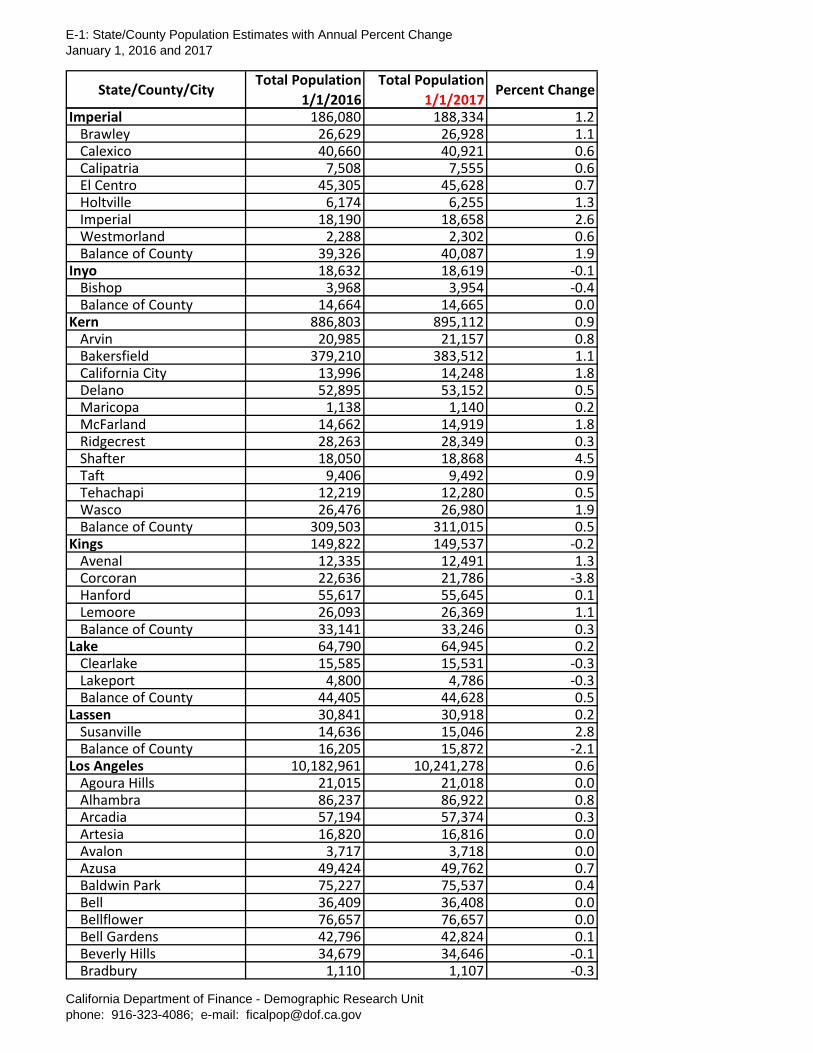
E-1: State/County Population Estimates with Annual Percent ChangeJanuary 1, 2016 and 2017
California Department of Finance - Demographic Research Unitphone: 916-323-4086; e-mail: [email protected]
State/County/CityTotal Population
1/1/2016 Total Population
1/1/2017Percent Change
Imperial 186,080 188,334 1.2Brawley 26,629 26,928 1.1Calexico 40,660 40,921 0.6Calipatria 7,508 7,555 0.6El Centro 45,305 45,628 0.7Holtville 6,174 6,255 1.3Imperial 18,190 18,658 2.6Westmorland 2,288 2,302 0.6Balance of County 39,326 40,087 1.9
Inyo 18,632 18,619 -0.1Bishop 3,968 3,954 -0.4Balance of County 14,664 14,665 0.0
Kern 886,803 895,112 0.9Arvin 20,985 21,157 0.8Bakersfield 379,210 383,512 1.1California City 13,996 14,248 1.8Delano 52,895 53,152 0.5Maricopa 1,138 1,140 0.2McFarland 14,662 14,919 1.8Ridgecrest 28,263 28,349 0.3Shafter 18,050 18,868 4.5Taft 9,406 9,492 0.9Tehachapi 12,219 12,280 0.5Wasco 26,476 26,980 1.9Balance of County 309,503 311,015 0.5
Kings 149,822 149,537 -0.2Avenal 12,335 12,491 1.3Corcoran 22,636 21,786 -3.8Hanford 55,617 55,645 0.1Lemoore 26,093 26,369 1.1Balance of County 33,141 33,246 0.3
Lake 64,790 64,945 0.2Clearlake 15,585 15,531 -0.3Lakeport 4,800 4,786 -0.3Balance of County 44,405 44,628 0.5
Lassen 30,841 30,918 0.2Susanville 14,636 15,046 2.8Balance of County 16,205 15,872 -2.1
Los Angeles 10,182,961 10,241,278 0.6Agoura Hills 21,015 21,018 0.0Alhambra 86,237 86,922 0.8Arcadia 57,194 57,374 0.3Artesia 16,820 16,816 0.0Avalon 3,717 3,718 0.0Azusa 49,424 49,762 0.7Baldwin Park 75,227 75,537 0.4Bell 36,409 36,408 0.0Bellflower 76,657 76,657 0.0Bell Gardens 42,796 42,824 0.1Beverly Hills 34,679 34,646 -0.1Bradbury 1,110 1,107 -0.3

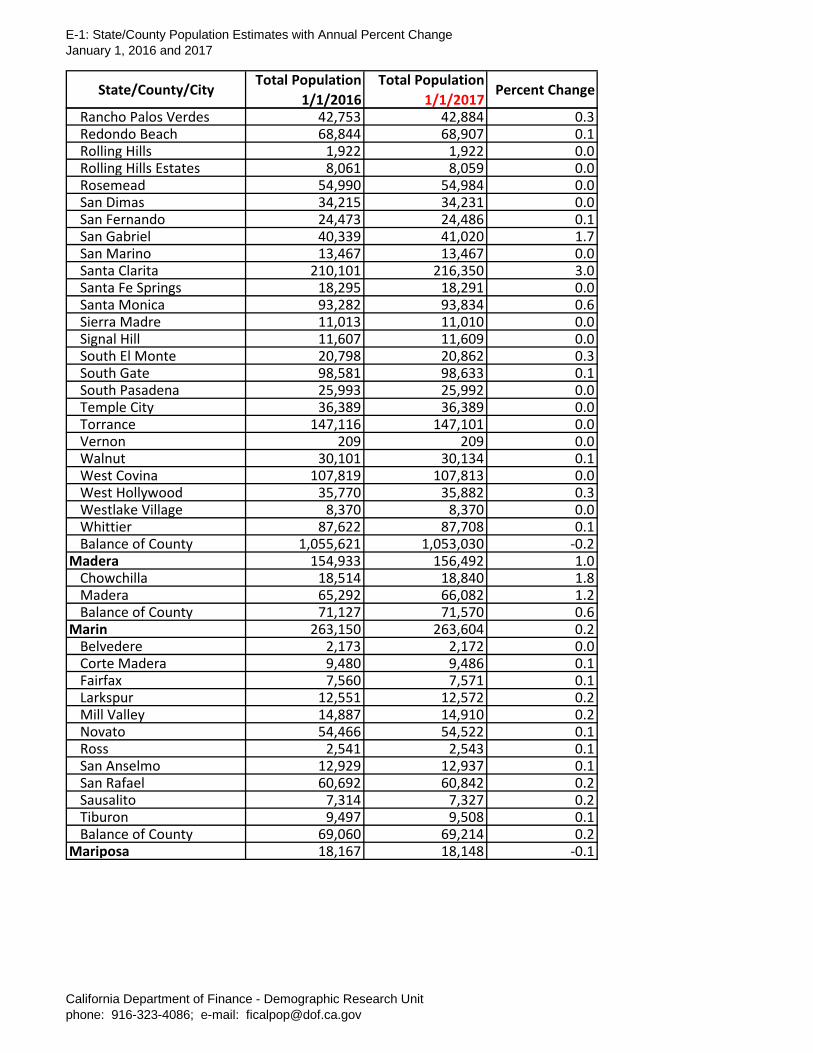
E-1: State/County Population Estimates with Annual Percent ChangeJanuary 1, 2016 and 2017
California Department of Finance - Demographic Research Unitphone: 916-323-4086; e-mail: [email protected]
State/County/CityTotal Population
1/1/2016 Total Population
1/1/2017Percent Change
Burbank 105,046 105,033 0.0Calabasas 24,168 24,202 0.1Carson 93,455 93,674 0.2Cerritos 49,439 50,039 1.2Claremont 36,165 36,225 0.2Commerce 13,067 13,064 0.0Compton 100,046 100,050 0.0Covina 49,000 49,011 0.0Cudahy 24,417 24,411 0.0Culver City 40,120 40,103 0.0Diamond Bar 56,919 57,066 0.3Downey 113,729 113,832 0.1Duarte 22,038 22,033 0.0El Monte 114,295 114,268 0.0El Segundo 16,703 16,717 0.1Gardena 60,534 60,721 0.3Glendale 200,600 201,748 0.6Glendora 51,928 52,608 1.3Hawaiian Gardens 14,761 14,753 -0.1Hawthorne 87,649 87,662 0.0Hermosa Beach 19,711 19,616 -0.5Hidden Hills 1,876 1,885 0.5Huntington Park 59,385 59,383 0.0Industry 440 440 0.0Inglewood 114,921 114,900 0.0Irwindale 1,419 1,423 0.3La Canada Flintridge 20,505 20,497 0.0La Habra Heights 5,438 5,463 0.5Lakewood 79,239 79,272 0.0La Mirada 49,448 49,434 0.0Lancaster 157,859 157,820 0.0La Puente 40,440 40,455 0.0La Verne 33,058 33,174 0.4Lawndale 33,357 33,365 0.0Lomita 20,363 20,403 0.2Long Beach 479,756 480,173 0.1Los Angeles 3,999,237 4,041,707 1.1Lynwood 71,863 71,997 0.2Malibu 12,747 12,742 0.0Manhattan Beach 35,329 35,488 0.5Maywood 28,023 28,016 0.0Monrovia 37,411 38,514 2.9Montebello 63,792 63,917 0.2Monterey Park 61,372 61,606 0.4Norwalk 105,530 105,526 0.0Palmdale 158,643 158,605 0.0Palos Verdes Estates 13,674 13,663 -0.1Paramount 55,868 55,923 0.1Pasadena 140,960 143,333 1.7Pico Rivera 64,031 64,046 0.0Pomona 154,151 155,306 0.7
E-1: State/County Population Estimates with Annual Percent ChangeJanuary 1, 2016 and 2017
California Department of Finance - Demographic Research Unitphone: 916-323-4086; e-mail: [email protected]
State/County/CityTotal Population
1/1/2016 Total Population
1/1/2017Percent Change
Rancho Palos Verdes 42,753 42,884 0.3Redondo Beach 68,844 68,907 0.1Rolling Hills 1,922 1,922 0.0Rolling Hills Estates 8,061 8,059 0.0Rosemead 54,990 54,984 0.0San Dimas 34,215 34,231 0.0San Fernando 24,473 24,486 0.1San Gabriel 40,339 41,020 1.7San Marino 13,467 13,467 0.0Santa Clarita 210,101 216,350 3.0Santa Fe Springs 18,295 18,291 0.0Santa Monica 93,282 93,834 0.6Sierra Madre 11,013 11,010 0.0Signal Hill 11,607 11,609 0.0South El Monte 20,798 20,862 0.3South Gate 98,581 98,633 0.1South Pasadena 25,993 25,992 0.0Temple City 36,389 36,389 0.0Torrance 147,116 147,101 0.0Vernon 209 209 0.0Walnut 30,101 30,134 0.1West Covina 107,819 107,813 0.0West Hollywood 35,770 35,882 0.3Westlake Village 8,370 8,370 0.0Whittier 87,622 87,708 0.1Balance of County 1,055,621 1,053,030 -0.2
Madera 154,933 156,492 1.0Chowchilla 18,514 18,840 1.8Madera 65,292 66,082 1.2Balance of County 71,127 71,570 0.6
Marin 263,150 263,604 0.2Belvedere 2,173 2,172 0.0Corte Madera 9,480 9,486 0.1Fairfax 7,560 7,571 0.1Larkspur 12,551 12,572 0.2Mill Valley 14,887 14,910 0.2Novato 54,466 54,522 0.1Ross 2,541 2,543 0.1San Anselmo 12,929 12,937 0.1San Rafael 60,692 60,842 0.2Sausalito 7,314 7,327 0.2Tiburon 9,497 9,508 0.1Balance of County 69,060 69,214 0.2
Mariposa 18,167 18,148 -0.1
E-1: State/County Population Estimates with Annual Percent ChangeJanuary 1, 2016 and 2017
California Department of Finance - Demographic Research Unitphone: 916-323-4086; e-mail: [email protected]
State/County/CityTotal Population
1/1/2016 Total Population
1/1/2017Percent Change
Mendocino 88,771 89,134 0.4Fort Bragg 7,707 7,772 0.8Point Arena 451 452 0.2Ukiah 16,254 16,314 0.4Willits 4,901 4,928 0.6Balance of County 59,458 59,668 0.4
Merced 271,547 274,665 1.1Atwater 30,059 30,406 1.2Dos Palos 5,375 5,391 0.3Gustine 5,840 5,886 0.8Livingston 13,848 13,947 0.7Los Banos 39,354 39,993 1.6Merced 83,955 84,464 0.6Balance of County 93,116 94,578 1.6
Modoc 9,620 9,580 -0.4Alturas 2,679 2,660 -0.7Balance of County 6,941 6,920 -0.3
Mono 13,654 13,713 0.4Mammoth Lakes 7,984 8,002 0.2Balance of County 5,670 5,711 0.7
Monterey 438,171 442,365 1.0Carmel-by-the-Sea 3,843 3,842 0.0Del Rey Oaks 1,670 1,681 0.7Gonzales 8,492 8,549 0.7Greenfield 17,484 17,866 2.2King City 14,255 14,480 1.6Marina 21,027 21,528 2.4Monterey 28,672 28,828 0.5Pacific Grove 15,388 15,498 0.7Salinas 161,426 162,470 0.6Sand City 382 384 0.5Seaside 34,150 34,165 0.0Soledad 25,595 26,065 1.8Balance of County 105,787 107,009 1.2
Napa 141,888 142,408 0.4American Canyon 20,338 20,570 1.1Calistoga 5,226 5,238 0.2Napa 80,442 80,628 0.2St Helena 6,018 6,033 0.2Yountville 2,996 2,935 -2.0Balance of County 26,868 27,004 0.5
Nevada 98,609 98,828 0.2Grass Valley 12,867 12,859 -0.1Nevada City 3,240 3,208 -1.0Truckee 15,779 15,904 0.8Balance of County 66,723 66,857 0.2
E-1: State/County Population Estimates with Annual Percent ChangeJanuary 1, 2016 and 2017
California Department of Finance - Demographic Research Unitphone: 916-323-4086; e-mail: [email protected]
State/County/CityTotal Population
1/1/2016 Total Population
1/1/2017Percent Change
Orange 3,172,152 3,194,024 0.7Aliso Viejo 50,341 50,312 -0.1Anaheim 355,692 358,546 0.8Brea 43,606 44,214 1.4Buena Park 83,042 83,884 1.0Costa Mesa 114,102 114,044 -0.1Cypress 49,535 49,655 0.2Dana Point 33,643 33,699 0.2Fountain Valley 56,730 56,709 0.0Fullerton 141,918 142,234 0.2Garden Grove 176,285 176,277 0.0Huntington Beach 196,564 197,574 0.5Irvine 257,181 267,086 3.9Laguna Beach 23,509 23,505 0.0Laguna Hills 30,736 31,544 2.6Laguna Niguel 65,637 66,689 1.6Laguna Woods 16,329 16,319 -0.1La Habra 62,003 62,084 0.1Lake Forest 83,376 84,931 1.9La Palma 16,006 15,984 -0.1Los Alamitos 11,741 11,739 0.0Mission Viejo 96,763 96,718 0.0Newport Beach 85,045 84,915 -0.2Orange 140,761 140,882 0.1Placentia 52,292 52,268 0.0Rancho Santa Margarita 48,636 48,602 -0.1San Clemente 65,904 65,975 0.1San Juan Capistrano 36,118 36,262 0.4Santa Ana 339,997 341,341 0.4Seal Beach 24,924 24,890 -0.1Stanton 39,560 39,611 0.1Tustin 82,015 82,372 0.4Villa Park 5,945 5,944 0.0Westminster 93,375 93,533 0.2Yorba Linda 67,632 67,890 0.4Balance of County 125,209 125,792 0.5
Placer 376,203 382,837 1.8Auburn 14,066 14,096 0.2Colfax 2,054 2,070 0.8Lincoln 47,268 48,165 1.9Loomis 6,715 6,775 0.9Rocklin 61,672 64,417 4.5Roseville 133,618 135,868 1.7Balance of County 110,810 111,446 0.6
Plumas 19,837 19,819 -0.1Portola 2,133 2,127 -0.3Balance of County 17,704 17,692 -0.1
E-1: State/County Population Estimates with Annual Percent ChangeJanuary 1, 2016 and 2017
California Department of Finance - Demographic Research Unitphone: 916-323-4086; e-mail: [email protected]
State/County/CityTotal Population
1/1/2016 Total Population
1/1/2017Percent Change
Riverside 2,348,213 2,384,783 1.6Banning 30,836 31,068 0.8Beaumont 44,821 46,179 3.0Blythe 19,725 19,660 -0.3Calimesa 8,378 8,637 3.1Canyon Lake 10,799 10,891 0.9Cathedral City 54,040 54,557 1.0Coachella 45,135 45,551 0.9Corona 163,931 167,759 2.3Desert Hot Springs 28,885 29,111 0.8Eastvale 63,214 64,613 2.2Hemet 81,109 81,868 0.9Indian Wells 5,375 5,450 1.4Indio 87,382 88,718 1.5Jurupa Valley 98,920 101,315 2.4Lake Elsinore 60,876 62,092 2.0La Quinta 40,176 40,677 1.2Menifee 88,524 90,660 2.4Moreno Valley 204,712 206,750 1.0Murrieta 112,232 114,914 2.4Norco 26,776 26,882 0.4Palm Desert 50,154 50,740 1.2Palm Springs 46,866 47,379 1.1Perris 74,005 75,739 2.3Rancho Mirage 18,093 18,295 1.1Riverside 323,666 326,792 1.0San Jacinto 47,348 47,925 1.2Temecula 109,635 111,024 1.3Wildomar 35,034 35,782 2.1Balance of County 367,566 373,755 1.7
Sacramento 1,496,619 1,514,770 1.2Citrus Heights 86,372 87,013 0.7Elk Grove 168,118 171,059 1.7Folsom 77,310 78,525 1.6Galt 25,471 25,693 0.9Isleton 844 854 1.2Rancho Cordova 72,267 73,872 2.2Sacramento 486,111 493,025 1.4Balance of County 580,126 584,729 0.8
San Benito 56,621 56,854 0.4Hollister 36,473 36,677 0.6San Juan Bautista 1,841 1,856 0.8Balance of County 18,307 18,321 0.1
E-1: State/County Population Estimates with Annual Percent ChangeJanuary 1, 2016 and 2017
California Department of Finance - Demographic Research Unitphone: 916-323-4086; e-mail: [email protected]
State/County/CityTotal Population
1/1/2016 Total Population
1/1/2017Percent Change
San Bernardino 2,135,724 2,160,256 1.1Adelanto 33,512 34,273 2.3Apple Valley 73,925 74,701 1.0Barstow 24,125 24,248 0.5Big Bear Lake 5,004 5,047 0.9Chino 85,705 88,026 2.7Chino Hills 78,798 80,676 2.4Colton 53,530 53,879 0.7Fontana 209,179 212,786 1.7Grand Terrace 12,366 12,435 0.6Hesperia 93,241 94,133 1.0Highland 54,024 54,377 0.7Loma Linda 24,433 24,528 0.4Montclair 38,766 39,122 0.9Needles 5,018 5,044 0.5Ontario 170,214 174,283 2.4Rancho Cucamonga 175,681 177,324 0.9Redlands 69,211 69,851 0.9Rialto 105,996 106,528 0.5San Bernardino 215,678 216,972 0.6Twentynine Palms 26,055 26,919 3.3Upland 76,016 76,790 1.0Victorville 123,053 123,565 0.4Yucaipa 53,773 54,324 1.0Yucca Valley 21,371 21,519 0.7Balance of County 307,050 308,906 0.6
San Diego 3,286,717 3,316,192 0.9Carlsbad 112,866 113,725 0.8Chula Vista 264,911 267,917 1.1Coronado 25,215 24,543 -2.7Del Mar 4,273 4,297 0.6El Cajon 102,277 102,803 0.5Encinitas 61,893 62,288 0.6Escondido 150,669 151,492 0.5Imperial Beach 27,417 27,510 0.3La Mesa 59,949 60,286 0.6Lemon Grove 26,594 26,795 0.8National City 60,734 61,210 0.8Oceanside 175,842 176,461 0.4Poway 50,074 50,253 0.4San Diego 1,390,878 1,406,318 1.1San Marcos 93,242 94,042 0.9Santee 56,725 57,100 0.7Solana Beach 13,487 13,527 0.3Vista 98,838 101,797 3.0Balance of County 510,833 513,828 0.6
San Francisco 864,889 874,228 1.1
E-1: State/County Population Estimates with Annual Percent ChangeJanuary 1, 2016 and 2017
California Department of Finance - Demographic Research Unitphone: 916-323-4086; e-mail: [email protected]
State/County/CityTotal Population
1/1/2016 Total Population
1/1/2017Percent Change
San Joaquin 735,677 746,868 1.5Escalon 7,168 7,205 0.5Lathrop 22,174 23,110 4.2Lodi 63,396 64,058 1.0Manteca 74,222 76,247 2.7Ripon 14,767 15,132 2.5Stockton 316,464 320,554 1.3Tracy 89,461 90,890 1.6Balance of County 148,025 149,672 1.1
San Luis Obispo 278,480 280,101 0.6Arroyo Grande 17,720 17,736 0.1Atascadero 30,633 30,900 0.9El Paso de Robles 31,378 31,745 1.2Grover Beach 13,391 13,438 0.4Morro Bay 10,714 10,762 0.4Pismo Beach 8,177 8,247 0.9San Luis Obispo 46,298 46,724 0.9Balance of County 120,169 120,549 0.3
San Mateo 765,895 770,203 0.6Atherton 7,107 7,148 0.6Belmont 27,608 27,594 -0.1Brisbane 4,690 4,722 0.7Burlingame 29,916 30,148 0.8Colma 1,505 1,506 0.1Daly City 108,538 109,287 0.7East Palo Alto 30,225 30,340 0.4Foster City 33,068 33,225 0.5Half Moon Bay 12,530 12,591 0.5Hillsborough 11,663 11,753 0.8Menlo Park 33,807 35,670 5.5Millbrae 23,148 23,168 0.1Pacifica 38,192 38,124 -0.2Portola Valley 4,703 4,707 0.1Redwood City 85,402 85,601 0.2San Bruno 45,230 45,295 0.1San Carlos 29,262 29,311 0.2San Mateo 102,977 103,426 0.4South San Francisco 65,378 65,451 0.1Woodside 5,652 5,666 0.2Balance of County 65,294 65,470 0.3
Santa Barbara 447,295 450,663 0.8Buellton 4,965 5,129 3.3Carpinteria 13,950 13,943 -0.1Goleta 31,431 31,760 1.0Guadalupe 7,358 7,414 0.8Lompoc 44,180 44,042 -0.3Santa Barbara 93,092 93,063 0.0Santa Maria 104,567 106,280 1.6Solvang 5,457 5,593 2.5Balance of County 142,295 143,439 0.8
E-1: State/County Population Estimates with Annual Percent ChangeJanuary 1, 2016 and 2017
California Department of Finance - Demographic Research Unitphone: 916-323-4086; e-mail: [email protected]
State/County/CityTotal Population
1/1/2016 Total Population
1/1/2017Percent Change
Santa Clara 1,922,619 1,938,180 0.8Campbell 42,583 42,726 0.3Cupertino 58,815 58,917 0.2Gilroy 54,777 55,936 2.1Los Altos 31,221 31,402 0.6Los Altos Hills 8,583 8,634 0.6Los Gatos 31,189 31,314 0.4Milpitas 75,069 75,410 0.5Monte Sereno 3,481 3,501 0.6Morgan Hill 43,484 44,145 1.5Mountain View 78,396 79,278 1.1Palo Alto 68,134 68,691 0.8San Jose 1,036,325 1,046,079 0.9Santa Clara 123,640 123,983 0.3Saratoga 30,498 30,569 0.2Sunnyvale 148,948 149,831 0.6Balance of County 87,476 87,764 0.3
Santa Cruz 275,557 276,603 0.4Capitola 10,136 10,162 0.3Santa Cruz 64,562 65,070 0.8Scotts Valley 12,129 12,163 0.3Watsonville 52,820 53,015 0.4Balance of County 135,910 136,193 0.2
Shasta 178,232 178,605 0.2Anderson 10,423 10,450 0.3Redding 90,341 90,653 0.3Shasta Lake 10,356 10,386 0.3Balance of County 67,112 67,116 0.0
Sierra 3,194 3,207 0.4Loyalton 764 766 0.3Balance of County 2,430 2,441 0.5
Siskiyou 44,722 44,688 -0.1Dorris 967 966 -0.1Dunsmuir 1,621 1,612 -0.6Etna 735 733 -0.3Fort Jones 710 710 0.0Montague 1,446 1,441 -0.3Mount Shasta 3,362 3,355 -0.2Tulelake 1,007 1,002 -0.5Weed 2,759 2,805 1.7Yreka 7,811 7,777 -0.4Balance of County 24,304 24,287 -0.1
Solano 430,972 436,023 1.2Benicia 27,574 27,695 0.4Dixon 19,065 19,298 1.2Fairfield 112,255 114,157 1.7Rio Vista 8,623 9,019 4.6Suisun City 29,168 29,295 0.4Vacaville 96,946 98,456 1.6Vallejo 117,629 118,280 0.6Balance of County 19,712 19,823 0.6
E-1: State/County Population Estimates with Annual Percent ChangeJanuary 1, 2016 and 2017
California Department of Finance - Demographic Research Unitphone: 916-323-4086; e-mail: [email protected]
State/County/CityTotal Population
1/1/2016 Total Population
1/1/2017Percent Change
Sonoma 502,604 505,120 0.5Cloverdale 8,833 8,931 1.1Cotati 7,250 7,272 0.3Healdsburg 11,757 11,800 0.4Petaluma 60,479 60,941 0.8Rohnert Park 41,936 42,067 0.3Santa Rosa 175,738 176,799 0.6Sebastopol 7,559 7,579 0.3Sonoma 10,944 10,989 0.4Windsor 27,269 27,371 0.4Balance of County 150,839 151,371 0.4
Stanislaus 541,466 548,057 1.2Ceres 47,475 47,754 0.6Hughson 7,237 7,331 1.3Modesto 212,287 215,080 1.3Newman 10,920 11,165 2.2Oakdale 22,402 22,711 1.4Patterson 22,329 22,730 1.8Riverbank 23,992 24,610 2.6Turlock 72,261 72,879 0.9Waterford 8,820 8,906 1.0Balance of County 113,743 114,891 1.0
Sutter 96,614 96,956 0.4Live Oak 8,366 8,636 3.2Yuba City 67,386 67,445 0.1Balance of County 20,862 20,875 0.1
Tehama 63,942 63,995 0.1Corning 7,534 7,522 -0.2Red Bluff 14,095 14,070 -0.2Tehama 428 427 -0.2Balance of County 41,885 41,976 0.2
Trinity 13,647 13,628 -0.1Tulare 466,563 471,842 1.1
Dinuba 24,567 24,861 1.2Exeter 10,927 10,985 0.5Farmersville 11,112 11,248 1.2Lindsay 12,931 12,984 0.4Porterville 59,686 59,908 0.4Tulare 63,421 64,661 2.0Visalia 130,977 133,151 1.7Woodlake 7,690 7,768 1.0Balance of County 145,252 146,276 0.7
Tuolumne 54,949 54,707 -0.4Sonora 4,898 4,871 -0.6Balance of County 50,051 49,836 -0.4
E-1: State/County Population Estimates with Annual Percent ChangeJanuary 1, 2016 and 2017
California Department of Finance - Demographic Research Unitphone: 916-323-4086; e-mail: [email protected]
State/County/CityTotal Population
1/1/2016 Total Population
1/1/2017Percent Change
Ventura 853,893 857,386 0.4Camarillo 69,224 69,623 0.6Fillmore 15,510 15,683 1.1Moorpark 36,529 36,828 0.8Ojai 7,516 7,553 0.5Oxnard 206,754 207,772 0.5Port Hueneme 22,742 22,808 0.3San Buenaventura 108,795 109,275 0.4Santa Paula 30,649 30,654 0.0Simi Valley 126,814 127,309 0.4Thousand Oaks 131,292 131,457 0.1Balance of County 98,068 98,424 0.4
Yolo 215,522 218,896 1.6Davis 67,731 68,740 1.5West Sacramento 52,797 53,163 0.7Winters 7,135 7,255 1.7Woodland 58,615 59,616 1.7Balance of County 29,244 30,122 3.0
Yuba 74,328 74,577 0.3Marysville 12,061 11,973 -0.7Wheatland 3,526 3,509 -0.5Balance of County 58,741 59,095 0.6