Embed Size (px)
Citation preview
CALIFORNIA STATE UNIVERSTIY, NORTHRIDGE
Geometric Morphometric Analysis of the Humerus in New and Old World Vultures
A thesis submitted in partial fulfillment of the requirements
For the degree of Master of Science in Biology
By
Jacob Matthew Holmes
May 2020
ii
The thesis of Jacob Holmes is approved:
_________________________________________ ______________
Dr. Casey terHorst, Ph.D. Date
_________________________________________ ______________
Dr. Diego Sustaita, Ph.D. Date
_________________________________________ ______________
Dr. Fritz Hertel, Ph.D. Chair Date
California State University Northridge
iii
Acknowledgments
Museums and collections that supplied skeletal specimens:
American Museum of Natural History
Smithsonian National Museum of Natural History
Natural History Museum
Louisiana State University
University of California, Berkeley
University of Kansas
iv
Table of Contents
Signature Page……………………………………………………………... ii
Acknowledgments…………………………………………………………. iii
List of Tables………………………………………………………………. v
List of Figures……………………………………………………………... vi
Abstract……………………………………………………………………. vii
Introduction………………………………………………………………... 1
Materials and Methods…………………………………………………….. 4
Results ……………………………………………………………………... 7
Discussion…………………………………………………………………. 11
Conclusion………………………………………………………………… 17
Literature Cited……………………………………………………………. 18
Appendix A………………………………………………………………... 24
Appendix B………………………………………………………………... 40
v
List of Tables
Table 1…………………………………………………………………….. 24
Table 2…………………………………………………………………….. 25
Table 3…………………………………………………………………….. 26
Table 4…………………………………………………………………….. 26
Table 5…………………………………………………………………….. 26
Table 6…………………………………………………………………….. 26
Table 7…………………………………………………………………….. 27
Table 8…………………………………………………………………….. 27
Table 9.……………………………………………………………………. 40
Table 10..………………………………………………………………….. 43
vi
List of Figures
Figure 1 A – D…………………………………………………………….. 28
Figure 2 A – D…………………………………………………………….. 29
Figure 3 A – D…………………………………………………………….. 30
Figure 4 A – D…………………………………………………………….. 31
Figure 5 1A – 1D, 2A – 2D……………………………………………….. 32
Figure 6 A – D…………………………………………………………….. 33
Figure 7 A – D…………………………………………………………….. 34
Figure 8 1A – 1D, 2A – 2D……………………………………………….. 35
Figure 9 A and B………………………………………………………….. 36
Figure 10 A and B………………………………………………………… 36
Figure 11 1A – 1B, 2A – 2B……………………………………………… 37
Figure 12 A and B………………………………………………………… 38
Figure 13 A and B………………………………………………………… 38
Figure 14 A and B………………………………………………………… 39
Figure 15A – D…..……………………………………………………….. 40
Figure 16A – D..………………………………………………………….. 43
vii
Abstract
Geometric Morphometric Analysis of the Humerus in New and Old World Vultures
By
Jacob Matthew Holmes
Master of Science in Biology
The vulture guild is comprised of two distinct groups, Old and New World, that provide a
unique insight into how morphology varies among convergent species. All vultures are
considered to be large birds of prey that utilize a style of flight called thermal soaring to search
and feed primarily on already dead animal flesh. Even though this flight style is exhibited among
all 23 species, slight variations in their skeletal morphology may relate to their differences in
ecology. I hypothesized that vulture humeral morphology varies in relation to these organisms’
habitat, average body mass, courtship displays, and migration capabilities.
To address this hypothesis, I used three-dimensional geometric morphometrics to
measure the overall shape differences of vulture humeri. Computer models of each bone were
created to observe the crucial skeletal features that relate to muscular functions and were
analyzed using discriminant function analyses. Humeral morphology was found to vary most by
habitat preference and body mass. Vultures that inhabit forested areas have humeri that exhibit
features that suggest increased flapping flight compared to those in open and mountainous
regions. The results for the heaviest species allude to these birds enhancing their wingbeats in
ways other than humeral morphology

1
Introduction
The forelimbs of flying organisms are the leading factors for aerial locomotor ecology
(Norberg 1981) and research should combine a variety of tools, methods, and strategies to fully
understand this biological relationship. Ecomorphology is the study that bridges the gap between
an organism’s ecological role and its morphology. Birds are an excellent class of organisms to
observe this connection due to the diversity of ecological adaptations within the group (James
1982). Past studies exploring the ecomorphology of birds have included topics relating to
foraging (Hertel 1994, 1995, Sustaita and Rubega 2014), locomotion (Dial 2003, Kaboli et al.
2007, Corbin et al. 2013, Degrange 2017), habitat (Gamauf et. al 1998, Kaboli et al. 2007), and
migration (Marchetti et al. 1995, Calmaestra and Moreno 2000, Voelker 2001, Provinciato et al.
2018).
Ecomorphological understanding is crucial in two facets of biological science:
convergent evolution and paleobiology (Hertel 1995, Plummer et al. 2008, Degrange 2017,
Serrano et al. 2017). Old and New World vultures (Accipitridae and Cathartidae, respectively)
provide a strong example of the convergence of form and function between two taxonomically
distinct groups of organisms. Phylogenetically, Old World vultures are related to other raptors,
such as hawks and eagles whereas the New World Vultures have historically been placed with
the ciconiid storks (Ligon 1967, Sibley and Ahlquist 1990). Recent DNA analyses have shown
that New World vultures are closely related to birds of prey (raptors), excluding owls and those
in Falconidae (Jarvis et al. 2014). Even though all species are members of the scavenger guild,
ecomorphological studies have shown intra and interspecific differences among these two
families by observing feeding and locomotor behaviors in relation to various cranial structures
(Hertel 1995), myology of the wings and hindlimbs (Hertel et al. 2015), and behavior (Houston
1985, Hertel 1995).
Vultures, as a guild, share a similar flying technique known as thermal soaring in which
the flying organism uses convection currents to remain aloft. Even though this ability is shared
among these birds, previous studies have shown how the wing morphology of raptors relates to
various flight styles, habitats, and migration patterns (Gamauf et. al 1998, Sievwright and
Macleod 2012). Wing elements such as size, shape, and feathers have been shown to relate to
species’ ecology and behavior (Brewer and Hertel 2007, Nudds et al. 2007, Wang et al. 2011,
2
Hieronymus 2015, Wang and Clarke 2015, Sausner et al. 2016, Serrano et al. 2017, van Oordt et
al. 2018), but relatively less work has been performed on the bones of the forelimb. The primary
muscles responsible for avian flight are the M. pectoralis muscles that power the downstroke and
the M. supracoracoideus that elevates the wing during the upstroke. The M. pectoralis of vultures
is divided into a superficial and deep section with the latter containing slow muscle fibers that
are associated with soaring and gliding (Meyers and McFarland 2017). These muscles originate
from the coracoid, scapula, and sternum and insert on various skeletal features of the humerus.
The combination of key muscle attachments and skeletal articulation points makes the avian
humerus a logical target for an ecomorphological study of understanding flight in soaring birds.
Differences among vulture behavior and ecology translate to variability in flight
characteristics. These include differences in habitat preference, general body mass, courtship
performances, and migration abilities. The habitat a species occupies is a critical aspect of an
organism’s ecology and relates to flight capabilities especially in terms of foraging and
maneuverability (Marchetti et al. 1995, Gamauf et. al 1998, Sievwright and Macleod 2012,
Corbin et al. 2013). Species such as the Griffon Vulture (Gyps fulvus) and many other Old World
vultures inhabit open spaces such as the savannahs of Africa whereas others like the New World
King Vulture (Sarcoramphus papa), occupy the forested Amazonian Basin (del Hoyo et al.
1994). These terrains provide certain challenges that may be overcome through different soaring
and flying techniques such as adjustments in the ratio between flapping and soaring flight.
Body mass has been shown to be a predictor of flight performance (Hertel and Ballance
1999, Dial 2003, Tobalske et al. 2003, Corvidae et al. 2006, Sievwright and Macleod 2012)
because of its relationship to mechanical power output. Vulture body masses range from the
small Lesser Yellow-headed Vulture (Cathartes burrovianus), with a mean body mass of 1.25
kg, to the massive 12 kg Andean Condor (Vultur gryphus), one of the heaviest flying avian
species (del Hoyo et al. 1994).
As a group, raptors are known to perform elaborate aerial courtship maneuvers in which
both mating pairs participate in clutching of talons, aerial flips, and high speed dives (del Hoyo
et al. 1994). Only a few species of vultures are known to perform these mating displays and that
ability may relate to wing morphology. Wing morphology varies between migratory and
sedentary species because migration is an energetically costly behavior and a strong selective
3
pressure for various flight elements (Marchetti et al. 1995, Calmaestra and Moreno 2000,
Voelker 2001, Kaboli et al. 2007, Provinciato et al. 2018). Even though the home ranges of many
vultures are generally large, only a handful of species actually migrate, which may be reflected
in their morphology.
Geometric morphometrics (GM) is a technique that uses morphological landmarks to
describe biological shape and shape variation among species. Previous studies utilized traditional
morphometrics to procure measurements and data to understand ecomorphological relationships.
These classic methods proved to be adequate when describing basic avian features such as
wingspan, body mass, or bone lengths but more precise techniques, such as GM, are crucial in
comparing the subtle differences in the entire wing form. Geometric morphometrics has been
shown to provide greater insight into the relationship between flight performance and various
morphological features such as wing shape (Tobalske et al. 2003, Wang and Clarke 2015,
Provinciato et al. 2018) and skeletal elements (Hui 2002, Sievwright and Macleod 2012, Corbin
et al. 2013).
In this study, I used three-dimensional geometric morphometrics to perform a qualitative
examination of the vulture humerus as it relates to ecological factors pertaining to flight. I
predicted that vulture humeri will exhibit osteological variation that relates to avian flight in the
areas of habitat preference, body mass, courtship performance, and migratory abilities. This
exploration will provide a framework for understanding how skeletal features on the humerus
differ among similar flight style in avian species.
4
Materials and Methods
Specimens
A total of 97 right wing humeri from 23 species of Cathartidae and Accipitridae were
utilized from various museum collections across the United States (Table 1). Specimens studied
were housed at: the American Museum of Natural History, New York (AMNH); the Natural
History Museum of Los Angeles County (LACM); the Smithsonian National Museum of Natural
History, Washington DC (USNM); the University of California, Berkeley, Museum of
Vertebrate Zoology (UCMVZ); University of Kansas Museum of Natural History (KUNHM);
Louisiana State University Museum of Natural Science (LSUMZ); and the University of
California, Los Angeles, Bird and Mammal collection (UCLA).
To examine ecomorphological correlations, I assigned each species to various ecological
categories based on the literature. Information was gathered from: Handbook to the Birds of the
World Volume 2 (del Hoyo et al. 1994), Eagles, Hawks, and Falcons of the World (Brown and
Amadon 1968), The Vultures of Africa (Mundy et al. 1992), and Birds of Prey of the World
(Grossman and Hamlet 1964). The categories include habitat preference (open, forested, or
mountain), species weight class (light, medium, or heavy), aerial courtship abilities (perform or
no performance), and migration capabilities (migratory or sedentary). Assignments for each
species are outlined in Table 1.
Imaging and 3D model creation
Capturing images of each humerus was done using a Nikon D3200 with an 18 – 55mm
lens. Each bone was held in place, using clay, in the center of a round swivel turntable with the
proximal end facing up. Turning the swivel, photos were taken every 10° until the whole bone
was captured. This was done at three various angled heights: 0° (straight on), 30°, and 60°. The
process was repeated with the distal end facing up. In total, each bone had a set of 216 photos,
108 for the proximal and distal ends, respectively. 3D-surface models were created using the
AgiSoft PhotoScan Professional software from the photos for each specimen.
5
Geometric Morphometrics
Landmark-based geometric morphometrics has been shown to be an effective method to
observe three-dimensional morphological differences (Zelditch et al. 2012). A total of 32
landmarks (Table 2) were chosen based on important avian muscular and osteological features
(Howard 1929, George and Berger 1966, Gilbert et al. 1985, Baumel and Witmer 1993).
Completed surface models for each humerus were imported into the Landmark Editor Version
3.0 software (Wiley 2006) for landmark application. The raw landmark coordinates were
imported into the MorphoJ Version 1.06d software (Klingenberg 2011) that performs a full
Procrustes fit, which ordinates the landmarks in both space and size creating Procrustes
coordinates. Each landmark produces three different Procrustes coordinates corresponding to the
x, y, and z planes.
Multivariate Analyses
A canonical variates analysis (CVA) is an ordination method used to determine which
variables discriminate between two or more assigned groups (Zelditch et al. 2012). This
technique was performed in MorphoJ for each of the ecological categories along with
discriminant function analyses (DFA) that examine group assignments. Both techniques were
applied due to how MorphoJ accepts groups for an analysis. The CVA allowed for inspection of
all pairings whereas the DFA only considered two groups at a time and provided cross-validated
correct classification rates of cases to their respective groupings.
Phylogenetic Consideration
To test the effects of phylogeny, MorphoJ performs permutation tests to determine if a
phylogenetic signal, the degree to which morphology can be ascribed to phylogenetic relations,
is present within the data (Klingenberg and Gidaszewski 2010). Following the methods of
Figueirido et al. (2016), a phylogenetic MANOVA was performed on the canonical variates of
each category using the Geiger library (Harmon et al. 2008) in R (R Development Core Team).
6
Quantifying Effects of Allometry
Avian forelimb morphology has been shown to relate in some way to organism size
(Kilbourne 2013). Wing mass, center of mass, and total length scale with positive allometry
relative to body mass (Kirkpatrick 1990, Van den Berg and Rayner 1995). The effects of
allometry on humerus shape were tested for each category by regression analysis of shape
(canonical variates of independent contrasts) on size (average body mass and log centroid Size).
Phylogenetically independent contrasts were used to control for phylogeny (Martín-Serra et al.
2014).
7
Results
A phylogenetic signal was revealed in the landmark dataset (P < 0.0001) but the groups for each
category were still found to be significantly different using the PhyMANOVA (P < 0.0001).
CVA Results
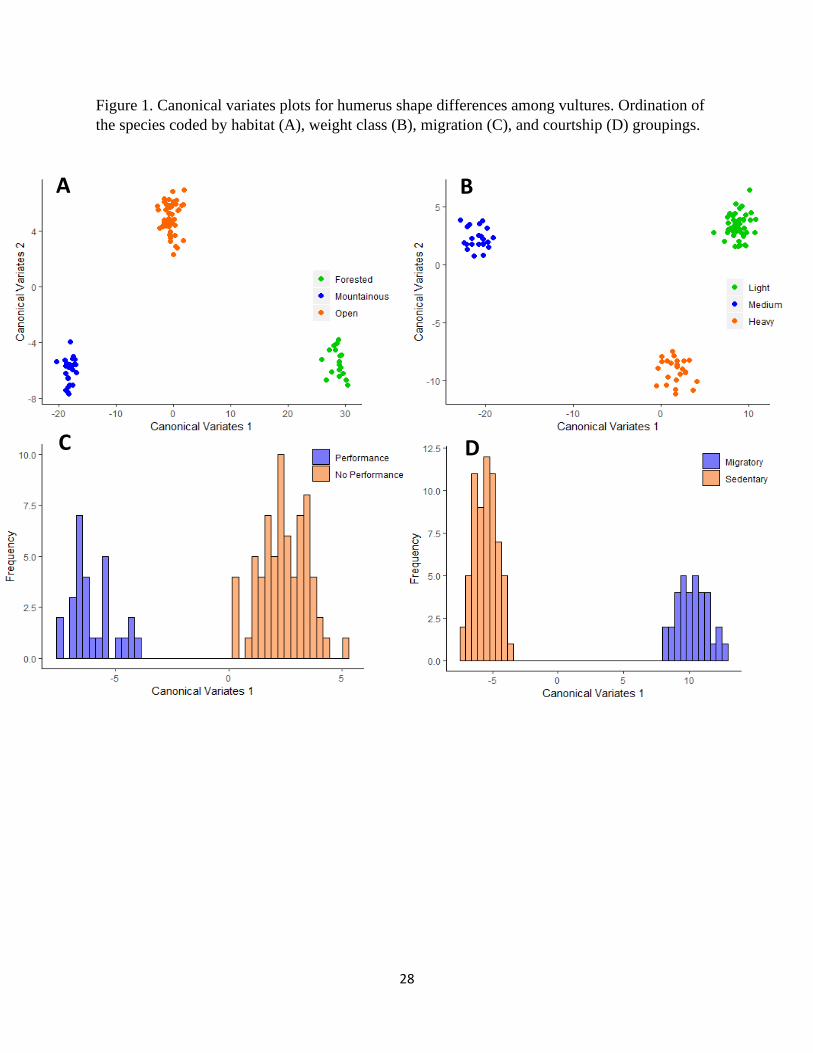
The CVA on habitat preference provided two eigenvectors that explain 100% (89.43%
for CV1 and 10.57% for CV2) of total variation among species. Permutation tests on both
Procrustes (PD) and Mahalanobis (MD) distances showed significant difference between each of
the habitat pairs (Table 3). The plot for CV1 vs. CV2 (Fig. 1A) showed differentiation among the
three habitat groups: forested, mountainous, and open. All groups were separated along the CV1
axis. Mountainous species fell on the negative side, the open group showed intermediate values
closer to 0, and forested species are found on the positive end. CV2 only separated open from
mountainous and forested which grouped around a similar negative value.
The CVA performed on the various weight classes provided two eigenvectors that
explained 100% (83.97% for CV1 and 16.03% for CV2) of total variance. Permutation tests on
PD and MD showed significant differences among the weight class pairs (Table 4). The plot for
CV1 vs. CV2 (Fig. 1B) showed variation in the weight classes: light, medium, and heavy. CV1
separated each group with medium falling on the negative end, light at the positive end, and
heavy in between. The CV2 axis separated the light and medium classes from the heavy class.
The CVAs performed on both courtship abilities and migratory behavior provided one
eigenvector each that explains 100% of total variation for each category. These permutation tests
also showed significant differences (Table 5 and 6). The plot for the CV1 axes (Fig. 1C and 1D)
separated the respective categories. For aerial courtship abilities, those species that perform fell
on the negative side whereas those that do not, group in the positive (Fig. 1C). Migratory
behavior was divided with sedentary species falling on the negative side of the axis and
migratory species on the positive (Fig. 1D).
8
DFA Results
The accuracies of the discriminant function analyses were assessed by observing the
classification of vulture species into their respective groups within each ecological category. The
DFA classified all species correctly but leave-one-out cross-validations showed that the post-hoc
probabilities did decrease for each category (Table 7).
Shape Changes
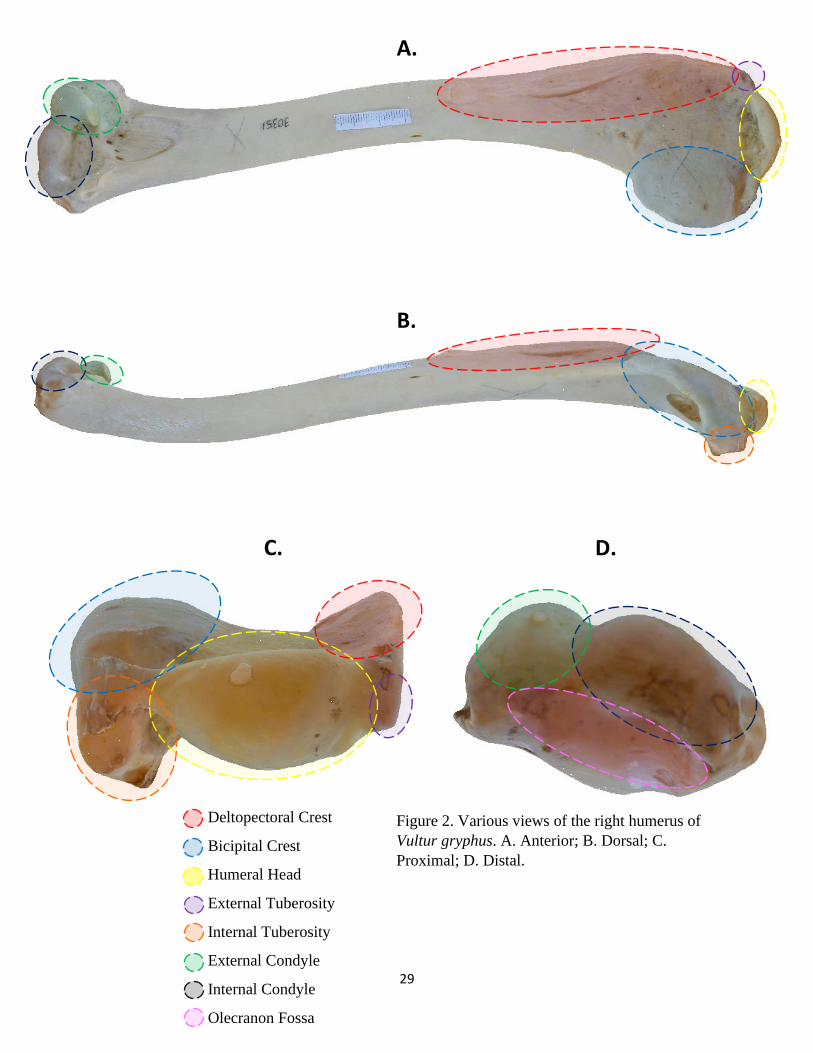
Relevant humerus skeletal features are outlined in Figure 2. Shape differences can be
described from the CVA by plotting the shape transformations between the various groups (Fig.
3 – 14). The DFA provided shape change plots between group pairings within ecological
categories that best separate morphological features.
Habitat
The shape transformation plots that describe the morphological differences among
vulture species that inhabit forested, mountainous, and open areas are presented in Figures 3 – 5.
The deltopectoral crest of mountain dwelling species are relatively longer and more curved than
the other groups (Fig. 3B – C and 4B – C). This is in contrast to forested individuals that exhibit
a relatively short and flat crest (Fig. 3C – D and 4C – D). The bicipital crests of forested and
mountainous species (Fig. 3C) are similar but this feature is relatively less robust and more
curved among those found in open habitats (Fig. 3B, D). Forested species display a
comparatively wide and robust head that projects laterally toward the deltopectoral crest (Fig.
3C, D and 5-1C, D). These species also exhibit relatively pronounced external tuberosities
whereas those of open areas were reduced and displaced medially toward the head (Fig. 3C, D
and 5-1C, D). Both the proximal and distal ends of the forested humeri are relatively wider
(medio-laterally) than the other two groups due to various features (Fig. 3C, D). On the distal
end, the external condyle is more pronounced in the forested group (Fig. 5-2C, D).
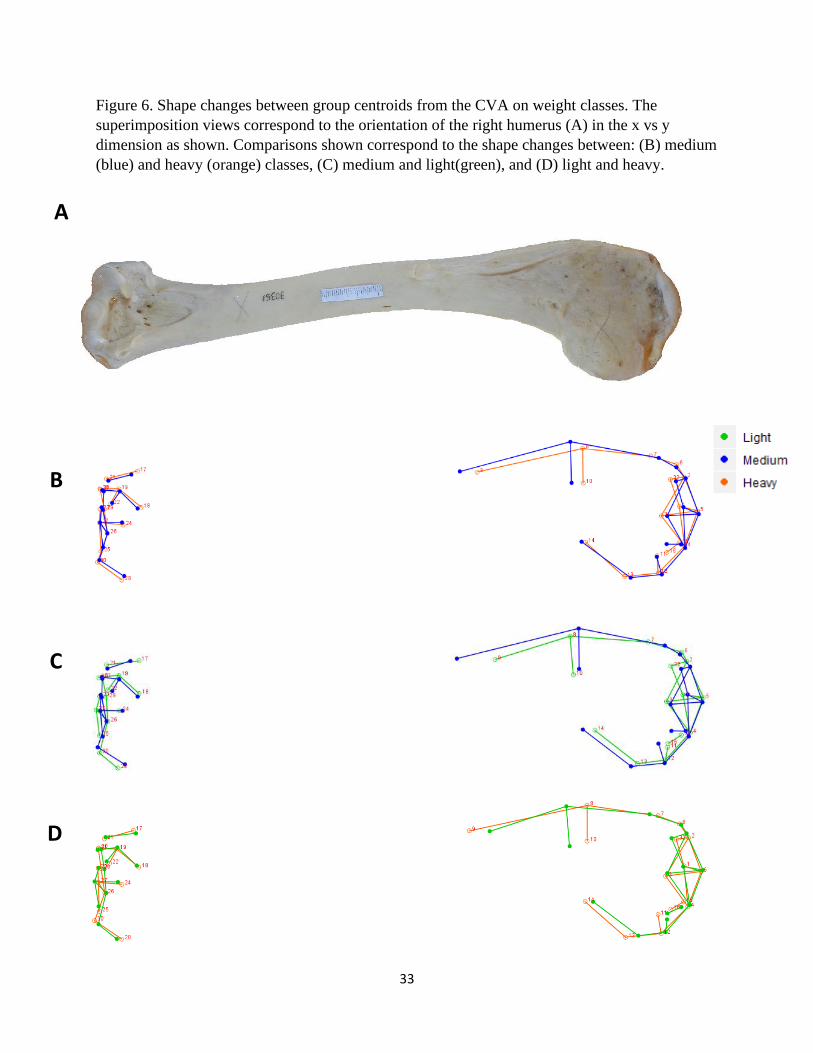
Weight Class
The shape transformation plots that describe the morphological differences among light,
medium, and heavy vulture species are presented in Figures 6 – 8. Species that are classified as
light-weight have a relatively shorter deltopectoral crest with a prominent peak that is
9
transitioned distally (Fig. 6, 7, and 8-1C, D). This crest for mid-weight vultures is comparatively
wider, laterally, with a more distal terminus thus making the feature relatively longer than the
other two groups (Fig. 6B, C and 8-1B, C). The heaviest species have a deltopectoral peak that is
most proximal, displaying a relatively short distance from the head (Fig. 8B, D). For medium
and heavy species, the bicipital crests are similar, but those in the light-weight class have a
relatively less robust crest (Fig. 6B, C, D). This crest is also comparatively flatter, and positioned
more posteriorly, in the light-weight species (Fig. 8-1C, D). The humeral heads of medium and
heavy species are less robust than those of lighter species and also angled toward the
deltopectoral crest (Fig. 8-1B, C, D). The external tuberosities of each group are shown to have
different morphological characteristics. This feature is relatively more pronounced in lighter
species, diminutive in mid-weight species, and intermediate among heavier individuals (Fig. 8-
1B, C, D). Internal tuberosities for light-weight species are angled relatively more proximally
and the other two groups are similar (Fig. 7B, C, D). The external condyles of mid-weight
vultures are comparatively the smallest of the three (Fig. 8-2B, C). Those in the heavy-weight
class possess more robust internal condyles (Fig. 8-2B, D). The olecranon fossa of this category
is also relatively the deepest (Fig. 8-2B, D).
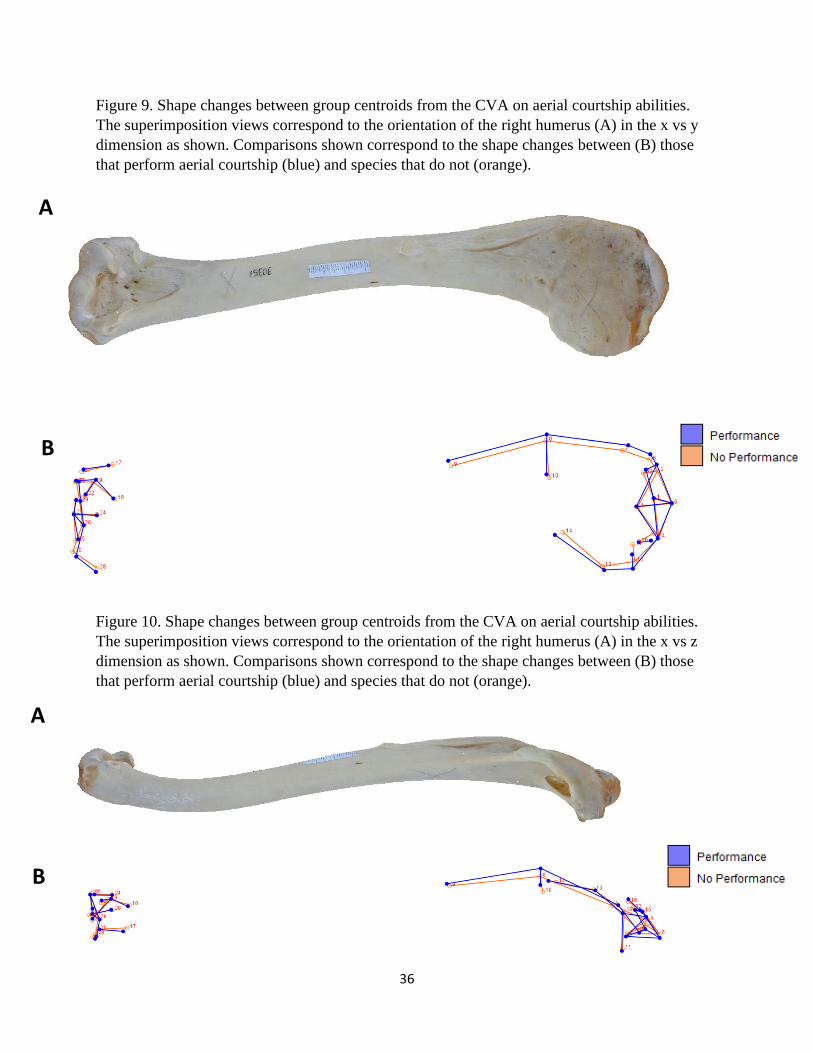
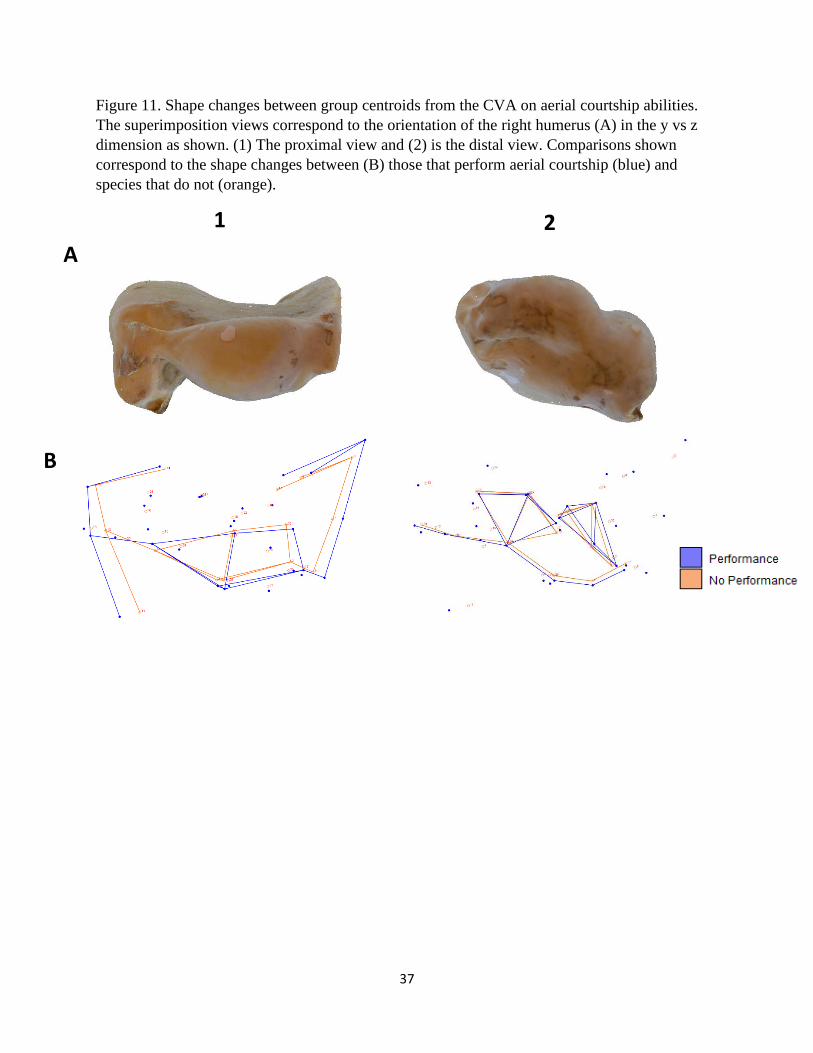
Courtship
The shape transformation plots that describe the morphological differences between
species that perform aerial courtship and those that do not are presented in Figures 9 – 11. The
proximal end for performing species is relatively wider compared to the other group, but this is
due to the exaggerated width and size of the humeral head (Fig. 9B and 11-1B). The shapes of
both the deltopectoral and bicipital crests are similar except for the aforementioned width and the
prominence of the deltopectoral peak (Fig. 9, 10, and 11-1B). Performers also possess a
comparatively more robust external condyle (Fig. 11-2B).
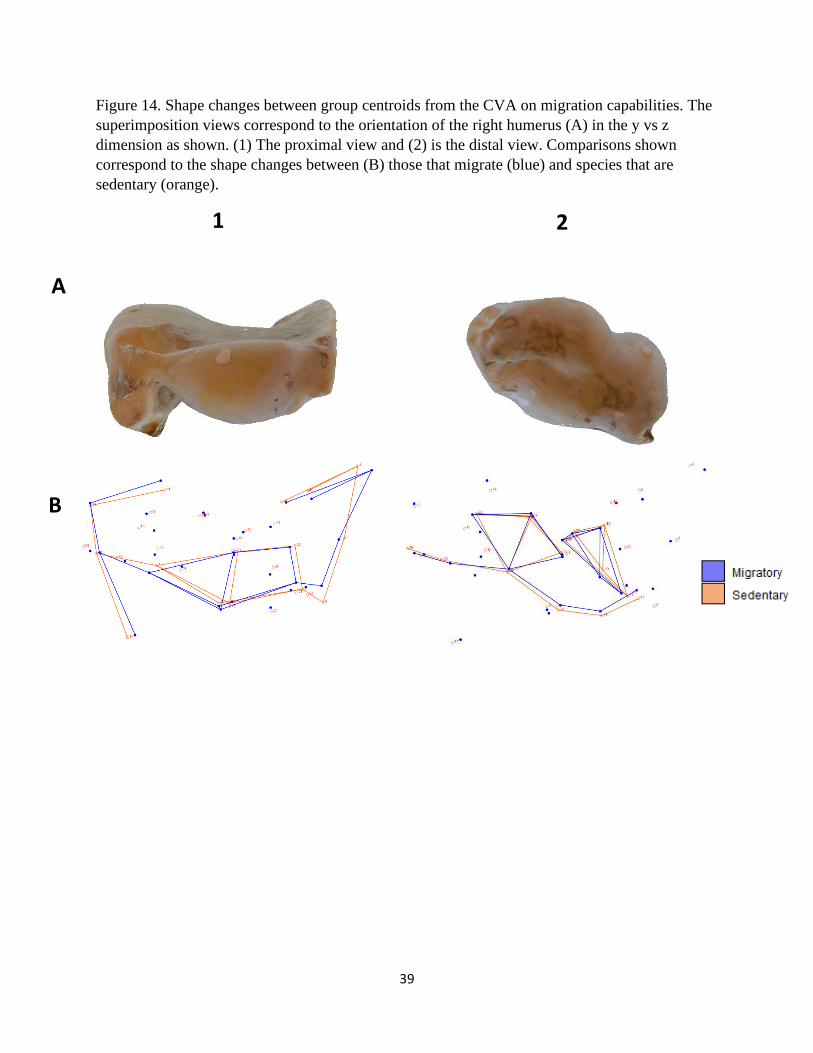
Migration
The shape transformation plots that describe the morphological differences between
migratory and sedentary species are presented in Figures 12 – 14. The peak of the deltopectoral
crests of migratory species is flared laterally, providing a relatively wider shape compared to
sedentary individuals (Fig. 12B and 14-1B). The external tuberosity for species that partake in
migration appears to be relatively shorter, but this is caused by the shift in angle of the humeral
10
head toward the deltopectoral crest (Fig. 14-1B). The remaining morphological features for these
categories are comparatively similar.
Effects of Phylogeny and Allometry
A phylogenetic signal was revealed in the landmark dataset (P < 0.0001) but the groups
for each category were found to be significantly different using the PhyMANOVA (P < 0.0001).
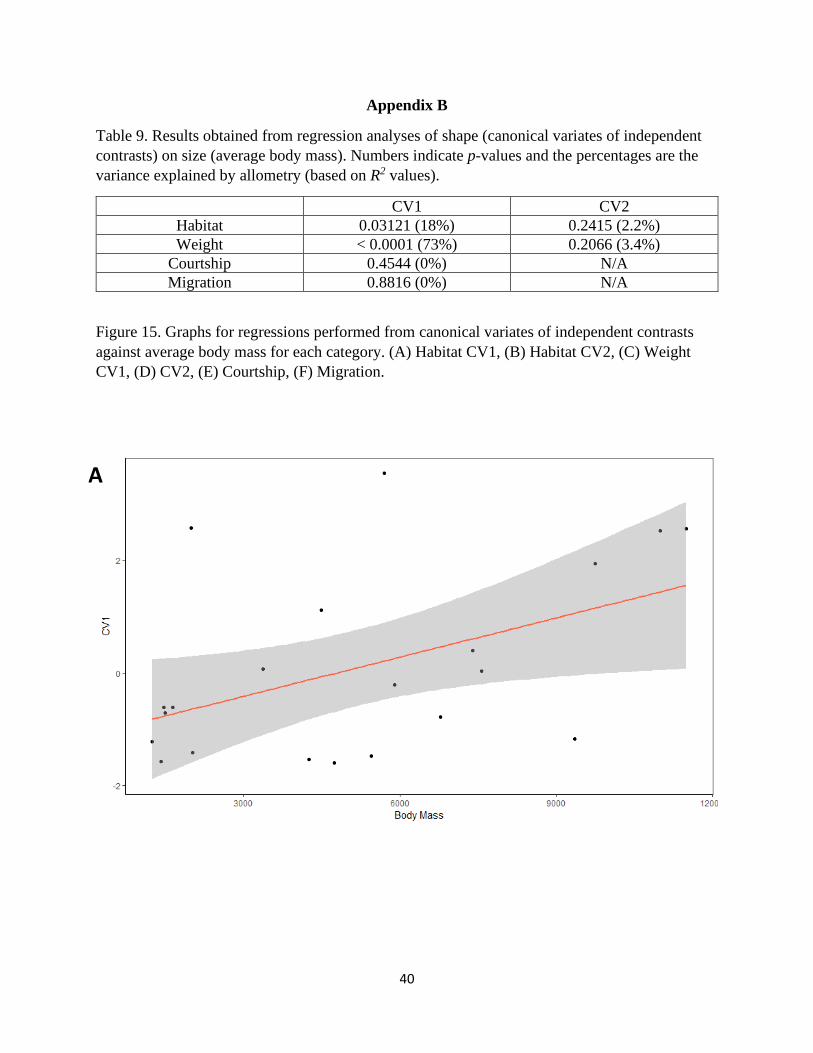
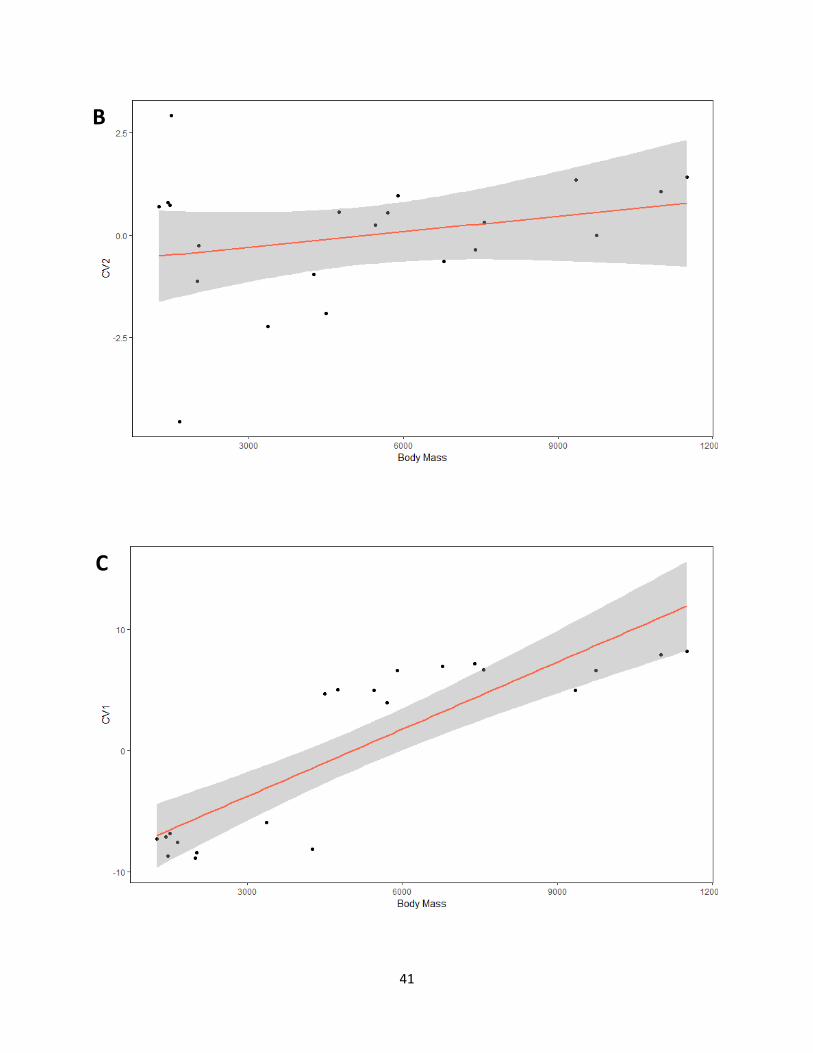
Regression analyses of shape on body mass were significant for both habitat and weight when
looking at shapes along the first canonical axes (P = 0.031, R2 = 0.18, and P < 0.0001, R2 = 0.73,
respectively; Appendix B). All analyses of shape on log centroid size were found to be non-
significant (Appendix B).
11
Discussion
Overview
Results suggest that there are differences among vulture humeral morphologies related to
functional variability of ecological factors. Skeletal shape differences were described for vultures
in each category, but the factors of habitat and weight were better at discriminating group
association compared to courtship or migration when looking at their higher percentage of
correct, leave-one-out cross-validated, classifications (Table 7). This outcome was possibly due
to the lack of courtship displaying species and that many vultures have incredibly large home
ranges without actively partaking in migration.
The results from the regression analyses suggest that the shape differences among species
in different habitats may be slightly attributed to the effects of allometry. About 18% of the
variance in shape found in this category can be explained by the increasing body mass of the
organisms in this study. Important avian linear morphological measurements, such as wing
length, have been shown to scale with positive allometry relating to inertial properties required to
fly (Van den Berg and Rayner 1995). Results for the regression in the weight category, in which
body mass explained 73% of the variance in shape, coincide with previous notions of scaling that
larger birds require different skeletal morphology to resist the demands for flight as body mass
increases (see Weight discussion).
The humeral features that displayed the most variation were the deltopectoral crest,
bicipital crest, humeral head, external and internal tuberosities, external and internal condyles,
olecranon fossa, supracondylaris dorsale, and entepicondyle (Fig. 2). Previous studies have
provided evidence for how bone shape and structure relate to muscle anatomy in a variety of
organisms (Hui 2002, Sievwright and Macleod 2012, Martín-Serra et al. 2014, MacLaren and
Nauwelaerts 2016, Mayr 2017, Dickson and Pierce 2019, Martin et al. 2019). These
musculoskeletal correlations may not just indicate the size and shape of muscles, but also how
the levers of the avian wing differ in mechanical advantages (Hildebrand and Goslow 2001). The
variations found in this study relate to musculoskeletal anatomies that suit a vulture’s ecology by
modifying the wing’s biomechanical properties. Relevant functions of these muscles and features
are detailed in Table 8.
12
Habitat
Humeral shape was shown to differ the most among the three habitat categories, the two
extremes being forest and mountain as noted along CV1 of Figure 1A. The deltopectoral crest
provides the insertion surface for both the M. pectoralis and the M. deltoideus major. Both New
and Old World vultures are known to possess similar flight muscle plans in terms of cross-
sectional area which is a valid indicator of muscle force-generating capacity (Hertel et al. 2015).
The relatively short crest of forested species implies that these muscles have their insertions
closer to their origins, shortening the overall length. This suggests that forest species have wings
that operate with increased velocity, therefore possibly flapping more compared to mountainous
and open inhabitants. Another key feature driving shape difference was the external tuberosity,
the point of insertion for the M. supracoracoideus tendon. This tuberosity was relatively longer
and more exaggerated in forested individuals creating a more distal attachment, which increases
the mechanical advantage for the upstroke muscle. Articulation points for both the proximal site
(humeral head) and one of the distal sites (external condyle) were relatively more pronounced
and rounded among forested species, creating a potentially greater range of motion for the wing
at the glenohumeral joint and radius, respectively. The last feature separating this group from the
others is the relatively wider distal end of the humerus caused by the protrusion of the
supracondylaris dorsale (dorsal) and the entepicondyle (ventral). Muscles of the antebrachium,
M. extensor carpi radialis and M. pronator profundus, respectively, originate from these tubercles
and provide the wing with more refined movements. Relative widening of the distal humerus
attachment points potentially create more distal insertions for muscles, thereby potentially
increasing mechanical advantage.
Mountain and open groups had relatively similar humeral shapes except for some
proximal features. The deltopectoral crests were comparatively the same length which may
enable the wings of these groups to act with more mechanical advantage, more forceful wing
beats, in contrast to the forest group. The main difference with open species is the shape of the
bicipital crest that segregates this group along the CV2 axis in Figure 1A. This feature is
relatively the least robust of the three, shortening the distance between the muscle attachments
and the glenohumeral joint, potentially increasing the velocity advantage for the recovery stroke.
13
Both the external and internal tuberosities are displaced medially toward the humeral head,
which might also contribute to the velocity advantage of the open habitat wings.
Examining these features simultaneously, I can conclude that there is some skeletal
variation among vultures occupying different habitats. Variation in wing morphology has been
shown to have a strong correlation with foraging style for a variety of avian species (Marchetti et
al. 1995, Corvidae et al. 2006, Sievwright and Macleod 2012, Corbin et al. 2013), whereas
foraging behavior has been associated with habitat (Gamauf et al. 1998). Because all vultures
have a very similar foraging style (Hertel et al. 2015), using habitat to infer the subtle differences
in wing morphology is an appropriate substitute. The species found in mountain and open
habitats have the characteristically long deltopectoral crest of soaring birds (Tobalske et al. 2011)
that provide forceful downstrokes and upstrokes due to the M. pectoralis and M. deltoideus
major. Due to the accessible thermals and updrafts, vultures inhabiting these areas only require
small adjustments in wing orientation to stay aloft. The bicipital crest, external tuberosity, and
internal tuberosity are the features that might enable open species’ wings to act at a velocity
advantage compared to the other categories. The relevant muscles of the bicipital crest and
external tuberosity, including the vital M. supracoracoideus, are responsible for upstroke
movements including flexing, stabilizing, and retracting the wing, which affects overall
maneuverability during various modes of flight (Dial 1992a, Warrick and Dial 1998, Corvidae et
al. 2006). Along with the muscles that insert on the internal tuberosity that assist the M.
pectoralis on the downstroke, the short moment arm of the wings might affect the speed at which
these species achieve takeoff, which is critical in environments that expose individuals to
predation such as accessible grasslands or savannas.
The dense foliage coverage of woodland and forested habitats provides unique challenges
to static soaring birds such as navigation and locating prey items. In this way, forest vultures
were hypothesized to possess wing morphologies similar to species that partake in more flapping
flight. This flight style is represented in humeral structure with shorter deltopectoral crests
(Serrano and Chiappe 2017) and increased area for muscle attachment sites that equate to
relatively larger muscles (Dial et al. 1991, Corvidae et al. 2006). Our results for forest vultures
comply with the former description of flapping flight indicating the muscles of the deltopectoral
crest work at a velocity advantage, but other features were found to have the opposite effect. The
14
external tuberosity, supracondylaris dorsale, entepicondyle, ectepicondyle, and flexorius process
might increase the mechanical advantage for the wing at different stages of the wingbeat. The M.
supracoracoideus is considered the primary upstroke muscle in birds but previous studies have
concluded that it may be recruited at different points during the wingbeat cycle such as takeoff
(Corvidae et al. 2006, Bribiesca-Contreras et al. 2019), low-speed soaring (Warrick and Dial
1998), or at the transition between the downstroke and upstroke (Dial et al. 1991, Dial 1992a,
Dial 1992b, Tobalske et al. 2011). Because forest species flap at a higher frequency, I suggest
that this muscle acts more to decelerate the wing at the termination of the downstroke. These
species may counteract the high inertia of quick downstrokes by utilizing more forceful
upstrokes accomplished by the M. supracoracoideus. This action may be facilitated by the M.
flexor and extensor carpi ulnaris that both flex the wrist as the wing is beginning its accession
(Dial 1992a, Vazquez 1994). The M. extensor carpi radialis is also active during the transition
period but at the upstroke – downstroke conversion, the opposite time compared to the previous
muscles (Dial 1992a). This muscle, along with the M. pronator profundus, are parts of the wing
responsible for altering its shape and position (Biewener 2011) and are subjected to the greatest
aerodynamic forces during flapping flight (Dial 1992a). The relatively higher mechanical
advantage for these muscles may allow forest species to compensate for the quick change of
wing shape and position during flight.
Weight
Among the four ecological categories, weight was only slightly worse at discriminating
group association compared to habitat (Table 7). Medium and light species were found to have
the greatest difference in humeral shape along CV1 (Fig. 1B). One would suspect that heavy and
light species would be the two extremes, but heavier vultures were closer to small vultures along
CV1 and separated from the other groups along CV2 (Fig. 1B). Skeletal shape variation is
known to be influenced by allometry (Bright et al. 2016), but our results suggest feeding ecology
of birds might be constrained by body size (Bright et al. 2016); our results also suggest that
humeral shape may not be related to allometric scaling.
Body mass is one of the largest constraints on a flying organism’s aerial performance
especially in energetically costly takeoff flight (Marden 1994, Dial 2003, Tobalske et al. 2011).
In general, larger birds exert more energy achieving vertical takeoff and other flight modes
15
because the power from muscles to attain this form of locomotion increases slower than what is
required to fly (Tobalske et al. 2011). I hypothesized that the heavy group would have the most
force behind the downstroke that would be represented by the deltopectoral crest. There are
many ways heavier birds alleviate this issue such as altered muscle physiology and wing shape
and size. The results in this category indicate that the deltopectoral crest for heavy vulture
species causes the wings to work at a greater mechanical disadvantage than those with a medium
weight. When compared to the light-weight group, heavy vultures still had a lower mechanical
advantage due to the peak of the deltopectoral crest positioned relatively closer to the humeral
head. This result leads us to believe that heavy vultures enhance the downstroke in other ways
besides the shape of the deltopectoral crest. These species might have larger cross-sectional area
for the pectoralis relating to potential force production (Hertel et al. 2015), overall lower wing
loading and aspect ratio for more lift surface area, different feather proportions (Norberg 1979),
or different recruitment of downstroke muscle fibers (Rosser and George 1986, Corvidae et al.
2006, Peters and Dobbins 2012).
Heavy vultures were also found to have less potential range of motion at various
articulation sites. The shape of the humeral head and internal condyle were found to be the most
restrictive of the three weight classes. However, the olecranon fossa was relatively the deepest in
comparison. The range of motion for limb joints deceases with increasing size (Biewener 1991)
and the combination of these features may allow large vultures to resist twisting of the humerus
during flight, increasing the critical torsional strength of the bone (Biewener and Dial 1995).
This is also seen in the medium weight species but to a lesser extent.
Vultures considered medium weight were found to have the relatively greatest
mechanical advantage on the downstroke due to the shape of the deltopectoral crest (Serrano and
Chiappe 2017). This feature, similar to the habitat results, is what drives the position of the
groups on the CV1 axis in Figure 1B. The deltopectoral crest is an insertion site for the M.
deltoideus major that assists the M. supracoracoideus in elevation of the wing near the
downstroke – upstroke transition (Dial 1992a). Medium weight species’ wings receive a velocity
advantage on the upstroke because of the relatively less robust external tuberosity. Examining
both upstroke muscles simultaneously reveals that these birds may have a more balanced flight
cycle.
16
Features of light-weight vultures were found to be remarkably similar to those of forest
species, given that two of three forest vultures are categorized as light-weight (Table 1, Fig. 3 –
7). Such similarities include a relative velocity advantage of the deltopectoral crest, mechanical
advantage of the external tuberosity, and a relatively greater potential range of motion at the
glenohumeral joint. However, light-weight species exhibited a relatively less robust bicipital
crest indicating a wing that has more velocity advantage on both flight strokes. In general,
smaller vultures would be able to flap their wings at a higher frequency and the similarities
between light and forest species might also be a result of the low number of vultures found in
this habitat type.
Courtship/Migration
The discriminant function analysis was able to correctly classify the species into the
correct courtship and migration categories but after a leave-one-out cross-validation these
groupings were less predictive (Table 7). In the shape change plots (Fig. 8 – 13), species that
perform aerial courtship displays and those that migrate tend to have more robust proximal
features. Both ecological classifications have been shown to be valid predictors of wing shape,
size, and skeletal morphology in a variety of other avian species (Marchetti et al. 1995,
Calmaestra and Moreno 2000, Voelker 2001, Sievwright and Macleod 2012, Provinciato et al.
2018). Only a handful of vulture species partake in aerial courtship and, being scavengers,
usually have incredibly large home ranges in which they may search hundreds of miles for a
chance to acquire a meal. For these reasons, courtship abilities or migration patterns may not be
reliable predictors of humeral morphology in this avian group.
17
Conclusions
Vultures provide unique insight to how avian skeletal morphology relates to the
locomotor form of flight. This group of birds is considered to have the same style of flight,
thermal or static soaring, and are usually clustered together for ecomorphological studies. Even
though phylogeny had a significant role in the separation of some features, that does not discredit
the humerus as a functional trait through evolutionary history. I presented a novel approach of
applying 3D geometric morphometrics to analyze two convergent families of birds, which
allowed us to examine slight differences in their generally similar skeletal morphology. Most
previous morphological studies implemented linear measurements to understand wing shape and
function. Traditional morphometrics fail to capture the complete variation in shape, which is
easily summarized using the various methods of visualization provided by geometric
morphometrics. Using the methods outlined here may provide a more detailed understanding of
the subtle shape differences that affect an organism’s ecology.
Our research provides a general framework for future introductory 3D geometric
morphometric studies on the avian humerus. The morphometric results presented here can be
improved with more precise imaging tools, advancements in software, or larger datasets that
include other species or structures. Continuing to develop ecomorphological techniques will
increase our understanding of the linkage between morphology and ecology on both extinct and
extant organisms.
18
Literature Cited
Baumel, J. J., and Witmer L. M. 1993. Osteologia. In: Baumel J. J., King A. S., Breazile J. E.,
Evans H. E., Vanden Berge J. C., editors. Handbook of avian anatomy: nomina anatomica
avium, 2nd ed. Cambridge, UK: Nuttall Ornithological Club. p 45–132.
Biewener, A. A. 1991. Musculoskeletal design in relation to body size. Journal of Biomechanics
24: 19–29.
Biewener, A. A. 2011. Muscle function in avian flight: Achieving power and control.
Philosophical Transactions of the Royal Society B: Biological Sciences 366(1570): 1496–
1506.
Biewener, A. A., and Dial, K. P. 1995. In vivo strain in the humerus of pigeons (Columba livia)
during flight. Journal of Morphology 225(1): 61–75.
Brewer, M. L., and Hertel, F. 2007. Wing Morphology and Flight Behavior of Pelecaniform
Seabirds, Journal of Morphology 268: 866–877.
Bribiesca-Contreras, F., Parslew, B., and Sellers, W. I. 2019. A Quantitative and Comparative
Analysis of the Muscle Architecture of the Forelimb Myology of Diurnal Birds of Prey
(Order Accipitriformes and Falconiformes). Anatomical Record 302: 1808–1823.
Bright, J. A., Marugán-Lobón, J., Cobb, S. N., and Rayfield, E. J. 2016. The shapes of bird beaks
are highly controlled by nondietary factors. Proceedings of the National Academy of
Sciences 113(19): 5352–5357.
Brown, L., and Amadon, D. 1968. Eagles, hawks, and falcons of the world. McGraw-Hill, New
York, USA.
Calmaestra, R. G., and Moreno, E. 2000. Ecomorphological patterns related to migration: A
comparative osteological study with passerines. Journal of Zoology 252(4): 495–501.
Corbin, C. E., Lowenberger, L. K., and Dorkoski, R. P. 2013. The skeleton flight apparatus of
North American bluebirds (Sialia): Phylogenetic thrushes or functional flycatchers? Journal
of Morphology 274(8): 909–917.
Corvidae, E. L., Bierregaard, R. O. and Peters, S. E. 2006. Comparisons of wing morphology in
three birds of prey: Correlations with differences in flight behavior. Journal of Morphology
267: 612–622.
Degrange, F. J. 2017. Hind limb morphometry of terror birds (Aves, Cariamiformes,
Phorusrhacidae): functional implications for substrate preferences and locomotor lifestyle.
Earth and Environmental Science Transactions of the Royal Society of Edinburgh 106(04):
257–276.
19
del Hoyo, J., Elliot, A., and Sargatal, J., eds. 1994. Handbook to the birds of the world. Volume
2. New World vultures to guinea fowl. Lynx Edicions, Barcelona.
Dial, K. P. 1992a. Activity patterns of the wing muscles of the pigeon (Columba livia) during
different modes of flight. Journal of Experimental Zoology 262(4): 357–373.
Dial, K. P. 1992b. Avian Forelimb Muscles and Nonsteady Flight: Can Birds Fly without Using
the Muscles in Their Wings? Auk 109(4): 874–885.
Dial, K. P. 2003. Evolution of Avian Locomotion: Correlates of Flight Style, Locomotor
Modules, Nesting Biology, Body Size, Development, and the Origin of Flapping Flight.
Auk 120(4): 941 – 952.
Dial, K. P., Goslow, G. E., and Jenkins, A. 1991. The Functional Anatomy of the Shoulder in the
European Starling. Journal of Morphology 344: 327–344.
Dickson, B. V., and Pierce, S. E. 2019. Functional performance of turtle humerus shape across
an ecological adaptive landscape. Evolution 73: 1265–1277.
Figueirido, B., Martín-Serra, A., and Janis, C. 2016. Ecomorphological determinations in the
absence of living analogues: the predatory behavior of the marsupial lion (Thylacoleo
carnifex) as revealed by elbow joint morphology. Paleobiology 42(3): 508 – 531.
Gamauf, A., Preleuthner M., and Winkler, H. 1998. Philippine birds of prey: interrelations
among habitat, morphology, and behavior. Auk 115: 713–726.
George, J. C. and Berger, J. 1966. Avian Myology. Academic Press, New York.
Gilbert, B., Martin, L., and Savage, H. 1985. Avian Osteology. Modern Printing Co., Wyoming.
Grossman, M. L. and Hamlet, J. 1964. Birds of prey of the world. Bonanza Books, New York.
Harmon, L. J., Weir, T., Brock, C., Glor, R., and Wendell, C. 2008. GEIGER: investigating
evolutionary radiations. Bioinformatics 24:129–131.
Hertel, F. 1994. Diversity in body size and feeding morphology in past and present vulture
assemblages. Ecology 75: 1074–1084.
Hertel, F. 1995. Ecomorphological indicators of feeding behavior in past and present raptors: an
analysis based on skull morphology. Auk 112:890–903.
Hertel, F., and Ballance, L.T. 1999. Wing ecomorphology of seabirds from Johnston Atoll.
Condor 101:549–556.
20
Hertel, F., Maldonado, J. E., and Sustaita, D. 2015. Wing and hindlimb myology of vultures and
raptors (Accipitriformes) in relation to locomotion and foraging. Acta Zoologica 96(3):
283–295.
Hieronymus, T. L. 2015. Qualitative skeletal correlates of wing shape in extant birds (Aves:
Neoaves). BMC Evolutionary Biology 15: 30.
Hildebrand M, Goslow GE. 2001 Analysis of vertebrate structure. New York, NY: John Wiley &
Sons.
Houston, D. C. 1985. Evolutionary ecology of afrotropical and neotropical vultures in forests. In:
Buckley P., Foster M., Morton E., Ridgley R., Buckley F., editors. Neotropical
ornithology. American Ornithologists’ Union, Ornithological Monographs, Number 36.
p. 856 – 864.
Howard, H. 1929. The avifauna of Emeryville Shellmound. University of California Publications
in Zoology 32 (2): 301–394.
Hui, C. A. 2002. Avian furcula morphology may indicate relationships of flight requirements
among birds. Journal of Morphology 251(3): 284–293.
James, F. C. 1982. The ecological morphology of birds: a review. Annales Zoologici Fennici
19:275–285.
Jarvis, E. D. et al. 2014. Whole-genome analyses resolve early branches in the tree of life of
modern birds. Science 346: 1320–1331.
Kaboli, M., Aliabadian, M., Guillaumet, A., Roselaar, C. S., Prodon, R. 2007. Ecomorphology of
the wheatears (genus Oenanthe). Ibis 149(4): 792–805.
Kilbourne, B. M. 2013. On birds: Scale effects in the neognath hindlimb and differences in the
gross morphology of wings and hindlimbs. Biological Journal of the Linnean Society
110(1): 14–31.
Kirkpatrick, S. J. 1990. The moment of inertia of bird wings. Journal of Experimental Biology
151: 489–494.
Klingenberg, C. P. 2011. MorphoJ: An integrated software package for geometric
morphometrics. Molecular Ecology Resources 11(2): 353–357.
Klingenberg, C. P., and Gidaszewski, N. A. 2010. Society of Systematic Biologists Testing and
Quantifying Phylogenetic Signals and Homoplasy in Morphometric Data. Systematic
Biology 59(3): 245–261.
Ligon, D. 1967. Retlationships of cathartid vultures. Occasional Papers, Museum of Zoology,
University of Michigan 651: 1–26.
21
MacLaren, J. A., and Nauwelaerts, S. 2016. A three-dimensional morphometric analysis of upper
forelimb morphology in the enigmatic tapir (Perissodactyla: Tapirus) hints at subtle
variations in locomotor ecology. Journal of Morphology 277(11): 1469–1485.
Marchetti, K., Price, T., Richman, A., Marchetti, K., Price, T., Richman, A. 1995. Correlates of
Wing Morphology with Foraging Behaviour and Migration Distance in the Genus
Phylloscopus. Journal of Avian Biology 26: 177 – 181.
Marden, J. H. 1994. From damselflies to pterosaurs: How burst and sustainable flight
performance scale with size. American Journal of Physiology - Regulatory Integrative and
Comparative Physiology 266: 1077 – 1084.
Martin, M. L., Travouillon, K. J., Sherratt, E., Fleming, P. A., Warburton, N. M. 2019.
Covariation between forelimb muscle anatomy and bone shape in an Australian scratch-
digging marsupial: Comparison of morphometric methods. Journal of Morphology 280(12)
1900 – 1915.
Martín-Serra, A., Figueirido, B., and Palmqvist, P. 2014. A three-dimensional analysis of
morphological evolution and locomotor performance of the carnivoran forelimb. PLoS
ONE 9(1): 43–49.
Mayr, G. 2017. Pectoral girdle morphology of Mesozoic birds and the evolution of the avian
supracoracoideus muscle. Journal of Ornithology 158(3): 859–867.
Meyers, R. A., and McFarland, J. C. 2017. Anatomy and histochemistry of spread-wing posture
in birds. 4. Eagles soar with fast, not slow muscle fibres. Physiology & Behavior 176(1):
139–148.
Mundy, P., Butchart, D., Ledger, J., Piper, S. 1992. The Vultures of Africa. Academic Press
Limited, London.
Norberg, U. M. 1979. Morphology of the wings, legs and tail of three coniferous forest tits, the
goldcrest, and the treecreeper in relation to locomotor pattern and feeding station
selection. Philosophical Transactions of the Royal Society B 287: 131–165.
Norberg, U. M. 1981. Flight, morphology and the ecological niche in some birds and bats.
Symposia of the Zoological Society of London. 48: 173–197.
Nudds, R. L., Dyke, G. J., and Rayner, J. M. V. 2007. Avian brachial index and wing kinematics:
Putting movement back into bones. Journal of Zoology 272(2): 218–226.
Peters, S. E., and Dobbins, C. S. 2012. A comparative study of the mechanics of the pectoralis
muscle of the red-tailed hawk and the barred owl. Journal of Morphology 273(3): 312–323.

22
Plummer, T., Bishop, L. and Hertel, F. 2008. Habitat preference of extant African bovids based
on astragalus morphology: operationalizing ecomorphology for palaeoenvironmental
reconstruction. Journal of Archaeological Science 35: 3016 – 3027.
Provinciato, I. C. C., Araújo, M. S., and Jahn, A. E. 2018. Drivers of wing shape in a widespread
Neotropical bird: a dual role of sex-specific and migration-related functions. Evolutionary
Ecology 32(4): 379–393.
R development core team. R: a language and environment for statistical computing. R
Foundation for Statistical Computing, Vienna, Austria.
Rosser, B. W. C., and George, J. C. 1986. The avian pectoralis: histochemical characterization
and distribution of muscle fiber types. Canadian Journal of Zoology 64(5): 1174–1185.
Sausner, J., Torres-Mura, J. C., Robertson, J., and Hertel, F. 2016. Ecomorphological differences
in foraging and pattering behavior among storm-petrels in the eastern Pacific Ocean. Auk
133: 397–414.
Serrano, F. J., & Chiappe, L. M. 2017. Aerodynamic modelling of a Cretaceous bird reveals
thermal soaring capabilities during early avian evolution. Journal of the Royal Society
Interface 14(132): 20170182.
Serrano, F. J., Palmqvist, P., Chiappe, L. M., and Sanz, J. L. 2017. Inferring flight parameters of
Mesozoic avians through multivariate analyses of forelimb elements in their living relatives.
Paleobiology, 43(1): 144–169.
Sibley, C. G., and Ahlquist, J. E. 1990. Phylogeny and classification of birds: a study in
molecular evolution. Yale University Press, New Haven, Connecticut, USA.
Sievwright, H., and MacLeod, N. 2012. Eigensurface analysis, ecology, and modelling of
morphological adaptation in the falconiform humerus (Falconiformes: Aves). Zoological
Journal of the Linnean Society 165(2): 390–419.
Sustaita, D., and Rubega, M. A. 2014. The anatomy of a shrike bite: Bill shape and bite
performance in Loggerhead Shrikes. Biological Journal of the Linnean Society 112(3): 485–
498.
Tobalske, B. W., Hedrick, T. L., and Biewener, A. A. 2003. Wing kinematics of avian flight
across speeds. Journal of Avian Biology 34(2): 177–184.
Van den Berg, C., and Rayner, J. V. 1995. The moment of inertia of bird wings and the inertial
power requirement for flapping flight. The Journal of Experimental Biology 198: 1655–
1664.
van Oordt, F., Torres-Mura, J.C. and Hertel, F. 2018. Ecomorphology and foraging behaviour of
Pacific boobies. Ibis 160: 313–326.
23
Vazquez, R. J. 1994. The automating skeletal and muscular mechanisms of the avian wing
(Aves). Zoomorphology 114(1): 59–71.
Voelker, G. 2001. Morphological correlates of migratory distance and flight display in the avian
genus Anthus. Biological Journal of the Linnean Society 73(4): 425–435.
Wang, X., & Clarke, J. A. 2015. The evolution of avian wing shape and previously unrecognized
trends in covert feathering. Proceedings of the Royal Society B: Biological Sciences
282(1816): 20151935.
Wang, X., McGowan, A. J., & Dyke, G. J. 2011. Avian wing proportions and flight styles: First
step towards predicting the flight modes of Mesozoic birds. PLoS ONE 6(12): 1–8.
https://doi.org/10.1371/journal.pone.0028672
Warrick, D. R., & Dial, K. P. 1998. Kinematic, aerodynamic and anatomical mechanisms in the
slow, maneuvering flight of pigeons. Journal of Experimental Biology 201(5): 655–672.
Wiley D. F. 2006. Landmark Editor 3.0. IDAV, Davis: University of California. Available at:
http://graphics.idav.ucdavis.edu/ research/EvoMorph
Zelditch, M. L., Swiderski, D. L., Sheets, H. D., and Fink, W. L. 2012. Geometric
Morphometrics for Biologists: A Primer. Academic Press, New York.
24
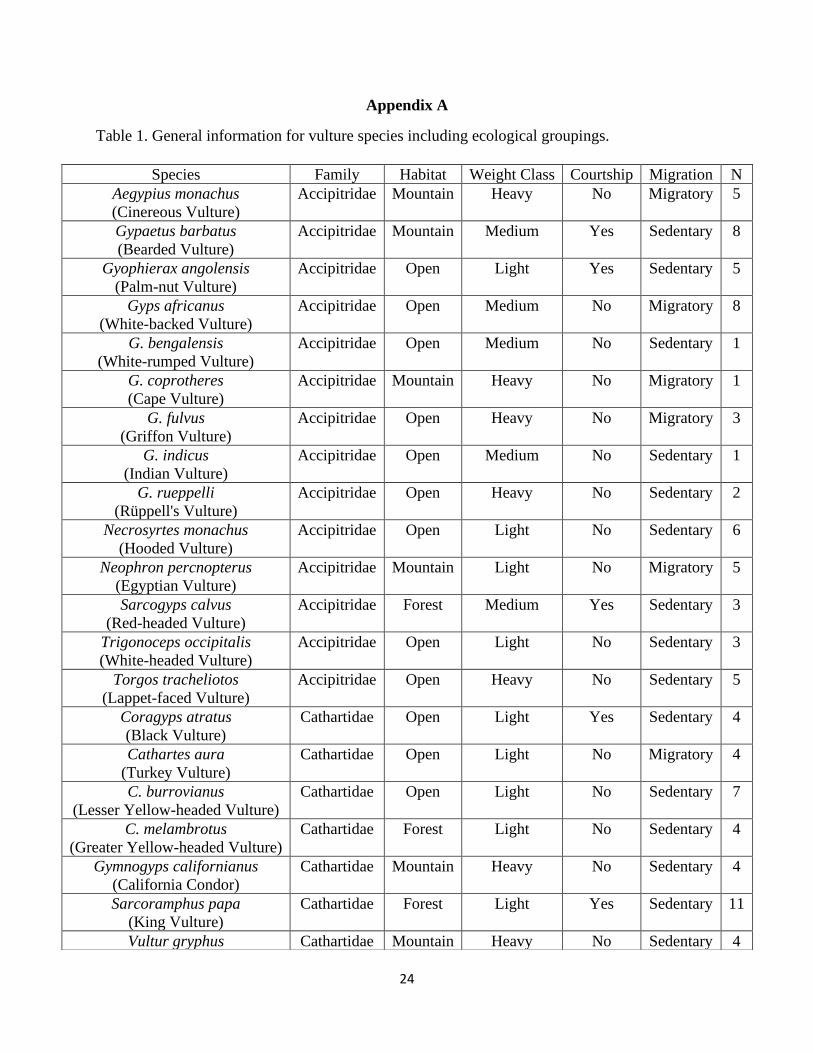
Appendix A
Table 1. General information for vulture species including ecological groupings.
Species Family Habitat Weight Class Courtship Migration N
Aegypius monachus
(Cinereous Vulture)
Accipitridae Mountain Heavy No Migratory 5
Gypaetus barbatus
(Bearded Vulture)
Accipitridae Mountain Medium Yes Sedentary 8
Gyophierax angolensis
(Palm-nut Vulture)
Accipitridae Open Light Yes Sedentary 5
Gyps africanus
(White-backed Vulture)
Accipitridae Open Medium No Migratory 8
G. bengalensis
(White-rumped Vulture)
Accipitridae Open Medium No Sedentary 1
G. coprotheres
(Cape Vulture)
Accipitridae Mountain Heavy No Migratory 1
G. fulvus
(Griffon Vulture)
Accipitridae Open Heavy No Migratory 3
G. indicus
(Indian Vulture)
Accipitridae Open Medium No Sedentary 1
G. rueppelli
(Rüppell's Vulture)
Accipitridae Open Heavy No Sedentary 2
Necrosyrtes monachus
(Hooded Vulture)
Accipitridae Open Light No Sedentary 6
Neophron percnopterus
(Egyptian Vulture)
Accipitridae Mountain Light No Migratory 5
Sarcogyps calvus
(Red-headed Vulture)
Accipitridae Forest Medium Yes Sedentary 3
Trigonoceps occipitalis
(White-headed Vulture)
Accipitridae Open Light No Sedentary 3
Torgos tracheliotos
(Lappet-faced Vulture)
Accipitridae Open Heavy No Sedentary 5
Coragyps atratus
(Black Vulture)
Cathartidae Open Light Yes Sedentary 4
Cathartes aura
(Turkey Vulture)
Cathartidae Open Light No Migratory 4
C. burrovianus
(Lesser Yellow-headed Vulture)
Cathartidae Open Light No Sedentary 7
C. melambrotus
(Greater Yellow-headed Vulture)
Cathartidae Forest Light No Sedentary 4
Gymnogyps californianus
(California Condor)
Cathartidae Mountain Heavy No Sedentary 4
Sarcoramphus papa
(King Vulture)
Cathartidae Forest Light Yes Sedentary 11
Vultur gryphus Cathartidae Mountain Heavy No Sedentary 4
25
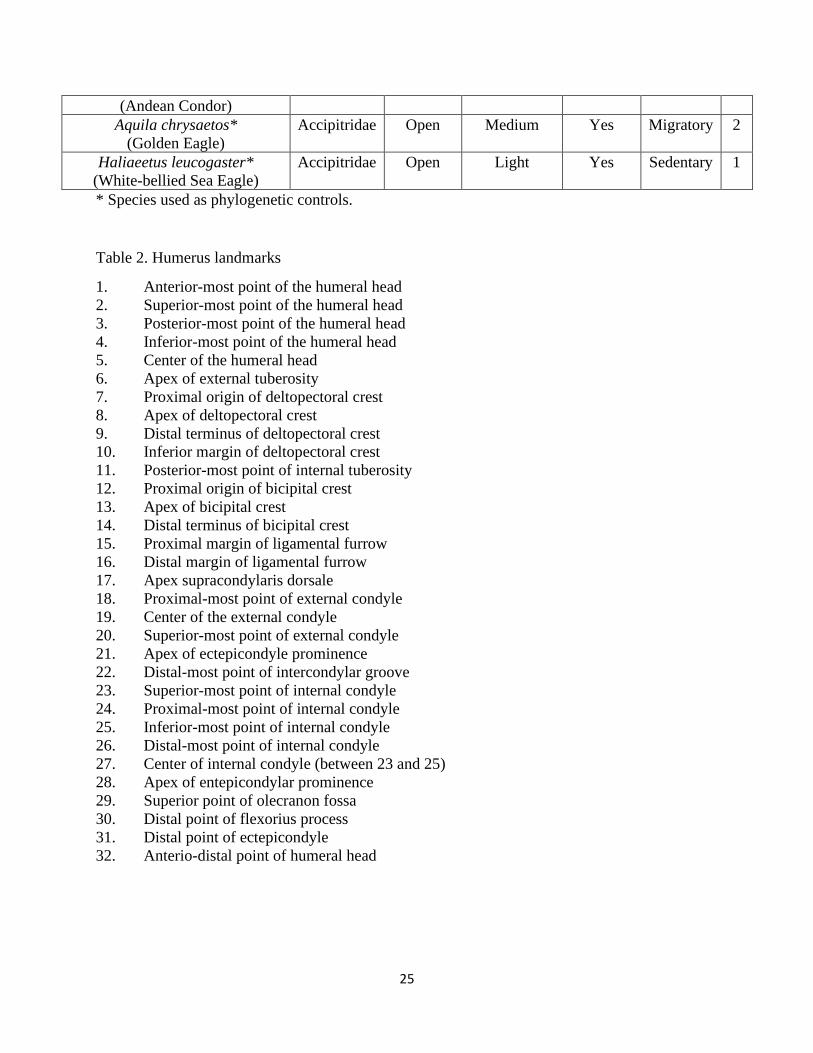
* Species used as phylogenetic controls.
Table 2. Humerus landmarks
1. Anterior-most point of the humeral head
2. Superior-most point of the humeral head
3. Posterior-most point of the humeral head
4. Inferior-most point of the humeral head
5. Center of the humeral head
6. Apex of external tuberosity
7. Proximal origin of deltopectoral crest
8. Apex of deltopectoral crest
9. Distal terminus of deltopectoral crest
10. Inferior margin of deltopectoral crest
11. Posterior-most point of internal tuberosity
12. Proximal origin of bicipital crest
13. Apex of bicipital crest
14. Distal terminus of bicipital crest
15. Proximal margin of ligamental furrow
16. Distal margin of ligamental furrow
17. Apex supracondylaris dorsale
18. Proximal-most point of external condyle
19. Center of the external condyle
20. Superior-most point of external condyle
21. Apex of ectepicondyle prominence
22. Distal-most point of intercondylar groove
23. Superior-most point of internal condyle
24. Proximal-most point of internal condyle
25. Inferior-most point of internal condyle
26. Distal-most point of internal condyle
27. Center of internal condyle (between 23 and 25)
28. Apex of entepicondylar prominence
29. Superior point of olecranon fossa
30. Distal point of flexorius process
31. Distal point of ectepicondyle
32. Anterio-distal point of humeral head
(Andean Condor)
Aquila chrysaetos*
(Golden Eagle)
Accipitridae Open Medium Yes Migratory 2
Haliaeetus leucogaster*
(White-bellied Sea Eagle)
Accipitridae Open Light Yes Sedentary 1
26
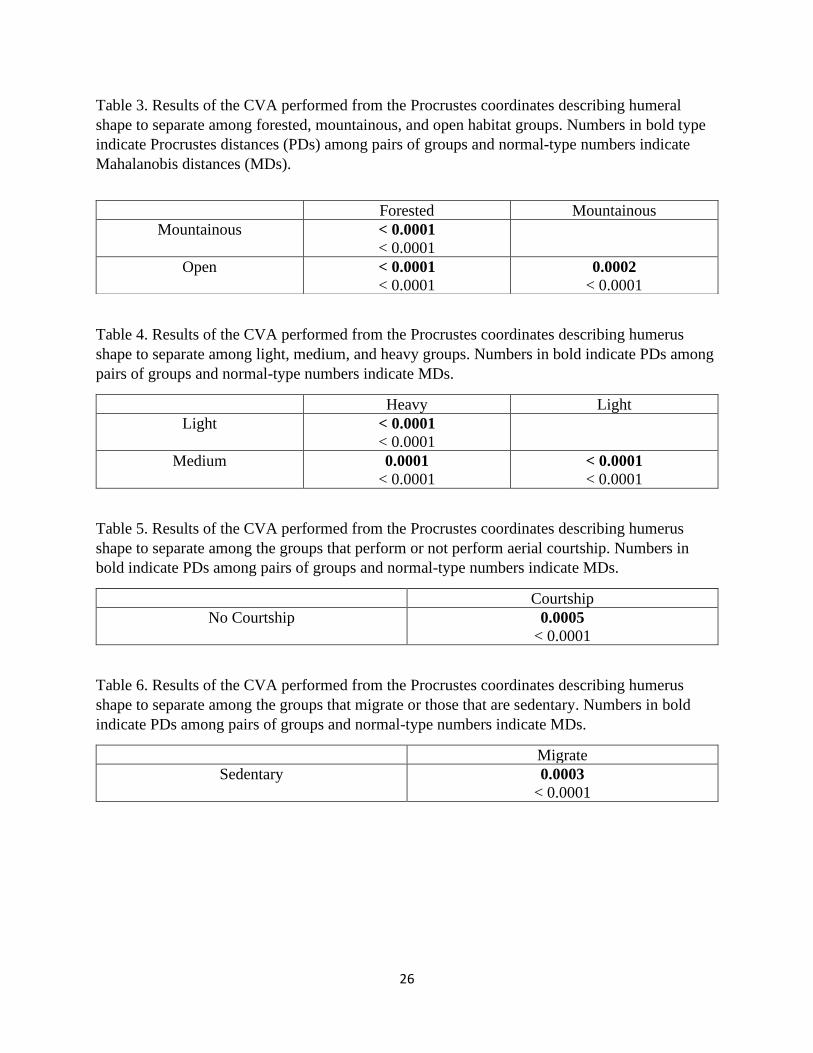
Table 3. Results of the CVA performed from the Procrustes coordinates describing humeral
shape to separate among forested, mountainous, and open habitat groups. Numbers in bold type
indicate Procrustes distances (PDs) among pairs of groups and normal-type numbers indicate
Mahalanobis distances (MDs).
Table 4. Results of the CVA performed from the Procrustes coordinates describing humerus
shape to separate among light, medium, and heavy groups. Numbers in bold indicate PDs among
pairs of groups and normal-type numbers indicate MDs.
Heavy Light
Light < 0.0001
< 0.0001
Medium 0.0001
< 0.0001
< 0.0001
< 0.0001
Table 5. Results of the CVA performed from the Procrustes coordinates describing humerus
shape to separate among the groups that perform or not perform aerial courtship. Numbers in
bold indicate PDs among pairs of groups and normal-type numbers indicate MDs.
Courtship
No Courtship 0.0005
< 0.0001
Table 6. Results of the CVA performed from the Procrustes coordinates describing humerus
shape to separate among the groups that migrate or those that are sedentary. Numbers in bold
indicate PDs among pairs of groups and normal-type numbers indicate MDs.
Migrate
Sedentary 0.0003
< 0.0001
Forested Mountainous
Mountainous < 0.0001
< 0.0001
Open < 0.0001
< 0.0001
0.0002
< 0.0001
27
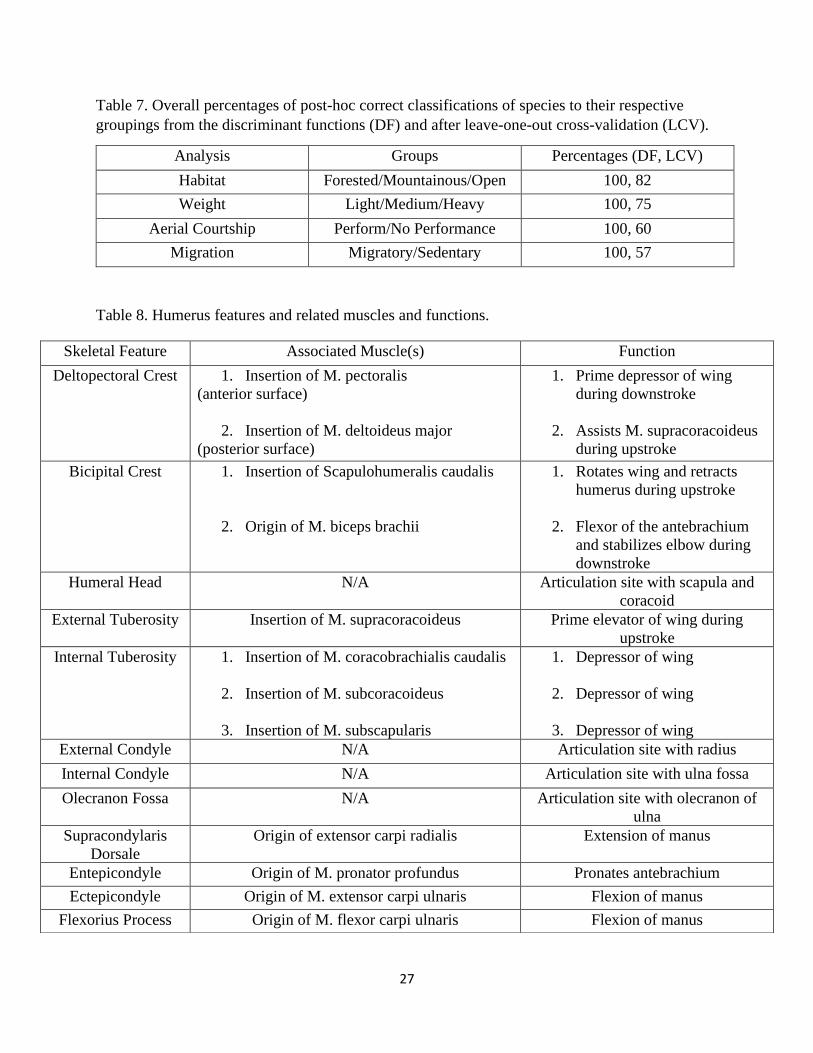
Table 7. Overall percentages of post-hoc correct classifications of species to their respective
groupings from the discriminant functions (DF) and after leave-one-out cross-validation (LCV).
Analysis Groups Percentages (DF, LCV)
Habitat Forested/Mountainous/Open 100, 82
Weight Light/Medium/Heavy 100, 75
Aerial Courtship Perform/No Performance 100, 60
Migration Migratory/Sedentary 100, 57
Table 8. Humerus features and related muscles and functions.
Skeletal Feature Associated Muscle(s) Function
Deltopectoral Crest 1. Insertion of M. pectoralis
(anterior surface)
2. Insertion of M. deltoideus major
(posterior surface)
1. Prime depressor of wing
during downstroke
2. Assists M. supracoracoideus
during upstroke
Bicipital Crest 1. Insertion of Scapulohumeralis caudalis
2. Origin of M. biceps brachii
1. Rotates wing and retracts
humerus during upstroke
2. Flexor of the antebrachium
and stabilizes elbow during
downstroke
Humeral Head N/A Articulation site with scapula and
coracoid
External Tuberosity Insertion of M. supracoracoideus Prime elevator of wing during
upstroke
Internal Tuberosity 1. Insertion of M. coracobrachialis caudalis
2. Insertion of M. subcoracoideus
3. Insertion of M. subscapularis
1. Depressor of wing
2. Depressor of wing
3. Depressor of wing
External Condyle N/A Articulation site with radius
Internal Condyle N/A Articulation site with ulna fossa
Olecranon Fossa N/A Articulation site with olecranon of
ulna
Supracondylaris
Dorsale
Origin of extensor carpi radialis Extension of manus
Entepicondyle Origin of M. pronator profundus Pronates antebrachium
Ectepicondyle Origin of M. extensor carpi ulnaris Flexion of manus
Flexorius Process Origin of M. flexor carpi ulnaris Flexion of manus
28
Figure 1. Canonical variates plots for humerus shape differences among vultures. Ordination of
the species coded by habitat (A), weight class (B), migration (C), and courtship (D) groupings.
A B
C D
29
Figure 2. Various views of the right humerus of
Vultur gryphus. A. Anterior; B. Dorsal; C.
Proximal; D. Distal.
A.
B.
C. D.
• Deltopectoral Crest
• Bicipital Crest
• Humeral Head
• External Tuberosity
• Internal Tuberosity
• External Condyle
• Internal Condyle
• Olecranon Fossa
30
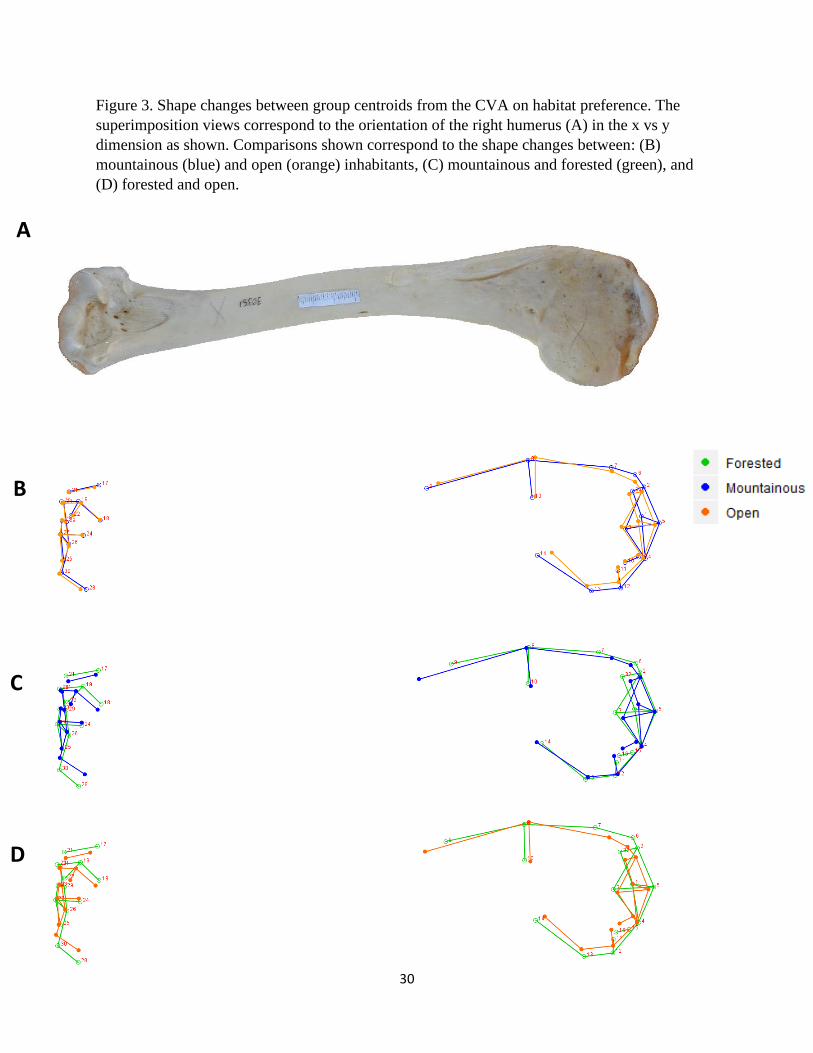
Figure 3. Shape changes between group centroids from the CVA on habitat preference. The
superimposition views correspond to the orientation of the right humerus (A) in the x vs y
dimension as shown. Comparisons shown correspond to the shape changes between: (B)
mountainous (blue) and open (orange) inhabitants, (C) mountainous and forested (green), and
(D) forested and open.
A
B
C
D
31
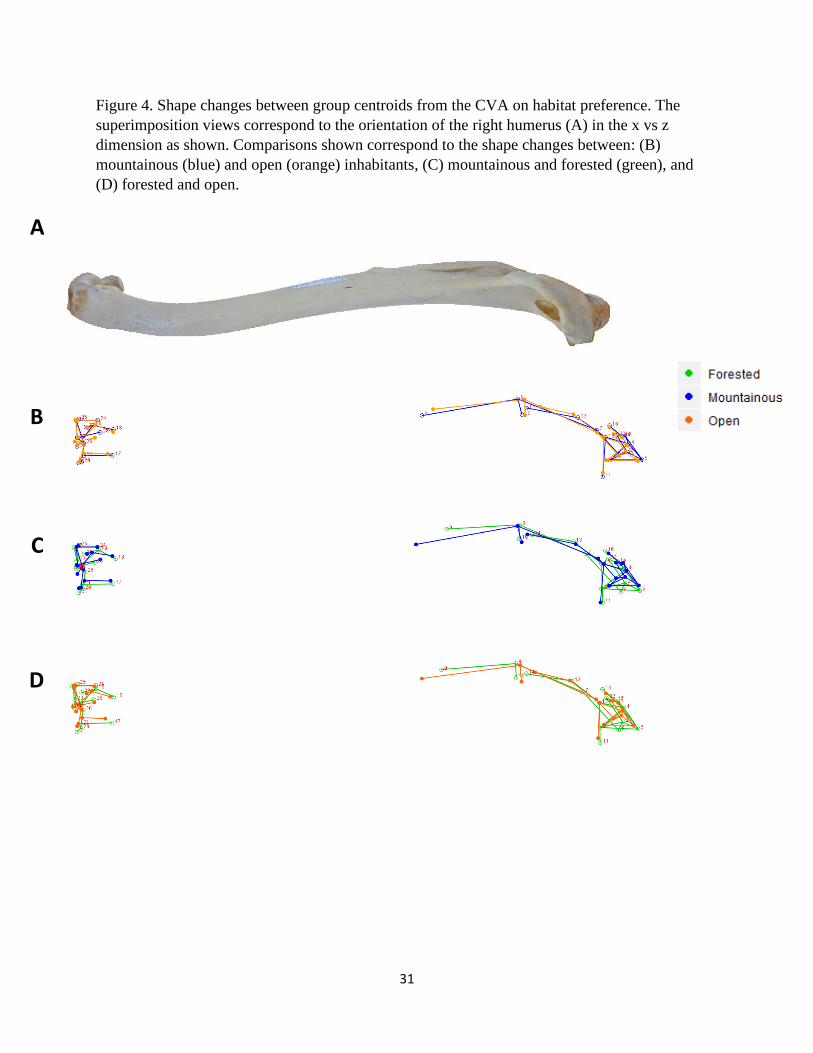
Figure 4. Shape changes between group centroids from the CVA on habitat preference. The
superimposition views correspond to the orientation of the right humerus (A) in the x vs z
dimension as shown. Comparisons shown correspond to the shape changes between: (B)
mountainous (blue) and open (orange) inhabitants, (C) mountainous and forested (green), and
(D) forested and open.
C
D
B
A
32
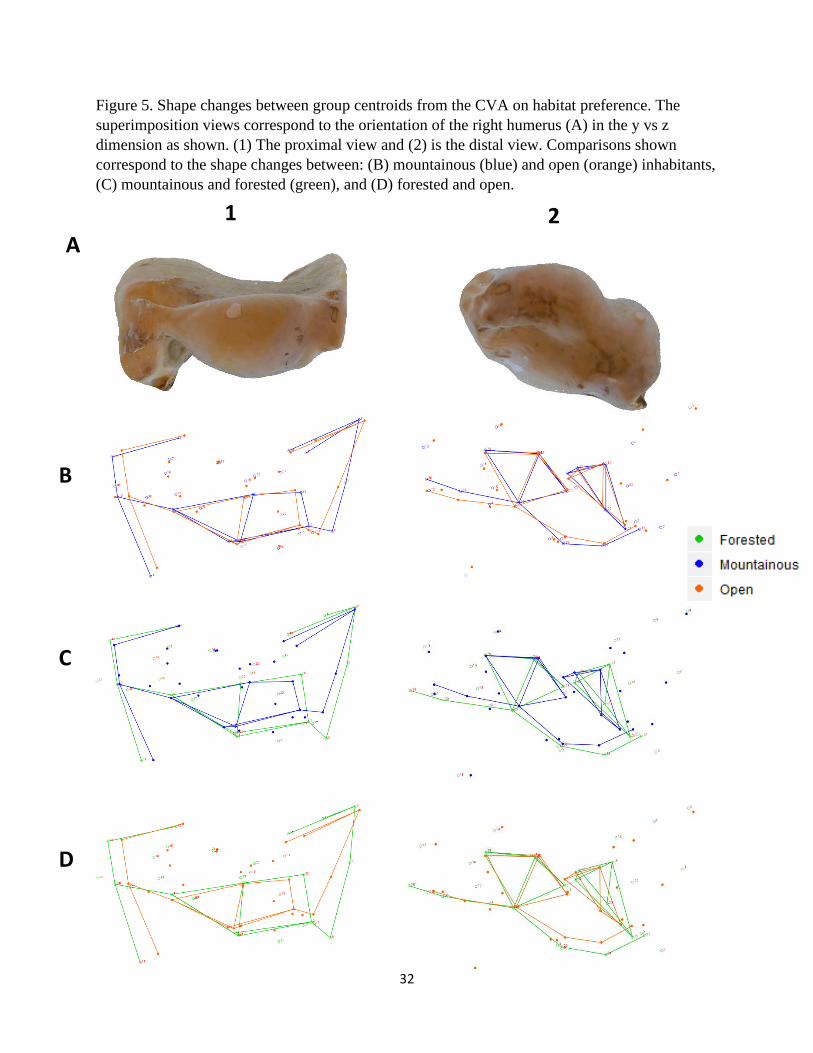
Figure 5. Shape changes between group centroids from the CVA on habitat preference. The
superimposition views correspond to the orientation of the right humerus (A) in the y vs z
dimension as shown. (1) The proximal view and (2) is the distal view. Comparisons shown
correspond to the shape changes between: (B) mountainous (blue) and open (orange) inhabitants,
(C) mountainous and forested (green), and (D) forested and open.
A
B
C
D
1 2
33
Figure 6. Shape changes between group centroids from the CVA on weight classes. The
superimposition views correspond to the orientation of the right humerus (A) in the x vs y
dimension as shown. Comparisons shown correspond to the shape changes between: (B) medium
(blue) and heavy (orange) classes, (C) medium and light(green), and (D) light and heavy.
A
B
C
D
34
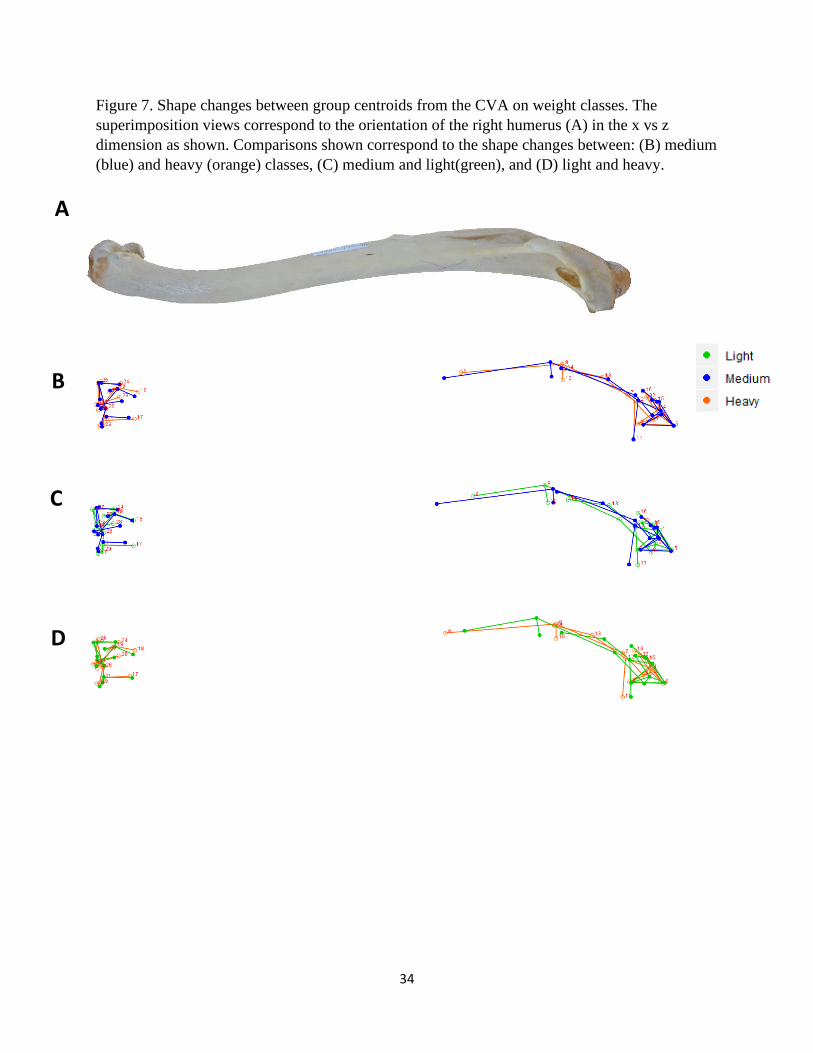
Figure 7. Shape changes between group centroids from the CVA on weight classes. The
superimposition views correspond to the orientation of the right humerus (A) in the x vs z
dimension as shown. Comparisons shown correspond to the shape changes between: (B) medium
(blue) and heavy (orange) classes, (C) medium and light(green), and (D) light and heavy.
A
B
C
D
35
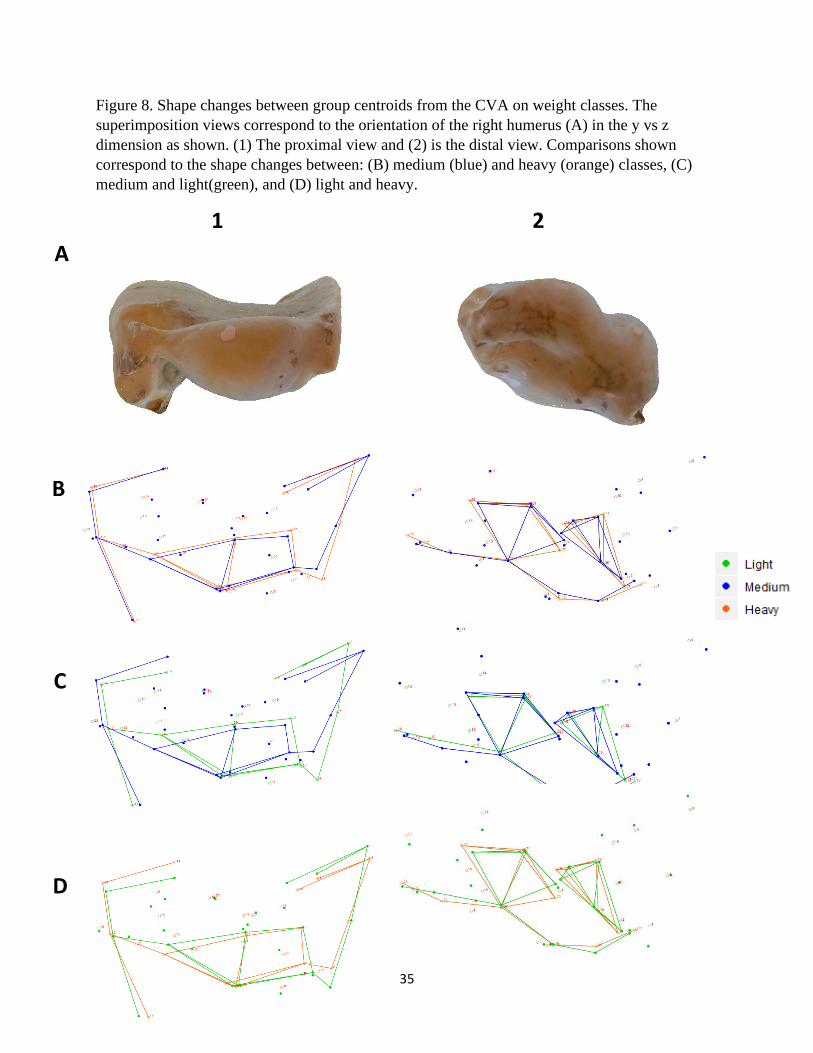
Figure 8. Shape changes between group centroids from the CVA on weight classes. The
superimposition views correspond to the orientation of the right humerus (A) in the y vs z
dimension as shown. (1) The proximal view and (2) is the distal view. Comparisons shown
correspond to the shape changes between: (B) medium (blue) and heavy (orange) classes, (C)
medium and light(green), and (D) light and heavy.
A
B
C
D
1 2
36
Figure 9. Shape changes between group centroids from the CVA on aerial courtship abilities.
The superimposition views correspond to the orientation of the right humerus (A) in the x vs y
dimension as shown. Comparisons shown correspond to the shape changes between (B) those
that perform aerial courtship (blue) and species that do not (orange).
Figure 10. Shape changes between group centroids from the CVA on aerial courtship abilities.
The superimposition views correspond to the orientation of the right humerus (A) in the x vs z
dimension as shown. Comparisons shown correspond to the shape changes between (B) those
that perform aerial courtship (blue) and species that do not (orange).
A
B
A
B
37
Figure 11. Shape changes between group centroids from the CVA on aerial courtship abilities.
The superimposition views correspond to the orientation of the right humerus (A) in the y vs z
dimension as shown. (1) The proximal view and (2) is the distal view. Comparisons shown
correspond to the shape changes between (B) those that perform aerial courtship (blue) and
species that do not (orange).
1 2
A
B

38
Figure 12. Shape changes between group centroids from the CVA on migration capabilities. The
superimposition views correspond to the orientation of the right humerus (A) in the x vs y
dimension as shown. Comparisons shown correspond to the shape changes between (B) those
that migrate (blue) and species that are sedentary (orange).
Figure 13. Shape changes between group centroids from the CVA on migration capabilities. The
superimposition views correspond to the orientation of the right humerus (A) in the x vs z
dimension as shown. Comparisons shown correspond to the shape changes between (B) those
that migrate (blue) and species that are sedentary(orange).
A
B
A
B
39
Figure 14. Shape changes between group centroids from the CVA on migration capabilities. The
superimposition views correspond to the orientation of the right humerus (A) in the y vs z
dimension as shown. (1) The proximal view and (2) is the distal view. Comparisons shown
correspond to the shape changes between (B) those that migrate (blue) and species that are
sedentary (orange).
1
A
2
B
40
Appendix B
Table 9. Results obtained from regression analyses of shape (canonical variates of independent
contrasts) on size (average body mass). Numbers indicate p-values and the percentages are the
variance explained by allometry (based on R2 values).
CV1 CV2
Habitat 0.03121 (18%) 0.2415 (2.2%)
Weight < 0.0001 (73%) 0.2066 (3.4%)
Courtship 0.4544 (0%) N/A
Migration 0.8816 (0%) N/A
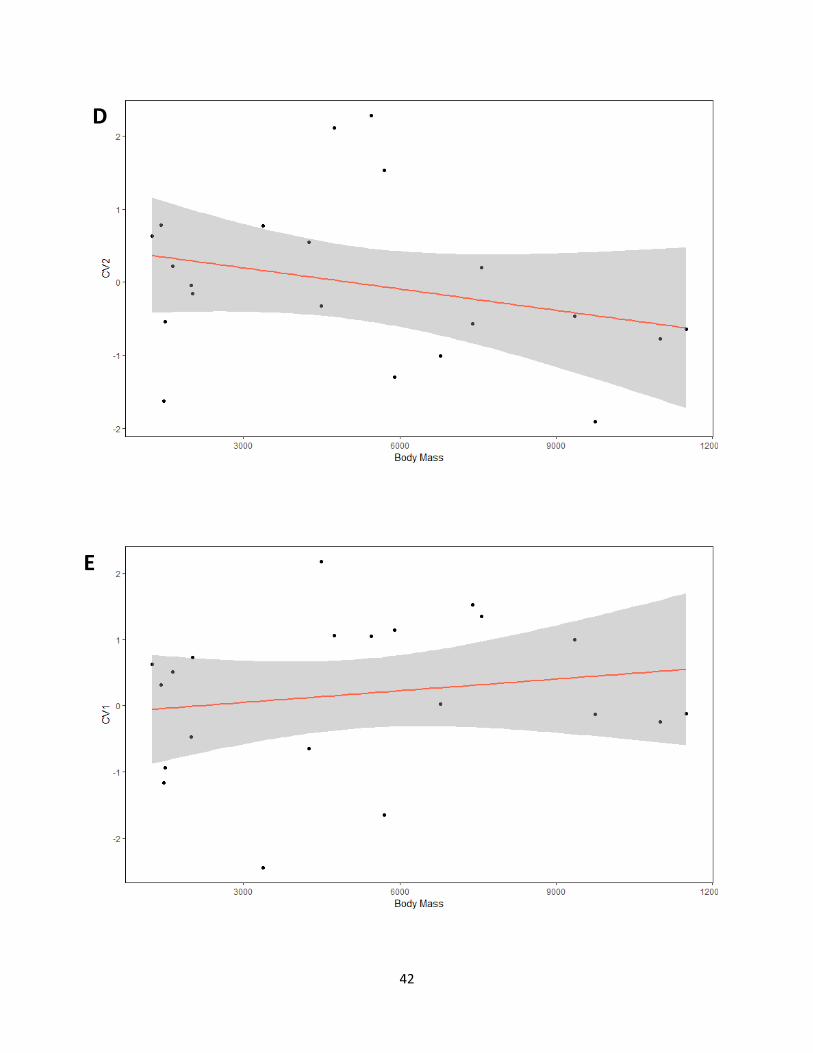
Figure 15. Graphs for regressions performed from canonical variates of independent contrasts
against average body mass for each category. (A) Habitat CV1, (B) Habitat CV2, (C) Weight
CV1, (D) CV2, (E) Courtship, (F) Migration.
A
41
B
C
42
D
E
43
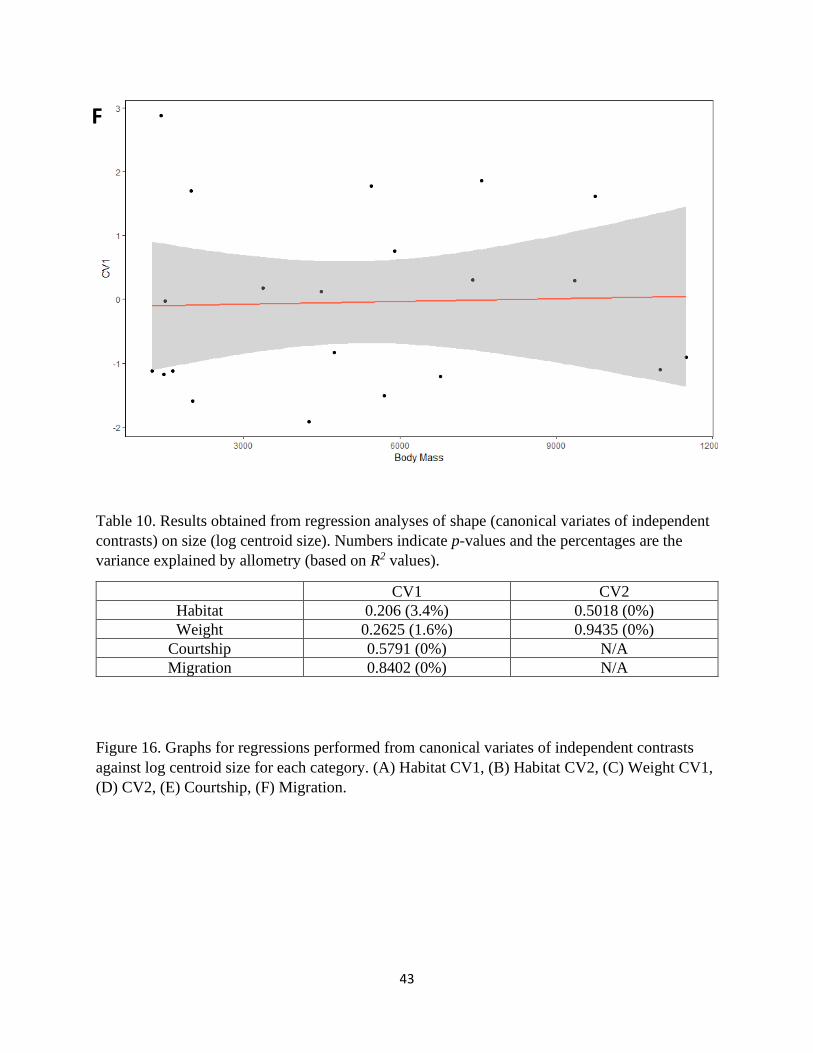
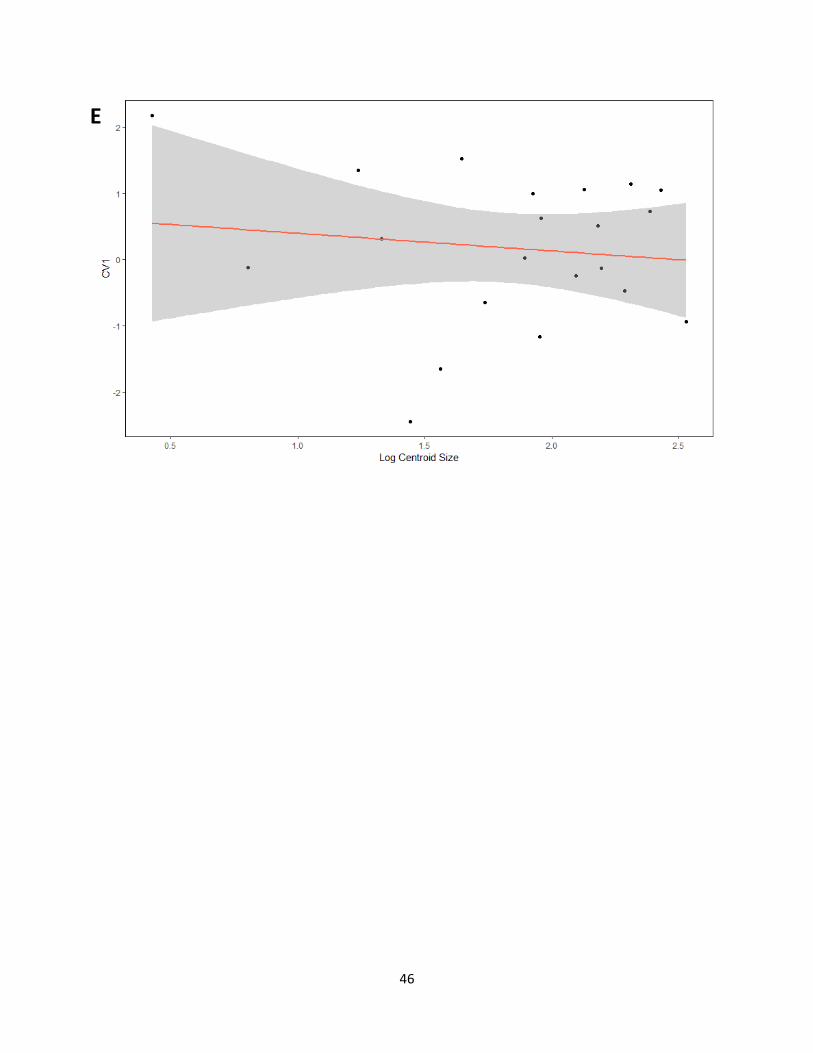
Table 10. Results obtained from regression analyses of shape (canonical variates of independent
contrasts) on size (log centroid size). Numbers indicate p-values and the percentages are the
variance explained by allometry (based on R2 values).
CV1 CV2
Habitat 0.206 (3.4%) 0.5018 (0%)
Weight 0.2625 (1.6%) 0.9435 (0%)
Courtship 0.5791 (0%) N/A
Migration 0.8402 (0%) N/A
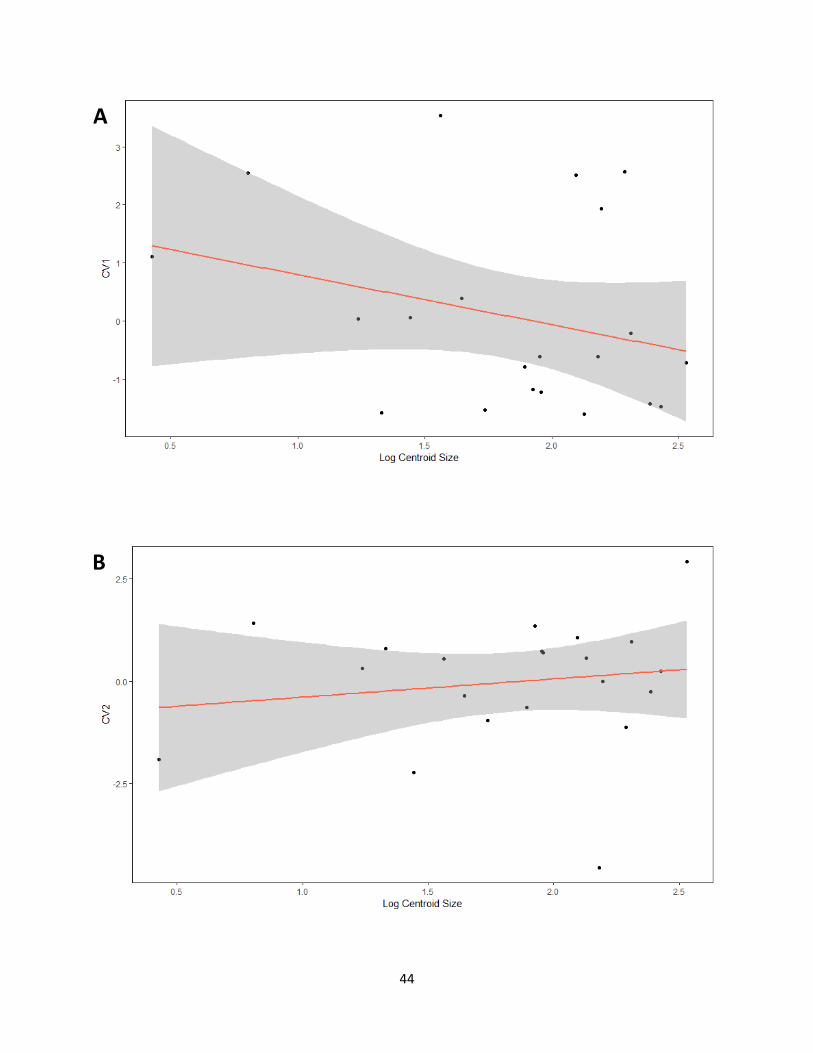
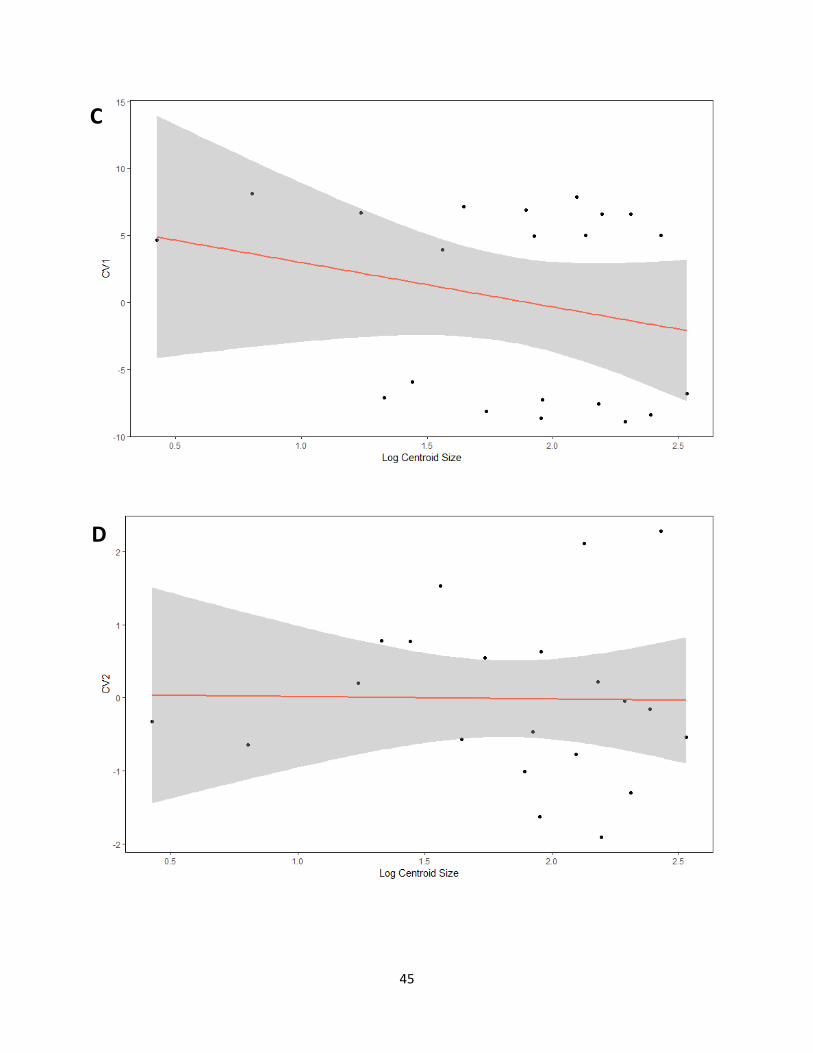
Figure 16. Graphs for regressions performed from canonical variates of independent contrasts
against log centroid size for each category. (A) Habitat CV1, (B) Habitat CV2, (C) Weight CV1,
(D) CV2, (E) Courtship, (F) Migration.
F
44
A
B
45
C
D
46
E