Embed Size (px)
Citation preview
California State University, Sacramento
Meeting California’s Higher Education Needs:Challenges and Prospects
Colleen Moore, Research SpecialistInstitute for Higher Education Leadership & Policy
Presentation to Campaign for College OpportunityAugust 8, 2005
California State University, Sacramento
Overview of Presentation
• California’s higher education system• CA higher education performance• Enrollment over next decade• How to pay for increasing enrollment
– Increasing revenues
– Reducing costs
• Conclusions/recommendations
California State University, Sacramento
California’s
Higher Education System
California State University, Sacramento
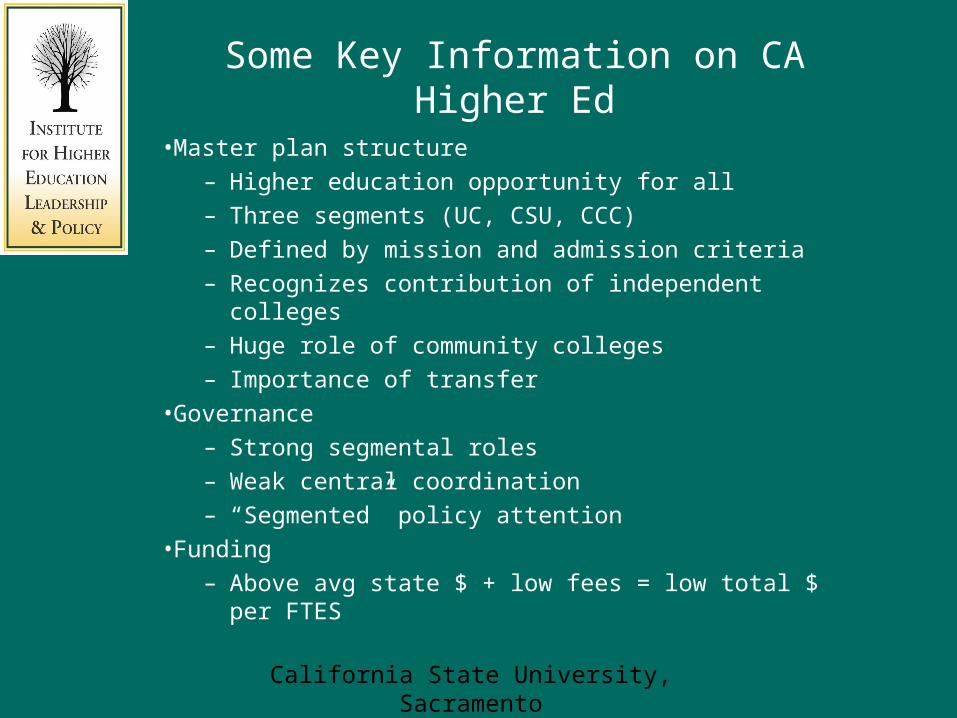
Some Key Information on CA Higher Ed
•Master plan structure
– Higher education opportunity for all
– Three segments (UC, CSU, CCC)
– Defined by mission and admission criteria
– Recognizes contribution of independent colleges
– Huge role of community colleges
– Importance of transfer
•Governance
– Strong segmental roles
– Weak central coordination
– “Segmented” policy attention
•Funding
– Above avg state $ + low fees = low total $ per FTES
California State University, Sacramento
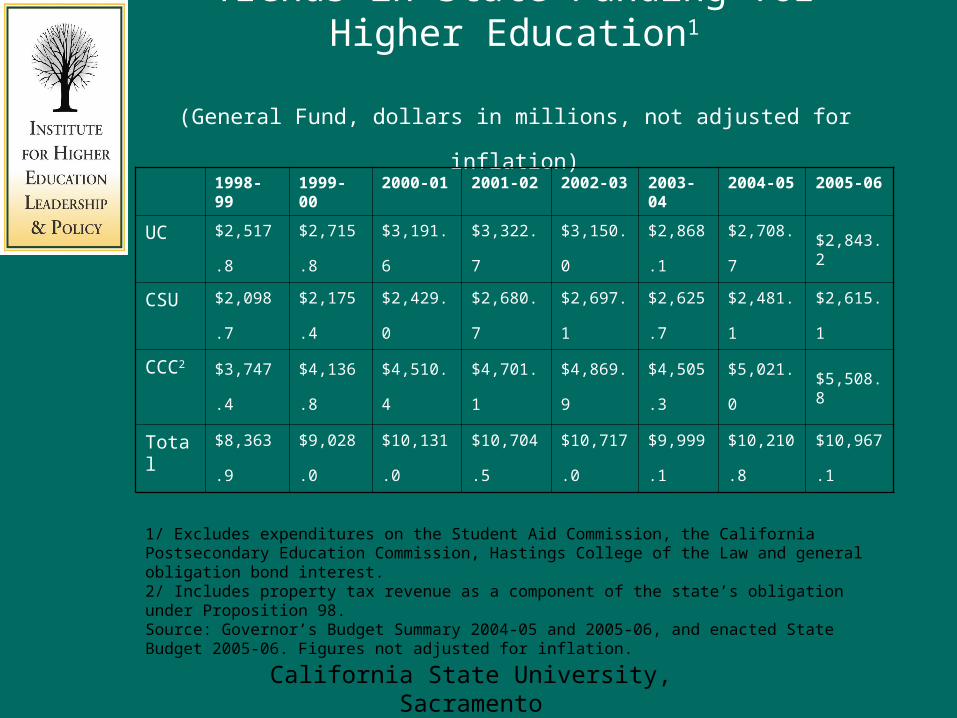
Trends in State Funding for Higher Education1
(General Fund, dollars in millions, not adjusted for inflation)
1998-99 1999-00 2000-01 2001-02 2002-03 2003-04 2004-05 2005-06
UC$2,517.8 $2,715.8 $3,191.6 $3,322.7 $3,150.0 $2,868.1 $2,708.7 $2,843.2
CSU$2,098.7 $2,175.4 $2,429.0 $2,680.7 $2,697.1 $2,625.7 $2,481.1 $2,615.1
CCC2
$3,747.4 $4,136.8 $4,510.4 $4,701.1 $4,869.9 $4,505.3 $5,021.0 $5,508.8
Total$8,363.9 $9,028.0 $10,131.0 $10,704.5 $10,717.0 $9,999.1 $10,210.8 $10,967.1
1/ Excludes expenditures on the Student Aid Commission, the California Postsecondary Education Commission, Hastings College of the Law and general obligation bond interest.2/ Includes property tax revenue as a component of the state’s obligation under Proposition 98.Source: Governor’s Budget Summary 2004-05 and 2005-06, and enacted State Budget 2005-06. Figures not adjusted for inflation.
California State University, Sacramento
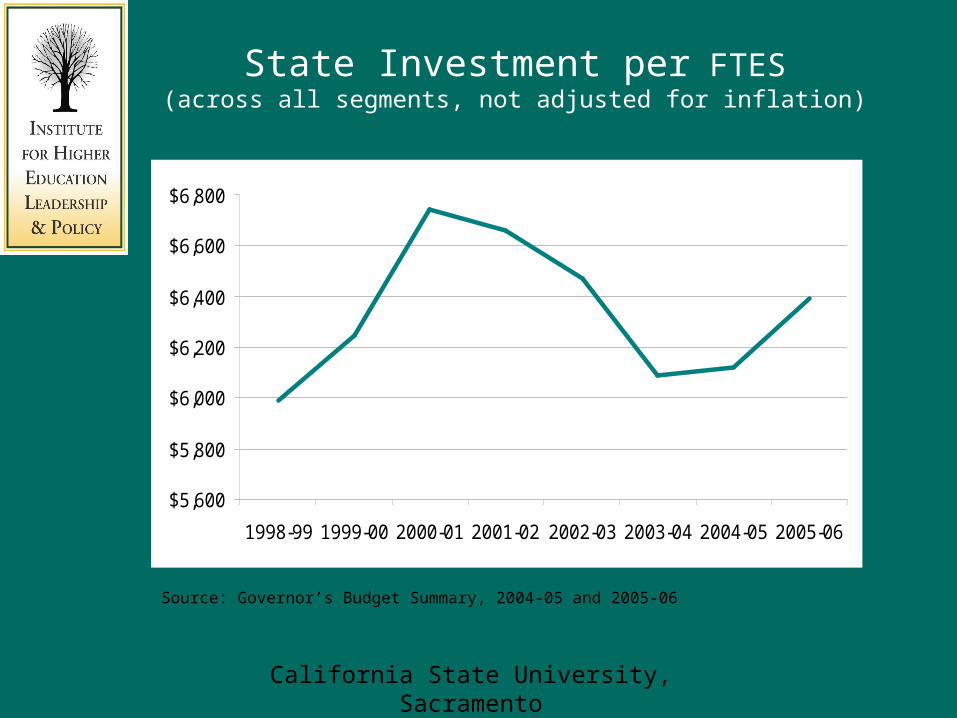
State Investment per FTES(across all segments, not adjusted for inflation)
$5,600
$5,800
$6,000
$6,200
$6,400
$6,600
$6,800
1998-99 1999-00 2000-01 2001-02 2002-03 2003-04 2004-05 2005-06
Source: Governor’s Budget Summary, 2004-05 and 2005-06
California State University, Sacramento
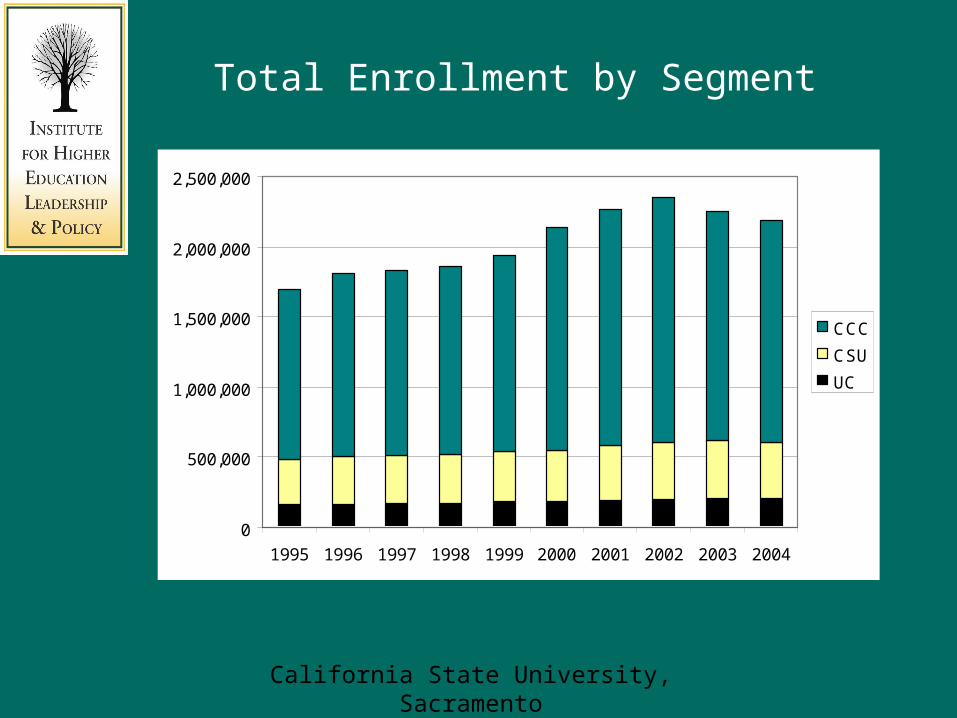
Total Enrollment by Segment
0
500,000
1,000,000
1,500,000
2,000,000
2,500,000
1995 1996 1997 1998 1999 2000 2001 2002 2003 2004
CCC
CSU
UC
California State University, Sacramento
California’s
Higher Education Performance
California State University, Sacramento
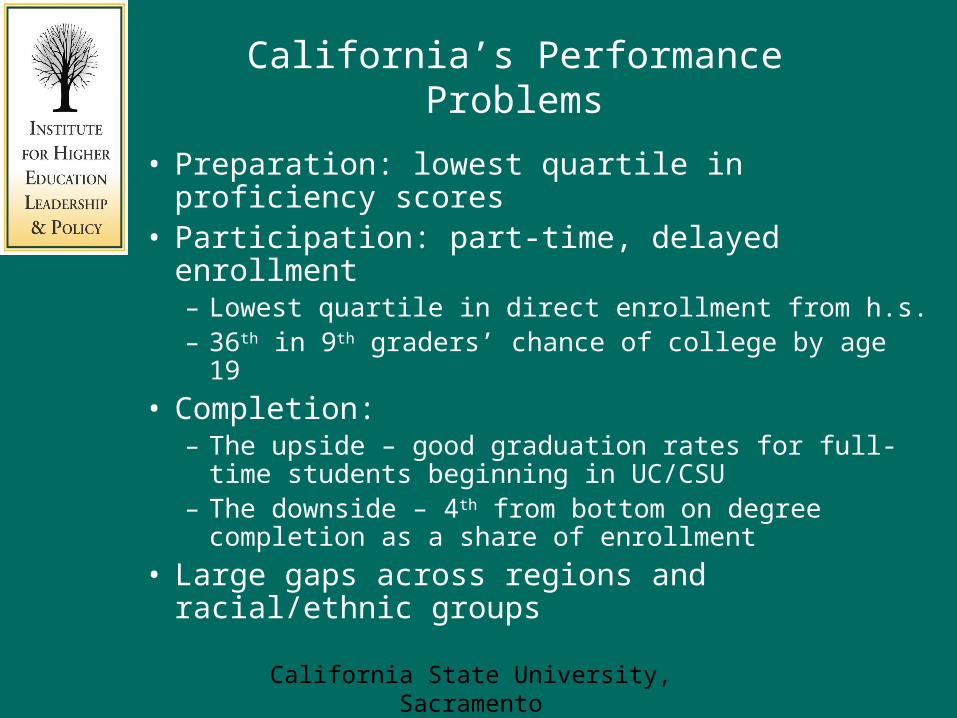
California’s Performance Problems
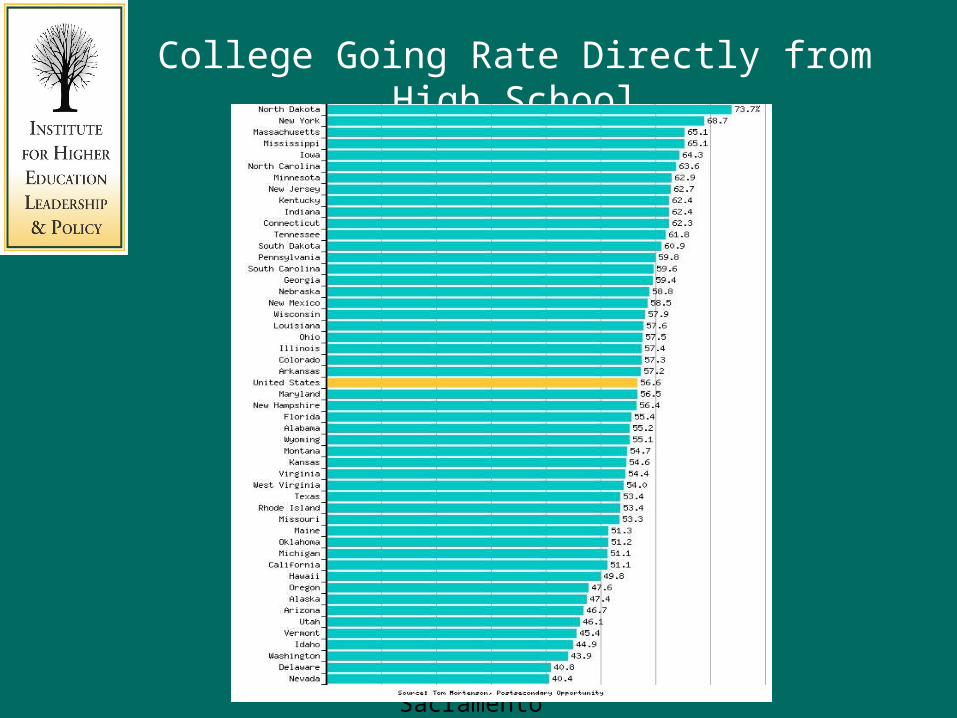
• Preparation: lowest quartile in proficiency scores• Participation: part-time, delayed enrollment
– Lowest quartile in direct enrollment from h.s.– 36th in 9th graders’ chance of college by age 19
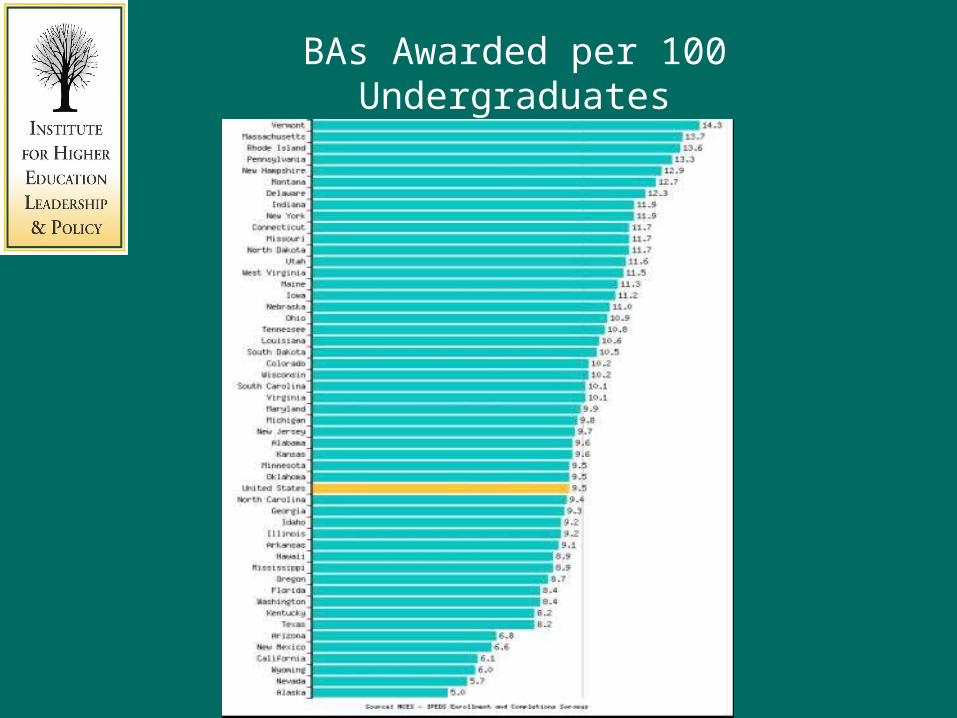
• Completion: – The upside – good graduation rates for full-time
students beginning in UC/CSU– The downside – 4th from bottom on degree completion
as a share of enrollment
• Large gaps across regions and racial/ethnic groups
California State University, Sacramento
College Going Rate Directly from High School
California State University, Sacramento
BAs Awarded per 100 Undergraduates

California State University, Sacramento
College Participation by Race/Ethnicity
Racial/Ethnic Group
Percent of 18-24 Year Olds in
College
Percent of Adults Ages 25+ in
College
Asian / Pacific Islander
60% 9.1%
White 43% 5.8%
Black 32% 8.8%
Latino 22% 5.4%
Source: US Census 2000, Summary File 4, Table PCT63
California State University, Sacramento
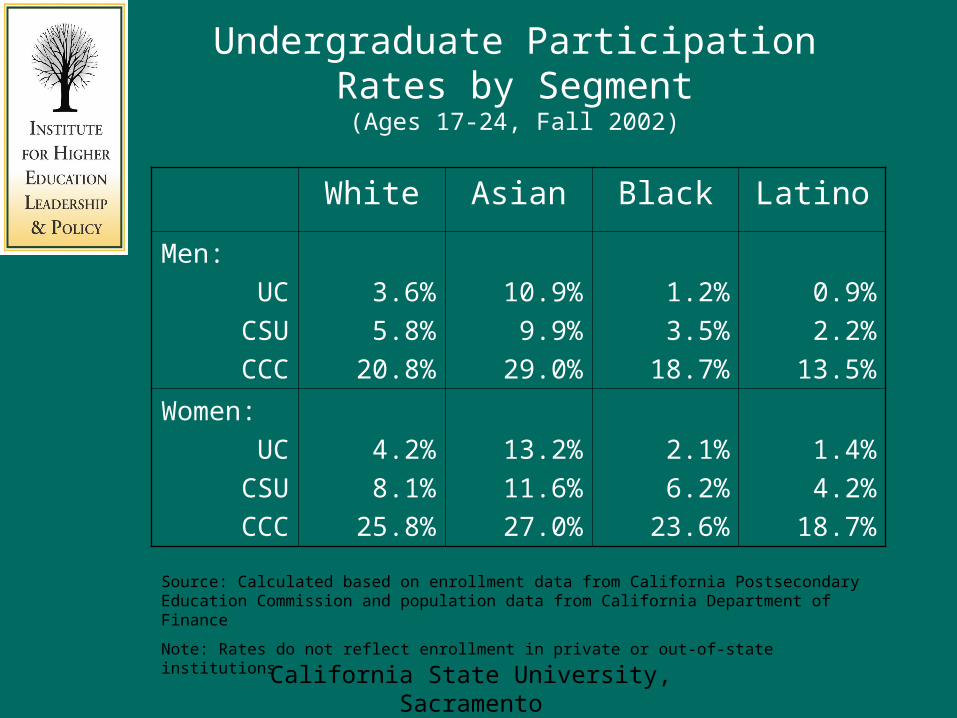
Undergraduate Participation Rates by Segment(Ages 17-24, Fall 2002)
White Asian Black Latino
Men:
UC
CSU
CCC
3.6%
5.8%
20.8%
10.9%
9.9%
29.0%
1.2%
3.5%
18.7%
0.9%
2.2%
13.5%
Women:
UC
CSU
CCC
4.2%
8.1%
25.8%
13.2%
11.6%
27.0%
2.1%
6.2%
23.6%
1.4%
4.2%
18.7%
Source: Calculated based on enrollment data from California Postsecondary Education Commission and population data from California Department of Finance
Note: Rates do not reflect enrollment in private or out-of-state institutions
California State University, Sacramento
Higher Education Enrollment
over the Next Decade
California State University, Sacramento
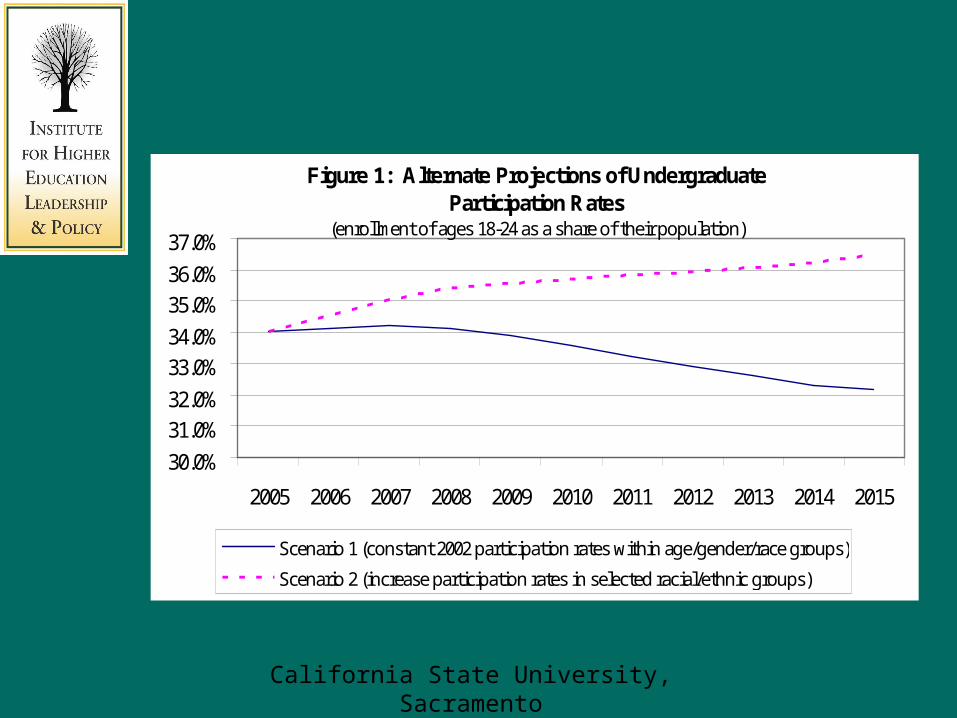
Figure 1: Alternate Projections of Undergraduate Participation Rates
(enrollment of ages 18-24 as a share of their population)
30.0%
31.0%
32.0%
33.0%
34.0%
35.0%
36.0%
37.0%
2005 2006 2007 2008 2009 2010 2011 2012 2013 2014 2015
Scenario 1 (constant 2002 participation rates within age/gender/race groups)
Scenario 2 (increase participation rates in selected racial/ethnic groups)
California State University, Sacramento
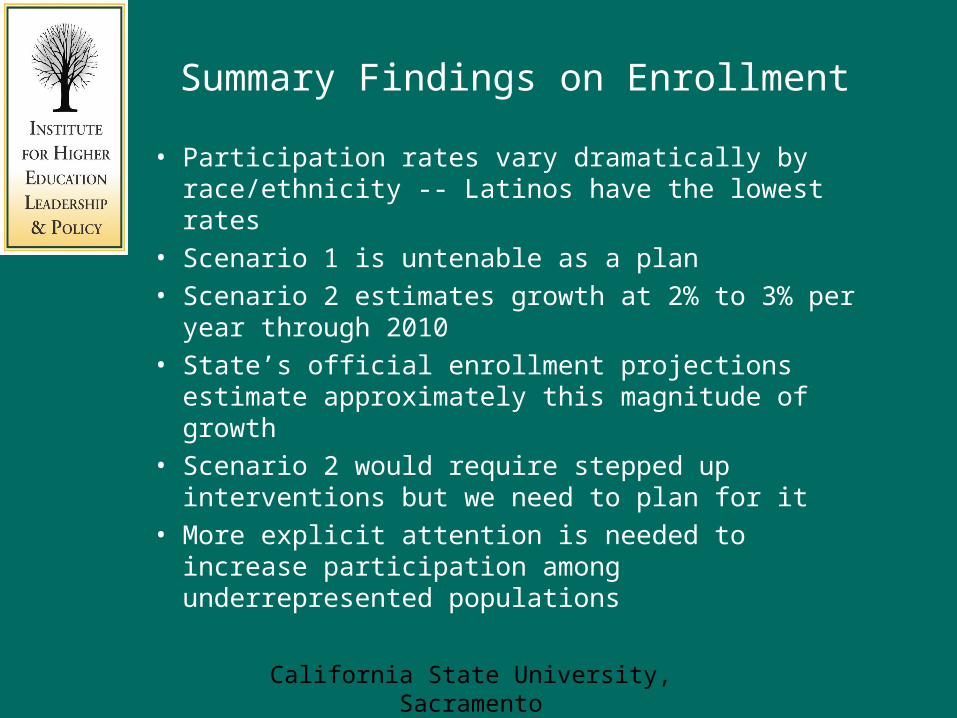
Summary Findings on Enrollment
• Participation rates vary dramatically by race/ethnicity -- Latinos have the lowest rates
• Scenario 1 is untenable as a plan
• Scenario 2 estimates growth at 2% to 3% per year through 2010
• State’s official enrollment projections estimate approximately this magnitude of growth
• Scenario 2 would require stepped up interventions but we need to plan for it
• More explicit attention is needed to increase participation among underrepresented populations
California State University, Sacramento
How to Pay for
Increasing Enrollment
California State University, Sacramento
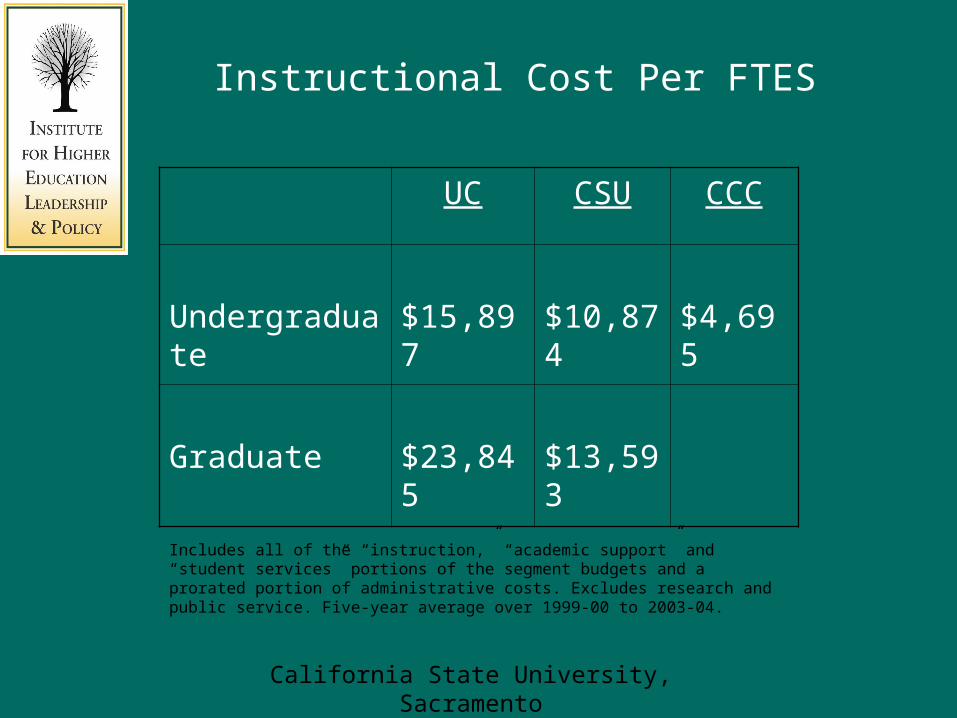
Instructional Cost Per FTES
UC CSU CCC
Undergraduate $15,897 $10,874 $4,695
Graduate $23,845 $13,593
Includes all of the “instruction,” “academic support” and “student services” portions of the segment budgets and a prorated portion of administrative costs. Excludes research and public service. Five-year average over 1999-00 to 2003-04.
California State University, Sacramento
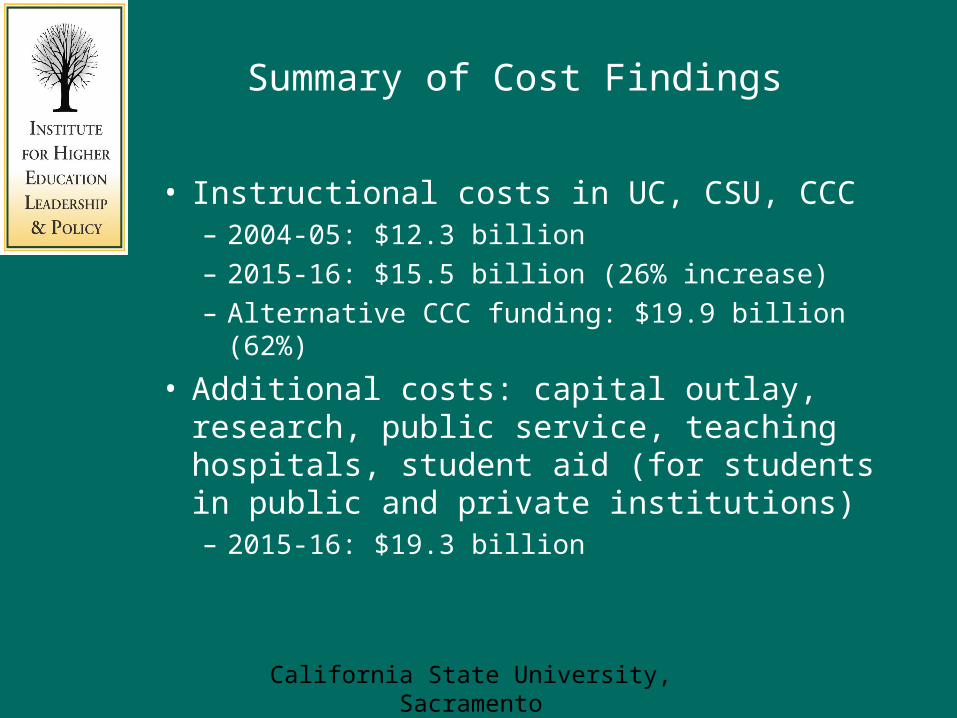
Summary of Cost Findings
• Instructional costs in UC, CSU, CCC– 2004-05: $12.3 billion
– 2015-16: $15.5 billion (26% increase)
– Alternative CCC funding: $19.9 billion (62%)
• Additional costs: capital outlay, research, public service, teaching hospitals, student aid (for students in public and private institutions)– 2015-16: $19.3 billion
California State University, Sacramento
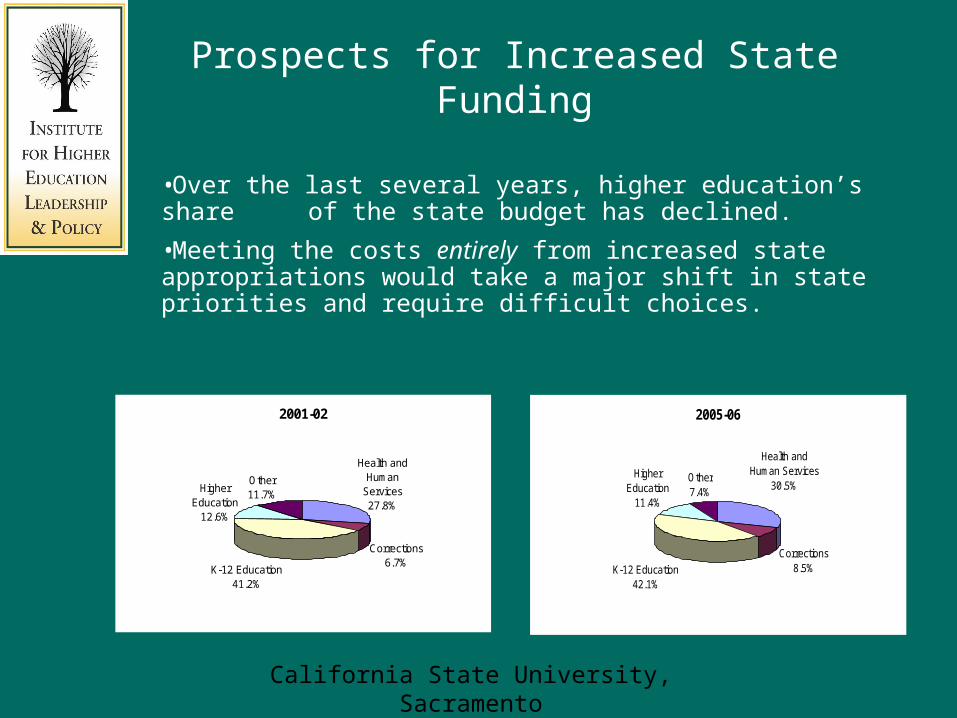
Prospects for Increased State Funding
•Over the last several years, higher education’s share of the state budget has declined.
•Meeting the costs entirely from increased state appropriations would take a major shift in state priorities and require difficult choices.
2001-02
Health and Human
Services27.8%
Corrections6.7%
K-12 Education41.2%
Higher Education
12.6%
Other11.7%
2005-06
K-12 Education42.1%
Higher Education
11.4%
Health and Human Services
30.5%Other7.4%
Corrections8.5%
California State University, Sacramento
Efficiency
• A loaded word – importance of language – Not about cutting budgets; working harder
– Is about best return on any level of investment
• Institutional efficiencies• Systemic efficiencies
– Less controversial
– More opportunity
– Dependent on policy change
California State University, Sacramento
Systemic Efficiency
• Efficient movement of students within and across segments; more return on investment
• Two types of cost impact– Reduce higher ed costs
• By reducing units-to-degree (FTE)
– Increase higher ed costs (but save State General Fund)
• By increasing graduation/completion rates
California State University, Sacramento
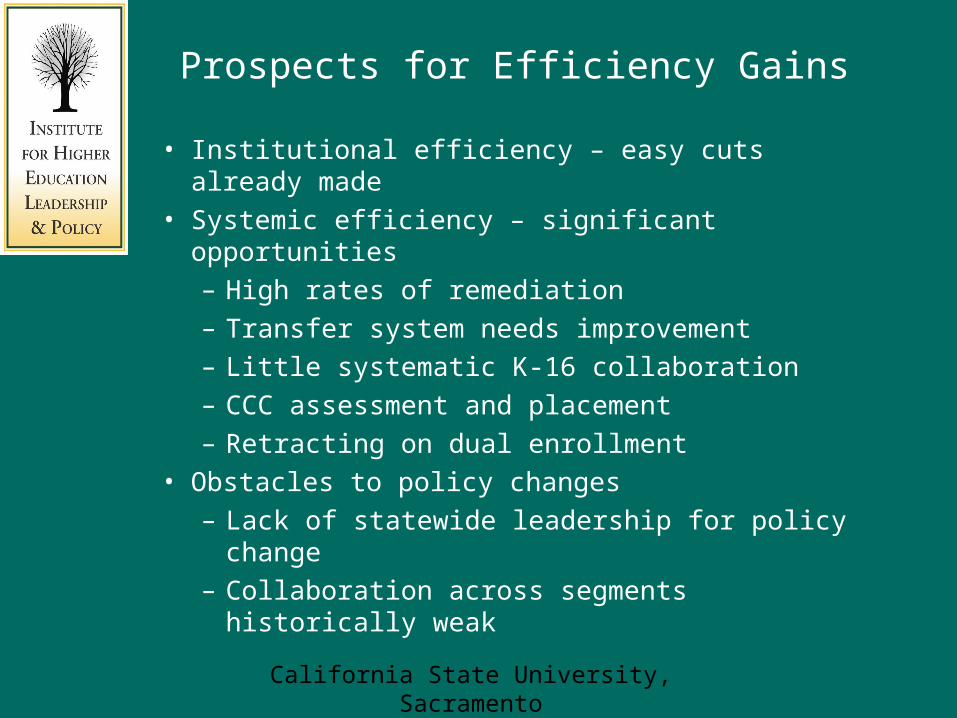
Prospects for Efficiency Gains
• Institutional efficiency – easy cuts already made
• Systemic efficiency – significant opportunities
– High rates of remediation
– Transfer system needs improvement
– Little systematic K-16 collaboration
– CCC assessment and placement
– Retracting on dual enrollment
• Obstacles to policy changes
– Lack of statewide leadership for policy change
– Collaboration across segments historically weak
California State University, Sacramento
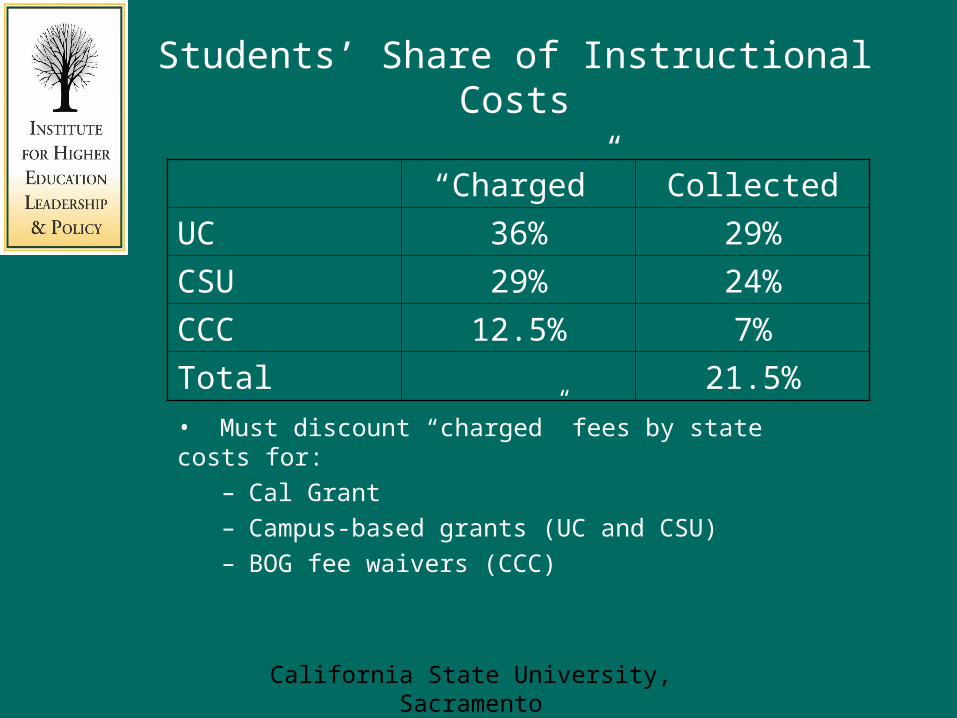
Students’ Share of Instructional Costs
• Must discount “charged” fees by state costs for:
– Cal Grant
– Campus-based grants (UC and CSU)
– BOG fee waivers (CCC)
“Charged” Collected
UC 36% 29%
CSU 29% 24%
CCC 12.5% 7%
Total 21.5%
California State University, Sacramento
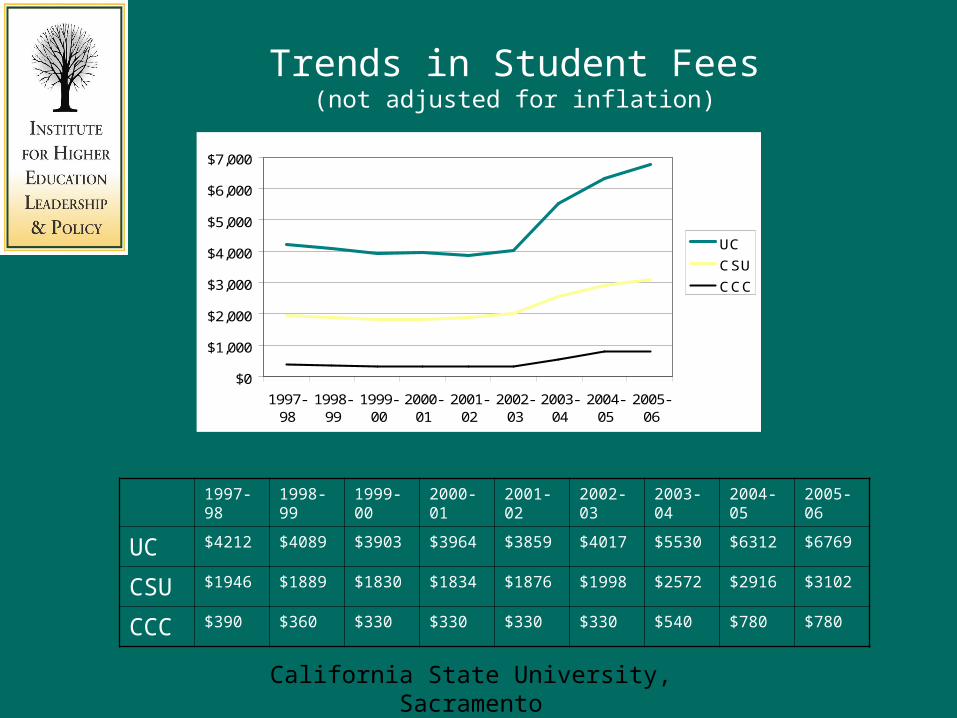
Trends in Student Fees(not adjusted for inflation)
$0
$1,000
$2,000
$3,000
$4,000
$5,000
$6,000
$7,000
1997-98
1998-99
1999-00
2000-01
2001-02
2002-03
2003-04
2004-05
2005-06
UC
CSU
CCC
1997-98 1998-99 1999-00 2000-01 2001-02 2002-03 2003-04 2004-05 2005-06
UC $4212 $4089 $3903 $3964 $3859 $4017 $5530 $6312 $6769
CSU $1946 $1889 $1830 $1834 $1876 $1998 $2572 $2916 $3102
CCC $390 $360 $330 $330 $330 $330 $540 $780 $780
California State University, Sacramento
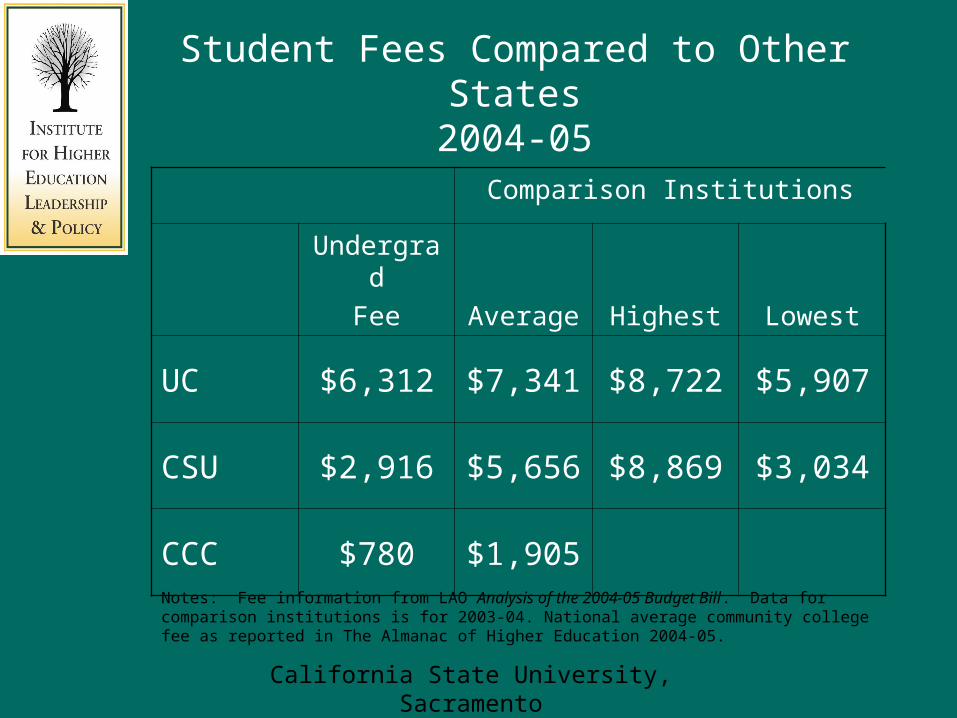
Student Fees Compared to Other States2004-05
Comparison Institutions
Undergrad
Fee Average Highest Lowest
UC $6,312 $7,341 $8,722 $5,907
CSU $2,916 $5,656 $8,869 $3,034
CCC $780 $1,905
Notes: Fee information from LAO Analysis of the 2004-05 Budget Bill. Data for comparison institutions is for 2003-04. National average community college fee as reported in The Almanac of Higher Education 2004-05.
California State University, Sacramento
Student Fee Revenue as Part of the Solution
• A paradigm shift for California values
• Legislature beginning to consider fee policy models
• Must be considered in context of financial aid (public and private institutions)
California State University, Sacramento
Conclusions
and Recommendations
California State University, Sacramento
Summary of Major Findings
• State needs to plan for:– substantial enrollment growth– substantial increase in revenues
• Costs can be reduced by efficiencies – systemic efficiencies are most hopeful
• Fee policy is needed – can help with access as well as affordability
• Shared solutions appear well within reach
California State University, Sacramento
Recommendations
• Need for leadership to support statewide planning and policy change
• State needs– Strategic plan: state goals, policies to
achieve– Finance plan: costs to achieve goals, how to
meet costs through state investment, fees, efficiencies
– Accountability plan that focuses on statewide outcomes consistent with the strategic plan
California State University, Sacramento
Governor’s Compact
• A reasonable starting point:
– enrollment growth funding to ensure access
– adjustments to cover cost increases
– some mention of efficiency
– some stability in fee levels
BUT:
• Community colleges not covered
• Financial aid to private institutions not covered
• Does not propose an actual fee policy
• No plan for efficiency gains