Embed Size (px)
Citation preview

Matt Rodriquez Secretary for
Environmental Protection
Jerry Brown Governor
California Regional Water Quality Control Board North Coast Region
Geoffrey M. Hales, Chairman
www.waterboards.ca.gov/northcoast 5550 Skylane Boulevard, Suite A, Santa Rosa, California 95403
Phone: (877) 721-9203 (toll free) • Office: (707) 576-2220 • FAX: (707) 523-0135
California Environmental Protection Agency
Recycled Paper
MEMORANDUM Date: March 14, 2012 To: File: Laguna de Santa Rosa; TMDL Development and Planning From: Steve Butkus Subject: Dissolved Oxygen Model Application for Pre-Settlement Laguna Watershed Conditions
The development of the Laguna de Santa Rosa (Laguna) Total Maximum Daily Load (TMDL) for impairment of beneficial uses due to low dissolved oxygen and high nutrients requires a ―linkage analysis‖ (CSWRCB 2005). A linkage analysis describes the method used to establish the relationship between pollutant loading and instream water quality response. The basic goal is to describe the process for establishing a linkage between nutrient loads and the instream dissolved oxygen (DO) conditions. Linkage analyses can vary widely across TMDLs. The spatial representation of the Laguna watershed showing pre-settlement hydrology and land cover was developed by Regional Water Board staff to help estimate historical pollutant loading, historical lake responses, and to help assess natural background sources. Historical ecological analysis can provide a better understanding of former conditions to support habitat restoration and water quality management goals and objectives. The analysis of natural conditions provides context for setting TMDL allocations for desirable and feasible future conditions. This memorandum serves to provide information on lake responses to pollutant loading prior to significant European settlement of the Laguna watershed. 1. MODEL SELECTION
Two QUAL2Kw water quality models were developed and evaluated for use in the TMDL linkage analysis (Butkus 2011a) to represent the lentic and lotic surface water types found in the Laguna watershed. The models were based on the River and Stream Water Quality Model (QUAL2K) receiving waters quality response model that is supported by the U.S. Environmental Protection Agency (Chapra et al. 2006). The QUAL2K model was written as open source code for model improvements. One such model upgrade is the QUALKw model version (Pelletier et al. 2006; Pelletier and Chapra 2008). The QUAL2Kw framework was used for the model due to improvements over the QUAL2K model that included the simulation of attached bottom algae.

Memo to File -2- March 14, 2012
California Environmental Protection Agency
Recycled Paper
Lower Santa Rosa Creek downstream of the Piner Creek confluence to the confluence with the mainstem Laguna de Santa Rosa was selected to represent lotic reaches in the lower Laguna watershed. The mainstem Laguna de Santa Rosa at Lake Jonive (Cummings 2004), the open water area south of Occidental Road near Sebastopol, was selected to represent lentic areas of the Laguna. The models were used to simulate various load reductions to advise the TMDL allocation process and implementation decisions. Additional information on the model selection, development, and evaluations can be found in Butkus (2011a). The land cover and hydrology that existed in the Laguna watershed prior to significant European settlement was investigated to help assess natural background sources (Butkus 2011b). Pre-settlement in the Laguna watershed was defined as the period of time prior to the General Land Office surveys conducted during the mid 19th century. The mainstem Laguna prior to European settlement contained large areas of open water even in the summer. Three lakes have been identified from early records: Ballard Lake, Sebring Lake, and Cunningham Lake (Cummings 2004). The two calibrated QUALKw models were adapted to simulate water quality responses to current and estimated historical nutrient loading. The lentic model was modified to represent these three pre-settlement lentic areas. Santa Rosa Creek prior to European settlement was a meandering stream with moderate sinuosity that is now channelized into a straight reach. The lower Santa Rosa Creek model was modified to represent pre-settlement lotic streams. Seven modeling scenarios were simulated for critical low flow conditions (Table 1). 2. MODEL CONSTRUCTION 2.1. Stream Flow The developed water quality models were applied to simulations representing low flow critical conditions. A range of flows were simulated to represent various impacts of critical low flow. Two statistically significant regression models were developed using daily mean flows from the downstream Russian River to allow the calculation of low flow statistics for the gages on the modeled Laguna reaches (Butkus, 2011a). Table 2 presents critical low flow statistics for the two Laguna stream flow gages used for the model simulations. 2.2. Stream Flow Rating Curves The model requires a depth-flow rating curve for each modeled reach. Depth-flow rating curves were derived from estimates of lake and stream channel bathymetry. Channel cross-sections were selected from Deas (2007) to represent the upper, middle and lower reaches of the current and pre-settlement lake bathymetries. The elevation profile was measured perpendicular to the selected channel cross-section for floodplain areas were derived from using 10-meter resolution elevation spatial data (NED 2006).

Memo to File -3- March 14, 2012
California Environmental Protection Agency
Recycled Paper
The floodplain elevation profiles were combined with the stream channel cross sections to provide a complete elevation at these locations. Channel cross-sections from Deas (2007) were used for developing the depth-flow rating curve for the current Santa Rosa Creek model. Pre-settlement Santa Rosa Creek channel was assumed to have unimpaired morphology. The Rosgen Stream Classification Method is widely used to describe impaired and healthy streams (Rosgen and Silvey 1996). Unimpaired Santa Rosa Creek was assumed to be a ―E3‖ stream type. The E3 stream types have moderate sinuosity, with gentle to moderately steep channel gradients, and very low width to depth ratios. This stream type is common in broad alluvial valleys with well-developed floodplains. The cross-section for the E3 stream type presented in Rosgen and Silvey (1996) was used to develop the depth-flow rating curve for the pre-settlement Santa Rosa Creek model. Estimates were made of the sediment volume and depths deposited in each pre-settlement lake since 1830 (Butkus 2011d). The estimated depth deposited in Lake Sebring (1.6 feet) was relatively the same as was measured by PWA (2004) from a sediment core (1.5 feet). Hypsometric curves were developed for each pre-settlement lake cross section. The hypsometric curves represent cross section geometry by comparing elevation with the corresponding wetted area of the cross section. Flow rating tables were developed from the hypsometric curves for each pre-settlement cross section using the Manning’s formula (Linsley et al. 1982). Channel slopes were measured from the USGS 10-meter digital elevation spatial data (NED 2006) along the stream thalweg defined by the 1:24K-scale National Hydrography Dataset (NHDPlus, 2007). Thalweg length was measured from the National Hydrography Dataset (Simley and Carswell 2009). A roughness coefficient of 0.080 was applied to represent sluggish reaches, with a weedy margin (Chow 1959). The flow rating curves for each pre-settlement cross section were fitted to a power equations (i.e., depth = αQß) using nonlinear regression for representation in the model framework (Butkus 2011d). The model also requires velocity-flow rating curves. Velocity-flow rating curves were derived from cross-sectional measurements and the depth-flow rating table. The estimated velocities and flows were fitted using nonlinear regression to a power function (i.e., velocity = αQß) for representation in the model. The rating curve equations were linearly weighted by reach length for the final rating curve of each pre-settlement lake (Table 3). 2.3. Initial and Upstream Concentrations The model requires specifying initial and upstream concentrations for each variable in each segment. Initial and upstream concentrations for model simulations of current conditions were derived from recent measurements. Concentrations of nutrient loads for model simulations of current conditions were based on Regional Water Board staff sampling of pollutant concentrations from different land covers (NCRWQCB 2010). Samples were collected during both wet and dry periods, but only the median dry period concentration data were used for model simulations of critical summer periods (Butkus 2011c).
Memo to File -4- March 14, 2012
California Environmental Protection Agency
Recycled Paper
The median pollutant concentrations were area-weighted for each lake catchment based on the Pre-settlement spatial data model (Butkus 2011b). The median concentrations measured for Forest and Rangeland land covers and were applied to the estimated Pre-settlement land cover areas. The pre-settlement oak savanna land cover was not sampled by Regional Water Board staff. Instead, nutrient loading rates measured in a nearby watershed with similar characteristics were used to develop the oak savanna land cover concentrations (Dahlgren et al. 2001). Concentrations of variables for each land cover category were area-weighted based on the distribution of the land cover areas within each lake and stream model catchment. Tables 5 – 9 present the areas-weighted concentrations used for the initial and upstream variable concentrations of each model. Diel data of dissolved oxygen, water temperature, and pH collected in 2011 were used as initial and upstream conditions (NCRWQCB 2011). The median hourly diel data collected over 6 days in the headwaters of Copeland Creek was used for the initial and upstream conditions for the models in the mainstem Laguna at Cunningham, Jonive, and Sebring Lakes. The daily mean value of data collected median hourly diel data collected over 12 days in the headwaters of Santa Rosa Creek was used for the initial and upstream conditions for the mainstem Laguna at Ballard Lake and Santa Rosa Creek models. Other required input concentrations variables were estimated by the methods described in Butkus (2011a). Citations to the derivation method for each constituent are presented in Table 4. 2.4. Meteorological Data The model uses meteorological data that affect specific mechanistic processes. Wind speed affects oxygen reaeration rates, and temperature conduction and convection. Wind speed was assumed to be zero to model the minimum oxygen reaeration rate with the atmosphere. This assumption models a worst-case condition that serves as an inherent margin of safety for the TMDL. Cloud cover affects photosynthesis rates. Cloud cover was assumed to be zero to model the maximum photosynthetic rate. This assumption also models a worst-case condition that also serves as an inherent margin of safety for the TMDL. Air and dewpoint temperatures are used only for the temperature model component of QUAL2kw which was not applied in these model simulations. 2.5. Source Loads The model allows specifying both nonpoint source and point source loads and flows to any model segments. For model development, nonpoint source loads were evenly distributed among each of the model segments, and were represented by the inflow concentrations and flows from the local drainage area to the modeled reaches. Local drainage inflow concentrations were derived by area-weighting the land covers based on the LCLM (Tables 10 – 14).

Memo to File -5- March 14, 2012
California Environmental Protection Agency
Recycled Paper
Diel data of dissolved oxygen, water temperature, and pH collected in 2011 were used as for local drainage concentrations in the models (NCRWQCB 2011). The daily mean value of data collected in the headwaters of Copeland Creek was used for local drainage conditions for the Cunningham Lake model. The daily mean value of data collected in the headwaters of Santa Rosa Creek was used for the local drainage conditions for the Lake Jonive, Sebring Lake and Santa Rosa Creek models. The daily mean value of data collected in the headwaters of Mark West Creek was used for local drainage conditions for the Ballard Lake model. Other required input concentrations variables were estimated by the methods described in Table 2 (Butkus 2011a). Flows from local drainage were estimated by area-weighting. The local drainage area for the modeled segments of Santa Rosa Creek is 3.73% of the drainage area of the stream flow gage operating on Lower Santa Rosa Creek at Willowside Road (USGS Gage #1146320). The local drainage area for the modeled segments of Lake Jonive is 1.84% of the drainage area of stream flow gage operating on Lake Jonive at Occidental Road (USGS Gage #11465750). Local inflow volumes were set at these percentages of the flow measured at these gages. The City of Santa Rosa treats municipal wastewater from Santa Rosa, Rohnert Park, Cotati, and Sebastopol at the Subregional Water Reclamation System (SWRS) utilizing advanced wastewater treatment. The SWRS is permitted to discharge wastewater only during the non-critical period of October 1 to May 14. In addition, the discharge volume of wastewater is limited based on receiving water flow volume. These permit limitations assure that wastewater is not discharged during critical periods. Therefore, no point source loads were included in the model development since point source discharges are not allowed during critical low flow periods. 2.6. Other Model Constants The model requires information on several other state variables. The values used for model development of these variables are specifically described in Butkus (2011a). User manual recommendations for sediment and light characteristics were selected. Solar radiation is estimated from input data based on the time of year, latitude and longitude, cloud cover, and shade. Simulations were run at the summer solstice (i.e., June 21) to model the maximum light available for increased photosynthetic rate. This assumption also models a worst-case condition that also serves as an inherent margin of safety for the TMDL. The model requires a percent shade value to represent the percent of solar radiation that is blocked because of riparian or topographic shade. Shade was assumed to be zero for model development for the Lake Jonive and lower Santa Rosa Creek models. This assumption models a worst-case condition that serves as an inherent margin of safety for the TMDL. The model requires the wetted-area coverage of benthic algae and oxygen demanding sediments. The proportion of benthic algae coverage to sediment was assumed to be split evenly between both (i.e., 50% to 50%) for Santa Rosa Creek. A larger coverage

Memo to File -6- March 14, 2012
California Environmental Protection Agency
Recycled Paper
of sediment was assumed for Lake Jonive since there is more relative open water area. Benthic algae carrying capacity represents the density of attached macrophytes and periphyton. Pre-settlement conditions for benthic algae carrying capacity was set at the presumptively unimpaired level (i.e., 100 mg chl-a/m2) for cold water beneficial uses established by Creager et al. (2006). Current conditions for benthic algae carrying capacity was set at the calibration level (i.e, 300 mg chla/ m2). Pre-settlement conditions for planktonic algae concentration was set at the presumptively unimpaired level (i.e., 10 µg chl-a/m2) for warm water beneficial uses established by Creager et al. (2006). The model includes internal loading from benthic sediments. The calibrated models prescribed rates of sediment oxygen demand (SOD), inorganic phosphorus, and ammonia nitrogen. These rates were established during calibration based on mass balance. Internal loading in unimpaired lakes and streams is often found to be much lower than highly eutrophic ecosystems like the current Laguna. Internal loading for the presettlement Laguna models was reduced to levels that are assumed to be unimpaired. Both ammonia nitrogen and inorganic phosphorus fluxes are based on anoxic processes and were assumed to be zero in the presettlement Laguna models. SOD was assumed to be 0.5 gO2/m
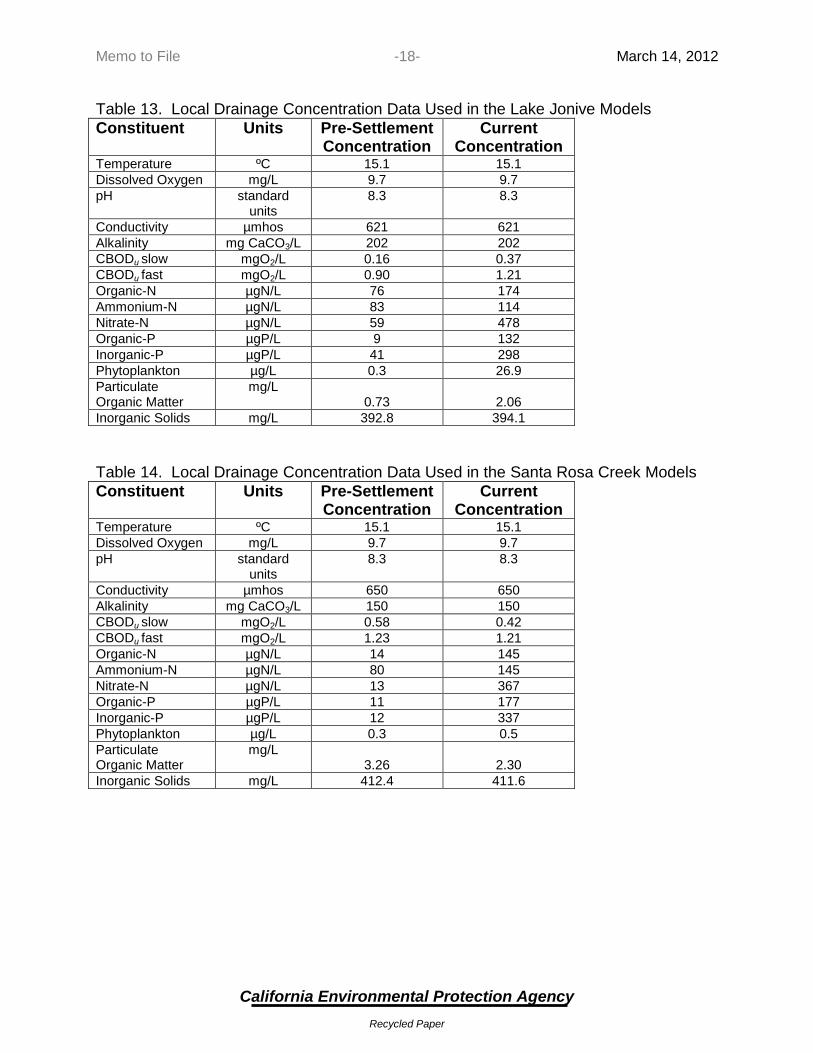
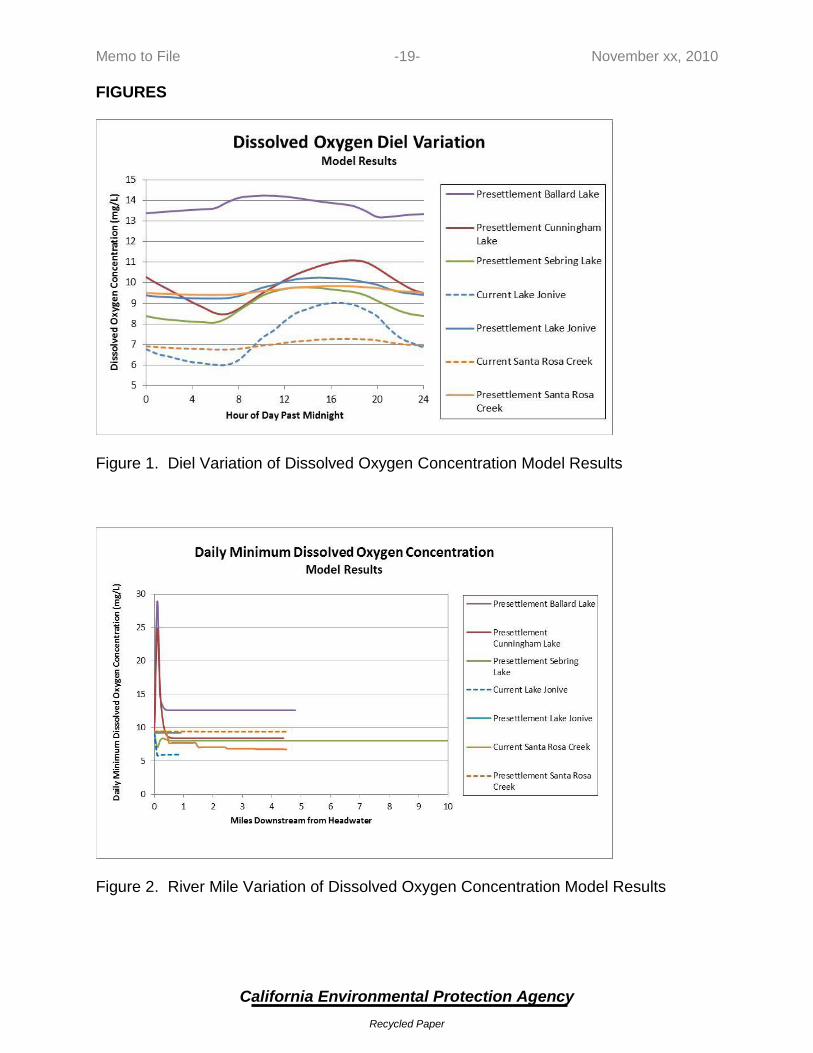
2/d which represents the midrange for a sandy benthos (Chapra 1997). 3. MODEL SIMULATIONS The model results of daily minimum DO concentrations were used to assess support of aquatic life uses (i.e., SPWN, WARM, COLD). The model results of the diel range of DO concentrations were used to assess impairment from biostimulatory substances, since higher ranges of diel DO concentrations are directly related to algal productivity. The results of the model simulations were presented in Figures 1-8 and discussed below. Figure 1 showed the diel variation of DO concentrations for each of the model simulations that represent 7Q20 critical low flow. Only the presettlement Cunningham Lake model results show a similar diel cycle in DO concentrations as the current lake Jonive model results. Each of the other pre-settlement lake model results showed a much smaller diel range indicating less algal productivity. The Ballard Lake model results predict unreasonably high DO concentrations suggesting the extrapolation of the calibrated Lake Jonive model to the pre-settlement Ballard Lake geometry provided biased results. The diel variation in the lower Santa Rosa Creek model results were similar between pre-settlement and current conditions. However, the overall DO concentration levels were around 3 mg/L higher for the pre-settlement conditions in Santa Rosa Creek than for current conditions.. Figure 2 shows the model results of the daily minimum DO concentration as the flow is transported downstream from the headwater inflow. The few reaches simulated by the models serve as a mixing zone for the upstream headwater loads as they are processed by the lake. The results show that the DO concentrations meet steady-state within the first river mile downstream of the headwater inflow for the lake model

Memo to File -7- March 14, 2012
California Environmental Protection Agency
Recycled Paper
simulations. The current loads modeled in Santa Rosa Creek show that steady-state is reached in about 2.5 river miles. These results show that the modeled processes drive the prediction of steady state conditions for daily minimum DO more than upstream headwater processes. Figure 3 compares the model results of daily minimum DO concentrations over a range of critical flows for each pre-settlement lake model. The presettlement Lake Jonive and Ballard Lake model results show that changes in critical low stream flows have no apparent effect on daily minimum DO concentration. Both the Sebring and Cunningham Lake model results exhibit a unimodal response in daily minimum DO concentration. DO concentration is the largest at a stream flow around 1.0 cfs which represents a critical return period of about 1.5 years (i.e., midway between the 7Q1 and 7Q2 values in Table 2). Figure 4 compares the model results of the diel range of DO concentrations over a range of critical flows for each pre-settlement lake models. The Lake Jonive model results show that increases in critical low stream flows decrease the diel DO concentration range indicating lower productivity with higher flows. The other three pre-settlement lake models exhibit a unimodal response in the diel range of DO concentration. The diel range of DO concentration is the largest between a stream flow around 0.7 – 1.0 cfs which again represents a critical return period of about 1.5 years (i.e., midway between the 7Q1 and 7Q2 values in Table 2). A comparison of Figures 3 and 4 show model results are consistent for three of the pre-settlement models: Lake Jonive, Cunningham Lake, and Sebring Lake. The results from these models show the same pattern in DO concentration with varying critical low flows. The unimodel flow response in the Cunningham Lake, and Sebring Lake model results show that stream flows around 1.0 cfs have the largest minimum DO concentration and apparent algal productivity. All three pre-settlement lake models show that minimum DO concentration for pre-settlement conditions are above the Basin Plan Water Quality Objective of 7.0 mg/L at stream flows above the 20-year return period (i.e., > 0.24 cfs in Table 2). The Ballard Lake model results show inconsistent model results with a large increase in the diel range (i.e., increased algal productivity) has no effect on daily minimum DO concentration. This inconsistency in model results suggests again the extrapolation of the calibrated Lake Jonive model to the pre-settlement Ballard Lake geometry provided biased results. Figure 5 compares the Lake Jonive model results of daily minimum DO concentration between the pre-settlement and current nutrient loads at various critical low flows. Both models show an increase in the daily minimum DO with increasing stream flows. The pre-settlement daily minimum DO concentrations are generally 3 mg/L larger than model results for current nutrient loads. The current Lake Jonive model results show that daily minimum DO concentrations do not meet the Basin Plan Water Quality Objective of 7.0 mg/L at critical stream flows of about 1.5 years (i.e., 1.0 cfs is midway between the 7Q1 and 7Q2 values in Table 2).

Memo to File -8- March 14, 2012
California Environmental Protection Agency
Recycled Paper
Figure 6 compares the Lake Jonive model results of the diel range of DO concentration between the pre-settlement and current nutrient loads at various critical low flows. Both models show a decrease in the DO concentration diel range with increasing stream flows. This observation indicates that lower stream flows results in greater algal productivity. The pre-settlement diel ranges of DO concentrations are much smaller than model results for current nutrient loads. This observation indicates that mainstem Laguna de Santa Rosa at Lake Jonive exhibits less algal productivity with pre-settlement nutrient loads as compared to current nutrient loads. Figure 7 compares the Santa Rosa Creek model results of daily minimum DO concentration between the pre-settlement and current nutrient loads at various critical low flows. Both models show no large change in the daily minimum DO with increasing stream flows. The pre-settlement daily minimum DO concentrations are generally 2 mg/L larger than model results for current nutrient loads. The current Santa Rosa Creek model results show that daily minimum DO concentrations just meet the Basin Plan Water Quality Objective of 7.0 mg/L at critical stream flows of 2 years (i.e., 3.5 cfs is near the 7Q2 value in Table 2). Figure 8 compares the Santa Rosa Creek model results of the diel range of DO concentration between the pre-settlement and current nutrient loads at various critical low flows. Both models show a decrease in the DO concentration diel range with increasing stream flows. This observation indicates that lower stream flows results in greater algal productivity. The pre-settlement diel ranges of DO concentrations are slightly smaller than model results for current nutrient loads. This observation indicates that Santa Rosa Creek exhibits less algal productivity with pre-settlement nutrient loads as compared to current nutrient loads. 4. FINDINGS The following finding can be made from the model simulations results.
Extrapolation of the calibrated Lake Jonive model to the pre-settlement Ballard Lake geometry provided biased results and should not be used to inform the TMDL process.
Three other the pre-settlement lake models (i.e, Lake Jonive, Cunningham Lake, and Sebring Lake) show that minimum DO concentration for pre-settlement conditions meet the Basin Plan Water Quality Objective of 7.0 mg/L at critical stream flows above the 20-year return period.
Both the Lake Jonive and Santa Rosa Creek model results show that lower stream flows results in greater algal productivity (as indicated by a decreasing diel range of DO concentration).
Both the Lake Jonive and Santa Rosa Creek model results show less algal productivity with pre-settlement nutrient loads as compared to current nutrient loads (as indicated by a decreasing diel range of DO concentration).

Memo to File -9- March 14, 2012
California Environmental Protection Agency
Recycled Paper
REFERENCES Butkus, S. 2010a. Water Quality Dynamics within the Laguna de Santa Rosa Watershed. North Coast Regional Water Quality Control Board. Memorandum to the File: Laguna de Santa Rosa; TMDL Development & Planning dated March 25, 2010. Santa Rosa, CA. Butkus, S. 2010b. Nutrient Loading Estimates for the Laguna TMDL Source Analysis. North Coast Regional Water Quality Control Board. Memorandum to the File: Laguna de Santa Rosa; TMDL Development & Planning dated November 19, 2010. Santa Rosa, CA. Butkus, S. 2011a. Dissolved Oxygen Model Development and Evaluation. Memorandum to the File: Laguna de Santa Rosa; TMDL Development & Planning dated June 28, 2011. Santa Rosa, CA. Butkus, S. 2011b. Development of the Laguna de Santa Rosa Watershed Pre-European Settlement Spatial Data Model. Memorandum to the File: Laguna de Santa Rosa; TMDL Development & Planning dated December 8, 2011. Santa Rosa, CA. Butkus, S. 2011c. Development of the Land Cover Loading Model for the Laguna de Santa Rosa Watershed. Memorandum to the File: Laguna de Santa Rosa; TMDL Development & Planning dated December 8, 2011. Santa Rosa, CA. Butkus, S. 2011d. Constructing Stream Flow Rating Power Equations for the Pre-settlement Lakes in the Laguna de Santa Rosa. Memorandum to the File: Laguna de Santa Rosa; TMDL Development & Planning dated June 28, 2011. Santa Rosa, CA. Chapra, S.C., Pelletier, G.J. and Tao, H. 2006. QUAL2K: A Modeling Framework for Simulating River and Stream Water Quality, Version 2.04: Documentation and Users Manual. Civil and Environmental Engineering Dept., Tufts University, Medford, MA. Chow, V. T. 1959. Open channel hydraulics. New York: McGraw-Hill Company, New York, NY. Creager, C., Butcher, J., Welch, E., Wortham, G. and S. Roy. 2006. Technical Approach to Develop Nutrient Numeric Endpoints for California. Tetrat Tech, Inc. Prepared for: U.S. EPA Region IX (Contract No. 68-C-02-108-To-111), Lafayette, CA. CSWRCB, 2005. A Process for Addressing Impaired Waters in California. S.B. 669 Guidance approved by resolution 2005-0050. California State Water Resources Control Board (CSWRCB), Sacramento, CA. Cummings, J. 2004. Draining and Filling the Laguna de Santa Rosa. Copyrighted Reference publication at Sebastopol Public Library, Sebastopol CA.

Memo to File -10- March 14, 2012
California Environmental Protection Agency
Recycled Paper
Dahlgren, R.A., Tate, K.W., Lewis, D.L., Atwill, E.R., Harper, J.M., and Allen-Diaz, B.H. 2001. Watershed research examines rangeland management effects on water quality. California Agriculture 55(6):64-71. Deas, M. 2007. Laguna de Santa Rosa and Russian River Flow and Water Quality Model Summary. Technical Memorandum D-6. Sata Rosa IRWP – Discharge Compliance Project. Prepared for the City of Santa Rosa by Merritt Smith Consulting. August 2007. Helsel, D.R. and Hirsch, R.M. 2002. Techniques of Water-Resources Investigations of the United States Geological Survey: Book 4, Hydrologic Analysis and Interpretation; Chapter A3 – Statistical Methods. U.S. Geological Survey. Available at: http://water.usgs.gov/pubs/twri/twri4a3/ Linsley, R.K. Jr., Kohler, M.A., and J.L.H. Paulhus. 1982. Hydrology for Engineers. McGraw-Hill Book Company, New York, NY. National Elevation Dataset (NED), 2006, NED Data Dictionary, U. S. Geological Survey, Available at http://ned.usgs.gov/ned/downloads/documents/ National Hydrography Dataset Plus (NHDPlus). User Guide. U.S. Environmental Protection Agency & U.S. Geological Survey, 2997. Available at: http://www.horizon-systems.com/nhdplus/data/NHDPLUS_UserGuide.pdf NCRWQCB, 2010. Laguna de Santa Rosa TMDL – 2009 Source Analysis Monitoring Report. North Coast Regional Water Quality Control Board, Santa Rosa, CA. June 2010. NCRWQCB, 2011. Laguna de Santa Rosa TMDL – Diel Water Quality Monitoring Report - 2011. North Coast Regional Water Quality Control Board, Santa Rosa, CA. December 2011. Pelletier, G.J. and Chapra, S.C. 2008. QUAL2Kw User Manual (version 5.1). A modeling framework for simulation of river and stream water quality. Washington State Dept of Ecology Publication No. 08-03-xxx. Olympia, WA. Pelletier, G.J., Chapra, S.C. and H. Tao. 2006. QUAL2Kw – A Framework for modeling water quality in streams and rivers using a genetic algorithm for calibration. Environmental Modeling & Software 21:419-425. Philip Williams and Associates, Ltd. (PWA). 2004. Sediment sources, rate and fate in the Laguna de Santa Rosa, Volume II. PWA Project Number 1411-08. Prepared for the U.S. Army Corp of Engineers, San Francisco District, CA. Pyrce, R. 2004. Hydrological Low Flow Indices and their Uses. WSC Report No. 04-2004, Watershed Science Centre, Peterborough, Ontario, Canada. K9J 7B8

Memo to File -11- March 14, 2012
California Environmental Protection Agency
Recycled Paper
Rosgen, D. L., & Silvey, H. L. 1996. Applied River Morphology. Pagosa Springs, CO: Wildland Hydrology Books. Searcy, J.K., 1959, Flow-duration curves, Manual of Hydrology—Part 2. Low-flow techniques: U.S. Geological Survey Water-Supply Paper 1542-A, 33 p. Simley, J.D. and Carswell Jr., W.J., 2009, The National Map—Hydrography: U.S. Geological Survey Fact Sheet 2009-3054, 4 p. Available at http://nhd.usgs.gov/data.html USEPA 1984. Technical guidance manual for performing waste load allocations. Book IX. Innovative waste load allocations. Contratc Number 68-01-6904. U.S. Environmental Protection Agency, Washington, DC.

Memo to File -12- March 14, 2012
California Environmental Protection Agency
Recycled Paper
TABLES Table 1. Model Scenarios Simulated
Waterbody Nutrient Loads Mainstem Laguna de Santa Rosa at Ballard Lake Pre-settlement (< 1830)
Mainstem Laguna de Santa Rosa at Cunningham Lake Pre-settlement (< 1830)
Mainstem Laguna de Santa Rosa at Sebring Lake Pre-settlement (< 1830)
Mainstem Laguna de Santa Rosa at Lake Jonive Pre-settlement (< 1830)
Santa Rosa Creek with Pre-settlement Channel Geometry Pre-settlement (< 1830)
Mainstem Laguna de Santa Rosa at Lake Jonive Current (2009)
Santa Rosa Creek with Current Channel Geometry Current (2009)
Table 2. Stream Flow Statistics from Gages on Modeled Reaches
Flow Statistic
Santa Rosa Creek at Willowside Road
Lake Jonive at Occidental Road
flow (cfs) flow (cms) flow (cfs) flow (cms) 7Q1 7.68 0.2174 1.90 0.0539
7Q2 3.85 0.1091 0.68 0.0191
7Q5 2.74 0.0775 0.40 0.0114
7Q10 2.22 0.0629 0.30 0.0084
7Q20 1.96 0.0554 0.24 0.0069
7Q50 1.66 0.0471 0.19 0.0054
7Q100 1.08 0.0306 0.10 0.0028
Table 3. Depth and Velocity Rating Curve Equation Terms for Laguna Pre-settlement Lakes at Selected Cross Sections
Pre-settlement Lake
Depth Rating Curve Velocity Rating Curve
Coefficient
(α)
Exponent
(ß)
Coefficient
(α)
Exponent
(ß)
Ballard 8.518 1.000 0.088 0.292
Cunningham 1.112 0.527 0.006 0.946
Jonive 1.626 0.168 0.001 0.491
Sebring 9.235 1.047 0.023 0.902

Memo to File -13- March 14, 2012
California Environmental Protection Agency
Recycled Paper
Table 4. Source of Initial and Upstream Concentration Data Used in Model Applications
Constituent Method Citation Temperature Diel data measured in 2011 NCRWQCB 2011
Dissolved Oxygen Diel data measured in 2011 NCRWQCB 2011
pH Diel data measured in 2011 NCRWQCB 2011
Conductivity Median value of measured diel data that was used for model calibration
NCRWQCB 2010; Butkus 2011a
Alkalinity Median measured in Russian River Brown & Sayers-Fay 2007
Mean measured in the Laguna AES 2004
CBODu slow & fast Derived from total organic carbon (TOC) and particulate matter (PM) concentrations
Butkus 2011c: [TOC] and [PM] from LCLM
Emery et al. 1971: [BOD5] derived from [TOC]
Pelletier & Chapra 2008: [CBODu] derived from [BOD5]
Bowie 1985: CBODu slow from [BOD5] and [PM]
Organic-N Derived from total-N minus ammonium-N minus nitrate-N
Standard Methods 4500-N
Ammonium-N Concentration estimated by LCLM Butkus 2011c
Nitrate-N Concentration estimated by LCLM Butkus 2011c
Organic-P Derived from measured ratio of inorganic-P & total-P
NCRWQCB 2008
Inorganic-P Concentration estimated by LCLM Butkus 2011c
Phytoplankton Derived biomass from chlorophyll a Standard Method 100200(I)(1)
Particulate Organic Matter
Derived from total organic carbon concentration estimated by LCLM. Assumed same particulate fraction of carbon as measured for phosphorus.
NCRWQCB 2008; Butkus 2011c
Inorganic Solids Derived from median value of measured conductivity data that was used for model calibration
NCRWQCB 2010; Butkus 2010 Chapra 1997

Memo to File -14- March 14, 2012
California Environmental Protection Agency
Recycled Paper
Table 5. Initial and Upstream Concentration Data Used in the Ballard Lake Models
Constituent Units Pre-Settlement Concentration
Current Concentration
Temperature ºC 13.9 - 16.3 13.9 - 16.3
Dissolved Oxygen mg/L 9.4 - 10.0 9.4 - 10.0
pH standard units
8.3 - 8.4 8.3 - 8.4
Conductivity µmhos 621 621
Alkalinity mg CaCO3/L 202 202
CBODu slow mgO2/L 0.14 0.32
CBODu fast mgO2/L 0.92 0.73
Organic-N µgN/L 106 158
Ammonium-N µgN/L 72 98
Nitrate-N µgN/L 190 464
Organic-P µgP/L 10 92
Inorganic-P µgP/L 52 210
Phytoplankton µg/L 0.3 26.9
Particulate Organic Matter
mg/L 0.66 1.62
Inorganic Solids mg/L 393.9 393.8
Table 6. Initial and Upstream Concentration Data Used in the Cunningham Lake Models
Constituent Units Pre-Settlement Concentration
Current Concentration
Temperature ºC 15.3 - 18.3 15.3 - 18.3
Dissolved Oxygen mg/L 9.2 - 9.9 9.2 - 9.9
pH standard units
8.0 - 8.2 8.0 - 8.2
Conductivity µmhos 621 621
Alkalinity mg CaCO3/L 202 202
CBODu slow mgO2/L 0.13 0.29
CBODu fast mgO2/L 0.88 1.04
Organic-N µgN/L 113 148
Ammonium-N µgN/L 72 101
Nitrate-N µgN/L 198 453
Organic-P µgP/L 9 100
Inorganic-P µgP/L 55 254
Phytoplankton µg/L 0.3 26.9
Particulate Organic Matter
mg/L 0.58 1.48
Inorganic Solids mg/L 394.1 393.7

Memo to File -15- March 14, 2012
California Environmental Protection Agency
Recycled Paper
Table 7. Initial and Upstream Concentration Data Used in the Sebring Lake Models
Constituent Units Pre-Settlement Concentration
Current Concentration
Temperature ºC 15.3 - 18.3 15.3 - 18.3
Dissolved Oxygen mg/L 9.2 - 9.9 9.2 - 9.9
pH standard units
8.0 - 8.2 8.0 - 8.2
Conductivity µmhos 621 621
Alkalinity mg CaCO3/L 202 202
CBODu slow mgO2/L 0.15 0.34
CBODu fast mgO2/L 0.92 1.14
Organic-N µgN/L 98 164
Ammonium-N µgN/L 74 110
Nitrate-N µgN/L 163 397
Organic-P µgP/L 10 114
Inorganic-P µgP/L 49 271
Phytoplankton µg/L 0.3 26.9
Particulate Organic Matter
mg/L 0.70 1.80
Inorganic Solids mg/L 393.9 393.2
Table 8. Initial and Upstream Concentration Data Used in the Lake Jonive Models
Constituent Units Pre-Settlement Concentration
Current Concentration
Temperature ºC 15.3 - 18.3 15.3 - 18.3
Dissolved Oxygen mg/L 9.2 - 9.9 9.2 - 9.9
pH standard units
8.0 - 8.2 8.0 - 8.2
Conductivity µmhos 621 621
Alkalinity mg CaCO3/L 202 202
CBODu slow mgO2/L 0.17 0.34
CBODu fast mgO2/L 0.95 1.14
Organic-N µgN/L 88 167
Ammonium-N µgN/L 76 108
Nitrate-N µgN/L 136 433
Organic-P µgP/L 10 114
Inorganic-P µgP/L 45 262
Phytoplankton µg/L 0.3 26.9
Particulate Organic Matter
mg/L 0.80 1.84
Inorganic Solids mg/L 393.2 393.8

Memo to File -16- March 14, 2012
California Environmental Protection Agency
Recycled Paper
Table 9. Initial and Upstream Concentration Data Used in the Santa Rosa Creek Models
Constituent Units Pre-Settlement Concentration
Current Concentration
Temperature ºC 13.9 - 16.3 13.9 - 16.3
Dissolved Oxygen mg/L 9.4 - 10.0 9.4 - 10.0
pH standard units
8.3 - 8.4 8.3 - 8.4
Conductivity µmhos 650 650
Alkalinity mg CaCO3/L 150 150
CBODu slow mgO2/L 0.11 0.26
CBODu fast mgO2/L 0.85 0.90
Organic-N µgN/L 134 150
Ammonium-N µgN/L 67 77
Nitrate-N µgN/L 263 516
Organic-P µgP/L 10 52
Inorganic-P µgP/L 63 127
Phytoplankton µg/L 0.3 0.5
Particulate Organic Matter
mg/L 0.48 1.19
Inorganic Solids mg/L 412.8 413.1
Table 10. Local Drainage Concentration Data Used in the Ballard Lake Models
Constituent Units Pre-Settlement Concentration
Current Concentration
Temperature ºC 16.1 16.1
Dissolved Oxygen mg/L 8.0 8.0
pH standard units
8.0 8.0
Conductivity µmhos 621 621
Alkalinity mg CaCO3/L 202 202
CBODu slow mgO2/L 0.12 0.34
CBODu fast mgO2/L 0.85 0.93
Organic-N µgN/L 108 125
Ammonium-N µgN/L 76 100
Nitrate-N µgN/L 156 265
Organic-P µgP/L 9 65
Inorganic-P µgP/L 54 113
Phytoplankton µg/L 0.3 26.9
Particulate Organic Matter
mg/L 0.53 1.59
Inorganic Solids mg/L 394.3 394.7

Memo to File -17- March 14, 2012
California Environmental Protection Agency
Recycled Paper
Table 11. Local Drainage Concentration Data Used in the Cunningham Lake Models
Constituent Units Pre-Settlement Concentration
Current Concentration
Temperature ºC 16.3 16.3
Dissolved Oxygen mg/L 9.6 9.6
pH standard units
8.1 8.1
Conductivity µmhos 621 621
Alkalinity mg CaCO3/L 202 202
CBODu slow mgO2/L 0.16 0.35
CBODu fast mgO2/L 0.93 1.16
Organic-N µgN/L 95 169
Ammonium-N µgN/L 74 112
Nitrate-N µgN/L 154 382
Organic-P µgP/L 10 118
Inorganic-P µgP/L 47 276
Phytoplankton µg/L 0.3 26.9
Particulate Organic Matter
mg/L 0.74 1.88
Inorganic Solids mg/L 393.8 411.6
Table 12. Local Drainage Concentration Data Used in the Sebring Lake Models
Constituent Units Pre-Settlement Concentration
Current Concentration
Temperature ºC 15.1 15.1
Dissolved Oxygen mg/L 9.7 9.7
pH standard units
8.3 8.3
Conductivity µmhos 621 621
Alkalinity mg CaCO3/L 202 202
CBODu slow mgO2/L 0.14 0.31
CBODu fast mgO2/L 0.91 0.99
Organic-N µgN/L 110 154
Ammonium-N µgN/L 71 91
Nitrate-N µgN/L 203 504
Organic-P µgP/L 10 80
Inorganic-P µgP/L 53 174
Phytoplankton µg/L 0.3 26.9
Particulate Organic Matter
mg/L 0.65 1.52
Inorganic Solids mg/L 393.9 394.1
Memo to File -18- March 14, 2012
California Environmental Protection Agency
Recycled Paper
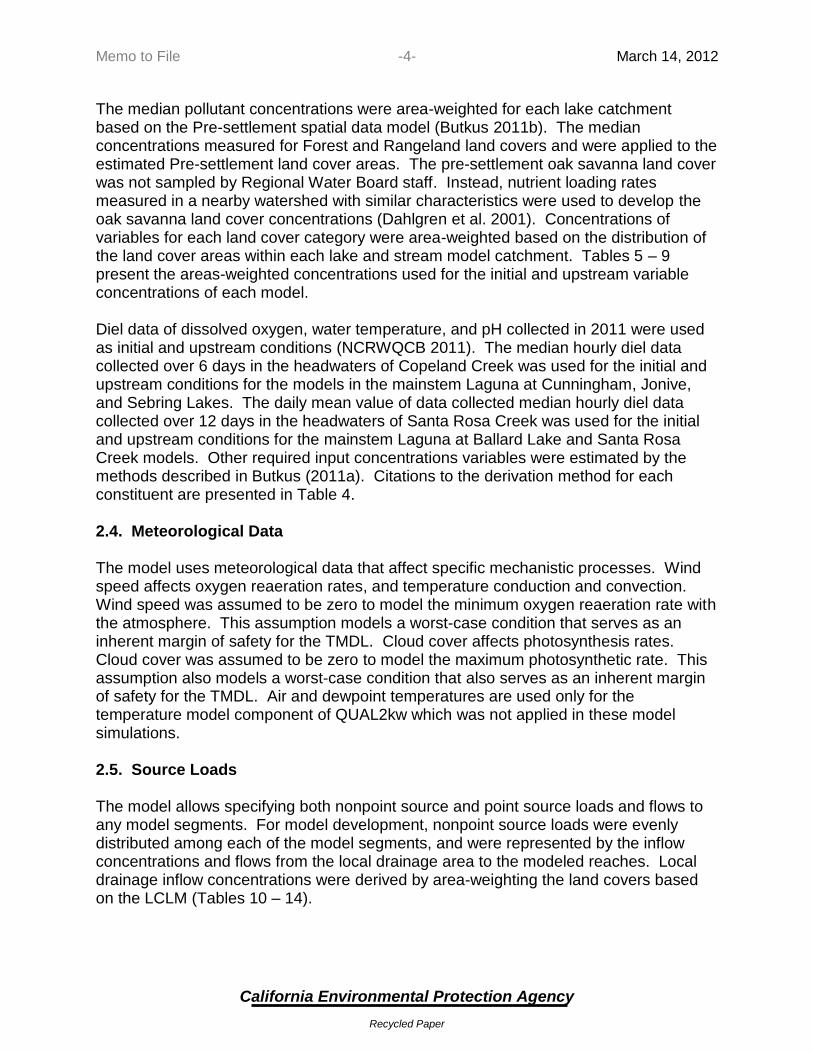
Table 13. Local Drainage Concentration Data Used in the Lake Jonive Models
Constituent Units Pre-Settlement Concentration
Current Concentration
Temperature ºC 15.1 15.1
Dissolved Oxygen mg/L 9.7 9.7
pH standard units
8.3 8.3
Conductivity µmhos 621 621
Alkalinity mg CaCO3/L 202 202
CBODu slow mgO2/L 0.16 0.37
CBODu fast mgO2/L 0.90 1.21
Organic-N µgN/L 76 174
Ammonium-N µgN/L 83 114
Nitrate-N µgN/L 59 478
Organic-P µgP/L 9 132
Inorganic-P µgP/L 41 298
Phytoplankton µg/L 0.3 26.9
Particulate Organic Matter
mg/L 0.73 2.06
Inorganic Solids mg/L 392.8 394.1
Table 14. Local Drainage Concentration Data Used in the Santa Rosa Creek Models
Constituent Units Pre-Settlement Concentration
Current Concentration
Temperature ºC 15.1 15.1
Dissolved Oxygen mg/L 9.7 9.7
pH standard units
8.3 8.3
Conductivity µmhos 650 650
Alkalinity mg CaCO3/L 150 150
CBODu slow mgO2/L 0.58 0.42
CBODu fast mgO2/L 1.23 1.21
Organic-N µgN/L 14 145
Ammonium-N µgN/L 80 145
Nitrate-N µgN/L 13 367
Organic-P µgP/L 11 177
Inorganic-P µgP/L 12 337
Phytoplankton µg/L 0.3 0.5
Particulate Organic Matter
mg/L 3.26 2.30
Inorganic Solids mg/L 412.4 411.6
Memo to File -19- November xx, 2010
California Environmental Protection Agency
Recycled Paper
FIGURES
Figure 1. Diel Variation of Dissolved Oxygen Concentration Model Results
Figure 2. River Mile Variation of Dissolved Oxygen Concentration Model Results

Memo to File -20- June 28, 2011
California Environmental Protection Agency
Recycled Paper
Figure 3. Model Results of Daily Minimum Dissolved Oxygen Concentration in Presettlement Lakes
Figure 4. Model Results of Diel Range of Dissolved Oxygen Concentration in Presettlement Lakes

Memo to File -21- June 28, 2011
California Environmental Protection Agency
Recycled Paper
Figure 5. Comparison of Current and Presettlement Lake Jonive Daily Minimum Dissolved Oxygen Concentration Model Results by Stream Flow
Figure 6. Comparison of Current and Presettlement Lake Jonive Diel Range of Dissolved Oxygen Concentration Model Results by Stream Flow

Memo to File -22- June 28, 2011
California Environmental Protection Agency
Recycled Paper
Figure 7. Comparison of Current and Presettlement Santa Rosa Creek Daily Minimum Dissolved Oxygen Concentration Model Results by Stream Flow
Figure 8. Comparison of Current and Presettlement Santa Rosa Creek Diel Range of Dissolved Oxygen Concentration Model Results by Stream Flow