Embed Size (px)
Citation preview
CALIFORNIA PETROLEUM REFINERY
HAZARDOUS WASTE SOURCE REDUCTION
1998 ASSESSMENT REPORT
California Environmental Protection Agency
Department of Toxic Substances Control
Office of Pollution Prevention and Technology Development
January 2004

COVER: We share a vision that California industry can coexist in environmental harmony with the State’s valued air, land, and water resources. Multimedia pollution prevention practices can be an effective tool for achieving this vision. The central cover photograph shows a petroleum refinery delayed coking unit schematic superimposed over a diffused image of a crude oil distillation unit. These refinery images were adopted from the Office of Pollution Prevention and Technology Development publication “Assessment of the Petroleum Industry Hazardous Waste Source Reduction Planning Efforts”, June 1997. The surrounding scenic photographs are courtesy of EcoPics and Freestockphotos.com. COVER DESIGN: Arvind Shah and Joanna Kruckenberg, California Environmental Protection Agency, Department of Toxic Substances Control, Office of Pollution Prevention and Technology Development.
ACKNOWLEDGMENTS The authors express special thanks to Pat Miles-Lopez of the Department of Toxic Substances Control, Office of Pollution Prevention and Technology Development support staff for her help and hard work in the preparation of this report. This report was prepared by: Arvind Shah (Editor) Relly Briones Benjamin Fries Leslie Goodbody Narendra Khilnani Stan Lau Philip Loder Eugene Shirai Under the guidance of: Alan Ingham Kim Wilhelm DOCUMENT AVAILABILITY This document contains no copyright restrictions and we encourage its reproduction and distribution. To request copies contact: MAIL: Department of Toxic Substances Control Office of Pollution Prevention and Technology Development Source Reduction Unit P. O. Box 806 Sacramento, California 95812-0806 TELEPHONE: (916) 322-3670 DISCLAIMER The mention of any products, companies or source reduction technologies, their source or their use in connection with material reported herein is not to be construed as either an actual or implied endorsement of such products, companies or technologies.
TABLE OF CONTENTS ACKNOWLEDGMENTS REPORT OVERVIEW.................................................................................................................1 I. BACKGROUND...............................................................................................................2 II. INTRODUCTION..............................................................................................................4 III. HAZARDOUS WASTE SOURCE REDUCTION ........................................................6 IV. CONCLUSIONS...........................................................................................................100 LIST OF TABLES TABLE 1 .......................................................................................................................................102 California Petroleum Industry Aqueous (Category A) Waste Reduction Results [1994 vs. 1998 Waste Generation] TABLE 2 .......................................................................................................................................103 California Petroleum Industry NonAqueous (Category B) Waste Reduction Data [1994 vs. 1998 Waste Generation] TABLE 3 .......................................................................................................................................104 California Petroleum Industry Aqueous (Category A) and NonAqueous (Category B) Waste Reduction Results [1994 vs. 1998 Waste Generation] TABLE 4 .......................................................................................................................................105 California Petroleum Industry Prevalent Waste Stream (Oil/Water Separation Sludge CWC 222) 1994 and 1998 Data Comparison TABLE 5 .......................................................................................................................................106 California Petroleum Industry Prevalent Waste Stream (Aqueous sol. with total organic residues less than 10% CWC 134) 1994 and 1998 Data Comparison TABLE 6 .......................................................................................................................................107 California Petroleum Industry Prevalent Waste Stream (Other Spent Catalyst CWC 162) 1994 and 1998 Data Comparison TABLE 1-A ....................................................................................................................................108 Bay Area Refineries Aqueous Waste Reduction Results [1994 vs. 1998 Waste Generation] TABLE 2-A ....................................................................................................................................108 Bay Area Refineries NonAqueous Waste Reduction Results [1994 vs. 1998 Waste Generation] TABLE 3-A ....................................................................................................................................109 Bay Area Refineries Aqueous and NonAqueous Waste Reduction Results [1994 vs. 1998 Waste Generation]

1
REPORT OVERVIEW This report presents the Department of Toxic Substances Control’s (DTSC) source reduction assessment of California’s 17 largest petroleum refineries. This assessment is based on a review of hazardous waste source reduction planning documents prepared in accord with the requirements of the Hazardous Waste Source Reduction and Management Review Act also known as SB 14. Several of the 17 refineries reported in this assessment are State’s largest hazardous waste generators as identified by recent Biennial Generator Report (BGR) data. Some of these large reported waste quantities include aqueous hazardous wastes which are by far the largest reported individual waste stream generated amounting in many cases to millions of tons annually. As of December 2002, DTSC changed waste stream terminology in its SB 14 guidance. Hazardous waste streams that are pretreated on site, then subsequently discharged via the sewer system to a publicly owned treatment works (POTW) or to a receiving water under a National Pollution Discharge Elimination System (NPDES) permit, are now referred to as Category A wastes. This type of waste stream was formerly called “aqueous waste.” All other hazardous waste streams subject to SB 14, which were formerly called “nonaqueous waste” are now referred to as Category B wastes. The refinery SB 14 documents were reviewed for completeness and for information regarding source reduction efforts. Waste generation comparisons were made for the period 1994 to 1998. Collectively, the California petroleum refineries reduced its generation of Category A and Category B wastes by seven percent from 1994 to 1998.
2
I. BACKGROUND The Hazardous Waste Source Reduction and Management Review Act of 1989 (SB 14) applies to businesses that routinely generated over 12,000 kilograms (13.2 tons) of hazardous waste or 12 kilograms of extremely hazardous waste in the years: 1990, 1994, 1998, and succeeding four year reporting years. Affected generators must conduct source reduction evaluations of major hazardous waste streams, followed by document preparation that demonstrate that they conducted a thorough source reduction assessment effort (present and past) to identify, evaluate, and then implement feasible source reduction measures. Source reduction involves those actions taken before waste is generated to reduce the concentration or quantities of hazardous waste by addressing the sources that would otherwise produce waste. Source reduction measures can be grouped into categories such as input changes: substituting non hazardous or less hazardous substances for hazardous substances, process modification: modifying production process variables or equipment, maintenance practices, administrative changes: such as procurement practices, establishing specific policies and procedures to achieve waste reduction, and lastly product reformulation: such as aqueous based product instead of solvent based product. Specific requirements for SB 14 can be found in Health and Safety Code Sections 25244.12–25244.24 and Title 22, California Code of Regulations Sections 67100.0–67100.14. The primary goal of requiring companies to review and incorporate source reduction practices is to promote public health and safety and to improve environmental quality. However, source reduction can also help businesses avoid future liabilities, become more competitive, and efficient in their use of resources. While source reduction measures typically reduce waste treatment, disposal, liability, or recycling expenses, they may also have other cost savings/efficiency implications by preventing losses of raw materials, water and/or energy. The premise underlying SB 14 is that once companies thoughtfully consider source reduction alternatives they will implement source reduction measures because of long-term economic benefit. SB 14 documents reviewed for this report cover the period 1994 through 2002 with the most recent reporting year represented being 1998. The reviewed documents included 1998 Source Reduction Plans (Plan) covering four year period 1999-2002 and Management Performance Reports (Performance Report) retrospectively discussing the period 1994-1998. The future-oriented Plan must include information about the facility’s operations including production process overview descriptions and waste generation data for the most recent reporting year. Plans must also identify potential source reduction alternatives for the significant sources which produce “major” (above five percent by weight) routinely generated waste streams. The Plan explains the rationale for determining measure feasibility by considering specific criteria related to economics, waste reduction potential, technical considerations, air, water, or land impacts, and health and safety implications for each potentially feasible source reduction alternative.
3
For feasible options, the Plan includes a schedule for implementing selected measures, and expresses a source reduction goal (percentage) that serves as a target that could be reached over the four year period under optimal conditions. The retrospective Report discusses waste management practices (waste stream disposition) for the reporting year and also describes past experience with source reduction measures, change in waste management methods, production, and other factors that have affected routine waste stream generation since the reporting year for the previous Report. A third document, the Summary Progress Report (SPR) summarizes key data and major waste stream information spanning eight years. For this 1998 SPR, it covers the 1994-2002 period. The source reduction accomplishment and projection data are entered directly from the generators’ previously prepared Plans and Reports. The SPR also summarizes generators total hazardous waste quantities for year 1994 and 1998. Starting September 1, 1999 and every four subsequent years, the SB 14 generators are required to prepare and submit their SPR to DTSC. Out of the three SB 14 documents, the SPR is the only SB 14 document that must be submitted to DTSC. SB 14 requires DTSC to select two categories of generators by Standard Industrial Classification (SIC) code every two years for source reduction planning assessment. As part of this assessment, request letters were sent to major California refineries operating under SIC code 2911 during 2000-01 requesting SB 14 documents for technical and completeness review. DTSC selected the California Refinery/Petroleum Industry for source reduction planning and assessment during fiscal years 1990-1991 and 1994-1995. This is the third California refinery/petroleum industry assessment report.
4
II. INTRODUCTION This report reflects the results of examining source reduction planning documents from 17 of California’s largest petroleum refineries. This is the third SB 14 assessment report of the refining industry. The petroleum refining industry is one of California’s largest industries. In 1997, it processed nearly 100 million tons (635 million barrels) of crude feed stocks, while producing more than 48 million tons (374 million barrels) of gasoline in addition to diesel, jet fuel, fuel oil, liquefied petroleum fuel gas, lubricants, and a wide variety of petrochemical feedstocks. The petroleum refinery industry is also California’s largest hazardous waste generator. California’s 17 largest petroleum refineries reported generating more than fourteen million tons of aqueous or Category A (discharged to a public sewer) and 133,000 tons of nonaqueous or Category B hazardous waste (shipped from the generator via a manifest) in 1998. As DTSC staff began to develop the refinery source reduction efforts, they found some refineries had processes or operations occurring at different sites that were in close physical proximity. For example, a refinery may have its marine terminal storage site and its crude processing plant separated from the main refinery operation that produces finished products. Each location may have a unique EPA Identification Number. Due to this association, a complete facility source reduction effort required gathering available information on all affiliated sites. In order to present the reader with a complete and consistent picture of this type of multi-part facility, DTSC organized the associated entities as one unit, presenting the source reduction information for each plant separately, while including totals for the combined facility. In this report, DTSC has gathered information on these refineries using their Hazardous Waste Source Reduction documents, prepared under SB 14. Due to the existence of multi-part facilities as discussed above, the 17 refineries reported comprised 21 sites. Over the last few years several refineries went through name changes due to merger and/or acquisition. The refineries names used herein are current as of April 15, 2002. This report focuses on individual refinery activities to reduce their hazardous waste generation through source reduction efforts. In addition to other information such as comparison of 1994 versus 1998 aqueous (Category A) and nonaqueous (Category B) hazardous waste generation data, three prevalent waste streams (oil/water separator sludge, aqueous solution with total organic residues less than ten percent, and spent catalyst) data are also included. DTSC has presented all data without alteration or interpretation, whenever possible. The only modifications were applied to raw data where units reported were standardized for consistency.
5
During the past two SB 14 cycles (reporting years 1990 and 1994), the California petroleum refining industry reduced its hazardous waste by more than 30 percent during each cycle. The industry reported in 1998 that it was able to reduce seven percent of their aqueous (Category A) and nonaqueous (Category B) combined waste generation from 1994 to 1998 period.
6
III. HAZARDOUS WASTE SOURCE REDUCTION This chapter provides a summary of each individual refinery’s major waste streams generated in the 1994 and 1998 calendar years, and source reduction activities projected over the last four years since 1998.
Chevron Products Company, Richmond Refinery
Chevron Richmond’s major waste streams are discussed in this section. The facility’s Senate Bill 14 (SB 14) documents (Source Reduction Evaluation Review and Plan, Hazardous Waste Management Performance Report, and Summary Progress Report) submitted to the Department of Toxic Substances Control (DTSC) were used to present the hazardous waste source reduction activities implemented by the facilities.
A. Summary of Major Waste Streams
The major waste streams generated at the Chevron Richmond Refinery include:
• API separator sludge generated during the separation of solids from refinery process waters at the API separators. Tank water draw solids, rust, scale, and other process equipment contaminants, as well as soils from run-off, make up this waste stream.
• Primary and secondary sludge generated when solids from various process equipment, such as tanks and process units, enter the process wastewater system and are removed prior to entering the API separators. Secondary sludge is generated after flocculants are added to an oil/water emulsion following primary treatment to aid in the further separation of oil, water, and solids from the waste stream.
• Spent refining catalyst is generated from processes that treat, crack or reform hydrocarbon streams by passing these streams over a metal-impregnated catalyst. The metals, present in the catalysts enable them to achieve the necessary reactions, cause the catalysts to be hazardous when spent.
• Spent activated carbon is recovered downstream of desalter during the treatment of desalter effluent. In the desalter, crude feed is washed with water to remove salts and sediments. The crude is then separated from the wash water (effluent). This effluent must then be treated to remove dissolved hydrocarbons (primarily benzene). Chevron Richmond uses granular activated carbon units in the final stage of effluent treatment to remove the benzene in the wash effluent. Captured benzene and other hydrocarbons may render the spent carbon hazardous.
7
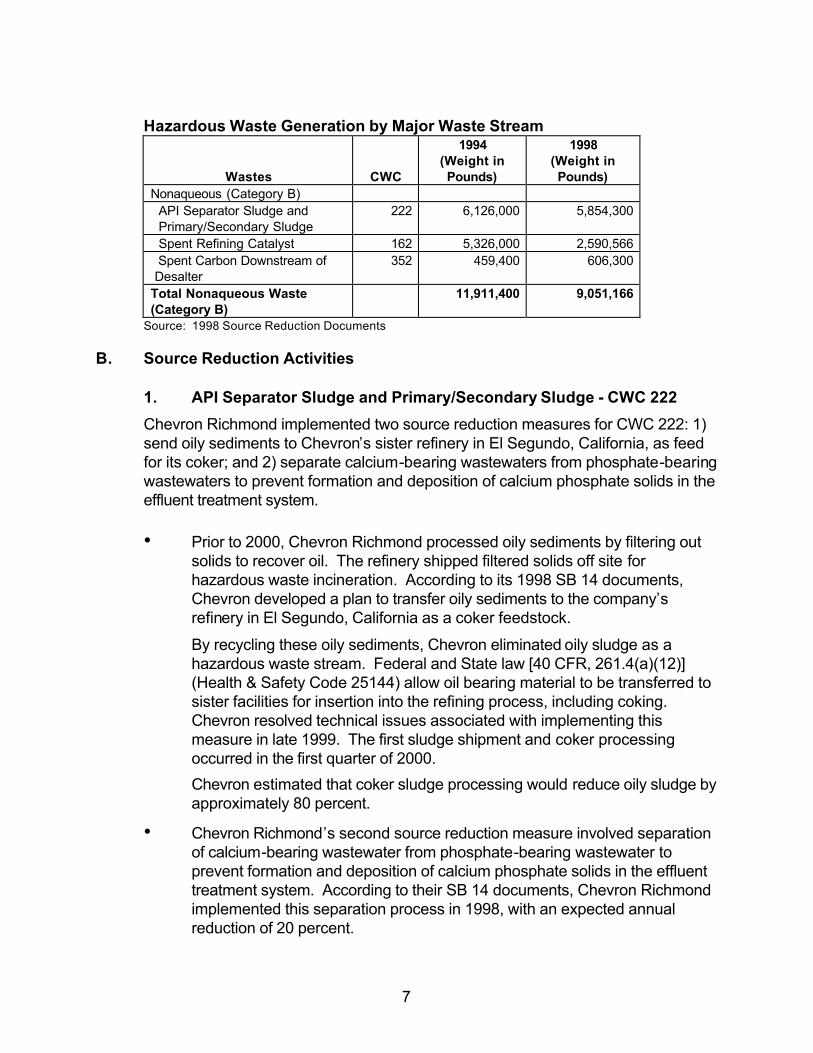
Hazardous Waste Generation by Major Waste Stream
Wastes
CWC
1994 (Weight in Pounds)
1998 (Weight in Pounds)
Nonaqueous (Category B) API Separator Sludge and Primary/Secondary Sludge
222 6,126,000 5,854,300
Spent Refining Catalyst 162 5,326,000 2,590,566 Spent Carbon Downstream of Desalter
352 459,400 606,300
Total Nonaqueous Waste (Category B)
11,911,400 9,051,166
Source: 1998 Source Reduction Documents
B. Source Reduction Activities
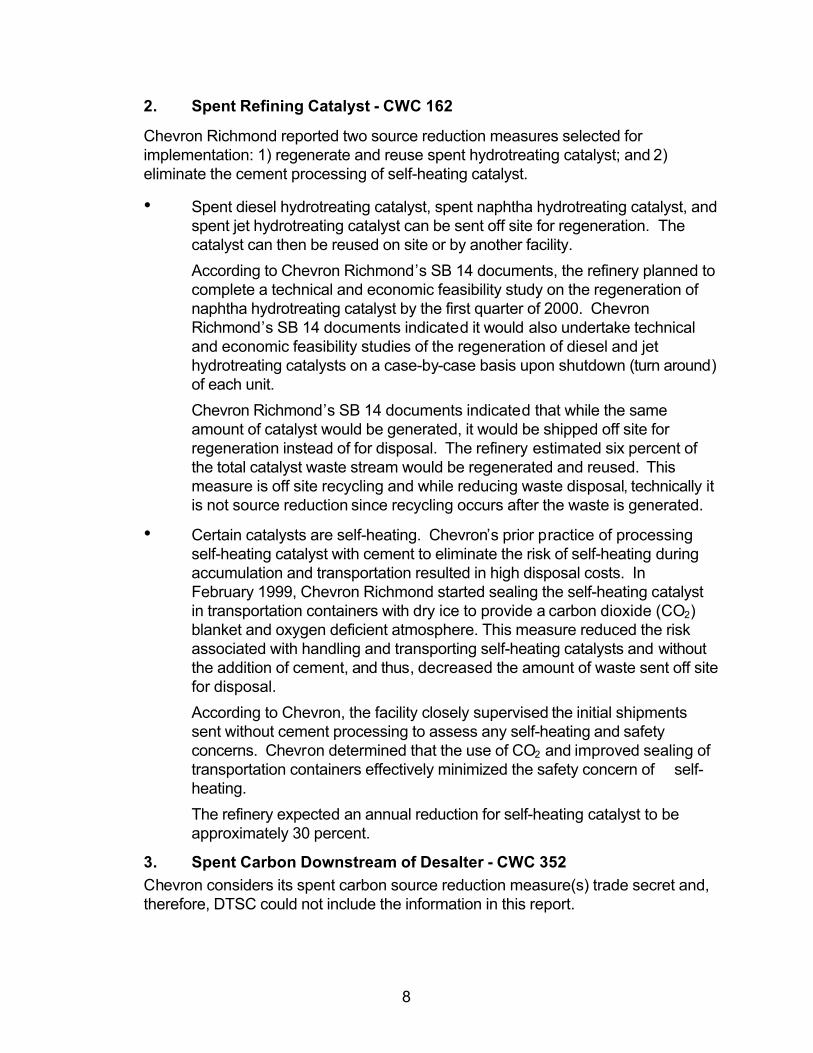
1. API Separator Sludge and Primary/Secondary Sludge - CWC 222
Chevron Richmond implemented two source reduction measures for CWC 222: 1) send oily sediments to Chevron’s sister refinery in El Segundo, California, as feed for its coker; and 2) separate calcium-bearing wastewaters from phosphate-bearing wastewaters to prevent formation and deposition of calcium phosphate solids in the effluent treatment system.
• Prior to 2000, Chevron Richmond processed oily sediments by filtering out
solids to recover oil. The refinery shipped filtered solids off site for hazardous waste incineration. According to its 1998 SB 14 documents, Chevron developed a plan to transfer oily sediments to the company’s refinery in El Segundo, California as a coker feedstock.
By recycling these oily sediments, Chevron eliminated oily sludge as a hazardous waste stream. Federal and State law [40 CFR, 261.4(a)(12)] (Health & Safety Code 25144) allow oil bearing material to be transferred to sister facilities for insertion into the refining process, including coking. Chevron resolved technical issues associated with implementing this measure in late 1999. The first sludge shipment and coker processing occurred in the first quarter of 2000.
Chevron estimated that coker sludge processing would reduce oily sludge by approximately 80 percent.
• Chevron Richmond’s second source reduction measure involved separation of calcium-bearing wastewater from phosphate-bearing wastewater to prevent formation and deposition of calcium phosphate solids in the effluent treatment system. According to their SB 14 documents, Chevron Richmond implemented this separation process in 1998, with an expected annual reduction of 20 percent.
8
2. Spent Refining Catalyst - CWC 162
Chevron Richmond reported two source reduction measures selected for implementation: 1) regenerate and reuse spent hydrotreating catalyst; and 2) eliminate the cement processing of self-heating catalyst.
• Spent diesel hydrotreating catalyst, spent naphtha hydrotreating catalyst, and spent jet hydrotreating catalyst can be sent off site for regeneration. The catalyst can then be reused on site or by another facility.
According to Chevron Richmond’s SB 14 documents, the refinery planned to complete a technical and economic feasibility study on the regeneration of naphtha hydrotreating catalyst by the first quarter of 2000. Chevron Richmond’s SB 14 documents indicated it would also undertake technical and economic feasibility studies of the regeneration of diesel and jet hydrotreating catalysts on a case-by-case basis upon shutdown (turn around) of each unit.
Chevron Richmond’s SB 14 documents indicated that while the same amount of catalyst would be generated, it would be shipped off site for regeneration instead of for disposal. The refinery estimated six percent of the total catalyst waste stream would be regenerated and reused. This measure is off site recycling and while reducing waste disposal, technically it is not source reduction since recycling occurs after the waste is generated.
• Certain catalysts are self-heating. Chevron’s prior practice of processing self-heating catalyst with cement to eliminate the risk of self-heating during accumulation and transportation resulted in high disposal costs. In February 1999, Chevron Richmond started sealing the self-heating catalyst in transportation containers with dry ice to provide a carbon dioxide (CO2) blanket and oxygen deficient atmosphere. This measure reduced the risk associated with handling and transporting self-heating catalysts and without the addition of cement, and thus, decreased the amount of waste sent off site for disposal.
According to Chevron, the facility closely supervised the initial shipments sent without cement processing to assess any self-heating and safety concerns. Chevron determined that the use of CO2 and improved sealing of transportation containers effectively minimized the safety concern of self-heating.
The refinery expected an annual reduction for self-heating catalyst to be approximately 30 percent.
3. Spent Carbon Downstream of Desalter - CWC 352 Chevron considers its spent carbon source reduction measure(s) trade secret and, therefore, DTSC could not include the information in this report.
9
Martinez Refining Company (MRC) A Division of Equilon Enterprises, LLC
The major waste streams are discussed in this section. The facility’s 1994 and 1998 SB 14 documents submitted to the DTSC were used to discuss the hazardous waste source reduction activities implemented by MRC.
A. Summary of Major Waste Streams
MRC’s major waste streams reported in their 1994 SB 14 documents were oil/water separator sludge, process water to biotreater, and equipment cleanout. MRC’s major waste streams reported in their 1998 SB 14 documents were process water to biotreater, oil/water separator sludge, and filter cake with selenium/vanadium.
• Oil/Water Separator Sludge (CWC 222). Process wastewater consisting of storm water and oily wastewater is treated onsite by MRC’s Effluent Treatment Plant (ETP). The ETP contains a set of parallel wastewater treatment trains, ETP-1 and ETP-2. Each train contains a pair of dissolved nitrogen flotation (DNF) units. The DNF units remove oil and solids from the process wastewater as part of the normal ETP treatment. The solids from the DNF units, referred to as Oil/Water Separator Sludge or Dissolved Air Flotation (DAF) float and contains approximately 90 percent water. The Oil/Water Separator Sludge is removed from the DNF units and sent to MRC’s carbon monoxide (CO) boilers for onsite incineration. The CO boilers are permitted under a RCRA hazardous waste facility permit.
• Process Water to Biotreater (CWC 134). Process wastewater containing oil from MRC’s Light Oil Processing (LOP) facility, Clean Fuels Units, Delayed Coking Unit, and other wastewater is treated at MRC’s ETP. At the ETP a pair of DNF units initially treats the process wastewater. After DNF treatment, the process wastewater is treated by the ETP-2 activated sludge unit and ETP-2 Aeration Tank. The aeration tank is permitted under DTSC’s Permit by Rule program. After activated sludge treatment, the treated wastewater is discharged to the Carquinez Strait, as permitted by MRC’s National Pollutant Discharge Elimination System (NPDES) discharge permit.
• Filter Cake with Selenium/Vanadium (CWC 181). Treated wastewater from MRC’s ETP-1 and ETP-2 activated sludge units is pumped to the Selenium Precipitation Unit (SPU), which removes soluble selenium from the wastewater using a ferric chloride precipitation process. The ferric chloride precipitate is dewatered using a belt press filter. The filter cake contains selenium and vanadium, and is sent offsite for disposal at the SafetyKleen, Incorporated hazardous waste landfill in Buttonwillow, California.
• Equipment Cleanout (CWC 223). This waste is generated from periodic cleaning of oil containing equipment. Also, this oil-containing waste stream is generated from process waste water treatment.
10
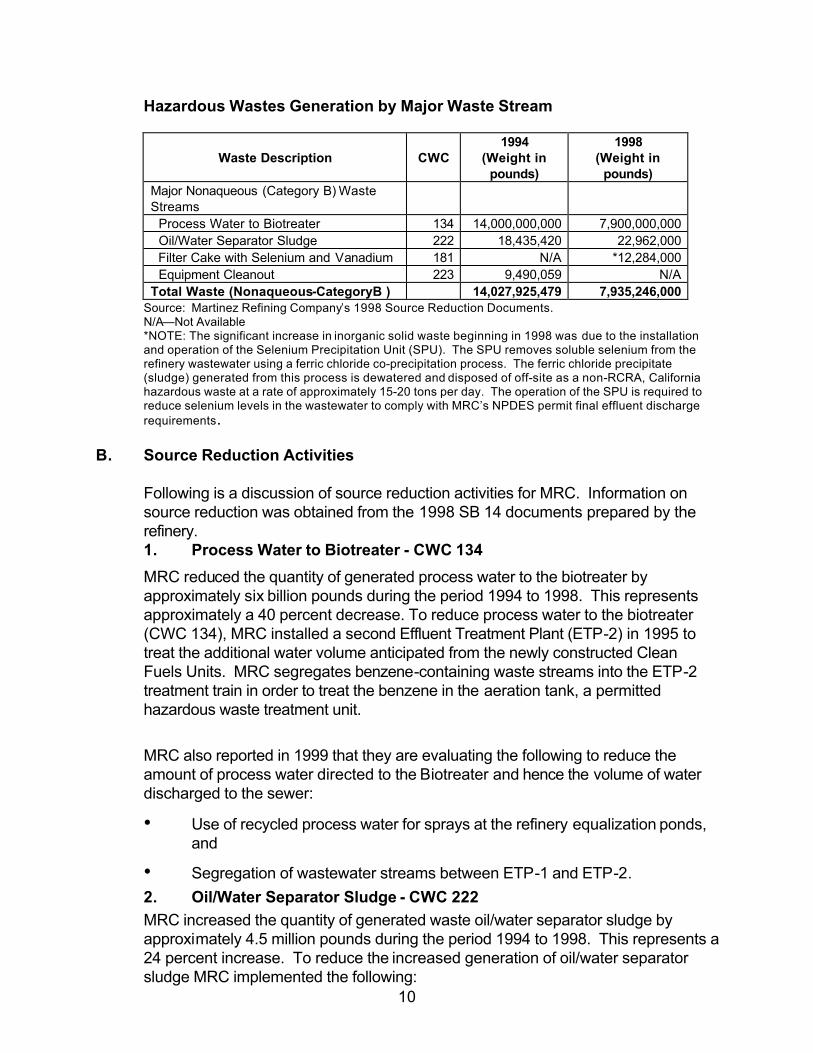
Hazardous Wastes Generation by Major Waste Stream
Waste Description
CWC
1994 (Weight in
pounds)
1998 (Weight in
pounds) Major Nonaqueous (Category B) Waste Streams
Process Water to Biotreater 134 14,000,000,000 7,900,000,000 Oil/Water Separator Sludge 222 18,435,420 22,962,000 Filter Cake with Selenium and Vanadium 181 N/A *12,284,000 Equipment Cleanout 223 9,490,059 N/A Total Waste (Nonaqueous-CategoryB ) 14,027,925,479 7,935,246,000
Source: Martinez Refining Company’s 1998 Source Reduction Documents. N/A—Not Available *NOTE: The significant increase in inorganic solid waste beginning in 1998 was due to the installation and operation of the Selenium Precipitation Unit (SPU). The SPU removes soluble selenium from the refinery wastewater using a ferric chloride co-precipitation process. The ferric chloride precipitate (sludge) generated from this process is dewatered and disposed of off-site as a non-RCRA, California hazardous waste at a rate of approximately 15-20 tons per day. The operation of the SPU is required to reduce selenium levels in the wastewater to comply with MRC’s NPDES permit final effluent discharge requirements .
B. Source Reduction Activities
Following is a discussion of source reduction activities for MRC. Information on source reduction was obtained from the 1998 SB 14 documents prepared by the refinery. 1. Process Water to Biotreater - CWC 134
MRC reduced the quantity of generated process water to the biotreater by approximately six billion pounds during the period 1994 to 1998. This represents approximately a 40 percent decrease. To reduce process water to the biotreater (CWC 134), MRC installed a second Effluent Treatment Plant (ETP-2) in 1995 to treat the additional water volume anticipated from the newly constructed Clean Fuels Units. MRC segregates benzene-containing waste streams into the ETP-2 treatment train in order to treat the benzene in the aeration tank, a permitted hazardous waste treatment unit.
MRC also reported in 1999 that they are evaluating the following to reduce the amount of process water directed to the Biotreater and hence the volume of water discharged to the sewer:
• Use of recycled process water for sprays at the refinery equalization ponds, and
• Segregation of wastewater streams between ETP-1 and ETP-2. 2. Oil/Water Separator Sludge - CWC 222 MRC increased the quantity of generated waste oil/water separator sludge by approximately 4.5 million pounds during the period 1994 to 1998. This represents a 24 percent increase. To reduce the increased generation of oil/water separator sludge MRC implemented the following:
11
• Coating, Guniting, and Curbing: From 1994 to1998, MRC coated, gunited and curbed areas throughout the refinery complex to better contain oil/water waste. Asphalt coating and paving, guniting, and landscaping bare areas throughout MRC reduced the amount of sediment entering the sewer system. In addition, MRC found that gunite surfaces improve the ability of facility personnel to detect oil pipeline leaks in pipe rows. Asphalt curbs were constructed in high water runoff areas to divert and dike solids. MRC planned to continue this program.
• Reduce Oil Discharges: MRC installed sample stations with recycle loops that effectively keep oil from entering the sewer. Since 1993, the refinery installed more than 65 fast loop sample stations to reduce the amount of light hydrocarbon range material entering the sewers.
• Street Sweeping Program and Sand Pile Relocation: Much of the material entering the sewer system comes from sediments accumulated in parking lots and on paved roadways throughout the MRC facility. The facility began annual removal of this sediment by a street sweeper prior to the rainy season. MRC plans to continue this practice as sediment removal significantly reduces the introduction of these solids into the sewer.
Sand piles were also moved to more protected areas or eliminated to further reduce sediment load to the sewer.
• Crude Oil Desalter Units: In 1997, MRC installed two additional Crude Oil Desalter Units (Desalters). The function of the Desalters is to extract salt and remove solids from the crude oil prior to refinery processing. The Desalters “wash” the crude oil using fresh water. Additional desalting capacity improves this “washing” by increasing the residence and contact time of the oil and water. This also reduces the amount of oil carry-under that enters the process sewer.
• Oil Recovery at the Delayed Coking Unit: MRC reported that the refinery achieved significant waste reduction in oil/water separator sludge by preparing and feeding the Delayed Coking Unit (DCU) solids from the Effluent Treatment Plant (API Solids, Gross Oil Separator Solids, etc.).
• Oil Interception Prior to Treatment: MRC reported improvement in its oil recovery operations. In 1996, the refinery constructed process water tanks as part of its Clean Fuels Expansion. The process water tanks effectively intercept the oil/water prior to its introduction into the Effluent Treatment Plant. As reported above, MRC constructed two additional crude oil desalter units that resulted in improved oil recovery. The additional units provide a greater residence time between the oil and water phases in the units, thus improving the likelihood of better oil and water separation. Finally MRC introduced a three-phase centrifuge which has helped to decrease both solids and oil effluent residuals prior to discharge.
MRC also began using vacuum trucks to consistently transport oil to oil
12
recovery facilities rather than using the sewers. In addition, MRC trained its employees to improve awareness of all the methods MRC has employed to reduce oil discharges to the sewer and hence ensure these systems are adequately maintained.
3. Filter Cake with Selenium/Vanadium - CWC 181
MRC did not generate this waste stream in 1994. MRC’s current NPDES permit requires treatment of wastewaters to achieve discharge compliance for selenium and vanadium. This wastewater treatment results in the production of hazardous filter cake containing selenium and vanadium. MRC first reported generating this waste stream in 1998. To reduce the generation of hazardous filter cake MRC implemented the following:
• Optimize Chemical Usage: MRC is evaluating improvements to selenium removal using the co-precipitation process, which is dependent upon the addition of several chemicals. The optimization of ferric chloride dosage, the control of pH using sodium hydroxide and sulfuric acid, and the better understanding of the role that phosphates play in selenium removal would each be evaluated. In addition, MRC made improvements for parameter monitoring to better understand and track the selenium removal process.
• Reduce Water Volume: The effectiveness of selenium removal using the co-precipitation process depends on the total water volume treated. MRC was evaluating more effective regulation of selenium containing wastewater streams to achieve optimum treatment. Likewise, these evaluations will improve MRC’s understanding of which streams do not need to be treated due to low selenium content.
• Obtain NPDES Permit Limit Relief: MRC reported it is required to meet both an NPDES concentration limit and an NPDES mass discharge limit for selenium. This resulted in the production of additional filter cake sludge. MRC planned to request relief from this concentration limit from the San Francisco Bay Regional Water Quality Control Board.
4. Equipment Cleanout - CWC 223 MRC reported that the following measures were implemented to effectively eliminate the generation of oil/water separator sludge from equipment cleaning operations.
• Improved follow-up hazardous waste characterization testing showed many equipment cleanout solids were consistently nonhazardous.
• Improved source control resulted in lower benzene concentrations in certain process wastewater streams. MRC’s 1999 SB 14 document did not specify which waste streams were involved.
• MRC installed a three-phase centrifuge in the oil recovery operations. The three-phase centrifuge provides enhanced oil recovery (and hence, less toxic constituents are imparted to the equipment cleanout solids), decreased
13
solids to the sewer, and decreased water content of waste thus resulting in less generated hazardous waste weight.
• Reduce High Solids Input Streams: MRC performed sewer waste stream surveys to quantify solids levels and evaluate solids reduction approaches.
• Return Low Solids Streams to Generating Processes. MRC increased its frequency of returning laboratory samples back to the sampled processes producing these wastes rather than sending them to the recovered oil system. MRC’s 1999 SB 14 document did not state how often this occurs.
14
Tosco Refining Company San Francisco Refinery at Rodeo Tosco Refining Company San Francisco Carbon Plant
The major waste streams of these Tosco facilities are discussed in this section. The facilities’ SB 14 documents submitted to the DTSC were used to discuss the hazardous waste source reduction activities implemented by the facilities.
A. Summary of Major Waste Streams
1. Tosco San Francisco Refinery The major waste streams generated by the Tosco Refinery were spent Stretford solution, spent catalyst, off-grade sulfur, industrial trash, oil/water separator sludge, and tank bottoms.
• Spent Stretford Solution: This waste stream was generated at the Beavon-Stretford Plant which removed any remaining hydrogen sulfide from the tail gas coming from the Claus Plant of the sulfur recovery units. The Beavon-Stretford Plant used Stretford Solution, which absorbed the hydrogen sulfide, and conversion byproducts such as thiosulfates which gradually accumulated in the Stretford Solution, subsequently fouling the solution.
• Spent Catalyst lost its overall reactivity and failed to perform as designed. In the petroleum refinery, catalytic refining units are used to treat hydrocarbon streams to remove components such as sulfur and nitrogen, and to “crack” or “reform” the original hydrocarbon into hydrocarbon compounds that are more desirable fuel feedstocks.
• Off-Grade Sulfur was also produced in the Beavon-Stretford Plant, when hydrogen sulfide in the offgas from the Claus Plant was oxidized to elemental Sulfur. In the Beavon-Stretford Plant, sulfur was removed from the Stretford Solution by Verti-Press filters. When sulfur is not repeatedly washed, an off-grade sulfur containing hazardous concentrations of vanadium is produced.
• The industrial trash waste stream was made up of many components such as soil, debris, rags, personal protective equipment, sweepings, sludge, filters, sand, and sandblast media.
• Oil/Water Separator Sludges were generated from water treatment units and sumps.
• Tank bottoms were generated from routine tank cleaning operations.
15
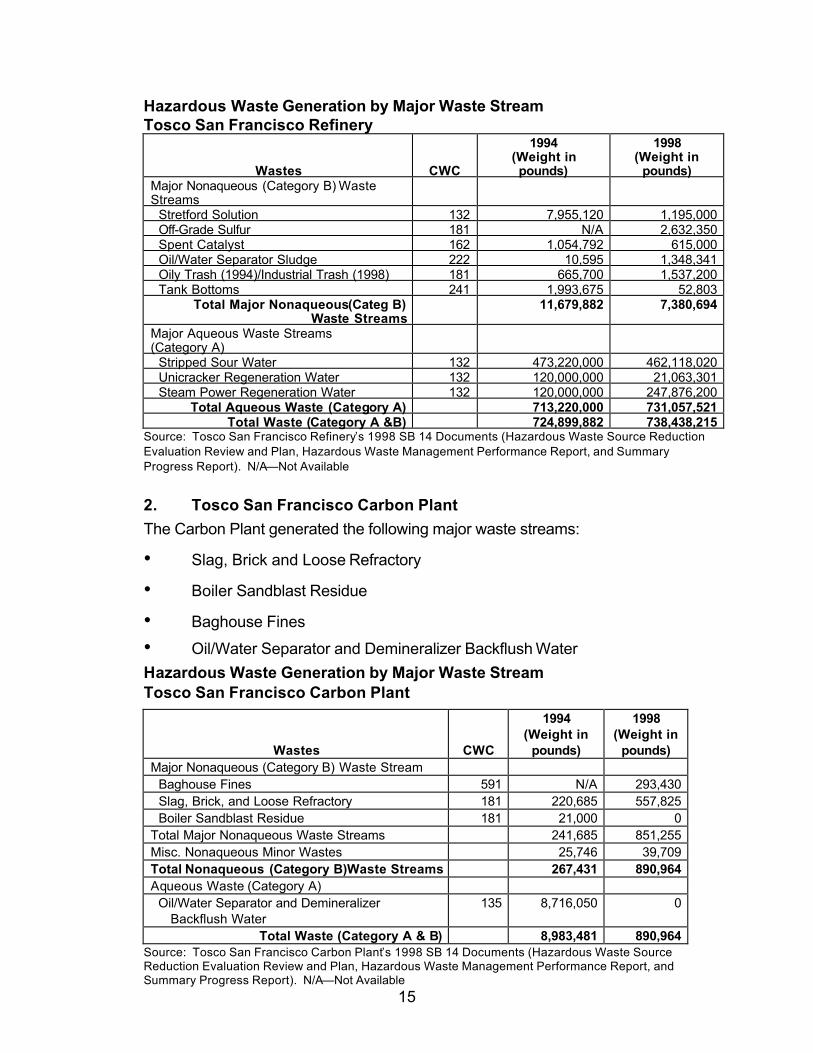
Hazardous Waste Generation by Major Waste Stream Tosco San Francisco Refinery
Wastes
CWC
1994 (Weight in pounds)
1998 (Weight in
pounds) Major Nonaqueous (Category B) Waste Streams
Stretford Solution 132 7,955,120 1,195,000 Off-Grade Sulfur 181 N/A 2,632,350 Spent Catalyst 162 1,054,792 615,000 Oil/Water Separator Sludge 222 10,595 1,348,341 Oily Trash (1994)/Industrial Trash (1998) 181 665,700 1,537,200 Tank Bottoms 241 1,993,675 52,803
Total Major Nonaqueous(Categ B) Waste Streams
11,679,882 7,380,694
Major Aqueous Waste Streams (Category A)
Stripped Sour Water 132 473,220,000 462,118,020 Unicracker Regeneration Water 132 120,000,000 21,063,301 Steam Power Regeneration Water 132 120,000,000 247,876,200
Total Aqueous Waste (Category A) 713,220,000 731,057,521 Total Waste (Category A &B) 724,899,882 738,438,215
Source: Tosco San Francisco Refinery’s 1998 SB 14 Documents (Hazardous Waste Source Reduction Evaluation Review and Plan, Hazardous Waste Management Performance Report, and Summary Progress Report). N/A—Not Available
2. Tosco San Francisco Carbon Plant The Carbon Plant generated the following major waste streams:
• Slag, Brick and Loose Refractory
• Boiler Sandblast Residue
• Baghouse Fines
• Oil/Water Separator and Demineralizer Backflush Water Hazardous Waste Generation by Major Waste Stream Tosco San Francisco Carbon Plant
Wastes
CWC
1994 (Weight in
pounds)
1998 (Weight in
pounds) Major Nonaqueous (Category B) Waste Stream Baghouse Fines 591 N/A 293,430 Slag, Brick, and Loose Refractory 181 220,685 557,825 Boiler Sandblast Residue 181 21,000 0 Total Major Nonaqueous Waste Streams 241,685 851,255 Misc. Nonaqueous Minor Wastes 25,746 39,709 Total Nonaqueous (Category B)Waste Streams 267,431 890,964 Aqueous Waste (Category A) Oil/Water Separator and Demineralizer Backflush Water
135 8,716,050 0
Total Waste (Category A & B) 8,983,481 890,964 Source: Tosco San Francisco Carbon Plant’s 1998 SB 14 Documents (Hazardous Waste Source Reduction Evaluation Review and Plan, Hazardous Waste Management Performance Report, and Summary Progress Report). N/A—Not Available
16
B. Source Reduction Activities
Following is a discussion of source reduction activities for both the Tosco Refinery and Carbon Plant. Information on source reduction was obtained from the 1998 SB 14 documents prepared by the facilities. 1. Tosco San Francisco Refinery According to the Tosco Refinery’s 1998 SB 14 documents, source reduction activities were implemented for the following waste streams:
a. Stretford Solution - CWC 132 Before 1994, Stretford Solution was continuously purged from the sulfur recovery process trains in order to maintain the thiosulfate concentration at levels below the level where the Stretford Solution loses its catalytic (H2S to elemental sulfur) effectiveness. These purges generated approximately 20,000 gallons of spent Stretford Solution per week. In 1994, the Tosco Refinery generated a total of 7,955,120 pounds of this Solution. According to the Tosco Refinery’s 1998 SB 14 documents, the Stretford Solution is no longer continuously purged. Before the thiosoulfate concentration increased beyond usable levels, the Solution was regenerated using the Global Modified System by converting sodium thiosulfate to sodium sulfate, and then removing the sodium sulfate from solution. The annual average generation rate from 1995 to 1998 was 1,195,000 pounds.
In 1998, Tosco Refinery’s SB 14 document listed alternatives being considered and evaluated for economic feasibility to further reduce their wastes. The considered alternatives were:
• Improve mixing operations: Optimal mixing operations of the Stretford storage tank would reduce the necessity for, and thus the frequency of, tank cleaning. Tank cleanings generate large quantities of Stretford Solution and Stretford-contaminated washwaters.
• Improve operation of filters: Optimizing filter operations would reduce the amount of solid sulfur depositing in the Stretford storage tank and would, therefore, reduce tank cleaning frequency.
• Substitute Modified Stretford process for existing Stretford process: In the Modified Stretford process, sodium sulfates will be produced as a byproduct instead of sodium thisulfates, which foul the Stretford Solution. Waste Stretford Solution would no longer be generated. It has not been determined if other hazardous waste streams would be generated.
• Evaluate RUST Process: The RUST process is a mobile treatment process that can be brought onsite to remove vanadium from either Stretford Solution or Stretford-contaminated washwaters. By removing vanadium, these liquids would no longer be classified as hazardous.
17
• Increase Evaporative Capacity: Water balance in the Stretford trains has been maintained by evaporative coolers (mini-cooling towers). The Claus reaction and the Verti-Press add water during normal operation. If more water is added than can be evaporated by the coolers, then it is necessary to purge Stretford Solution from the system for inventory control. Thus, by increasing evaporative capacity, less Stretford Solution will need to be purged for inventory control. During the winter, the coolers have marginal evaporative capacity.
• Increase conversion in the upstream Claus units: Improved conversion of hydrogen sulfide into elemental sulfur in the Claus gas processing units upstream of the Stretford gas processing units would reduce the amount of hydrogen sulfide in the sour gas feed to the Stretford units. If such improved conversion could be achieved, then the hydrogen sulfide loading to the Stretford units could potentially be decreased, reducing plugging in the absorbers and the frequency of absorber cleanings. However, changing the conversion rates in the Claus units would have significant operating effects both upstream and downstream of the units, and more in depth study concerning the probable changes in operating conditions would be required.
• Substitute the Shell Claus OffGas Treating (SCOT) process or other liquid redox processes, such as the Sulferox, LoCat, Sulfolin, or Hiperion processes, for the Stretford process: The Stretford process has generated large quantities of both liquid and solid wastes that are hazardous due to their vanadium content. One alternative would be to treat the Claus tail feed gas using a technology called the SCOT process. In this process, the Claus feed gas becomes heated and flows through a catalyst bed where the sulfur compounds is substantially reduced to hydrogen sulfide. Then, a heat recovery system and quench tower cool the gas before an amine absorber removes the hydrogen sulfide from the gas stream. The process is fully continuous and provides 99.7 percent sulfur recovery on Claus Plant intake. Substitution of an iron-based process such as the Sulferox or LoCat processes would eliminate the environmental concerns associated with the vanadium content in the Stretford waste streams. Substitution of other processes for the Stretford process would necessarily entail a complete reengineering of the Sulfur Recovery Units, and had not been seriously considered as of the 1999 SB 14 document submission to DTSC.
• Investigate DOW process for recovering anthraquinone disulfonic acid
(ADA) and vanadium from Stretford Solution: This patented process recovers ADA and vanadium from Stretford Solution. The recovery process includes the unit operations of filtration, adsorption (for ADA recovery), and ion exchange (for vanadium recovery) operating on a semi-continuous cycle. The effluent can be oxidized, if necessary, to remove thiosulfates and then discharged to the sewer system. ADA and vanadium are regenerated using
18
a caustic solution. This process can recover up to about 95 percent of the ADA and 85 percent of the vanadium for return to the Stretford balance tank. This alternative had been previously considered by the Tosco Refinery, but was not pursued. One concern was that the new process might generate a greater quantity of waste than the current (1999) method.
b. Off-Grade Sulfur - CWC 181 In 1994, Off-Grade Sulfur was shipped off site as part of the Stretford Solids waste stream. As a result of the change in management of the Stretford Solution, these waste streams were no longer combined, and Off-Grade Sulfur became a separate major waste stream. In 1998, the Tosco Refinery reported having generated 2,632,350 pounds of this waste.
In the 1998 SB 14 document, the Tosco Refinery reported that the facility was considering optimizing operation of its Verti-Press filters (discussed above under Stretford Solution), which would not only reduce the Stretford Solution waste stream, but would also reduce the amount of Off-Grade Sulfur.
c. Spent Catalyst - CWC 162 Spent catalysts were periodically removed from various refinery processes during turnarounds and replaced with new or regenerated catalysts. Source reduction measures implemented included catalyst substitution and monitoring.
Because of catalyst substitution, the runtime between change outs in the Unicracker would be expected to double from 2½ years to 5 years, thus reducing the generation rate of catalyst by 70,000 pounds every 2½ years. In the Sulfur Adsorber Unit, the Tosco Refinery reported using copper-zinc adsorbent, which has an operating lifetime of 8 years compared with previous catalysts used which averaged a lifetime of less than 3 years. In their Hydrocracker Unit, the Tosco Refinery started using lower density catalysts, which reduced waste generation by 25 percent.
Instead of changing catalysts during unit turnaround on their zinc-oxide drums, Tosco implemented a monitoring system to trigger specifically when the catalyst needed to be changed. The Tosco Refinery estimated that the catalyst would need to be changed every 4-5 years, rather than every 2½ to 3 years.
The Tosco Refinery generated 1,054,000 pounds of spent catalyst in 1994. For the years 1995-1998, it generated an annual average of 615,000 pounds. For the next four years (1999-2002), the Tosco Refinery reported that it is evaluating the following source reduction measures:
• Use new and improved catalysts to lengthen unit runtimes between change outs: The Tosco Refinery already used a higher activity, more robust catalyst in their Unicracker Unit. The company is evaluating the use of similar catalysts on other units such as the Reformer, which they expect could reduce the waste generated from these units by 50 percent.
• Maximize unit runtimes: Because the Tosco Refinery has been successful in maximizing unit runtimes in their zinc-oxide drums through a monitoring system, which triggers the need for catalyst change, the company is
19
evaluating implementation of the same monitoring system at other operating units. The Tosco Refinery expects a reduction of 50 percent on spent catalysts generated from monitored units.
• Substitute lower density catalysts: As discussed above, lower density catalysts can reduce the weight of spent catalyst by 25 percent. The Tosco Refinery plans to expand the use of these lower density catalysts to other units.
• Regenerate and/or reuse catalysts: The Tosco Refinery has been attempting to regenerate or reuse catalyst whenever possible. For example, at Unit 240 Reactors D-201A and D-201B, the spent catalyst is not disposed, but regenerated off site and reused in other operating units. At the Tosco Refinery, these operating units include the naphtha and diesel hydrotreaters. Thus, source reduction occurs because new catalyst is not used in the hydrotreaters. Regeneration and/or reuse of spent catalysts may therefore be implemented at other operating units.
d. Oil/Water Separator Sludges - CWC 222 Oil/Water Separator Sludge can result from nonhazardous solids that enter the process sewer system. To minimize nonhazardous solids that enter the process sewer system, the Tosco Refinery implemented a street-sweeping program, constructed a sediment catch basin with the objective of capturing erosion solids, and implemented an erosion control program. The Tosco Refinery will continue with these solids control programs. The Tosco Refinery also plans to re-institute other solids controls including construction of additional sediment catch basins and/or runoff trenches; maintenance of sediment catch basins, pipe trenches, and other drainage structures; street sweeping; unit vacuuming; and erosion control (paving surfaces, oiling surfaces, controlling weeds, and planting vegetation). The Tosco Refinery will evaluate the economic feasibility of solids control in the tank block areas such as connecting roof drains to sewer basins (for clean-outs) located at the base of each tank, constructing sediment traps around tank block drains, constructing risers/weirs around tank block drains, installing sediment traps within tank block drains, and paving or oiling tank block sediments.
The Tosco Refinery reported generating 10,595 pounds of oil/water separator sludge in 1994, but the annual average for the years 1995-1998 increased to 1,348,341 pounds. An unusual amount of this waste stream was produced in 1998 due to cleaning operations at their Unit 100, Tosco Refinery’s process water treatment system.
e. Industrial Trash - CWC 181 In 1998, the Tosco Refinery reported 1,537,200 pounds of “industrial trash,” compared to 665,700 pounds of “oily trash” in 1994. In 1998, the Tosco Refinery began using the term “industrial trash” for wastes that included “oily trash” (which was a major waste stream in 1994), in addition to oily soil, used personal protective equipment, non-recyclable filters, and non-RCRA sandblast grit. The Tosco Refinery will re-educate employees to segregate and properly manage industrial trash, especially at the 220 equipment pad where 25 to 50 percent of the industrial
20
trash was generated. Examples of waste management activities that regularly occur at the 220 pad include washout of vacuum truck sludges, sandblasting, and heat exchanger bundle cleaning. It may be possible to optimize the handling and management of some of these industrial trash component wastes to reduce the amount of industrial trash collectively manifested offsite for disposal.
f. Tank Bottoms - CWC 241 For the years 1995-1998, the Tosco Refinery generated an average annual rate of 52,803 pounds of tank bottoms which is 97 percent reduction from quantities generated in 1994 (1,993,675 pounds). Because of the low generation volume in 1998, tank bottoms were not considered a major waste for that year.
The major factor that influenced the tank bottom waste generation rate was the Tosco Refinery’s implementation in 1992 of an above ground tank cleaning and inspection program in response to a State mandate. The program will last through the year 2017. Prior to 1994, only tanks that required repairs were taken out of service and cleaned. In 1994, 15 tanks were cleaned, resulting in the generation of 1,993,675 pounds of tank bottom waste. For the years 1995-1999, the number of tanks that were serviced varied from 2 to 15 tanks per year.
Tank bottoms are either sent off site as hazardous waste when rust or iron scale is present, or sent to the coker unit when metals concentration is acceptably low. Approximately 75 percent of tank bottoms sent to the coker are pretreated because of high sulfur content. The remaining 25 percent are sent straight to the coker without pretreatment. The Tosco Refinery does not consider the tank bottoms being sent directly to the coker as waste because there was no element of discard nor treatment required, and it was used as a feedstock for a refinery production process unit. In future source reduction efforts, the Tosco Refinery plans to investigate ways to increase the amount of tank bottoms that can be used as coker feedstock without requiring pretreatment.
g. Unicracker Regeneration Water - CWC 132 Unicracker regeneration water occurred when the cation and anion exchange columns at the Tosco Refinery’s Unicracker Unit were regenerated. To reduce this waste, the Tosco Refinery installed a reverse osmosis unit immediately upstream of the ion exchange units, thus decreasing the frequency of ion exchange unit regeneration. The installation of the reverse osmosis unit resulted in an 82 percent decrease in the regeneration waste water between 1994 and 1998.
2. Tosco San Francisco Carbon Plant In its 1998 SB 14 documents the Tosco Carbon Plant reported implementing measures intended to reduce production of the following wastes:
a. Oil/Water Separator and Demineralizer Backflush Water - CWC 135
Prior to 1992, this waste stream was composed of two separate effluents, one from the oil/water separator, and one from the demineralizer unit. The effluents were collected in an on site surface impoundment, and were not quantified. This impoundment collected other process waters and storm water runoff for subsequent
21
recycling into the product coolers. In order to meet regulatory requirements for classification and management of the waste stream as an “excluded recyclable material,” per California Health and Safety Code Section 25143.2(d)(5)(F and G), in 1992 the Tosco Carbon Plant installed piping and equipment to combine the two effluents for direct recycling into the product coolers.
This waste stream was determined to be a hazardous aqueous waste in 1994, and the amount generated was 8,716,050 pounds. A source reduction measure presented in the 1994 SB 14 Plan was implemented, resulting in the removal of hazardous constituents from the waste stream rendering it nonhazardous. The following seven-step approach was used to reduce the hazardous components of the combined aqueous waste stream:
• Characterize combined aqueous waste stream to establish baseline conditions;
• Train employees to prevent and discourage any introduction of used oil into the waste stream;
• Install containers immediately downstream of oil drainage lines in the turbine generator building and use booms instead of water to clean-up oil spills;
• Remove sludges from oil/water sump and separator, and steam clean thoroughly;
• Periodically recharacterize waste stream and monitor;
• If necessary, re-evaluate program and implement additional measures to eliminate used oil, if still present, or other hazardous components; and
• If waste stream becomes nonhazardous, decommission oil/water separator.
The Tosco Carbon Plant’s implementation of the above seven steps resulted in the reclassification of this waste water stream as nonhazardous. Because of the elimination of this waste stream as a hazardous waste, the facility reduced their total hazardous waste produced by 90 percent.
b. Baghouse Fines - CWC 591 The off-gases from the boiler enter a baghouse where fine debris is separated from the gases and deposited in hoppers beneath the baghouses. The fines are primarily carbons with low concentrations of cadmium, nickel, vanadium, and zinc. In 1994 and in previous years, these fines were recycled as feedstock along with the raw petroleum coke for the calcination process. Although the recycling minimized the amount of baghouse fines manifested off site for disposal, the fines deposited as slag on the refractory and brick, leaving the refractory and brick hazardous due to elevated metal content.
One of the alternatives developed in 1994 was to discontinue recycling of baghouse fines. Although the amount of baghouse fines manifested off site for disposal increased, the Tosco Carbon Plant estimated that this increase would be offset by reduction in generation of hazardous slag, brick, and loose refractory. The
22
implementation of this alternative (intended to reduce the hazardous brick wastes) caused a significant increase in generation of baghouse fines in 1998, generating 293,430 pounds. In addition, removal of baghouse fines from the feedstock did not reduce the hazardous nature of the brick. The Tosco Carbon Plant recommended that the waste stream be recycled again.
c. Slag, Brick, and Loose Refractory - CWC 181 Brick and refractory material line the two rotary kilns, pyroscrubbers, coolers, and hot stacks at the Tosco Carbon Plant. During the roasting of the raw petroleum coke into calcined product, some trace heavy metals such as nickel and vanadium are deposited as slag in an aluminum silicate matrix on the cooler-exposed faces of the brick and refractory linings. Periodic replacement of the linings is necessary to maintain optimal operating conditions for petroleum coke calcination. The extent of the hazardous slag accumulation on the brick faces depends on their locations in the process. For instance, brick recovered from the kiln firing hood and scrubber floor is heavily slagged, whereas brick recovered from the kiln and scrubber ceiling is lightly slagged, or mostly clean.
When labor and resources are available, bricks and refractory are removed and segregated according to their location in the process. The hazardous slag is removed from the brick faces and deposited in a separate bin for off-site disposal. The remaining brick material is combined with relatively clean, intact brick obtained from the same location, and subsequently tested. If brick material is not hazardous, contents of the bin remain onsite for recycling as fill material. The Tosco Carbon Plant has a Used Brick Management Plan that specifies quantities of nonhazardous brick recycled on site each year. The Regional Water Quality Control Board (RWQCB) oversees the used brick plan.
The segregation process described above is performed if the Tosco Carbon Plant has sufficient resources, and if the Tosco Carbon Plant has a designated use for the nonhazardous brick and refractory. In 1998, brick and refractory were not segregated and were disposed off site as hazardous wastes, resulting in 557,825 pounds hazardous waste generated, as compared to 220,685 pounds in 1994.
Several minimization alternatives are being considered for the slag, brick and loose refractory waste stream:
• Remove Slag from Refractory Brick with a Brick Saw: Currently, use of a pneumatic chipping hammer to remove the slag from the brick faces requires that the hammer penetrate beyond the layer of slag into the brick material. As a result, relatively clean brick material, is deposited in the bins with the slag, and contributes to the hazardous waste stream requiring off-site disposal. Use of a brick saw would reduce the amount of refractory material sent off site. A brick saw would cut the slag more cleanly from the brick face at the slag-brick interface. Preliminary estimates show that brick saw use could reduce the amount of slag, brick, and loose refractory disposed off site by ten percent.
23
• Implement a Refractory Material Replacement Plan: As part of scheduled maintenance, Tosco Carbon Plant engineers determine the extent of refractory removal and replacement. Tosco Carbon Plant engineers minimize refractory removal by replacement of refractory material from only those areas that are heavily impacted. The Tosco Carbon Plant has lengthened the replacement time from the standard 12 months to 14 to 18 months. Waste is generated less frequently, but in greater quantity. This practice needs to be studied further to determine if lengthening replacement time reduces or increases the overall generation of hazardous brick.
• Recycle Material to Cement Kiln as an Additive: The only cement kilns that can accept hazardous bricks are several states away from California. Transportation costs were determined to be economically infeasible. However, the Tosco Carbon Plant will continue to identify and evaluate new and closer facilities.
• Recycle Crushed Brick to Pyroscrubber: Crushed brick is added to the Oceanite used in the pyroscrubber to reduce slag deposition. Crushed brick was added in the 1998 turnaround and will be inspected at the next available opportunity. If the brick recycling is successful, one on site use for stockpiled nonhazardous brick will be to crush and reuse it in the pyroscrubber.
d. Boiler Sandblast Residue - CWC 181 The periodic cleaning of boilers by sandblasting generated 21,000 pounds of hazardous waste in 1994 and 21,780 pounds in 1998. The amount of material generated by this process has not changed significantly since 1994, and was not a major waste stream in 1998 because of changes in generation of the brick and baghouse fines. The Tosco Carbon Plant is still considering source reduction strategies, including magnesium injection to loosen boiler deposits and the use of alternative cleaning techniques.
24
Golden Eagle Refinery
The major waste streams generated by Golden Eagle are discussed in this section. The facility’s SB 14 documents prepared in 1999 by previous owner, Tosco, and submitted to the DTSC were used to discuss the hazardous waste source reduction activities implemented by the facility.
A. Summary of Major Waste Streams
In 1998, the major wastes streams generated by Golden Eagle (then under the ownership of the Tosco Refining Company) were spent catalysts, wastewater solids, acid plant effluent, and the demineralizer regeneration effluent.
• Catalysts were used in the refinery to reduce the sulfur and nitrogen content of certain hydrocarbon streams (hydrotreating), to promote hydrocarbon conversion reactions (hydrocracking and fluid catalytic cracking), and to convert sulfur and sulfuric acid. Catalysts were also used to convert steam and natural gas to hydrogen for use in the hydrotreating and hydrocracking reactions. Absorbents that were used in the refinery process for the recovery of sulfur or sulfuric acid were also included in the spent catalyst waste stream. Catalysts used in each of these processes lost effectiveness over time, and were replaced when the effectiveness decreased below an acceptable level.
• Wastewater solids were generated from dredging Surge Ponds 1 and 2 at the refinery’s wastewater treatment plant. The two primary components of the waste stream were biosolids formed during the biological breakdown of organic compounds in the wastewater, and ferric hydroxide sludge formed during the treatment of the wastewater with ferric chloride as a flocculant in the clarifiers.
• The Sulfuric Acid Plant within the Chemical Plant generated an aqueous acidic hazardous waste stream. This waste was produced when the sulfur trioxide (S03 ) produced during the process was removed in a wash tower. This acidic wastewater was combined with other Chemical Plant wastewater streams, such as steam condensate and boiler blowdown, in Tank 842 to form the Acid Plant effluent waste stream.
• The demineralizer regeneration effluent was produced as a result of regenerating the resin beds used for the demineralization of water used for steam production. This process takes place at the No. 3 Water Treatment Plant on a regular basis as needed to maintain high purity water for supply to a 600 psig boiler. These resin beds must be periodically regenerated to maintain capacity.
In 1994, Tosco reported that tank bottoms, oil/water separation sludge solids, and oily absorbent booms and debris were considered major waste streams. These wastes were not considered major wastes in 1998.
25
• Tank Bottoms were the sediment that forms from solid particles, heavy organics, and water settling to the bottom of crude oil and petroleum product storage tanks over time.
• Oil/Water Separation Sludge Solids includes solids removed from the API separator and DNF Units during maintenance. During normal operation, API and DNF sludges are processed in the coker for oil recovery.
• Oily Booms and Debris were generated from routine maintenance activities which consisted of absorbent boom used to contain and clean up hydrocarbons around equipment being serviced.
Hazardous Waste Generation by Major Waste Stream
Wastes
CWC 1994
(Weight in pounds)
1998 (Weight in
pounds) Major Nonaqueous (Category B) Waste Streams
Spent Catalyst 162 2,282,600 1,277,410 Wastewater Solids 352,
491
3,565,800
21,552,440 Tank Bottoms 241 572,800 50,550* Oil/Water Separation Sludge Solids 222 407,400 94,005* Oily Booms and Debris 352 305,400 175,930*
Total Category B Major Waste Streams 7,134,000 22,829,850 Misc. Category B Minor Waste Streams 485,400 950,204
Total Category B Wastes 7,619,400 23,780,054 Aqueous (Category A) Waste Acid Plant Effluent 791 1,308,744,000 1,381,275,700 Demineralizer Regeneration Effluent 791,
122
894,372,000
377,734,000 Total Category A Waste 2,203,116,000 1,759,009,700
Total Waste (Category A & B) 2,210,735,400 1,782,789,754 *Not a major waste stream in 1998.
B. Source Reduction Activities
The following is a discussion of refinery source reduction activities. Source reduction information was obtained from the 1998 SB 14 documents prepared by Golden Eagle’s previous owner, Tosco.
1. Spent Catalyst - CWC 162
Catalysts used at the refinery were composed of various metallic compounds including nickel-molybdenum, iron-chromiun, copper, nickel, zinc, oxide, platinum, cobalt-molybdenum, or vanadium pentoxide, supported on an alumina or clay base. Life for these catalysts varied between two and eight years. If possible, catalysts were regenerated offsite and reused in the refinery at least once until activity of the regenerated catalyst was inadequate for further regeneration and reuse. When unsuitable for regeneration or reuse, the catalysts were shipped offsite to a metals
26
reclaimer for recovery of the metals present on the catalyst. However, some catalysts, such as the vanadium pentoxide, or the copper-based absorbent used for recovery of sulfur products, were transported to a hazardous waste landfill, because reclamation was not economically feasible. In a limited number of cases Tosco was unable to locate a reclaimer.
The amount of manifested spent catalyst shipped offsite decreased from 2,282,600 pounds in 1994 to 1,277,410 pounds in 1998, or a 44 percent reduction. Factors that contributed to this decrease were:
• Use of more robust catalyst. Advances in catalyst technology during the four years from 1994 to1998 allowed units at the refinery to operate for longer run times before catalyst was replaced, thus reducing the generation rate of spent catalyst. For example, increasing run lengths at the Hydrocracker Plant stage 1 and stage 2 reactors decreased spent catalyst generation by approximately 50,000 to 100,000 pounds per year. This reduction was achieved primarily by redesigning the internals of the reactor in conjunction with using more robust catalyst.
• Addition of pre-reactors. Addition of pre-reactors at the steam reforming and low-temperature shift reactors at the Hydrogen Plant increased the life of catalyst in the reactors from two years to six years. Approximately 100,000 pounds of catalyst in each of the two primary reactors are therefore replaced every six years rather than every other year. The use of pre-reactors essentially reduced the catalyst loading in the primary reactors.
In their 1998 SB 14 documents, the former owner, Tosco, identified the following source reduction alternatives to further reduce their spent catalyst waste stream.
• Investigate appropriate catalyst substitute. The facility reported it would further investigate the feasibility of using higher activity catalysts. Tosco also planned to evaluate larger catalysts, as smaller-sized catalysts were more difficult to manage and broke more easily upon changeout, thus reducing opportunity for regeneration and reuse.
• Determine the feasibility of further segregating catalyst support material from spent catalysts.
Tosco reported that support material remaining with the spent catalyst was generally material that could not be easily separated from the catalyst during unloading. However, the refinery considered the possibility of decreasing the amount of support material left in the spent catalyst by modifying catalyst-unloading procedures, or by screening the discharged catalyst at the refinery. The refinery planned to review catalyst unloading operations and other ways (such as screening) to segregate out this support material before, or in the process of, removing spent catalyst from the vessel.
27
2. Wastewater Solids - CWC 352 and CWC 491 Each year, wastewater solids are dredged and removed from surge ponds, centrifuged, and shipped offsite for disposal. The generation rate depends on the rate of solids buildup in the surge ponds, which is a function of the amount of wastewater treated and the refinery’s crude oil throughput.
The quantity of wastewater solids increased from 1994 to 1998 by 17,956,640 pounds, or 500 percent. In 1998 the quantity of wastewater solids was particularly large because Tosco had fallen behind in its surge pond-dredging program in the preceding years. The refinery implemented an aggressive dredging program, to keep up with the production of solids in the ponds and to increase the pond capacity, and thus the retention time, of the two surge ponds.
In their 1999 Hazardous Waste Source Reduction Evaluation Review and Plan, then owner Tosco, identified the following alternatives that they would evaluate to reduce wastewater solids:
• Use sulfuric acid instead of ferric chloride for pH control. In 1999, ferric chloride was being added to the clarifiers not only as a coagulant to enhance clarification, but also for pH control. Ferric chloride results in the generation of ferric chloride sludge. To reduce this sludge, the refinery planned to evaluate using sulfuric acid for pH control.
• Evaluate whether it is possible to discontinue conveying the clarifier solids back to the surge tank.
In 1995, clarifier solids, (ferric hydroxide sludge) that were likely to contain selenium, were conveyed back to surge ponds. This practice contributed approximately 50 percent of the total amount of wastewater solids removed from surge ponds. Tosco reported that reintroducing these solids back into surge ponds could contribute to the hazardous characteristic of the surge ponds wastewater solids waste stream. The refinery reported that removing clarifier solids from the treatment system at, or immediately after, the clarifier would reduce the amount of wastewater solids generated and removed from the surge ponds.
• Dry wastewater solids. Tosco estimated that the wastewater solids removed from the surge ponds consisted of up to 10 percent solids by weight. Onsite centrifugation increases the solids content to approximately 25 percent solids by weight before the solids are shipped offsite for disposal. Methods to further dewater the waste stream (e.g., thermal dryer, filter press) would reduce the total weight of hazardous wastewater solids shipped offsite for disposal.
28
3. Tank Bottoms - CWC 241 Tank bottoms are sediments that form when solid particles, heavy organic compounds, and water settle to the bottom of crude oil and petroleum product storage tanks over time. The residue formed by the gradual accumulation of these sediments is removed from the tanks during tank clean outs. Tosco conducted clean outs infrequently, usually when tanks are scheduled for refurbishment.
The quantity of tank bottoms generated at Golden Eagle decreased from 1994 to 1998 by 522,250 pounds, or 91 percent, as a result of recycling oily solids, such as tank bottoms, to the Coker. This waste management practice proved both technically and economically feasible for Tosco. The refinery reported in 1999 that a majority of tank bottoms generated were being injected into the Coker as feedstock for petroleum coke production, and only disposed offsite when they were unsuitable for injection due to debris content or metals concentrations.
4. Oil/Water Separator Sludge Solids - CWC 222 The amount of oil/water separator sludge solids managed as hazardous waste during 1998 decreased by approximately 314,000 pounds, or 77 percent, from the 1994 total. Source reduction practices implemented by Tosco for this waste stream are presented below.
• Injection of Oil/Water Separator Sludge Solids into the Coker as Feedstock. Implementation of this alternative was the primary reason for a large reduction in the amount of oil/water separator sludge solids shipped offsite in 1998. Oil/water separator sludge solids processed in the Coker were no longer considered a waste because they did not require pretreatment, and there was no discard prior to their reuse as a raw material feedstock in a refinery production process unit. Processing oil/water separator sludge solids in the coker exempted Tosco from SB 14 regulation.
In 1999, Tosco reported this waste stream was routinely processed in the Coker, and only transported offsite for disposal when the material was not suitable for coker feedstock. This occurred during routine maintenance of the API separator, and when the sludge was contaminated with debris.
• Replacing Sand Absorbent with Diatomaceous Earth for Clean up of Oily Surfaces.
Sand was formerly used in the refinery to clean oily surfaces contaminated by spills. This sand was then collected and disposed. However, residual sand often remained, which was washed into the process sewers, to be removed later as part of the oil/water separator sludge solids waste stream. Tosco reported in 1999 that it used diatomaceous earth absorbents to clean up oily spills in the refinery. They were found to be much more effective at absorbing oil from contaminated surfaces, and could be more easily removed from concrete or pavement without the use of water, thus reducing the amount of solids that reached the sewer system. Tosco had difficulty quantifying the waste reduction achieved by this practice, but estimated it
29
resulted in 19,400 pounds per year. This estimate was based on the five-fold increase in absorption capacity of the diatomaceous absorbent over the sand, and the expectation that very little of the new absorbent would reach the sewer system.
• Use of Lead Blankets Instead of Burlap and Sand to Cover Sewer Openings during Maintenance Work.
During maintenance work, Tosco covered openings to the sewer system to prevent inappropriate discharges to the refinery wastewater system. These openings were formerly covered with burlap and free sand. An estimated five gallons of sand was lost to the sewer each time it was covered in this manner, and this sand then contributed to the generation of the oil/water separator sludge solids waste stream. The use of lead blankets was suggested in the refinery’s 1994 SB 14 Plan as an alternative method for providing an effective cover for the sewer openings, without loss of material to the sewer. The reduction in waste achieved by implementation of this alternative is difficult to quantify, but Tosco estimated it to be 11,200 pounds. The refinery based its estimate on the approximate number of times sewers are covered per year and an estimate of the amount of sand lost each time an opening was covered.
• Use of a Powered Sweeper to Remove Solids from Refinery Access Roads and Operating Areas.
Tosco found that dust, sand, and debris present on refinery roads and operating areas were likely to wash into the wastewater system during unit washdowns and rainfall events, and therefore contributed to the generation of oil/water separator sludge solids. By using a sweeper to remove solids from these areas these solids could be kept out of the sewer system. Tosco had not implemented this measure at the writing of its 1998 SB 14 report.
5. Oily Booms and Debris - CWC 352 Tosco decreased the quantity of oily booms and debris from 1994 to 1998 by 129,470 pounds or 42 percent. This waste stream was not considered a major waste stream in the refinery’s 1998 SB 14 documents because it was less than five percent of the total nonaqueous wastes. Tosco reported that the refinery continuously evaluated and implemented measures that had the potential to reduce this waste stream. All refinery employees underwent hazardous waste training once per year. During the training, employees learned how to distinguish materials that needed to be disposed as hazardous and those that did not.
30
6. Demineralizer Regeneration Effluent - CWC 791 and CWC 122 Although Tosco did not implement source reduction measures for demineralizer regeneration effluent between 1994 and 1998, there was a 58 percent reduction of this waste stream during the same period (894,372,000 pounds to 377,734,000 pounds). This reduction occurred because of improvements in feedwater quality, which was better in 1998 than in 1994. Prior to Ultramar obtaining Golden Eagle in 2000, Tosco reported in 1998 its plans to evaluate the following alternatives to reduce this waste stream.
• Investigate feasibility of replacing or augmenting the demineralizer system with a reverse osmosis system.
A reverse osmosis system would decrease the rate at which the ion exchange units would require regeneration.
• Reconfigure the effluent system to reuse spent sulfuric acid and rinsewater. The various wastewater effluents discharged during the regeneration cycle (spent sulfuric acid, spent caustic, spent rinsewater) were combined in a common tank prior to being discharged to the refinery’s wastewater treatment system. The spent sulfuric acid could be reused as part of the sulfuric acid pH project at the wastewater treatment plant. In addition, the spent rinsewater generated from the rinsing of the resin beds after regeneration by acid or caustic could be segregated and reused.
31
Valero Refining Company
For the purposes of clarity, the name Benicia Refinery will be used throughout this section in place of using Exxon or Valero, due to the change in ownership of the refinery. All data in this section was generated while Exxon was the owner and operator of the Benicia Refinery.
The Benicia Refinery’s major waste streams are discussed in this section. The refinery’s SB 14 documents (Source Reduction Evaluation Review and Plan, Hazardous Waste Management Performance Report, and Summary Progress Report) submitted to DTSC were used to discuss the hazardous waste source reduction activities implemented by the refinery.
A. Summary of Major Waste Streams The Benicia Refinery’s major waste streams reported in its 1994 SB 14 documents were demineralizer regenerant (acid), alkylation wastewater, demineralizer regenerant (caustic), and wastewater treatment plant sewer sludge. The refinery’s major waste streams reported in their 1998 SB 14 documents were demineralizer regenerant (acid), alkylation wastewater, demineralizer regenerant (caustic), wastewater treatment plant selenium sludge, spent catalyst, sulfur waste, and Dimersolcaustic.
2. Demineralizer Regenerant Wastes - CWC 791 (acidic) and CWC 122 (caustic)
Benicia Refinery generated both acidic and caustic wastewater streams from the regeneration of the ion exchange beds in the demineralization process. Raw untreated water, supplied to the refinery by the City of Benicia, is purified by lime softening. Softened water is then demineralized through anion and cation ion exchange resins to produce high quality water as feed for high-pressure steam boilers. These resins remove salts from water by replacement (ion exchange) with hydrogen ions (for cations) and hydroxyl ions (for anions). The hydrogen and hydroxyl ions combine to form water. Once the resins are saturated with salts, they are regenerated with acid or caustic. The CWC 791 waste stream is generated when cation resins are fed with a two to four percent solution of sulfuric acid to remove cations such as the sodium and calcium ions. The CWC 122 waste stream is generated when anion resins are regenerated with a two- percent solution of sodium hydroxide to remove anions such as the chloride and sulfate ions. The resins are subsequently rinsed with water after regeneration to flush out the respective regenerate.
2. Alkylation Wastewater - CWC 791
The alkylation process produces hydrocarbons for gasoline blending by combining shorter chain unsaturated hydrocarbons (primarily propylenes and butylenes) in the presence of sulfuric acid which acts as a catalyst. The spent sulfuric acid is sent off site for regeneration and returned to the alkylation unit for reuse. The refinery generated alkylation wastewater during equipment repairs, washdown of leaks, from pump sludge, from collecting process samples, and from collection of storm
32
water runoff. Similar wastewaters from the adjacent Dimersol Unit enter the underground piping and combine with the alkylation unit wastewater and storm water. The Dimersol water is approximately five to ten percent of the total wastewater. All of these wastewaters are sent to the alkylation waste treatment unit.
3. Wastewater Treatment Plant Sewer Sludge - CWC 222 Benicia Refinery generated oily wastewater, which required treatment to remove oil and organics, from a variety of processes including pump seal water, equipment washdown, storm waters, contact of steam with petroleum products, and removal of water from crude oil. Oily wastewaters are directed to the wastewater treatment system. The system consists of an oily water separator for initial oil removal, a device for enhanced removal of oils from water, and a biological unit for final removal of organics. (The refinery noted in its SB 14 documents that its biological oxidation unit met United States Environmental Protection Agency (U.S. EPA) definition of an aggressive biological treatment unit and therefore did not generate any U.S. EPA F037 Resource Conservation and Recovery Act (RCRA) listed sludge).
Refinery process wastewater and oily storm water enter the corrugated plate separator (CPS). The separator is designed to enhance the effect of gravity to separate free oil and solids from the wastewater. The wastewater then flows to an induced static flotation (ISF) unit that utilizes treatment chemicals and induced gas to further remove solids and oil from the wastewater. The sludge and float materials from the parallel trains consisting of one CPS and one ISF vessel are directed to an accumulation tank. Biological oxidation solids are added to the CPS/ISF sludges in the accumulation tank. The refinery added CPS and ISF units in 1991 to replace other equipment.
Sludge and floats generated at the Benicia Refinery contained oil, water and solids, which form an emulsion stabilized by the solids. The refinery routed the sludge and floats to the Coker for the production of coke.
4. Wastewater Treatment Plant Selenium Sludge - CWC 181 In July 1998, Exxon began operating an additional wastewater treatment process at the Wastewater Treatment Plant (WWTP) called the Benicia Effluent Quality Improvement Project (EQIP). The EQIP process employs an iron coprecipitation process to precipitate and settle out selenium from the wastewater. The source of the selenium is naturally-occurring selenium in the crude oil processed at the refinery, which enters wastewater in oily wastes discharged to it. The refinery installed EQIP to meet a mandate from the Regional Water Quality Control Board (RWQCB) to reduce selenium levels in wastewater discharge to below 50 milligrams per liter (mg/L). The EQIP process generates a sludge, which has selenium concentration levels exceeding DTSC’s soluble threshold limit concentration (STLC), for selenium of 1 mg/L. Therefore, this sludge is a hazardous waste.
The EQIP process includes a reactor/clarifier into which ferric chloride is added. The ferric chloride converts to iron hydroxide precipitate and hydrochloric acid. The positively charged iron hydroxide floc adsorbs negatively charged selenium ions
33
from the wastewater and settles in the clarifier. The water from the reactor/clarifier flows to a pH control tank, where its pH is adjusted to between seven and eight. The water is then discharged to the final pond wet well. The refinery discharges sludge from the reactor/clarifier to a sludge thickener feed sump, from which it is pumped to the thickener tank. In the thickener tank, sludge concentration increased from approximately one percent to two percent. The thickened sludge is discharged to the sludge dewater feed sump. From this sump, the thickened sludge is discharged to a contractor-operated transportable treatment unit for dewatering. The refinery shipped dewatered sludge off site to a hazardous waste landfill for disposal.
5. Spent Catalyst - CWC 162 Benicia Refinery generates spent catalysts from various process units throughout the refinery when catalyst is either disposed of or recycled. The refinery analyzes all spent catalysts to determine their waste classifications. The refinery determined that spent catalysts fall into different categories: nonhazardous, non-RCRA hazardous, RCRA listed hazardous, or RCRA characteristic hazardous.
The refinery generates hazardous spent catalysts in the hydrogen unit, the hydrocracker unit, and the alkylation hydrogenation process. The hydrogen unit uses a catalytic reforming process to convert steam and light hydrocarbons into hydrogen and carbon dioxide. The hydrocracker unit uses a catalyst to crack larger hydrocarbons into lighter, more valuable products, while simultaneously hydrogenating the hydrocarbons with hydrogen. Alkylation hydrogenation converts propadiene and butadiene to propylene and butylene through the addition of hydrogen. All of these catalytic processes require periodic replacement of the catalysts. Where possible, Benicia Refinery replaces only a fraction of the catalyst. The refinery reclaims, regenerates, or ships spent catalysts to a hazardous waste landfill.
6. Sulfur Waste - CWC 441 Benicia Refinery’s tail gas unit (TGU), which was replaced with new technology Flexsorb in 2000, generated the sulfur waste. The unit removed residual sulfur compounds in the tail gas from the sulfur gas unit (SGU), which reduced the concentration of hydrogen sulfide in the exhaust gas. Hydrogenation and hydrolysis were used to convert sulfur compounds in the tail gas to hydrogen sulfide. The refinery used Stretford Solution to dissolve and react hydrogen sulfide gas, converting it to nonhazardous elemental sulfur. After the sulfur was removed from the Stretford Solution, the rejuvenated solution was recycled to the process to recover additional sulfur. The refinery periodically purged the Stretford Solution, including residual sulfur contaminants, from the system and shipped off site as Stretford Sludge. During TGU turnarounds, scale and sludge from the process equipment were removed and managed in the same way as Stretford Sludge.
34
7. Dimersol Caustic - CWC 121 Benicia Refinery generated spent caustic (sodium hydroxide) in the Dimersol Unit. The Dimersol Unit converts propylene from the alkylation unit into high-octane dimate and liquefied petroleum gas (LPG). The refinery uses a series of reactors to convert the propylene into dimate using a nickel catalyst. The reactor effluent is neutralized in three stages: ammonia mixing, caustic washing, and water washing. Following neutralization, the reactor effluent is stabilized to separate the reactor effluent into usable products and to remove the dimate.
The caustic washing process removes the nickel catalyst from the reactor effluent. Reactor effluent flows from the ammonia-mixing drum to the caustic wash drum. Prior to entering the caustic wash drum, a caustic solution is mixed with the reactor effluent. The catalyst reacts with the caustic and dissolves into the caustic solution. The spent caustic solution is disposed of at an off-site wastewater treatment plant.
Hazardous Waste Generation by Major Waste Stream
Wastes
CWC
1994 (Weight in pounds)
1998 (Weight in pounds)
Aqueous (Category A) Waste
Demineralizer regenerant (acid) 791 262,934,000 240,000,000 Alkylation Wastewater 791 8,956,000 52,000 Demineralizer regenerant (caustic) 122 131,466,000 160,362,000
Total Category A Waste 403,356,000 400,414,000 Nonaqueous (Category B) Waste
Wastewater Treatment Plant Sewer Sludge 222 77,734,800 N/A Wastewater Treatment Selenium Sludge 181 4,504,000 Spent Catalyst 162 1,261,800 Sulfur Waste 441 824,200 Dimersol Caustic 121 751,800
Total Category B Waste 77,734,800 7,341,800 Total Waste (Category A &B) 481,090,800 407,755,800
Source: 1998 SB 14 Source Reduction Documents. N/A—Not Available
B. Source Reduction Activities
1. Demineralized Regenerant - CWC 122 and CWC 791 The Benicia Refinery found limited opportunities to reduce the quantity of demineralizer regenerant waste because the frequency of regeneration was based on the mineral content of the untreated water obtained from the City of Benicia. Several operational measures were reported to be in place which optimized demineralizer performance, including continuous on line monitoring of resin life, automated measurement of regenerant concentration and flow rate, computer controlled regeneration cycles, and use of fresh reagents.
35
2. Alkylation Wastewater - CWC 791 Because a portion of the wastewater occurred from equipment leaks and repairs, the Benicia Refinery reported an aggressive preventative maintenance program to prevent equipment leaks and maintain employee safety. In addition, the refinery trained employees to minimize waste generation during repairs.
3. Oil/Water Separation Sludges - CWC 222 The Benicia Refinery implemented the following measures to reduce refinery oil/water separation sludges:
• The direct transfer of electrostatic precipitator (ESP) fines was implemented in third Quarter 1995 which discontinued the use of a rollbox for fines collection except as an emergency backup. The reduction in spillage was roughly estimated at 26 tons per year.
• The desalter internals were changed to a Petreco BILECTRIC design in fourth Quarter 1995. While impossible to determine accurately, the refinery estimated this modification resulted in a waste reduction of about 2,500 tons per year.
After the 1995 Source Reduction Evaluation Review process, the Benicia Refinery intensified its efforts to recover the oil content of oily sludges by redirecting them to the on site Coker. As a result, the portion of the wastewater treatment sludge waste stream that was hazardous waste reduced from 38,867 tons during the 1994 Baseline Year to 190.8 tons during the 1998 Reporting Year. The wastewater treatment sludge represents less than five percent of the total nonaqueous waste generated during 1998 and, therefore, was not evaluated as a major waste stream during the SB14 process.
In July 1998, the Benicia Refinery began operating an additional wastewater treatment process at the WWTP called the Benicia EQIP. The EQIP process employed an iron coprecipitation process to precipitate and settle out selenium from the wastewater.
The Benicia Refinery reported making several improvements to reduce salt loading to the WWTP. The refinery improved the lime softening process to reduce the salt loading in the demineralizer. The refinery also replaced the resin in two ion exchange beds in the Demineralizer with an improved resin to reduce the frequency of regeneration. This resulted in a decrease in the volume of waste processed to the WWTP.
The refinery evaluated and subsequently either rejected or postponed two measures identified in its 1995 Source Reduction Evaluation and Review Plan. An example of one such measure was to evaluate the installation of a Reverse Osmosis (RO) Unit upstream of the demineralizer ion exchange beds to reduce the salt loading on the beds, and therefore reduce the amount of regeneration wastes generated. However, the Benicia Refinery found this project to be technically impracticable.
36
4. Spent Catalyst - CWC 162 The Benicia Refinery reported that it decreased the frequency of turnarounds in part to minimize the amount of waste catalyst and other materials generated during turnaround activities.
Where possible, spent catalyst was removed by skimming a fraction of the catalyst rather than replacing the entire amount. This practice reduced the amount of spent catalyst generated.
5. Sulfur Waste - CWC 441 The Benicia Refinery replaced the tail gas unit where a sulfur waste stream was generated. The refinery has begun operating a new unit, the Flexsorb Unit, which more efficiently removes hydrogen sulfide from the gas stream. Replacing the tail gas unit with the Flexsorb Unit eliminated the sulfur waste stream. By implementing this measure, the refinery estimated that the hazardous waste quantity decreased by approximately 400 tons per year. Hydrogen sulfide is recycled back into the process.
The refinery completed implementation of this selected source reduction measure as planned in the fourth quarter of 1999.
6. Dimersol Caustic - CWC 121 In its 1999 SB 14 documents, the Benicia Refinery reported evaluating the installation of new process units that would allow the Dimersol Unit to be taken out of service, thus, eliminating the Dimersol caustic waste. However, the refinery recently decided to keep the Dimersol Unit in service, and the refinery has not yet reported other planned source reduction measures.
37
BP-Carson Refinery Carson and Wilmington
The major waste streams of these two nearby facilities are discussed in this section. These facilities’ SB 14 documents submitted to the DTSC were used to discuss the hazardous waste source reduction activities implemented by BP-Carson.
A. Summary of Major Waste Streams
BP-Carson’s major waste streams are discussed in the section. Hazardous wastes generated by these facilities include aqueous (Category A) and nonaqueous (Category B) wastes. The major Category A waste stream subject to SB 14 regulations is wastewater discharged to a publicly owned treatment works (POTW) - California Waste Code (CWC) 135. The major nonaqueous waste streams are oil/water separation sludge CWC 222, and spent catalysts CWC 162.
1. Wastewater to POTW - CWC 135 BP-Carson’s wastewater is a combination of process wastewaters (from tank draws, crude desalters, and refinery process units), ground water remediation, cooling tower blowdown and storm water. BP-Carson has a very limited separate storm drain system, and consequently, wastewater flow also includes a storm water component that varies from year to year. The single constituent that results in the wastewater being characterized a hazardous waste is benzene when its concentration is 0.5 ppm or greater.
2. Oil/Water Separation Sludge - CWC 222 BP-Carson reported that oil/water separation sludge resulted from the solids removal phase of the wastewater treatment process necessary to meet the standards for discharge to the municipal sewer and POTW. This waste stream consisted of the following listed RCRA hazardous wastes and RCRA waste codes: API Separator Sludge (K051) and Primary Sludges (F037 and F038). The refinery managed the sludge as a single hazardous waste as oil/water separation sludge CWC 222. The following were the four major sources of solids that contributed to the generation of sludge wastes:
• Debris, sand, and soil from the refinery site were entrained with oily wastewater that drained to the process sewer.
• Dirt from geological formations that produced crude oil entered the refinery with the crude oil.
• Water used in refinery operations that contained minerals caused calcium salt precipitates. The precipitates were discharged into the refinery wastewater system.
• Dirt, sand, soil, and precipitate wastes adsorbed heavy oils resulting in subsequent oily sludge generation.
38
BP-Carson reported for 1998 that each of these major four sources generated about one fourth of the refineries’ sludge wastes.
3. Spent Catalysts - CWC 162 Catalytic reactors enhance chemical conversions using catalysts. The catalyzed process slowly deposits contaminants on the surfaces of the catalyst. Deposits cause diminished catalytic reaction so that the catalyst no longer functions effectively, and results in the generation of spent catalyst. Spent catalyst is removed from the catalytic reactor and replaced with fresh catalyst. Some of the catalysts are metals bonded to an inert substrate. An example is nickel/molybdenum catalyst on an alumina base. A single reactor can contain over 100,000 pounds of catalyst.
The schedule of replacing spent catalyst with fresh catalyst determines the annual generation rate of spent catalyst. The spent catalyst may be classified as either RCRA-listed or RCRA-characteristic hazardous waste.
4. Spent Cat Poly - CWC 161 Spent cat poly is spent catalyst from the Fluid Catalytic Cracker (FCC) unit. BP-Carson formerly shipped spent cat poly to hazardous waste landfill as a non-RCRA hazardous waste, only because of its low pH. Subsequent testing proved this material has agricultural value. During 1997 and 1998, under a DTSC issued variance, the refinery sold spent cat poly as refinery phosphorus fertilizer for agricultural use. Since 1998, BP-Carson has sent spent cat poly catalyst to a cement kiln for use as a cement production additive.
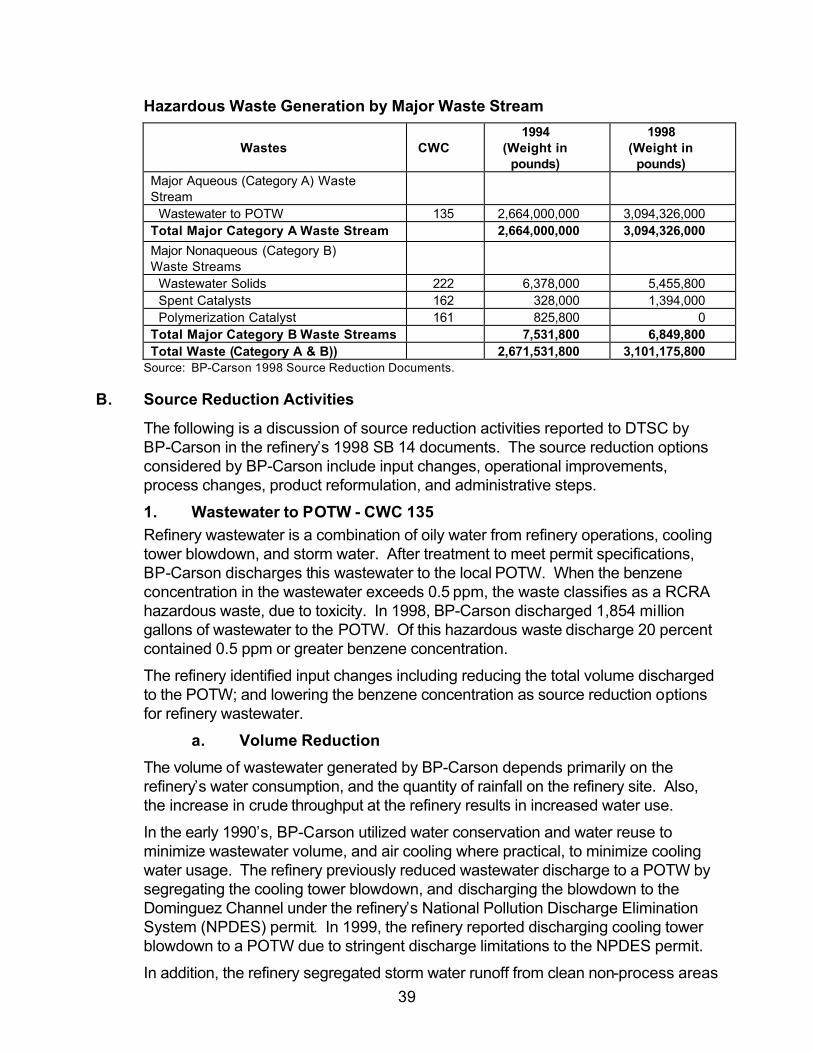
39
Hazardous Waste Generation by Major Waste Stream
Wastes
CWC
1994 (Weight in
pounds)
1998 (Weight in
pounds) Major Aqueous (Category A) Waste Stream
Wastewater to POTW 135 2,664,000,000 3,094,326,000 Total Major Category A Waste Stream 2,664,000,000 3,094,326,000
Major Nonaqueous (Category B) Waste Streams
Wastewater Solids 222 6,378,000 5,455,800 Spent Catalysts 162 328,000 1,394,000 Polymerization Catalyst 161 825,800 0 Total Major Category B Waste Streams 7,531,800 6,849,800 Total Waste (Category A & B)) 2,671,531,800 3,101,175,800
Source: BP-Carson 1998 Source Reduction Documents.
B. Source Reduction Activities
The following is a discussion of source reduction activities reported to DTSC by BP-Carson in the refinery’s 1998 SB 14 documents. The source reduction options considered by BP-Carson include input changes, operational improvements, process changes, product reformulation, and administrative steps.
1. Wastewater to POTW - CWC 135 Refinery wastewater is a combination of oily water from refinery operations, cooling tower blowdown, and storm water. After treatment to meet permit specifications, BP-Carson discharges this wastewater to the local POTW. When the benzene concentration in the wastewater exceeds 0.5 ppm, the waste classifies as a RCRA hazardous waste, due to toxicity. In 1998, BP-Carson discharged 1,854 million gallons of wastewater to the POTW. Of this hazardous waste discharge 20 percent contained 0.5 ppm or greater benzene concentration.
The refinery identified input changes including reducing the total volume discharged to the POTW; and lowering the benzene concentration as source reduction options for refinery wastewater.
a. Volume Reduction
The volume of wastewater generated by BP-Carson depends primarily on the refinery’s water consumption, and the quantity of rainfall on the refinery site. Also, the increase in crude throughput at the refinery results in increased water use.
In the early 1990’s, BP-Carson utilized water conservation and water reuse to minimize wastewater volume, and air cooling where practical, to minimize cooling water usage. The refinery previously reduced wastewater discharge to a POTW by segregating the cooling tower blowdown, and discharging the blowdown to the Dominguez Channel under the refinery’s National Pollution Discharge Elimination System (NPDES) permit. In 1999, the refinery reported discharging cooling tower blowdown to a POTW due to stringent discharge limitations to the NPDES permit.
In addition, the refinery segregated storm water runoff from clean non-process areas
40
of the refinery, so it did not enter the process sewer, thereby reducing the amount of storm water runoff that became contaminated with benzene and other hydrocarbons.
b. Benzene Concentration Reduction Source reduction projects completed in 1992 at BP-Carson reduced the concentration of benzene in the refinery wastewater. Prior to the projects, the benzene concentration of the wastewater discharged to a POTW was consistently above the 0.5 ppm toxicity threshold. For the 1994 source reduction reporting year, the benzene concentration of this wastewater treatment effluent to the POTW, was greater than 0.5 ppm, for about 20 percent of the time. BP-Carson realized additional improvement in benzene reduction for the years 1994-1999, but at lower rates than in 1994. BP-Carson stated in their 1998 SB 14 documents that practical technology and economics limit further improvement.
2. Oil/Water Separation Sludges - CWC 222 Oil/water separation sludge generation varies with scheduled maintenance activities, such as tank cleanings and process unit turnarounds. For 1998, BP-Carson reported decreased generation of oil-water separation sludge since the prior 1994 reporting period. This decrease can be attributed to source reduction projects at the refinery. Source reduction options were pursued for the four major components of wastewater sludge listed below.
a. Refinery Site Dirt Soil, sand, and dirt from refinery grounds enter the refinery wastewater system from both paved and unpaved areas of the refinery. Dirt from the pavement is washed into the process sewer during unit wash downs, and during rainstorms. Between 1994 and 1998, the refinery expanded its use of street sweepers, to reduce the accumulation of dirt on the paved areas of the refinery. BP-Carson was unable to accurately determine the quantity of reduced wastewater sludge attained by the street-sweeping program. In addition to sweeping, the refinery also reported using solids screens or traps at storm water catch basins.
b. Hard Water Precipitate In 1999, BP-Carson reported it was evaluating an acid-injection system to slightly reduce wastewater pH. Calcium carbonate, or limestone, precipitates from soluble calcium salts in the refinery water supply. The precipitation occurs when alkaline process wastes mix with other wastewaters in the process sewer. The precipitate contributes to the generation of wastewater treatment sludge.
c. Formation Solids Sludges also originate from the geological formation that produces crude oil. The solids enter the refinery entrained in the crude oil. In1999, BP-Carson reported it had considered to use refinery crude desalter units to remove formation solids prior to entering the refinery wastewater system, however, the option did not appear to be technically feasible.
d. Heavy Oil Leakage BP-Carson reported that heavy oils leaking or seeping from packing seals of process pump shafts were a significant source of sludge in the process sewer. In
41
1999, the refinery reported it had converted process pumps to mechanical seals. By 1999, BP-Carson had completed shaft seal conversions on pumps serving the FCC, Hydrocracker, Crude Distillation, Vacuum Distillation, and Coker units. BP-Carson expects to achieve some waste reduction due to this new practice.
3. Spent Catalysts - CWC 162 In their 1998 SB 14 documents, BP-Carson did not identify source reduction options for CWC 162.
The generation rate of spent refinery catalysts fluctuates dramatically each year depending upon scheduled maintenance of refinery units. According to BP-Carson, spent refinery catalyst is a waste stream that is not suitable for source reduction.
BP-Carson reported also that operational improvements to extend the life of catalysts have always been a strong economic priority for the refinery. However, no significant operational improvements were identified in BP-Carson’s 1998 SB 14 documents.
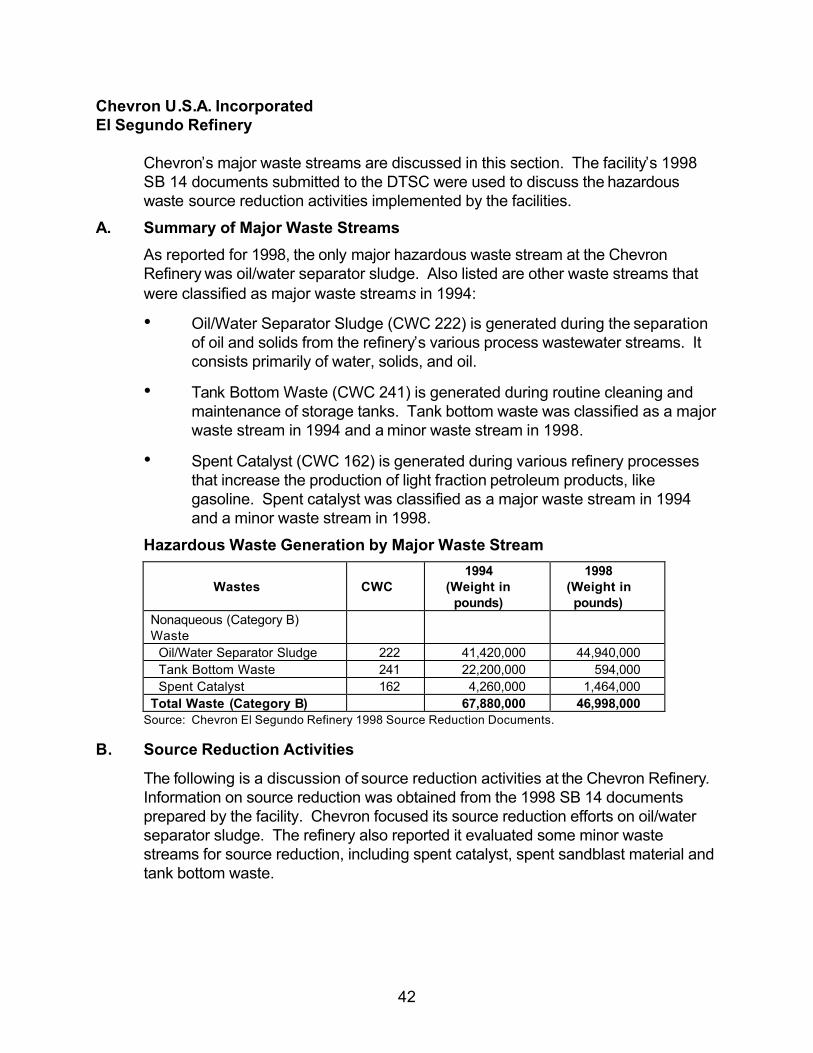
42
Chevron U.S.A. Incorporated El Segundo Refinery
Chevron’s major waste streams are discussed in this section. The facility’s 1998 SB 14 documents submitted to the DTSC were used to discuss the hazardous waste source reduction activities implemented by the facilities.
A. Summary of Major Waste Streams
As reported for 1998, the only major hazardous waste stream at the Chevron Refinery was oil/water separator sludge. Also listed are other waste streams that were classified as major waste streams in 1994:
• Oil/Water Separator Sludge (CWC 222) is generated during the separation of oil and solids from the refinery’s various process wastewater streams. It consists primarily of water, solids, and oil.
• Tank Bottom Waste (CWC 241) is generated during routine cleaning and maintenance of storage tanks. Tank bottom waste was classified as a major waste stream in 1994 and a minor waste stream in 1998.
• Spent Catalyst (CWC 162) is generated during various refinery processes that increase the production of light fraction petroleum products, like gasoline. Spent catalyst was classified as a major waste stream in 1994 and a minor waste stream in 1998.
Hazardous Waste Generation by Major Waste Stream
Wastes
CWC
1994 (Weight in
pounds)
1998 (Weight in pounds)
Nonaqueous (Category B) Waste
Oil/Water Separator Sludge 222 41,420,000 44,940,000 Tank Bottom Waste 241 22,200,000 594,000 Spent Catalyst 162 4,260,000 1,464,000 Total Waste (Category B) 67,880,000 46,998,000
Source: Chevron El Segundo Refinery 1998 Source Reduction Documents.
B. Source Reduction Activities
The following is a discussion of source reduction activities at the Chevron Refinery. Information on source reduction was obtained from the 1998 SB 14 documents prepared by the facility. Chevron focused its source reduction efforts on oil/water separator sludge. The refinery also reported it evaluated some minor waste streams for source reduction, including spent catalyst, spent sandblast material and tank bottom waste.
43
1. Oil/Water Separator Sludge - CWC 222 Source reduction activities for this waste stream involved improving the effectiveness of on-site recycling of oily sludge to the Coker Plant, reducing the volume of the waste stream requiring treatment through process modifications, and reducing the amount of solids collected with the various wastewater streams.
a. Coking Process The Coker Plant produces coke from the oily sludge generated at the refinery’s wastewater treatment plant. Most of the oil sludge fed into the Coker vaporizes upon contact in the hot coking process. The lighter fraction passes into overhead lines and returns to the refinery fractionation process. Solids and other non-volatiles in the oil sludge are incorporated into the coke product.
Chevron and the oil refining industry cooperated with the U.S. EPA to review and establish the coking of oil water separator sludge as a viable recycling activity. The U.S. EPA now excludes material that is recycled on site in a coker from being classified as solid waste. This rulemaking was published in the Federal Register dated August 6, 1998 (Volume 63, Number 15 1).
b. Augment Sludge Coking Process with Collider Unit According to Chevron, in 1999 the refinery evaluated installing a collider unit to augment the oil sludge coking process, and reduce the amount of oil/water separator sludge that is disposed off site.
A collider crushes and grinds viscous particulate sludge into slurry that can be pumped into a coker. Without a collider, about 80 percent of all the oil/water separator sludge were directly recovered in the Coker. Remaining particulate sludge was too viscous to pump into the coking process. Consequently, Chevron shipped the viscous sludge off site for disposal. The refinery calculated that a collider could reduce by 90 percent the viscous sludge shipped off site for disposal in 1999. Chevron believed that installation of a collider would have both economic and environmental benefits.
c. Segregated Drain System Maintenance The refinery drain system provides collection of miscellaneous oil/water drainage on the refinery site that is subsequently processed by the oil/water separator. The oil/water from the drains contain significant amounts of sand, which ultimately results in more sludge generated by the separator. Chevron’s 1998 SB 14 documents described the refinery’s on-going maintenance program to clean, inspect, and repair the segregated refinery drain system to reduce the amount sand in the drains.
Chevron implemented the drain maintenance program in 1997. Chevron reported that the drain maintenance program continues to be a significant financial commitment by the refinery. As of 1999, the refinery had cleaned over 6,000 feet of 24” and 30” segregated drain lines. In addition, the refinery had repaired or replaced over 1,300 feet. Total funds spent exceeded $2,000,000. Despite the cost, Chevron plans to continue the drain system maintenance program.
According to the 1998 documents, the refinery did not know the effectiveness of the drain maintenance effort on reducing oil/water separator sludge. Consequently,
44
Chevron was unsure of the cost effectiveness for the company. However, the refinery believes there is benefit in maintaining the integrity of the drains, reducing sand infiltration, and thereby improving the overall wastewater system operation.
d. Soil Maintenance Program Over the years, landscaping soils and the soil berms that surround tank foundations have eroded. This soil erosion releases dirt and sand into the refinery drain system, which results in a significant source of sludge generated by the oil/water separators. Chevron’s soil maintenance program involves the on-going repair, stabilization and maintenance of refinery landscaping and protective berms to minimize the amount of dirt and sand that enters the drainage system. Chevron reported this established practice has been effective and easy to implement at a low cost to the refinery.
e. Degasser Plant Crude desalter units separate brine water from the crude oil prior to the initial fractional distillation in crude oil refining. However, oil/water separation is incomplete, because wastewater effluent from desalters contains crude oil that is entrained and emulsified in brine water.
According to Chevron, significant amounts of oil can be recovered from the desalter wastewater effluent, if the effluent is processed in a degasser. A degasser adds heat and steam to desalter effluent to vaporize the entrained light boiling range oils and gasses. The degasser also separates heavy oil from wastewater and skims off the separated heavy oil. The degassed wastewater is sent to the wastewater treatment system.
In 1998, Chevron installed a degasser at the #4 Crude Unit which proved to be highly effective in removing excess entrained oil from the crude desalter wastewater effluent. Because of these favorable results, the refinery is evaluating the option of installing a second degasser plant at the #2 Crude Unit to improve oil recovery. Because the #2 Crude Unit processes crude types that are different from that of the #4 Crude Unit, the refinery will need to identify and resolve technical and economic details to determine the feasibility of this source reducing measure.
f. Evaluation of Tank Water-Draw Monitoring Equipment Chevron reported its plans to evaluate the installation of monitoring equipment to detect changes from water to oil during tank water-draws that are directed to the drain. This equipment would sound an alarm and stop the drainage, once notable oil is detected in the tank water-draw flow stream. Evaluation will include identifying and resolving cost and technical details of the installation, training and operation, and maintenance of the flow monitoring devices.
Chevron reported that this source reduction measure would generate less oil/water separator sludge, reduce refinery reprocessing costs resulting from the recovery of oil from the separators, reduce waste releases and discharge into the environment, and improve compliance efforts and wastewater treatment plant operations.
45
g. Drain Filters and Blockades Chevron considered installing drain filters and blockades to prevent dirt and debris from entering the refinery drain system. According to Chevron, there are over three thousand process and run-off drains throughout the refinery. Miscellaneous dirt and debris from traffic, plant wash downs, and other refinery operations routinely infiltrate drains. In addition, during plant shutdown maintenance activity (such as welding or other construction work), Chevron covers drain entry points with sandbags to prevent dirt and debris from entering the drain system. These sandbags often become weathered and deteriorated allowing sand from the bags to enter the drain system.
According to Chevron, filters and blockades could be installed at the refinery to filter or block drain entry points. By reducing dirt and debris in the drains, generated oil/water separator sludge would be reduced. The refinery is determining optional locations installed, source reduction effectiveness and cost.
2. Tank Bottom Waste - CWC 241 Chevron reported tank bottom waste as a major waste stream in 1994 and a minor waste stream in 1998. Chevron indicated that the amount of tank bottom wastes generated each year is primarily dependant on the number of tanks taken out of service for inspection, cleaning, repair, and upgrading. Although tank bottom wastes are not currently captured by SB 14, Chevron does include this waste stream in its hazardous waste source reduction program.
Chevron’s ongoing tank inspection and maintenance program includes re-coating tank interiors to reduce corrosion and increase the service cycle of the tanks. Reduced corrosion would result in reduced generation of corrosion solids that occur as tank bottom waste.
It was difficult for Chevron to assess how much benefit this measure will provide, because the refinery does not take tanks out of service frequently. Chevron will measure the effectiveness of this source reducing measure over an extended period of time.
3. Spent Catalyst - CWC 162 Chevron reported spent catalyst as a major waste stream in 1994 and a minor waste stream in 1998. Periodically the refinery generates spent catalyst in large enough quantities to identify it as a major waste stream, and subject to regulation. Therefore, Chevron elected to include spent catalyst in its hazardous waste source reduction program.
Spent catalyst is generated during refinery operations to increase production of light fraction petroleum products, like gasoline. Source reduction opportunities are limited for spent catalyst. Chevron utilizes industry-developed optimal catalysts in its refinery operations, so the company does not find material substitution to be an economical alternative. The only option identified by Chevron for spent catalyst was off-site recycling for metals recovery.
According to Chevron, transportation costs and market demand for reclaimed metal, affect recycling economics. Therefore, sometimes the refinery elected to
46
ship spent catalyst off site for disposal. Between 1994-1998, Chevron recycled an average of 31 percent of its spent catalyst.
4. Spent Sandblast - CWC 181 and CWC 352 Although it is a minor waste stream under SB 14, Chevron reported spent sandblast in the refinery hazardous waste source reduction program. Chevron was evaluating substitutions to reduce the metals content in spent sandblasting material. Much of spent sandblast is characterized as non-RCRA hazardous waste because the unused grit contains copper. One source reduction option considered by Chevron was the use of alternative blasting materials with low metals content.
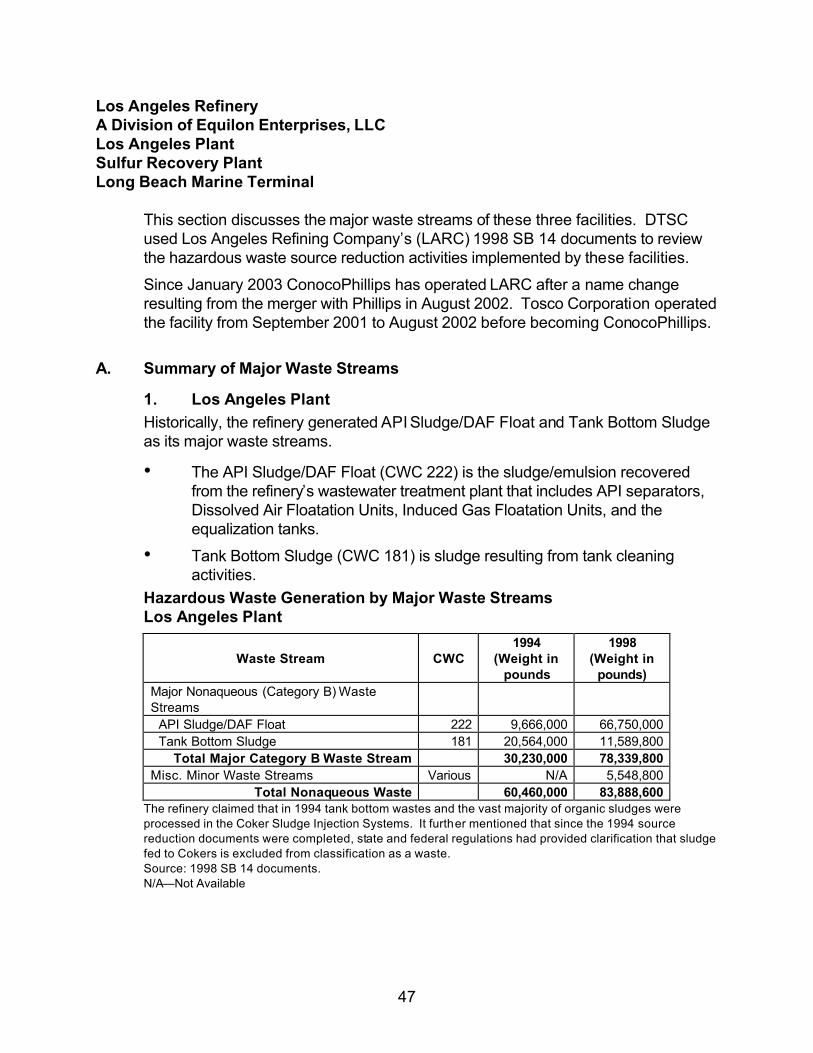
47
Los Angeles Refinery A Division of Equilon Enterprises, LLC Los Angeles Plant Sulfur Recovery Plant Long Beach Marine Terminal
This section discusses the major waste streams of these three facilities. DTSC used Los Angeles Refining Company’s (LARC) 1998 SB 14 documents to review the hazardous waste source reduction activities implemented by these facilities.
Since January 2003 ConocoPhillips has operated LARC after a name change resulting from the merger with Phillips in August 2002. Tosco Corporation operated the facility from September 2001 to August 2002 before becoming ConocoPhillips.
A. Summary of Major Waste Streams
1. Los Angeles Plant Historically, the refinery generated API Sludge/DAF Float and Tank Bottom Sludge as its major waste streams.
• The API Sludge/DAF Float (CWC 222) is the sludge/emulsion recovered from the refinery’s wastewater treatment plant that includes API separators, Dissolved Air Floatation Units, Induced Gas Floatation Units, and the equalization tanks.
• Tank Bottom Sludge (CWC 181) is sludge resulting from tank cleaning activities.
Hazardous Waste Generation by Major Waste Streams Los Angeles Plant
Waste Stream
CWC
1994 (Weight in
pounds
1998 (Weight in
pounds) Major Nonaqueous (Category B) Waste Streams
API Sludge/DAF Float 222 9,666,000 66,750,000 Tank Bottom Sludge 181 20,564,000 11,589,800
Total Major Category B Waste Stream 30,230,000 78,339,800 Misc. Minor Waste Streams Various N/A 5,548,800
Total Nonaqueous Waste 60,460,000 83,888,600 The refinery claimed that in 1994 tank bottom wastes and the vast majority of organic sludges were processed in the Coker Sludge Injection Systems. It further mentioned that since the 1994 source reduction documents were completed, state and federal regulations had provided clarification that sludge fed to Cokers is excluded from classification as a waste. Source: 1998 SB 14 documents. N/A—Not Available
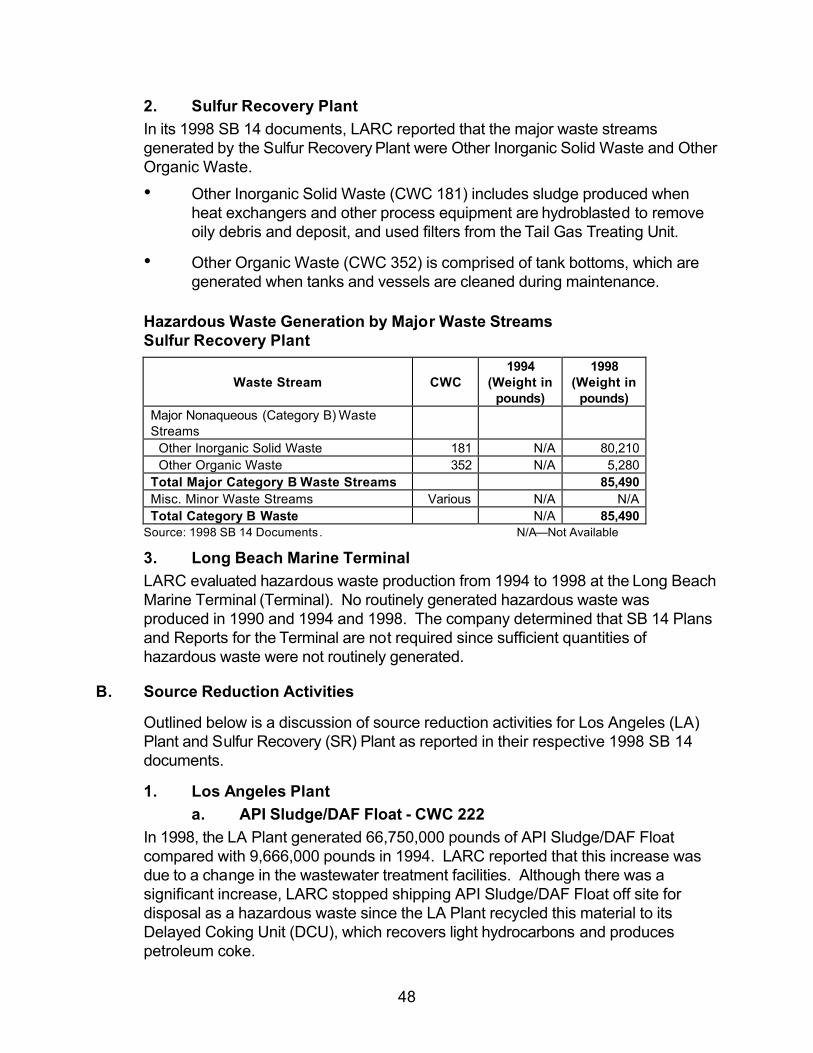
48
2. Sulfur Recovery Plant In its 1998 SB 14 documents, LARC reported that the major waste streams generated by the Sulfur Recovery Plant were Other Inorganic Solid Waste and Other Organic Waste.
• Other Inorganic Solid Waste (CWC 181) includes sludge produced when heat exchangers and other process equipment are hydroblasted to remove oily debris and deposit, and used filters from the Tail Gas Treating Unit.
• Other Organic Waste (CWC 352) is comprised of tank bottoms, which are generated when tanks and vessels are cleaned during maintenance.
Hazardous Waste Generation by Major Waste Streams Sulfur Recovery Plant
Waste Stream
CWC
1994 (Weight in
pounds)
1998 (Weight in
pounds) Major Nonaqueous (Category B) Waste Streams
Other Inorganic Solid Waste 181 N/A 80,210 Other Organic Waste 352 N/A 5,280 Total Major Category B Waste Streams 85,490 Misc. Minor Waste Streams Various N/A N/A Total Category B Waste N/A 85,490
Source: 1998 SB 14 Documents. N/A—Not Available
3. Long Beach Marine Terminal LARC evaluated hazardous waste production from 1994 to 1998 at the Long Beach Marine Terminal (Terminal). No routinely generated hazardous waste was produced in 1990 and 1994 and 1998. The company determined that SB 14 Plans and Reports for the Terminal are not required since sufficient quantities of hazardous waste were not routinely generated.
B. Source Reduction Activities
Outlined below is a discussion of source reduction activities for Los Angeles (LA) Plant and Sulfur Recovery (SR) Plant as reported in their respective 1998 SB 14 documents.
1. Los Angeles Plant a. API Sludge/DAF Float - CWC 222
In 1998, the LA Plant generated 66,750,000 pounds of API Sludge/DAF Float compared with 9,666,000 pounds in 1994. LARC reported that this increase was due to a change in the wastewater treatment facilities. Although there was a significant increase, LARC stopped shipping API Sludge/DAF Float off site for disposal as a hazardous waste since the LA Plant recycled this material to its Delayed Coking Unit (DCU), which recovers light hydrocarbons and produces petroleum coke.
49
LARC’s hazardous waste management philosophy has been to minimize hazardous waste generation and to maximize recycling. To reduce the amount of API Separator sludge and sewer sludge, the LA Plant paved a number of areas in the refinery. LARC also implemented controls to minimize the amount of oil and debris entering sewers. This include: collecting oil from reciprocating equipment to be used as feedstock for the DCU, sweeping coke and transporting to the coke pile, and using cyclonic precipitators to reduce the amount of fines that contribute to sewer sludge.
In the 1998 SB 14 documents, the LA Plant reported evaluating the following measures it planned to implement in the next four years to reduce the generation of API Sludge/DAF Float.
• Cooling Tower Water Make-Up Softening: The refinery controls cooling tower blowdown to maintain an optimum economic level of dissolved solids in the circulating cooling water. Blowdown water is sent to the wastewater treatment plant. Softening of cooling water would reduce the amount of dissolved solids in the cooling tower make-up water, thus reducing the need for a blowdown, requiring less make-up water.
• Demineralized Boiler Feed Water: The boiler blowdown contributes to the amount of API separator Sludge, DAF Float and IGFU Float. Boiler blowdown is the removal of high dissolved solid residual boiler water from a boiler system. Conditioned boiler feedwater replaces the blowdown water. Control parameters and the feedwater quality affect the amount of blowdown. As the feedwater quality improves, blowdown frequency can be reduced while still meeting the control standards.
b. Tank Bottom Sludge - CWC 181 To minimize the amount of tank bottoms sent offsite, the LA Plant removes tank bottoms and recycles them to the DCU. The refinery reported evaluating a number of options prior to injecting tank bottoms to the DCU to improve the efficiency of coker injection, including centrifuging or dewatering the sludge, increasing coker injection capacity, and using mixers to decrease sediment generation. LARC continues to recycle tank bottom sludge.
2. Sulfur Recovery Plant a. Other Inorganic Solid Waste - CWC 181
The SR Plant reported implementing the following administrative steps to reduce the generation of its hazardous waste:
• The SR Plant requires all hourly housekeeping personnel to routinely practice oil spill prevention and observe and correct any practices which may cause a spill;
50
• Management encouraged employee involvement and solicits employee input to identify source reduction approaches. LARC trains employees to emphasize source reduction and, recognizes individuals for waste minimization actions;
• The SR Plant routinely develops and publicizes waste summaries; and
• The company periodically disseminates educational information and holds meetings to encourage waste minimization, recycling, and good housekeeping practices.
b. Other Organic Waste - CWC 352 In implementing the administrative steps discussed above to reduce CWC 181, The SR Plant also implemented these same practices to generally reduce all wastes, including CWC 352.
51
Exxon Mobil Corporation Torrance Refinery
Exxon Mobil’s major waste streams are discussed in this section. The facility’s SB 14 documents prepared in 1998 were used to discuss the hazardous waste source reduction activities implemented by the facility.
A. Summary of Major Waste Streams
Exxon Mobil identified four major waste streams that are subject to California hazardous waste source reduction regulations in its 1998 SB 14 documents. These were aqueous solution with organic residue (CWC 134), aqueous oil/water separator sludge (CWC 222); monoethanolamine reclamation waste (CWC 343); and oily debris, spent filter clay, spent sandblast material, and spent steam reformer catalyst waste (CWC 352).
1. Aqueous Solutions Waste - CWC 134 Aqueous solutions waste classified as CWC 134, contains total organic residues of less than 10 percent. This waste stream is the total flow of the segregated process wastewater collection system, or “process sewer.” Process wastewater enters the process sewer at many process drains and direct connections throughout the refinery.
• Process unit drains: All process units in the refinery are located on concrete pads to prevent site soil contamination. These pads collect hydrocarbon drips, leaks, or spills from the process units. These pads are washed down periodically with steam, water, and/or other cleaning agents. These pads drain to the process sewer. Lubricants and hydrocarbons from pumps, compressors, and other rotating process equipment may seep from seals and gaskets and this material is directed to drains that are connected to the process sewer.
• Sample port drains: Refinery operations require frequent sampling of intermediate and final products. Sample ports are located throughout the refinery. Typically, sample ports are located directly above a drain to the process sewer. The refinery’s reported normal procedure was to let the sample port run into the sewer for a time sufficient to purge the line from the process, so that a representative process sample can be taken. Any dripping during sampling also drains to the sewer.
• Oil/water separation vessels: Vessels are located throughout the Torrance refinery to provide water separation from hydrocarbons. Separated water may be drained to the process sewer.
• Vacuum truck washout station: Vacuum trucks are tank trucks equipped with suction pumps. They collect and transport liquids and sludges from a variety of operations within the refinery. To prevent mixing of incompatible fluids and cross-contamination of transported product, the refinery washes out vacuum trucks with water between service changes. The vacuum truck washout
52
station is a concrete basin with a sump and an overflow weir. The weir overflow which contains oil and water drains into the process sewer. Oily solids settle out in the sump as sludge and are periodically removed.
• Heat exchanger cleaning pad: Exxon Mobil routinely cleans heat exchanger bundles to maintain their efficiency. The bundles are cleaned to remove accumulated residues that deposit from the process streams that are heated or cooled in the exchangers. Hydro-blasting and steam is used to clean the tube bundles which results in generation of heat exchanger cleaning pad waste. This is done on a concrete pad that contains a drain sump that overflows into the process sewer.
• Tank dike drains: Dikes surround storage tanks to contain accidental leaks and spills from tank and tank fixtures. Exxon Mobil’s diked areas typically contain a process sewer drain. The refinery can drain leaks or spills to the process sewer for recovery. Storm water accumulating inside the diked areas is also typically drained to the process sewer.
• Boiler blowdown: Steam boilers in the refinery require occasional discharge of boiler water as wastewater to maintain the mineral content of the boiler water within target operating limits. The refinery directs the discharged boiler wastewater, or “blowdown,” to the process sewer. The blowdown, which contains mineral precipitate and scale, contributes to the generation of sludge at the wastewater treatment plant.
• Water drainage from storage tanks: Over time, water condenses and accumulates inside intermediate and final product storage tanks. Condensate collects at the bottom of the tanks, where it is periodically drained off as oily water and discharged to the process sewer for oil recovery at the industrial wastewater treatment plant.
2. Oil/Water Separator Sludge and Other Oily Solids - CWC 222 Most of the waste classified as CWC 222 consists of oil/water separator sludge, which is aqueous waste generated when sludge is separated from the process wastewater in the industrial wastewater treatment plant. This sludge is considered an aqueous waste since it is generated as a result of treating process wastewater.
CWC 222 also includes oily sludges (or solids) that may be managed as nonaqueous hazardous waste. These sludges include the residues from heat exchanger bundle cleaning (RCRA K050), tank bottoms, and vacuum truck washout (RCRA F037).
These oily sludges are normally recycled to the Coker Unit at the refinery for oil recovery under the exemption provided in Section 25144 of the California Health and Safety Code.
53
3. Scale Solids - CWC 181 Scale solids are generated when process equipment is cleaned. As much of the oil bearing scale is recycled to the Coker Unit through the Mobil Oil Sludge Coking (MOSC) process as possible. No scale solids were reported in 1998.
4. Monoethanolamine Reclamation Waste - CWC 343 Monoethanolamine reclamation waste, a nonaqueous waste, included draw-off from the MEA reclaimer (non-RCRA) and reclaimer bottoms.
5. Non-RCRA Oily Debris, Spent Process Media, and F037 Waste - CWC 352 This nonaqueous waste category included a variety of wastes from various refinery operations, such as, discarded coker gaskets, tar solids, wood spent filters, spent filter clay, spent sandblast material and spent steam reformer catalyst.
Hazardous Waste Generation by Major Waste Stream
Wastes
CWC
1994 (Weight in
pounds)
1998 (Weight in
pounds) Aqueous (Category A) Waste Aqueous Solution with Organic Residue 134 10,490,000,000 11,097,100,000 Oil/Water Separator Sludge (RCRA F and K listed) 222 109,499,520 82,207,440 Total Category A Waste 10,599,499,520 11,179,307,440 Nonaqueous (Category B) Waste Scale Solids 181 141,450 0 Oily Solids (RCRA K050 and F037) 222 696,000 37,880 Non-RCRA Monoethanolamine Wastes 343 N/A 327,520 Non-RCRA Oily Debris, Filter Clay, Spent Sandblast, Reformer Catalyst, RCRA F037
352 1,371,760 2,088,496
Total Category B Waste 2,209,210 2,453,896 Total Waste (Category A &B) 10,601,708,730 11,181,761,336
Source: Exxon Mobil’s 1998 SB 14 documents, and Exxon Mobil letter to DTSC dated September 3, 2003. N/A—Not Available
B. Source Reduction Activities
The following is a discussion of source reduction activities for Exxon Mobil. DTSC obtained source reduction information from the 1998 SB 14 documents prepared by Exxon Mobil.
1. Aqueous Solution with Organic Residue - CWC 134 Aqueous solution with organic residue waste (CWC 134) contains primarily oily process wastewater accumulated from the refinery. Source reduction opportunities for this waste stream include:
• Oil recovery: Exxon Mobil recovers and recycles oil to the refining process by blending it with the refinery’s crude oil feed stream. The refinery sends oily sludge generated in the wastewater treatment plant and other sources to the on site MOSC Process, at the Coker Unit. The Coker recovers the hydrocarbon content of sludge as coker product and as volatiles, which are returned to the refinery for fractionation. The refinery ships a small quantity of
54
oily debris from the wastewater treatment system for disposal off site only when it has been determined it can not be recycled to the Coker.
• Prevent particulate debris from entering the process sewer: The refinery implemented a procedure to cover process sewer drains during maintenance work and catalyst changeouts to prevent dust and particulates from entering the sewer. Preventing debris entry to the process sewer reduced the generation of sludge.
• Improved sampling system: The refinery installed many closed loop sampling systems to prevent discharge of process material and product into the process sewer during sampling. In addition, purged material is diverted from the process sewer and is recycled back to the process, reducing discharge to the process sewer.
• Reduce entry of nonhazardous waters into the process sewer: Exxon Mobil conducted several water conservation studies. As a result, water is often reused in the refinery where it is economically practical to do so.
• Product reformulation for clean fuels: New gasoline formulation standards have reduced the benzene in fuel by about half. It has also reduced benzene contaminants in the refinery process wastewaters. To meet the new standards, the refinery decommissioned a process unit that had a tendency to form benzene and other aromatic blending stock.
2. Oil/Water Separator Sludge - CWC 222
Exxon Mobil recycles nearly all of its oil/water separator sludge into the refinery Coker Unit via the MOSC process. Some sludge contains debris and cannot be recycled to the Coker Unit, so it is shipped off site.
In its 1998 SB 14 documents, Exxon Mobil reported considering a study that would evaluate source reduction measures for the solids generated at the vacuum truck washout station sump. The study would evaluate the following feasibility measures:
• Stop addition of particulate solids to washout sump: Prior studies have shown that dirt or sand entering the sump adsorbs oil, which expands the volume of sludge generation by five to eight times. Exxon Mobil is considering studying additional source reduction measures for the sump solids. However, keeping solids out of the washout sump will be difficult due to the nature of the various vacuum truck services.
• Reduce the number of truck washouts: Exxon Mobil will look at an operational improvement of dedicating vacuum trucks to specific services to reduce the need to washout trucks between service changes. This measure is unproven to reduce the accumulation of sump solids.
55
• Segregate the truck washouts: Exxon Mobil will explore the segregation of hazardous from nonhazardous vacuum truck washouts. This may require the installation of a second washout station or modification to the existing washout station to provide waste segregation.
• Eliminate the vacuum truck washout station: This production process change would provide alternatives to the vacuum truck washout station. However, even if the refinery eliminated the vacuum truck washout area, the result might only shift the point of waste generation.
• Track usage of the washout area: In this administrative source reduction measure, Exxon Mobil would use a log book or computer file to track usage of the washout station. The log would be reviewed to determine which vacuum truck services leave the most particulate matter and then work on them to reduce contribution.
3. Scale Solids - CWC 181 Source reduction opportunities are limited, since this material is generated when process equipment is cleaned.
4. Monoethanolamine Reclamation Waste - CWC 343 Exxon Mobil reported no source reduction alternatives for its monoethanolamine reclamation waste stream. The refinery has no substitute for amine, and could not suggest operational improvements, product reformulation, or administrative steps to reduce the amount of amine required.
5. Non-RCRA Oily Debris, Spent Process Media, and F037 Waste - CWC 352 This nonaqueous waste stream from a variety of operation sources throughout the refinery included oily debris such as discarded coker gaskets, tar solids, and wood; spent filters; spent filter clay; spent sandblast; and spent steam reformer catalyst. One source reduction measure considered by Exxon Mobil was the segregation of some of the debris, discards, and residuals, accompanied by improved waste testing and classification of various components of the waste stream. This could result in some of the segregated components classifying as nonhazardous.
Many types of spent catalyst are sent to facilities where they are regenerated. In some cases, when the catalyst can not be regenerated, spent catalyst may be recycled offsite to recover components that can be beneficially used such as metals.
56
Tosco Refining Company Los Angeles Refinery Carson Plant Wilmington Plant Marine Terminal
The major hazardous waste streams of the Tosco Los Angeles Refinery are discussed in this section. The facilities’ 1998 SB 14 documents submitted to the DTSC were used to discuss the hazardous waste source reduction activities implemented by the Carson and Wilmington Plants. Tosco has included both the Carson and Wilmington Plants in one set of SB 14 documents because they approach hazardous waste source reduction as a whole at the Tosco Los Angeles Refinery. For this reason, waste generation and source reduction activities are organized in this section by major waste stream, with specific reference to Carson or Wilmington when applicable.
The Marine Terminal did not generate major hazardous waste streams and, therefore, is not subject to the source reduction regulations.
A. Summary of Major Waste Streams
Major aqueous hazardous waste streams generated at the Carson and Wilmington Plants in 1994 and 1998 included aqueous solution with metals (CWC 132) and weak acid waste (CWC 791). Major nonaqueous hazardous waste streams included spent catalysts (CWC 162), inorganic solid wastes (CWC 181), other organic solids (CWC 352/222), and tank bottom waste (CWC 241). Spent catalysts represented 27 percent of the total nonaqueous hazardous wastes generated in 1998. Inorganic solids represented 67 percent of the nonaqueous waste total. Other organic solids comprised only 4 percent of the 1998 nonaqueous total, which identifies it as a minor waste stream.
1. Aqueous Solution with Metals - CWC 132 Operations at the Carson and Wilmington Plants generate aqueous wastes with selenium. This is because selenium occurs naturally in crude oil. In refinery processing, some selenium is removed from the crude and eventually flows to the sour water waste stream. If the selenium concentration in sour water exceeds one part per million by weight (ppm), the sour water classifies as a non-RCRA California hazardous waste. The sour water is treated in the Sour Water Stripper, which removes nitrogen, sulfur, and metal compounds. The treated effluent is either recycled to the refinery processes, or discharged to the POTW.
Aqueous solutions with metals comprised 98 percent of total hazardous waste generated in 1998. This waste stream was not included in the refinery’s 1994 SB 14 documents because, at that time, the POTW did not require the facility to assess the selenium content of their sour water.
57
2. Weak Acid Waste - CWC 791 The Wilmington Plant generates weak acid waste in its Sulfuric Acid Plant. This aqueous waste stream is produced during the second phase of Sulfuric Acid Plant operation involving the purification and cooling of sulfur dioxide process gas. During this phase, sulfur dioxide process gas is cooled through the addition of quench water in a scrubbing system, which also removes particles and some weak acid (sulfur trioxide). A heat exchanger and stripper are then used to condense and remove more weak acid and water from the process gas. The gas is then purified of sulfur trioxide and particles in a second and final scrubber. The weak acid waste stream exits the two scrubbers and the stripper.
In 1994, weak acid waste was considered a major waste stream comprising 76 percent of the total hazardous waste generated. Due to the inclusion of CWC 132 as an aqueous hazardous waste stream in 1998, and due to successful source reduction efforts targeting weak acid waste, this waste stream was not classified as a major waste stream in 1998.
3. Spent Catalysts - CWC 162 The Tosco Los Angeles Refinery uses catalysts for numerous processes. Most spent catalyst generated at the Wilmington and Carson Plants are generated by Hydrotreating and Hydrocracking processes. The Sulfur Recovery Unit, Shell Claus Off-Gas Treatment (SCOT) Unit, Hydrogen Unit, and Penex Plus/Butamer Unit also generate small amounts of spent catalyst. When the catalyst activity in hydrotreating declines below an effective level, the spent catalyst from the Hydrotreater is sometimes used for hydrocracking. The refinery manages spent catalyst off site for regeneration, recycling, or reclamation.
Another spent catalyst is sulfuric acid from the Wilmington Plant’s alkylation unit. The spent acid is regenerated on site in the sulfuric acid unit.
4. Inorganic Solid Wastes - CWC 441/181 The Tosco Los Angeles Refinery generates inorganic solid waste from numerous sources. In 1998, approximately 66 percent of this inorganic solid waste consisted of Stretford sulfur waste, sulfur solids waste, and blasting grit residue.
• Stretford sulfur waste is generated during operation of the Beavon Stretford Tail Gas Unit at the Wilmington Plant. The unit processes off-gases from the sulfur recovery unit to recover residual sulfur compounds. Tail gases from the sulfur recovery unit first enter a Hydrogenation Reactor, where sulfur dioxide in the gas converts to hydrogen sulfide. The gas from the Hydrogenation Reactor is sent to an absorber, where the hydrogen sulfide is absorbed by reaction with Stretford solution. The absorbed hydrogen sulfide then reacts with sodium vanadate in the solution, which precipitates elemental sulfur. The solution is then regenerated by oxidation of the vanadium to its original state. The oxidation occurs through air injection in the oxidizer flotation tank, which separates the sulfur by flotation. The sulfur froth is then filter-pressed to recover Stretford solution. The filter cake sulfur is the Stretford sulfur waste. The vanadium content of the Stretford sulfur waste and sulfur solids
58
waste classifies the wastes as a non-RCRA hazardous waste. The refinery manages the wastes by off-site disposal at a hazardous waste landfill.
• Sulfur solids waste is generated during the tail gas unit maintenance turnaround work and handled as described above.
• Blasting grit is spent blasting media that had been used to strip away paint and debris from tanks, vessels, and appurtenances. Blasting is used to prepare surfaces for painting and other maintenance. The most common blasting media in refinery maintenance are steel shot and sand. Unlike sand, steel shot media can typically be recovered and reused numerous times because it does not fracture upon impact with the surface being blasted. Blasting grit is managed by off-site disposal at a hazardous waste landfill.
In the 1994 SB 14 documents, the sulfur-containing waste was designated as CWC 441 while blasting grit was designated as CWC 181. In the 1998 SB 14 documents, the sulfur waste was designated as CWC 181 along with blasting grit and other inorganic waste.
5. Other Organic Solids - CWC 222/352 Both the Carson and Wilmington Plants generate organic solids in various oil recovery units. These units separate oil, water, and solids from the oily water and oily sludge generated during refinery operations.
Tosco uses several separation methods to remove organic solids, including gravimetric oil/water separators, such as API Separators, and Corrugated Plate Interceptors (CPIs). Another separation is by air injection in Dissolved Air Flotation (DAF) Separators. Most of the organic solids generated from oil recovery are oil bearing materials excluded from being classified as waste because they are processed in the Coker at the Carson Plant to recover oil and produce petroleum coke product.
A small percentage of organic solids from the separators have a high specific gravity and cannot be pumped into the Coker Unit Sludge Injection System. These solids are treated and taken off site either for disposal at a hazardous waste landfill or for incineration.
6. Tank Bottom Waste - CWC 241 Tank bottom waste is generated at the Carson Plant during the cleaning of tanks used to store raw crude and various intermediate process streams. Materials that settle out and/or accumulate in tank bottoms include water; solids in the crude or intermediate streams; rust or scale from tanks, pipes and other equipment; and heavy wax-like hydrocarbons. These materials accumulate very slowly over time and are removed when a tank is taken out of service, usually for repairs or routine inspection.
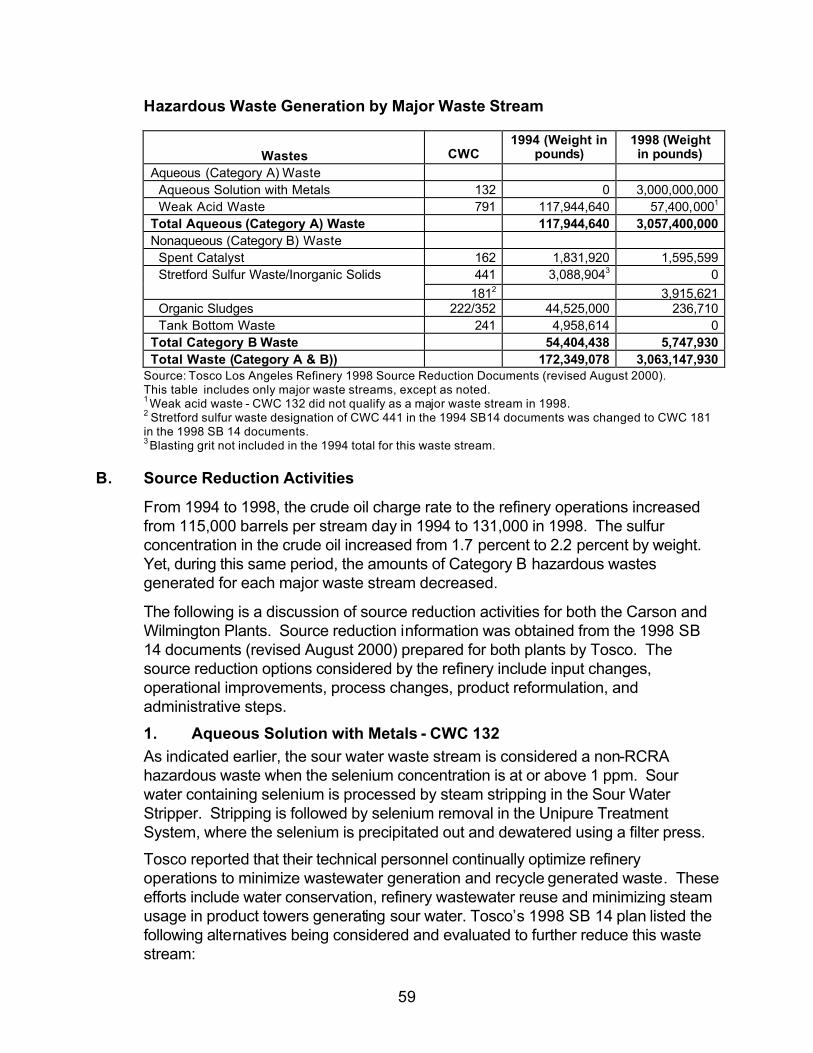
59
Hazardous Waste Generation by Major Waste Stream
Wastes
CWC
1994 (Weight in pounds)
1998 (Weight in pounds)
Aqueous (Category A) Waste Aqueous Solution with Metals 132 0 3,000,000,000 Weak Acid Waste 791 117,944,640 57,400,0001
Total Aqueous (Category A) Waste 117,944,640 3,057,400,000 Nonaqueous (Category B) Waste Spent Catalyst 162 1,831,920 1,595,599
441 3,088,9043 0 Stretford Sulfur Waste/Inorganic Solids 1812 3,915,621
Organic Sludges 222/352 44,525,000 236,710 Tank Bottom Waste 241 4,958,614 0 Total Category B Waste 54,404,438 5,747,930 Total Waste (Category A & B)) 172,349,078 3,063,147,930
Source: Tosco Los Angeles Refinery 1998 Source Reduction Documents (revised August 2000). This table includes only major waste streams, except as noted. 1 Weak acid waste - CWC 132 did not qualify as a major waste stream in 1998. 2 Stretford sulfur waste designation of CWC 441 in the 1994 SB14 documents was changed to CWC 181 in the 1998 SB 14 documents. 3 Blasting grit not included in the 1994 total for this waste stream.
B. Source Reduction Activities
From 1994 to 1998, the crude oil charge rate to the refinery operations increased from 115,000 barrels per stream day in 1994 to 131,000 in 1998. The sulfur concentration in the crude oil increased from 1.7 percent to 2.2 percent by weight. Yet, during this same period, the amounts of Category B hazardous wastes generated for each major waste stream decreased.
The following is a discussion of source reduction activities for both the Carson and Wilmington Plants. Source reduction information was obtained from the 1998 SB 14 documents (revised August 2000) prepared for both plants by Tosco. The source reduction options considered by the refinery include input changes, operational improvements, process changes, product reformulation, and administrative steps.
1. Aqueous Solution with Metals - CWC 132 As indicated earlier, the sour water waste stream is considered a non-RCRA hazardous waste when the selenium concentration is at or above 1 ppm. Sour water containing selenium is processed by steam stripping in the Sour Water Stripper. Stripping is followed by selenium removal in the Unipure Treatment System, where the selenium is precipitated out and dewatered using a filter press.
Tosco reported that their technical personnel continually optimize refinery operations to minimize wastewater generation and recycle generated waste. These efforts include water conservation, refinery wastewater reuse and minimizing steam usage in product towers generating sour water. Tosco’s 1998 SB 14 plan listed the following alternatives being considered and evaluated to further reduce this waste stream:
60
• Sour water evaluation: To optimize stripped sour water use, Tosco technical personnel evaluated systems used at other refineries. Data obtained from this study will be provided to respective unit process and operations engineers for appropriate feasibility assessments and, as warranted, project implementation. Tosco technical personnel calculated material balances on sour water to identify sour water minimization projects. Results indicated that sour water generation could be reduced significantly at the Hydrocracker and the Fluidized Catalytic Cracker. These results were subject to further evaluation.
• Use stripped sour water in Coker: The quality of stripped sour water at the Carson Plant may be suitable for use in the Coker. The refinery is evaluating the use of stripped sour water to supplement the quench and cutting water used to finish the product coke.
• Return the Sour Water Stripper Reboiler to service: Until 1988, the Carson Plant used a reboiler to reheat sour water from the sour water stripper. In the reboiler, sour water flowing through tubes was reheated using utility steam (non-contact) to form a steam/water mixture. The reheated sour water recirculated to the stripper while the spent steam and condensate circulated back to the utility steam header. With the reboiler, utility steam does not contact sour water. This indirect use of steam to reheat sour water minimized the amount of live steam contaminated with sour water.
Due to reoccurring operating problems with the reboiler, the Carson Plant stopped its use in 1988. Since then, the Carson Plant uses utility steam at the stripper tower without condensate recovery. The Carson Plant is considering returning the reboiler to service provided they could remedy operating problems and ensure consistent stripper operations. By returning the reboiler to service, Tosco anticipates that steam usage and the amount of sour water contaminated steam would both be reduced.
• Substitute desalter brine recirculation with stripped sour water: All crude oil undergoes a two-stage desalting process to remove chlorides and other impurities naturally existing. If not removed, these impurities can foul downstream pipes, exchangers, heater tubes, and process fixtures. First stage desalters wash the crude with water in horizontal cylindrical vessels. This is followed by second stage polishing desalters. Recycled process waters provide the wash water for the desalters. Currently, this recycled water includes a brine slipstream, referred to as brine recirculation, from the second stage desalters. Tosco evaluated using stripped sour water instead of brine recirculation to supplement the wash water for the desalters. The stripped sour water would have come from the sour water stripper effluent prior to selenium removal, thereby reducing the volume of selenium-impacted water requiring treatment. However, this option was not economically justified.
61
• Optimize use of stripping steam: Stripping steam is used in product towers that generate sour water. To minimize steam use and improve operations, Tosco recently installed two additional crude desalters at the Carson Plant. The additional desalters reduce downstream chloride corrosion and exchanger fouling. Optimum operation of the new desalters minimizes downstream sour water generation, thereby reducing stripping steam where the sour water is generated. The desalters reduce selenium aqueous waste generation by reducing exchanger wash water used for the hydrocracker wash water discharge exchanger.
• Sour water segregation at Wilmington: The Wilmington Plant has two sour water stripper towers. One tower is in operation and one is on stand-by. Tosco evaluated the possibility of operating both of the sour water strippers simultaneously, operating on sour water containing elevated levels of selenium. Tosco studied sour water streams discharged from various process units at the Wilmington Plant and found that about one-half of the streams contain selenium concentrations below the hazardous threshold criteria of 1 ppm.
Tosco considered separating out sour water with elevated selenium levels, and diverting it through one stripper and the Unipure Selenium Removal System. Other sour water streams with lower selenium levels would flow through the second stripper and then directly to the Oil Recovery Unit. Segregating the streams would result in less sour water being classified as hazardous waste and a reduction in flows to the Unipure Selenium Removal System. The refinery found capital expenditures required for process modifications necessary to segregate the streams to be too high to justify this source reduction option.
• Improve sampling of sour water stripper effluent: The refinery considered improving the sour water stripper effluent sampling system to ensure that only effluent with detectable selenium is routed to the Unipure Treatment System. Improved sampling of sour water stripper effluent would indicate when repeated cycles have stripped sour water stripper effluent to below the 1 ppm selenium hazardous threshold. Stripped water below the 1 ppm threshold would bypass the Unipure and go directly to the Oil Recovery Unit.
When Tosco looked at this option in 1998, the refinery found it impractical. At the time, no online analyzers and control valves were available that could precisely and automatically provide continuous process control.
• Reuse stripped sour water to wash process equipment: Exchangers and overhead fans in the Hydrocracker, Coker, and other process units need periodic washing. Tosco considered using stripped sour water for this washing purpose; however, since it contains dissolved solids and trace concentrations of corrosion inhibitors and sulfur compounds, it was not acceptable for the periodic washing. These constituents can foul exchanger and fan tubes, causing unscheduled process shutdowns. Tosco considered building new sour water stripping facilities at each process unit to recycle
62
sour water streams. However, financial analysis found unit-specific sour water strippers cost prohibitive.
• Use stripped sour water for flushing pump seals: In 1998, Tosco evaluated using stripped sour water in lieu of city or well water for flushing pump seals in refinery process. The refinery found this option unsuitable because stripped sour water has high dissolved solids and trace sulfur compound concentrations. The dissolved solids can deposit in the pump seals, causing fouling and unscheduled pump shutdowns. The trace sulfur compounds and dissolved solids may contaminate a process stream, because the seal water can sometimes enter the stream. Therefore, Tosco did not pursue this source reduction option.
• Substitute steam with hydrogen or fuel gas: Steam is used in some product stripper towers, resulting in a wastewater stream containing selenium. Tosco evaluated using hydrogen or fuel gas instead of steam, but found that product quality would be jeopardized. The hydrogen and fuel gas can impart increased vapor pressure into finished products, thereby causing gasoline and other products to exceed federal and state air emissions standards. Additionally, since the total steam usage for the Carson Plant’s stripper tower operations is only 3 percent of the total water makeup for sour water waste, this option would result in very little reduction of selenium in the sour water waste streams. Because of this minimal impact, and the risk to product quality, Tosco chose to not pursue this source reduction option.
2. Weak Acid Waste - CWC 791 The Wilmington Plant operations records indicated a 51 percent source reduction in acid waste generation from 1994 to 1998. However, the refinery did not implement any source reduction alternatives specific to weak acid waste during or before those years. Tosco reported that the improved source reduction is due to incremental improvements in unit operations that the refinery implemented to improve production efficiency. The Wilmington Plant neutralizes waste acid on site pursuant to California Permit-By-Rule regulations, and the neutralized acid is discharged to a POTW.
3. Source Reduction of Spent Catalysts - CWC 162 Tosco reports that they continually seek ways to minimize the amount and toxicity of spent catalyst generated at the Tosco Los Angeles Refinery. From 1994 to 1998, Tosco, shipped less than 1 percent of its spent catalyst off site for disposal. The remaining spent catalysts were either regenerated and used again or recycled at metals recovery/smelting facilities.
a. Source Reduction To minimize the generation of spent catalysts from refinery operations, Tosco process engineers maximize the service life of catalysts by optimizing the operation of each reactor. Following are examples of engineering activities successfully applied to increase catalyst run times and reduce waste generation.
63
• Upgrade Catalytic Reactor Outlet Collector: In 1998, Tosco replaced the outlet collector on the Wilmington Plant’s Diesel Unifiner with a new one of greater structural capacity. The outlet collector is the support structure located inside the reactor vessel at the base of the catalyst bed. A pressure differential is applied across the catalyst bed and the outlet collector to push the vapor or liquid process stream through the catalyst. As operational time for the catalyst accumulates, the pressure differential across the catalyst increases, thereby increasing the structural load on the outlet collector. The increased structural capacity of the new outlet collector permitted higher pressures to be maintained across the catalyst bed and outlet collector so that the complete life of the catalyst could be reached. As a result, the 12-18 month operational time of the Diesel Unifiner catalyst increased to 24 months, a 33-100 percent improvement in operational time.
• Increase sulfur recovery unit catalyst run time: In 1998, Tosco implemented two projects to extend operational life of the sulfur recovery unit catalyst at the Carson Plant. The first project involved evaluating vapor samples upstream and downstream of the catalyst. Results indicated that the catalyst was still operating at full activity even after three years. The second improvement involved removing sulfate from the catalysts to improve catalyst activity. Tosco raised catalyst temperatures and lowered the quantity of combustion air to remove sulfate. As a result, the sulfur recovery unit increased the catalyst operational life from three years to four years, a 33 percent improvement.
Tosco’s future source reduction plans for this waste stream involve ensuring that reactors are operating at optimum conditions through daily review of feed conditions, process operating variables, reactor pressures, and reactor inlet temperatures.
b. Off-Site Metal Reclamation For spent metallic base catalysts, the refinery recycles the catalyst off site for metal reclamation. However, the low market value of the recovered metals as a commodity, and the logistical cost of transporting spent catalyst, often precludes metal reclamation. This is because the small amount of catalyst, and extensive documentation and analytical data required for regulatory approval of each shipment, often makes metal reclamation not cost-effective. The refinery has arrangements with nearly a dozen off-site facilities for reclaiming the variety of metals used in refinery catalysts. Smelters reclaim zinc, iron, chromium, and copper. Metal leaching facilities reclaim nickel, cobalt, and molybdenum.
Tosco reported that they occasionally evaluate innovative off-site recycling options for spent catalysts. In 1996, Tosco sent a sample of spent alumina-base hydroprocessing catalyst to an abrasive manufacturing plant to determine if it could be used as a feed source. However, the test did not find it acceptable as a raw material.
64
4. Inorganic Solid Wastes - CWC 181 Eighty-seven percent of inorganic solid wastes are composed of sulfur solids and Stretford sulfur wastes generated at the Wilmington Plant’s Beavon Stretford Tail Gas Unit. Blasting grit generated at both the Carson and Wilmington Plants comprises a significantly smaller percentage of Tosco’s inorganic solid waste stream. Source reduction measures considered and/or implemented for these waste streams are described below.
a. Stretford Sulfur Waste and Sulfur Solids This waste stream generation increased slightly from 1994 to 1998. A source reduction measure implemented during that period involved increasing unit run lengths. Following is a description of this and other source reduction resources considered by Tosco for this waste stream.
• Increase unit run lengths: During shutdowns of the Stretford Sulfur and Tail Gas Units, the residual waste that coats the process vessels must be removed. By increasing the operational time between start up and shutdown of the Sulfur and Tail Gas Units, which operate in conjunction with each other, Tosco believed that the generation of this residual waste could be minimized.
In 1990, the Beavon Stretford Unit had numerous process upsets. These upsets prompted several shutdowns and, resulting in the purging and disposal of Stretford sulfur waste entrained in the idled units. By 1994, process upsets decreased because Tosco implemented several process improvements and mechanical repairs. Recently, the Sulfur and Tail Gas Units have reached operational time exceeding 18 months, thereby minimizing the amount of sulfur solids waste that must be removed after shutdowns.
• Beavon Stretford Unit replacement: The refinery is evaluating replacing the Beavon Stretford Unit with a selective amine-based tail gas unit, thereby eliminating Stretford and most sulfur solids waste generation. One of the most common amine units for tail gas is the SCOT Unit. The SCOT Unit typically uses methyldiethanolamine as the sour gas absorbent. The methyldiethanolamine is regenerated on site and about 10 percent must be replaced annually. The refinery already operates a SCOT Unit at the Carson Plant.
Tosco estimates that the amine unit would generate a nominal amount of waste annually. It would also reduce the Wilmington Plant’s operation expenditures for the treatment of sulfur-containing tail gases from $1.5 million per year to $50,000 per year. Expenditure savings include the costs of Stretford chemicals, Stretford regeneration, filter press operation, and waste disposal. However, replacing the Beavon Stretford Unit with an amine unit, involves capital investment exceeding $20 million.
• Replace Stretford absorber splash packing: Tosco considered replacing the existing wood splash packing in the Stretford absorbers with metal splash
65
packing to eliminate the need for disposal of decomposed wood packing. In the Stretford absorber, the splash packing uniformly distributes Stretford solution in the tower to maintain adequate surface area for liquid-gas interface contact with the hydrogen sulfide gas streams. Every 12 to 18 months, the wood packing deteriorates so that it needs to be replaced during maintenance turnaround work. In their evaluation, Tosco rejected this source reduction alternative indicating that wood packing is more economical to install than metal packing, and that the nominal waste disposal savings of $800 per turnaround was not sufficient enough to justify the replacement with metal packaging.
• Replace filter press: The Wilmington Plant currently uses a plate and frame filter press to recover Stretford solution in the tail gas unit. This filter press simply filters the Stretford precipitate from the solution, returns the filtrate to the process balance tanks, and compresses the precipitate into a filter cake. The filter cake from the press contains vanadium so that it classifies as a non-RCRA California hazardous waste and, therefore, is disposed of at a landfill. In 1997, the Wilmington Plant attempted to water wash the filter cake to remove vanadium from the filter cake, rendering it non-hazardous. However, the wash failed to effectively remove vanadium from the cake.
In 1999, Tosco considered replacing the Stretford filter press with a Verti Press/Water Wash belt filter operation that uses a belt filter press in conjunction with 5 gpm of water wash. The filter cake was water washed to remove vanadium, rendering it non-hazardous. The belt filter cake could be sold for fertilizer manufacture or other industrial use. The filtrate and spent wash water containing the vanadium would be returned to the tail gas unit for process use. However, Tosco determined that the Verti Press/Water Wash belt filter was not an economical replacement for the Stretford filter press. This was because additional evaporative cooling capacity would be required to remove the increased water content present in the belt filtrate. The estimated costs of the belt filter and increasing the evaporative cooling capacity could easily exceed $5 million. Tosco considers this cost as prohibitive and not justified by any operational improvements it would provide.
• Oxidizer flotation tank: The Tail Gas Unit removes sulfur from sour intermediate process streams. Sulfur compounds are removed with Stretford solution, then separated in the oxidizer flotation tank. The sulfur froth is then stored in the sulfur storage tanks. Some sulfur deposits onto the interior of the flotation tank. These deposits are removed during maintenance turnaround work. After review and research, Tosco technical personnel determined there is no efficient means to avoid the sulfur deposits or to improve the flotation tank.
66
b. Blasting Grit Waste Three percent of CWC 181 wastes at the refinery is blasting grit. More than half of this blasting grit is generated from blasting above ground tanks and their fixtures during maintenance work. The Tosco Los Angeles Refinery considered two source reduction measures for this waste stream.
• Refinery-wide tank use optimization: In 1993, the refinery established a tank optimization program to evaluate whether to continue using a tank after its downtime for routine maintenance work. The goal of the optimization program is to ensure maximum return from refinery assets. The optimization program has reduced the number of tanks in use, thereby reducing the total tank surface area that is blasted in maintenance activities. The program allows tanks to be returned to service if economically justified.
• Closed Loop Blasting / Contractor Selection: The refinery tested and approved the use of a closed loop blasting system that uses steel shot. The steel shot does not fracture as easily as sand media and can be re-used several times. Tosco reports that the use of closed loop blasting contributed to a 98 percent decrease in this waste stream from 1990 to 1994. From 1994 to 1998, however, the refinery reported an increasing trend in the generation of blasting grit. As a source reduction measure, Tosco will consider source reduction of blasting grit generation in future contractor selection. Previously, the refinery chose blasting contractors based on bid prices for the blasting work only. In the future, the refinery will require that specified project costs include blasting work and waste management.
5. Organic Solids - CWC 222/352 Oil/water separation sludge and other organic solids are generated at both the Carson and Wilmington Plants. In 1994, the California Health and Safety Code Section 25144 established sludge fed to Coker as on-site recycling; therefore, excluding such sludge from classification as a waste. Most of the oily sludge generated at the Tosco Los Angeles Refinery is recycled to the sludge injection system as a feed stream to the Coker at the Carson Plant. As a result, the amount of organic solids managed as hazardous waste at both the Carson and Wilmington Plants decreased by 95 percent from 1994 to 1998. The only sludge the refinery reported as hazardous waste in 1998 is that which was managed off site.
Tosco considered the following source reduction possibilities for sludge generation.
• Inject high density sludge to Coker: Some sludge is too dense to be pumped by the Coker sludge injection system and is managed off site as hazardous waste. The refinery is evaluating a modified operating procedure or supplemental sludge pumping system to overcome this limitation.
• Tank farm modifications: Pursuant to a recommendation made in Tosco’s 1994 SB 14 documents, tank farm modifications were implemented at the Wilmington Plant to minimize the amount of sand, dirt, and debris that enters the refinery sewer collection system. Modifications included placing gravel in the vicinity of drain openings, paving small perimeter areas around the drain
67
openings, and adding lip berms to impede solids from entering the tank area drains. These changes had all reduced the sand and dirt that was generated as oily sludge by rainfall runoff to the sewer.
• Clean solids from storm water basin: Currently, all of the storm water impoundment basins at the Wilmington Plant are cleaned at least annually in accordance with a source reduction measure recommended in Tosco’s 1994 SB14 documents. Prior to this cleaning practice, the basins were only cleaned if dirt in the basins impeded flow at the drainpipe. Annual cleaning helps minimize the volume of refinery dirt that is washed into the sewer by rainfall runoff. As a result, less oily sludge is generated by the sewer collection system.
6. Tank Bottom Waste at Carson - CWC 241 Tank bottom waste is an oily sludge generated during the cleaning of tanks. In 1994 and years prior, Tosco designated tank bottom waste as hazardous waste. Since tank bottom waste is similar in composition to organic solids (CWC 222/352), Tosco started recycling it to the sludge injection system as a feed stream to the Coker in 1995. As a result, the Carson Plant decreased the amount of tank bottom waste managed as hazardous by 100 percent from 1994 to 1998.
In 1993, the Tosco Los Angeles Refinery implemented a refinery-wide tank optimization program. In addition to reducing the generation of blasting grit waste, this program has also reduced the number of tank bottoms that would otherwise be cleaned routinely.
68
Ultramar Incorporated
Ultramar Wilmington Refinery’s major waste streams are discussed in this section. The refinery’s 1998 SB 14 documents submitted to the DTSC were used to discuss the hazardous waste source reduction activities implemented by the facility.
A. Summary of Major Waste Streams
The four major wastes streams generated at Ultramar Wilmington Refinery during the 1994 and 1998 reporting years were alkylation sludge (CWC 181), oil/water separation sludge (CWC 222), spent catalyst (CWC 162), and fluid catalytic cracking fines (CWC 161). The processes, operations and activities that generate these hazardous waste streams are described below. Quantities of each hazardous waste stream generated in 1994 and 1998 are included in the Table in this chapter.
1. Alkylation Sludge The Ultramar Wilmington Refinery operates a Hydrofluoric Acid (HF) Alkylation Unit to produce high-octane gasoline blending stock. In 1998, the refinery generated approximately 706,600 pounds of alkylation sludge from the process making up approximately five percent of the total waste generated at the refinery during the year.
The alkylation unit uses HF as a catalyst for the reaction between short-chain single-bonded paraffin’s (e.g., isobutane) and olefins (double-bonded hydrocarbons). HF catalyzes the isobutane/olefin reaction in two alkylation reactors to produce a higher octane gasoline material called “alkylate.” HF acid, which is circulated through the reactors, is continuously regenerated in the acid regenerator. Over time, acid impurities accumulate on the bottom of the regenerator and are manually drained into a surge drum. Acidic water is transferred from the surge drum into the neutralization drum where it is combined with other acidic water collected from the unit’s acid relief system.
Byproducts of the process are two highly acidic streams: long-chain hydrocarbons (polymer); and a mixture of spent acid and water (constant boiling mixture or CBM). Each of the byproducts must be neutralized before further processing. This neutralization is done using potassium hydroxide (KOH). The KOH is reacted to potassium fluoride (KF), which is reconverted to KOH using lime (calcium hydroxide). The residual (alkylation sludge) is hazardous because it is a corrosive solid contaminated with polymer (oil). The refinery drains and filters the sludge material and ships it to an off-site hazardous waste disposal facility.
69
2. Oil/Water Separation Sludge A number of waste streams in the refinery include oil-bearing sludge generated at the wastewater treatment plant and in the process sewers, and during the cleaning of tanks. Both the federal government and the state of California regulate these waste streams. The Ultramar Wilmington Refinery estimated the quantity of oil/water separation sludge it generated in 1998 to be 15,692,000 pounds. This volume accounts for approximately 80 percent of the total amount of hazardous waste generated by the refinery in 1998.
Under normal operating conditions, the Ultramar Wilmington Refinery constantly removes sludge from the refinery’s wastewater treatment system. The refinery generates additional sludge during periodic cleaning of the facility’s sewer system. These oily sludges accumulate in the gravity separators and the sewer catch basins (~150) located throughout the refinery. Additional sludge is generated from the desalter centrifuge.
Ultramar recycles such sludges into the delayed coking operations using the Mobil Oily Sludge Coking (MOSC) process. The MOSC process uses process water mixed with oily sludge as a partial substitute for quenching water in the final stage of a coking cycle. The MOSC process recovers the hydrocarbon content of sludge as coker product and as volatiles, which are returned to the refinery for fractionation.
3. Spent Catalyst
Major spent catalyst streams generated at the refinery consist of nickel-molybdenum catalyst from the Naphtha Hydrotreater and Hydrodesulfurizer Units; cobalt-molybdenum catalyst from the Gas Oil Hydrotreater and Beavon Units, and alumina-silicate spent catalyst from the FCC, Alkylation, and Claus Units. In 1998, these processes generated approximately 1,115,000 pounds of spent catalyst, all of which was recycled off site at cement kilns. This volume accounts for six percent of the total amount of hazardous waste generated at the refinery in 1998.
4. Fluid Catalytic Cracking Fines The Ultramar Wilmington Refinery uses catalytic cracking to convert heavy oils into gasoline and lighter products. The Fluid Catalytic Cracking (FCC) process employs a catalyst in the form of very fine particles, which behave as fluid when, aerated with vapor. The cracking process produces carbon (coke), which remains on the catalyst particle and rapidly lowers its activity. To maintain the catalyst activity at a useful level, the refinery regenerates the catalyst by burning off this coke with air. As a result, catalyst continuously moves from the reactor to regenerator and back to the reactor.
The catalyst leaving the reactor is called “spent catalyst” and contains adsorbed hydrocarbons. Steam stripping removes some of the adsorbed hydrocarbons before the catalyst enters the regenerator. The flue gas leaving the regenerator is processed through a flue gas cooler (waste heat recovery) and through the electrostatic precipitators. The electrostatic precipitators remove 95-97 percent of the remaining catalyst fines from the flue gas in order to meet environmental standards for particulate emissions. An electric charge in the internal grid of the
70
precipitator causes the particles to collect instead of passing through with the flue gas. The particles are “rapped” off the collection plates and fall into dust hoppers below the precipitators.
Similar to spent alumina catalyst, FCC fines have been recycled as process feed in cement kilns and foundries as an alternative to landfill disposal since 1995. In 1998, the Ultramar Wilmington Refinery managed approximately 1,573,400 pounds of FCC Fines as hazardous material. This quantity accounts for eight percent of the total hazardous waste generated by the refinery in 1998.
The table below also identifies the major hazardous waste streams that Ultramar Wilmington Refinery routinely generated during 1994 and 1998 during the normal course of refinery operations.
Hazardous Waste Generation by Major Waste Stream
Wastes
CWC
1994 (Weight in
pounds)
1998 (Weight in
pounds) Major Nonaqueous (Category B) Waste Streams
Alkylation Sludge 181 822,120 706,600 Oil/Water Separation Sludge 222 537,240 15,692,000 Spent Catalyst 162 310,540 1,115,000 FCC Fines 161 1,175,505 1,573,400
Total Major Category B Waste Streams 3,319,758 19,087,000 Misc. Category B Minor Waste Streams (1) 1,657,160
Total Category B Wastes 3,319,758 Aqueous (Category A) Waste (1) N/A
Total Category A Waste N/A Total (Category A & B) 3,319,758 20,744,160
Source: Ultramar’s Wilmington Refinery’s 1998 SB 14 Documents (1) Ultramar was unable to provide these numbers.
B. Source Reduction Activities
The Ultramar Wilmington Refinery began to implement source reduction measures for routinely generated hazardous wastes in 1987. Approximately 95 percent of the hazardous waste generated in 1998 was either recycled on or off site. The Ultramar Wilmington Refinery reports it will continue to evaluate other source reduction measures, as they become available. According to Ultramar Wilmington Refinery’s 1998 SB 14 documents, source reduction approaches were identified for the following waste streams:
1. Alkylation Sludge - CWC 181 The Ultramar Wilmington Refinery reduced the quantity of waste alkylation sludge by over 100,000 pounds, or 14 percent, during the period 1994 to 1998. The refinery accomplished the reduction in part by filtering sludge prior to disposal as explained below.
71
The Ultramar Wilmington Refinery reported in its SB 14 documents that in the past, sludge material was shipped to an off-site disposal facility. As volumes and costs for disposal increased, Ultramar evaluated other management alternatives.
Since late 1988, the refinery has processed all its alkylation sludge through a vacuum filter to capture and recycle the entrained KOH. Implementation of this process resulted in decreased calcium fluoride disposal volumes. The Ultramar Wilmington Refinery reported to DTSC in 1998 that it used a filter press to capture increased quantities of KOH and reduced the amount of hazardous waste shipped off site for disposal.
In recent years, the Ultramar Wilmington Refinery explored recycling alkylation sludge as a slagging substitute in metal processing or as a raw material feed in the manufacture of hydrofluoric acid. In their evaluation, the refinery estimated that using the HF alkylation sludge in the production of hydrofluoric acid would provide the manufacturers with a less expensive alternative to using virgin additives. However, fluctuations in sludge composition and the presence of inert materials, such as diatomaceous earth, polymer and lime, combine to create problems with this waste management alternative. Hydrofluoric acid manufacturers are reluctant to use the alkylation sludge as material feed due to the potential polymer emissions generated during the manufacturing process. Separating polymer from the alkylation sludge is not possible in the current unit operation.
The refinery attempted to reduce the volume of solid waste material generated from the alkylation unit by substituting concentrated liquid lime for powdered lime. The use of liquid lime increased water buildup, which resulted in dilution of the KOH. To counteract this dilution and maintain proper strength in the process, constant addition of KOH was necessary. Due to increased chemical usage and treatment required, the Ultramar Wilmington Refinery determined this to be an unfavorable alternative. The Ultramar Wilmington Refinery reported that the refinery continues to evaluate other waste reduction and recycling alternatives for alkylation sludge.
2. Oil/Water Separation Sludge - CWC 222 The Ultramar Wilmington Refinery increased the quantity of waste oil/water separation sludge generated by over 15 million pounds, a 2,900 percent increase, during the period 1994 to 1998.
Before Ultramar Wilmington’s Refinery started recycling oil-bearing sludge, the refinery dewatered, centrifuged, and shipped its sludge to hazardous waste landfills. Sometime prior to 1991, Ultramar began using the MOSC process, so that almost all oil-bearing sludge generated in the refinery is recycled on site.
72
3. Spent Catalyst - CWC 162 In 1996, the Ultramar Wilmington Refinery completed construction of the clean fuels units, which included the Gas Oil and Naphtha Hydrotreaters, enabling the refinery to produce cleaner-burning reformulated fuels. As a result, the refinery increased the quantity of waste alumina-based catalyst it generates by 800,000 pounds, a 360 percent increase, during the period 1994 to 1998.
In 1993, the Ultramar Wilmington Refinery entered into agreement with suppliers to take the refinery spent alumina catalysts for reuse in production of fresh alumina catalyst. Supplier problems with volume and packaging limited the success of the recycling project.
In 1994, the Ultramar Wilmington Refinery began recycling all spent catalysts as process feed to cement kilns and foundries, a successful alternative to landfill disposal. In early 1999, spent molybdenum catalysts were reclassified as RCRA-hazardous and no longer accepted as cement kiln process feed. As a result, the Ultramar Wilmington Refinery now uses one of three options for their spent molybdenum catalysts: 1) treatment and landfill disposal at an out-of-state facility; 2) off-site incineration with the ash either landfilled or used as cement kiln process feed; and 3) off-site metals recovery if the metals content is high enough.
4. FCC Fines - CWC 161 The Ultramar Wilmington Refinery increased the quantity of waste FCC fines generated by 400,000 pounds, a 34 percent increase, during the period 1994 to 1998. Similar to spent catalyst, FCC fines recovered have been recycled as process feed in cement kiln foundries since 1994.
73
Paramount Petroleum Corporation
Paramount’s major waste streams and source reduction activities are discussed in this section. The refinery’s 1998 SB 14 documents submitted to the DTSC were used to discuss the hazardous waste source reduction activities implemented by this facility.
A. Summary of Major Waste Streams
The major waste streams generated by Paramount for the years 1994-1998 were oily process waste, tank bottoms, spent catalyst, oily process wastewater, surplus chemicals and sandblast grit. Processes that generate these waste streams are detailed below:
• Oily process waste California Waste Code (CWC) 352 includes all oil contaminated wastes such as oily rags, gloves and other used personal protective equipment, sample containers, hoses, pallets, filters, and other items generated in the operation and maintenance of the process units. Almost 50 percent of the hazardous waste generated at Paramount Petroleum in 1998 were oily debris.
• Tank bottoms (CWC 241) generally become a hazardous waste if they contain regulated levels of benzene or certain heavy metals that are inherent to crude oil. During the refinery distillation process, lighter products such as gasoline components tend to contain benzene and heavy products may contain trace heavy metals in regulated concentrations. In 1998, Paramount generated 103 tons of waste tank bottoms, all of which were nonhazardous, from the cleaning of a gas oil tank. Gas oil is a middle distillate containing neither the benzene levels nor heavy metals in levels that would cause the tank bottoms to be hazardous.
• Spent catalyst (CWC 162) was generated in hydroprocessing units through 1997, which was the last time Paramount shipped hazardous waste spent catalyst off site. Paramount will not generate spent catalyst again until and unless the refinery makes the decision to run or dismantle the units, which still contain usable catalyst.
• API separator sludge (CWC 222): The API separator, part of the oily process water system, uses gravity to separate oil, water and sludge. Oil, rising to the top, is skimmed off and recovered for production. Water is further processed in the wastewater system and discharged to the local POTW. Removing the sludge from the bottom requires taking the API Separator out of service. This is done during refinery shutdowns. The sludge is vacuumed out and transferred to a large portable tank from which it is filter pressed to further recover any oil and water, and reduce the volume of waste which must be disposed.
• Surplus chemicals (CWC 331) are generated when chemicals are purchased for activities such as pilot studies, or when an operating process
74
changes result in a particular chemical no longer being needed. This category also includes outdated chemicals, which were not used prior to their shelf life expiration.
• Some sandblast grit (CWC 181) is made from copper slag and becomes a hazardous waste when spent because of the hazardous nature of the source material. Other sandblast grit becomes hazardous when it is used to blast tanks and vessels that contained a hazardous material or coating.
Hazardous Waste Generation by Major Waste Stream
Waste Description
CWC
1994 (Weight in
pounds)
1998 (Weight in
pounds) Aqueous (Category A) 0 0 Nonaqueous (Category B): Oily Process Waste 352 529,260 71,100 Tank Bottoms 241 307,520 0 Spent Catalyst 162 299,120 0 API Separator Sludge 222 144,500 31,880 Surplus Chemicals 331 N/A 21,960 Sandblast Grit 181 N/A 11,040
Source: Paramount Petroleum Corporation’s 1998 SB 14 Documents.
B. Source Reduction Activities
The major waste streams generated by Paramount are discussed in this section. The facility’s 1998 SB 14 documents submitted to the DTSC were used to discuss the hazardous waste source reduction activities implemented by the facility.
1. Oily Process Waste - CWC 352 Oily process waste is a non-RCRA waste that is classified as a hazardous waste by California due to oil content. Paramount reduced oily process waste from 1994 to 1998 as follows: 1994 - 264 tons, 1995 - 42 tons, 1996 - 80 tons (major maintenance turnaround year), 1997 - 29 tons, and 1998 - 36 tons. Almost 50 percent of the hazardous waste generated at Paramount Petroleum in 1998 was oily debris, and the volume was reduced by over 85 percent from 1994 to 1998.
Source reduction options for oily process waste reported in Paramount’s 1998 SB 14 plan include using the refinery’s Hazardous Waste Committee to review specific wastes, evaluate how and where they are generated, and recommend ways to reduce their volume. Paramount reported that they have improved housekeeping practices, improved segregation of hazardous and nonhazardous waste, increased on-site recycling of oily liquids (quality control samples), and encouraged more complete use of chemicals to reduce residue disposal.
Paramount encourages employees to minimize the generation of oily waste by washing and reusing sample containers, completely using rags and gloves before throwing them away, and using all of a container’s contents prior to disposal.
All of Paramount’s oily debris that is sent off site is sent to a recycler where it is reclaimed for reuse.
75
For the oily process waste stream, Paramount reported a source reduction goal of ten percent for the period 1998 to 2002.
2. Tank Bottoms - CWC 241 Paramount’s 1994 SB 14 plan included tank bottoms dewatering to reduce the total volume of waste for disposal. Gas oil tank bottoms are too thick and viscous for filter pressing. Therefore, the gas oil tank bottoms were landfilled. However, in 1996 Paramount cleaned out a wastewater tank and effectively used filter pressing to reduce the volume of waste generated. The material also contained sufficient heat content to be reused as fuel. Paramount continues to look for a means of recycling its heavier tank bottoms.
3. Spent Catalyst - CWC 162 The Hydroprocessing Units that generate spent catalyst have not operated since 1997, which was the last time Paramount sent out spent catalyst hazardous waste. Paramount reported that they will not generate spent catalyst again until, and unless they make the decision to run or dismantle the Hydroprocessing Units, which still contain usable catalyst.
Catalyst is recyclable and is often regenerated several times before it is no longer suitable for reactors. In 1997, Paramount sent its spent catalyst to a metals reclaimer.
4. API Separator Sludge - CWC 222 Between 1994 and 1998, Paramount reduced the generated volume of API separator sludge by more than 75 percent, mainly by keeping non-wastewater solids out of the wastewater system. The refinery set up filters and strainers around drains to minimize solids, mainly dirt, from entering the drains. Also, Paramount began a program of paving its roads and work areas, which include areas surrounding drains. Paramount plans to continue its program of road paving as a means of further minimizing this waste stream.
API separator sludge removed from the separator is filter pressed to recover oil and water; thereby reducing the total volume of solids that must be handled as hazardous waste. After filter pressing, the material can be sent to a cement kiln to be used as fuel if the heating value of the material is high enough. The material generated in 1998 did not have sufficient heat value and was consequently sent to an off-site incinerator. In the future, Paramount will consider using a thermal desorption treatment facility for this material enabling soil/sediment to be reused.
In 1998, Paramount’s four-year goal was to reduce API separator sludge by an additional ten percent.
76
5. Surplus Chemicals - CWC 331 Paramount did not generate enough surplus chemicals in 1994 to be reported under SB 14; however, in 1998, the waste stream exceeded 5 percent of the total waste generated, primarily due to the shutdown of Paramount’s Hydroprocessing Units. The majority of this waste stream was ethylene dichloride. Paramount attempted to recycle the material through the DTSC Waste Exchange Program but found no buyers before the drums began to deteriorate.
Paramount reported that its Process Safety Management policy requires any new chemical brought into the refinery to be introduced and approved during a Management of Change meeting. Issues discussed and reviewed at these meetings include level of toxicity, potential alternatives if the material is particularly hazardous, quantities required for inventory, and whether the chemical is to be used on a temporary or permanent basis. The meeting is also used to ensure that quantities are not over purchased, and that the Purchasing Department can plan for a warehouse inventory item or a one time only purchase.
In 1998, Paramount was reviewing its chemical usage and used the information to study opportunities to streamline its chemical inventory procedures, and minimize surplus and outdated chemical disposal. The study was scheduled for completion in 2000, with plans for a full year of analysis the following year. Paramount plans to have surplus chemical management procedures in place by the end of 2001.
In 1998, Paramount’s four-year source reduction goal for a major warehouse cleanout, was a minimum of 50 percent within the next four years.
6. Sandblast Grit - CWC 181 At the time Paramount did not include sandblast grit in its 1994 SB 14 plan because the refinery did not consider it routinely generated, as approximately 95 percent of the material was generated from two major projects. However, Paramount found that it did continually generate sandblast grit over the following years. As a result, Paramount reported this waste stream in its 1998 SB 14 documents because the waste stream exceeded five percent of the refinery’s total waste.
Paramount has used various alternatives to minimize sandblasting since 1994, including soda blasting, hydroblasting and ice blasting. The refinery chooses the most effective alternative for each individual job.
For non-RCRA hazardous sandblast grit, Paramount reported several practices that it combined, based on the number and type of projects being performed at the refinery, to reduce the volume of this waste generated. Paramount reported that on occasion maintenance sandblasting is required on a piece of equipment coated with lead-based paint. For other jobs, Paramount considers alternatives to sandblasting on a case-by-case basis.
In 1998, Paramount was unable to set a four-year source reduction goal.
77
Valero Refining Company Wilmington Asphalt Plant
The major waste streams of the Wilmington Asphalt Plant are discussed in this section. The facility’s 1998 SB 14 documents submitted to the DTSC were used to discuss the hazardous waste source reduction activities implemented by the facility.
A. Summary of Major Waste Streams
In 1998, the major waste streams generated by the asphalt plant (then under the ownership of the Huntway Refining Company) were oil/water separation sludge and wastewater.
Oil/water separation sludge: Valero’s Wilmington Asphalt Plant generates oil/water separation sludge as the result of recycling oily process water and storm waters in the refinery’s Water/Oil Recycling Treatment System (WORT). The WORT system includes a series of oil/water separator tanks for removal of oil and solids from the wastewater stream. Oil recovered from this system is recycled back to the process. Huntway generated approximately 95,050 pounds of oil/water separator sludge during the 1998 reporting year.
Wastewater: Oily water generated during the refinery’s operational activities is collected and recycled in the WORT system. It is also designed to collect and treat storm water containing hydrocarbons. The WORT system separates the wastewater into three phases: water, oil, and solids (sludge). The oil is sent back to crude for reprocessing, water is discharged to the POTW and the solids (sludge) are removed from the WORT system for possible dewatering and disposal. For purposes of this report only, untreated water entering the WORT system is referred to as wastewater. (Valero does not believe the water entering or leaving the system is waste.)
The following sources contribute to the wastewater generation in the asphalt plant:
• Crude oil Dehydration Process (heating of incoming crude oil to draw out naturally occurring water);
• Re-condensation of steam injected into the Vacuum and Atmospheric Distillation Tower (to assist in the distillation process);
• Boiler blowdown (the boiler water softening process);
• Desalter wash water; and
• Collection of storm water.
78
Hazardous Waste Generation by Major Waste Stream
Waste Description
CWC 1994 (Weight in
pounds)
1998 (Weight in
pounds) Nonaqueous (Category B) Waste: Oil/Water Separator Sludge 222 152,000 96,100 Aqueous (Category A) Waste: Wastewater N/A N/A
Total Waste (Category A & B) 152,000 96,100 Source: 1998 SB 14 documents N/A—Not Available
B. Source Reduction Activities
The major waste streams of this facility are discussed in this section. The facility’s SB 14 documents submitted to the DTSC were used to discuss the hazardous waste source reduction activities implemented by Valero.
1. Oil/Water Separation Sludge (CWC 222) Oil/water separation sludge solids are generated by naturally occurring sand (solid) particles in the incoming crude oil, wind blown dust that is captured in the WORT system drains and from the re-precipitation of “removed hardness” discharged from the water softening process. These small particles combine with oil and deposit in the bottom of the WORT system process tanks. A number of source reduction measures were developed to reduce these solids and are discussed below.
• Covering the WORT conveyance system openings and entrances during maintenance activities will prevent debris from entering the WORT system.
• Modifying the I-CARE Program: The plant converted its refinery-wide waste reduction awareness program to a “Stamp Out Waste” employee incentive program, by adding it to the company’s I-CARE program. The I-CARE program offers employees the opportunity to receive cash awards for suggestions that reduce company’s operational costs. The addition of the “Stamp Out Waste” program will also identify waste reduction as a viable measure that will reduce operating costs. The modified refinery-wide waste awareness program, specifically addressed hazardous, as well as nonhazardous wastes. It identified refinery waste streams and stressed how minimizing these waste streams would benefit individuals, the environment, as well as the entire company. Through this increased awareness, the employees had the opportunity to directly contribute to the refinery’s waste minimization and through the I-CARE program receive a monetary incentive for their efforts.
• Reduce the sludge volumes by adding a centrifuge to the WORT system and sending the reduced cake off site for further recycling.
• Segregate the boiler blowdown from the refinery’s wastewater stream. By segregating the boiler blowdown from the refinery’s wastewater stream and discharging the “clean” hard water directly to the city sewer, the portion of sludge generated by precipitation of hard water can be eliminated. At the
79
present time, Valero’s Wilmington Asphalt Plant does not have any data on the hardness percentage of the sludge. Additional data is needed to fully evaluate this alternative.
2. Wastewater A number of source reduction measures have been developed to reduce the wastewater stream and are discussed below.
• Segregate the boiler blowdown from the refinery’s wastewater stream. Currently, process water streams and the oil-free process water, are not segregated from the boiler blowdown. By separating the two streams, the volumes of wastewater would be reduced. This measure does have the potential to reduce the amount of water treated in the WORT system; however, it will require additional piping and heat exchange equipment.
• Modifying the I-CARE Program. This administrative measure, which was identified for the oil/water separator stream, is also applicable for the wastewater stream.
80
Bakersfield Refining Company (BRC) A Division of Equilon Enterprises LLC Bakersfield Refining Areas One and Two Bakersfield Refining Area Three
A. Summary of Major Waste Streams
The major waste streams of these facilities are discussed in this section. The Bakersfield Refining Company’s 1998 SB 14 documents submitted to the DTSC were used to discuss the hazardous waste source reduction activities implemented by the three local facilities. Most refinery hazardous wastes are included as SB 14 wastes. The two tables in this Section list these hazardous wastes generated at BRC.
1. Areas One & Two From 1994 to 1998, BRC Areas One and Two generated four major hazardous waste streams including: CWC 162 (spent catalyst); CWC 181 (inorganic solid waste); CWC 241 (tank bottoms waste); and CWC 352 (organic solids). Hazardous Waste Generation by Major Waste Stream BRC Area One and Two Table identifies amounts of each of these major hazardous waste streams during 1994 and 1998. Major hazardous waste streams are defined as being greater than or equal to five percent (by volume or comparable weight) of the nonexempt routinely generated hazardous waste streams.
The processes, operations and activities that generate these major hazardous waste streams are discussed below:
a. Spent Catalyst - CWC 162 Catalysts are used to initiate or promote reactions in petroleum refining operations. Specific catalysts are used to promote chemical reactions inside reactor vessels under specified operating conditions.
Petroleum refining catalysts are typically manufactured by extruding aluminum oxide into pellets. These pellets are then sintered to increase surface area and pore space for the catalytic metals that initiate or promote the reaction chemistry. Typical catalytic metals include nickel, molybdenum, cobalt, and tungsten. Precious metals, such as platinum, are also used in catalysts.
Replacement of the catalyst is required when a catalyst loses efficiency or becomes inactive due to physical fouling or chemical poisoning. Once removed from the reactor, the catalyst is properly disposed of, regenerated, or reclaimed. BRC uses properly permitted off-site hazardous waste management facilities to dispose of a small percentage of their hazardous waste catalyst stream. These waste catalyst streams are typically contaminated with soil or debris that makes regeneration or reclamation impossible.
Regeneration is a process that reactivates the catalysts. Regeneration can be performed on or off site depending on the type of catalyst. Off-site regeneration of the catalysts is typically performed by catalyst manufacturing companies. Although regeneration restores much of the catalytic efficiency, the active life of a catalyst is typically not as long as with new catalyst. Since the catalysts cannot be fully
81
restored to a new condition, BRC will only regenerate the catalysts once before replacement with new catalyst material.
Spent catalyst is sent off site for reclamation or recycling. Reclamation involves the destruction of the inert structure of the catalyst to recover the catalytic metals. Reclamation companies typically use the catalytic metals to manufacture new catalyst.
Metal processing companies recycle catalysts containing a high percentage of nickel. The catalyst is used as a feed substitute in the smelting process.
b. Other Inorganic Wastes - CWC 181 The second major waste stream generated in Areas One and Two is grouped under California Waste Code 181, Other Inorganic Wastes. The wastes that fall under this waste code are RCRA sandblast grit, cooling tower sludge, crushed empty drums, selenium centrifuge solids, and sulfuric acid sludge.
RCRA Sandblast Grit: Sandblasting is used to clean a variety of materials within the refinery. On occasion this sandblast media become contaminated with organic material. In other cases spend sandblast grit itself may be a hazardous waste.
Cooling Tower Sludge: The induced draft cooling towers operated by BRC are designed to use large water storage basins. These basins require cleaning to remove solid materials on an infrequent basis. Because cleaning of towers occurs infrequently, the weight of the sludge has been divided over a five-year period to calculate the average annual quantity of waste generated for SB 14 reporting purposes. The cooling tower sludge contains metals originating from cooling water treatment chemicals and from the corrosion of heat exchangers, piping, and other equipment that use cooling water. During cleaning the cooling tower sludge is removed and dewatered prior to off-site disposal at a properly permitted hazardous waste facility.
Crushed Empty Drums - BRC purchases many products, such as solvents, alkalis and acids in drums for the refinery operation and maintenance. Drums are also used to collect hazardous materials prior to disposal. Empty metallic drums are crushed prior to disposal to reduce volume. All crushed drums are sent to permitted hazardous waste facilities for disposal.
Selenium Centrifuge Solids - BRC receives much of its crude supply from San Joaquin Valley sources. The selenium concentration in this crude is higher than comparable gravity crude oil from other regions. During processing, a large portion of the selenium is captured in the sour water system. If discharged directly to the wastewater treatment plant, stripped sour water may contain sufficient quantities of selenium to cause the refinery wastewater to be hazardous.
To avoid this possibility, BRC designed and installed a stripped sour water selenium removal unit in 1997. This proprietary process removes selenium by a patented precipitation process. Solids are dewatered using a centrifuge and disposed of at a properly permitted off-site hazardous waste facility. This new process routinely generates the largest volume of hazardous waste at BRC; however, this innovative process also prevents the generation of a far larger amount
82
of potentially hazardous selenium wastewater.
Sulfuric Acid Sludge - Sulfuric acid is used to adjust the pH of cooling water and refinery wastewater. Periodically, the process tank used for storage of sulfuric acid must be cleaned to remove sludge generated by material storage.
c. Tank Bottom Wastes - CWC 241 The third major waste stream generated in Areas One and Two is grouped under California Waste Code 241, Tank Bottom Wastes. The wastes that fall under this waste code are centrifuge solids from tank cleaning.
Centrifuge Solids from Tank Cleaning - Tank cleaning involves the removal of solids that settle in the tank over several years of operation. Tank cleaning is performed to recover lost tank capacity, for periodic inspection, for changes in service, and for repair. Materials removed from the tank are processed in either a filter press or centrifuge to separate liquids that can be returned to the refinery for further processing. During 1998, BRC used centrifuge separation technology for processing tank cleaning solids. Solids are sent to a properly permitted off-site disposal facility.
d. Other Organic Solids - CWC 352 The fourth major waste stream generated in Areas One and Two is grouped under California Waste Code 352, Other Organic Solids. The wastes that fall under this waste code are heat exchanger bundle cleaning sludge, lube oil with selenium from process pumps, primary treatment sludge.
Heat Exchanger Bundle Sludge: Heat exchangers are used throughout the refinery to heat and cool process streams. These heat exchangers become fouled and lose efficiency. To recover the heat exchange efficiency, the heat exchanger bundles are cleaned by hydroblasting to remove the scale and hydrocarbon solids. Hydroblasting the heat exchanger bundles takes place on a concrete pad from where the scale and hydrocarbon solids are placed in drums for disposal.
Primary Treatment Sludge - The wastewater collection and treatment system is the source of primary treatment sludge and oil emulsions. Oily solids settle out of the wastewater stream in various sumps located within the refinery. F-listed sludge is generated, which is sent to off-site hazardous waste facilities for disposal or is burned as a supplemental fuel at approved off-site facilities.
Spent Filter Cartridges - Phosam Unit filter cartridges are used in the MEA system located at the Phosam Unit to remove particulate matter. High concentrations of particulate in MEA can lead to foaming of the MEA solution. Spent filters typically contain high concentrations of sulfides, which require incineration at an approved off-site hazardous waste facilities.
Spent Filter Cartridges - WWTP. The wastewater collected in Areas One and Two are combined and handled in the WWTP in Area 1 prior to disposal by deep well injection. The wastewater is filtered using disposable filter cartridges to prevent sub-surface plugging of the receiving aquifer. BRC uses a similar process in Area Three.
83
Several cartridge filtration units are installed to remove wastewater particulates five microns in size and larger. These units are installed in a parallel configuration to allow removal of spent filter cartridges while the other units are continued in service. Wastewater filters are classified as debris contaminated with an F-listed waste and are shipped off-site to a permitted hazardous waste facility for incineration.
2. Area Three From 1994 to 1998, BRC generated four major hazardous waste streams in Area Three including: CWC 181 and 611 (California Hazardous Soil and Debris), CWC 241 (Tank Bottoms Waste), and CWC 352 (Other Organic Solids). SB 14 major hazardous waste streams are defined as being greater than or equal to five percent (by weight) of the non-exempt routinely generated hazardous waste streams.)
The Area Three processes, operations and activities that generate these major hazardous waste streams are discussed below:
a. Organic Solids - CWC 352 Wastes in this waste code are Primary Treatment Sludge and Spent Filters - WWTP.
These wastes are generated as described in the Section III(A)(1)(d) above.
b. California Hazardous Soil and Debris – CWC 181, CWC 611 These wastes were generated as part of the improvements made to the facility’s spill containment and surface drains, routine cleanup of facilities, and materials collected during maintenance activities. Hazardous soil and debris are disposed in a permitted off-site hazardous waste facility.
c. Tank Bottoms Waste - CWC 241 California Waste Code 241 (Tank Bottom Waste) includes tank bottoms and centrifuge solids from tank cleaning.
When tanks are cleaned, solids that have settled in the tank over the tank’s service years are removed. Tank cleaning is performed to recover lost tank capacity, to enable periodic inspection, for changes in service, and for repair. Materials removed from the tanks are processed in either a filter press or centrifuge to separate liquids that can be returned to the refinery for further processing and are usually burned as a supplemental fuel at approved off-site facilities.
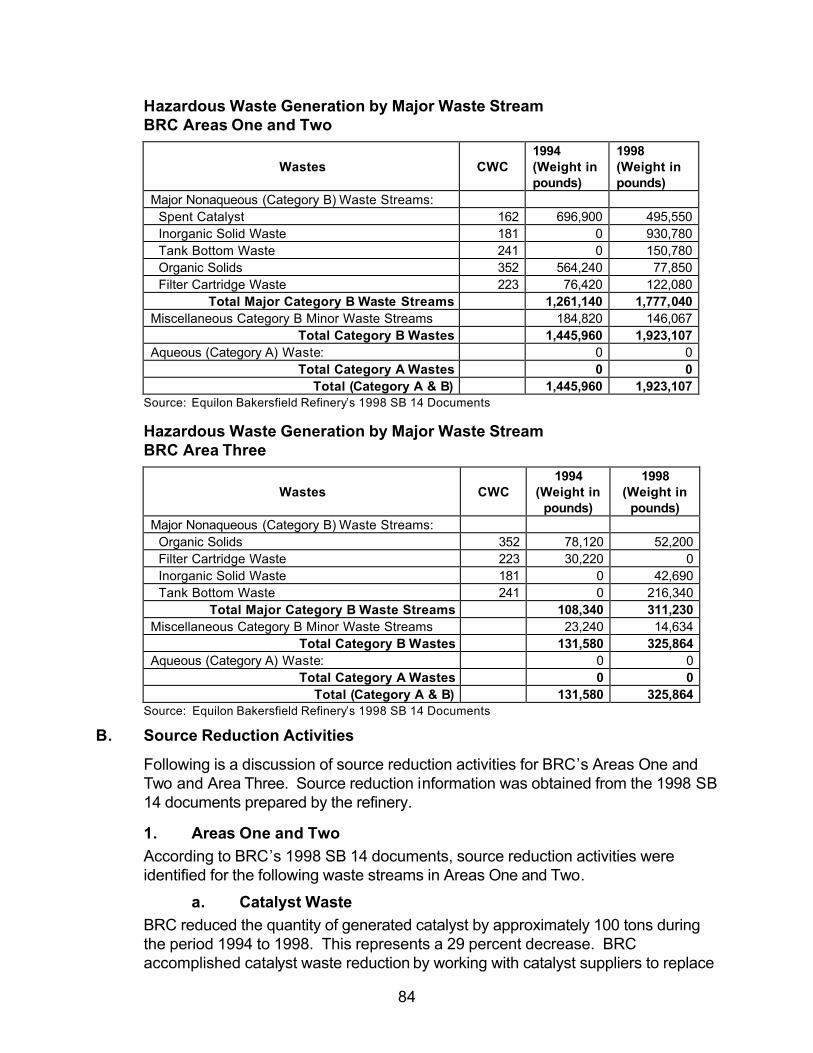
84
Hazardous Waste Generation by Major Waste Stream BRC Areas One and Two
Wastes
CWC
1994 (Weight in pounds)
1998 (Weight in pounds)
Major Nonaqueous (Category B) Waste Streams: Spent Catalyst 162 696,900 495,550 Inorganic Solid Waste 181 0 930,780 Tank Bottom Waste 241 0 150,780 Organic Solids 352 564,240 77,850 Filter Cartridge Waste 223 76,420 122,080
Total Major Category B Waste Streams 1,261,140 1,777,040 Miscellaneous Category B Minor Waste Streams 184,820 146,067
Total Category B Wastes 1,445,960 1,923,107 Aqueous (Category A) Waste: 0 0
Total Category A Wastes 0 0 Total (Category A & B) 1,445,960 1,923,107
Source: Equilon Bakersfield Refinery’s 1998 SB 14 Documents
Hazardous Waste Generation by Major Waste Stream BRC Area Three
Wastes
CWC
1994 (Weight in
pounds)
1998 (Weight in
pounds) Major Nonaqueous (Category B) Waste Streams: Organic Solids 352 78,120 52,200 Filter Cartridge Waste 223 30,220 0 Inorganic Solid Waste 181 0 42,690 Tank Bottom Waste 241 0 216,340
Total Major Category B Waste Streams 108,340 311,230 Miscellaneous Category B Minor Waste Streams 23,240 14,634
Total Category B Wastes 131,580 325,864 Aqueous (Category A) Waste: 0 0
Total Category A Wastes 0 0 Total (Category A & B) 131,580 325,864
Source: Equilon Bakersfield Refinery’s 1998 SB 14 Documents
B. Source Reduction Activities
Following is a discussion of source reduction activities for BRC’s Areas One and Two and Area Three. Source reduction information was obtained from the 1998 SB 14 documents prepared by the refinery.
1. Areas One and Two According to BRC’s 1998 SB 14 documents, source reduction activities were identified for the following waste streams in Areas One and Two.
a. Catalyst Waste BRC reduced the quantity of generated catalyst by approximately 100 tons during the period 1994 to 1998. This represents a 29 percent decrease. BRC accomplished catalyst waste reduction by working with catalyst suppliers to replace
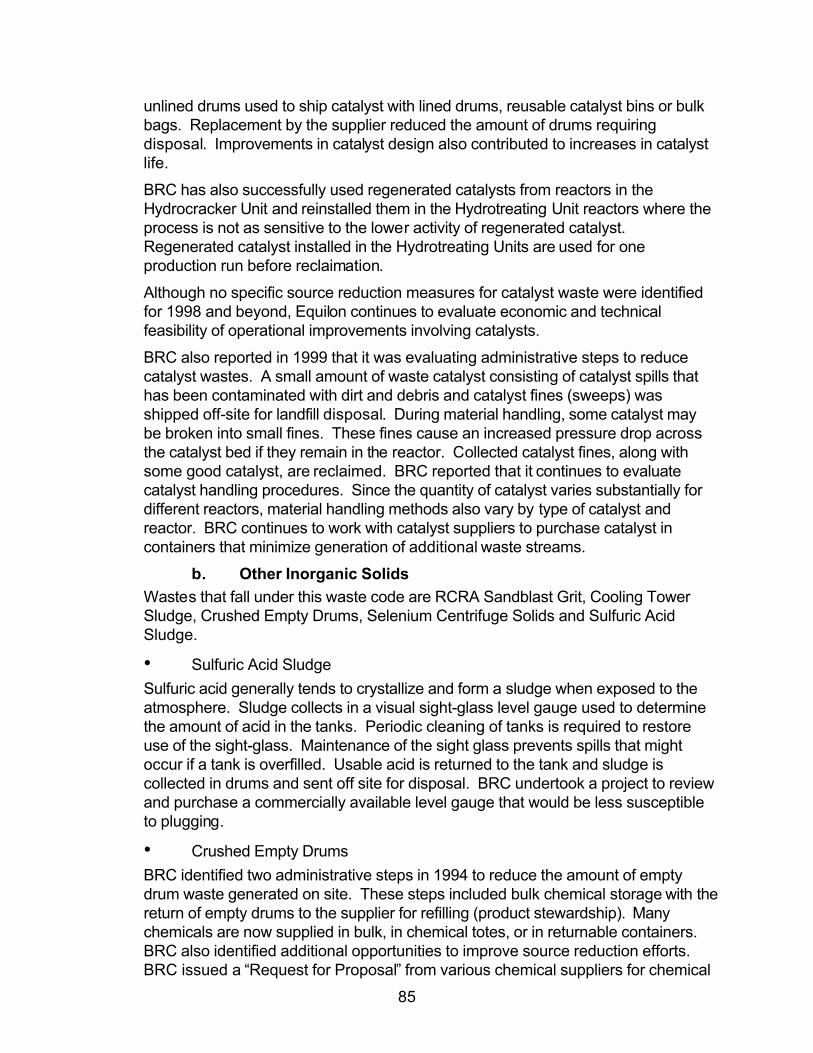
85
unlined drums used to ship catalyst with lined drums, reusable catalyst bins or bulk bags. Replacement by the supplier reduced the amount of drums requiring disposal. Improvements in catalyst design also contributed to increases in catalyst life.
BRC has also successfully used regenerated catalysts from reactors in the Hydrocracker Unit and reinstalled them in the Hydrotreating Unit reactors where the process is not as sensitive to the lower activity of regenerated catalyst. Regenerated catalyst installed in the Hydrotreating Units are used for one production run before reclaimation.
Although no specific source reduction measures for catalyst waste were identified for 1998 and beyond, Equilon continues to evaluate economic and technical feasibility of operational improvements involving catalysts.
BRC also reported in 1999 that it was evaluating administrative steps to reduce catalyst wastes. A small amount of waste catalyst consisting of catalyst spills that has been contaminated with dirt and debris and catalyst fines (sweeps) was shipped off-site for landfill disposal. During material handling, some catalyst may be broken into small fines. These fines cause an increased pressure drop across the catalyst bed if they remain in the reactor. Collected catalyst fines, along with some good catalyst, are reclaimed. BRC reported that it continues to evaluate catalyst handling procedures. Since the quantity of catalyst varies substantially for different reactors, material handling methods also vary by type of catalyst and reactor. BRC continues to work with catalyst suppliers to purchase catalyst in containers that minimize generation of additional waste streams.
b. Other Inorganic Solids Wastes that fall under this waste code are RCRA Sandblast Grit, Cooling Tower Sludge, Crushed Empty Drums, Selenium Centrifuge Solids and Sulfuric Acid Sludge.
• Sulfuric Acid Sludge Sulfuric acid generally tends to crystallize and form a sludge when exposed to the atmosphere. Sludge collects in a visual sight-glass level gauge used to determine the amount of acid in the tanks. Periodic cleaning of tanks is required to restore use of the sight-glass. Maintenance of the sight glass prevents spills that might occur if a tank is overfilled. Usable acid is returned to the tank and sludge is collected in drums and sent off site for disposal. BRC undertook a project to review and purchase a commercially available level gauge that would be less susceptible to plugging.
• Crushed Empty Drums BRC identified two administrative steps in 1994 to reduce the amount of empty drum waste generated on site. These steps included bulk chemical storage with the return of empty drums to the supplier for refilling (product stewardship). Many chemicals are now supplied in bulk, in chemical totes, or in returnable containers. BRC also identified additional opportunities to improve source reduction efforts. BRC issued a “Request for Proposal” from various chemical suppliers for chemical
86
treatment services. All vendor proposals were evaluated to determine if a vendor has an effective bulk delivery service and/or container return service. The refinery also evaluated factors such as personnel exposure to chemicals, logistics and product shelf life for each bulk storage application.
c. Tank Bottom Wastes Wastes that fall under this waste code include RCRA Sandblast Grit, Cooling Tower Sludge, Crushed Empty Drums, Selenium Centrifuge Solids and Sulfuric Acid Sludge.
• Centrifuge Solids from Tank Cleaning BRC initiated a process change in 1991 that allowed a small stream of oil emulsions to be processed in the Area Three Delayed Coker. Injecting the oil emulsion into the Delayed Coker recovered the lighter hydrocarbons, while incorporating the remainder of the emulsion mixture into the coke product. This process change was accomplished without adversely affecting the quality of any product streams.
Subsequent to 1994, this process was improved to increase the capacity of the system. In 1999, BRC reported it was studying the effectiveness of a system to clean tanks with diesel, centrifuge the resulting oil emulsion, and blend to a specific solids and water content. This material would be sent to the Coker for hydrocarbon recovery.
d. Other Organic Solids The wastes that fall under this waste code are Organic Wastes Containing Recoverable Oil (Heat Exchanger Bundle Sludge & Primary Treatment Sludge), Spent Filters - MEA at Phosam Unit and WWTP.
BRC reduced the quantity of generated organic solid waste by approximately 200 tons during the period 1994 to 1998, a 70 percent decrease including eliminating filter cake as a waste stream. In August 1995, BRC completed constructing its hydrocarbon recovery system. This system provided the capability to recycle oily residuals containing higher solids content to the Coker. Injection of oil emulsion into the Delayed Coker substantially contributed to the elimination of filter cake generated in Areas One and Two. BRC was later able to recycle tank bottoms and other oily residuals to the Coker. BRC continues to evaluate improvements to the hydrocarbon recovery system that would increase the volume of organic solids processed in the Coker.
One of the refinery’s major contributors to primary treatment sludge was the wastewater treatment plant. To reduce the amount of primary treatment sludge, BRC began a project to improve the design of Wastewater Treatment Tank 25004. The refinery expects that modifications to this tank will reduce the amount of oil trapped in the tank, reduce sludge formation within the tank, and improve the efficiency of downstream units.
87
• Organic Wastes Containing Recoverable Oil BRC initiated a process change in 1991 that allowed a stream of oil emulsions to be processed in the Area Three Delayed Coker. Injecting the oil emulsion into the Delayed Coker recovered the lighter hydrocarbons, while the remainder of the emulsion mixture was incorporated into the coke product.
• Spent Filters (Phosam MEA filters and WWTP filters) The spent filters waste stream at BRC increased by more than 24 tons from 1994 to 1998, representing an increase of approximately 60 percent. One reason for this increase was that only filters originating from the wastewater treatment plant were included in the 1994 waste totals. For 1998, spent filters from the Phosam Unit were also included with filters for the Wastewater Unit.
Other refinery activities could have been responsible for the increase in the generation of wastewater filters including construction of new processing units designed to produce reformulated fuels. The new units added to the total solids loading in the wastewater treatment plant without an overall increase in wastewater. Also, improved operation of the crude oil desalters increased dissolved and suspended concentrations of solids in desalter water, which was treated in the wastewater treatment plant.
BRC continues to evaluate methods for reduction of spent WWTP filters. Multimedia filters were replaced during the fourth quarter of 1997 with walnut shell filters. Walnut shell filters exceed multimedia filters in oil removal effectiveness, thereby reducing the plugging of WWTP cartridge filters. BRC continues to optimize the use of walnut shell filters.
BRC reported that improvements in chemical treatment at the wastewater treatment plant may be able to reduce the formation of particulate and result in a decrease in the generation of WWTP filters. BRC requested proposals from chemical vendors for treatment of wastewater. BRC considered the effectiveness of each vendor’s water treatment program as part of the bid evaluation.
2. Area Three
According to BRC’s 1998 SB 14 documents, source reduction activities were identified for the following waste streams in Area Three.
a. California Hazardous Soil and Debris Employees were rewarded through an incentive program for reducing the number of spills below identified targets. This program has been effective at reducing spills and waste generated by spill cleanup.
b. Tank Bottom Waste The wastes that fall under this waste code are tank bottoms and centrifuge solids from tank cleaning.
BRC initiated a process change in 1991 that allowed a stream of oil emulsions to be processed in the Area Three Delayed Coker. Injecting the oil emulsion into the Delayed Coker recovered the lighter hydrocarbons while the remainder of the
88
emulsion mixture was incorporated into the coke product. This process change was accomplished without adversely affecting the quality of the product streams.
Subsequent to 1994, this process was improved to increase the capacity of the system. BRC studied the effectiveness of a system that would clean tanks with diesel, centrifuge the resulting oil emulsion, and blend to a specific solids and water content. This material would be sent to the Coker for processing to recover hydrocarbons.
c. Organic Solids The wastes that fall under this waste code are primary treatment sludge and spent filters - WWTP.
• Primary Treatment Sludge
BRC reduced their waste primary treatment sludge by approximately 34,000 pounds during the period 1994 to 1998. This approximate 40 percent decrease resulted from changes in the handling of this waste stream are similar to those mentioned for this stream in Areas One and Two. Please refer to the previous section for a discussion of source reduction efforts for this waste stream described in Section III.B.1.d.above.
BRC initiated a process change in 1991 that allowed a small stream of oil emulsions to be processed in the Area Three Delayed Coker. Injecting the oil emulsion into the Delayed Coker recovered the lighter hydrocarbons, while the remainder of the emulsion mixture was incorporated into the coke product. This process change was accomplished without adversely affecting the quality of the product streams.
Due to the success of this process change, BRC has implemented a source reduction measure that will optimize hydrocarbon recovery and reduce the amount of organic solids generated at the plant. The refinery continues to evaluate hydrocarbon recovery system improvements to increase the amount of organic solids that can be processed in the Delayed Coker.
• Spent Filters (WWTP filters)
BRC reduced its spent wastewater filter generation by approximately 21,000 pounds, more than 70 percent, during the period 1994 to 1998. Cartridge filter generation is directly related to the volume of wastewater treated in the wastewater treatment plant, assuming there has been no increase in suspended solids and oil. Between 1994 and 1998 wastewater disposal from the Area Three wastewater treatment plant decreased by approximately 50 percent. This decrease accounts for the decrease in generation of spent filter cartridges.
BRC continues to evaluate methods for reduction of spent WWTP filters. Improvements in chemical treatment at the wastewater treatment plant may be able to reduce the formation of particulate and result in a decrease in the generation of WWTP filters. BRC requested proposals from chemical vendors for treatment of wastewater. The refinery considered the effectiveness of each vendor’s water treatment program as part of the bid evaluation.
89
d. Amine Waste BRC reduced waste amine by approximately 10,000 pounds from 1994 to 1998. This represents a decrease of approximately 90 percent during the same period. Spent amine is generated when the amine in the fuel gas system is no longer able to remove CO2, H2S and other sulfur compounds from the fuel gas stream. The decrease may be related to operational or process improvements in the fuel gas or fuel gas treating systems.
90
Kern Oil and Refining Company
Kern Oil’s major waste streams for the period 1994-1998 are discussed in this section. Information on hazardous waste source reduction activities implemented by Kern Oil was obtained from the facility’s SB 14 document entitled Hazardous Waste Reduction/Minimization Plan dated October 10, 2000.
A. Summary of Major Waste Streams
The major waste streams and how they were generated by Kern Oil for the period 1994-1998 are listed below:
• Wastewater Sludge came from the Water Plant that treated the wastewater coming from the API separator.
• Separator Sludge was generated from API separator.
• Hydrotreater Catalyst was spent catalyst that lost its reactivity and failed to perform as designed.
• Slop Oil Emulsion Solids generated from settled sludge from the API separator.
• Heat Exchanger Bundle Cleaning Sludge was generated when heat exchanger tubing bundles from the process units were washed.
• Crude Tank Sludge was settled sludge from crude oil tanks.
• Oily Debris was miscellaneous debris generated from several refinery operations and contaminated with oil.
Hazardous Waste Generation by Major Waste Stream
Wastes
CWC
1994* (Weight
in Pounds)
1998 (Weight
in Pounds)
Major Nonaqueous (Category B) Waste Streams: Wastewater Sludge 222 N/A 40,000 Separator Sludge 223 N/A 10,000 Slop Oil Emulsion Solids 223 N/A 20,000 Crude Tank Sludge 241 N/A 16,000 Hydrotreater Catalyst 162 N/A 20,000 Oily Debris (rags, debris, etc.) 223 N/A 22,000 Bundle Cleaning Sludge 352 N/A 10,000
Total Major Category B Waste Streams: N/A 138,000 Misc. Nonaqueous Minor Waste Streams N/A 6,800
Total Category B Wastes: N/A 144,800 *DTSC did not receive 1994 data. Kern Oil claimed it did not generate more than the threshold amount of waste in 1994, therefore the refinery was not required to file a SB 14 report for that year. Source: Kern Oil’s Hazardous Waste Reduction Minimization Plan dated October 10, 2000.
91
B. Source Reduction Activities
Kern Oil, in its SB 14 document, discussed measures it implemented to reduce wastes including loss prevention, waste segregation, training, production scheduling, maintenance operations and overall site management. The refinery was not required to submit SB 14 documents reporting 1994 hazardous waste generation data because it did not exceed the threshold level necessary for capture under SB 14. Measures implemented for the following wastes were reported in the facility’s 2000 SB 14 document:
1. Sludges (Wastewater Sludge, Separator Sludge, Slop Oil Solids, Wastewater Sludge, Crude Tank Sludge) – CWC 222, CWC 223, CWC 241
In 1998, Kern Oil generated 5 tons of separator sludge, 10 tons of slop oil sludge, and 20 tons of wastewater sludge. To reduce these waste streams, Kern Oil conducted a maintenance effort using high pressure/low volume steam cleaning and/or minimum rinsewater to minimize the quantity of water entering the oily water sewer system, which ultimately reduced the volume of treated wastewater. By reducing rinsewater, the refinery reduced solids washed into the sewer system that in turn reduced sludge produced from the separator, the slop oil system and the wastewater plant. Kern Oil also plans to pave additional refinery areas, and to pave the traffic lanes between production units to reduce sediments entering the sewer system. Kern Oil reported that the areas in the Crude Unit were paved prior to the October 2000 SB 14 report.
Kern Oil commingles compatible wastes (Separator Sludge, Crude Tank Bottom Sludge, and Slop Oil Emulsion Solids) in a portable tank and recycles the oily liquids by injection back to the Crude Unit. Kern Oil places wastewater sludge in portable tanks and returns liquids to an oil/water separator. Remaining solids from both waste streams are accumulated and shipped off site. In 2000, Kern Oil reported it is currently evaluating whether to add a contract filter pressing operation or an in-house filter press to further reduce the volume of compatible wastes shipped off site.
Kern Oil reported it would continue to implement all efforts discussed above. The major new items to be implemented were paving remaining process units and the traffic areas between units. For Phase One, the Crude Unit and the traffic lane to the laboratory, an engineered grading and paving plan was scheduled to be completed by March 2001. Grading and paving plans for truck overflow parking and areas east and south of the warehouse, the solvent loading rack, diesel and gas racks are scheduled to be completed as available budget permits. These improvements will all reduce sediment entering the oily sewer system.
Kern Oil plans to continue to recover and recycle oil from wastewater sludge back into the refinery to further reduce the amount of disposed waste. For Kern Oil, recovery and recycling are an ongoing operation with a focus to maximize recycled volumes.
92
2. Hydrotreating Catalyst - CWC 162 In 1998, Kern Oil generated 10 tons of spent catalyst. The refinery reported that hydrotreating catalyst is generated once every other year from the DHT Unit and every ten years from the Unifiner. Kern Oil substituted catalysts offering the longest production runs. During change-outs, catalyst was carefully screened to remove inert ceramic support media enabling catalyst reuse. Spent catalyst and guard media were disposed, or recycled if metal content was sufficient.
3. Oily Debris - CWC 223 Kern Oil generated 11 tons of oily debris in 1998. Oily debris was generated by operations, maintenance and the laboratory, and offered little practical opportunities for source reduction. Sample containers for in-house sampling and analysis were cleaned and reused as often as practical. At all locations a trash container was available to encourage segregation of ordinary refuse from oily debris.
93
Oildale Refinery Oildale Refinery’s major waste streams are discussed in this section. The refinery’s 1998 SB 14 documents (during 2000) submitted to the DTSC were used to discuss the hazardous waste source reduction activities implemented by the facility.
A. Summary of Major Waste Streams
Since 1986, the Oildale Refinery has generated 10 to 25 different waste streams, however only three of the waste streams are classified as “major” under the SB 14 definition. SB 14 defines major waste streams as those which exceed five percent of the waste stream total. In 1994, two waste streams, tank bottoms (CWC 241), and empty containers and debris (CWC 352) exceeded five percent of the total. In 1998, because of the reduction in total nonaqueous waste, waste solvent (CWC 213) became a major waste.
Hazardous Waste Generation by Major Waste Stream
Wastes
CWC
1994 (Weight in pounds)
1998 (Weight in pounds)
Major Nonaqueous (Category B) Wastes: Tank Bottoms 241 1,097,130 563,640 Empty Containers/Other Debris 352 216,000 56,850 Waste Solvent 213 32,110 37,680
Total Major Category B Wastes: 1,345,240 658,170 Source: Oildale Refinery 1998 SB 14 documents
B. Source Reduction Activities
In its 1998 SB 14 documents, Oildale Refinery presented the measures implemented to reduce asphalt tank bottoms waste. The refinery reduced asphalt tank bottoms waste from 1,097,130 pounds in 1994 to 563,640 pounds in 1998. This 49 percent reduction resulted from the refinery modifying the process used to add lime slurry to the crude oil.
During refining, lime slurry is added to the crude oil prior to distillation so that neutral (or essentially neutral) distillates are produced. The amount of lime added, and in turn, the amount of waste generated, is dependent principally on the acid content of the crude oil (determines the amount of lime required for neutralization) and the level of acidity allowed in the distillates.
In past attempts to reduce tank bottoms waste, the Oildale Refinery injected sodium hydroxide solution into the crude oil prior to distillation, thereby eliminating the solids waste problem. However, the excess sodium hydroxide required and the sodium salts of the neutralized acids rendered the asphalt product unacceptable for certain market areas, so the refinery discontinued the practice.
The neutralization reaction is dependent upon lime dissolving in water. In 1993, the Oildale Refinery reduced the lime concentration from approximately 28 percent to 15 percent while keeping the volume of lime slurry constant, thereby increasing the water to lime ratio. This resulted in a 34.2 percent decrease in tank bottoms waste in 1994 compared to the baseline year of 1990.
94
In 1995, the Oildale Refinery initiated a second modification to the neutralization process. A recycle loop was added to the crude oil charge line which recycles a portion of the crude oil/lime slurry mixture back to the suction side of the charge pump. This recycling through the charge pump enabled more of the lime in the slurry to dissolve in the water and react with the acids in the crude, thereby reducing the amount of unreacted lime, remaining in the product.
95
Tosco Refining Company Santa Maria Refinery and Carbon Plant Santa Maria Refinery Santa Maria Carbon Plant
The major waste streams of Tosco’s facilities are discussed in this section. The facilities’ 1998 SB 14 documents submitted to the DTSC were used to discuss the hazardous waste source reduction activities implemented by the facilities.
A. Summary of Major Waste Streams
1. Tosco Santa Maria Refinery
The major waste streams generated by the Refinery during the profile period of 1994 through 1998 were the Stretford Solution and Refinery Waste Cleanup.
• Stretford Solution (CWC 132): Spent Stretford solution was a generated refinery waste during the SB 14 profile period of 1994 through 1998. Stretford solution was used in the Tail Gas Unit (TGU), to absorb hydrogen sulfide (H2S) and convert the H2S to elemental sulfur. When H2S is converted to sulfur in the Stretford reaction, a byproduct may be generated. This byproduct, sodium sulfate, becomes insoluble when it reaches a specific concentration. As a result, it begins to drop out of solution and interferes with the process. At this point, the Stretford solution must be either regenerated or replaced.
• Refinery Waste Cleanup (CWC 352): Refinery waste cleanup was generated by a variety of daily operations and consisted of several different, mainly non-RCRA, waste streams. Some refinery waste cleanup was material that contacted oil during fuel production, product processing and ancillary operations. The major waste streams in this category were: fiber filters used in liquid sulfur removal; oil contaminated material that may have included gloves, personal protective equipment, rags, and absorbents, oil contaminated soils, storm drain sewer clean out, oily covered boards, plastics and off-specification sulfur cake.
2. Tosco Santa Maria Carbon Plant
The Carbon Plant generated the following major waste streams during the profile period of 1994 through 1998:
• Baghouse Ash Liquid (CWC 132): Baghouse Ash Liquid was a new category first listed by the refinery in 1997. It was produced in the Carbon Plant boiler during periodic wash down of the tubes to remove slag build up. This 12 to 16 hour cleaning process uses a high-pressure hose to dislodge slag. The rinse water and slag mixture typically contains nickel, vanadium and trace metals in concentrations that make it a hazardous waste.
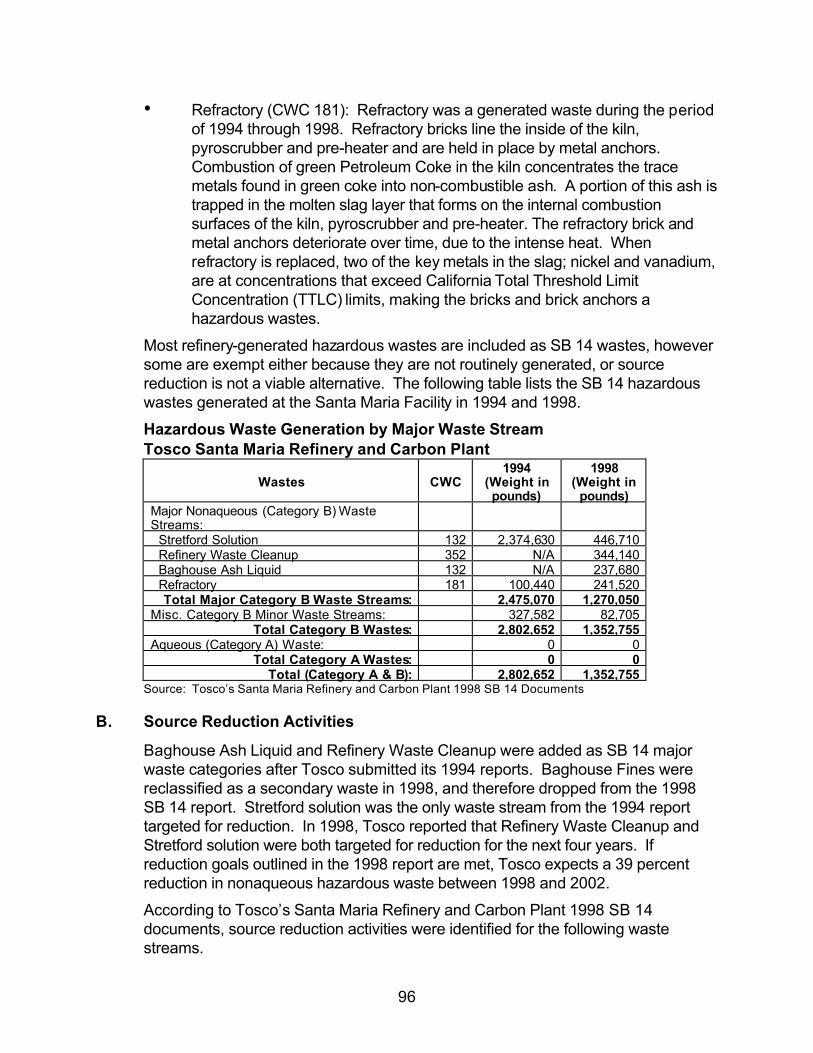
96
• Refractory (CWC 181): Refractory was a generated waste during the period of 1994 through 1998. Refractory bricks line the inside of the kiln, pyroscrubber and pre-heater and are held in place by metal anchors. Combustion of green Petroleum Coke in the kiln concentrates the trace metals found in green coke into non-combustible ash. A portion of this ash is trapped in the molten slag layer that forms on the internal combustion surfaces of the kiln, pyroscrubber and pre-heater. The refractory brick and metal anchors deteriorate over time, due to the intense heat. When refractory is replaced, two of the key metals in the slag; nickel and vanadium, are at concentrations that exceed California Total Threshold Limit Concentration (TTLC) limits, making the bricks and brick anchors a hazardous wastes.
Most refinery-generated hazardous wastes are included as SB 14 wastes, however some are exempt either because they are not routinely generated, or source reduction is not a viable alternative. The following table lists the SB 14 hazardous wastes generated at the Santa Maria Facility in 1994 and 1998.
Hazardous Waste Generation by Major Waste Stream Tosco Santa Maria Refinery and Carbon Plant
Wastes
CWC
1994 (Weight in pounds)
1998 (Weight in
pounds) Major Nonaqueous (Category B) Waste Streams:
Stretford Solution 132 2,374,630 446,710 Refinery Waste Cleanup 352 N/A 344,140 Baghouse Ash Liquid 132 N/A 237,680 Refractory 181 100,440 241,520
Total Major Category B Waste Streams: 2,475,070 1,270,050 Misc. Category B Minor Waste Streams: 327,582 82,705
Total Category B Wastes: 2,802,652 1,352,755 Aqueous (Category A) Waste: 0 0
Total Category A Wastes: 0 0 Total (Category A & B): 2,802,652 1,352,755
Source: Tosco’s Santa Maria Refinery and Carbon Plant 1998 SB 14 Documents
B. Source Reduction Activities
Baghouse Ash Liquid and Refinery Waste Cleanup were added as SB 14 major waste categories after Tosco submitted its 1994 reports. Baghouse Fines were reclassified as a secondary waste in 1998, and therefore dropped from the 1998 SB 14 report. Stretford solution was the only waste stream from the 1994 report targeted for reduction. In 1998, Tosco reported that Refinery Waste Cleanup and Stretford solution were both targeted for reduction for the next four years. If reduction goals outlined in the 1998 report are met, Tosco expects a 39 percent reduction in nonaqueous hazardous waste between 1998 and 2002.
According to Tosco’s Santa Maria Refinery and Carbon Plant 1998 SB 14 documents, source reduction activities were identified for the following waste streams.
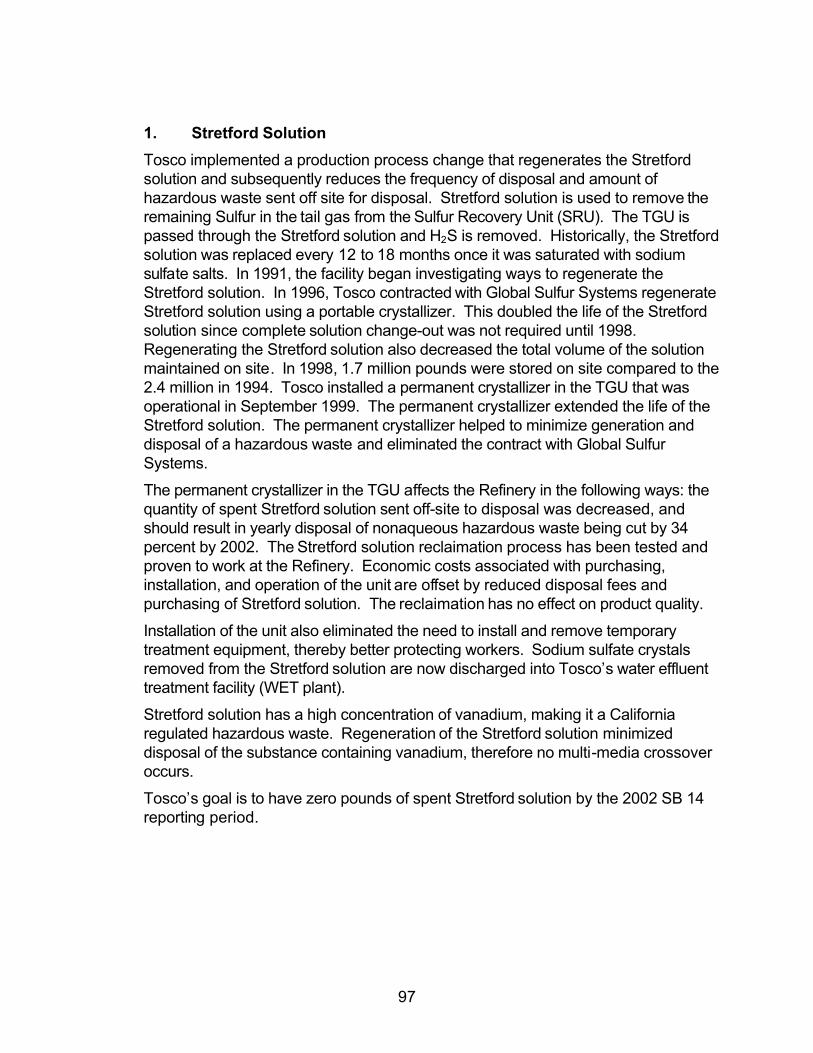
97
1. Stretford Solution
Tosco implemented a production process change that regenerates the Stretford solution and subsequently reduces the frequency of disposal and amount of hazardous waste sent off site for disposal. Stretford solution is used to remove the remaining Sulfur in the tail gas from the Sulfur Recovery Unit (SRU). The TGU is passed through the Stretford solution and H2S is removed. Historically, the Stretford solution was replaced every 12 to 18 months once it was saturated with sodium sulfate salts. In 1991, the facility began investigating ways to regenerate the Stretford solution. In 1996, Tosco contracted with Global Sulfur Systems regenerate Stretford solution using a portable crystallizer. This doubled the life of the Stretford solution since complete solution change-out was not required until 1998. Regenerating the Stretford solution also decreased the total volume of the solution maintained on site. In 1998, 1.7 million pounds were stored on site compared to the 2.4 million in 1994. Tosco installed a permanent crystallizer in the TGU that was operational in September 1999. The permanent crystallizer extended the life of the Stretford solution. The permanent crystallizer helped to minimize generation and disposal of a hazardous waste and eliminated the contract with Global Sulfur Systems.
The permanent crystallizer in the TGU affects the Refinery in the following ways: the quantity of spent Stretford solution sent off-site to disposal was decreased, and should result in yearly disposal of nonaqueous hazardous waste being cut by 34 percent by 2002. The Stretford solution reclaimation process has been tested and proven to work at the Refinery. Economic costs associated with purchasing, installation, and operation of the unit are offset by reduced disposal fees and purchasing of Stretford solution. The reclaimation has no effect on product quality.
Installation of the unit also eliminated the need to install and remove temporary treatment equipment, thereby better protecting workers. Sodium sulfate crystals removed from the Stretford solution are now discharged into Tosco’s water effluent treatment facility (WET plant).
Stretford solution has a high concentration of vanadium, making it a California regulated hazardous waste. Regeneration of the Stretford solution minimized disposal of the substance containing vanadium, therefore no multi-media crossover occurs.
Tosco’s goal is to have zero pounds of spent Stretford solution by the 2002 SB 14 reporting period.
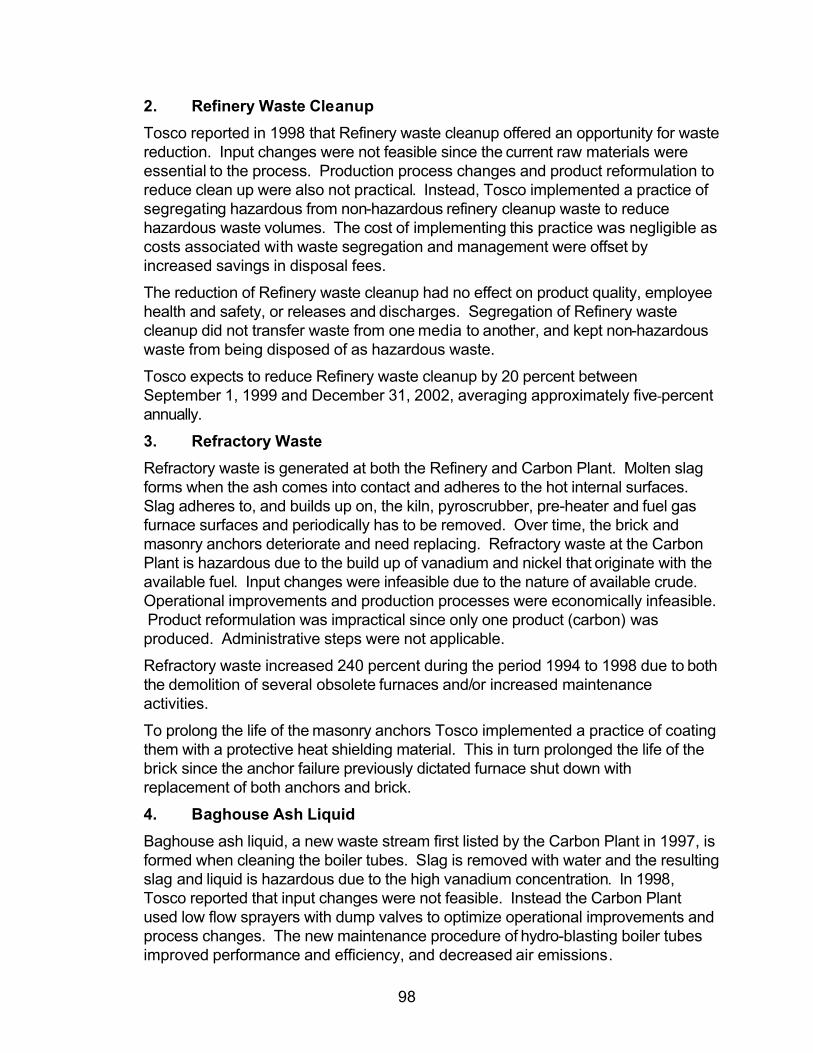
98
2. Refinery Waste Cleanup
Tosco reported in 1998 that Refinery waste cleanup offered an opportunity for waste reduction. Input changes were not feasible since the current raw materials were essential to the process. Production process changes and product reformulation to reduce clean up were also not practical. Instead, Tosco implemented a practice of segregating hazardous from non-hazardous refinery cleanup waste to reduce hazardous waste volumes. The cost of implementing this practice was negligible as costs associated with waste segregation and management were offset by increased savings in disposal fees.
The reduction of Refinery waste cleanup had no effect on product quality, employee health and safety, or releases and discharges. Segregation of Refinery waste cleanup did not transfer waste from one media to another, and kept non-hazardous waste from being disposed of as hazardous waste.
Tosco expects to reduce Refinery waste cleanup by 20 percent between September 1, 1999 and December 31, 2002, averaging approximately five percent annually.
3. Refractory Waste
Refractory waste is generated at both the Refinery and Carbon Plant. Molten slag forms when the ash comes into contact and adheres to the hot internal surfaces. Slag adheres to, and builds up on, the kiln, pyroscrubber, pre-heater and fuel gas furnace surfaces and periodically has to be removed. Over time, the brick and masonry anchors deteriorate and need replacing. Refractory waste at the Carbon Plant is hazardous due to the build up of vanadium and nickel that originate with the available fuel. Input changes were infeasible due to the nature of available crude. Operational improvements and production processes were economically infeasible. Product reformulation was impractical since only one product (carbon) was produced. Administrative steps were not applicable.
Refractory waste increased 240 percent during the period 1994 to 1998 due to both the demolition of several obsolete furnaces and/or increased maintenance activities.
To prolong the life of the masonry anchors Tosco implemented a practice of coating them with a protective heat shielding material. This in turn prolonged the life of the brick since the anchor failure previously dictated furnace shut down with replacement of both anchors and brick.
4. Baghouse Ash Liquid
Baghouse ash liquid, a new waste stream first listed by the Carbon Plant in 1997, is formed when cleaning the boiler tubes. Slag is removed with water and the resulting slag and liquid is hazardous due to the high vanadium concentration. In 1998, Tosco reported that input changes were not feasible. Instead the Carbon Plant used low flow sprayers with dump valves to optimize operational improvements and process changes. The new maintenance procedure of hydro-blasting boiler tubes improved performance and efficiency, and decreased air emissions.
99
5. Baghouse Fines
Tosco reclassified these wastes as secondary wastes and no longer includes these in generated SB 14 waste totals.
100
IV. CONCLUSIONS The following conclusions are derived from the SB 14 review of 21 sites of California’s 17 largest refineries. The SB 14 review included a detailed review of SB 14 documents and in some cases discussion with facility environmental managers. 1) Table 1 presents the refinery’s individual SB 14 applicable aqueous (Category A)
hazardous waste generation data for the years 1994 and 1998. Table 2 presents the refinery’s individual SB 14 applicable nonaqueous (Category B) hazardous waste generation data for the years 1994 and 1998. Table 1 and 2 offer an easy comparison of waste generation changes for the years listed. During 1994 and 1998 California refineries Category A waste generation was
99 percent and Category B waste was 1 percent of the total.
2) Eleven out of the 21 sites show zero Category A waste generation during both 1994 and 1998 calendar years.
3) In Category A the refinery’s waste generation was decreased by more than
2 billion pounds or 7.3 percent during calendar year 1998 in comparison to 1994 (Table 1). During the same period, their nonaqueous waste was reduced by nearly 61 million pounds or more than 18 percent (Table 2). Overall the California refinery industry was successful in reducing more than 2.3 billion pounds (1.15 million tons) or 7.3 percent of their waste (including Category A and Category B) during the four year period ending with the 1998 SB 14 reporting year (Table 3).
4) The petroleum refining industry is California’s largest hazardous waste generator.
Since its inception they have been subject to the Hazardous Waste Source Reduction and Management Review Act of 1989 (SB 14). Traditionally, DTSC has shared petroleum industry source reduction success stories among the industry when it prepared and distributed industry assessments in 1993 and 1997. The petroleum refining industry has seen dramatic reductions in hazardous waste generation due to their pollution prevention efforts. For example, the refinery industry reported in 1990 and 1994 that their hazardous waste generation decreased by more than 30 percent each time. Correspondingly, the amount of crude processed in California decreased by 5 percent from 1990 to 1994.1 From 1994 to 1998, crude inputs increased by 4 percent while refinery pollution prevention efforts resulted in 7.3 percent reduction in hazardous waste generation.
1 Crude processing percentages calculated using data provided by the California Energy Commission.
101
5) Tables 4, 5, and 6 present refinery generation of the three most prevalent major
waste streams for the calendar years 1994 and 1998. These three waste streams are: (i) Oil/Water separation sludge (CWC 222); (ii) Aqueous solution with total organic residues less than 10 percent (CWC 134); and (iii) Other spent catalyst (CWC 162). While the sludge (CWC 222) increased by almost 4 percent, the aqueous waste and spent catalyst were reduced by 18 and 35 percent respectively. DTSC has observed that in two or three instances the reduction in a particular hazardous waste was not necessarily due to source reduction measure, but was sometimes due to other factors such as production decreases, elimination of refinery operations, etc. The overall quantities decreased due to these reasons, however, are minimal in comparison to large quantities reduced by source reduction practices in place by 1998.
6) Recommendation: Refineries must take special care when they prepare their
SB 14 documents. This is especially true when providing information on generated waste quantities. Based on the information provided by refineries in their 1998 SB 14 documents, the facilities collectively reduced Category A (aqueous) hazardous waste by approximately 40 per cent from 1994 to 1998. One of the 17 reporting refineries later indicated that the Category A waste quantity reported in their SB 14 document was in error. This refinery correctly reported their Category A waste in pounds in 1994 but reported the same waste category in gallons for 1998. When the discrepancy was reported by the refinery in September 2003 to DTSC the collective Category A waste for the 17 refineries increased dramatically. As a result, the industry decrease in Category A hazardous waste was actually 7.3 percent rather than the initial 40 percent reduction reported from 1994 to 1998.
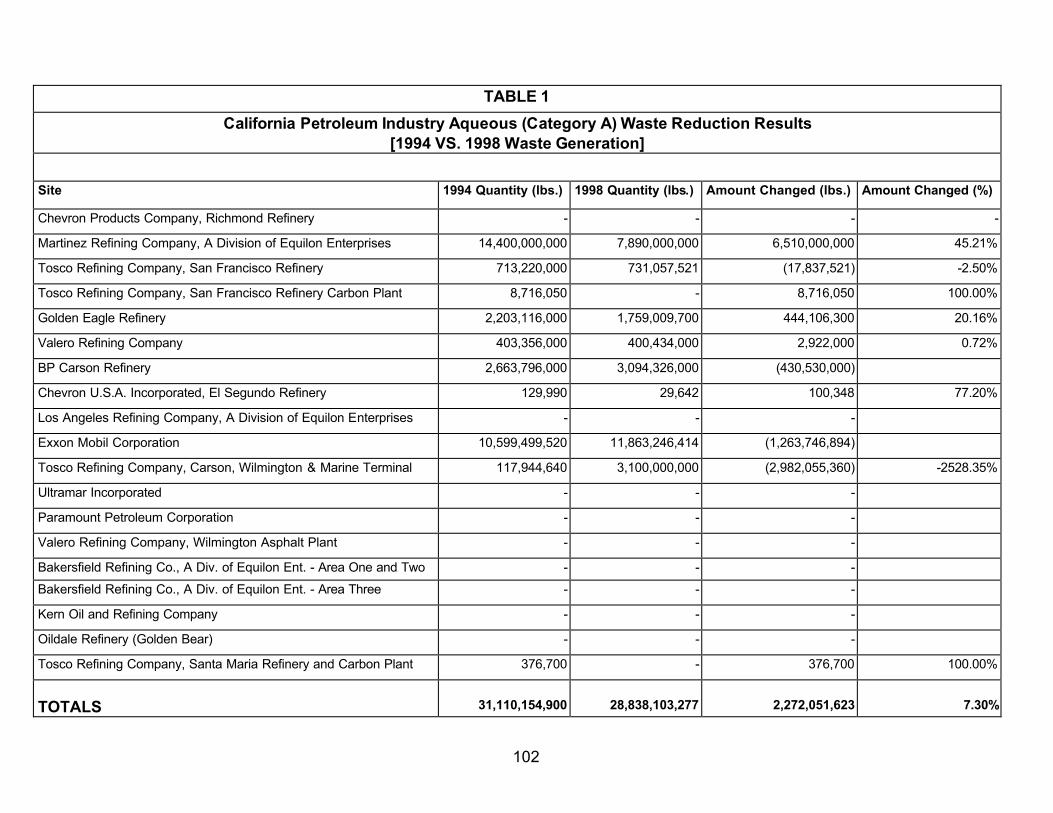
102
TABLE 1
California Petroleum Industry Aqueous (Category A) Waste Reduction Results [1994 VS. 1998 Waste Generation]
Site 1994 Quantity (lbs.) 1998 Quantity (lbs.) Amount Changed (lbs.) Amount Changed (%)
Chevron Products Company, Richmond Refinery - - - -
Martinez Refining Company, A Division of Equilon Enterprises 14,400,000,000 7,890,000,000 6,510,000,000 45.21%
Tosco Refining Company, San Francisco Refinery 713,220,000 731,057,521 (17,837,521) -2.50%
Tosco Refining Company, San Francisco Refinery Carbon Plant 8,716,050 - 8,716,050 100.00%
Golden Eagle Refinery 2,203,116,000 1,759,009,700 444,106,300 20.16%
Valero Refining Company 403,356,000 400,434,000 2,922,000 0.72%
BP Carson Refinery 2,663,796,000 3,094,326,000 (430,530,000)
Chevron U.S.A. Incorporated, El Segundo Refinery 129,990 29,642 100,348 77.20%
Los Angeles Refining Company, A Division of Equilon Enterprises - - -
Exxon Mobil Corporation 10,599,499,520 11,863,246,414 (1,263,746,894)
Tosco Refining Company, Carson, Wilmington & Marine Terminal 117,944,640 3,100,000,000 (2,982,055,360) -2528.35%
Ultramar Incorporated - - -
Paramount Petroleum Corporation - - -
Valero Refining Company, Wilmington Asphalt Plant - - -
Bakersfield Refining Co., A Div. of Equilon Ent. - Area One and Two - - -
Bakersfield Refining Co., A Div. of Equilon Ent. - Area Three - - -
Kern Oil and Refining Company - - -
Oildale Refinery (Golden Bear) - - -
Tosco Refining Company, Santa Maria Refinery and Carbon Plant 376,700 - 376,700 100.00%
TOTALS
31,110,154,900
28,838,103,277
2,272,051,623
7.30%
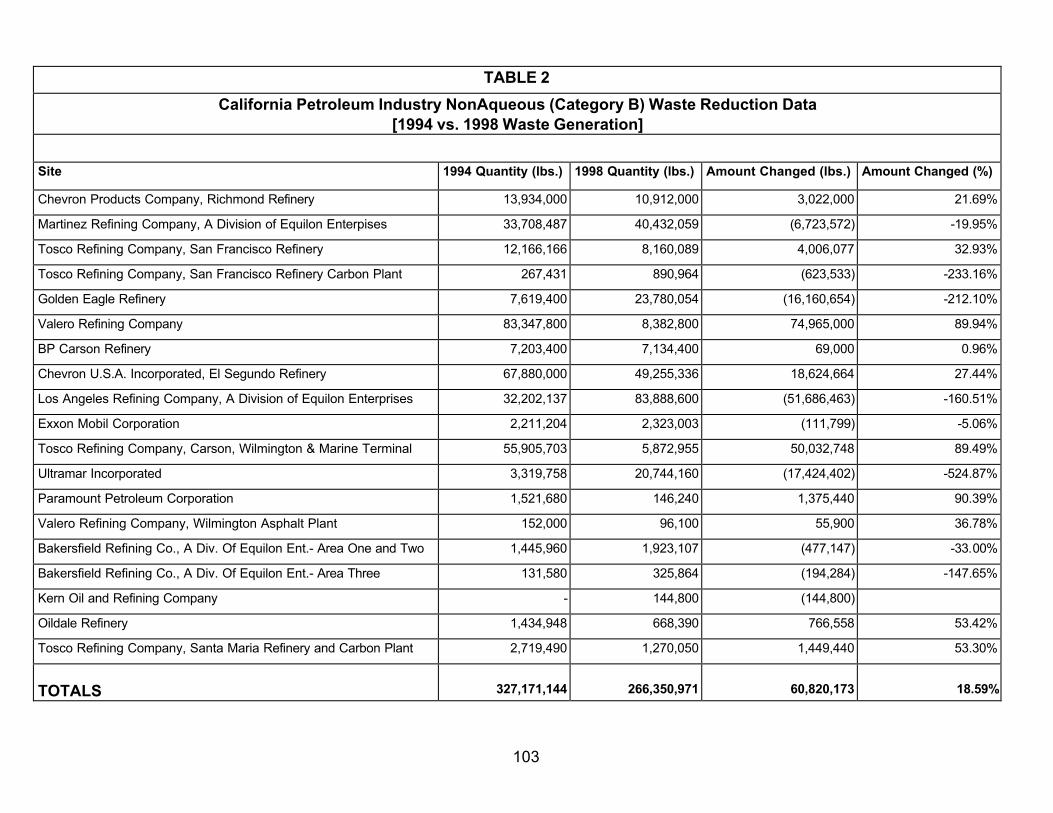
103
TABLE 2
California Petroleum Industry NonAqueous (Category B) Waste Reduction Data [1994 vs. 1998 Waste Generation]
Site 1994 Quantity (lbs.) 1998 Quantity (lbs.) Amount Changed (lbs.) Amount Changed (%)
Chevron Products Company, Richmond Refinery 13,934,000 10,912,000 3,022,000 21.69%
Martinez Refining Company, A Division of Equilon Enterpises 33,708,487 40,432,059 (6,723,572) -19.95%
Tosco Refining Company, San Francisco Refinery 12,166,166 8,160,089 4,006,077 32.93%
Tosco Refining Company, San Francisco Refinery Carbon Plant 267,431 890,964 (623,533) -233.16%
Golden Eagle Refinery 7,619,400 23,780,054 (16,160,654) -212.10%
Valero Refining Company 83,347,800 8,382,800 74,965,000 89.94%
BP Carson Refinery 7,203,400 7,134,400 69,000 0.96%
Chevron U.S.A. Incorporated, El Segundo Refinery 67,880,000 49,255,336 18,624,664 27.44%
Los Angeles Refining Company, A Division of Equilon Enterprises 32,202,137 83,888,600 (51,686,463) -160.51%
Exxon Mobil Corporation 2,211,204 2,323,003 (111,799) -5.06%
Tosco Refining Company, Carson, Wilmington & Marine Terminal 55,905,703 5,872,955 50,032,748 89.49%
Ultramar Incorporated 3,319,758 20,744,160 (17,424,402) -524.87%
Paramount Petroleum Corporation 1,521,680 146,240 1,375,440 90.39%
Valero Refining Company, Wilmington Asphalt Plant 152,000 96,100 55,900 36.78%
Bakersfield Refining Co., A Div. Of Equilon Ent.- Area One and Two 1,445,960 1,923,107 (477,147) -33.00%
Bakersfield Refining Co., A Div. Of Equilon Ent.- Area Three 131,580 325,864 (194,284) -147.65%
Kern Oil and Refining Company - 144,800 (144,800)
Oildale Refinery 1,434,948 668,390 766,558 53.42%
Tosco Refining Company, Santa Maria Refinery and Carbon Plant 2,719,490 1,270,050 1,449,440 53.30%
TOTALS
327,171,144
266,350,971
60,820,173
18.59%
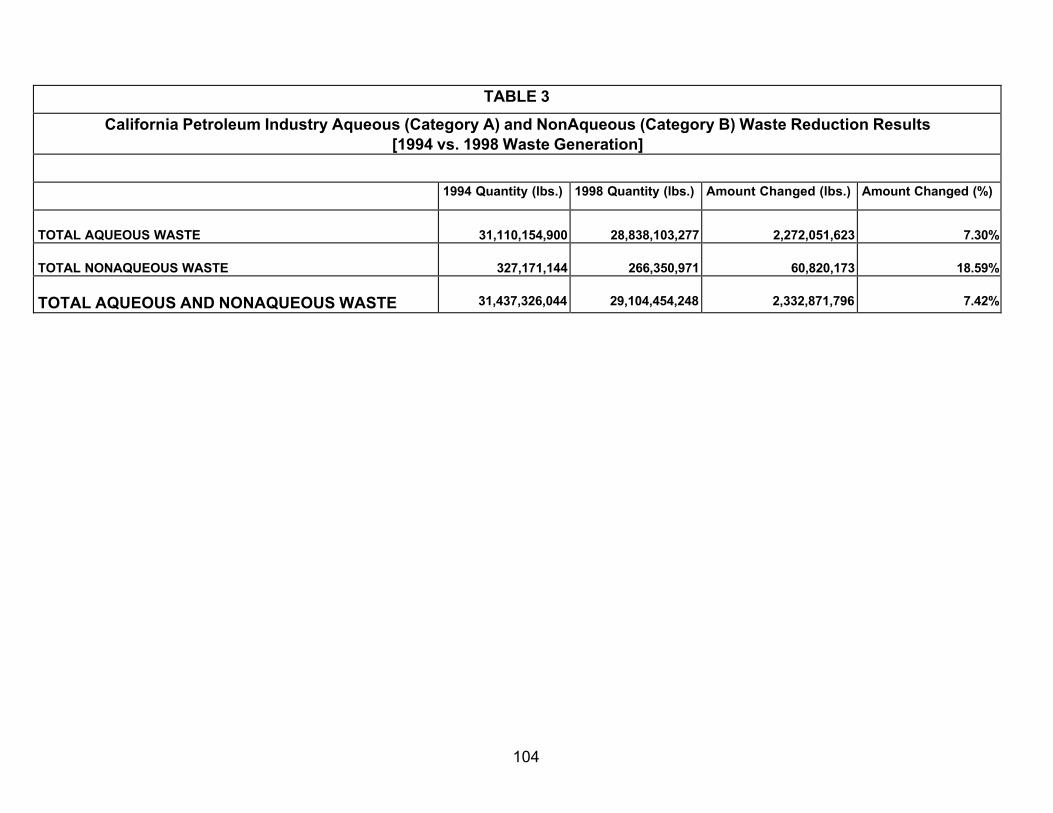
104
TABLE 3
California Petroleum Industry Aqueous (Category A) and NonAqueous (Category B) Waste Reduction Results [1994 vs. 1998 Waste Generation]
1994 Quantity (lbs.) 1998 Quantity (lbs.) Amount Changed (lbs.) Amount Changed (%)
TOTAL AQUEOUS WASTE
31,110,154,900
28,838,103,277
2,272,051,623
7.30%
TOTAL NONAQUEOUS WASTE
327,171,144
266,350,971
60,820,173
18.59%
TOTAL AQUEOUS AND NONAQUEOUS WASTE
31,437,326,044
29,104,454,248
2,332,871,796
7.42%
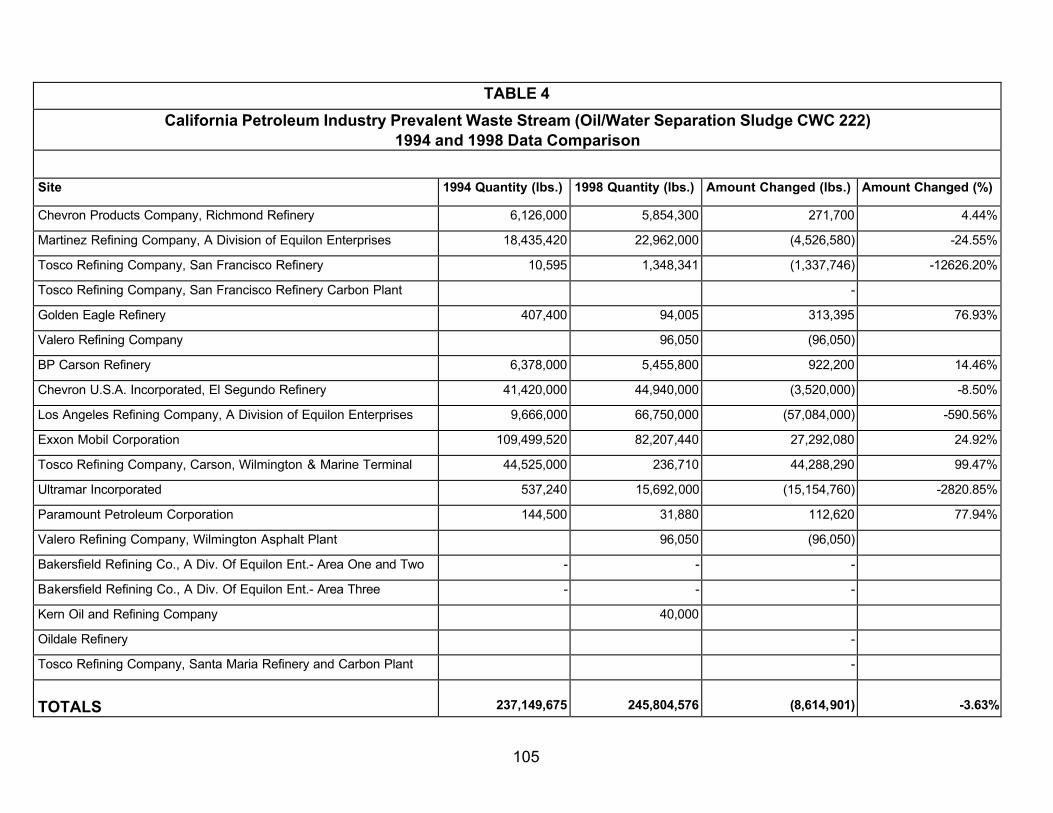
105
TABLE 4
California Petroleum Industry Prevalent Waste Stream (Oil/Water Separation Sludge CWC 222) 1994 and 1998 Data Comparison
Site 1994 Quantity (lbs.) 1998 Quantity (lbs.) Amount Changed (lbs.) Amount Changed (%)
Chevron Products Company, Richmond Refinery 6,126,000 5,854,300 271,700 4.44%
Martinez Refining Company, A Division of Equilon Enterprises 18,435,420 22,962,000 (4,526,580) -24.55%
Tosco Refining Company, San Francisco Refinery 10,595 1,348,341 (1,337,746) -12626.20%
Tosco Refining Company, San Francisco Refinery Carbon Plant -
Golden Eagle Refinery 407,400 94,005 313,395 76.93%
Valero Refining Company 96,050 (96,050)
BP Carson Refinery 6,378,000 5,455,800 922,200 14.46%
Chevron U.S.A. Incorporated, El Segundo Refinery 41,420,000 44,940,000 (3,520,000) -8.50%
Los Angeles Refining Company, A Division of Equilon Enterprises 9,666,000 66,750,000 (57,084,000) -590.56%
Exxon Mobil Corporation 109,499,520 82,207,440 27,292,080 24.92%
Tosco Refining Company, Carson, Wilmington & Marine Terminal 44,525,000 236,710 44,288,290 99.47%
Ultramar Incorporated 537,240 15,692,000 (15,154,760) -2820.85%
Paramount Petroleum Corporation 144,500 31,880 112,620 77.94%
Valero Refining Company, Wilmington Asphalt Plant 96,050 (96,050)
Bakersfield Refining Co., A Div. Of Equilon Ent.- Area One and Two - - -
Bakersfield Refining Co., A Div. Of Equilon Ent.- Area Three - - -
Kern Oil and Refining Company 40,000
Oildale Refinery -
Tosco Refining Company, Santa Maria Refinery and Carbon Plant -
TOTALS
237,149,675
245,804,576
(8,614,901)
-3.63%
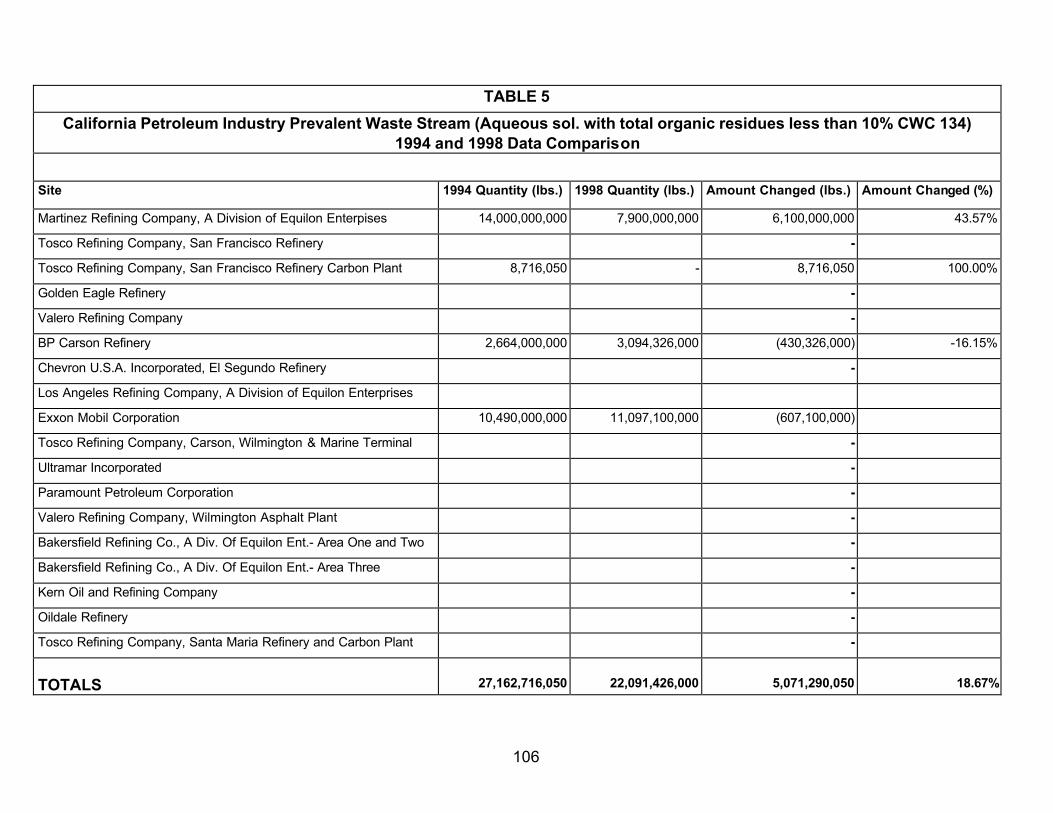
106
TABLE 5
California Petroleum Industry Prevalent Waste Stream (Aqueous sol. with total organic residues less than 10% CWC 134) 1994 and 1998 Data Comparison
Site 1994 Quantity (lbs.) 1998 Quantity (lbs.) Amount Changed (lbs.) Amount Changed (%)
Martinez Refining Company, A Division of Equilon Enterpises 14,000,000,000 7,900,000,000 6,100,000,000 43.57%
Tosco Refining Company, San Francisco Refinery -
Tosco Refining Company, San Francisco Refinery Carbon Plant 8,716,050 - 8,716,050 100.00%
Golden Eagle Refinery -
Valero Refining Company -
BP Carson Refinery 2,664,000,000 3,094,326,000 (430,326,000) -16.15%
Chevron U.S.A. Incorporated, El Segundo Refinery -
Los Angeles Refining Company, A Division of Equilon Enterprises
Exxon Mobil Corporation 10,490,000,000 11,097,100,000 (607,100,000)
Tosco Refining Company, Carson, Wilmington & Marine Terminal -
Ultramar Incorporated -
Paramount Petroleum Corporation -
Valero Refining Company, Wilmington Asphalt Plant -
Bakersfield Refining Co., A Div. Of Equilon Ent.- Area One and Two -
Bakersfield Refining Co., A Div. Of Equilon Ent.- Area Three -
Kern Oil and Refining Company -
Oildale Refinery -
Tosco Refining Company, Santa Maria Refinery and Carbon Plant -
TOTALS
27,162,716,050
22,091,426,000
5,071,290,050
18.67%
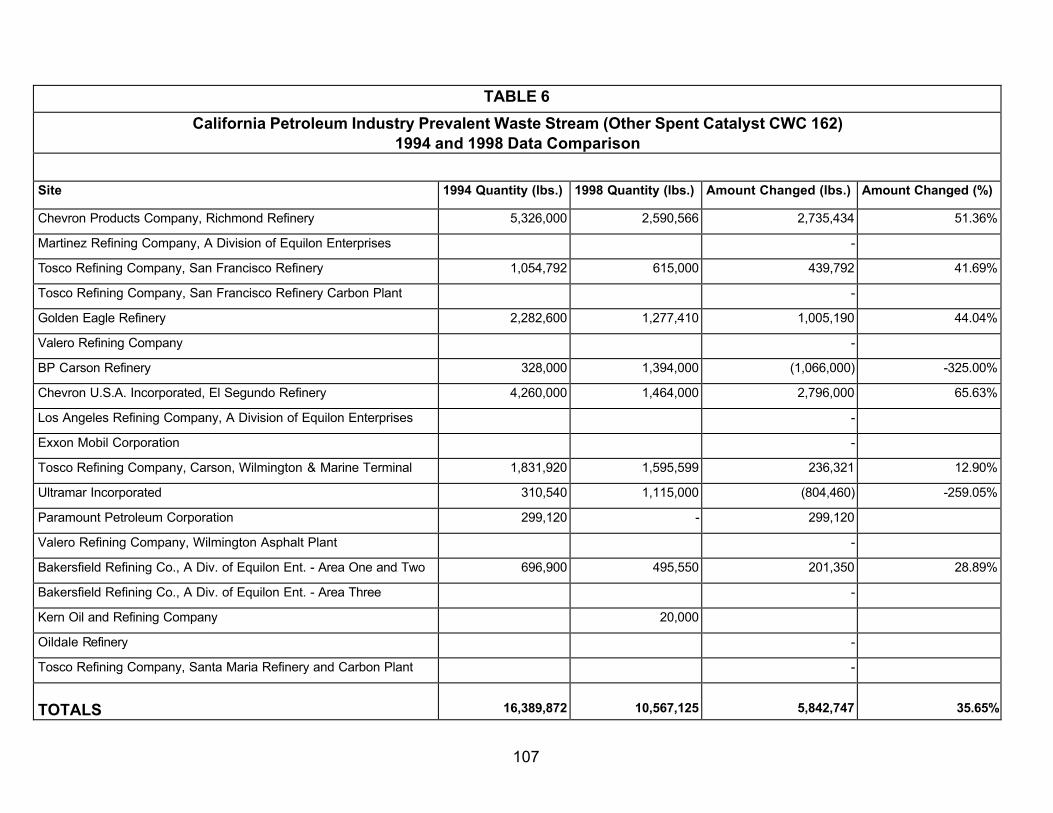
107
TABLE 6
California Petroleum Industry Prevalent Waste Stream (Other Spent Catalyst CWC 162) 1994 and 1998 Data Comparison
Site 1994 Quantity (lbs.) 1998 Quantity (lbs.) Amount Changed (lbs.) Amount Changed (%)
Chevron Products Company, Richmond Refinery 5,326,000 2,590,566 2,735,434 51.36%
Martinez Refining Company, A Division of Equilon Enterprises -
Tosco Refining Company, San Francisco Refinery 1,054,792 615,000 439,792 41.69%
Tosco Refining Company, San Francisco Refinery Carbon Plant -
Golden Eagle Refinery 2,282,600 1,277,410 1,005,190 44.04%
Valero Refining Company -
BP Carson Refinery 328,000 1,394,000 (1,066,000) -325.00%
Chevron U.S.A. Incorporated, El Segundo Refinery 4,260,000 1,464,000 2,796,000 65.63%
Los Angeles Refining Company, A Division of Equilon Enterprises -
Exxon Mobil Corporation -
Tosco Refining Company, Carson, Wilmington & Marine Terminal 1,831,920 1,595,599 236,321 12.90%
Ultramar Incorporated 310,540 1,115,000 (804,460) -259.05%
Paramount Petroleum Corporation 299,120 - 299,120
Valero Refining Company, Wilmington Asphalt Plant -
Bakersfield Refining Co., A Div. of Equilon Ent. - Area One and Two 696,900 495,550 201,350 28.89%
Bakersfield Refining Co., A Div. of Equilon Ent. - Area Three -
Kern Oil and Refining Company 20,000
Oildale Refinery -
Tosco Refining Company, Santa Maria Refinery and Carbon Plant -
TOTALS
16,389,872
10,567,125
5,842,747
35.65%
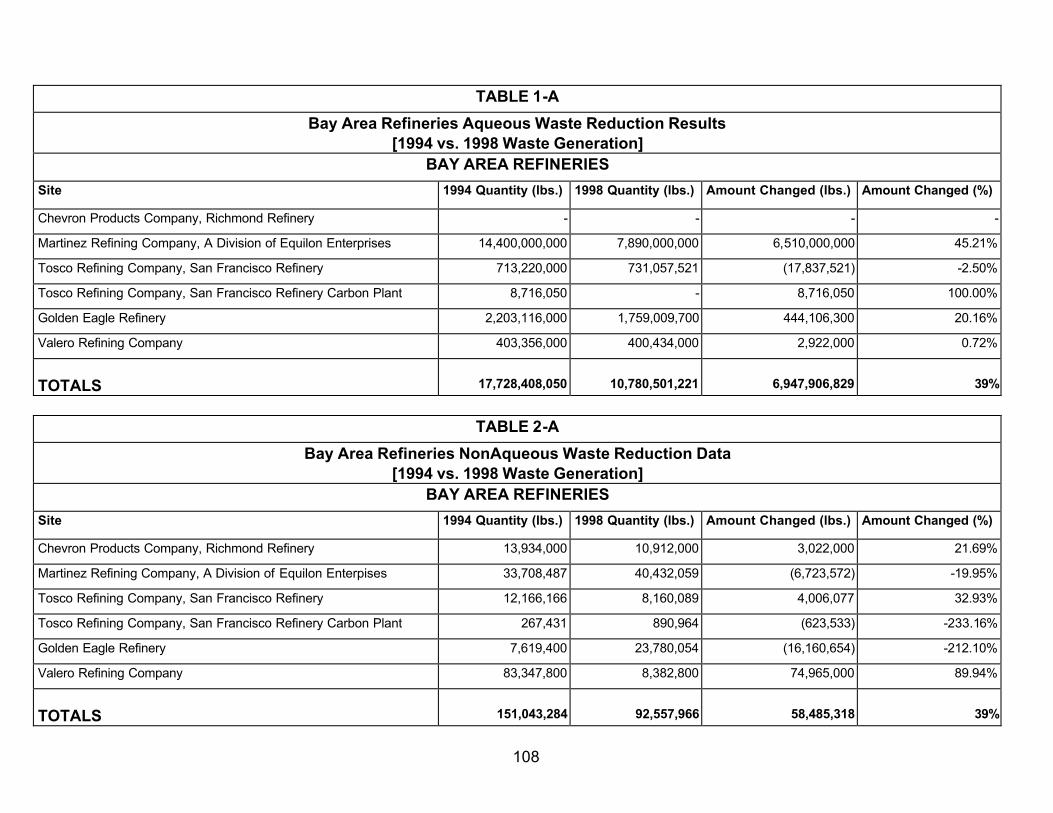
108
TABLE 1-A
Bay Area Refineries Aqueous Waste Reduction Results [1994 vs. 1998 Waste Generation]
BAY AREA REFINERIES
Site 1994 Quantity (lbs.) 1998 Quantity (lbs.) Amount Changed (lbs.) Amount Changed (%)
Chevron Products Company, Richmond Refinery - - - -
Martinez Refining Company, A Division of Equilon Enterprises 14,400,000,000 7,890,000,000 6,510,000,000 45.21%
Tosco Refining Company, San Francisco Refinery 713,220,000 731,057,521 (17,837,521) -2.50%
Tosco Refining Company, San Francisco Refinery Carbon Plant 8,716,050 - 8,716,050 100.00%
Golden Eagle Refinery 2,203,116,000 1,759,009,700 444,106,300 20.16%
Valero Refining Company 403,356,000 400,434,000 2,922,000 0.72%
TOTALS
17,728,408,050
10,780,501,221
6,947,906,829
39%
TABLE 2-A
Bay Area Refineries NonAqueous Waste Reduction Data [1994 vs. 1998 Waste Generation]
BAY AREA REFINERIES
Site 1994 Quantity (lbs.) 1998 Quantity (lbs.) Amount Changed (lbs.) Amount Changed (%)
Chevron Products Company, Richmond Refinery 13,934,000 10,912,000 3,022,000 21.69%
Martinez Refining Company, A Division of Equilon Enterpises 33,708,487 40,432,059 (6,723,572) -19.95%
Tosco Refining Company, San Francisco Refinery 12,166,166 8,160,089 4,006,077 32.93%
Tosco Refining Company, San Francisco Refinery Carbon Plant 267,431 890,964 (623,533) -233.16%
Golden Eagle Refinery 7,619,400 23,780,054 (16,160,654) -212.10%
Valero Refining Company 83,347,800 8,382,800 74,965,000 89.94%
TOTALS
151,043,284
92,557,966
58,485,318
39%
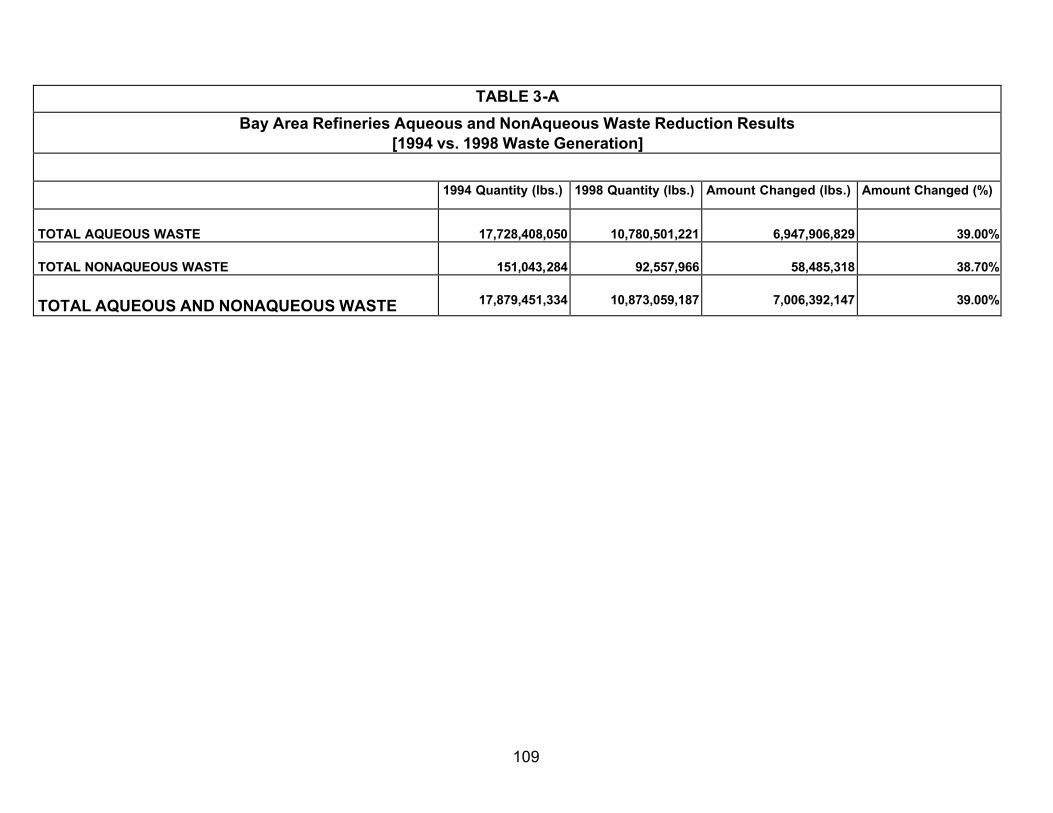
109
TABLE 3-A
Bay Area Refineries Aqueous and NonAqueous Waste Reduction Results [1994 vs. 1998 Waste Generation]
1994 Quantity (lbs.) 1998 Quantity (lbs.) Amount Changed (lbs.) Amount Changed (%)
TOTAL AQUEOUS WASTE
17,728,408,050
10,780,501,221
6,947,906,829
39.00%
TOTAL NONAQUEOUS WASTE
151,043,284
92,557,966
58,485,318
38.70%
TOTAL AQUEOUS AND NONAQUEOUS WASTE
17,879,451,334
10,873,059,187
7,006,392,147
39.00%