Embed Size (px)
Citation preview

California NEM-V Market Assessment A Snapshot of the Current State of the NEM-V Market in California
Milestone 3.6.1
December 31, 2015
Prepared by
Center for Sustainable Energy California Solar Energy Industries Association Interstate Renewable Energy Council

M1.3.1: Policy Background and Tariff Summary 2
Copyright © 2015 Center for Sustainable Energy
M1.3.1: Policy Background and Tariff Summary 3
Contents About this Report ...................................................................................................................................... 5
I. Background ............................................................................................................................................ 6
II. Market Assessment Approach .............................................................................................................. 7
III. Market Potential .................................................................................................................................. 9
IV. Market Adoption ............................................................................................................................... 11
IV. Market Actors .................................................................................................................................... 16
V. Conclusion ........................................................................................................................................... 21

M1.3.1: Policy Background and Tariff Summary 4
DISCLAIMER: This material was prepared as an account of work sponsored by an agency of the United
States Government and is based upon work supported by the U.S. Department of Energy under Award
Number DE-EE0006902. Neither the United States Government nor any agency thereof, nor any of their
employees, makes any warranty, express or implied, or assumes any legal liability or responsibility for
the accuracy, completeness or usefulness of any information, apparatus, product or process disclosed,
or represents that its use would not infringe on privately owned rights. Reference herein to any specific
commercial product, process or service by trade name, trademark, manufacturer or otherwise does not
necessarily constitute or imply its endorsement, recommendation or favoring by the United States
Government or any agency thereof. The views and opinions of authors expressed herein do not
necessarily state or reflect those of the United States Government or any agency thereof.

M1.3.1: Policy Background and Tariff Summary 5
About this Report
The Virtual Net Metering (NEM-V) Market Development Project is one of 15 projects that make up the
United States Department of Energy’s SunShot Solar Market Pathways Program, which aims to bolster
solar adoption throughout the United States.
This NEM-V Market Assessment Report is one deliverable associated in the Virtual Net Metering Market
Development Project Statement of Project Objectives and is intended to summarize the current state of
California’s NEM-V market. A future report will explore barriers to the widespread use of the NEM-V
tariff; this report is simply a snapshot of tariff adoption to date.
The term market can refer to “the group of consumers or organizations that is interested in the product,
has the resources to purchase the product and is permitted by law and other regulations to acquire the
product.”1 This report looks at the NEM-V market, as it relates to locale, adoption process and market
actors, as well as financing and other implementation models.
This report will be published on the Virtual Net Metering Market Development Project webpage2 and
disseminated to other Solar Market Pathways awardees, as well as provided directly to the Department
of Energy as a reporting requirement under award DE-EE0006902.
1 http://www.netmba.com/marketing/market/definition/.
2 www.energycenter.org/smp.

M1.3.1: Policy Background and Tariff Summary 6
I. Background The California Legislature established the Net Energy Metering (NEM) tariff in 1996 with the enactment
of Senate Bill 656. With the growth of solar through the successful implementation of NEM, California
has created different subtariffs that extend and build off the successes NEM created. Virtual Net Energy
Metering (VNEM) has become one of the important derivatives of traditional net energy metering
because it allows residents in a multitenant building to share in the tariff benefits of a common system
on the roof of their building. By allowing a multitenant building to install a single solar electric system for
the benefit of multiple tenants, it enables more cost-effective design as compared to the traditional
NEM solar arrangement of one solar electric system physically installed and connected to each utility
account.
To address low-income residential customers and affordable housing projects, the CPUC created the
Multifamily Affordable Solar Housing Program (MASH) in October 2008.3 Recognizing that tenant access
to the direct benefits of the solar system
production was a critical component of the
rebate, the need for a new utility tariff was
apparent, which resulted in the low-income VNM
tariff.
In July 2011, the California Public Utilities
Commission (CPUC) released Decision 11-07-031,4
which ordered the three large investor-owned
utilities5 (IOUs) to create a tariff for non-low-
income multitenant housing properties similar to
VNM,6 but with participation limited to a single
service delivery point (SDP), to be known as the
NEM-V tariff. The three IOUs filed proposed tariffs
in September 2011 to fulfill the CPUC’s order to
3 CPUC Decision 08-10-036.
4 CPUC Decision 11-07-031, p. 65, Ordering Paragraphs 1 and 2.
5 San Diego Gas & Electric; Southern California Edison; Pacific Gas & Electric.
6 VNM is the low-income solar tariff which allows multiple accounts to benefit from a common solar electric
system, within the three large IOU service territories. The VNM tariff is not subject to the same SDP restrictions as the NEM-V tariff.
Figure 1: Electric Service Territories of the IOUs Offering NEM-V in California

M1.3.1: Policy Background and Tariff Summary 7
create a virtual net metering tariff for general market multifamily housing and multimetered properties.
There were a variety of topics that needed to be addressed in such a tariff, all of which were subject to
protests, disputes and competing opinions as to how the tariff should be structured. Each utility
proposal had elements controversial to the various solar parties, and the CPUC issued a decision in April
2012 ordering changes to the proposed tariffs.7 This resolution led to the current NEM-V tariff structure,
as we know it today. At present, there are no other utility providers in California offering a virtual net
metering tariff for general-market multitenant properties with on-site generation. Figure 1 shows the
service territories of the three large IOUs offering NEM-V.
Despite having been operational since 2011, the use of the NEM-V tariff has been extremely limited.
This report seeks to summarize the existing NEM-V market, as well as highlight potential market
developments that could support greater tariff adoption levels. This report will only peripherally address
barriers to NEM-V. A more in depth exploration of barriers will be presented by the project team in a
future Solar Market Pathways report.
II. Market Assessment Approach This report seeks to assess the existing NEM-V market within California, as well as highlight potential
market developments that could
support greater NEM-V adoption
levels. In order to conduct an
assessment of the NEM-V market and
inform the market context of NEM-V in
California, we employed a variety of
primary and secondary data collection
methods that are summarized in
Tables 1 and 2. Primary data was
obtained through surveys, in-depth
interviews and data requests, as well
as working group meetings with
market stakeholders, including
7 CPUC, Resolution E-4481, April 29, 2012.
Table 1: Primary Data Collection Methods
Primary Data
Property Owners/
Managers
Solar Contractors/
Installers
Utilities
Surveys 42 responses
116 responses
N/A
Interviews 2 interviews
9 interviews
1 interview each with
PG&E, SCE & SDG&E
Working Group Meetings
N/A 4 meetings,
averaging 16 attendees
N/A

M1.3.1: Policy Background and Tariff Summary 8
property owners and managers, solar contractors and utility representatives. The team also used
secondary data to inform its research (Table 2). More details on the primary data collection are
provided.
Table 2: Secondary Data Collection Methods
Property owner/manager survey: The
electronically administered survey gauged
the knowledge, decision factors and
experience of going solar and the NEM-V
tariff. The survey was disseminated through
the various channels:
Apartment Association of Greater Los Angeles (AAGLA) – Survey sent through a “Products and
Services” email, as well as linked in their monthly newsletter
Building Owners and Management Association (BOMA) – Survey description and link was
distributed in a monthly newsletter, as well as advertised on their “news” page for the duration
of the active survey
San Diego County Apartment Association (SDCAA) – Agreed to distribute the survey link in their
weekly newsletter, as well as in their monthly digital newsletter
Building Industries Association (BIA) – Distributed news of the survey to San Diego members
through a targeted email, as well as advertised the survey in their newsletter
Due to the variety of dissemination avenues and facilitators, it is unclear how many recipients received
the final survey. The survey yielded a total of 42 responses.
Property Owner Interviews: Based on the survey results, seven property owners were identified as
having experience with the NEM-V tariff. We contacted respondents who reported contact information
for follow-up interviews and completed two interviews. In addition, we interviewed two more through
referrals, resulting in a total of four interviews.
Solar Contractor/Installer Survey: The contractor survey sought to inform the project team on the
awareness and activity of installers working with the NEM-V tariff, adoption levels and location of NEM-
V projects and challenges faced in the development process. The contractor surveys were administered
electronically and distributed through the project team’s internal list of 350 contractor contacts,
Secondary Data
Data Type Source California building stock data American Community
Survey 2014 Estimates Number of interconnected
NEM-V projects Utility Data Requests
for all 3 IOUs

M1.3.1: Policy Background and Tariff Summary 9
including contractors within California who participated in the California Solar Initiative (CSI) incentive
program. The survey process included several email reminders to prompt further participation, which
yielded a response rate of 33% or 116 complete responses.
Contractor Interviews: Based on survey results, we identified a total of 15 contractors who reported to
have experience with the NEM-V tariff. We reached out to those contractors and completed nine
contractor interviews.8
Utility Interviews: To accurately assess the NEM-V process from the point of view of the utility, the
project team utilized semistructured interview scripts to understand the interconnection process and
requirements of NEM-V within each utility territory. The interview questions were sent to utility
representatives prior to the interview to allow them to gather information from different
staff/departments that would be useful during the interviews. The interviews were administered in
person and via conference call. The interview team confirmed the documented responses with the
utility representatives and the results were sent back to the interviewees to ensure accuracy and quality
of each response. Utility representatives provided minor edits allowing the project team to feel
confident with the level of detail and accuracy in the interviews.
Working Group Meetings: This assessment also is supported with information gained from four NEM-V
Working Group meetings with contractors operating in the Southern California region and held as part
of our Friends of NEM-V Santa Monica Pilot project during September-December 2015. Each meeting
hosted a series of speakers and topics, exploring different aspects of implementing NEM-V in the
multifamily building space. Topics included tariff eligibility, interconnection process, financing,
permitting, rent control and the value proposition for apartments and condos. The four meetings
averaged 16 attendees.
The following sections of this report present the findings of these efforts.
III. Market Potential California has significant potential for the deployment of NEM-V given the volume of multitenant
building stock in the residential and commercial building sector. In this section we will focus on the
M1.3.1: Policy Background and Tariff Summary 10
potential in the residential sector only as this has been the center of this team’s SMP project
deliverables to date.
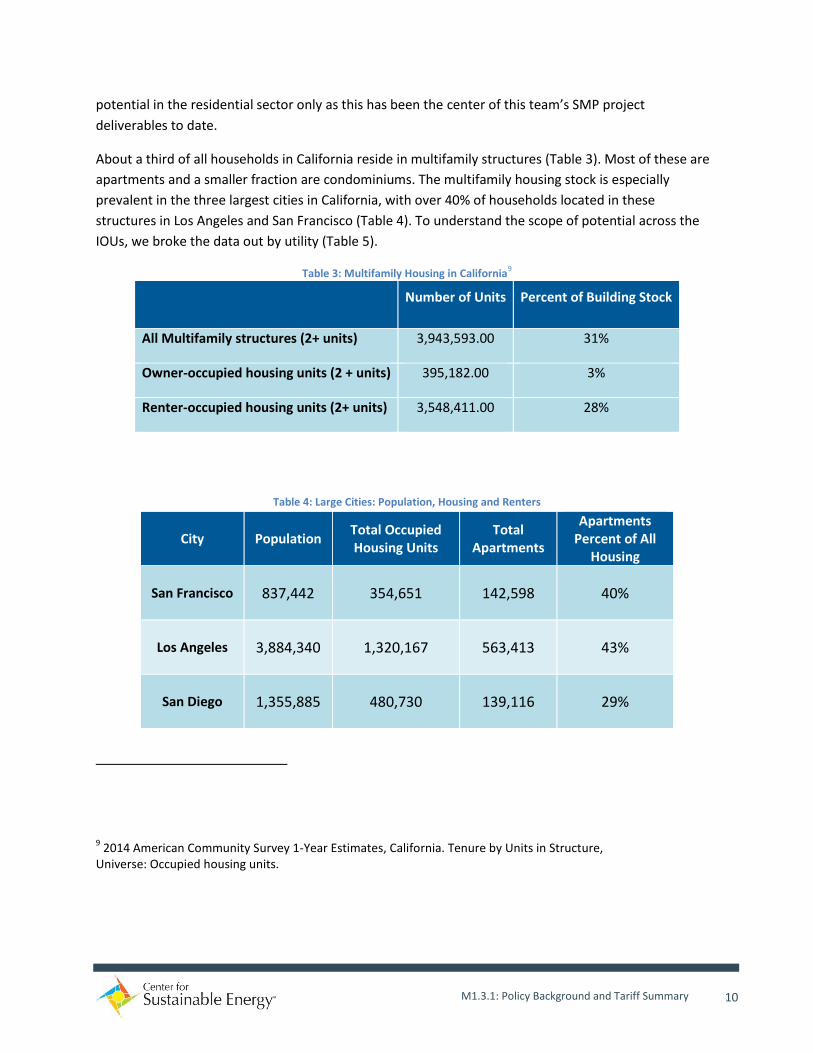
About a third of all households in California reside in multifamily structures (Table 3). Most of these are
apartments and a smaller fraction are condominiums. The multifamily housing stock is especially
prevalent in the three largest cities in California, with over 40% of households located in these
structures in Los Angeles and San Francisco (Table 4). To understand the scope of potential across the
IOUs, we broke the data out by utility (Table 5).
Table 3: Multifamily Housing in California9
Number of Units Percent of Building Stock
All Multifamily structures (2+ units) 3,943,593.00 31%
Owner-occupied housing units (2 + units) 395,182.00 3%
Renter-occupied housing units (2+ units) 3,548,411.00 28%
Table 4: Large Cities: Population, Housing and Renters
City Population Total Occupied Housing Units
Total Apartments
Apartments Percent of All
Housing
San Francisco 837,442 354,651 142,598 40%
Los Angeles 3,884,340 1,320,167 563,413 43%
San Diego 1,355,885 480,730 139,116 29%
9 2014 American Community Survey 1-Year Estimates, California. Tenure by Units in Structure,
Universe: Occupied housing units.

M1.3.1: Policy Background and Tariff Summary 11
Table 5: Multifamily Housing Breakdown by IOU Service Territory
PG&E SCE SDG&E
Total households 4,320,333 4,139,577 1,186,479
Households in multifamily structures (2+ units) 1,209,693 (28%) 1,117,685 (27%) 403,402 (34%)
Condominiums (2+ units) 3% 3% 5%
Apartment (2+ units) 25% 24% 29%
The data does not differentiate between affordable housing and market-rate housing; however, the
sheer number of multitenant dwellings that exist within the three IOU territories is an indicator of the
large NEM-V market potential in all utility territories. The number of households in the three IOUs
roughly corresponds to 1,695 MW of load that could be served by solar power generation.10
IV. Market Adoption
Levels of NEM-V Adoption
California’s three largest IOUs reported 161 interconnected NEM-V solar PV projects comprising at least
2,195 kW11 (AC) of installed capacity in their territories (Table 6). These systems provide PV credits to at
least 752 benefitting accounts.12
10 For this estimate we utilized average energy consumption data provided by the U.S. Energy Information
Administration, Office of Energy Consumption and Efficiency Statistics, Forms EIA-457 A and C-G of the 2009 Residential Energy Consumption Survey.An apartment household in Western USA has an average electric consumption of 5442 kWh/year. This corresponds to an average load of 0.62kW per household. 11
2195.77 kW is the sum of SCE and SDG&E projects. PG&E did not provide system capacity information, citing privacy concerns. 12
SCE reported 154 benefitting accounts. SDG&E reported a total of 484 benefitting accounts. PG&E was unable to provide the number of benefitting accounts, so 114 is the minimum number of benefitting accounts for their territory.

M1.3.1: Policy Background and Tariff Summary 12
Table 6: NEM-V PV Project Adoption Across IOUs in California 2011-2015
Utility # of NEM-V Projects kW (AC) # Benefitting Accounts
PG&E 11413 Not available14 Not available15
SCE 1116 232 154
SDG&E 3617 1963 484
Pacific Gas & Electric (PG&E), the largest IOU in California by total square miles served, has the highest
adoption rates of NEM-V projects among the three large IOUs. This would seem an obvious conclusion
considering PG&E has the highest adoption rate of NEM installed solar installations in California with
over 2.2 GW. Southern California Edison (SCE), which serves more customers than PG&E, has a 90%
lower NEM-V adoption rate compared to PG&E. However, what makes these numbers even more
striking is that SCE, at just under 1.2 GW of total installed NEM projects, has 25 less NEM-V projects
compared to San Diego Gas & Electric (SDG&E), although SDG&E has less than half as many total NEM
installed solar projects (481 MW) in its territory. Possible explanations are that in both PG&E and SDG&E
territories the process to date for installing NEM-V projects may be simpler and more transparent than
the process in SCE territory, communicating with the utility may be more difficult and financing methods
may be less available in SCE territory.
Data Issues
While these adoption levels were reported by the utilities as NEM-V projects, the interpretation of the
reported numbers requires some caution. The reported number of NEM-V projects cannot be directly
translated into a number of participating properties, as meters within a property may be connected to
13 Per PG&E May 2015 — Project team submitted a data request to PG&E in November 2015; however, PG&E did
not provide specific NEM-V projects within their territory, citing privacy concerns. 14
PG&E did not provide NEM-V system capacity information, citing privacy concerns. 15
PG&E did not supply the total number of benefitting accounts for NEM-V projects within their territory, citing privacy concerns. 16
Per SCE December, 2015 — This total differs from the May data request, which listed a total of 12 NEM-V projects. This is assumed to be an error of differentiating between low-income and general market VNEM tariffs. 17
Per SDG&E, November 2015.
M1.3.1: Policy Background and Tariff Summary 13
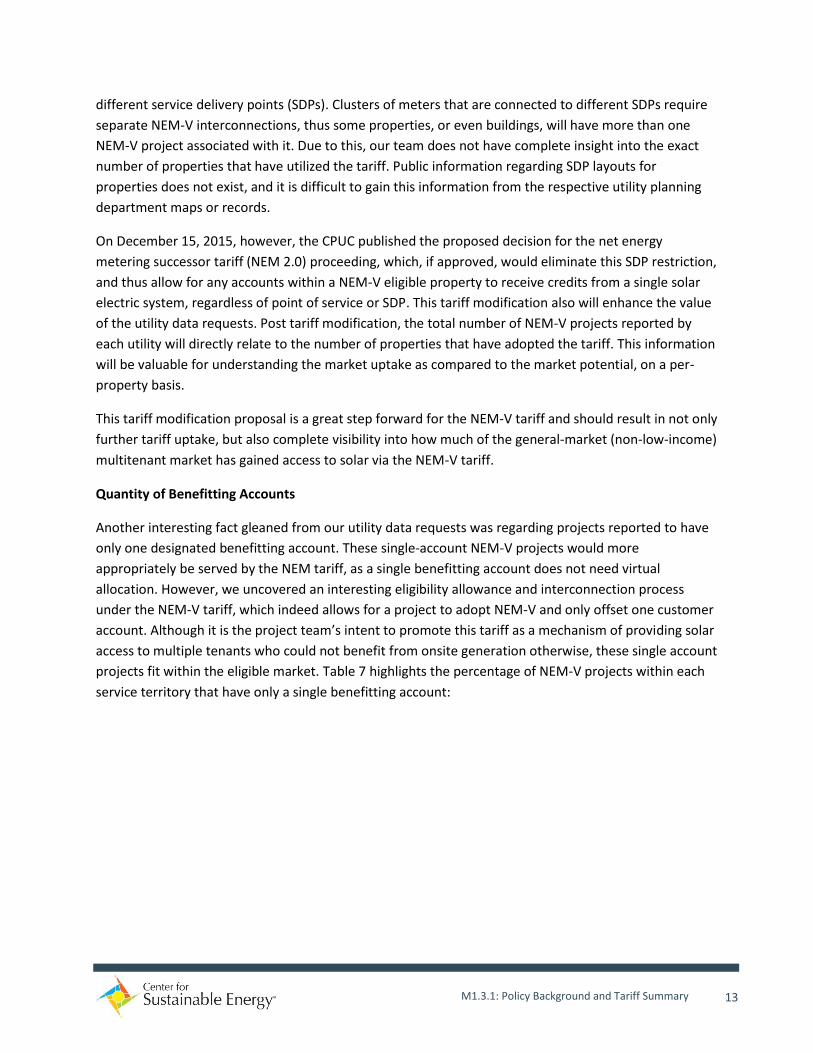
different service delivery points (SDPs). Clusters of meters that are connected to different SDPs require
separate NEM-V interconnections, thus some properties, or even buildings, will have more than one
NEM-V project associated with it. Due to this, our team does not have complete insight into the exact
number of properties that have utilized the tariff. Public information regarding SDP layouts for
properties does not exist, and it is difficult to gain this information from the respective utility planning
department maps or records.
On December 15, 2015, however, the CPUC published the proposed decision for the net energy
metering successor tariff (NEM 2.0) proceeding, which, if approved, would eliminate this SDP restriction,
and thus allow for any accounts within a NEM-V eligible property to receive credits from a single solar
electric system, regardless of point of service or SDP. This tariff modification also will enhance the value
of the utility data requests. Post tariff modification, the total number of NEM-V projects reported by
each utility will directly relate to the number of properties that have adopted the tariff. This information
will be valuable for understanding the market uptake as compared to the market potential, on a per-
property basis.
This tariff modification proposal is a great step forward for the NEM-V tariff and should result in not only
further tariff uptake, but also complete visibility into how much of the general-market (non-low-income)
multitenant market has gained access to solar via the NEM-V tariff.
Quantity of Benefitting Accounts
Another interesting fact gleaned from our utility data requests was regarding projects reported to have
only one designated benefitting account. These single-account NEM-V projects would more
appropriately be served by the NEM tariff, as a single benefitting account does not need virtual
allocation. However, we uncovered an interesting eligibility allowance and interconnection process
under the NEM-V tariff, which indeed allows for a project to adopt NEM-V and only offset one customer
account. Although it is the project team’s intent to promote this tariff as a mechanism of providing solar
access to multiple tenants who could not benefit from onsite generation otherwise, these single account
projects fit within the eligible market. Table 7 highlights the percentage of NEM-V projects within each
service territory that have only a single benefitting account:

M1.3.1: Policy Background and Tariff Summary 14
Table 7: Percentage of NEM-V Projects with a Single Benefitting Account
Utility
Total NEM-V
Projects
Total NEM-V Projects with
a Single Benefitting
Account
Percentage (%) of NEM-V projects
with a Single Benefitting
Account
SCE 11
2
18%
SDG&E 36
9
25%
PG&E 114
Information not available18
This distinct use of the tariff for means of saving on installation costs rather than for providing tenant
access, is something to be recognized and exposes the fact that there could be different drivers for
adopting the tariff beyond the intention of providing solar access for tenants, but rather that it is simply
more cost-effective to go the NEM-V interconnection route over the non-virtual NEM route.
Why would a project employ NEM-V, as opposed to NEM, if they are simply allocating 100% of the
production to a single customer account?
The cost of implementation for these two options is the driver of determining which tariff to adopt:
NEM or NEM-V. In order to adopt the NEM tariff, a building’s service panel often needs to be upgraded
in order to handle the added generation capacity that will be flowing from the solar electric system,
through the service panel, to the home’s appliances. The cost to upgrade a building’s service panel, if
needed, is based on amperage and can range from $2,500 to $9,300, which could increase if further
upgrades to surrounding transmission lines or components are needed. Rather than upgrading the
building’s service panel and employing the [nonvirtual] NEM tariff, some projects have utilized the NEM-
18 PG&E did not divulge details as to the number of benefitting accounts, citing privacy concerns.
M1.3.1: Policy Background and Tariff Summary 15
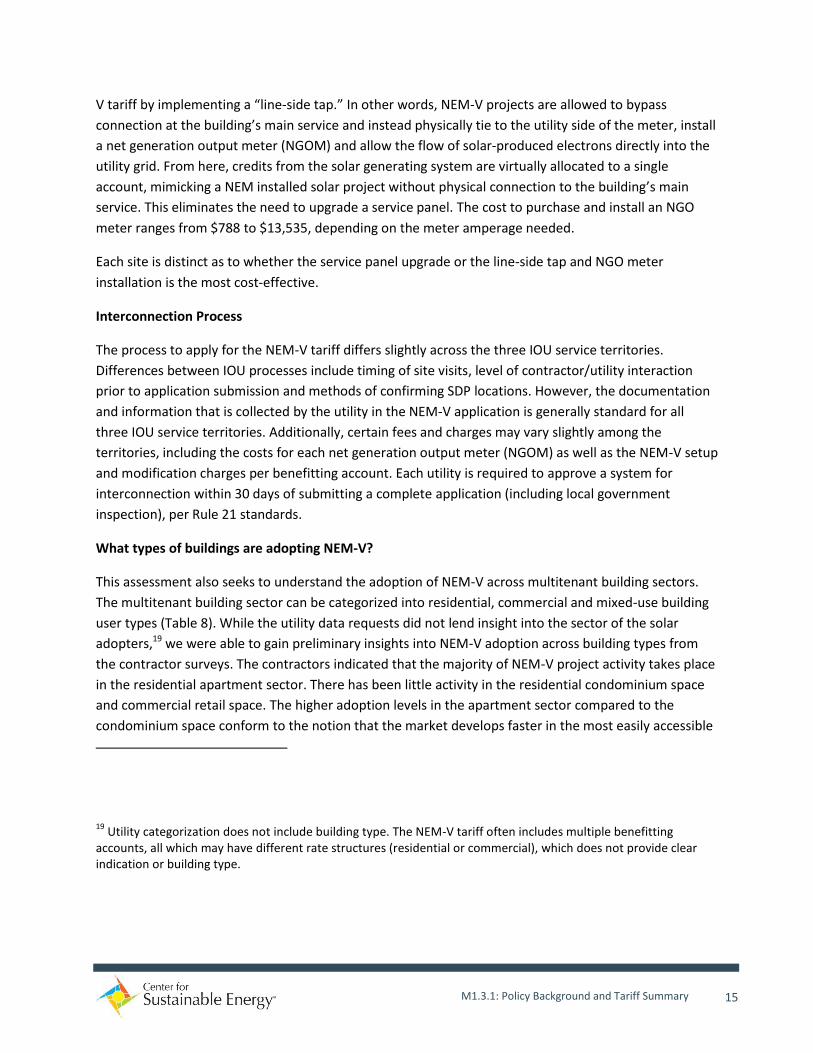
V tariff by implementing a “line-side tap.” In other words, NEM-V projects are allowed to bypass
connection at the building’s main service and instead physically tie to the utility side of the meter, install
a net generation output meter (NGOM) and allow the flow of solar-produced electrons directly into the
utility grid. From here, credits from the solar generating system are virtually allocated to a single
account, mimicking a NEM installed solar project without physical connection to the building’s main
service. This eliminates the need to upgrade a service panel. The cost to purchase and install an NGO
meter ranges from $788 to $13,535, depending on the meter amperage needed.
Each site is distinct as to whether the service panel upgrade or the line-side tap and NGO meter
installation is the most cost-effective.
Interconnection Process
The process to apply for the NEM-V tariff differs slightly across the three IOU service territories.
Differences between IOU processes include timing of site visits, level of contractor/utility interaction
prior to application submission and methods of confirming SDP locations. However, the documentation
and information that is collected by the utility in the NEM-V application is generally standard for all
three IOU service territories. Additionally, certain fees and charges may vary slightly among the
territories, including the costs for each net generation output meter (NGOM) as well as the NEM-V setup
and modification charges per benefitting account. Each utility is required to approve a system for
interconnection within 30 days of submitting a complete application (including local government
inspection), per Rule 21 standards.
What types of buildings are adopting NEM-V?
This assessment also seeks to understand the adoption of NEM-V across multitenant building sectors.
The multitenant building sector can be categorized into residential, commercial and mixed-use building
user types (Table 8). While the utility data requests did not lend insight into the sector of the solar
adopters,19 we were able to gain preliminary insights into NEM-V adoption across building types from
the contractor surveys. The contractors indicated that the majority of NEM-V project activity takes place
in the residential apartment sector. There has been little activity in the residential condominium space
and commercial retail space. The higher adoption levels in the apartment sector compared to the
condominium space conform to the notion that the market develops faster in the most easily accessible
19 Utility categorization does not include building type. The NEM-V tariff often includes multiple benefitting
accounts, all which may have different rate structures (residential or commercial), which does not provide clear indication or building type.

M1.3.1: Policy Background and Tariff Summary 16
sector, i.e., the lowest hanging fruit. Apartment complexes are operated by a single building owner, as
opposed to multiple owners in the condominium sector. This allows for a more efficient decision-making
process. Securing financing may be simpler for a single-property owner, as opposed to multiple owner
investors, due to the infancy of this market and the perceived risk of dealing with multiple loan
recipients.
Table 8: NEM-V Project20
Activity Across Multitenant Building Sectors, as Reported by the 29 Contractor Survey Responses
Installed Under development Cancelled
Residential apartments 72 143 21
Residential condominiums 0 13 1
Commercial retail 0 2 3
Commercial other 23 36 14
Residential/commercial mixed use 2 7 0
The commercial other sector, which includes office and industrial buildings, came in as the second most
prevalent building type to employ the NEM-V tariff. Similar reasons could be applied to this scenario, as
the apartment sector, however, commercial rate design and the effects of solar are more complicated
and may not be as easily translated.
Overall, the reported data demonstrates low adoption levels of NEM-V across the three IOUs. Given the
significant potential for NEM-V projects in all three IOU service territories and the nominal adoption
rates, these statistics give reason for further investigation into challenges faced to the adoption of the
NEM-V tariff.
IV. Market Actors Multitenant Property Owners
In the multitenant property space, decisions about energy upgrades are typically made by the owner or
manager of the facilities. The decision-making entity may differ depending on property building sector,
20 The totals reported in the contractor surveys for “Installed,” “Under development” and “Cancelled” do not align
with the utility-reported data for the total number of NEM-V projects. This is assumed to be due to a misinterpretation of the survey question, and the numbers reported may relate to the number of units and/or benefitting accounts associated within their NEM-V project(s).
M1.3.1: Policy Background and Tariff Summary 17
size and ownership model. The decision makers typically fall into one of the following categories:
property owner/manager, real estate developers or homeowner associations (HOAs).
From conversations with contractors and property decision makers, we gained insight into motivations
for installing NEM-V systems. Installing NEM-V projects provides the ability to market apartments to
environmentally conscious renters. This boosts occupancy and may enable the building owner to charge
a premium.
We administered a survey to understand the property decision makers’ awareness and decisions
regarding the utilization of the NEM-V tariff. Through qualifying questions at the start of the survey we
identified 42 respondents as energy upgrade decision makers in the market-rate multitenant property
space. The vast majority of these respondents (38) operate properties in the residential apartment
sector. About half of the respondents indicated that they operate outside of the three major IOU
territories. Because the NEM-V tariff is only available from the three IOUs, the following data pertain to
those respondents that operate properties inside IOU territories (26). All three IOU territories are
represented in the data, while five respondents operate in more than one IOU territory.
Since 2011, the year NEM-V became available in the multitenant property sector, the majority of the
respondents (18) had engaged with solar on some level – from researching the possibility to installing a
solar system. Six decision makers installed solar PV systems on at least one of their properties, of which
three utilized the NEM-V tariff. These three companies reported one, five and twelve NEM-V projects
each. Both lease and self-ownership financing modes were reported for these projects.
The three companies utilizing NEM-V learned about the tariff from the solar developer (2) or solar
blogs/solar newsletters/articles (1).Two property owners/managers expressed challenges with the
development of the NEM-V solar PV project, while one did not report major challenges.
The challenges involved (multiple answers were possible):
Understanding how to make NEM-V work on my property (2)
Working with the utility to interconnect the PV system and allocate PV credits among tenants (2)
Understanding the financing options for a NEM-V project (1)
Of the respondents that installed solar but did not utilize NEM-V (6), five mentioned that they were not
familiar with the NEM-V tariff at the time. This indicates a potential to reach out to property
owners/developers and HOAs about NEM-V on multitenant properties. These decision makers also
mentioned as challenges for not deploying the NEM-V tariff rent control restrictions and the difficulty of
finding contractors that could make VNEM on their property work out economically.
Solar Contractors & Installers
As of December 2015, SCE and SDG&E reported 15 contractor companies that successfully installed
NEM-V (Table 9). There were no contractors who had installed NEM-V projects across both service
territories. The available PG&E NEM-V metrics do not provide visibility into which or how many solar

M1.3.1: Policy Background and Tariff Summary 18
contractors have successfully installed NEM-V projects within that territory. The single-family residential
solar market and small commercial solar market has seen a proliferation of solar installers in California.
NEM-V is still in its infant stages but this data shows that at least 15 installers have made it work.
While we did not obtain information about solar contractors active in PG&E from the utility, we learned
from interviews that there is one installation company has championed at least 100 NEM-V projects
within PG&E service territory. The interview with this company did not glean information about which
licensed contractor completed the physical installation, but it is assumed that at least one installer has
been subcontracted for those projects. We did gain some insight into the business model of this
company. The NEMV projects are realized using a third-party ownership model by setting up PPA’s with
the tenants living in the property rather than with the property owner. Additionally, the company enters
into an agreement for a fixed length of time with the property owner to allow the installation of the
solar system on the building roof, essentially renting roof space. Under such a business structure, the
building owner is not responsible for operating, maintaining or fixing the system. These NEM-V projects
are set up to incorporate all tenant households. Thus, all tenants participate in the NEM-V tariff
allocation.
Table 9: Number of NEM-V Project Installers Across IOU Service Territories Within California
Number of Installers
Number of Projects
PG&E Unknown21 114
SCE 5 11
SDG&E 10 36
The survey responses from the contractors/installers presented more insights into NEM-V activity,
challenges associated with the development of these projects and awareness of the tariff and how
contractors learned about the tariff.
21 PG&E was unable to provide the contractor information associated with the NEM-V projects due to privacy
concerns. Contractor interviews confirmed there is at least one NEM-V developer working in the PG&E service territory.

M1.3.1: Policy Background and Tariff Summary 19
The contractor survey yielded responses from 116 contractors, representing 105 different companies. Of
the 105 companies, 13 reported to have installed a NEM-V project. Seventeen companies are currently
in the process of developing a project.22 Another six companies attempted to develop a NEM-V project
but the project was canceled in the end. Altogether, 28 contractors reported to have been involved in
solar business activities involving NEM-V. While these numbers may not be reflective of the entire NEM-
V contractor base, it is evident that the active NEM-V contractor/installer base is very small in
comparison to the more than 1,000 solar contractor/installers in California.23
There are multiple reasons why the contractor activity is limited at this time. The following sections shed
light on the different aspects of installer engagement deficiencies in the NEM-V market.
To gain insights into why only few contractors operate in the space, we can look at responses of
contractors that, while being knowledgeable about the tariff, have not engaged in the development of
NEM-V projects. The majority of contractors (34) reported barriers that they could not overcome at this
time as reason for not participating in the NEM-V market segment. This shows that the entrance into the
NEM-V market segment is difficult. In particular, these contractors mentioned that they were not able to
find customers that would employ solar in the multitenant space or property managers did not see the
value proposition of solar. The barriers also extend to the contractor side as contractors reported that
they do not have the knowledge to develop a business proposition that is financially appealing to the
property owner. The open responses revealed that the success rate of establishing projects is low as it
takes a lot of effort to make a proposal. Despite these difficulties, almost all 34 contractors indicated
that they are interested in developing NEM-V projects in the future, which leads to the assumption that
the contractor base will likely increase with the evolving NEM-V market.
Knowledge of NEM-V tariff among contractors
A critical factor in activity of contractors in the NEM-V market segment is the contractor’s awareness of
the tariff. Of the 116 contractors that responded to the survey, only 54% reported to be familiar with
the NEM-V tariff. While some of these contractors may not be active in the multitenant market
segment, the level of awareness gives reason to increase education and outreach about the tariff to the
contractor base in California. Increasing the knowledge about the tariff may increase the active NEM-V
22 Of these 17 companies, 8 have installed a NEM-V system.
23 More than 1000 active solar contractors are documented in California Solar Statistics, “Currently Interconnected
Data Set.”

M1.3.1: Policy Background and Tariff Summary 20
contractor base as contractors who are familiar with the tariff are likely to be interested in developing
projects in this space.
Information sources for learning about NEM-V
Contractors mentioned a variety of sources for learning about the NEM-V tariff. Of the 27 contractors
who responded to this question, 14 referenced the utility as source of information. Some contractors
attended webinars, while others called the utility representatives to learn more about the tariff. The
utility websites also were accessed for more information. Three contractors learned about NEM-V from
the California Solar Energy Industries Association (CALSEIA). Two contractors mentioned the CPUC
websites and proceedings. One contractor stated a solar website as an information source. Given the
needs for improving awareness of the tariff, the current information sources may not be sufficient
and/or effective enough to achieve that. Increased and targeted outreach to contractors is necessary to
achieve higher levels of awareness of NEM-V.
Challenges in the development of NEM-V projects
To understand the level of difficulty in the development of NEM-V projects we posed several questions
addressing project challenges. Of the 28 contractors actively involved in NEM-V, the majority (24)
reported to have experienced challenges during the NEM-V project development cycle. Most of these
projects struggled with interconnection issues. Uncertainty about regulatory policies or changes of
policies (such as NEM, utility rate structure) was mentioned by half of the respondents. Moreover,
contractors indicated that property owners find the NEM-V tenant allocation difficult to manage, which
makes it challenging for contractors to sell NEM-V to customers.
Contractors reported these challenges in different phases of the interconnection process:
A lack of understanding of the tariff by utility employees
Utility disapproval of NEM-V equipment
Difficulty communicating with the utility, e.g., response time to requests and finding a contact
person
The challenge of identifying the location of the service delivery points, as well as the virtual
credit allocation restriction to one SDP only
Comparison of Difficulty of Project Factors NEM-V to NEM
Comparing the level of difficulty of a project process of a nascent market segment compared to a well-
established market segment can give us more insights into the trajectory of the new market segment.
Therefore we asked contractors how they would rate the ease or difficulty of certain critical project
factors of NEM-V compared to the more established NEM (Table 10).
M1.3.1: Policy Background and Tariff Summary 21
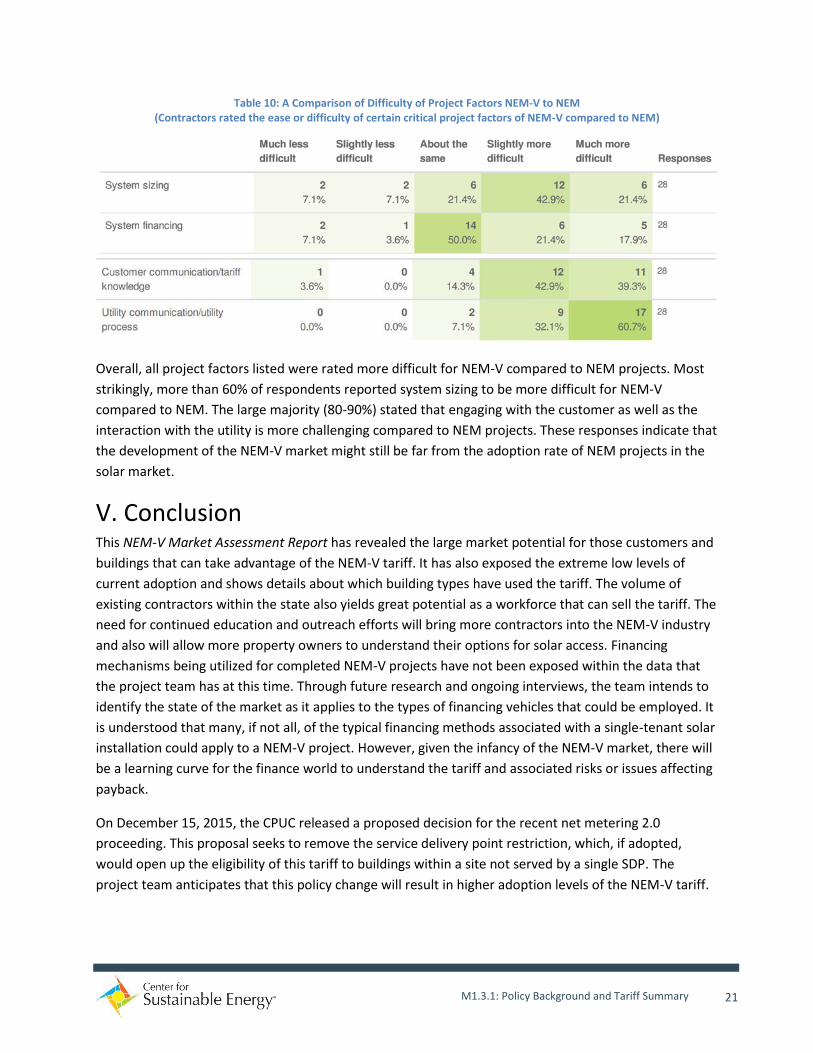
Table 10: A Comparison of Difficulty of Project Factors NEM-V to NEM (Contractors rated the ease or difficulty of certain critical project factors of NEM-V compared to NEM)
Overall, all project factors listed were rated more difficult for NEM-V compared to NEM projects. Most
strikingly, more than 60% of respondents reported system sizing to be more difficult for NEM-V
compared to NEM. The large majority (80-90%) stated that engaging with the customer as well as the
interaction with the utility is more challenging compared to NEM projects. These responses indicate that
the development of the NEM-V market might still be far from the adoption rate of NEM projects in the
solar market.
V. Conclusion This NEM-V Market Assessment Report has revealed the large market potential for those customers and
buildings that can take advantage of the NEM-V tariff. It has also exposed the extreme low levels of
current adoption and shows details about which building types have used the tariff. The volume of
existing contractors within the state also yields great potential as a workforce that can sell the tariff. The
need for continued education and outreach efforts will bring more contractors into the NEM-V industry
and also will allow more property owners to understand their options for solar access. Financing
mechanisms being utilized for completed NEM-V projects have not been exposed within the data that
the project team has at this time. Through future research and ongoing interviews, the team intends to
identify the state of the market as it applies to the types of financing vehicles that could be employed. It
is understood that many, if not all, of the typical financing methods associated with a single-tenant solar
installation could apply to a NEM-V project. However, given the infancy of the NEM-V market, there will
be a learning curve for the finance world to understand the tariff and associated risks or issues affecting
payback.
On December 15, 2015, the CPUC released a proposed decision for the recent net metering 2.0
proceeding. This proposal seeks to remove the service delivery point restriction, which, if adopted,
would open up the eligibility of this tariff to buildings within a site not served by a single SDP. The
project team anticipates that this policy change will result in higher adoption levels of the NEM-V tariff.

M1.3.1: Policy Background and Tariff Summary 22

HEADQUARTERS
9325 Sky Park Court, Suite 100 - San Diego, CA 92123 - 858.244.1177 - www.energycenter.org
SAN DIEGO | LOS ANGELES | OAKLAND
As a mission-driven nonprofit organization, CSE works with energy policymakers,
regulators, public agencies and businesses as an expert implementation partner and
trusted information resource. Together, we are the catalysts for sustainable energy
market development and transformation.