Embed Size (px)
Citation preview

PRELIMINARY DRAFT DISTRIBUTED FOR PUBLIC COMMENT
California-Modified GREET Pathway for the Production of Biodiesel from Corn Oil at Dry
Mill Ethanol Plants
Stationary Source Division Release Date: November 3, 2011
Version 2.0
Corn Oil

PRELIMINARY DRAFT DISTRIBUTED FOR PUBLIC COMMENT
Preliminary draft version developed by Fuels Evaluation Section of the California Air Resources Board for the Low Carbon
Fuel Standard Methods 2A-2B Process
When reviewing this document, please submit comments directly to:
Hafizur Chowdhury: [email protected] Wes Ingram: [email protected]
These comments will be compiled, reviewed, and posted to the LCFS website in a timely manner
PRELIMINARY DRAFT DISTRIBUTED FOR PUBLIC COMMENT
11/03/11 i
TABLE OF CONTENT
TABLE OF CONTENT ..................................................................................................... i LIST OF FIGURES...........................................................................................................ii LIST OF TABLES ............................................................................................................ii APPENDICES ..................................................................................................................ii 1. Pathway Summary .................................................................................................... 3 2. Description of Corn Oil Extraction Process ............................................................... 9 3. Corn Oil Extraction Energy Use and GHG Emissions ............................................. 10 4. Ethanol Plant Energy Savings ................................................................................. 12 5. Carbon Intensity of Corn Oil Extraction ................................................................... 14 6. Effect of Corn Oil Extraction on DGS Production .................................................... 16 7. Corn Oil Transport and Distribution ......................................................................... 16 8. Biodiesel Production ................................................................................................ 17 9. Biodiesel Transport and Distribution ........................................................................ 18 10. Complete Pathway Carbon Intensities .................................................................... 19
PRELIMINARY DRAFT DISTRIBUTED FOR PUBLIC COMMENT
11/03/11 ii
LIST OF FIGURES
Figure 1. Corn Oil Biodiesel Production Process ........................................................... 5
LIST OF TABLES
Table 1. Summary of Energy Consumption and GHG Emissions from a WTW Analysis of Biodiesel Produced from Corn Oil .................................................. 8 Table 2. Greenhouse-Gas-Generating Energy Consumed to Extract Corn Oil ............ 11 Table 3. Total GHG Emissions from Corn Oil Extraction .............................................. 12 Table 4. Energy Use and Savings from Corn Oil Extraction Installation at Dry Mill Ethanol Plants ............................................................................... 13 Table 5. Greenhouse Gas Emission Factors and Net Carbon Intensities for Corn Oil Extraction .................................................................................... 15 Table 6. Total Energy Required for Corn Oil Transportation from Midwest to California ..................................................................................... 17 Table 7. Total GHG Emissions from Corn Oil Transportation ....................................... 17 Table 8. Total GHG Emissions from Biodiesel Transesterification ............................... 18 Table 9. Total GHG Emissions from Biodiesel Transport and Distribution ................... 19 Table 10.Corn Oil to Biodiesel Pathway Carbon Intensity ............................................. 20
APPENDICES
Appendix A. Energy Use Estimates.............................................................................. 21 Appendix B. Emissions Factors and Carbon Intensity Estimates ................................. 23 Appendix C. Energy Use Reduction in the Production of Corn Ethanol from Adding Corn Oil Extraction by GreenShift Corporation ............................. 33 References .................................................................................................................... 40
PRELIMINARY DRAFT DISTRIBUTED FOR PUBLIC COMMENT
11/03/11 3
CALIFORNIA-MODIFIED GREET PATHWAY FOR THE PRODUCTION OF BIODIESEL FROM CORN OIL AT DRY MILL
ETHANOL PLANTS
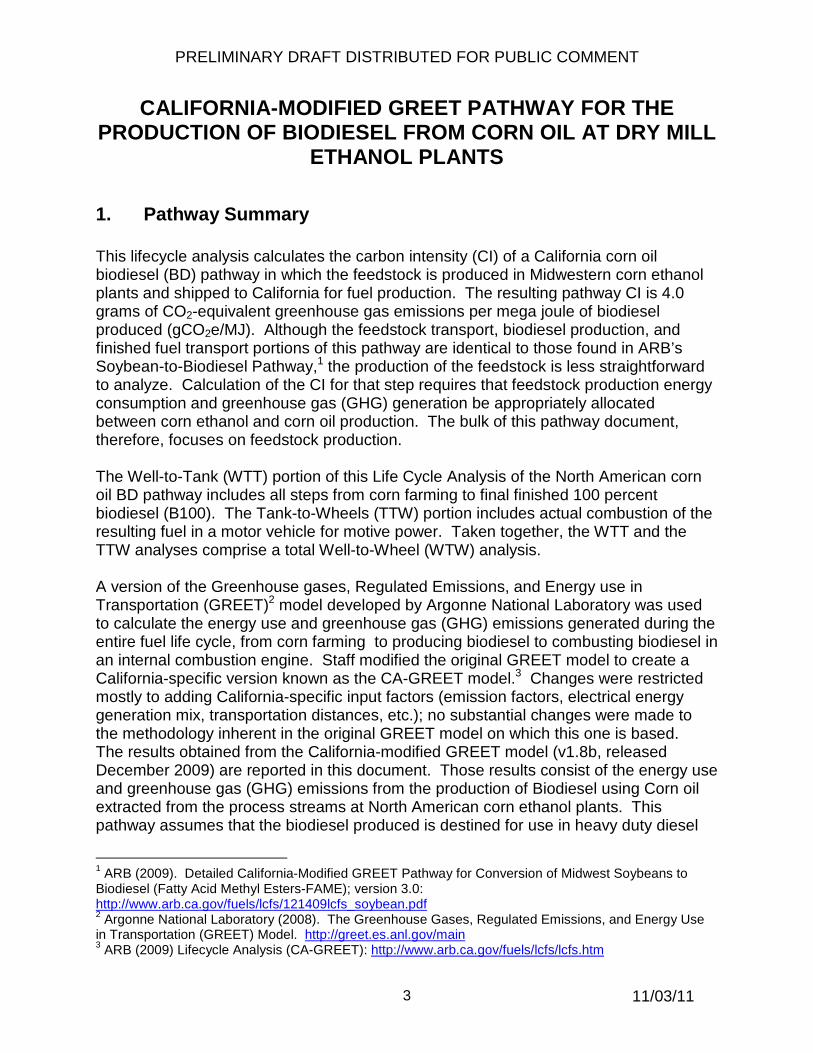
1. Pathway Summary This lifecycle analysis calculates the carbon intensity (CI) of a California corn oil biodiesel (BD) pathway in which the feedstock is produced in Midwestern corn ethanol plants and shipped to California for fuel production. The resulting pathway CI is 4.0 grams of CO2-equivalent greenhouse gas emissions per mega joule of biodiesel produced (gCO2e/MJ). Although the feedstock transport, biodiesel production, and finished fuel transport portions of this pathway are identical to those found in ARB’s Soybean-to-Biodiesel Pathway,1 the production of the feedstock is less straightforward to analyze. Calculation of the CI for that step requires that feedstock production energy consumption and greenhouse gas (GHG) generation be appropriately allocated between corn ethanol and corn oil production. The bulk of this pathway document, therefore, focuses on feedstock production. The Well-to-Tank (WTT) portion of this Life Cycle Analysis of the North American corn oil BD pathway includes all steps from corn farming to final finished 100 percent biodiesel (B100). The Tank-to-Wheels (TTW) portion includes actual combustion of the resulting fuel in a motor vehicle for motive power. Taken together, the WTT and the TTW analyses comprise a total Well-to-Wheel (WTW) analysis. A version of the Greenhouse gases, Regulated Emissions, and Energy use in Transportation (GREET)2 model developed by Argonne National Laboratory was used to calculate the energy use and greenhouse gas (GHG) emissions generated during the entire fuel life cycle, from corn farming to producing biodiesel to combusting biodiesel in an internal combustion engine. Staff modified the original GREET model to create a California-specific version known as the CA-GREET model.3 Changes were restricted mostly to adding California-specific input factors (emission factors, electrical energy generation mix, transportation distances, etc.); no substantial changes were made to the methodology inherent in the original GREET model on which this one is based. The results obtained from the California-modified GREET model (v1.8b, released December 2009) are reported in this document. Those results consist of the energy use and greenhouse gas (GHG) emissions from the production of Biodiesel using Corn oil extracted from the process streams at North American corn ethanol plants. This pathway assumes that the biodiesel produced is destined for use in heavy duty diesel
1 ARB (2009). Detailed California-Modified GREET Pathway for Conversion of Midwest Soybeans to Biodiesel (Fatty Acid Methyl Esters-FAME); version 3.0: http://www.arb.ca.gov/fuels/lcfs/121409lcfs_soybean.pdf 2 Argonne National Laboratory (2008). The Greenhouse Gases, Regulated Emissions, and Energy Use in Transportation (GREET) Model. http://greet.es.anl.gov/main 3 ARB (2009) Lifecycle Analysis (CA-GREET): http://www.arb.ca.gov/fuels/lcfs/lcfs.htm

PRELIMINARY DRAFT DISTRIBUTED FOR PUBLIC COMMENT
11/03/11 4
vehicles. Much of the calculation methodology and many of the basic inputs and assumptions used in the corn-oil-to-biodiesel analysis are discussed in the soy biodiesel technical documentation provided by Argonne National Laboratory.4 This document contains the ARB’s estimate of the carbon intensity of biodiesel fuel produced from corn oil extracted from distiller’s grains with solubles (DGS) at dry mill ethanol plants. Using information provided by GreenShift Corporation, ARB estimated the energy use and carbon intensity associated with the extraction of corn oil at dry mill ethanol plants, and the energy savings that would also occur during this extraction process. In this analysis, the ARB assumes that corn oil extraction equipment will be retrofitted to pre-existing corn ethanol plants. The GreenShift process allows corn oil to be extracted from the thin stillage after fermentation and distillation. ARB estimates the carbon intensity of this process to be 4.00 grams of CO2-equivalent emissions per mega joule of biodiesel produced (gCO2e/MJ). This value does not include any emissions resulting from the conversion of non-agricultural land to agricultural use. These land use change emissions are discussed below. The corn oil produced at the ethanol plant is sent to a biodiesel plant where it is transesterified to fatty acid methyl ester (FAME) biodiesel. Figure 1 illustrates the corn oil biodiesel production process.
4 Argonne National Laboratory (2008). Life-Cycle Assessment of Energy and Greenhouse Gas Effects of Soybean-Derived Biodiesel and Renewable Fuels: http://www.transportation.anl.gov/pdfs/AF/467.pdf

PRELIMINARY DRAFT DISTRIBUTED FOR PUBLIC COMMENT
11/03/11 5
Figure 1 . Corn Oil Biodiesel Production Process
The analysis that follows uses conventions and technical terms with specific meanings that are defined here:
• CA-GREET employs a recursive methodology to calculate energy consumption and emissions. To calculate WTT energy and emissions, the values being calculated are often utilized in the calculation. For example, crude oil is used as a process fuel to recover crude oil. The total crude oil recovery energy consumption includes the direct crude oil consumption and the energy associated with crude recovery (which is the value being calculated).
• Btu/MMBtu is the energy input necessary in BTU, or Btu to produce one
million BTU of a finished (or intermediate) product. This description is used consistently in GREET for all energy calculations
Corn Production
DDGS
Ethanol to
Fuel
Corn Oil Extraction Animal
Feed
Corn Ethanol Plant
Biodiesel Plant
Biodiesel Fuel

PRELIMINARY DRAFT DISTRIBUTED FOR PUBLIC COMMENT
11/03/11 6
• gCO2e/MJ provides the total greenhouse gas emissions on a CO2 equivalent basis per unit of energy (MJ) in a given fuel. Methane (CH4) and nitrous oxide (N2O) are converted to a CO2 equivalent basis using IPCC5 global warming potential values and included in the total.
• CA-GREET assumes that VOC and CO are converted to CO2 in the atmosphere and includes these pollutants in the total CO2 value using ratios of the appropriate molecular weights.
• The input values extracted from reference material may have been in units that differ from the units used in this document. For example, if a fertilizer value was in kilogram per hectare (kg/ha), ARB staff used the standard conversion factors to convert this value to grams per acre (g/ac).
• Process Efficiency for any step in GREET is defined as: Efficiency = energy
output/(energy output + energy consumed).
• Note that rounding of values has not been performed in several tables in this document. This is to allow stakeholders executing runs with the GREET model to compare actual output values from the CA-modified model with values in this document.
• As used in this document, the term “upstream” refers to the energy use and emissions associated with the inputs supplied to the fuel production process. In the case of most fuels, including corn oil biodiesel, the two upstream processes considered in the WTT analysis are the production of natural gas and the generation of electricity. In the case of natural gas, the energy used to extract, process, and transport the gas are quantified. In the case of electrical generation, the energy needed to produce and transport the fuels used to generate the electrical energy are considered. In both cases, the expenditure of this energy results in GHG emissions.
• The fuel production process can yield what are known as co-products. The biodiesel production process, for example, yields glycerin as a co-product. If that glycerin is sold, it displaces glycerin from other sources. The GHGs associated with the production of glycerin from those other sources could be greater than the GHGs associated with the biodiesel co-product. Glycerin from the production of biodiesel sometimes displaces glycerin produced from petrochemicals, for example. This indicates that biodiesel should be credited for the GHG reduction associated with this displacement. Because the
5 Solomon and et al. (2007). United Nations Intergovernmental Panel on Climate Change (IPCC): Contribution of Working Group I to the Fourth Assessment Report of the Intergovernmental Panel on Climate Change, 2007. In 2007, the IPCC values for GHG equivalence (gCO2e/MJ) are: CH4 = 25, N2O = 298, CO2 = 1. For others GHG, GREET calculates molecular weight of carbon to obtain the GHG equivalence (gCO2e/MJ): VOC = 0.85/0.27 = 3.12 and CO = 0.43/0.273 = 1.57. http://www.ipcc.ch/publications_and_data/ar4/wg1/en/contents.html

PRELIMINARY DRAFT DISTRIBUTED FOR PUBLIC COMMENT
11/03/11 7
amounts and types of displaced glycerin are difficult to measure, however, the emissions associated with the production of both the biodiesel and the glycerin are allocated over the products according the relative energy content of each. This results in an allocation of 4.9 percent of total emissions to glycerin, leaving 95.1 of total process emissions for the biodiesel. This 4.9 percent reduction comprises what is known as a co-product credit for biodiesel.
• Production and feedstock production emissions are also adjusted to reflect material losses incurred during the production process. These are accounted for through the use of a loss factor. In this analysis, a 1.000039 (gCO2e/MJ) loss factor is applied.
• In order to calculate a single carbon intensity value for all greenhouse gas
emissions occurring throughout the WTW lifecycles, the atmospheric heat-trapping potential of all greenhouse gases must be expressed in standardized additive units. Under the LCFS, all greenhouse gas species other than CO2 are converted to CO2-equivalent (CO2e) values. These conversions are accomplished by using the Intergovernmental Panel on Climate Change (IPCC) global warming potential factors. The IPCC Global Warming Potential (GWP) factors function as multipliers: CH4 emissions, for example, are multiplied by 25. The IPCC GWP factors are discussed on the IPCC web site (http://www.ipcc.ch/publications_and_data/ar4/wg1/en/ch2s2-10-2.html).
The production of corn ethanol and corn oil as a biodiesel feedstock at the same plant can complicate the separate estimation of carbon intensity values for these two products. The emissions associated with agricultural chemical production, corn farming operations, and corn transportation, for example, could be allocated in whole or in part to each product. A number of methods have been used accomplish allocations such as this. Emissions could be allocated on the basis of the total energy content of each product, for example. In this analysis, the ARB has decided to allocate all of the emissions associated with agricultural chemical production, corn farming operations, and corn transportation to the carbon intensity value of the ethanol produced at the ethanol plant, and none to the carbon intensity of the corn oil. The basis for this allocation lies in the nature of the corn oil extraction equipment that the ARB expects will be installed in corn ethanol plants. Currently, very few ethanol plants are equipped with corn oil extraction equipment. ARB expects that, as corn oil becomes an increasingly attractive option for biodiesel fuel production, corn oil extraction equipment will be added to pre-existing corn ethanol plants. However, ethanol will always be the primary product produced at these plants, and ethanol production will continue to be the primary reason for the construction of new corn ethanol plants. The retrofitting of corn oil extraction equipment to existing corn ethanol plants is an indication of corn oil’s status as a secondary product. That secondary status should be reflected in in the carbon intensity of the fuel made from this feedstock. Because corn oil extraction capability is added to plants built primarily to produce corn ethanol, all of the energy use and emissions normally attributed to ethanol production—including indirect land use
PRELIMINARY DRAFT DISTRIBUTED FOR PUBLIC COMMENT
11/03/11 8
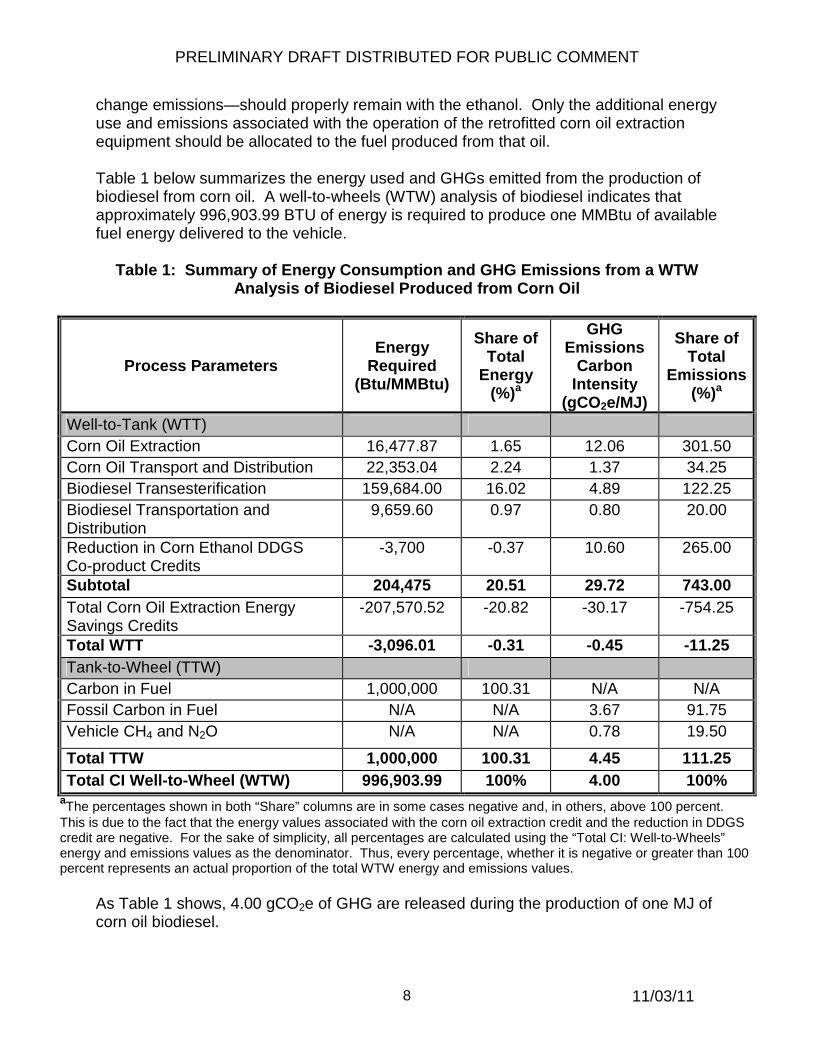
change emissions—should properly remain with the ethanol. Only the additional energy use and emissions associated with the operation of the retrofitted corn oil extraction equipment should be allocated to the fuel produced from that oil. Table 1 below summarizes the energy used and GHGs emitted from the production of biodiesel from corn oil. A well-to-wheels (WTW) analysis of biodiesel indicates that approximately 996,903.99 BTU of energy is required to produce one MMBtu of available fuel energy delivered to the vehicle.
Table 1: Summary of Energy Consumption and GHG Emi ssions from a WTW Analysis of Biodiesel Produced from Corn Oil
Process Parameters Energy
Required (Btu/MMBtu)
Share of Total
Energy (%)a
GHG Emissions
Carbon Intensity
(gCO2e/MJ)
Share of Total
Emissions (%)a
Well-to-Tank (WTT) Corn Oil Extraction 16,477.87 1.65 12.06 301.50 Corn Oil Transport and Distribution 22,353.04 2.24 1.37 34.25 Biodiesel Transesterification 159,684.00 16.02 4.89 122.25 Biodiesel Transportation and Distribution
9,659.60 0.97 0.80 20.00
Reduction in Corn Ethanol DDGS Co-product Credits
-3,700 -0.37 10.60 265.00
Subtotal 204,475 20.51 29.72 743.00 Total Corn Oil Extraction Energy Savings Credits
-207,570.52 -20.82 -30.17 -754.25
Total WTT -3,096.01 -0.31 -0.45 -11.25 Tank-to-Wheel (TTW) Carbon in Fuel 1,000,000 100.31 N/A N/A Fossil Carbon in Fuel N/A N/A 3.67 91.75 Vehicle CH4 and N2O N/A N/A 0.78 19.50
Total TTW 1,000,000 100.31 4.45 111.25 Total CI Well -to-Wheel (WTW) 996,903.99 100% 4.00 100%
aThe percentages shown in both “Share” columns are in some cases negative and, in others, above 100 percent. This is due to the fact that the energy values associated with the corn oil extraction credit and the reduction in DDGS credit are negative. For the sake of simplicity, all percentages are calculated using the “Total CI: Well-to-Wheels” energy and emissions values as the denominator. Thus, every percentage, whether it is negative or greater than 100 percent represents an actual proportion of the total WTW energy and emissions values.
As Table 1 shows, 4.00 gCO2e of GHG are released during the production of one MJ of corn oil biodiesel.
PRELIMINARY DRAFT DISTRIBUTED FOR PUBLIC COMMENT
11/03/11 9
In this analysis, the carbon intensity of corn oil biodiesel is calculated by considering only the incremental emissions that occur from the operation of corn oil extraction equipment and the production of biodiesel from the resulting corn oil. All land use change emissions, therefore, remain with the production of corn ethanol. Any corn oil biodiesel that was produced from a feedstock that resulted in a net energy savings at a corn ethanol plant equal to or greater than the savings used in this analysis may use the 4.00 gCO2e/MJ carbon intensity associated with this LCFS pathway. 2. Description of Corn Oil Extraction Process Fuel-grade corn oil can be produced at corn ethanol plants by extracting the oil from the stillage portion of the DGS produced at the plants. Extraction follows fermentation and distillation, and precedes DGS drying. Corn Oil extraction systems can be added to existing corn ethanol plants to increase plant energy efficiency and to increase the total volume of fuel that is produced per unit of corn processed. The installation of GreenShift-style corn oil extraction equipment in an existing corn ethanol plant will allow a diesel fuel feedstock to be produced without affecting ethanol production volumes. Although GreenShift’s is not the only available extraction process, more information is publicly available on the GreenShift process than is available on competing systems. For this reason, ARB’s analysis in this document is based on the GreenShift process and GreenShift’s estimates of energy consumption and energy savings for corn oil extraction. The system commercialized by GreenShift can be retrofitted into existing dry mill ethanol plants. GreenShift’s systems are of two types. The first system, referred to as Corn Oil Extraction 1, extracts corn oil from the thin stillage after it is removed from the whole stillage through centrifuging. In this system, the partially concentrated thin stillage is heated and the corn oil is extracted by separation in a second centrifuge. Steam is used in heat exchangers to raise the temperature of the thin stillage for extraction. After extraction of the corn oil, thermal energy from the stillage is recovered in heat exchangers to heat the incoming stillage. Appendix C contains a more detailed discussion of the GreenShift process. The thin stillage generally contains about 30 percent of the oil available in the corn. Corn Oil Extraction 1 can recover most of this corn oil, depending on site-specific conditions. A typical ethanol plant uses corn that contains about four percent by weight corn oil, which, in the absence of corn oil extraction, passes through the process, ending up in the DGS. For a 50-million-gallon-per-year ethanol plant, the incoming corn oil is about 5-million-gallons-per-year, and Corn Oil Extraction 1 can recover about 1.5-million-gallons-per-year. GreenShift’s second corn oil extraction system, referred to as Corn Oil Extraction 2, is an extraction extension that frees another 30 percent of the corn oil that is bound in the whole stillage prior to the separation of wet grain and thin stillage in the plant’s centrifuge. As more than 40 percent of the total oil within the corn is trapped within the wet cake, GreenShift developed a washing technique to free this oil from the wet cake so that it is recoverable in the Corn Oil Extraction 1 system. The additional oil made

PRELIMINARY DRAFT DISTRIBUTED FOR PUBLIC COMMENT
11/03/11 10
available to the Corn Oil Extraction 1 system generally doubles the production of corn oil. Corn Oil Extraction 1 and 2 systems together can extract 60 to 70 percent of the corn oil passing through the plant, which translates to about six to seven gallons of corn oil per 100 gallons of ethanol produced. The results presented in this analysis are based on the operation of both corn oil extraction systems (1 and 2). 3. Corn Oil Extraction Energy Use and GHG Emissions Electric power and steam are supplied to the corn oil extraction equipment from the ethanol plant’s existing power systems. Even though the corn oil extraction equipment consumes energy, plants that produce dry DGS will realized a net energy savings when the extraction equipment is operating. Installation of this equipment, therefore, does not require a plant to supply additional process energy. According to GreenShift, operating a Corn Oil Extraction 1 system requires about 0.01 kWhr per gallon of ethanol produced. This electrical energy is used to power motors on the centrifuge and the pumps. This electricity use is equivalent to about 34 Btu per gallon of ethanol produced. A Corn Oil Extraction 2 system will use 0.09 kWhr per gallon of ethanol produced, or about 306 Btu per gallon of ethanol produced. The greater electricity use for Corn Oil Extraction 2 system arises from the operation of much larger centrifuges. Thus, the total additional electricity demands for operating Corn Oil Extraction 1 and 2 systems together would be about 340 Btu per gallon of ethanol produced. Table 2 summarizes the total energy use for corn oil extraction. The upstream and direct energies equate to the energy used for each type of fuel in Table 2. Detailed calculations are provided in Appendix A.
PRELIMINARY DRAFT DISTRIBUTED FOR PUBLIC COMMENT
11/03/11 11
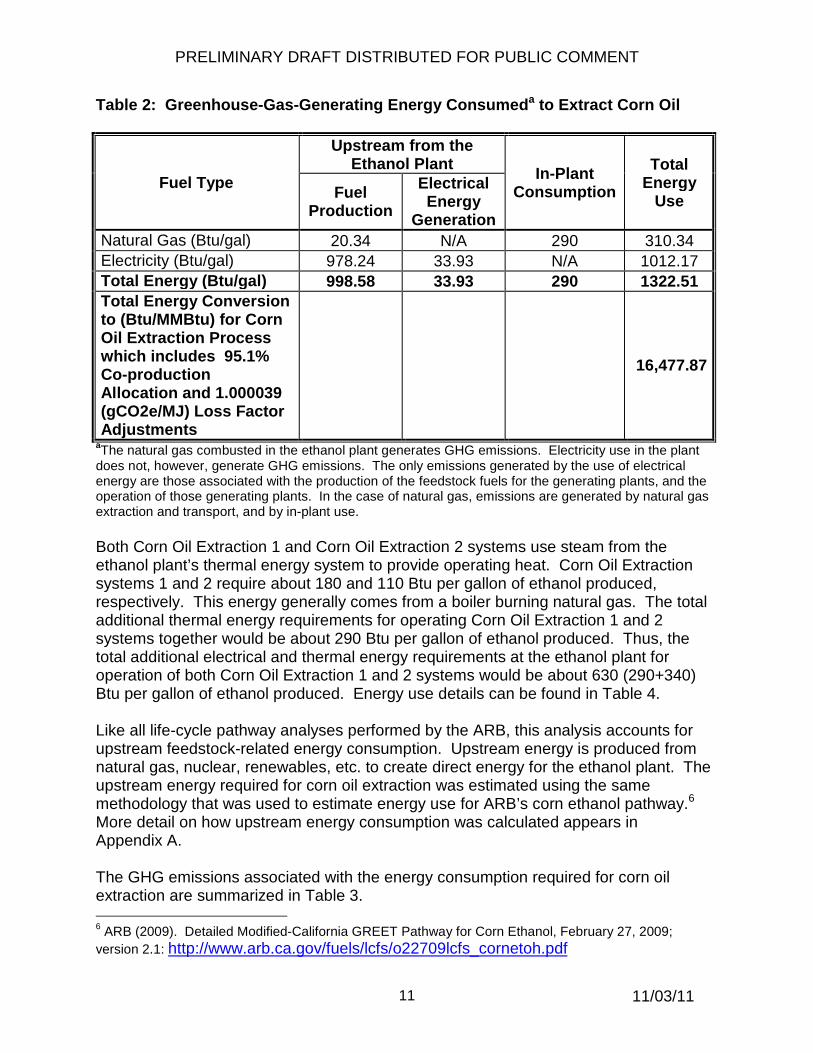
Table 2: Greenhouse-Gas-Generating Energy Consumed a to Extract Corn Oil
Fuel Type
Upstream from the Ethanol Plant
In-Plant Consumption
Total Energy
Use Fuel Production
Electrical Energy
Generation Natural Gas (Btu/gal) 20.34 N/A 290 310.34 Electricity (Btu/gal) 978.24 33.93 N/A 1012.17 Total Energy (Btu/gal) 998.58 33.93 290 1322.51 Total Energy Conversion to (Btu/MMBtu) for Corn Oil Extraction Process which includes 95.1% Co-production Allocation and 1.000039 (gCO2e/MJ) Loss Factor Adjustments
16,477.87
aThe natural gas combusted in the ethanol plant generates GHG emissions. Electricity use in the plant does not, however, generate GHG emissions. The only emissions generated by the use of electrical energy are those associated with the production of the feedstock fuels for the generating plants, and the operation of those generating plants. In the case of natural gas, emissions are generated by natural gas extraction and transport, and by in-plant use. Both Corn Oil Extraction 1 and Corn Oil Extraction 2 systems use steam from the ethanol plant’s thermal energy system to provide operating heat. Corn Oil Extraction systems 1 and 2 require about 180 and 110 Btu per gallon of ethanol produced, respectively. This energy generally comes from a boiler burning natural gas. The total additional thermal energy requirements for operating Corn Oil Extraction 1 and 2 systems together would be about 290 Btu per gallon of ethanol produced. Thus, the total additional electrical and thermal energy requirements at the ethanol plant for operation of both Corn Oil Extraction 1 and 2 systems would be about 630 (290+340) Btu per gallon of ethanol produced. Energy use details can be found in Table 4. Like all life-cycle pathway analyses performed by the ARB, this analysis accounts for upstream feedstock-related energy consumption. Upstream energy is produced from natural gas, nuclear, renewables, etc. to create direct energy for the ethanol plant. The upstream energy required for corn oil extraction was estimated using the same methodology that was used to estimate energy use for ARB’s corn ethanol pathway.6 More detail on how upstream energy consumption was calculated appears in Appendix A. The GHG emissions associated with the energy consumption required for corn oil extraction are summarized in Table 3. 6 ARB (2009). Detailed Modified-California GREET Pathway for Corn Ethanol, February 27, 2009; version 2.1: http://www.arb.ca.gov/fuels/lcfs/o22709lcfs_cornetoh.pdf
PRELIMINARY DRAFT DISTRIBUTED FOR PUBLIC COMMENT
11/03/11 12
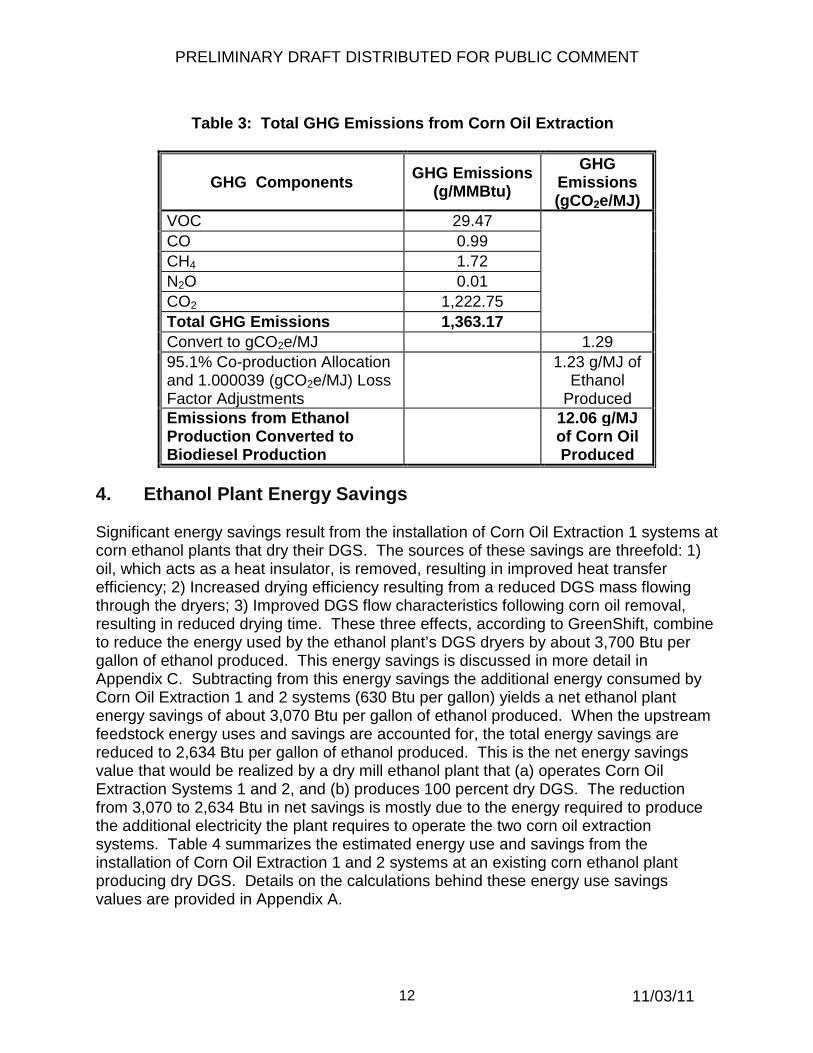
Table 3: Total GHG Emissions from Corn Oil Extract ion
GHG Components GHG Emissions (g/MMBtu)
GHG Emissions (gCO2e/MJ)
VOC 29.47 CO 0.99 CH4 1.72 N2O 0.01 CO2 1,222.75 Total GHG Emissions 1,363.17 Convert to gCO2e/MJ 1.29 95.1% Co-production Allocation and 1.000039 (gCO2e/MJ) Loss Factor Adjustments
1.23 g/MJ of Ethanol
Produced Emissions from Ethanol Production Converted to Biodiesel Production
12.06 g/MJ of Corn Oil Produced
4. Ethanol Plant Energy Savings Significant energy savings result from the installation of Corn Oil Extraction 1 systems at corn ethanol plants that dry their DGS. The sources of these savings are threefold: 1) oil, which acts as a heat insulator, is removed, resulting in improved heat transfer efficiency; 2) Increased drying efficiency resulting from a reduced DGS mass flowing through the dryers; 3) Improved DGS flow characteristics following corn oil removal, resulting in reduced drying time. These three effects, according to GreenShift, combine to reduce the energy used by the ethanol plant’s DGS dryers by about 3,700 Btu per gallon of ethanol produced. This energy savings is discussed in more detail in Appendix C. Subtracting from this energy savings the additional energy consumed by Corn Oil Extraction 1 and 2 systems (630 Btu per gallon) yields a net ethanol plant energy savings of about 3,070 Btu per gallon of ethanol produced. When the upstream feedstock energy uses and savings are accounted for, the total energy savings are reduced to 2,634 Btu per gallon of ethanol produced. This is the net energy savings value that would be realized by a dry mill ethanol plant that (a) operates Corn Oil Extraction Systems 1 and 2, and (b) produces 100 percent dry DGS. The reduction from 3,070 to 2,634 Btu in net savings is mostly due to the energy required to produce the additional electricity the plant requires to operate the two corn oil extraction systems. Table 4 summarizes the estimated energy use and savings from the installation of Corn Oil Extraction 1 and 2 systems at an existing corn ethanol plant producing dry DGS. Details on the calculations behind these energy use savings values are provided in Appendix A.
PRELIMINARY DRAFT DISTRIBUTED FOR PUBLIC COMMENT
11/03/11 13
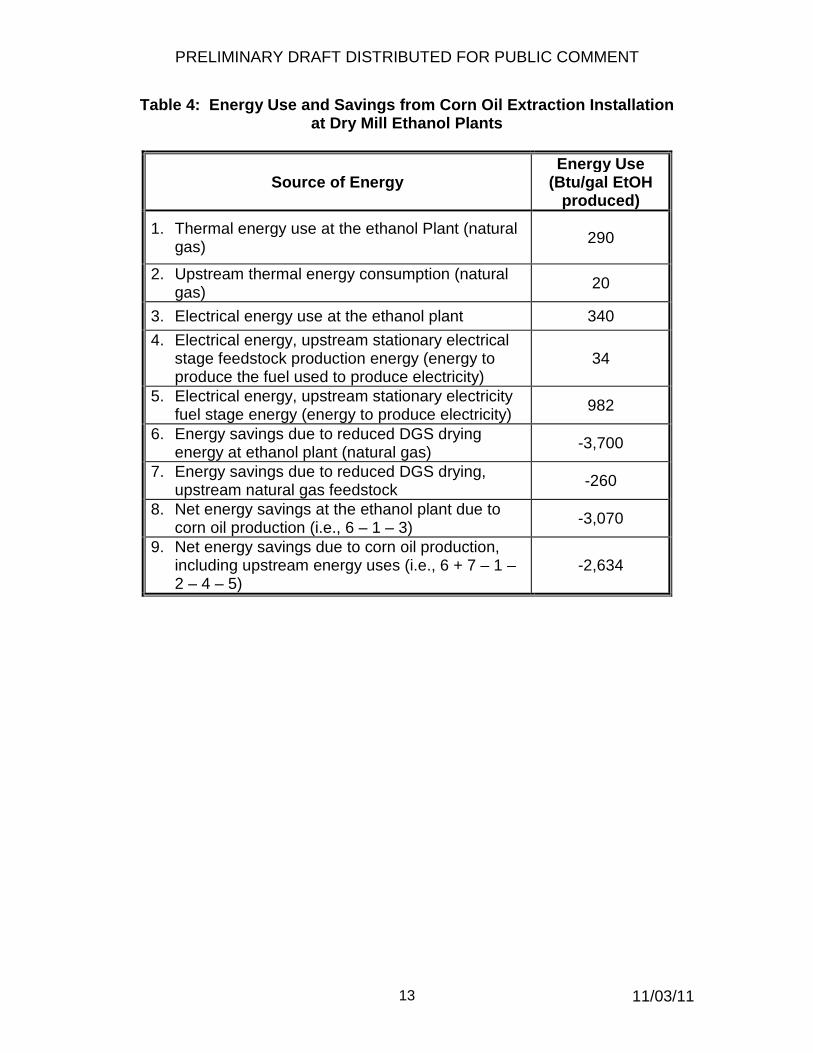
Table 4: Energy Use and Savings from Corn Oil Extr action Installation at Dry Mill Ethanol Plants
Source of Energy Energy Use
(Btu/gal EtOH produced)
1. Thermal energy use at the ethanol Plant (natural gas) 290
2. Upstream thermal energy consumption (natural gas)
20
3. Electrical energy use at the ethanol plant 340
4. Electrical energy, upstream stationary electrical stage feedstock production energy (energy to produce the fuel used to produce electricity)
34
5. Electrical energy, upstream stationary electricity fuel stage energy (energy to produce electricity) 982
6. Energy savings due to reduced DGS drying energy at ethanol plant (natural gas)
-3,700
7. Energy savings due to reduced DGS drying, upstream natural gas feedstock
-260
8. Net energy savings at the ethanol plant due to corn oil production (i.e., 6 – 1 – 3)
-3,070
9. Net energy savings due to corn oil production, including upstream energy uses (i.e., 6 + 7 – 1 – 2 – 4 – 5)
-2,634
PRELIMINARY DRAFT DISTRIBUTED FOR PUBLIC COMMENT
11/03/11 14
5. Carbon Intensity of Corn Oil Extraction The calculated carbon intensities for the extraction of corn oil using Corn Oil Extraction 1 and 2 systems are shown in Table 5. The greenhouse gas emission factors used to calculate these carbon intensities are the same as those used in the ARB’s pathway for the production of ethanol from corn.7 As shown in Table 4, the addition of Corn Oil 1 and Corn Oil 2 systems at a corn ethanol plant reduces the total energy consumption at the ethanol plant by about 3,070 Btu per gallon of ethanol produced, which translates to about an 8.5 percent reduction in the energy used at the ethanol plant (assuming the CA-GREET ethanol plant energy value of 36,000 Btu per gallon of ethanol produced). The net reduction in total energy consumed (at the ethanol plant and upstream) results in reduced greenhouse gas emissions and a corresponding carbon intensity credit of about 1.838 gCO2 per MJ of ethanol produced. Assuming that about 6.5 gallons of corn oil are produced per 100 gallons of ethanol, and taking into account the energy differences between corn oil and ethanol, this credit is equivalent to about 18.06 gCO2 per MJ of corn oil produced. The details behind this calculation are shown in Appendix B.
7 ARB (2009). Detailed Modified-California GREET Pathway for Corn Ethanol, February 27, 2009; version 2.1: http://www.arb.ca.gov/fuels/lcfs/o22709lcfs_cornetoh.pdf

PRELIMINARY DRAFT DISTRIBUTED FOR PUBLIC COMMENT
11/03/11 15
Table 5 : Greenhouse Gas Emission Factors and Net Carbon Inte nsities for Corn Oil Extraction
Source of Energy Use
GHG Emissions Factor
(gCO2e/MMBtu) 1
Carbon Intensity
(gCO2e/MJ of EtOH)
Carbon Intensity
(gCO2e/MJ of Biodiesel)
1. Thermal Energy Use at the EtOH Plant, Natural Gas, (CO2 emissions)
58,188 0.200 1.97
2. Thermal Energy, Upstream Feedstock, Natural Gas, (CO2 emissions)
5,245 0.018 0.18
3. Electrical Energy, Upstream Stationary Electricity Feedstock Stage Energy, (Energy to Produce the Fuel Used to Produce Electricity), (CO2 emissions)
7,794 0.031 0.30
4. Electrical Energy, Upstream Stationary Electricity Fuel Stage Energy (Energy to Produce Electricity), (CO2 emissions)
233,154 0.936 9.19
5. Electrical Energy and Thermal Energy, Direct and Upstream Use of Natural Gas and Electricity (CH4, VOC, CO, N2O Emissions)
Please See Table in Appendix B, Calculation 5.
0.050 0.49
6. Total Carbon Intensity for Corn Oil Extraction (1+2+3+4+5)
1.235 12.13
7. Carbon Intensity of Energy Savings Due to Reduced DGS Drying Energy at Ethanol Plant, Natural Gas, (CO2 emissions)
58,188 -2.674 -26.27
8. Carbon Intensity of Energy Savings Due to Reduced DGS Drying at the Ethanol Plant, Upstream Natural Gas Feedstock, (CO2 emissions)
5,245 -0.241 -2.37
9. Carbon Intensity of Energy Savings Due to Reduced DGS Drying Energy at Ethanol Plant, Direct and Upstream Energy Use (CH4, VOC, CO, N2O emissions)
Please See Table in Appendix B, Calculation 5.
-0.158 -1.55
10. Carbon Intensity of Total Energy Savings Due to Reduced DGS Drying (7+8+9)
-3.073 -30.19
11. Net Carbon Intensity for Corn Oil Extraction (Including Energy Savings) (6+10)
-1.838 -18.06
1The units of the natural gas emission factor are gCO2e upstream emissions per Btu downstream energy use. Therefore, the total greenhouse gas emissions are calculated by taking the product of the emission factor and the downstream energy use of 290 Btu per gal. The units of the electricity emission factor are gCO2e upstream emissions per Btu downstream electricity use. Therefore, the CO2 emissions for electricity are calculated by taking the product of this emission factor and the downstream energy use of 340 Btu per gallon.

PRELIMINARY DRAFT DISTRIBUTED FOR PUBLIC COMMENT
11/03/11 16
6. Effect of Corn Oil Extraction on DGS Production As shown in Section 2, the use of both Corn Oil Extraction 1 and 2 systems would remove about six to seven gallons of corn oil per 100 gallons of corn ethanol produced. This equates to about 0.50 pounds of corn oil per gallon of ethanol produced. The removal of the corn oil from the dry DGS (DDGS) reduces the DDGS co-product credit for corn ethanol. Because DDGS yields without the use of corn oil extraction are typically 5.34 pounds per gallon of ethanol produced, a reduction of 0.50 pounds per gallon of ethanol represents about a 9.4 percent reduction in the DDGS yield. This 9.4 percent reduction in DDGS yield would translate into a 9.4 percent reduction in the DDGS co-product credit. Because the DDGS co-product credit for corn ethanol without corn oil extraction is about 11.5 gCO2e per MJ of ethanol produced, a 9.4 percent reduction in the credit due to corn oil extraction would translate into a reduction in the co-product credit of about 1.08 gCO2e per MJ of ethanol produced. This reduction in the credit can be considered as an increase in the carbon intensity of corn oil-based biodiesel. Converting the value of the credit reduction of 1.08 gCO2e per MJ of ethanol to a gCO2e per MJ biodiesel basis gives a reduction in the credit of 10.60 gCO2 per MJ of biodiesel. The details of this calculation are shown in Appendix B. The reduction in the co-product credit is included as an emission component in the carbon intensity of the biodiesel. Removal of corn oil affects the nutritional profile of the DGS. The removal of the corn oil reduces the fat and energy content, and increases the protein content of the DGS. For some livestock species, higher fat and energy content is more important, while for others higher protein content is needed. Thus, for some species, the loss in the DGS volume and the reduction in the corn ethanol co-product credit might be offset by a higher protein content of the DGS. The ARB has not attempted to estimate the net effects of these nutritional changes on the extent to which DGS displaces other feeds in the marketplace, nor on the carbon intensity associated with this displacement change. 7. Corn Oil Transport and Distribution Because feedstock transportation is within the system boundary of this analysis, the CA-GREET model calculates the energy consumed and the GHG emissions generated during the transport of the corn oil extracted from the ethanol process stream. Corn oil from Midwest dry mill, dry DGS plants is assumed to be transported 1400 miles by rail to California rail yards, then 50 miles by heavy duty diesel truck (HDDT) from the destination rail yards to biodiesel production facilities. The finished biodiesel travels 90 miles by HDDT to refueling stations for dispensing. The energy consumption associated with corn oil transport is shown in Table 6.
PRELIMINARY DRAFT DISTRIBUTED FOR PUBLIC COMMENT
11/03/11 17
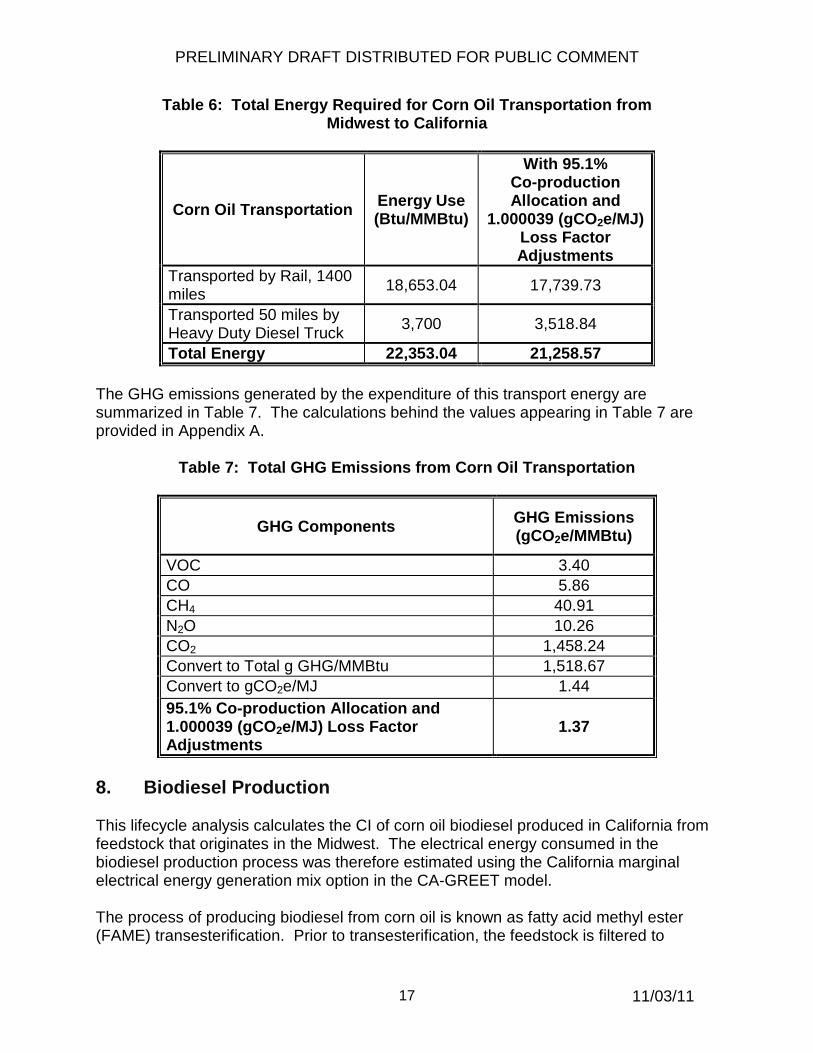
Table 6: Total Energy Required for Corn Oil Transp ortation from Midwest to California
Corn Oil Transportation Energy Use (Btu/MMBtu)
With 95.1% Co-production Allocation and
1.000039 (gCO2e/MJ) Loss Factor Adjustments
Transported by Rail, 1400 miles 18,653.04 17,739.73
Transported 50 miles by Heavy Duty Diesel Truck
3,700 3,518.84
Total Energy 22,353.04 21,258.57 The GHG emissions generated by the expenditure of this transport energy are summarized in Table 7. The calculations behind the values appearing in Table 7 are provided in Appendix A.
Table 7: Total GHG Emissions from Corn Oil Transpo rtation
GHG Components
GHG Emissions (gCO2e/MMBtu)
VOC 3.40 CO 5.86 CH4 40.91 N2O 10.26 CO2 1,458.24 Convert to Total g GHG/MMBtu 1,518.67 Convert to gCO2e/MJ 1.44 95.1% Co-production Allocation and 1.000039 (gCO2e/MJ) Loss Factor Adjustments
1.37
8. Biodiesel Production This lifecycle analysis calculates the CI of corn oil biodiesel produced in California from feedstock that originates in the Midwest. The electrical energy consumed in the biodiesel production process was therefore estimated using the California marginal electrical energy generation mix option in the CA-GREET model. The process of producing biodiesel from corn oil is known as fatty acid methyl ester (FAME) transesterification. Prior to transesterification, the feedstock is filtered to
PRELIMINARY DRAFT DISTRIBUTED FOR PUBLIC COMMENT
11/03/11 18
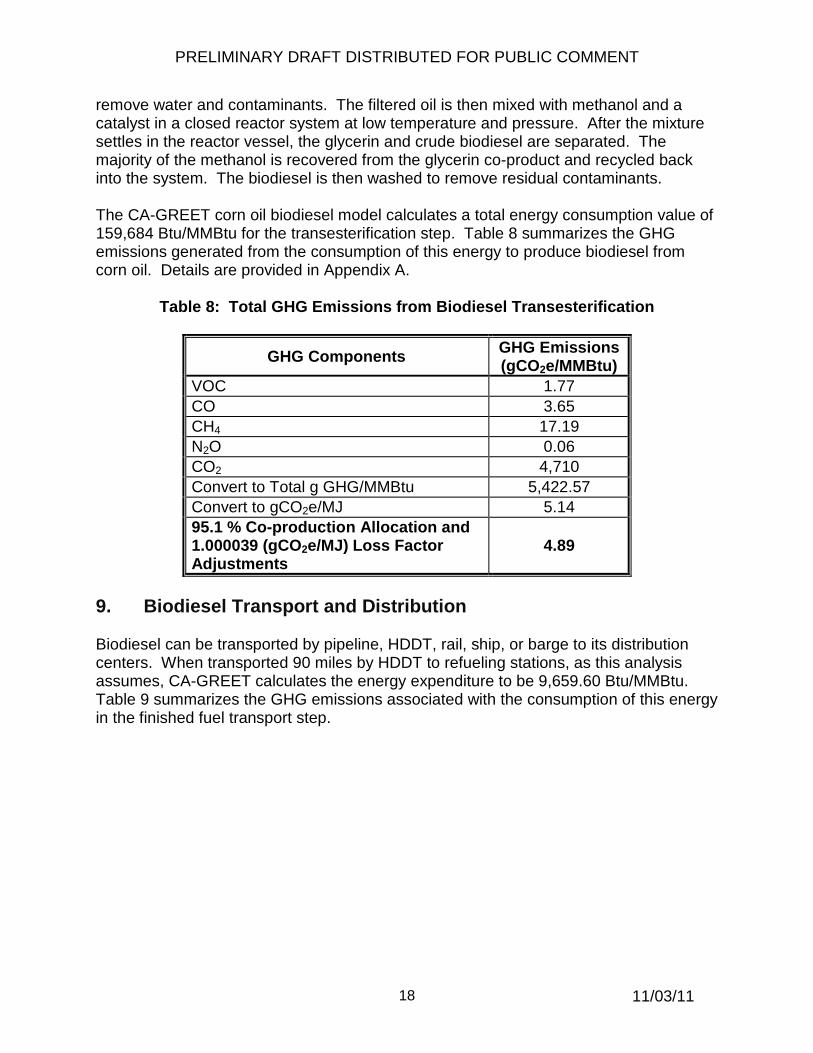
remove water and contaminants. The filtered oil is then mixed with methanol and a catalyst in a closed reactor system at low temperature and pressure. After the mixture settles in the reactor vessel, the glycerin and crude biodiesel are separated. The majority of the methanol is recovered from the glycerin co-product and recycled back into the system. The biodiesel is then washed to remove residual contaminants. The CA-GREET corn oil biodiesel model calculates a total energy consumption value of 159,684 Btu/MMBtu for the transesterification step. Table 8 summarizes the GHG emissions generated from the consumption of this energy to produce biodiesel from corn oil. Details are provided in Appendix A.
Table 8: Total GHG Emissions from Biodiesel Transe sterification
GHG Components GHG Emissions (gCO2e/MMBtu)
VOC 1.77 CO 3.65 CH4 17.19 N2O 0.06 CO2 4,710 Convert to Total g GHG/MMBtu 5,422.57 Convert to gCO2e/MJ 5.14 95.1 % Co-production A llocation and 1.000039 (gCO2e/MJ) Loss Factor Adjustments
4.89
9. Biodiesel Transport and Distribution Biodiesel can be transported by pipeline, HDDT, rail, ship, or barge to its distribution centers. When transported 90 miles by HDDT to refueling stations, as this analysis assumes, CA-GREET calculates the energy expenditure to be 9,659.60 Btu/MMBtu. Table 9 summarizes the GHG emissions associated with the consumption of this energy in the finished fuel transport step.

PRELIMINARY DRAFT DISTRIBUTED FOR PUBLIC COMMENT
11/03/11 19
Table 9: Total GHG Emissions from Biodiesel Transp ort and Distribution
GHG Components GHG Emissions (gCO2e/MMBtu)
VOC 4.37 CO 2.39 CH4 22.19 N2O 5.98 CO2 811.74 Convert to Total gGHG/MMBtu
846.67
Convert to g CO2e/MJ 0.80
10. Complete Pathway Carbon Intensities In addition to the carbon intensities associated with the production and transportation steps described above, the GHGs emitted when biodiesel is combusted in vehicles must be estimated. Vehicle combustion emissions under the corn oil BD pathway are identical to those described in ARB’s Soybean-to-Biodiesel Pathway document. 8 Table 10 shows the individual components and the total carbon intensity for the entire corn oil-to-biodiesel pathway, including vehicle emissions. The calculations behind these carbon intensity values are shown in Appendix B.
8 ARB (2009). Detailed California-Modified GREET Pathway for Conversion of Midwest Soybeans to Biodiesel (Fatty Acid Methyl Esters-FAME); version 3.0: http://www.arb.ca.gov/fuels/lcfs/121409lcfs_soybean.pdf

PRELIMINARY DRAFT DISTRIBUTED FOR PUBLIC COMMENT
11/03/11 20
Table 10: Corn Oil to Biodiesel Pathway Carbon Int ensity
Component Carbon Intensity
(gCO2e/MJ Biodiesel) 1
Corn Oil Extraction 12.06
Corn Oil Transport 1.37
Biodiesel Transesterification 4.89
Biodiesel Transportation and Distribution 0.80
Fossil Carbon in Fuel 3.67
Vehicle CH4 and N2O 0.78
Reduction in Corn Ethanol DDGS Co-product Credit 10.60
Total CI for Corn Oil Biodiesel (without credits) 34.17
Total Corn Oil Extraction Energy Savings Credit -30.17
Total CI for Corn Oil Biodiesel (with credits) 4.00
1A discussion of all values in this table except “Corn Oil Extraction,” “Reduction in Corn Ethanol DDGS Co-product Credit,” and the totals can be found in Air Resources Board’s Detailed California-Modified GREET Pathway for Conversion of Midwest Soybeans to Biodiesel (Fatty Acid Methyl Esters-FAME).

PRELIMINARY DRAFT DISTRIBUTED FOR PUBLIC COMMENT
11/03/11 21
Appendix A
Energy Use Estimates This appendix shows how the CA-GREET model calculated the energy use estimates on which pathway GHG emissions and final carbon intensities are based. Please see ARB’s corn ethanol pathway document for additional information on energy use calculations.9 1. Corn Oil Extraction, Upstream Well-to-Tank Natural Gas Feedstock Use Upstream natural gas energy use is 70,154 Btu/mmBtu of natural gas produced. For 290 Btu/gal ethanol of natural gas used at the ethanol plant, the upstream natural gas use is: �70,154 ������1,000,000 �����× �290 �����ℎ����� = �20.34 �����ℎ����� 2. Corn Oil Extraction, Electrical Energy, Upstream Stationary Electricity
Feedstock Stage Energy Use (Energy to Produce the Fuel Used to Produce Electricity)
The stationary electricity feedstock energy is 99,790 Btu/mmBtu. For a total electrical energy use at the ethanol plant of 340 Btu per gallon of ethanol produced, the upstream stationary electricity feedstock stage energy is:
�99,790 ������1,000,000 �����× �340 �����ℎ����� = �33.93 �����ℎ����� 3. Corn Oil Extraction, Electrical Energy, Upstream Stationary Electricity Fuel
Stage Energy (Energy to Produce Electricity) The stationary electricity fuel stage energy is 2,877,173 Btu/mmBtu. For a total electrical energy use at the ethanol plant of 340 Btu per gallon of ethanol produced, the upstream stationary electricity fuel stage energy is:
�2,877,173 ������1,000,000 �����× �340 �����ℎ����� = �978.24 �����ℎ�����
9 Detailed Modified-California GREET Pathway for Corn Ethanol, February 27, 2009; version 2.1: http://www.arb.ca.gov/fuels/lcfs/022709lcfs_cornetoh.pdf. Please see page 42 for information on the calculation of energy usage at corn ethanol plants.
PRELIMINARY DRAFT DISTRIBUTED FOR PUBLIC COMMENT
11/03/11 22
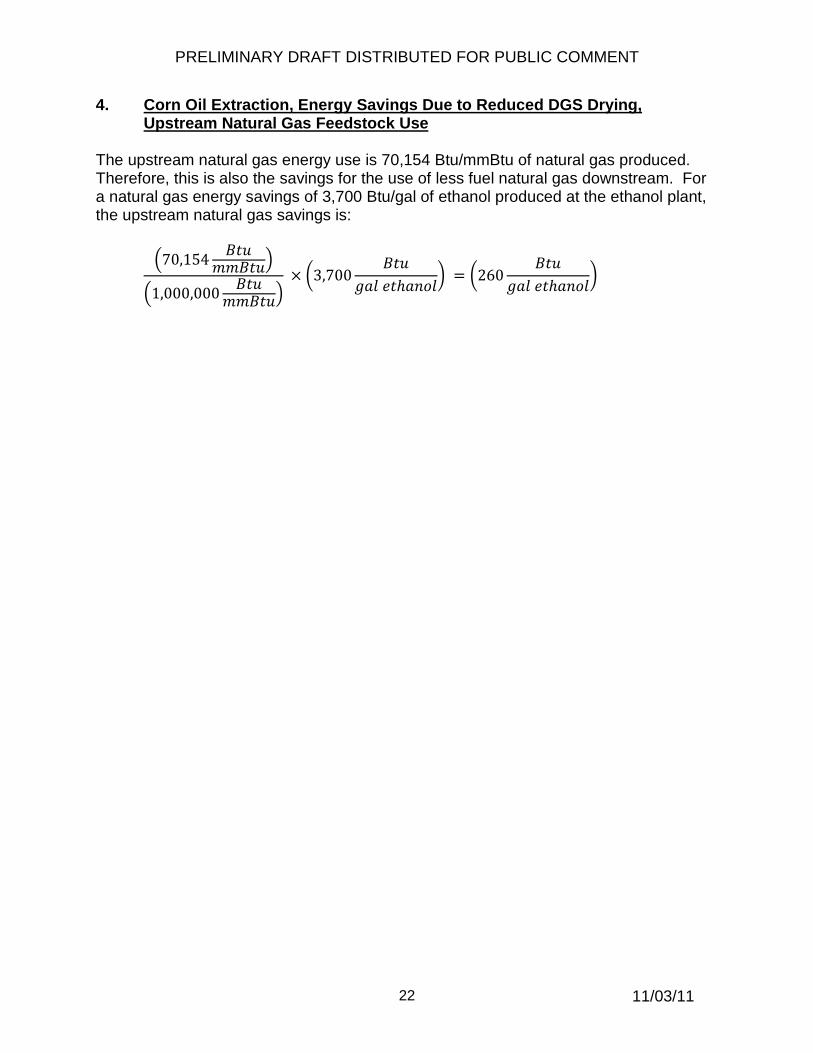
4. Corn Oil Extraction, Energy Savings Due to Reduced DGS Drying, Upstream Natural Gas Feedstock Use
The upstream natural gas energy use is 70,154 Btu/mmBtu of natural gas produced. Therefore, this is also the savings for the use of less fuel natural gas downstream. For a natural gas energy savings of 3,700 Btu/gal of ethanol produced at the ethanol plant, the upstream natural gas savings is:
�70,154 ������1,000,000 �����× �3,700 �����ℎ����� = �260 �����ℎ�����

PRELIMINARY DRAFT DISTRIBUTED FOR PUBLIC COMMENT
11/03/11 23
Appendix B Emissions Factors and Carbon Intensity Estimates
This appendix shows how the CA-GREET model calculated carbon intensities, for the corn oil biodiesel pathway, and also provides the GHG emission factors on which those carbon intensities are based. Please see ARB’s corn ethanol pathway document for additional information on emission factors and carbon intensity calculation.10 1. Corn Oil Extraction Carbon Intensity, Direct Emissions, Thermal Energy,
Natural Gas (CO2 emissions) The emission factor of 58,188 gCO2/mmBtu represents direct emissions per Btu downstream energy use. Therefore, the total direct greenhouse gas emission carbon intensity from natural gas feedstock use is calculated by taking the product of the emission factor and the downstream energy use of 290 Btu/gal ethanol).
��290 �����ℎ����� × �58,188 � !2�����76,330����� "�1,055 #$���� = 0.210 � !2#$�ℎ����
An adjustment to this carbon intensity must be made to account for the glycerine co-product credit. The adjustment is made by multiplying the carbon intensity by 0.951, as was done in the ARB’s soy bean-to-biodiesel pathway analysis.11 Doing this multiplication gives a carbon intensity of 0.200 gCO2/MJ ethanol. 2. Corn Oil Extraction Carbon Intensity, Upstream Well-to-Tank Natural Gas
Feedstock Energy Use (CO2 emissions)
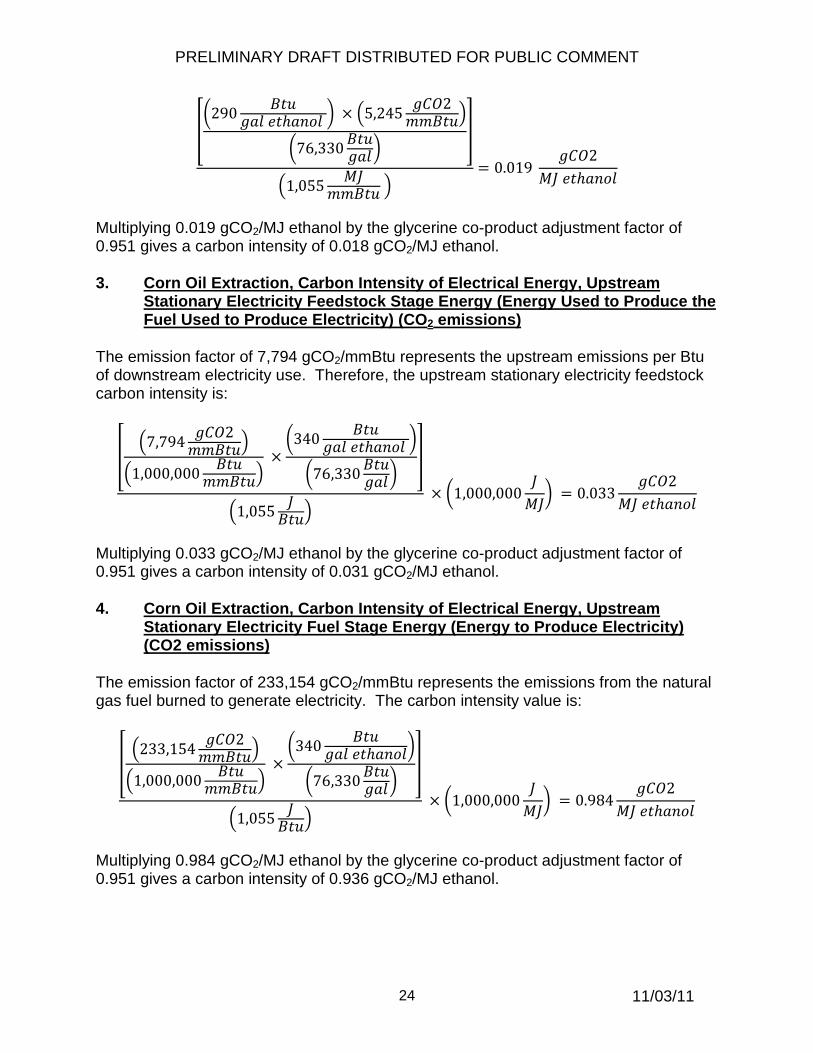
The emission factor of 5,245 gCO2/mmBtu represents upstream emissions per Btu of downstream energy use. Therefore, the total upstream emissions greenhouse gas carbon intensity from natural gas feedstock use is calculated by taking the product of the emission factor and the downstream energy use of 290 Btu/gal ethanol).
10 Detailed Modified-California GREET Pathway for Corn Ethanol, February 27, 2009; version 2.1: http://www.arb.ca.gov/fuels/lcfs/022709lcfs_cornetoh.pdf. Please see page 44 for information on emission factors and the calculation of carbon intensities corn ethanol plants. 11 Detailed California-Modified GREET Pathway for Conversion of Midwest Soybeans to Biodiesel (Fatty Acid Methyl Esters-FAME, December 14, 2009; version 3.0: http://www.arb.ca.gov/fuels/lcfs/121409lcfs_soybd.pdf
PRELIMINARY DRAFT DISTRIBUTED FOR PUBLIC COMMENT
11/03/11 24
��290 �����ℎ����� × �5,245 � !2�����76,330����� "�1,055 #$���� = 0.019 � !2#$�ℎ����
Multiplying 0.019 gCO2/MJ ethanol by the glycerine co-product adjustment factor of 0.951 gives a carbon intensity of 0.018 gCO2/MJ ethanol.
3. Corn Oil Extraction, Carbon Intensity of Electrical Energy, Upstream Stationary Electricity Feedstock Stage Energy (Energy Used to Produce the Fuel Used to Produce Electricity) (CO2 emissions)
The emission factor of 7,794 gCO2/mmBtu represents the upstream emissions per Btu of downstream electricity use. Therefore, the upstream stationary electricity feedstock carbon intensity is:
� �7,794 � !2�����1,000,000 �����×�340 �����ℎ������76,330����� "
�1,055 $�� × �1,000,000 $#$� = 0.033 � !2#$�ℎ���� Multiplying 0.033 gCO2/MJ ethanol by the glycerine co-product adjustment factor of 0.951 gives a carbon intensity of 0.031 gCO2/MJ ethanol.
4. Corn Oil Extraction, Carbon Intensity of Electrical Energy, Upstream Stationary Electricity Fuel Stage Energy (Energy to Produce Electricity) (CO2 emissions)
The emission factor of 233,154 gCO2/mmBtu represents the emissions from the natural gas fuel burned to generate electricity. The carbon intensity value is:
� �233,154 � !2�����1,000,000 �����×�340 �����ℎ������76,330����� "
�1,055 $�� × �1,000,000 $#$� = 0.984 � !2#$�ℎ���� Multiplying 0.984 gCO2/MJ ethanol by the glycerine co-product adjustment factor of 0.951 gives a carbon intensity of 0.936 gCO2/MJ ethanol.
PRELIMINARY DRAFT DISTRIBUTED FOR PUBLIC COMMENT
11/03/11 25
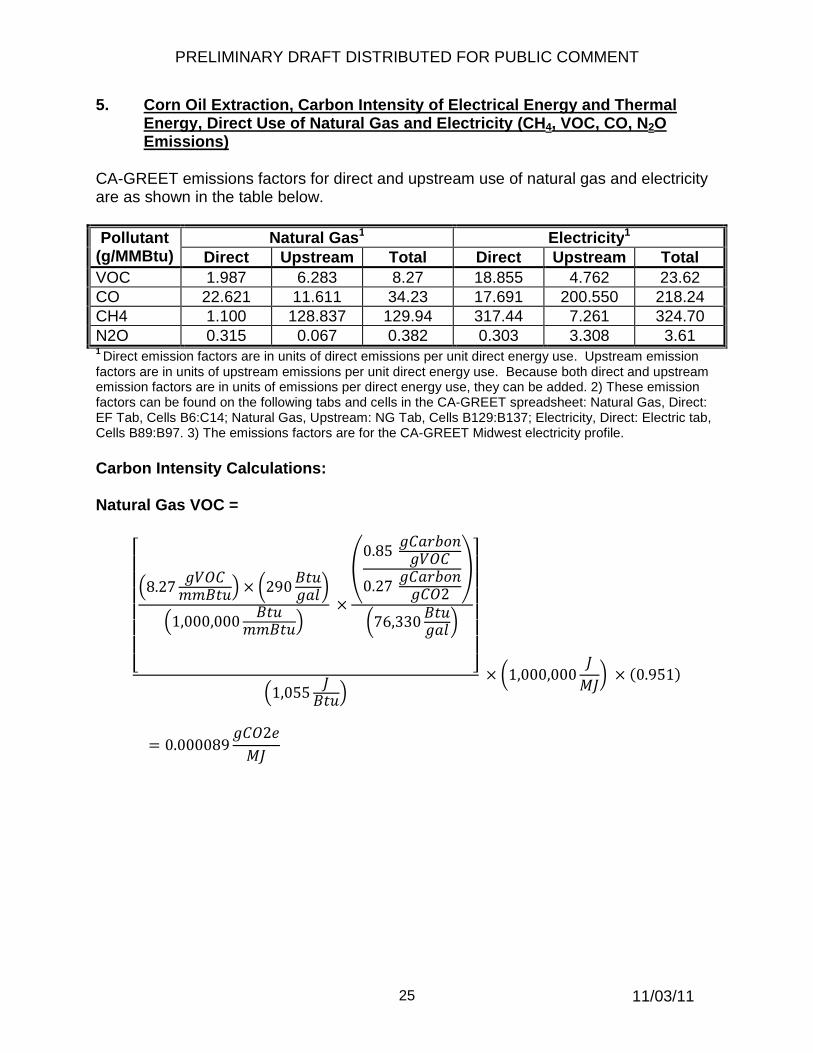
5. Corn Oil Extraction, Carbon Intensity of Electrical Energy and Thermal Energy, Direct Use of Natural Gas and Electricity (CH4, VOC, CO, N2O Emissions)
CA-GREET emissions factors for direct and upstream use of natural gas and electricity are as shown in the table below.
Pollutant (g/MMBtu)
Natural Gas 1 Electricity 1 Direct Upstream Total Direct Upstream Total
VOC 1.987 6.283 8.27 18.855 4.762 23.62 CO 22.621 11.611 34.23 17.691 200.550 218.24 CH4 1.100 128.837 129.94 317.44 7.261 324.70 N2O 0.315 0.067 0.382 0.303 3.308 3.61 1 Direct emission factors are in units of direct emissions per unit direct energy use. Upstream emission factors are in units of upstream emissions per unit direct energy use. Because both direct and upstream emission factors are in units of emissions per direct energy use, they can be added. 2) These emission factors can be found on the following tabs and cells in the CA-GREET spreadsheet: Natural Gas, Direct: EF Tab, Cells B6:C14; Natural Gas, Upstream: NG Tab, Cells B129:B137; Electricity, Direct: Electric tab, Cells B89:B97. 3) The emissions factors are for the CA-GREET Midwest electricity profile.
Carbon Intensity Calculations: Natural Gas VOC =
%&&&&&&'�8.27 �(! ���� × �290������1,000,000 ����� ×
)0.85 � �*+���(! 0.27 � �*+��� !2 ,�76,330�����
-....../
�1,055 $�� × �1,000,000 $#$� × 00.9511 = 0.000089 � !2�#$

PRELIMINARY DRAFT DISTRIBUTED FOR PUBLIC COMMENT
11/03/11 26
Natural Gas CO =
%&&&&&&'�34.23 � !���� × �290������1,000,000 ����� ×
)0.43� �*+��� !0.27� �*+��� !2 ,�76,330�����
-....../
�1,055 $�� × �1,000,000 $#$�× 00.9511 = 0.000187 � !2�#$
Natural Gas CH4 =
��129.94 � 24���� × �290������1,000,000 ����� × �25� !2�� 24 ��76,330�����"�1,055 $�� × �1,000,000 $#$� × 00.9511 = 0.011125 � !2�#$
Natural Gas N2O =
��0.382 �32!���� × �290������1,000,000 ����� × �298 � !2��32! ��76,330�����"�1,055 $�� × �1,000,000 $#$�× 00.9511 = 0.000390 � !2�#$

PRELIMINARY DRAFT DISTRIBUTED FOR PUBLIC COMMENT
11/03/11 27
Electricity VOC =
%&&&&&&'�23.62 �(! ���� × �340������1,000,000 ����� ×
)0.85� �*+���(! 0.27� �*+��� !2 ,�76,330�����
-....../
�1,055 $�� × �1,000,000 $#$�× 00.9511 = 0.000299 � !2�#$
Electricity CO =
%&&&&&&'�218.24 � !���� × �340������1,000,000 ����� ×
)0.43� �*+��� !0.27� �*+��� !2 ,�76,330�����
-....../
�1,055 $�� × �1,000,000 $#$�× 00.9511 = 0.001396 � !2�#$
Electricity CH4 =
��324.70 � 24���� × �340������1,000,000 ����� × �25� !2�� 24 ��76,330�����"�1,055 $�� × �1,000,000 $#$� × 00.9511 = 0.032594 � !2�#$

PRELIMINARY DRAFT DISTRIBUTED FOR PUBLIC COMMENT
11/03/11 28
Electricity N2O =
��3.61 �32!���� × �340������1,000,000 ����� × �298 � !2�� 24 ��76,330�����"�1,055 $�� × �1,000,000 $#$� × 00.9511 = 0.004320 � !2�#$
Therefore, the total carbon intensity (gCO2e/MJ) = 00.000089 + 0.000187 + 0.011125 + 0.000390 + 0.000299 + 0.001396 + 0.032594+ 0.0043201 = 0.050400 � !2�#$ ≈ 0.050� !2�#$
6. Total Carbon Intensity of Corn Oil Extraction (CO2e emissions)
Carbon intensity of corn oil extraction is the sum of the above components (from section 1 through 5), which is equal to:
00.200 + 0.018 + 0.031 + 0.936 + 0.0501 = 1.235 � !2�#$�ℎ���� Therefore, gCO2e/MJ Biodiesel =
�1.235 � !2�#$�ℎ����� × �76,330��ℎ��������ℎ����� × � 1����ℎ����0.065���6�*��7�� × � 1���6�*��7�1���+7�87�9��� × � 1���+7�87�9��119,550�+7�87�9��� = 12.13 � !2�#$+7�87�9��
7. Carbon Intensity of Energy Savings Due to Reduced DGS Drying Energy at
Ethanol Plant, Direct Energy Use (Natural Gas) (CO2 emissions)
The emission factor of 58,188 gCO2/mmBtu for the natural gas savings is the same as the emission factor for the natural gas use shown in Calculation 1 above. The carbon intensity of these savings is as follows:

PRELIMINARY DRAFT DISTRIBUTED FOR PUBLIC COMMENT
11/03/11 29
��3,700 �����ℎ����� × �58,188 � !2�����76,330 �����ℎ����� "�1,055 #$���� = 2.674 � !2�#$
8. Carbon Intensity of Energy Savings Due to Reduced DGS Drying Energy,
Upstream Natural Gas Feedstock (CO2 emissions)
The emission factor of 5,245 gCO2/mmBtu for the natural gas savings is the same as the emission factor for the natural gas use shown in Calculation 2 above. The carbon intensity of these savings is as follows:
��3,700 �����ℎ����� × �5,245 � !2�����76,330 �����ℎ����� "�1,055 #$���� = 0.241� !2�#$
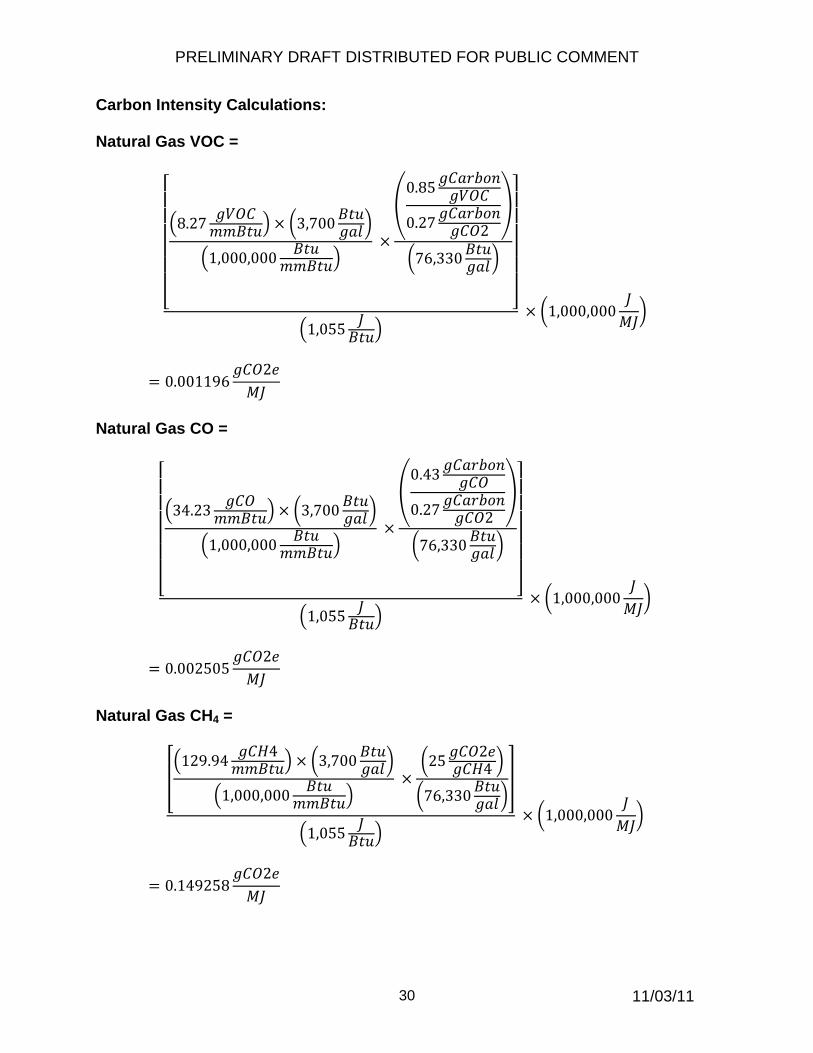
9. Carbon Intensity of Energy Savings Due to Reduced DGS Drying Energy at
Ethanol Plant, Direct and Upstream Energy Use (CH4, VOC, CO, N2O Emissions)
These calculations are performed the same way as in calculation 5, but for natural gas only, using the same emission factors and the ethanol plant thermal energy savings of 3,700 mmBtu/gal.
PRELIMINARY DRAFT DISTRIBUTED FOR PUBLIC COMMENT
11/03/11 30
Carbon Intensity Calculations: Natural Gas VOC =
%&&&&&&'�8.27 �(! ���� × �3,700������1,000,000 ����� ×
)0.85� �*+���(! 0.27� �*+��� !2 ,�76,330�����
-....../
�1,055 $�� × �1,000,000 $#$� = 0.001196 � !2�#$
Natural Gas CO =
%&&&&&&'�34.23 � !���� × �3,700������1,000,000 ����� ×
)0.43� �*+��� !0.27� �*+��� !2 ,�76,330�����
-....../
�1,055 $�� × �1,000,000 $#$� = 0.002505 � !2�#$
Natural Gas CH4 =
��129.94 � 24���� × �3,700������1,000,000 ����� × �25 � !2�� 24 ��76,330�����"�1,055 $�� × �1,000,000 $#$� = 0.149258 � !2�#$

PRELIMINARY DRAFT DISTRIBUTED FOR PUBLIC COMMENT
11/03/11 31
Natural Gas N2O =
��0.382 �32!���� × �3,700������1,000,000 ����� × �298 � !2��32! ��76,330�����"�1,055 $�� × �1,000,000 $#$� = 0.005231 � !2�#$
Total Carbon Intensity from VOC, CO, CH4, and N2O =
00.001196 + 0.002505 + 0.149258 + 0.0052311 = 0.158� !2�#$
10. Total Carbon Intensity of Energy Savings Due to Reduced DGS Drying
Energy (CO2, VOC, CO, CH4, N2O emissions) The total carbon intensity of the energy savings due to reduced DGS drying energy is the sum of the carbon intensities in calculations 7, 8, and 9.
This is: 02.674 + 0.241 + 0.1581 = 3.073 gCO2eMJethanol
The carbon intensity is converted from a gCO2e/MJ of ethanol basis to a gCO2e/MJ of biodiesel fuel. Therefore, gCO2e/MJ biodiesel = �3.073 � !2�#$�ℎ����� × �76,330��ℎ��������ℎ����� × � 1����ℎ����0.065���6�*��7��
× � 1���6�*��7�1���+7�87�9��� × � 1���+7�87�9��119,550�+7�87�9��� = 30.19 � !2�#$+7�87�9��
PRELIMINARY DRAFT DISTRIBUTED FOR PUBLIC COMMENT
11/03/11 32
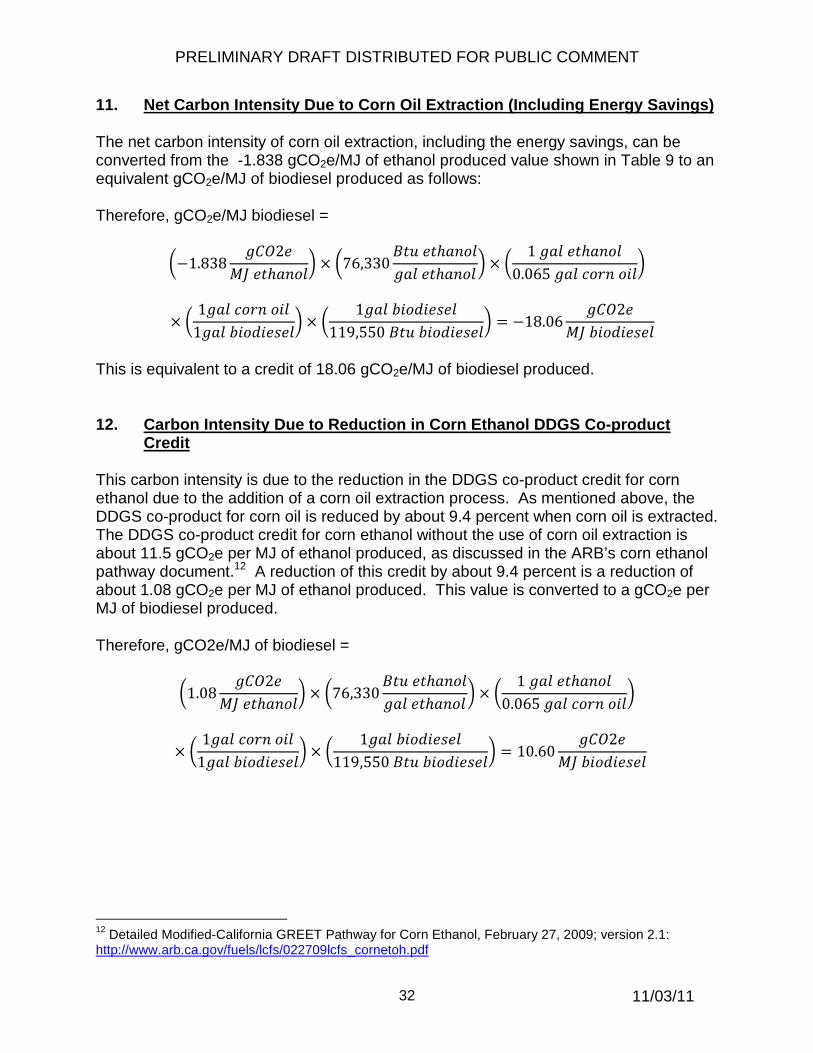
11. Net Carbon Intensity Due to Corn Oil Extraction (Including Energy Savings)
The net carbon intensity of corn oil extraction, including the energy savings, can be converted from the -1.838 gCO2e/MJ of ethanol produced value shown in Table 9 to an equivalent gCO2e/MJ of biodiesel produced as follows:
Therefore, gCO2e/MJ biodiesel =
�−1.838 � !2�#$�ℎ����� × �76,330��ℎ��������ℎ����� × � 1����ℎ����0.065���6�*��7��
× � 1���6�*��7�1���+7�87�9��� × � 1���+7�87�9��119,550�+7�87�9��� = −18.06 � !2�#$+7�87�9�� This is equivalent to a credit of 18.06 gCO2e/MJ of biodiesel produced.
12. Carbon Intensity Due to Reduction in Corn Ethanol DDGS Co-product
Credit
This carbon intensity is due to the reduction in the DDGS co-product credit for corn ethanol due to the addition of a corn oil extraction process. As mentioned above, the DDGS co-product for corn oil is reduced by about 9.4 percent when corn oil is extracted. The DDGS co-product credit for corn ethanol without the use of corn oil extraction is about 11.5 gCO2e per MJ of ethanol produced, as discussed in the ARB’s corn ethanol pathway document.12 A reduction of this credit by about 9.4 percent is a reduction of about 1.08 gCO2e per MJ of ethanol produced. This value is converted to a gCO2e per MJ of biodiesel produced.
Therefore, gCO2e/MJ of biodiesel =
�1.08 � !2�#$�ℎ����� × �76,330��ℎ��������ℎ����� × � 1����ℎ����0.065���6�*��7��
× � 1���6�*��7�1���+7�87�9��� × � 1���+7�87�9��119,550�+7�87�9��� = 10.60 � !2�#$+7�87�9��
12 Detailed Modified-California GREET Pathway for Corn Ethanol, February 27, 2009; version 2.1: http://www.arb.ca.gov/fuels/lcfs/022709lcfs_cornetoh.pdf
PRELIMINARY DRAFT DISTRIBUTED FOR PUBLIC COMMENT
11/03/11 33
Appendix C Energy Use Reduction in the Production of Corn Etha nol from Adding
Corn Oil Extraction by GreenShift Corporation
GreenShift Corporation submitted the following narrative to the U.S. Environmental Protection Agency during the Renewable Fuel Standard rulemaking process in 2009. GreenShift provided a copy to the Air Resources Board in February of 2010 for inclusion in this pathway report.13 GreenShift Corporation (GreenShift) is a company that develops and commercializes clean technologies that facilitate the efficient use of natural resources. As a particular focus, we are using innovative technologies to produce biofuel and other biomass-derived products by extracting and refining raw materials that other producers cannot access or process. A prime example of fundamental importance to the increased availability of renewable fuels is using the extracted corn oil from dry mill corn ethanol plants as a feedstock for biofuels, such as biodiesel. The technology also substantially decreases the energy and production costs of corn ethanol, thereby simultaneously reducing greenhouse gas (GHG) emissions associated with corn ethanol and improving the economic viability of ethanol plants. Corn oil extraction systems, dubbed (COES) by GreenShift, thereby add even more to the renewable energy value of corn ethanol. GreenShift presented testimony at the Public Hearing on the federal Renewable Fuel Standard Program (RFS2) held in Washington DC on June 9, 2009 and submitted comments on the RFS2 rulemaking. GreenShift spoke of three of the most significant effects of extracting corn oil from any ethanol plant: First : The energy savings from installing corn oil extraction are substantial, reducing
energy use to manufacture ethanol by as much as 25 percent. As a result, GHG emissions are actually 29 percent less than gasoline.
Second : Corn oil extraction after fermentation allows a dry mill ethanol plant to produce 11 percent more total fuel energy by manufacturing additional renewable biofuels from its corn oil byproduct. Corn oil is an excellent feedstock for biodiesel and renewable diesel.
Third : Success is just beginning. Additional corn oil extraction efficiency, coupled with corn varieties now available that have higher corn oil content (and the same starch content), have the potential to more than double these benefits.
13 GreenShift Corporation (2009). Energy Use Reduction in the Production of Corn Ethanol from Adding Corn Oil Extraction. February, 2009. GreenShift Corporation submitted this document to the U.S. Environmental Protection Agency during the Renewable Fuel Standard rulemaking process in 2009. GreenShift provided a copy to the Air Resources Board in February of 2010 for inclusion in this pathway report.
PRELIMINARY DRAFT DISTRIBUTED FOR PUBLIC COMMENT
11/03/11 34
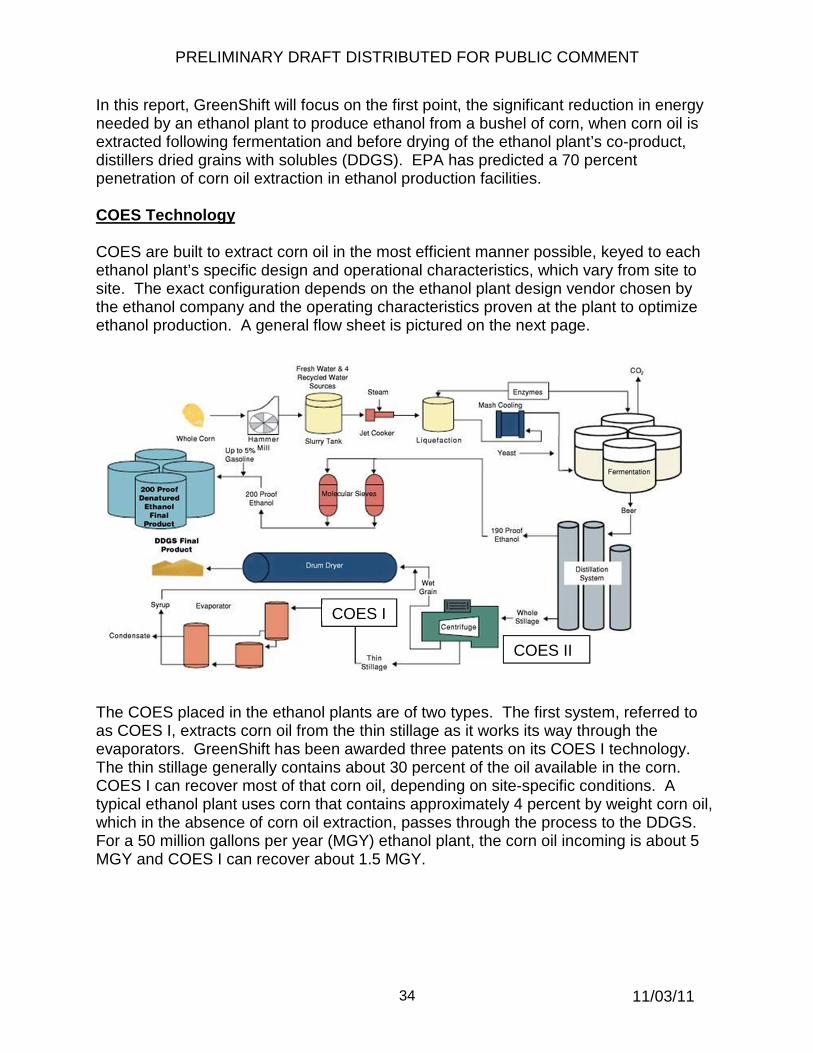
In this report, GreenShift will focus on the first point, the significant reduction in energy needed by an ethanol plant to produce ethanol from a bushel of corn, when corn oil is extracted following fermentation and before drying of the ethanol plant’s co-product, distillers dried grains with solubles (DDGS). EPA has predicted a 70 percent penetration of corn oil extraction in ethanol production facilities. COES Technology COES are built to extract corn oil in the most efficient manner possible, keyed to each ethanol plant’s specific design and operational characteristics, which vary from site to site. The exact configuration depends on the ethanol plant design vendor chosen by the ethanol company and the operating characteristics proven at the plant to optimize ethanol production. A general flow sheet is pictured on the next page.
The COES placed in the ethanol plants are of two types. The first system, referred to as COES I, extracts corn oil from the thin stillage as it works its way through the evaporators. GreenShift has been awarded three patents on its COES I technology. The thin stillage generally contains about 30 percent of the oil available in the corn. COES I can recover most of that corn oil, depending on site-specific conditions. A typical ethanol plant uses corn that contains approximately 4 percent by weight corn oil, which in the absence of corn oil extraction, passes through the process to the DDGS. For a 50 million gallons per year (MGY) ethanol plant, the corn oil incoming is about 5 MGY and COES I can recover about 1.5 MGY.
COES I
COES II

PRELIMINARY DRAFT DISTRIBUTED FOR PUBLIC COMMENT
11/03/11 35
Product Supply 180 °F
Steam Condensate
257 °F
260 °F
Product Return 210 °F
180 °F
210 °F
Trim Cooler Recovered Oil
Heat Exchanger
Patent-pending COES II is an extraction extension that frees another 30 percent of the corn oil that is bound in the whole stillage, prior to the separation of wet grain and thin stillage. The unbound oil is thus made available to COES I and generally increases production of corn oil by nearly 100 percent. COES I and II together therefore can extract on the order of 60 percent (up to 75 percent) of the corn oil passing through the plant, or about 3.0 MGY to 3.8 MGY of corn oil from a 50 MGY ethanol plant. COES installations are similar from plant to plant. They consist of skid mounted equipment placed in the ethanol plant so as to become part of its operation, but in a manner transparent to the production of ethanol – except, that is, for the dramatic decrease in energy use at the ethanol plant. An installed COES, either COES I or II, adds no new materials to the ethanol circuit and uses or consumes no reagents, solvents, or other chemicals. Both COES I and COES II are sealed processes. Only corn oil is taken out and no materials are added. Corn oil (CAS #: 8001-30-7) is a stable vegetable oil, with a very low vapor pressure (< 1.0 mmHg @ 20°C (68°F)). Its flash point is greater th an 290°C (550°F), with a specific gravity of about 0.95 and negligible solubility in water. It is relatively viscous and biodegradable. Corn oil is a light to dark red with a mild corn odor. COES I extracts the corn oil from the thin stillage. The entire flow of thin stillage is passed through the COES and returned, minus the extracted corn oil, just downstream of the extraction point in the evaporator circuit of the ethanol plant. A COES I consists of the equipment shown in the following Process Flow Diagram:
The main process is to heat the partially concentrated thin stillage and extract the corn oil by separation in a centrifuge. Steam is used in heat exchangers to raise the temperature of the thin stillage for extraction. As the temperature is reduced prior to returning the defatted stillage to the evaporators in the ethanol plant, energy is recovered in the heat exchangers to preheat the incoming thin stillage.
PRELIMINARY DRAFT DISTRIBUTED FOR PUBLIC COMMENT
11/03/11 36
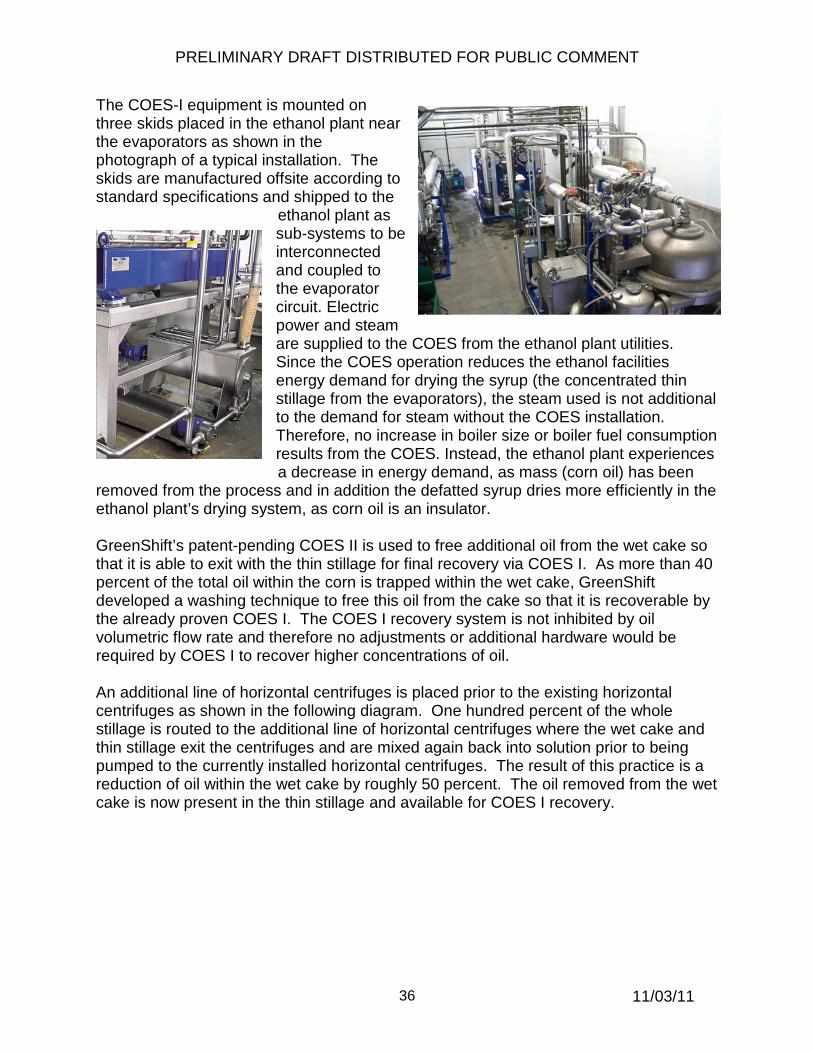
The COES-I equipment is mounted on three skids placed in the ethanol plant near the evaporators as shown in the photograph of a typical installation. The skids are manufactured offsite according to standard specifications and shipped to the ethanol plant as
sub-systems to be interconnected and coupled to the evaporator circuit. Electric power and steam are supplied to the COES from the ethanol plant utilities. Since the COES operation reduces the ethanol facilities energy demand for drying the syrup (the concentrated thin stillage from the evaporators), the steam used is not additional to the demand for steam without the COES installation. Therefore, no increase in boiler size or boiler fuel consumption results from the COES. Instead, the ethanol plant experiences
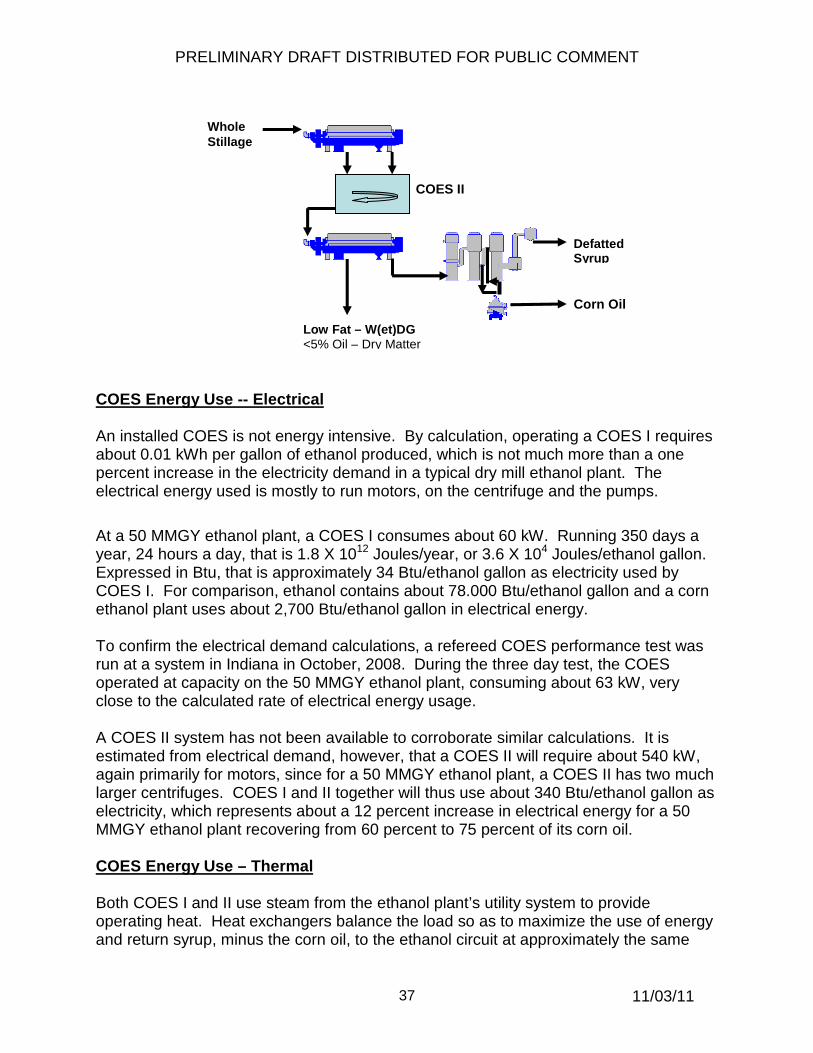
a decrease in energy demand, as mass (corn oil) has been removed from the process and in addition the defatted syrup dries more efficiently in the ethanol plant’s drying system, as corn oil is an insulator. GreenShift’s patent-pending COES II is used to free additional oil from the wet cake so that it is able to exit with the thin stillage for final recovery via COES I. As more than 40 percent of the total oil within the corn is trapped within the wet cake, GreenShift developed a washing technique to free this oil from the cake so that it is recoverable by the already proven COES I. The COES I recovery system is not inhibited by oil volumetric flow rate and therefore no adjustments or additional hardware would be required by COES I to recover higher concentrations of oil. An additional line of horizontal centrifuges is placed prior to the existing horizontal centrifuges as shown in the following diagram. One hundred percent of the whole stillage is routed to the additional line of horizontal centrifuges where the wet cake and thin stillage exit the centrifuges and are mixed again back into solution prior to being pumped to the currently installed horizontal centrifuges. The result of this practice is a reduction of oil within the wet cake by roughly 50 percent. The oil removed from the wet cake is now present in the thin stillage and available for COES I recovery.
PRELIMINARY DRAFT DISTRIBUTED FOR PUBLIC COMMENT
11/03/11 37
COES Energy Use -- Electrical An installed COES is not energy intensive. By calculation, operating a COES I requires about 0.01 kWh per gallon of ethanol produced, which is not much more than a one percent increase in the electricity demand in a typical dry mill ethanol plant. The electrical energy used is mostly to run motors, on the centrifuge and the pumps.
At a 50 MMGY ethanol plant, a COES I consumes about 60 kW. Running 350 days a year, 24 hours a day, that is 1.8 X 10¹² Joules/year, or 3.6 X 10⁴ Joules/ethanol gallon. Expressed in Btu, that is approximately 34 Btu/ethanol gallon as electricity used by COES I. For comparison, ethanol contains about 78.000 Btu/ethanol gallon and a corn ethanol plant uses about 2,700 Btu/ethanol gallon in electrical energy. To confirm the electrical demand calculations, a refereed COES performance test was run at a system in Indiana in October, 2008. During the three day test, the COES operated at capacity on the 50 MMGY ethanol plant, consuming about 63 kW, very close to the calculated rate of electrical energy usage. A COES II system has not been available to corroborate similar calculations. It is estimated from electrical demand, however, that a COES II will require about 540 kW, again primarily for motors, since for a 50 MMGY ethanol plant, a COES II has two much larger centrifuges. COES I and II together will thus use about 340 Btu/ethanol gallon as electricity, which represents about a 12 percent increase in electrical energy for a 50 MMGY ethanol plant recovering from 60 percent to 75 percent of its corn oil. COES Energy Use – Thermal Both COES I and II use steam from the ethanol plant’s utility system to provide operating heat. Heat exchangers balance the load so as to maximize the use of energy and return syrup, minus the corn oil, to the ethanol circuit at approximately the same
Low Fat – W(et)DG <5% Oil – Dry Matter
Corn Oil
Defatted Syrup
Whole Stillage
COES II
PRELIMINARY DRAFT DISTRIBUTED FOR PUBLIC COMMENT
11/03/11 38
temperature as it was when diverted to COES. Consumed energy as heat is therefore limited to waste heat lost and heat retained in the extracted corn oil. GreenShift has calculated the heat energy needed to run a COES I on a 50 MMGY ethanol plant to be about 1 million Btu/hr, obtained by using 900 lb/hr of steam. That is about 180 Btu/ethanol gallon. In most ethanol plants, as assumed here, this energy comes from a boiler burning natural gas. In the performance test mentioned above, the COES I consumed approximately 450 lbs/hr of steam, one half this rate at that particular plant. The steam demand for a COES II is estimated by GreenShift to be about 550 lb/hr of steam, or 110 Btu/ethanol gallon. Taken together, the total thermal energy demand for operating COES I and II is just under 300 Btu/ethanol gallon produced. Adding the electrical and thermal energy uses for COES I results in 34 plus 180, or about 210 Btu/gal ethanol. COES I and II require 640 Btu/ethanol gallon. Ethanol Plant Energy Use Reduction While electrical demand, which increases with COES installation, is a small component of an ethanol plant’s energy use, large savings in the use of thermal energy result from the effects of extracting corn oil. First, corn oil is removed from the syrup stream in the evaporators, which increases their performance by improving heat transfer, since oil is an insulator and is hard to heat. Second, corn oil extraction improves the drying efficiency of the DDGS, as there is less mass passing through the dryers. Third, corn oil extraction improves the flowability and handling of DDGS, such that less drying is needed to produce a quality feed product. To calculate the ethanol plant energy reductions resulting from COES, GreenShift has performed a mass balance on a typical 50 MMGY ethanol plant, with and without COES. COES I reduces the energy use in the ethanol plant dryers by about 3,700 Btu/ethanol gallon, due to the combined effects listed above. Subtracting the COES I consumption of energy from this reduction, the net energy savings produced by a COES I is 3,700 minus 210, or about 3,500 Btu/ethanol gallon. EPA estimates that a total ethanol plant energy use is about 35,700 Btu/gal, as noted in the draft Regulatory Impact Analysis (DRIA) of the Renewable Fuel Standard. (Reference is made here to the DRIA instead of the final RIA to be conservative, since energy efficiencies are included in the final that lower the total energy demand, which will increase the value of COES in reducing energy use.) Installation of a COES I therefore represents a 9.8 percent total energy savings (3,500/35,700). GreenShift feels these numbers are the expected savings in energy and should be considered along with the conservative 5.4 percent figure in the FRIA.

PRELIMINARY DRAFT DISTRIBUTED FOR PUBLIC COMMENT
11/03/11 39
Final values shown above were calculated on Microsoft Excel, where contributing factors were not rounded, resulting final values are different than the actual calculating operations (Similar calculations for VOC, CO, CH4, and N2O.)
PRELIMINARY DRAFT DISTRIBUTED FOR PUBLIC COMMENT
11/03/11 40
REFERENCES
ARB (2009). Detailed California-Modified GREET Pathway for Conversion of Midwest Soybeans to Biodiesel (Fatty Acid Methyl Esters-FAME). December 14, 2009; version 3.0: http://www.arb.ca.gov/fuels/lcfs/121409lcfs_soybd.pdf Argonne National Laboratory (2008). The Greenhouse Gases, Regulated Emissions, and Energy Use in Transportation (GREET) Model. http://greet.es.anl.gov/main ARB (2009). Air Resources Board, Low Carbon Fuel Standard Program, Lifecycle Analysis (CA-GREET): http://www.arb.ca.gov/fuels/lcfs/lcfs.htm Argonne National Laboratory (2008). Life-Cycle Assessment of Energy and Greenhouse Gas Effects of Soybean-Derived Biodiesel and Renewable Fuels: http://www.transportation.anl.gov/pdfs/AF/467.pdf Solomon and et al (2007). United Nations Intergovernmental Panel on Climate Change (IPCC): Contribution of Working Group I to the Fourth Assessment Report of the Intergovernmental Panel on Climate Change, 2007. In 2007, the IPCC values for GHG equivalence (gCO2e/MJ) are: CH4 = 25, N2O = 298, CO2 = 1. For others GHG, GREET calculates molecular weight of carbon to obtain the GHG equivalence (gCO2e/MJ): VOC = 0.85/0.27 = 3.12 and CO = 0.43/0.273 = 1.57. http://www.ipcc.ch/publications_and_data/ar4/wg1/en/contents.html ARB (2009). Detailed Modified-California GREET Pathway for Corn Ethanol, February 27, 2009; version 2.1: http://www.arb.ca.gov/fuels/lcfs/o22709lcfs_cornetoh.pdf GreenShift Corporation (2009). Energy Use Reduction in the Production of Corn Ethanol from Adding Corn Oil Extraction. February, 2009. GreenShift Corporation submitted this document to the U.S. Environmental Protection Agency during the Renewable Fuel Standard rulemaking process in 2009. GreenShift provided a copy to the Air Resources Board in February of 2010 for inclusion in this pathway report.