Embed Size (px)
Citation preview
July 2018
Work conducted under LCR MSCP Work Task D9
California Leaf-nosed and Townsend’s Big-eared Bat Foraging Distance Survey 2017
Lower Colorado River Multi-Species Conservation Program Steering Committee Members
Federal Participant Group California Participant Group Bureau of Reclamation California Department of Fish and Wildlife U.S. Fish and Wildlife Service City of Needles National Park Service Coachella Valley Water District Bureau of Land Management Colorado River Board of California Bureau of Indian Affairs Bard Water District Western Area Power Administration Imperial Irrigation District
Los Angeles Department of Water and Power Palo Verde Irrigation District Arizona Participant Group San Diego County Water Authority
Southern California Edison Company Arizona Department of Water Resources Southern California Public Power Authority Arizona Electric Power Cooperative, Inc. The Metropolitan Water District of Southern Arizona Game and Fish Department California Arizona Power Authority Central Arizona Water Conservation District Cibola Valley Irrigation and Drainage District Nevada Participant Group City of Bullhead City City of Lake Havasu City Colorado River Commission of Nevada City of Mesa Nevada Department of Wildlife City of Somerton Southern Nevada Water Authority City of Yuma Colorado River Commission Power Users Electrical District No. 3, Pinal County, Arizona Basic Water Company Golden Shores Water Conservation District Mohave County Water Authority Mohave Valley Irrigation and Drainage District Native American Participant Group Mohave Water Conservation District North Gila Valley Irrigation and Drainage District Hualapai Tribe Town of Fredonia Colorado River Indian Tribes Town of Thatcher Chemehuevi Indian Tribe Town of Wickenburg Salt River Project Agricultural Improvement and Power District Unit “B” Irrigation and Drainage District Conservation Participant Group Wellton-Mohawk Irrigation and Drainage District Yuma County Water Users’ Association Ducks Unlimited Yuma Irrigation District Lower Colorado River RC&D Area, Inc. Yuma Mesa Irrigation and Drainage District The Nature Conservancy Other Interested Parties Participant Group QuadState Local Governments Authority Desert Wildlife Unlimited

Lower Colorado River Multi-Species Conservation Program Bureau of Reclamation Lower Colorado Region Boulder City, Nevada http://www.lcrmscp.gov
July 2018
Lower Colorado River Multi-Species Conservation Program
California Leaf-nosed and Townsend’s Big-eared Bat Foraging Distance Survey 2017
Prepared by: Maturango Museum1 and Brown-Berry Biological Consulting2 1 100 E. Las Flores Avenue Ridgecrest, California 93555 760-375-6900 760-375-0479 (fax) [email protected] 2 134 Eagle Vista Bishop, California 93514 760-387-2005 760-920-3975 cell [email protected]

Maturango Museum and Brown-Berry Biological Consulting. 2018. California Leaf-nosed and Townsend’s Big-eared Bat Foraging Distance Survey, 2017. Submitted to the Lower Colorado River Multi-Species Conservation Program, Bureau of Reclamation, Boulder City, Nevada, by the Maturango Museum, Ridgecrest, California.
ACRONYMS AND ABBREVIATIONS ac acre(s) a.k.a. also known as AKTP ‘Ahakhav Tribal Preserve BLCA Beal Lake Conservation Area CDFW California Department of Fish and Wildlife Cibola NWR Unit #1 Cibola National Wildlife Refuge Unit #1 Conservation Area CRIT Colorado River Indian Tribes CSV comma delimited table file CVCA Cibola Valley Conservation Area ESRI Environmental Systems Research Institute g gram(s) GIS Geographic Information System GME Geospatial Modelling Environment GPS Global Positioning System GPX GPS exchange format ha hectare(s) HCA habitat creation area km kilometer(s) km/h kilometers per hour LCR lower Colorado River LCR MSCP Lower Colorado Multi-Species Conservation Program MCP minimum convex polygon MEFF mobile electronic field form mph miles per hour NAD83 North American 1983 Datum PRDA Pratt Restoration Demonstration Area PVER Palo Verde Ecological Reserve Reclamation Bureau of Reclamation SD card secure digital card UTM Universal Transverse Mercator YEW Yuma East Wetlands YPG Yuma Proving Ground Symbols ° degree(s) ºF degrees Fahrenheit > greater than < less than # number % percent ± plus or minus
i
CONTENTS
Page
Executive Summary ....................................................................................... ES-1
Introduction ......................................................................................................... 1 Methods .............................................................................................................. 2
Bats and Transmitters .................................................................................... 2 Aerial Telemetry .......................................................................................... 11 Ground-based Telemetry .............................................................................. 15 Remote Telemetry Receivers ....................................................................... 17 Data Analysis and Management ................................................................... 20
Results ............................................................................................................... 33 February and August 2015: Blythe Area ..................................................... 35
2015 Recaptured Bats and Recovered Transmitters ................................ 52 2015 Tracking from Conservation Areas to Roosts ................................. 55 Arizona Myotis Roost ............................................................................ 60
February 2016: Yuma Area ......................................................................... 61 February 2016 Tracking from Conservation Areas to Roosts........................ 69 August 2016: Parker Area ........................................................................... 73 August 2016 Tracking from the ‘Ahakhav Tribal Preserve to Roosts ........... 88
Discussion ......................................................................................................... 90 California Leaf-nosed Bats .......................................................................... 90 Townsend’s Big-eared Bats ......................................................................... 95 Arizona Myotis ............................................................................................ 98
Conclusions ....................................................................................................... 99 Literature Cited ............................................................................................... 101 Acknowledgments ........................................................................................... 107

ii
Tables Table Page
1 Details of radio tracked California leaf-nosed bats for February 2015 ...................................................................................... 8
2 Details of radio tracked bats for August 2015 ........................................... 9 3 Details of radio-tracked California leaf-nosed bats for
February 2016 .................................................................................... 10 4 Details of radio-tracked California leaf-nosed and
Townsend’s big-eared bats for August 2016 ....................................... 11 5 Locations and duration of deployment of telemetry data loggers,
2015 and 2016 .................................................................................... 19 6 An example of a derived estimated location point data table for
the Bat #2 field survey night, February 7, 2015, showing spatially correct coordinates (UTM) after adding to the shapefile data table ............................................................................................ 30
7 Straight line distance (miles) from mine roosts to southern Blythe area HCAs.......................................................................................... 36
8 February 2015 maximum straight line distances (miles) to foraging areas from mine roost and minimum convex polygon area (acres) for all locations for each telemetered California leaf-nosed bat ........... 37
9 August 2015 maximum straight line distances (miles) to foraging areas from mine roosts and LCR MSCP area (acres) for all locations for each telemetered California leaf-nosed bat ..................... 38
10 Distances (miles) from roost to HCAs for all California leaf-nosed bats telemetered at foraging sites in February and August 2015 as determined by airplane tracking ..................................................... 57
11 Bat detections by night in Cibola NWR Unit #1 and the PVER with the remote telemetry logger (L) and airplane tracking (A) in February 2015 ................................................................................ 57
12 Bat detections by night at the CVCA with the remote telemetry logger (L) and airplane tracking (A) in August 2015 .......................... 60
13 February 2016 straight line distance (miles) from known roosts in the 3C Mine and I-8 bridge to YEW and the PRDA ........................... 62
14 Nightly exit of bats from the 3C Mine detected with telemetry logger (L), airplane (A), and ground (G) tracker teams stationed near the mine entrance ........................................................................ 63
15 February 2016 maximum straight line distances (miles) to foraging areas from the 3C Mine and I-8 bridge roost for telemetered California leaf-nosed bats ................................................................... 64
16 August 2016 maximum straight line distances (miles) traveled to foraging areas by telemetered California leaf-nosed and Townsend’s big-eared bats from Mountaineer, Morningstar, Gold Dollar, and Blue Cloud Mine roosts ........................................... 76
iii
Figures Figure Page
1 Map showing bat mine roosts, LCR MSCP conservation areas, and HCAs where bats were captured for telemetry in February and August 2015 and 2016. .................................................................. 3
2 Map showing bat mine roosts and LCR MSCP conservation areas near Blythe, California, where bats were captured for telemetry in February and August 2015. .................................................................. 4
3 Map showing bat roosts, LCR MSCP conservation areas and HCAs near Yuma, Arizona, where bats were captured for telemetry or tracked in February 2016. ..................................................................... 5
4 Map showing bat roosts and the ‘Ahakhav Tribal Preserve near Parker, Arizona, where bats were captured for telemetry or tracked in August 2016. ........................................................................ 6
5 Airplane GPS track, February 12, 2015. ................................................. 14 6 An example of a 10° cone of uncertainty at 3 miles (5 km)
from a fixed observer position demonstrating the increase in positional uncertainty as the distance from the observer location increases. ........................................................................................... 22
7 Example of a single ground tracker observer location in relationship to the Stonehouse Mine (the label on the observer location is the GPS file name). ........................................................... 23
8 Example of the same observer location as in figure 7 with two signal detections with the directional azimuths. ............................................ 23
9 Example of the range of uncertainty for a bat location at a given time based on 1° azimuth signal detection from the observer location. ............................................................................................. 24
10 Example of line of sight limit to bat transmitter radio signal detection. ........................................................................................... 27
11 Example of a bat recorded on the night of August 5, 2015. ..................... 28 12 Derived estimated location points for Bat #2, February 7, 2015,
showing data table extraction. ............................................................ 29 13 An example of the flight path waypoints for August 5, 2015,
and estimated averaged locations of bats, #1, #3, and #4, buffered to 250-meter-diameter polygons. .......................................... 32
14 Example of the estimated use area by all bats recorded on the night of August 5, 2015. ..................................................................... 33
15 Composite map of all telemetered bat detections for all tracking sessions showing mine roosts, LCR MSCP conservation areas, and HCAs. ......................................................................................... 34
16 All foraging locations of 17 telemetered male and female California leaf-nosed bats roosting in the Stonehouse Mine, February 2015. ................................................................................... 39
iv
Figures (continued) Figure Page 17 All positions of 10 telemetered male California leaf-nosed bats
roosting in the Stonehouse Mine, August 2015. .................................. 40
18 All positions of eight telemetered female California leaf-nosed bats roosting in the Roosevelt Mine, August 2015. ............................. 41
19 Track of Bat #1a (a female California leaf-nosed bat) on February 15, 2015, from Stonehouse Mine collected over 5.2 hours of ground and aerial tracking. .............................................. 42
20 GPS track of airplane for 4.5 hours on February 15, 2015. ..................... 43 21 Bat #1b (a male California leaf-nosed bat), August 5, 2015,
roosting in the Stonehouse Mine. ........................................................ 44 22 Foraging detections for the same bat, #7a,b (a male California
leaf-nosed bat), in both the February and August 2015 tracking sessions. ............................................................................................. 45
23 Foraging detections for the same bat, #18a,b (a male California leaf-nosed bat), in both the February and August tracking 2015 sessions. .................................................................................... 46
24 Foraging detections for the same bat, #19a/20b (a male California leaf-nosed bat, labeled #19a in winter and #20b in summer), in the February and August 2015 tracking sessions. ............................ 47
25 MCPs for foraging activity of Stonehouse Mine bats, #1a to #5a (female California leaf-nosed bats), during February 2015. ................ 48
26 MCPs for foraging activity of Stonehouse Mine bats, #6a to #10a (male and female California leaf-nosed bats), during February 2015. ................................................................................... 49
27 MCPs for foraging activity of Stonehouse Mine bats #11a, #12a, and #16a (male and female California leaf-nosed bats), during February 2015. ................................................................................... 50
28 MCPs for foraging activity of Stonehouse Mine bats, #17a to #20a (male California leaf-nosed bats), during February 2015. ........... 51
29 All positions of eight telemetered male and female California leaf-nosed bats roosting in the Stonehouse Mine on the night of February 15, 2015. ............................................................................. 53
30 Bat #22b (a male California leaf-nosed bat) locations for all nights August 9–16, 2015. .................................................................. 54
31 All positions of three female California leaf-nosed bats roosting in the Hart Mine and foraging at the CVCA and Cibola NWR Unit #1 in February 2015. .................................................................. 56
32 All positions of two female California leaf-nosed bats day roosting in caves in cliff faces and foraging at the CVCA and Cibola NWR Unit #1 in August 2015. ........................................................... 58
v
Figures (continued) Figure Page 33 All positions of two bats, #21a and #22a (male California
leaf-nosed bats), day roosting in a mine in the Dome Rock Mountains and foraging at the PVER in February 2015. ..................... 59
34 All aerially tracked positions of the female Arizona myotis (#17b), including the capture site at the CVCA and the bridge day roost near the town of Palo Verde, California. ............................................. 61
35 Foraging locations of all bats tagged at the 3C Mine and the PRDA in February 2016. .................................................................... 65
36 MCPs for foraging activity of 3C Mine male (38,922 ac [15,751 ha]) and female (52,659 ac [21,310 ha]) California leaf-nosed bats during February 2016. ................................................ 66
37 All locations of telemetered California leaf-nosed bats (male and female) roosting in the 3C Mine and the I-8 bridge on the night of February 10, 2016. ................................................................ 67
38 Tracked locations for California leaf-nosed bats, #1c, #6c, #7c, #13c, and #14c, for all nights of the February 2016 session, demonstrating foraging area fidelity. .................................................. 68
39 Track of California leaf-nosed bat, #7c (a male), on February 10, 2016, roosting in the 3C Mine from over 4.6 hours of ground and aerial tracking. ............................................................................. 70
40 February 2016 California leaf-nosed bat detections from ground (blue dots) versus aircraft (red dots). .................................................. 71
41 GPS track of airplane for 5.5 hours on February 16, 2016. ..................... 72 42 February 2016 tracking detections of California leaf-nosed bats,
#16c and #17c, captured at YEW and roosting in the I-8 bridge. ........ 74 43 All foraging locations of Townsend’s big-eared bats roosting in
the Mountaineer and Gold Dollar Mines, August 2016. ...................... 77 44 MCP (38.355 ac [15,522 ha]) for activity of all Townsend’s
big-eared bats roosting in the Gold Dollar Mine during August 2016. ...................................................................................... 78
45 All positions of eight telemetered Townsend’s big-eared bats roosting in the Gold Dollar Mine on the night of August 21, 2016. ................................................................................ 79
46 Locations for Townsend’s big-eared bats, #5d and #7d, for all nights tracked in August 2016, showing individual foraging area fidelity. ....................................................................................... 80
47 Track of Townsend’s big-eared bats, #5d and #3d, August 30, 2016, roosting in Gold Dollar mine. ................................................... 82
48 Comparison of airplane versus ground tracking detected locations for Townsend’s big-eared bats in August 2016. .................................. 83

vi
Figures (continued) Figure Page 49 Airplane GPS track, August 19, 2016, while searching for new
Townsend’s big-eared bat roosts in the Riverside Mountains and roosts of California leaf-nosed bats, #16d and #17d, tagged at the AKTP. ...................................................................................... 84
50 All foraging locations of telemetered California leaf-nosed bats roosting in the Mountaineer and Morningstar Mines, August 2016. ...................................................................................... 85
51 MCPs for foraging activity of Mountaineer Mine (male, 20,195 ac [8,173 ha]) and Morningstar Mine (female, 12,991 ac [5,257 ha]) California leaf-nosed bats during August 2016. .................................. 86
52 Comparison of airplane versus ground tracking detected locations, August 2016, for California leaf-nosed bats. ....................................... 87
53 All positions of female California leaf-nosed bats, #16d and #17d, captured while foraging at the AKTP in August 2016 and tracked to roosts in the southeast Whipple Mountains near the Blue Cloud Mine. ................................................................................................. 89
ES-1
EXECUTIVE SUMMARY California leaf-nosed bats (Macrotus californicus) and Townsend’s big-eared bats (Corynorhinus townsendii) were tracked using radio telemetry in 2015 and 2016 to determine the maximum foraging distances of each species and to document roost and foraging area locations. This was conducted to inform how far Lower Colorado River Multi-Species Conservation Program (LCR MSCP) conservation areas could be from roosts and be utilized by foraging California leaf-nosed and Townsend’s big-eared bats. Nocturnal aerial and ground tracking of telemetered bats was conducted, supplemented by remote receivers/dataloggers at roosts and potential foraging areas, and diurnal reconnaissance of roosting and foraging habitat identified by tracking. In 2015, California leaf-nosed bats were captured and fitted with radio telemetry transmitters in the Mule Mountains at the Stonehouse Mine (a.k.a. Hodge Mine) southwest of Blythe, California, in winter (February), and at the Stonehouse and Roosevelt Mines in late summer (in August after lactation has ended). Transmitters were also attached to California leaf-nosed bats captured in mist nets at LCR MSCP conservation areas (Palo Verde Ecological Reserve, Cibola National Wildlife Refuge Unit #1 Conservation Area, and Cibola Valley Conservation Area). In February 2016, California leaf-nosed bats were captured at the 3C Mine in the Chocolate Mountains northwest of Yuma, Arizona. Transmitters were attached to these bats as well as those captured in mist nets at Yuma East Wetlands and the Pratt Restoration Demonstration Area. In August 2016, California leaf-nosed and Townsend’s big-eared bats were tagged at the Mountaineer Mine. Transmitters were also attached to California leaf-nosed bats captured at the ‘Ahakhav Tribal Preserve south of Parker, Arizona. The tracking of Townsend’s big-eared bats commenced at the end of the maternity season after lactation ended. Telemetered California leaf-nosed and Townsend’s big-eared bats traveled up to 10 miles (16 kilometers) measured in a straight line from their roosts when foraging. However, the observed routes involved followed the terrain and were often circuitous. Individual California leaf-nosed bats tracked from the ground and airplane could travel over 50 miles (80 kilometers) while foraging during only part of a night. California leaf-nosed bats traveled over 10 miles (16 kilometers) one way to forage in LCR MSCP conservation areas and other habitat conservation areas. Over the duration of a tracking session, individual California leaf-nosed and Townsend’s big-eared bats exhibited foraging area fidelity. Foraging areas for California leaf-nosed bats can vary seasonally. Female California leaf-nosed bats traveled, on average, farther than males while foraging and had larger travel area minimum convex polygons. The roost was not the center of foraging movements. Along the lower Colorado River (LCR), the direction of movement for the telemetered bats was mainly toward the LCR, with the roost being the apex of a fan spreading out toward the river. New California
California Leaf-nosed and Townsend’s Big-eared Bat Foraging Distance Survey, 2017
ES-2
leaf-nosed bat roosts (other than mines) discovered through telemetry included cavities in high cliffs and deep washes, abandoned buildings, cavities in hay bales, and in the extensive interior cavity of the reinforced concrete I-8 bridge over the LCR. Except for the I-8 bridge, all of the other roost types were only used in the summer tracking periods. All-day roosts for Townsend’s big-eared bats were in mines, but identified night roosts were in abandoned or little used buildings. Consistent with the widely reported pattern of high disturbance sensitivity, post-lactating Townsend’s big-eared bats switched roosts after capture and transmitter attachment. California leaf-nosed bats generally did not change roosts. Aerial tracking provided a much greater detection range than ground tracking and successfully located bats in areas with limited ground access (e.g., military or Tribal lands and wilderness areas). The airplane crew could coordinate activity of ground tracking crews in multiple locations over a 12-mile (20-kilometer) distance in real time and could direct ground trackers toward bats in locations where their transmitter signals are blocked by terrain. Ground tracking was necessary to document habitat use, find night roosts, and recover dropped transmitters, as well as to triangulate bat foraging locations, especially in the absence of an airplane. Remote telemetry data loggers successfully record visits of bats to roosts and foraging areas. Despite a limited detection volume with a single omnidirectional antenna, the data loggers documented repeated nightly visits of California leaf-nosed bats to the same regions in habitat conservation areas where they had been captured and tagged during foraging.

1
INTRODUCTION California leaf-nosed bats (Macrotus californicus) and Townsend’s big-eared bats (Corynorhinus townsendii) are evaluation species for the Lower Colorado River Multi-Species Conservation Program (LCR MSCP). Documents creating the LCR MSCP (2004) used the subspecific designation of pale Townsend’s big-eared bat (Cornorhinus townsendii pallescenss = Plecotus townsendii pallescens), which was based on the taxonomic studies of Handley (1959). Subsequent phylogeographic studies (Piaggio and Perkins 2005; Piaggio et al. 2009) have determined that the subspecies of the Townsend’s big-eared bat that occurs in the area covered by the LCR MSCP is Corynorhinus townsendii townsendii. Townsend’s big-eared bats in this report refer to the currently used common name without subspecies designation. The goals of the 2015 to 2016 telemetry project were to determine maximum foraging distances of California leaf-nosed and Townsend’s big-eared bats, and to document roost and foraging area locations. This was necessary to determine how far LCR MSCP conservation areas should be from roosts in order to be utilized for foraging by covered bat species. Nocturnal aerial and ground tracking of telemetered bats was conducted, supplemented by remote receivers/dataloggers at roosts and potential foraging areas, and diurnal reconnaissance of roosting and foraging habitat identified by tracking. The utility of combining nocturnal aerial and ground tracking techniques in the current project was first demonstrated in a 2004 telemetry survey of Allen’s big-eared bats (Idionycteris phyllotis) near Kingman, Arizona. All 12 of the telemetered female bats (with the same body mass as California leaf-nosed bats) left a mine roost in creosote bush scrub and flew northeast 18.6–24.8 miles (30–40 kilometers [km]) each night to forage in pinyon juniper woodland in the next mountain range. The nightly distance traveled by the bats was greater than the straight line between the roost and the foraging habitat. The roost was not the center of a foraging area, but the base of a narrow fan-shaped foraging pattern (Brown and Berry 2004). The results of the current tracking surveys of California leaf-nosed and Townsend’s big-eared bats were consistent in general conclusions with the 2004 research and validated the importance of these integrated techniques. Telemetered California leaf-nosed and Townsend’s big-eared bats in mine roosts are not detectable until they emerge after dark to forage. Unless the bats night roost on the surface between foraging bouts, California leaf-nosed and Townsend’s big-eared bats (and their transmitted signals) are always in motion. This requires coordination and triangulation between teams of trackers and is augmented with information from the aircraft observers throughout the night. Night tracking of foraging bats is more challenging than locating bat species during the day that roost on or near the surface, such as western red bats (Lasiurus blossevillii) and western yellow bats (Lasiurus xanthinus).
California Leaf-nosed and Townsend’s Big-eared Bat Foraging Distance Survey, 2017
2
California leaf-nosed bats are distinctive among lower Colorado River (LCR) bat species: they cannot lower their body temperature to hibernate. They are active year round along the LCR, relying on winter roosts in a small number of geothermally heated mines that provide consistently warm roosts (Bell et al. 1986; Brown 2013, 2016). The Mountaineer Mine, located in the Riverside Mountains north of Blythe, California, is the only currently known maternity roost of Townsend’s big-eared bats along the LCR. Townsend’s big-eared bats are not present in the mine in winter and probably hibernate in higher elevations away from the LCR during that time.
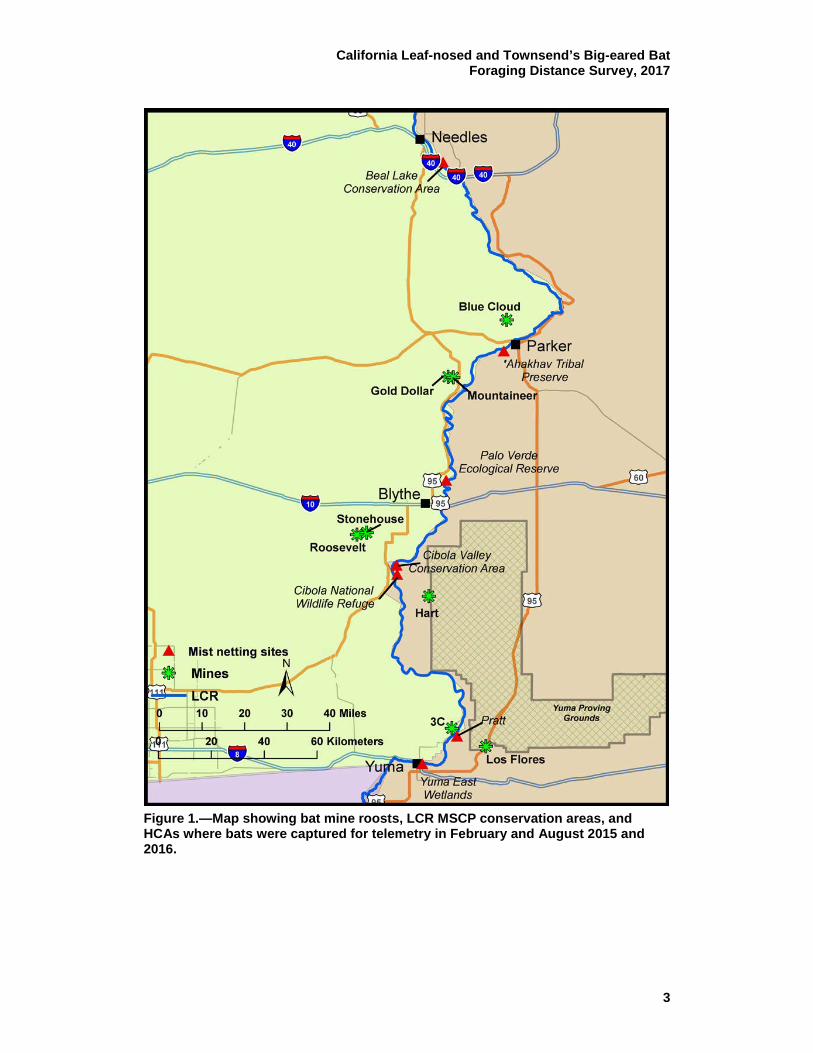
METHODS Bats and Transmitters A combination of active aerial and ground tracking was employed to document California leaf-nosed and Townsend’s big-eared bat foraging distances from roosts. During two sampling periods in winter (February 5–20, 2015, and February 1–20, 2016) and two in summer (August 2–19, 2015, and August 15–September 1, 2016), bats were captured with hand nets inside mines during the day and/or in mist nets and harp traps at roost exits after sunset, or in mist nets while foraging in conservation areas and habitat creation areas (HCAs). Figures 1–4 show the areas where bats were captured and tracked along the LCR. When possible, multiple bats beyond the minimum needed for the telemetry were captured and weighed, and the heaviest bats selected to be fitted with transmitters. The added mass of a transmitter (Holohil BD 2X weighing 0.36 gram [g]) lessens bat maneuverability (Aldridge and Brigham 1988), and the goal was to select bats that would have an added mass less than 5% of their body weight. The telemetered California leaf-nosed bats weighed between 10.2 and 15.7 g and the Townsend’s big-eared bats from 7 to 10.8 g. California leaf-nosed bats were also fitted with color anodized numbered metal forearm bands for easy visual recognition in the roost and for future recapture information. Tooth wear (1 = unworn teeth to 4 = teeth worn down to gums) was also recorded for California leaf-nosed bats using a system developed by P. Leitner and used for relative determination of age in band and recapture studies of California leaf-nosed bats since the 1960s (Leitner and Brown, unpublished data). The Townsend’s big-eared bats were not banded because this sensitive species has shown adverse reactions to banding in prior studies (Pierson and Fellers 1993). Radio transmitters were attached by standard methods (Carter et al. 2009) to the bats’ backs with latex-based medical adhesive after trimming fur along the midline above the scapulae. The transmitter battery life was rated as 18–21 days.
California Leaf-nosed and Townsend’s Big-eared Bat Foraging Distance Survey, 2017
3
Figure 1.—Map showing bat mine roosts, LCR MSCP conservation areas, and HCAs where bats were captured for telemetry in February and August 2015 and 2016.
California Leaf-nosed and Townsend’s Big-eared Bat Foraging Distance Survey, 2017
4
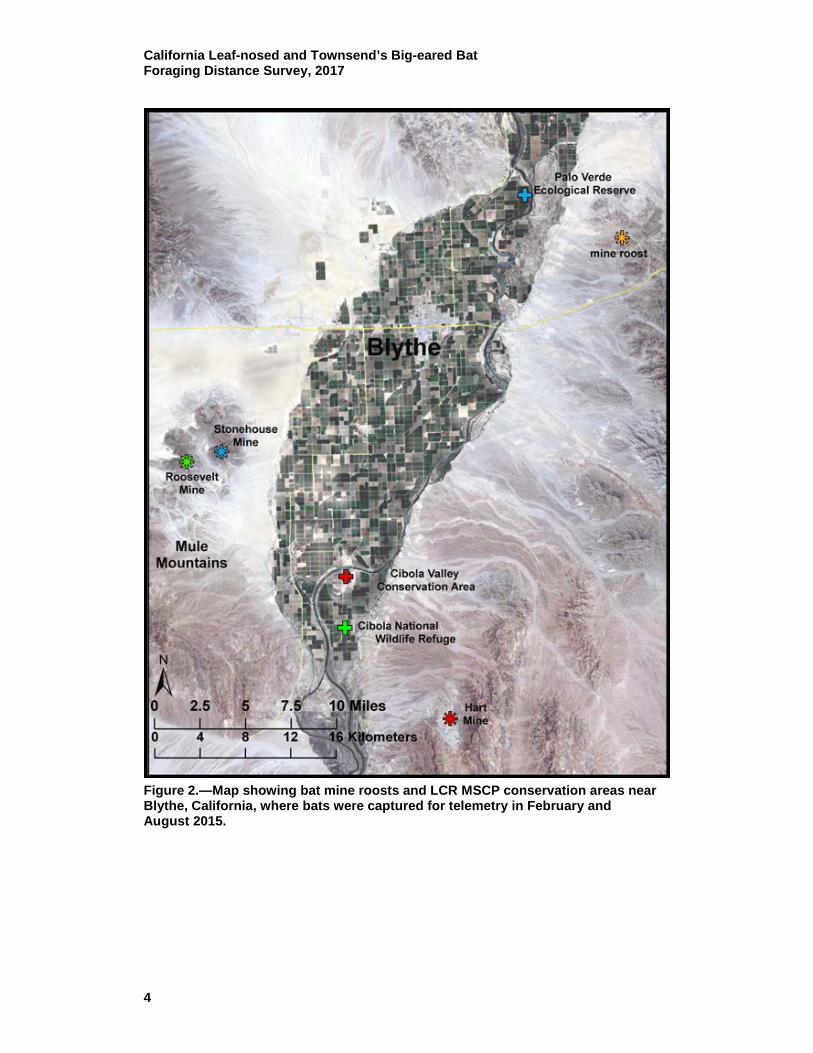
Figure 2.—Map showing bat mine roosts and LCR MSCP conservation areas near Blythe, California, where bats were captured for telemetry in February and August 2015.
California Leaf-nosed and Townsend’s Big-eared Bat Foraging Distance Survey, 2017
5
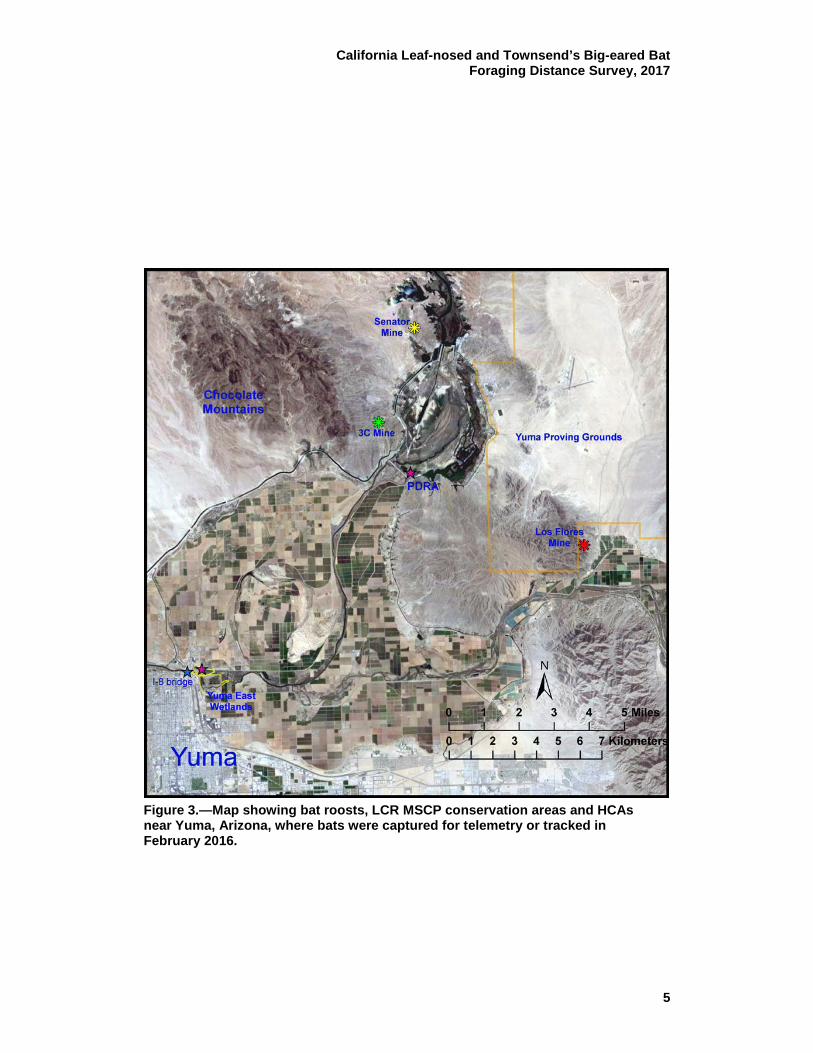
Figure 3.—Map showing bat roosts, LCR MSCP conservation areas and HCAs near Yuma, Arizona, where bats were captured for telemetry or tracked in February 2016.
California Leaf-nosed and Townsend’s Big-eared Bat Foraging Distance Survey, 2017
6
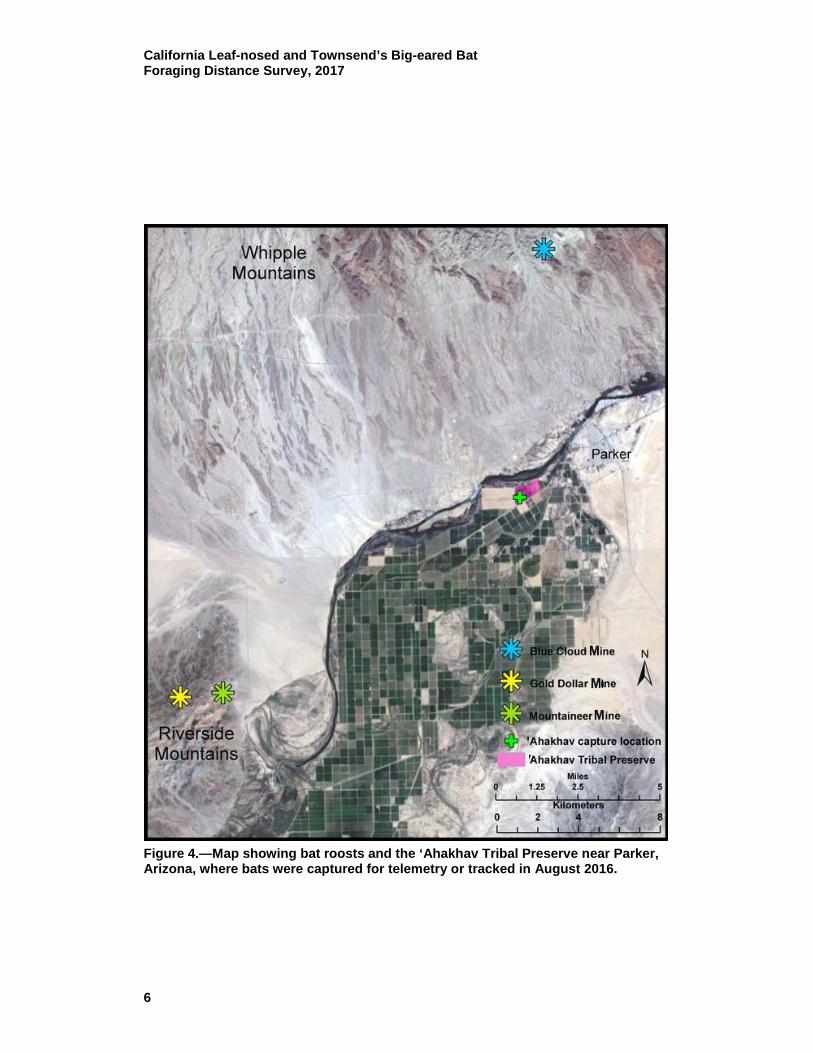
Figure 4.—Map showing bat roosts and the ‘Ahakhav Tribal Preserve near Parker, Arizona, where bats were captured for telemetry or tracked in August 2016.

California Leaf-nosed and Townsend’s Big-eared Bat Foraging Distance Survey, 2017
7
However, the bats commonly groomed the transmitters off in less than 14 days. Each transmitter had a separate frequency between 150 and 151 megahertz. All tagging data were recorded on paper data sheets, and during the February 2015 session additionally recorded in a Trimble Juno using a mobile electronic field form (MEFF). At the beginning of the project, a dedicated relational Access (Microsoft Office 2007) database was created to manage all of the project data. Tagging data were manually entered into a bat tag table that included the transmitter identification, gender, species, identification number, and other relevant notes. During all of the tracking sessions, bats were assigned a number starting with 1 for the first bat tagged, with the series extending through the number of bats tagged during that session. These numbers were assigned sequentially for each field session beginning with “Bat #1” for the first radio-tagged bat in February 2015. In order to track individuals each season in the relational database, a suffix letter was added to each individual each field season (tables 1–4). In the database, the first radio-tagged bat in February 2015 was identified as Bat #1a, and the first bat radio tagged in August 2015 was Bat #1b. This was continued for the 2016 field tacking sessions, with “c” and “d” appended to the bat numbers. When the same individual was recaptured during subsequent tracking seasons, a new radio tag was applied, and the bat number could change. Note that the MEFF data files did not differentiate individual bats and used the sequentially assigned numbers (tables 1–4) from each field session. However, individual California leaf-nosed bats were also identified by band numbers and remain linked in the relational database (tables 1 and 2; e.g., Bat #19a from February 2015 was Bat #20b in August 2015 with band number 6891). Transmitters that detached from the bats while foraging at night and recovered provided a precise location of where the bat was foraging. The locations of transmitters recovered on the surface were recorded using a Trimble Juno 3B Global Positioning System (GPS) Unit with TerraSync Professional and differentially corrected with Pathfinder Office software. Transmitters that were dropped in the mine roosts could only be documented by entry into the mine. The mine entrance was the external GPS point of recovery, as satellite reception is blocked inside the mine itself. At the end of the tracking session, telemetered bats that were recaptured were weighed as an index of health. The color anodized bands (left forearm for females and right for males) allowed easier recognition of the telemetered bats in the mine roost so they could be recaptured for weighing and transmitter removal at the end of the survey. If a bat had lost weight, it was possible that this indicated significant stress during the telemetry session and that this stress may have affected their foraging behavior. Marked body mass changes can be used to identify this potential bias. The foraging range for stressed animals could be less representative of the foraging distance of the California leaf-nosed bat population.
California Leaf-nosed and Townsend’s Big-eared Bat Foraging Distance Survey, 2017
8
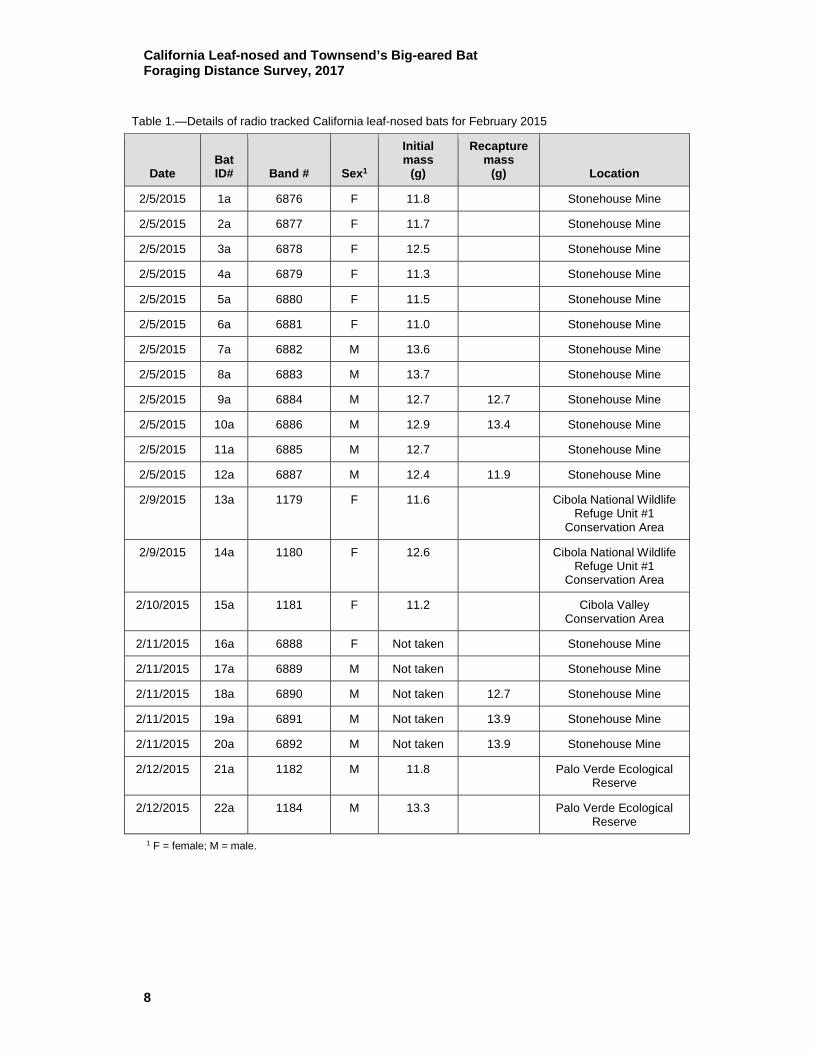
Table 1.—Details of radio tracked California leaf-nosed bats for February 2015
Date Bat ID# Band # Sex1
Initial mass
(g)
Recapture mass
(g) Location
2/5/2015 1a 6876 F 11.8
Stonehouse Mine
2/5/2015 2a 6877 F 11.7
Stonehouse Mine
2/5/2015 3a 6878 F 12.5
Stonehouse Mine
2/5/2015 4a 6879 F 11.3
Stonehouse Mine
2/5/2015 5a 6880 F 11.5
Stonehouse Mine
2/5/2015 6a 6881 F 11.0
Stonehouse Mine
2/5/2015 7a 6882 M 13.6
Stonehouse Mine
2/5/2015 8a 6883 M 13.7
Stonehouse Mine
2/5/2015 9a 6884 M 12.7 12.7 Stonehouse Mine
2/5/2015 10a 6886 M 12.9 13.4 Stonehouse Mine
2/5/2015 11a 6885 M 12.7
Stonehouse Mine
2/5/2015 12a 6887 M 12.4 11.9 Stonehouse Mine
2/9/2015 13a 1179 F 11.6
Cibola National Wildlife Refuge Unit #1
Conservation Area
2/9/2015 14a 1180 F 12.6
Cibola National Wildlife Refuge Unit #1
Conservation Area
2/10/2015 15a 1181 F 11.2
Cibola Valley Conservation Area
2/11/2015 16a 6888 F Not taken
Stonehouse Mine
2/11/2015 17a 6889 M Not taken
Stonehouse Mine
2/11/2015 18a 6890 M Not taken 12.7 Stonehouse Mine
2/11/2015 19a 6891 M Not taken 13.9 Stonehouse Mine
2/11/2015 20a 6892 M Not taken 13.9 Stonehouse Mine
2/12/2015 21a 1182 M 11.8
Palo Verde Ecological Reserve
2/12/2015 22a 1184 M 13.3
Palo Verde Ecological Reserve
1 F = female; M = male.
California Leaf-nosed and Townsend’s Big-eared Bat Foraging Distance Survey, 2017
9
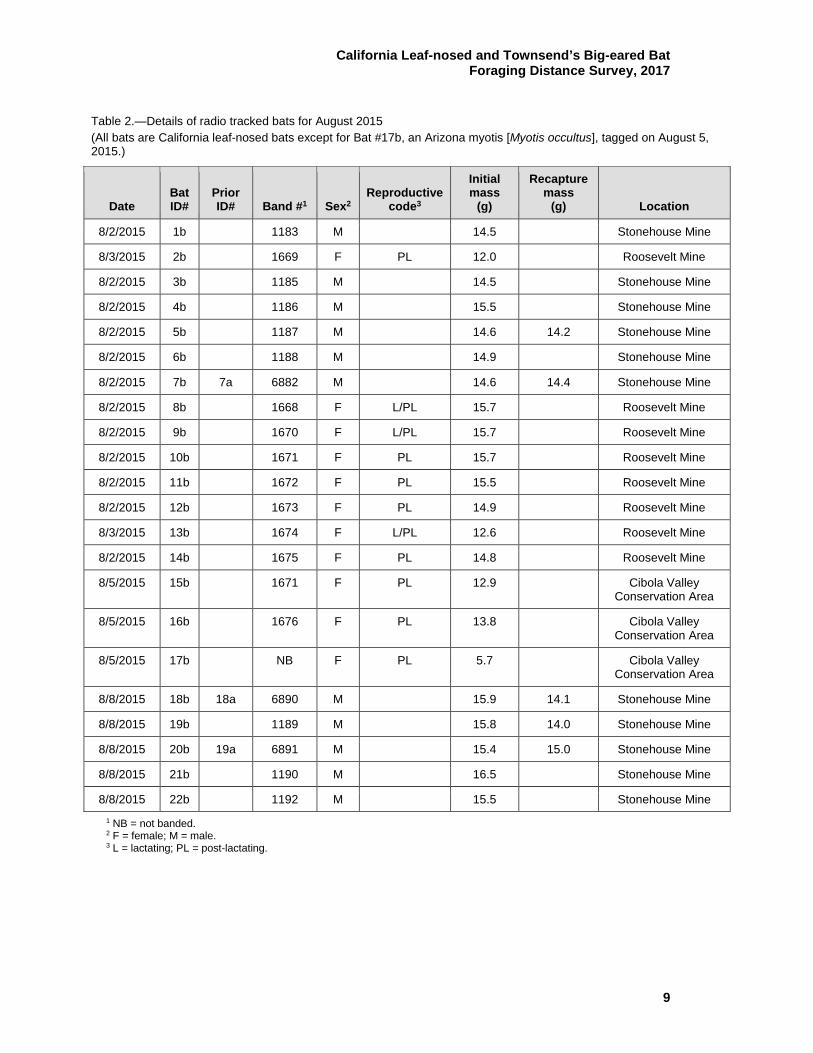
Table 2.—Details of radio tracked bats for August 2015 (All bats are California leaf-nosed bats except for Bat #17b, an Arizona myotis [Myotis occultus], tagged on August 5, 2015.)
Date Bat ID#
Prior ID# Band #1 Sex2
Reproductive code3
Initial mass
(g)
Recapture mass
(g) Location
8/2/2015 1b
1183 M
14.5 Stonehouse Mine
8/3/2015 2b
1669 F PL 12.0 Roosevelt Mine
8/2/2015 3b
1185 M
14.5 Stonehouse Mine
8/2/2015 4b
1186 M
15.5 Stonehouse Mine
8/2/2015 5b
1187 M
14.6 14.2 Stonehouse Mine
8/2/2015 6b
1188 M
14.9 Stonehouse Mine
8/2/2015 7b 7a 6882 M
14.6 14.4 Stonehouse Mine
8/2/2015 8b
1668 F L/PL 15.7 Roosevelt Mine
8/2/2015 9b
1670 F L/PL 15.7 Roosevelt Mine
8/2/2015 10b
1671 F PL 15.7 Roosevelt Mine
8/2/2015 11b
1672 F PL 15.5 Roosevelt Mine
8/2/2015 12b
1673 F PL 14.9 Roosevelt Mine
8/3/2015 13b
1674 F L/PL 12.6 Roosevelt Mine
8/2/2015 14b
1675 F PL 14.8 Roosevelt Mine
8/5/2015 15b
1671 F PL 12.9 Cibola Valley Conservation Area
8/5/2015 16b
1676 F PL 13.8 Cibola Valley Conservation Area
8/5/2015 17b
NB F PL 5.7 Cibola Valley Conservation Area
8/8/2015 18b 18a 6890 M
15.9 14.1 Stonehouse Mine
8/8/2015 19b
1189 M
15.8 14.0 Stonehouse Mine
8/8/2015 20b 19a 6891 M
15.4 15.0 Stonehouse Mine
8/8/2015 21b
1190 M
16.5 Stonehouse Mine
8/8/2015 22b
1192 M
15.5 Stonehouse Mine
1 NB = not banded. 2 F = female; M = male. 3 L = lactating; PL = post-lactating.
California Leaf-nosed and Townsend’s Big-eared Bat Foraging Distance Survey, 2017
10
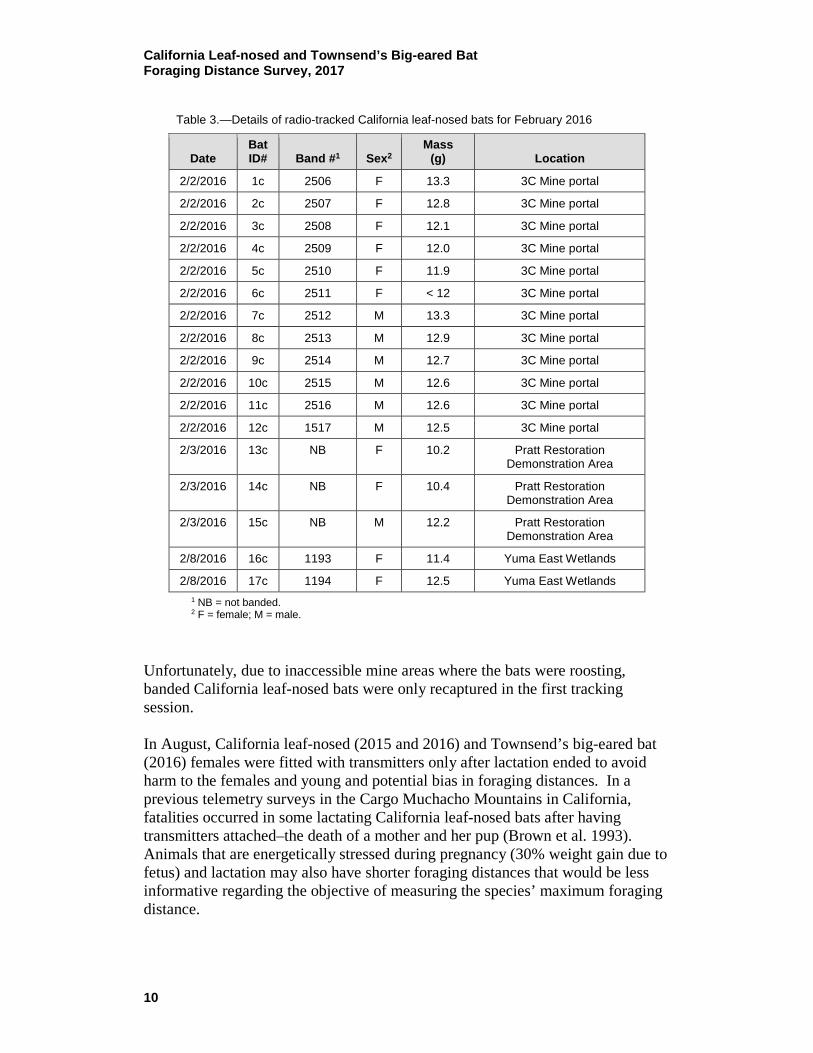
Table 3.—Details of radio-tracked California leaf-nosed bats for February 2016
Date Bat ID# Band #1 Sex2
Mass (g) Location
2/2/2016 1c 2506 F 13.3 3C Mine portal
2/2/2016 2c 2507 F 12.8 3C Mine portal
2/2/2016 3c 2508 F 12.1 3C Mine portal
2/2/2016 4c 2509 F 12.0 3C Mine portal
2/2/2016 5c 2510 F 11.9 3C Mine portal
2/2/2016 6c 2511 F < 12 3C Mine portal
2/2/2016 7c 2512 M 13.3 3C Mine portal
2/2/2016 8c 2513 M 12.9 3C Mine portal
2/2/2016 9c 2514 M 12.7 3C Mine portal
2/2/2016 10c 2515 M 12.6 3C Mine portal
2/2/2016 11c 2516 M 12.6 3C Mine portal
2/2/2016 12c 1517 M 12.5 3C Mine portal
2/3/2016 13c NB F 10.2 Pratt Restoration Demonstration Area
2/3/2016 14c NB F 10.4 Pratt Restoration Demonstration Area
2/3/2016 15c NB M 12.2 Pratt Restoration Demonstration Area
2/8/2016 16c 1193 F 11.4 Yuma East Wetlands
2/8/2016 17c 1194 F 12.5 Yuma East Wetlands
1 NB = not banded. 2 F = female; M = male.
Unfortunately, due to inaccessible mine areas where the bats were roosting, banded California leaf-nosed bats were only recaptured in the first tracking session. In August, California leaf-nosed (2015 and 2016) and Townsend’s big-eared bat (2016) females were fitted with transmitters only after lactation ended to avoid harm to the females and young and potential bias in foraging distances. In a previous telemetry surveys in the Cargo Muchacho Mountains in California, fatalities occurred in some lactating California leaf-nosed bats after having transmitters attached–the death of a mother and her pup (Brown et al. 1993). Animals that are energetically stressed during pregnancy (30% weight gain due to fetus) and lactation may also have shorter foraging distances that would be less informative regarding the objective of measuring the species’ maximum foraging distance.
California Leaf-nosed and Townsend’s Big-eared Bat Foraging Distance Survey, 2017
11
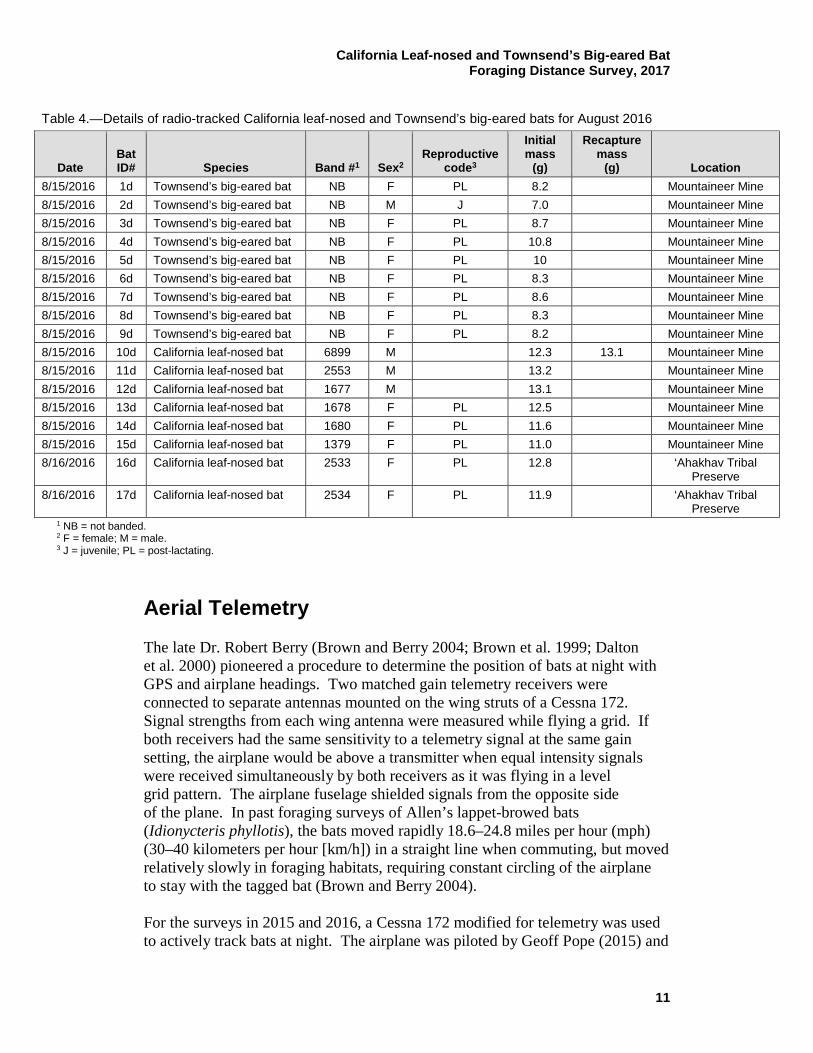
Table 4.—Details of radio-tracked California leaf-nosed and Townsend’s big-eared bats for August 2016
Date Bat ID# Species Band #1 Sex2
Reproductive code3
Initial mass
(g)
Recapture mass
(g) Location 8/15/2016 1d Townsend’s big-eared bat NB F PL 8.2 Mountaineer Mine 8/15/2016 2d Townsend’s big-eared bat NB M J 7.0 Mountaineer Mine 8/15/2016 3d Townsend’s big-eared bat NB F PL 8.7 Mountaineer Mine 8/15/2016 4d Townsend’s big-eared bat NB F PL 10.8 Mountaineer Mine 8/15/2016 5d Townsend’s big-eared bat NB F PL 10 Mountaineer Mine 8/15/2016 6d Townsend’s big-eared bat NB F PL 8.3 Mountaineer Mine 8/15/2016 7d Townsend’s big-eared bat NB F PL 8.6 Mountaineer Mine 8/15/2016 8d Townsend’s big-eared bat NB F PL 8.3 Mountaineer Mine 8/15/2016 9d Townsend’s big-eared bat NB F PL 8.2 Mountaineer Mine 8/15/2016 10d California leaf-nosed bat 6899 M
12.3 13.1 Mountaineer Mine
8/15/2016 11d California leaf-nosed bat 2553 M
13.2 Mountaineer Mine 8/15/2016 12d California leaf-nosed bat 1677 M
13.1 Mountaineer Mine
8/15/2016 13d California leaf-nosed bat 1678 F PL 12.5 Mountaineer Mine 8/15/2016 14d California leaf-nosed bat 1680 F PL 11.6 Mountaineer Mine 8/15/2016 15d California leaf-nosed bat 1379 F PL 11.0 Mountaineer Mine 8/16/2016 16d California leaf-nosed bat 2533 F PL 12.8 ‘Ahakhav Tribal
Preserve 8/16/2016 17d California leaf-nosed bat 2534 F PL 11.9 ‘Ahakhav Tribal
Preserve 1 NB = not banded. 2 F = female; M = male. 3 J = juvenile; PL = post-lactating.
Aerial Telemetry The late Dr. Robert Berry (Brown and Berry 2004; Brown et al. 1999; Dalton et al. 2000) pioneered a procedure to determine the position of bats at night with GPS and airplane headings. Two matched gain telemetry receivers were connected to separate antennas mounted on the wing struts of a Cessna 172. Signal strengths from each wing antenna were measured while flying a grid. If both receivers had the same sensitivity to a telemetry signal at the same gain setting, the airplane would be above a transmitter when equal intensity signals were received simultaneously by both receivers as it was flying in a level grid pattern. The airplane fuselage shielded signals from the opposite side of the plane. In past foraging surveys of Allen’s lappet-browed bats (Idionycteris phyllotis), the bats moved rapidly 18.6–24.8 miles per hour (mph) (30–40 kilometers per hour [km/h]) in a straight line when commuting, but moved relatively slowly in foraging habitats, requiring constant circling of the airplane to stay with the tagged bat (Brown and Berry 2004). For the surveys in 2015 and 2016, a Cessna 172 modified for telemetry was used to actively track bats at night. The airplane was piloted by Geoff Pope (2015) and

California Leaf-nosed and Townsend’s Big-eared Bat Foraging Distance Survey, 2017
12
Glen Enzfelder (2016), with Dr. Patricia Brown as co-pilot, telemetry equipment operator, and data recorder. Telemetry signals could be detected from the air as far away as 18.6 miles (30 km) in the absence of blocking terrain. The advantage of an airplane over the ground trackers is that an airplane can move rapidly over areas without roads and get clear signals in mountainous terrain, which could block signal reception from the ground. An airplane can also travel over private land, Indian reservations, and over military-restricted areas, with permission. For the February 2015 survey, the GPS position and relative signal strength of the transmitters were logged in the memory of two scanning Lotek SRX 800 GPS receivers, one linked to each wing antenna. Very limited adjustment of settings was possible in flight; therefore, while still on the ground, the receiver sensitivity, scan intervals, frequencies, and other parameters for bat transmitter signal recognition were programmed via USB cable to a computer with proprietary Lotek software (SRX800 Host V1.1.1385.3). After landing, files of logged presumptive transmitter GPS positions and other data were downloaded via USB to a computer from onboard receiver memory after each flight and subsequently emailed to the data analyst (Bruce Miller). On receipt, Lotek data files were imported into the Access database. As the Lotek continually recorded all bats detected during the same minute timeframe as the airplane was moving, rather than selecting a single point out of the often dozens of locations recorded for a single bat, all records for each bat recorded during a single minute were averaged. This produced a single location estimate for each bat by each minute. These estimated points were then buffered to the 250-meter diameter of uncertainty. While in flight, the airplane’s GPS position and heading were displayed in real time and also logged on an iPad in the cockpit. The speakers in the airplane headsets matched each ear to the receiver on the same side of the airplane, providing auditory information to guide the pilot. The headsets also allowed communication between pilot and co-pilot, and the pilot and other aircraft in the vicinity. Real time communication between the air and ground tracking crews was conducted by Dr. Patricia Brown using hand-held long-range Motorola consumer two-way radios. This guided the ground-based team to adjust positions for maximum signal detection of bats on the ground. For the final session in August 2016, text messaging via smart phones became the primary communication between the ground crews and the aircraft, with the two-way radios as backup. Unfortunately, during the February 2015 tracking session, it was determined that the two Lotek SRX 800 receivers were not gain matched as requested (and as described when shipped), so the initial plan of flying a grid with the airplane level, and comparing signals logged from each wing’s antenna, had to be substantially modified during that session. In August 2015 and subsequent sessions, the Lotek receivers were not used, as they proved to be less reliable and not easily programmable in flight when compared to the Communications
California Leaf-nosed and Townsend’s Big-eared Bat Foraging Distance Survey, 2017
13
Specialists R 1000 receiver, which were used by the ground trackers. The output from the two wing antennas was cabled via a Telonics switch box to the Communications Specialists R 1000 receiver, allowing signals to be heard from both antennas simultaneously, or isolated to the left or right antenna. After initial auditory detection of a transmitter signal, the bat’s location was narrowed down by using the switch to toggle between both antennas to clarify the bat’s direction, and the airplane was flown toward the signal location. The pilot would log a GPS position and time as a waypoint while flying in a tight circle over the bat, with the strongest signal coming from one side of the airplane. The bat ID number (corresponding to a frequency), detection time, and short-hand notes were entered on a data sheet by the co-pilot (Dr. Patricia Brown) while flying with only red light in the cockpit (so as not to disturb the pilot’s night vision). Nightly flight tracks were recorded as a GPS exchange format (GPX) file using flight software on an iPad. The GPX files used Easting and Northing (Universal Transverse Mercator [UTM] zone 11) coordinates with WGS84 as the base datum and set to the UTC -4 time zone. All times were corrected to UTC -7 to match local times, and the WGS84 base datum was converted to North American 1983 Datum (NAD83) using GPS Utility (Murphy 2016) licensed to Bruce Miller. After conversion, nightly flight track files were imported to the database and also exported from GPS Utility as point shapefiles for use in the Geographic Information System (GIS) with the corresponding date and time for all X-Y coordinates recorded during the flight (figure 5). Waypoint files from the hand-held Garmin GPS provided numbered locations to transmitter frequencies (i.e., bats recorded on the data sheet). The following morning the pilot combined these waypoint locations with bat ID detections from the co-pilot, linking each individual bat to a specific location with X-Y coordinates, date, and time. He then compiled the nightly air survey data in an Excel spreadsheet and forwarded them to analyst Bruce Miller by email for backup and analyses. Upon receipt, they were checked for possible errors and then imported into the Access database in an aerial survey table. Neither flight nor bat detection waypoint data were entered into a Trimble Juno. Aerial tracking would begin the night after the transmitters were attached to the bats and continue for 2 weeks. Flights averaged about 4.5 hours in duration, varying with fuel consumption and pilot fatigue. Safety and weather were the prime considerations for how many hours night flights were conducted. Hazardous weather precluded nightly flying during some of the tracking sessions, especially in August 2016; therefore, there are a few nights when only ground tracker data were available. At the beginning of each night, the airplane was airborne in the vicinity of the mine roost of the telemetered bats 30 minutes after sunset. No signals were received until the bats emerged from underground roosts. The exiting bats were then tracked as they dispersed to forage. For most of the flight time, the receivers scanned between transmitter frequencies. However,

California Leaf-nosed and Townsend’s Big-eared Bat Foraging Distance Survey, 2017
14
Figure 5.—Airplane GPS track, February 12, 2015. The airplane circled early evening over the Hart Mine to track bat emergence and travel to the Cibola National Wildlife Refuge Unit #1 Conservation Area, then moved to monitor Stonehouse Mine bats foraging in agricultural areas. The airplane then returned to Blythe Airport to refuel and circled over the Palo Verde Ecological Reserve for telemetered bat release and initial tracking to locate the day roost in the Dome Rock Mountains.
California Leaf-nosed and Townsend’s Big-eared Bat Foraging Distance Survey, 2017
15
when a signal was detected, that frequency was locked, and a grid flown to more accurately document the bat’s position with signals logging simultaneously on both the left and right antennas. When bats were captured in LCR MSCP conservation areas or HCAs, the airplane circled the capture area until the bat was released , and then tracked the bat back to the roost. On subsequent evenings, the airplane was airborne in the vicinity of the new roost, and would log when and where the signal was first detected, and the pilot could then track the tagged bat back to the foraging area (that was usually where the bat had been captured [see figure 5]). The use of an airplane was especially valuable in tracking bats that were mist netted in foraging areas when the ground crew was concentrating on monitoring the bats that had been tagged from the mine roosts. When bats switched roosts from the mine where they had been initially tagged, the airplane could traverse wilderness areas to locate the new roosts. Ground-based Telemetry A minimum of three ground-based tracking teams consisting of one or two persons were used, with Kei Yasuda as the lead coordinator for the first three tracking sessions. Occasionally, it was necessary for an experienced tracker to work solo, but usually a team of two trackers was deployed in order to cover all the details of collecting, communicating, and recording the data. Each team was equipped with a Communications Specialists R 1000 scanning receiver (individually pre-programmed for best detection of the activated bat transmitter frequencies), directional 3- or 5-element Yagi antenna, a compass, a hand-held radio, a Trimble Juno data logger (if available), and paper data forms. All compasses used were adjusted to account for magnetic north declination at the beginning of the project. All Juno GPS units were pre-set to record locations as UTM zone 11 using NAD83. Teams without Juno units used other hand-held GPS units. While most GPS units were set NAD83 and recorded locations as Easting and Northing (UTM zone 11) coordinates, several may have had the datum set to the default WGS84. Several teams recorded locations as latitude and longitude either as degrees, minutes, and seconds or as decimal degrees. In all cases, observer locations not recorded with a Juno GPS on the hard-copy paper data sheets were transformed to NAD83 with Easting and Northing (UTM zone 11) coordinates prior to being entered into the master database and subsequent derivation of estimated bat locations. The base datum used was not recorded on the data sheets. Ground tracking data were always recorded using paper data sheets, with area weather data logged by at least one team each night. Usually, a team of two trackers was positioned on high ground near the roost(s) at dusk to record the flight direction (azimuth) and time of each bat emerging from the roost. Other teams were placed in key high points near foraging habitats;

California Leaf-nosed and Townsend’s Big-eared Bat Foraging Distance Survey, 2017
16
these positions might change between nights depending on the areas that the bats had used the previous night or if the airplane team detected the bats in different locations. One or more “roving” teams in 4-wheel-drive vehicles would move to other locations to improve triangulation of a signal, to explore microhabitat use by the bats, and to locate night roosts. All teams were usually in radio contact with each other as well as the airplane. Ground trackers used the scanning radio receiver and ear phones to listen for transmitter frequencies assigned to each bat, while moving the directional Yagi antennas in a 360° arc from their locations. When a signal was detected, the observer would stop scanning and determine the most precise signal location by turning down the gain on the receiver so the signal was detected on a narrow arc, and then used a compass to record the direction (azimuth) of the center of the arc. The bat ID, observer position, and compass heading was communicated to all trackers, who then locked their receivers on that bat ID frequency, and the azimuth recorded of the maximum signal strength by the teams that could detect the signal. For each detection event, observers would record the time, bat ID, signal strength, and the estimated azimuth of the signal from their GPS position. If possible, it was also noted if the signal was fluctuating in amplitude (flying bat) or steady (roosting bat or dropped transmitter). The closer the time between different trackers’ bearing records, along with their precision in determining the azimuth, the greater the accuracy in calculating the position of the bat. When the bats flew out of range of the ground-based trackers, the airplane could direct mobile teams to the foraging areas, unless terrain or landownership precluded access. Transmitter beacons (Holohil BC-2A) were placed near the mine roost(s) and at the closest LCR MSCP conservation areas to test the equipment function and reception accuracy for air and ground crews. A complete catalog of all ground tracking data, along with metadata, was delivered to the Bureau of Reclamation (Reclamation). In some cases, MEFFs using TerraSync software on Trimble Juno units were used to record ground tracking data. During the February 2015 session, there were more tracking teams than Trimble units available. The data collected on paper was determined to be more accurate than the electronic data, as there was a greater potential for missing or recording incorrect data due to the time required to enter the data in the MEFFs. Due to the uniqueness in collecting telemetry data of moving, foraging bats at night, the method of using MEFFs had to be modified in order to ensure data were collected as quickly and accurately as possible. During February 2015, the significant time delay of the electronic data entry with the ground tracking data were often evident when the MEFF data were subsequently exported as a single Access database. A delay of digital entry of several minutes or more into the Juno logger versus the rapid manual entry on the paper forms meant that many estimated locations for a bat would not be within a tight timeframe between detections recorded by air and other ground trackers. The result would be less robust location estimates if detections from various ground tracking teams were not recorded at the same time. Since some ground
California Leaf-nosed and Townsend’s Big-eared Bat Foraging Distance Survey, 2017
17
tracking teams did not have Juno units in order to analyze the data consistently, only the times of detections recorded on the original data sheets were used and the times documented on the Trimble unit were ignored. These issues were alleviated in the August 2015 and subsequent sessions. It was determined that the most expedient use of the Junos was as hand-held GPS units to record the observer team locations. Bat detection data were then manually transferred from the paper data sheets to the MEFF using the Trimble GPS Pathfinder Office software prior to the teams being redeployed to the field the next evening. Remote Telemetry Receivers Two unattended/passive battery-powered telemetry receiver/data loggers were used at the roost, LCR MSCP conservation areas, and HCAs where bats were captured for telemetry to record when tagged bats were active in the area (exiting or entering a mine, commuting, or foraging). These were prepared by Titley Scientific LLC (Columbia, Missouri) and consisted of a sealed Pelican polymer case containing a Titley Scientific Australis 26k telemetry receiver, a Titley Scientific RF data logger, and a CN101A weekly timer with relay. Cabling allowed for attaching inside the case a 12-volt, 7-ampere-hour, sealed lead acid battery that was sufficient for 1.5 nights of operation (batteries exchanged daily). A sealed BNC connector on the case exterior was connected to a cable for an external antenna. Both MFJ Enterprises 1728B 2-meter magnetic mount omnidirectional whip antennas mounted on a painted sheet steel rectangle and collapsible quarter wave 2-meter antennas (constructed by Tony Messina, Las Vegas, Nevada) mounted on a camera tripod were used. The latter design has nearly hemispherical rather than approximately planar reception and thus could enhance detection of telemetered bats flying above the antenna. At some sites, the antenna cable was routed through flexible aluminum conduit to lessen the risk of rodent damage. The logger was programmed via USB cable using the provided Windows application (Titley Scientific RF Data Logger Configuration Tool) by individually entering the frequencies to be monitored, the duration (seconds) of monitoring for each, and the number of recognized pulses required for logging a detection. Pulse recognition depends on individual receiver noise floor, as well as local radio frequency noise, and is based on two-user entered pulse intensity settings. Receiver gain is separately set manually by the user. The timer switch is manually configured to provide power to activate the receiver and logger before sunset and to turn off after sunrise. The controller logger steps the receiver through the transmitter frequencies in the sequence entered in software and monitors the signal for a selected interval (dwell time). Signal strength and pulse parameters (pulses per minute and pulse duration) determine
California Leaf-nosed and Townsend’s Big-eared Bat Foraging Distance Survey, 2017
18
whether a transmitter (or other radio frequency signal source) is logged to a removable micro secure digital (SD) card. The transmitter pulse rate and pulse duration are approximately fixed (i.e., some temperature variation in pulse rate) and are parameters provided for each transmitter by the manufacturer, so the pulse rate is a key criterion for evaluating logger entry validity in data analysis. Both the local radio frequency noise floor and narrow band (sometimes episodic) sources of higher intensity radio frequency noise (e.g., hilltop transmitter installations) may vary considerably among sites and times and affect detection of individual bat transmitter frequencies. Radio frequency noise from poorly shielded LED headlamp circuits used by project participants near a logger antenna yielded recognizably spurious event logs. Logger data recovery (in somewhat different formats) is possible either via USB cable using the Titley Scientific RF Data Logger Configuration Tool on a field computer or by exchanging micro SD cards in the field and reading files from the card later. Logger reprogramming onsite to adjust to changing numbers and frequencies of transmitters required a field computer. During each tracking session, usually one unattended logging receiver was placed close to the mine portal where the bats were tagged to detect the temporal pattern of roost exit and entry for all tagged bats that visit the site (table 5). The logged data could provide a daily diurnal indication of which telemetered bats were likely to emerge at that site the following evening, though this required a daily site visit to download the log file. If a bat was detected entering the mine at dawn and was not logged at emergence the next evening, then it was possible that the transmitter was dropped in the mine. However, logger evaluation of each frequency takes several seconds, and if one or more tagged bats exited while the receiver was scanning another frequency, those bats would not be logged. This uncertainty is also inherent is the scanning receivers of the ground and air tracking crews, and also occurs when a receiver is manually paused at a single frequency to obtain a bat’s bearing or position (i.e., no other frequencies are received). A different source of uncertainty is that the Stonehouse and Mountaineer Mines have several well-separated portals that allow bat entry and exit, and only one logger was available for roost monitoring. The 3C Mine has a single portal within a restrictive decline, and that location was the most effective for logging entering and exiting bats. Loggers were also placed in LCR MSCP conservation areas and HCAs where bats were captured and tagged while foraging. While the geographic scale of the conservation areas and HCAs are much larger than the effective signal detection volume of the single, static, omnidirectional antennas, some information could be acquired on presence of the telemetered bats in the area without requiring a ground-based telemetry team to be onsite through the night.

California Leaf-nosed and Townsend’s Big-eared Bat Foraging Distance Survey, 2017
19
Table 5.—Locations and duration of deployment of telemetry data loggers, 2015 and 2016
Telemetry session
Serial # Site Start End Nights
February 2015
747 Stonehouse Mine ridge 2/6/2015 2/21/2015 15 766 Stonehouse Mine lower portal 2/7/2015 2/9/2015 3 766 Cibola National Wildlife Refuge Unit #1
Conservation Area 2/10/2015 2/11/2015 2
766 Palo Verde Ecological Reserve 2/12/2015 2/18/2015 7 766 Cibola National Wildlife Refuge Unit #1
Conservation Area 2/19/2015 2/24/2015 6
August 2015 766 Stonehouse Mine ridge 8/11/2015 8/19/2015 9 747 Cibola Valley Conservation Area 8/12/2015 8/21/2015 10
February 2016 747 3C Mine portal 2/3/2016 2/18/2016 16 766 Pratt Restoration Demonstration Area 2/2/2016 2/16/2016 15
August 2016 747 Mountaineer Mine adit portal 8/21/2016 8/29/2016 9 Ideally, the equipment should be placed in the potential flight path of a bat in openings between vegetation; this was very effective for logging bats in February and August 2015 when placed close to the mist-netting sites. However, when the logger enclosure and antenna are positioned on open ground, they are difficult to conceal. Concern about logger loss or vandalism at mines (e.g., Stonehouse Mine) or LCR MSCP conservation areas and HCAs (e.g., Pratt Restoration Demonstration Area [PRDA]) (a.k.a. Betty’s Kitchen) with evident visitor vehicle or foot traffic lead to placements that were more secure by vegetation shielding or isolation, but the loggers were consequently less effective for bat detection. At the Stonehouse Mine, there was recreational human traffic at the gated adit portal where bats were captured for tagging. Installing the logger inside the locked angle iron gate out of reach would have required at least 30 additional minutes to open and close the heavy gate each evening. Instead, this logger was redeployed at a LCR MSCP conservation area (initially the Cibola National Wildlife Refuge Unit #1 Conservation Area [Cibola NWR Unit #1), then the Palo Verde Ecological Reserve [PVER], then back to Cibola NWR Unit #1; see table 5). The second logger was placed on a steep narrow ridge below the several portals of the Stonehouse Mine, with the hypothesis that most of the emerging and returning bats would follow the terrain and likely pass near this site. While there was vehicle and foot traffic at Cibola NWR Unit #1 Nature Trail, the Cibola Valley Conservation Area (CVCA), and PVER, bats actively foraged along vehicle corridors in the developed plantings and it was possible to fairly effectively conceal the logger enclosure and a deployed antenna in the planting block margins. The PRDA presented a more difficult concealment problem, as human activity both on road corridors and in the planting blocks was extensive and the vegetation structure was considerably more open. The logger was placed at a less-developed margin in a planting block well away from the vehicle corridor where the bats had been captured.
California Leaf-nosed and Townsend’s Big-eared Bat Foraging Distance Survey, 2017
20
Netting at the ‘Ahakhav Tribal Preserve (AKTP) yielded two telemetered California leaf-nosed bats that were tracked primarily by air. The nightly battery exchange and data downloads to make use of a passive logger at the AKTP was judged logistically infeasible. Data Analysis and Management Radio tracking flying animals differs from logging stationary transmitter locations where post-processing differential corrections are useful to provide greater location accuracy. Differential correction was not possible for air survey data or ground observer locations that were not collected using a Juno GPS. While all ground tracking Trimble Juno locations were differentially corrected as per Reclamation guidelines for 2015 field sessions, the only utility of this was to improve positional accuracy for roost sites and locations of dropped/shed transmitters. Post-processing correction was not used for any location observer points during the 2016 tracking sessions. Since the GPS waypoint coordinates of the locations of the trackers on the ground or in the air were not the location of the target animals, such correction of location accuracy was not warranted. Radio tracking provides an estimate of locations of transmitters that are affixed to the animals. Ideally, multiple ground tracking teams collect simultaneous information on the direction and strength of these signals. The comparison of signal strength also requires that each receiver is set to the same gain and that the hearing sensitivity of all trackers is equal. When the compass directions (azimuths) of these detected signals intersect, either by bisection or triangulation, the location point of the animal of interest at a given time may be estimated. This project combined data from multiple ground tracking teams, stationary radio signal loggers, and an air tracking team. In relatively few instances, direct intersections of ground or air tracking signals were recorded during a relatively close timeframe (within minutes). While it was initially assumed the software package LOAS (Ecological Software Solutions, LLC 2015) would be useful for deriving bat locations and convex polygon ranges based on ground observer data (primarily intersecting azimuth lines of detection), there were very few actual intersecting location estimates from data recorded within the same timeframe. Based on the February 2015 field data and the lack of multiple signal intersections, it was clear that it would not be possible to establish location estimates of bats using LOAS. Other possible alternatives evaluated included the R (R Core Team 2016) adehabitat, adehabitatLT, adehabitatHR (Calenge 2006), and AniMov (Fleming et al. 2014) packages. With the varying types of data collected during this project, none of these were appropriate for deriving estimated locations to calculate foraging distances or estimate bat ranges.

California Leaf-nosed and Townsend’s Big-eared Bat Foraging Distance Survey, 2017
21
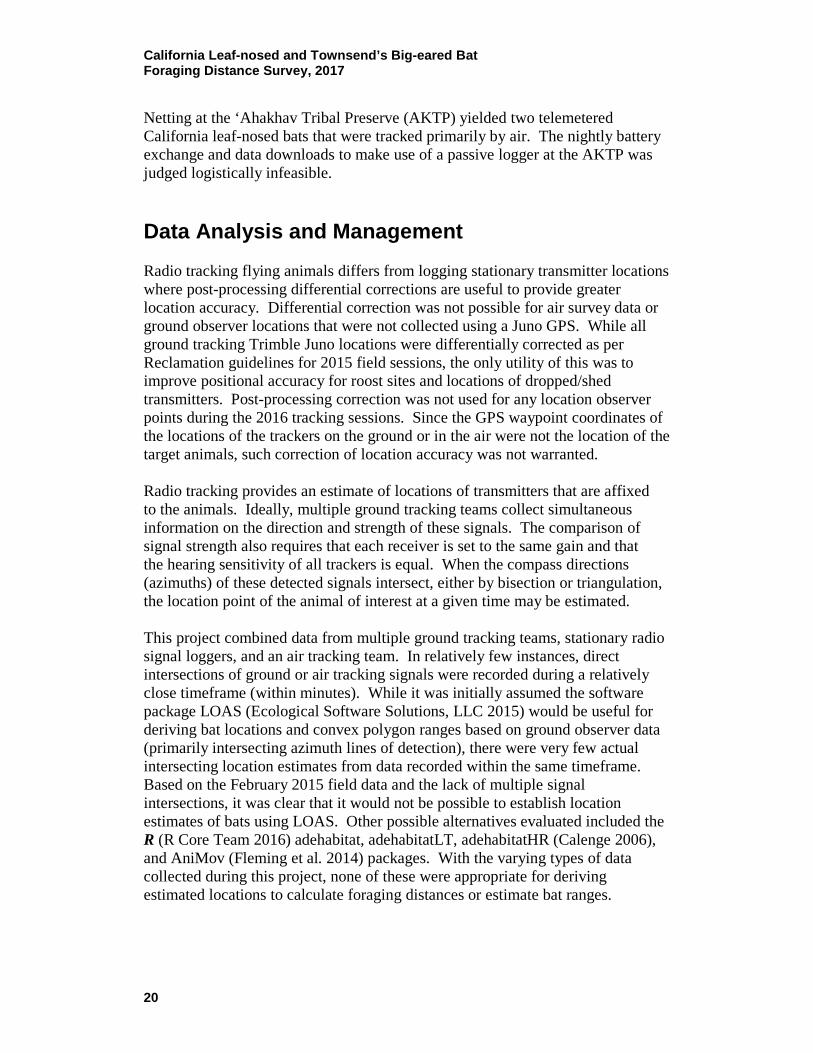
Given the unprecedented wealth of data collected from multiple tracking sources (ground, air, and logging stations), a novel approach to estimating the locations of bats was developed to fully use all of the tracking data. With data from four geographic areas, multiple seasons, and multiple years, it was critical to maximize and integrate the data to the fullest. This approach developed new spatially explicit estimated location data in GIS ArcGIS Desktop version 10.2.2 (Environmental Systems Research Institute [ESRI] 2014) with relevant ESRI extensions from all collected data sources. Details on the derivation of estimated locations and related analyses follow, noting other related management and analytical tools for spatial data. All spatial data used were compiled in a single GIS project, including an ArcGIS geodatabase, as point, line, and polygon shapefiles with relevant metadata embedded. All spatial data were standardized to NAD83 and projected using Easting and Northing (UTM zone 11) coordinates covering the LCR project survey area. All field and derived data were stored and managed in the database. Copies of both are being provided to the LCR MSCP, Reclamation, upon completion of the project. The level of radio tracking detection uncertainty is widely discussed in the literature. Bartolommeia et al. (2012) found no difference in tracking accuracy between expert and non-expert trackers and showed that the mean angular error was 12.6°, indicating that data from all trackers could be combined. Based on discussions of the level of uncertainty during the initial field session (February 2015) and extensive experience in radio tracking bats by the principal trackers the zones of uncertainty from 5 to 10° and estimated unobstructed line of sight 5,000-meter signal detection were agreed to be reasonable estimates and used for this project. As discussed above, the commonly employed method for obtaining locations of animals in the field is triangulation, in which observers record the azimuth to the transmitter from several known points and assume that their intersection indicates the animal’s location. However, this technique provides only an estimate of the animal’s true position because locations obtained by radio triangulation are affected by bias and sampling errors (Amelon et al. 2009; Fuller et al. 2005; Millspaugh and Marzluff 2001). Amelon et al. (2009) also discuss transmitter location accuracy from aerial surveys and noted a mean horizontal error of ±275 meters for coyote (Canis latrans) carcasses that were in fixed locations. Given that the range of uncertainty noted above for ground tracking data increases as the distance between the observer and the bat increases, so does the potential uncertainty of an estimated bat location (figure 6). For example, at 5,000 meters from a stationary ground tracking location, a single 10° cone of uncertainty from the receiver compass azimuth will result in an uncertainty of 892 meters across at the target terminus. This level of uncertainty was far greater than the GPS ±3 to
California Leaf-nosed and Townsend’s Big-eared Bat Foraging Distance Survey, 2017
22
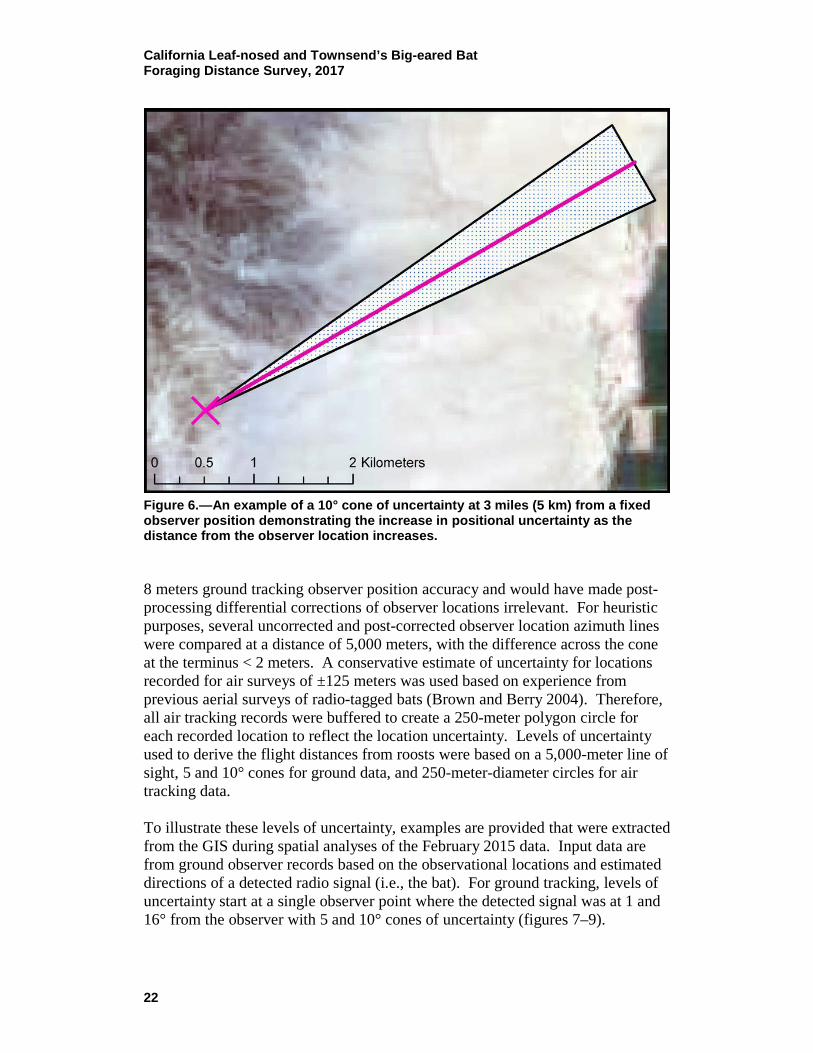
Figure 6.—An example of a 10° cone of uncertainty at 3 miles (5 km) from a fixed observer position demonstrating the increase in positional uncertainty as the distance from the observer location increases. 8 meters ground tracking observer position accuracy and would have made post-processing differential corrections of observer locations irrelevant. For heuristic purposes, several uncorrected and post-corrected observer location azimuth lines were compared at a distance of 5,000 meters, with the difference across the cone at the terminus < 2 meters. A conservative estimate of uncertainty for locations recorded for air surveys of ±125 meters was used based on experience from previous aerial surveys of radio-tagged bats (Brown and Berry 2004). Therefore, all air tracking records were buffered to create a 250-meter polygon circle for each recorded location to reflect the location uncertainty. Levels of uncertainty used to derive the flight distances from roosts were based on a 5,000-meter line of sight, 5 and 10° cones for ground data, and 250-meter-diameter circles for air tracking data. To illustrate these levels of uncertainty, examples are provided that were extracted from the GIS during spatial analyses of the February 2015 data. Input data are from ground observer records based on the observational locations and estimated directions of a detected radio signal (i.e., the bat). For ground tracking, levels of uncertainty start at a single observer point where the detected signal was at 1 and 16° from the observer with 5 and 10° cones of uncertainty (figures 7–9).
California Leaf-nosed and Townsend’s Big-eared Bat Foraging Distance Survey, 2017
23
Figure 7.—Example of a single ground tracker observer location in relationship to the Stonehouse Mine (the label on the observer location is the GPS file name).
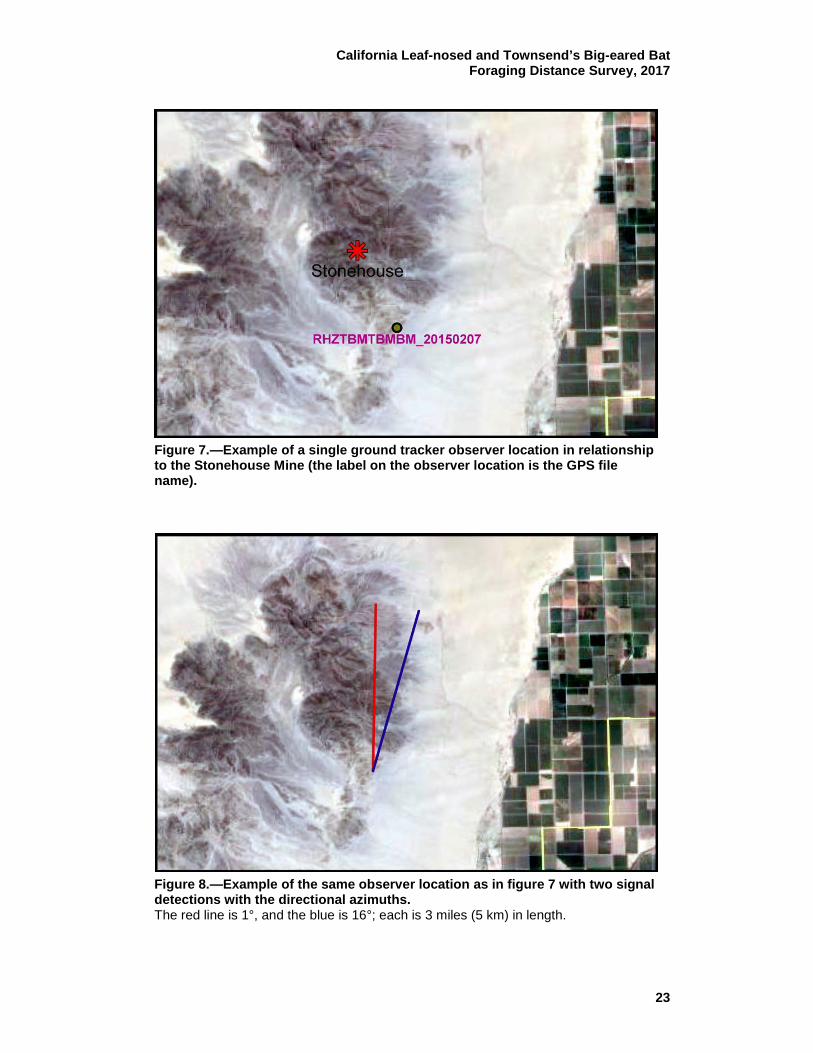
Figure 8.—Example of the same observer location as in figure 7 with two signal detections with the directional azimuths. The red line is 1°, and the blue is 16°; each is 3 miles (5 km) in length.
California Leaf-nosed and Townsend’s Big-eared Bat Foraging Distance Survey, 2017
24
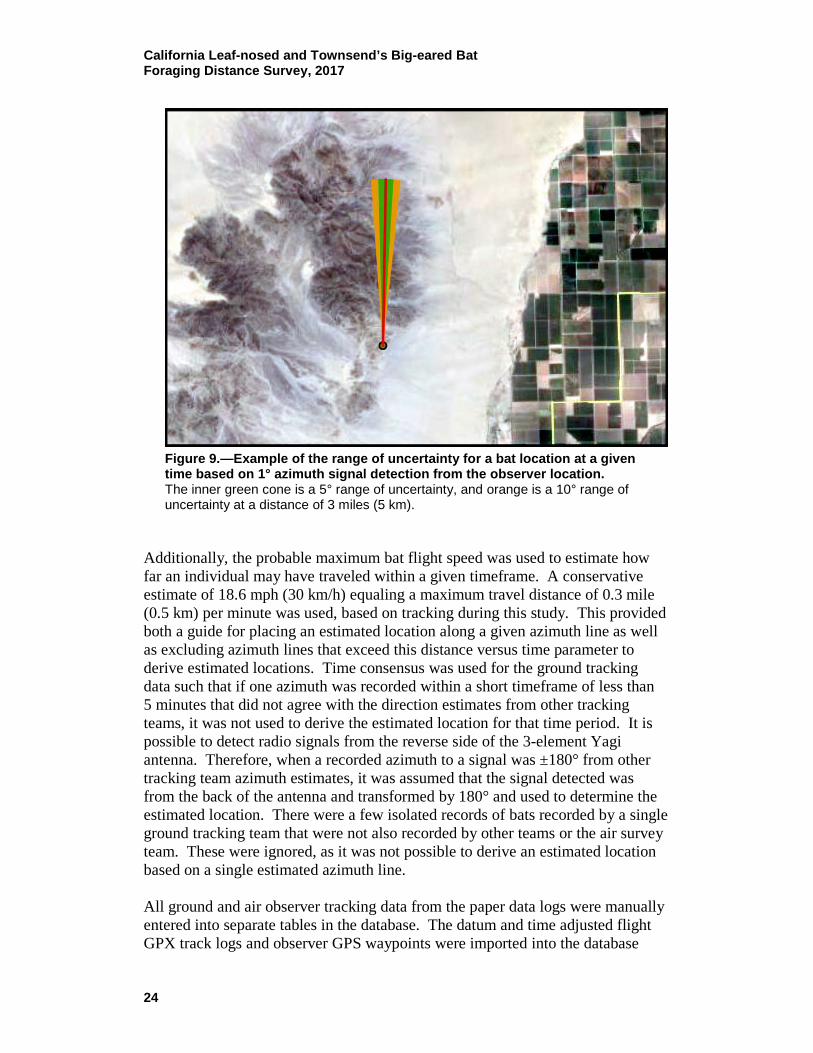
Figure 9.—Example of the range of uncertainty for a bat location at a given time based on 1° azimuth signal detection from the observer location. The inner green cone is a 5° range of uncertainty, and orange is a 10° range of uncertainty at a distance of 3 miles (5 km).
Additionally, the probable maximum bat flight speed was used to estimate how far an individual may have traveled within a given timeframe. A conservative estimate of 18.6 mph (30 km/h) equaling a maximum travel distance of 0.3 mile (0.5 km) per minute was used, based on tracking during this study. This provided both a guide for placing an estimated location along a given azimuth line as well as excluding azimuth lines that exceed this distance versus time parameter to derive estimated locations. Time consensus was used for the ground tracking data such that if one azimuth was recorded within a short timeframe of less than 5 minutes that did not agree with the direction estimates from other tracking teams, it was not used to derive the estimated location for that time period. It is possible to detect radio signals from the reverse side of the 3-element Yagi antenna. Therefore, when a recorded azimuth to a signal was ±180° from other tracking team azimuth estimates, it was assumed that the signal detected was from the back of the antenna and transformed by 180° and used to determine the estimated location. There were a few isolated records of bats recorded by a single ground tracking team that were not also recorded by other teams or the air survey team. These were ignored, as it was not possible to derive an estimated location based on a single estimated azimuth line. All ground and air observer tracking data from the paper data logs were manually entered into separate tables in the database. The datum and time adjusted flight GPX track logs and observer GPS waypoints were imported into the database

California Leaf-nosed and Townsend’s Big-eared Bat Foraging Distance Survey, 2017
25
track log table. Data files from the Lotek data loggers during February 2015 were also imported and relationally linked. Being that many Lotek records of detected bats were recorded during the same minute while the airplane was moving, it was not prudent to randomly select a single estimated location from potentially a dozen or more points for a given bat in order to match ground tracking data. All Lotek 2015 location records of individual bats recorded during the same minute were averaged within the database. A new set of location points was created and appended to the air tracking data table; thereby, only a single estimated point for each bat per minute was used prior to creating the 125-meter buffer of uncertainty for the air tracking data. The database relationally links details such as location waypoints, dates, times, transmitter frequencies to unique bat ID numbers, bat species, sex, etc. As there were many records recorded after midnight that included a date rollover, all tracking data were assigned to a “Night” text field for the starting date of each survey night to avoid date confusion and to avoid potential confusion regarding what survey night the signal was recorded. For example, a bat recorded at 15 minutes after midnight was actually recorded on February 18, 2015, with a time of 0:15; however, this record would be associated with tracking the night of February 17. Each field season’s ground and air data were exported from the database as a tab delimited file. Point shapefiles were created in the GIS using ArcCatalog. The shapefile for ground tracking teams included the coordinates of each observer location, observer names, details on signal strength, the identification number of each bat, the estimated direction (azimuth) of the detected radio signal, the survey night, date, and time of each detection. The aerial tracking shapefile included the bat ID number, survey night, date, time of detection, relevant notes, and the GPS waypoints recorded at the time of detection. In some cases when there was a discrepancy or missing waypoint for a given time of a bat detection, the database was used to match the airplane locations from the GPX flight log track to the estimated location of a bat detection based on the time recorded. These shapefiles that were inclusive of all records for a given field season were then imported into the GIS project as air survey estimated location point detections. Air tracking estimated location points were then converted to a new shapefile of buffered polygons representing the ±125-meter level of uncertainty resulting in 250-meter-diameter circles using a Geospatial Modelling Environment (GME) (Beyer 2012) running on the R (v 3.2.5) platform (R Core Team 2016). When created, there are no attributes associated with the buffered air tracking uncertainty zone polygons. A spatial join was then preformed in the GIS, linking the Feature Identifier of the created files to the original air tracker file, which added the date, survey night, bat ID, and time of detection to the buffered points.
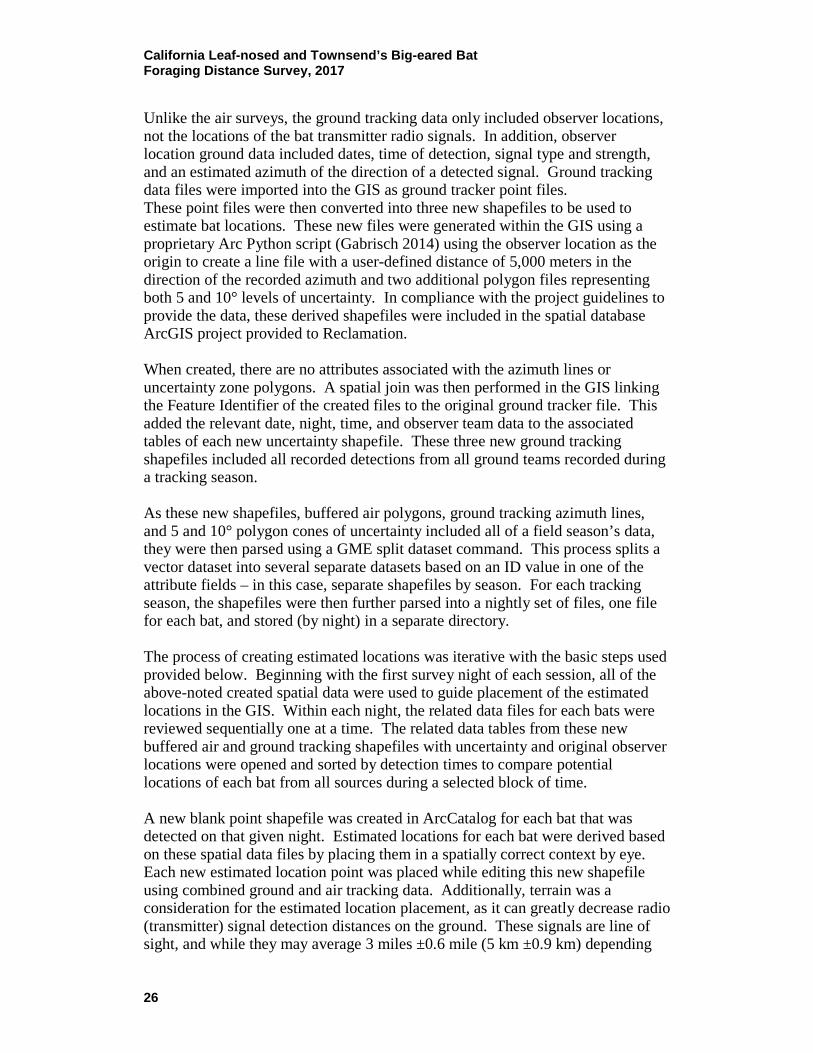
California Leaf-nosed and Townsend’s Big-eared Bat Foraging Distance Survey, 2017
26
Unlike the air surveys, the ground tracking data only included observer locations, not the locations of the bat transmitter radio signals. In addition, observer location ground data included dates, time of detection, signal type and strength, and an estimated azimuth of the direction of a detected signal. Ground tracking data files were imported into the GIS as ground tracker point files. These point files were then converted into three new shapefiles to be used to estimate bat locations. These new files were generated within the GIS using a proprietary Arc Python script (Gabrisch 2014) using the observer location as the origin to create a line file with a user-defined distance of 5,000 meters in the direction of the recorded azimuth and two additional polygon files representing both 5 and 10° levels of uncertainty. In compliance with the project guidelines to provide the data, these derived shapefiles were included in the spatial database ArcGIS project provided to Reclamation. When created, there are no attributes associated with the azimuth lines or uncertainty zone polygons. A spatial join was then performed in the GIS linking the Feature Identifier of the created files to the original ground tracker file. This added the relevant date, night, time, and observer team data to the associated tables of each new uncertainty shapefile. These three new ground tracking shapefiles included all recorded detections from all ground teams recorded during a tracking season. As these new shapefiles, buffered air polygons, ground tracking azimuth lines, and 5 and 10° polygon cones of uncertainty included all of a field season’s data, they were then parsed using a GME split dataset command. This process splits a vector dataset into several separate datasets based on an ID value in one of the attribute fields – in this case, separate shapefiles by season. For each tracking season, the shapefiles were then further parsed into a nightly set of files, one file for each bat, and stored (by night) in a separate directory. The process of creating estimated locations was iterative with the basic steps used provided below. Beginning with the first survey night of each session, all of the above-noted created spatial data were used to guide placement of the estimated locations in the GIS. Within each night, the related data files for each bats were reviewed sequentially one at a time. The related data tables from these new buffered air and ground tracking shapefiles with uncertainty and original observer locations were opened and sorted by detection times to compare potential locations of each bat from all sources during a selected block of time. A new blank point shapefile was created in ArcCatalog for each bat that was detected on that given night. Estimated locations for each bat were derived based on these spatial data files by placing them in a spatially correct context by eye. Each new estimated location point was placed while editing this new shapefile using combined ground and air tracking data. Additionally, terrain was a consideration for the estimated location placement, as it can greatly decrease radio (transmitter) signal detection distances on the ground. These signals are line of sight, and while they may average 3 miles ±0.6 mile (5 km ±0.9 km) depending
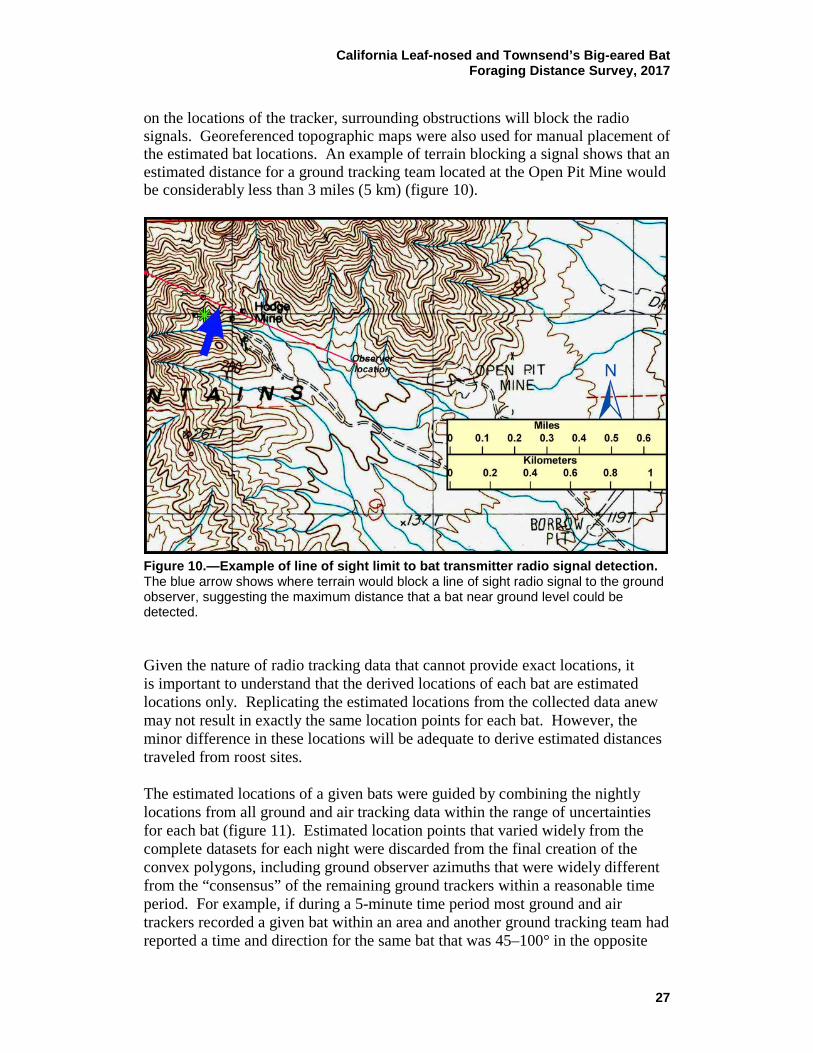
California Leaf-nosed and Townsend’s Big-eared Bat Foraging Distance Survey, 2017
27
on the locations of the tracker, surrounding obstructions will block the radio signals. Georeferenced topographic maps were also used for manual placement of the estimated bat locations. An example of terrain blocking a signal shows that an estimated distance for a ground tracking team located at the Open Pit Mine would be considerably less than 3 miles (5 km) (figure 10).
Figure 10.—Example of line of sight limit to bat transmitter radio signal detection. The blue arrow shows where terrain would block a line of sight radio signal to the ground observer, suggesting the maximum distance that a bat near ground level could be detected. Given the nature of radio tracking data that cannot provide exact locations, it is important to understand that the derived locations of each bat are estimated locations only. Replicating the estimated locations from the collected data anew may not result in exactly the same location points for each bat. However, the minor difference in these locations will be adequate to derive estimated distances traveled from roost sites. The estimated locations of a given bats were guided by combining the nightly locations from all ground and air tracking data within the range of uncertainties for each bat (figure 11). Estimated location points that varied widely from the complete datasets for each night were discarded from the final creation of the convex polygons, including ground observer azimuths that were widely different from the “consensus” of the remaining ground trackers within a reasonable time period. For example, if during a 5-minute time period most ground and air trackers recorded a given bat within an area and another ground tracking team had reported a time and direction for the same bat that was 45–100° in the opposite
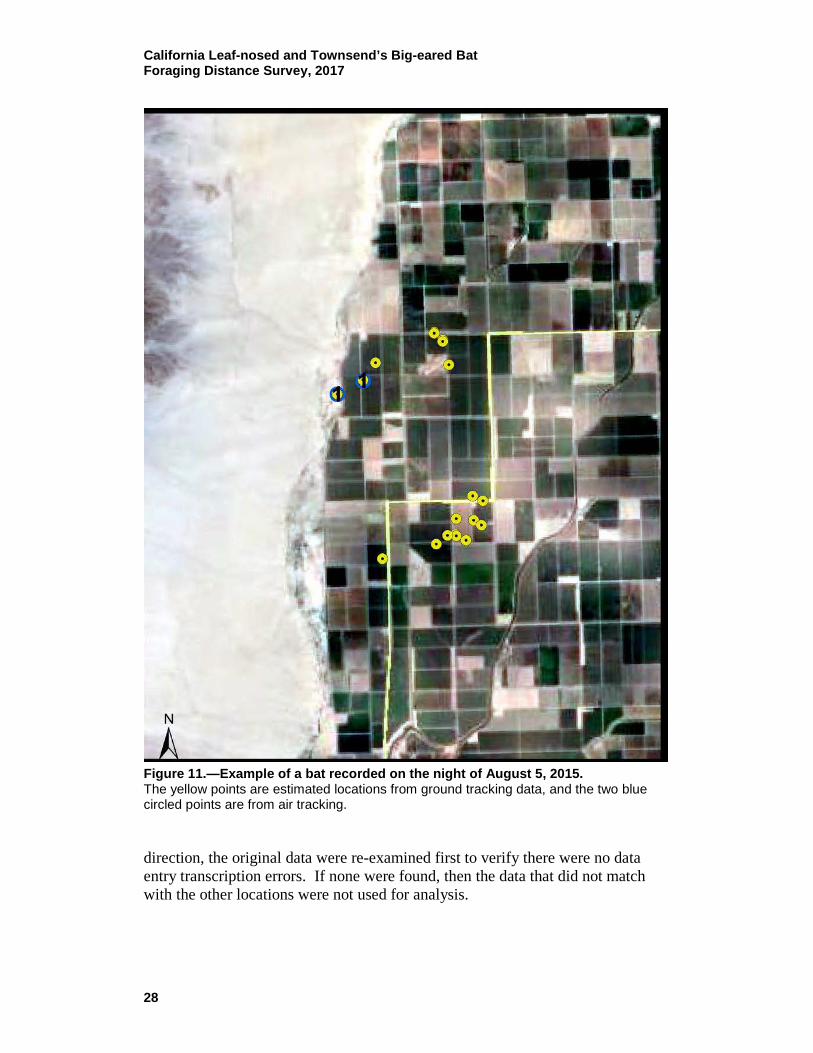
California Leaf-nosed and Townsend’s Big-eared Bat Foraging Distance Survey, 2017
28
Figure 11.—Example of a bat recorded on the night of August 5, 2015. The yellow points are estimated locations from ground tracking data, and the two blue circled points are from air tracking. direction, the original data were re-examined first to verify there were no data entry transcription errors. If none were found, then the data that did not match with the other locations were not used for analysis.
California Leaf-nosed and Townsend’s Big-eared Bat Foraging Distance Survey, 2017
29
This resulted in a new, uniquely estimated location point shapefile for each bat for each night surveyed. As the estimated point files are created, they will not have any spatial references or data associated with them. Therefore, upon completion of manually placing estimated location points for each bat for each survey night, the shapefile relevant information was added to the file data table that included survey night, time of detection, and bat ID number. The newly created estimated point shapefile for that bat was then saved, and the edit mode was exited and subsequently updated in the GIS using XTools Pro (Data East 2014) to include the spatially correct estimated derived location X-Y coordinates (Easting and Northing), thereby creating a new unique dataset of estimated locations for each bat (figure 12). The related data table associated with each new shapefile that included survey night, time of detection, bat number, and the derived X-Y coordinates was then extracted and appended into the master database estimated location table comprised of all estimated points for each field session from all air and ground tracking records (table 6).
Figure 12.—Derived estimated location points for Bat #2, February 7, 2015, showing data table extraction. Once the estimated locations had been created, it was possible to derive an estimated maximum distance traveled each night for each bat. This was achieved by creating a multiple polygon ring buffer file in the GIS using the Proximity > Multiple Ring Buffer tool. Parameters for this were defined as 0.5 mile (0.8 km) increments from 0.5 to 15 miles (0.8 to 24 km) from each roost that generated

California Leaf-nosed and Townsend’s Big-eared Bat Foraging Distance Survey, 2017
30
Table 6.—An example of a derived estimated location point data table for the Bat #2 field survey night, February 7, 2015, showing spatially correct coordinates (UTM) after adding to the shapefile data table
Night Time Easting Northing Bat #
Feb_7 18:18 704774.0 3710190.3 2a
Feb_7 18:21 704853.4 3709931.9 2a
Feb_7 18:23 704919.5 3709812.8 2a
Feb_7 18:23 705911.7 3709826.1 2a
Feb_7 18:25 705779.4 3708781.0 2a
Feb_7 18:30 705991.1 3708265.0 2a
Feb_7 18:38 705660.4 3708489.9 2a
Feb_7 18:53 707142.0 3708079.8 2a
Feb_7 19:09 707366.9 3708053.4 2a
Feb_7 19:12 707486.0 3707854.9 2a
Feb_7 19:22 709655.6 3707047.9 2a
Feb_7 19:41 711494.4 3706545.2 2a
Feb_7 20:17 710608.1 3706704.0 2a
0.5 mile distance concentric rings around each roost of interest. The estimated points for all bats identified as roosting in a location (e.g., Stonehouse Mine) were then overlain onto this concentric ring polygon. Estimated distances were then derived using the X Tools Pro (Data East 2014) Identify tool that identified each bat point intersection with a matching distance ring. This added a distance field and value for every estimated bat location. This derived distance data table was then exported as a comma delimited table file (CSV) and imported into a database estimated location table. The CSV file was subsequently imported into the open source statistical programming platform R v 3.2.5 (R Core Team 2016), where basic descriptive parameters were extracted. These included the maximum estimated distance traveled by each bat during all observation nights and the mean and standard deviation of the maximum estimated distance traveled across individuals by gender for the samples of each species from each tracking session and capture site. Additional considerations taken into account when placing estimated locations included flight speeds for bats. These were usually < 1.25 mph (2 km/h), with bats frequently remaining in one location for longer periods of time. When
California Leaf-nosed and Townsend’s Big-eared Bat Foraging Distance Survey, 2017
31
moving from one area to another, flight speeds averaged 12.5 mph (20 km/h), with a maximum of 29.4 mph (47 km/h). All estimates were derived from a subset of the estimated locations within the GIS based on location point distances versus time for all estimated points. Note that these calculations are subject to a margin of error based on the range of uncertainty of estimated locations and errors in recorded time of observation. For example, speed calculated between points 1 minute apart that have a location uncertainty of 100 meters may have a speed range of ±3.8 mph (6 km/h). As times were recorded to the nearest minute, the same would hold true if locations were accurate, but the times varied by 1 minute. Even with the range of uncertainty, this still suggested that the maximum distance conceivably traveled within a 1-minute timeframe by a bat would be within 500–600 meters. For aerial surveys when the airplane was circling, the X-Y locations recorded for the flight path varied from ±1,000 to 1,300 meters for any given minute, with an estimated diameter average of ±1,200 meters depending on the tightness of the turning circles. During these times, estimated positions of the bats were constantly changing with movements of the airplane and the bat and resulted in multiple detections recorded during the same minute. Similar to the ground tracking data, the actual location of the bat detected from the airplane would fall within a zone of uncertainty given that a bat could have been detected by either or both of the airplane’s antennas. Bats were not likely flying more than 20.6 mph (33 km/h) and located at two separate locations separated by > 1,000 meters during the same minute. To adjust for these multiple X-Y locations recorded during very short time periods (e.g., less than 1 minute), the estimated locations were averaged and merged into a single X-Y location by each minute before being buffered to the 250-meter estimated location. An example of these averaged bat locations from air tracking during the night of August 5, 2015, for three bats (#1, #3, and #4) is illustrated on figure 13. Additionally, a few points were discarded as anomalies when the distances and time traveled were impossible, such as a bat recorded at point A at 20:32 then the same bat recorded at Point B 7 miles (12 km) away at 20:38. Flying at the maximum speed known flight speed for the 6 minutes would only place that bat at a maximum of 2.1 miles (3.3 km). In order to travel the 7.5 miles (12 km) in 6 minutes, the bat would have been flying nearly 46.9 mph (75 km/h). A convex hull polygon was created for an estimate of the active range for all bats tracked during each survey night by combining locations for all individual bats (figure 14).

California Leaf-nosed and Townsend’s Big-eared Bat Foraging Distance Survey, 2017
32
Figure 13.—An example of the flight path waypoints for August 5, 2015, and estimated averaged locations of bats, #1, #3, and #4, buffered to 250-meter-diameter polygons.

California Leaf-nosed and Townsend’s Big-eared Bat Foraging Distance Survey, 2017
33
Figure 14.—Example of the estimated use area by all bats recorded on the night of August 5, 2015. The convex hull polygon encompasses all estimated locations from all data sources and assumes the bat use areas included the mine portals.
RESULTS The primary goal of the project was to determine the straight line distance from the roost that a California leaf-nosed or Townsend’s big-eared bat could travel on a nightly basis. The rationale was to ascertain if the bats roosting in the mines along the LCR that have been monitored as part of the LCR MSCP for over a decade (Brown 2016; Brown and Berry 2004) could forage in the LCR MSCP

California Leaf-nosed and Townsend’s Big-eared Bat Foraging Distance Survey, 2017
34
HCAs or other restoration areas (see figure 1). The four telemetry sessions were concentrated in three geographic areas, and the results are presented for each of these locations. Figure 15 represents a composite of all the transmitter detections for all the tracking sessions using both air and ground tracking data.
Figure 15.—Composite map of all telemetered bat detections for all tracking sessions showing mine roosts, LCR MSCP conservation areas, and HCAs.

California Leaf-nosed and Townsend’s Big-eared Bat Foraging Distance Survey, 2017
35
February and August 2015: Blythe Area On February 5, 2015, six male and six female California leaf-nosed bats (weighing between 11.0 to 13.7 g) were captured in the Stonehouse Mine in the Mule Mountains southwest of Blythe, California (see table 1; figure 2). By February 11, five bats had lost their transmitters and five additional bats were captured and fitted with new transmitters at the mine (one female and four males). To determine the roost sites of California leaf-nosed bats foraging in LCR MSCP conservation areas, two female California leaf-nosed bats were captured the night of February 9 in mist nets at the Cibola NWR Unit #1, one female California leaf-nosed bat was captured on February 10 at the CVCA, and two male California leaf-nosed bats were captured on February 12 at the PVER. Six of the banded California leaf-nosed bats that had been tagged at the Stonehouse Mine were recaptured in the mine at the end of the tracking session and weighed (see table 1). On August 2, 2015, transmitters were placed on six male California leaf-nosed bats at the Stonehouse Mine (including one bat previously tracked in the February 2015 study session) and on eight females at the Roosevelt Mine (see figure 2). Female California leaf-nosed bats aggregate and roost separately from males in the summer maternity season (Brown and Berry 1998; 2004). The Roosevelt Mine shelters the main maternity colony for California leaf-nosed bats in the Mule Mountains. The mass of the bats ranged between 14.5 to 15.5 g for males and 12 to 15.7 g for females (see table 2). Two of the tagged females (#2b and #13b) were killed by shrikes near the mine after emergence the next evening. On August 4, their transmitters and bands were removed and placed on two new females from the mine and assigned the same identification numbers as the dead bats. By August 8, several of the transmitters were no longer detected outside the mines, and it was assumed that the transmitters had been removed by the bats. Four of these transmitters were recovered in the Stonehouse Mine. Five more males weighing between 15.4 and 16.5 g were captured in the Stonehouse Mine (including two banded bats previously tracked in February 2015) and new transmitters attached. By the end of the tracking session, five banded male California leaf-nosed bats that had been tagged were recaptured in the Stonehouse Mine and weighed. No female California leaf-nosed bats from the Roosevelt Mine were recaptured. In addition to the transmitters attached in the mine roosts, two female California leaf-nosed bats were captured and telemetered at the CVCA on August 5. At the same time, a post-lactating female Arizona myotis (Myotis occultus) was also radio tagged at the CVCA (see table 2). Mist nets were also set at Cibola NWR Unit #1 and the PVER on August 6 and 11, although no California leaf-nosed bats were captured.
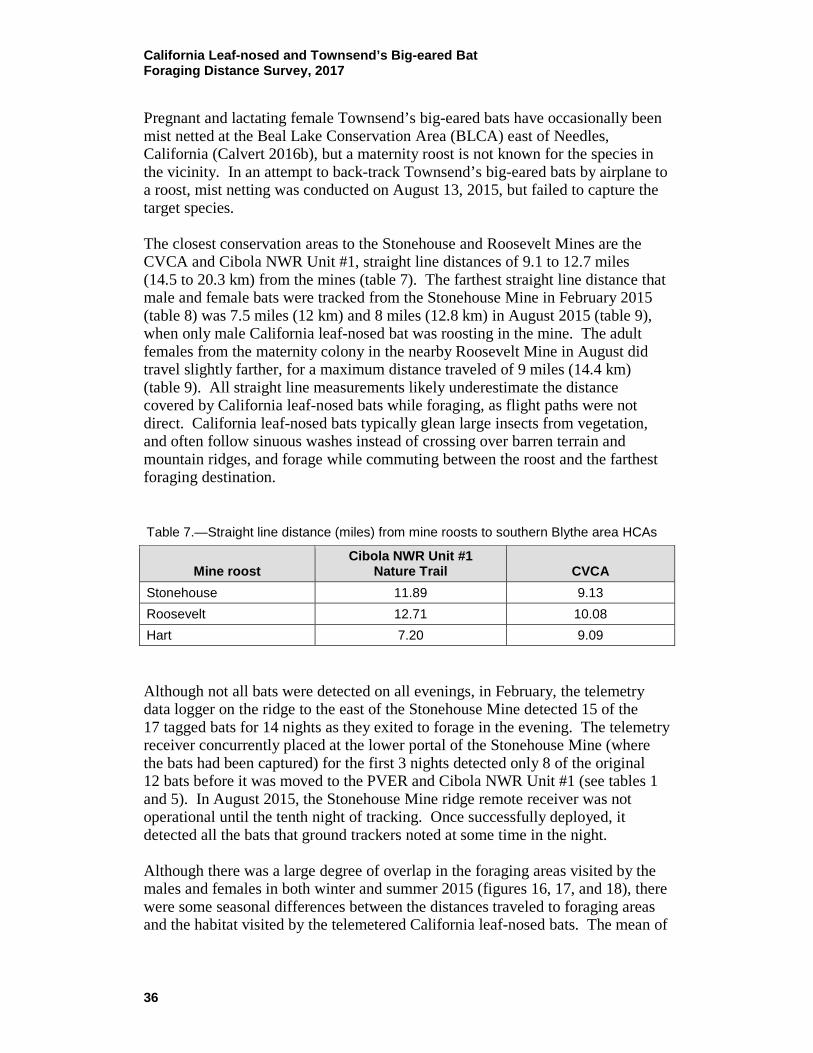
California Leaf-nosed and Townsend’s Big-eared Bat Foraging Distance Survey, 2017
36
Pregnant and lactating female Townsend’s big-eared bats have occasionally been mist netted at the Beal Lake Conservation Area (BLCA) east of Needles, California (Calvert 2016b), but a maternity roost is not known for the species in the vicinity. In an attempt to back-track Townsend’s big-eared bats by airplane to a roost, mist netting was conducted on August 13, 2015, but failed to capture the target species. The closest conservation areas to the Stonehouse and Roosevelt Mines are the CVCA and Cibola NWR Unit #1, straight line distances of 9.1 to 12.7 miles (14.5 to 20.3 km) from the mines (table 7). The farthest straight line distance that male and female bats were tracked from the Stonehouse Mine in February 2015 (table 8) was 7.5 miles (12 km) and 8 miles (12.8 km) in August 2015 (table 9), when only male California leaf-nosed bat was roosting in the mine. The adult females from the maternity colony in the nearby Roosevelt Mine in August did travel slightly farther, for a maximum distance traveled of 9 miles (14.4 km) (table 9). All straight line measurements likely underestimate the distance covered by California leaf-nosed bats while foraging, as flight paths were not direct. California leaf-nosed bats typically glean large insects from vegetation, and often follow sinuous washes instead of crossing over barren terrain and mountain ridges, and forage while commuting between the roost and the farthest foraging destination. Table 7.—Straight line distance (miles) from mine roosts to southern Blythe area HCAs
Mine roost Cibola NWR Unit #1
Nature Trail CVCA Stonehouse 11.89 9.13 Roosevelt 12.71 10.08 Hart 7.20 9.09 Although not all bats were detected on all evenings, in February, the telemetry data logger on the ridge to the east of the Stonehouse Mine detected 15 of the 17 tagged bats for 14 nights as they exited to forage in the evening. The telemetry receiver concurrently placed at the lower portal of the Stonehouse Mine (where the bats had been captured) for the first 3 nights detected only 8 of the original 12 bats before it was moved to the PVER and Cibola NWR Unit #1 (see tables 1 and 5). In August 2015, the Stonehouse Mine ridge remote receiver was not operational until the tenth night of tracking. Once successfully deployed, it detected all the bats that ground trackers noted at some time in the night. Although there was a large degree of overlap in the foraging areas visited by the males and females in both winter and summer 2015 (figures 16, 17, and 18), there were some seasonal differences between the distances traveled to foraging areas and the habitat visited by the telemetered California leaf-nosed bats. The mean of
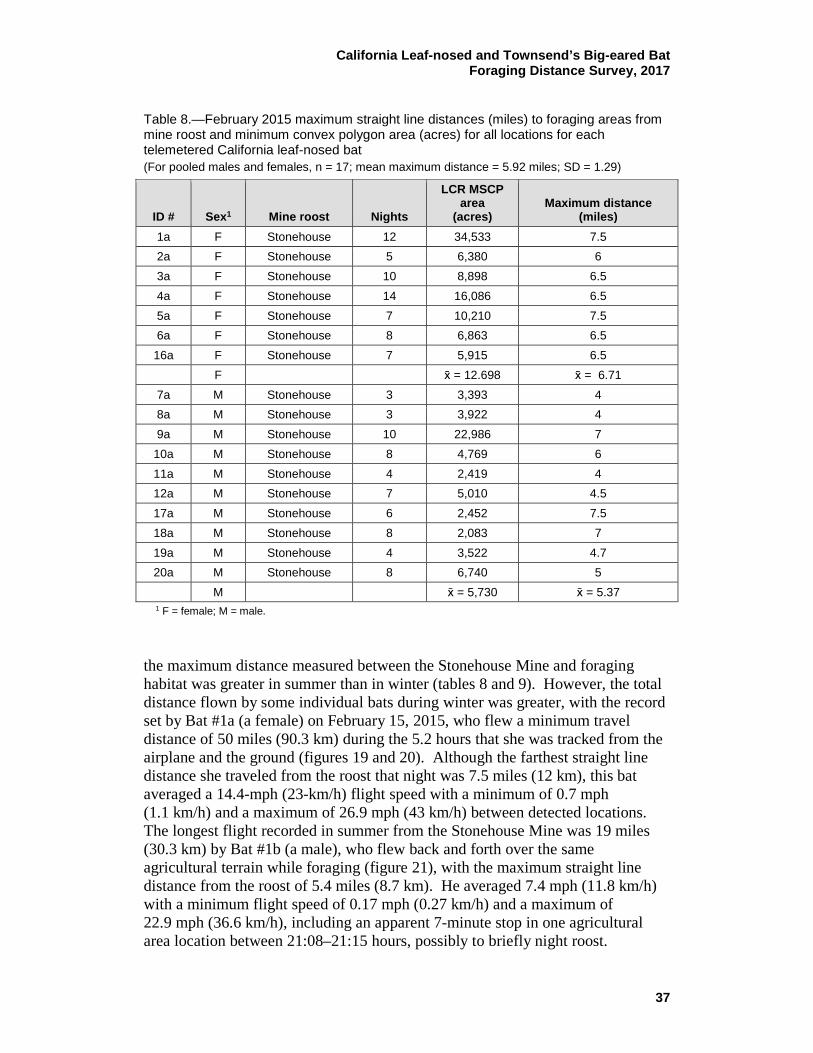
California Leaf-nosed and Townsend’s Big-eared Bat Foraging Distance Survey, 2017
37
Table 8.—February 2015 maximum straight line distances (miles) to foraging areas from mine roost and minimum convex polygon area (acres) for all locations for each telemetered California leaf-nosed bat (For pooled males and females, n = 17; mean maximum distance = 5.92 miles; SD = 1.29)
ID # Sex1 Mine roost Nights
LCR MSCP area
(acres) Maximum distance
(miles) 1a F Stonehouse 12 34,533 7.5 2a F Stonehouse 5 6,380 6 3a F Stonehouse 10 8,898 6.5 4a F Stonehouse 14 16,086 6.5 5a F Stonehouse 7 10,210 7.5 6a F Stonehouse 8 6,863 6.5
16a F Stonehouse 7 5,915 6.5 F x̄ = 12.698 x̄ = 6.71
7a M Stonehouse 3 3,393 4 8a M Stonehouse 3 3,922 4 9a M Stonehouse 10 22,986 7
10a M Stonehouse 8 4,769 6 11a M Stonehouse 4 2,419 4 12a M Stonehouse 7 5,010 4.5 17a M Stonehouse 6 2,452 7.5 18a M Stonehouse 8 2,083 7 19a M Stonehouse 4 3,522 4.7 20a M Stonehouse 8 6,740 5
M x̄ = 5,730 x̄ = 5.37 1 F = female; M = male.
the maximum distance measured between the Stonehouse Mine and foraging habitat was greater in summer than in winter (tables 8 and 9). However, the total distance flown by some individual bats during winter was greater, with the record set by Bat #1a (a female) on February 15, 2015, who flew a minimum travel distance of 50 miles (90.3 km) during the 5.2 hours that she was tracked from the airplane and the ground (figures 19 and 20). Although the farthest straight line distance she traveled from the roost that night was 7.5 miles (12 km), this bat averaged a 14.4-mph (23-km/h) flight speed with a minimum of 0.7 mph (1.1 km/h) and a maximum of 26.9 mph (43 km/h) between detected locations. The longest flight recorded in summer from the Stonehouse Mine was 19 miles (30.3 km) by Bat #1b (a male), who flew back and forth over the same agricultural terrain while foraging (figure 21), with the maximum straight line distance from the roost of 5.4 miles (8.7 km). He averaged 7.4 mph (11.8 km/h) with a minimum flight speed of 0.17 mph (0.27 km/h) and a maximum of 22.9 mph (36.6 km/h), including an apparent 7-minute stop in one agricultural area location between 21:08–21:15 hours, possibly to briefly night roost.
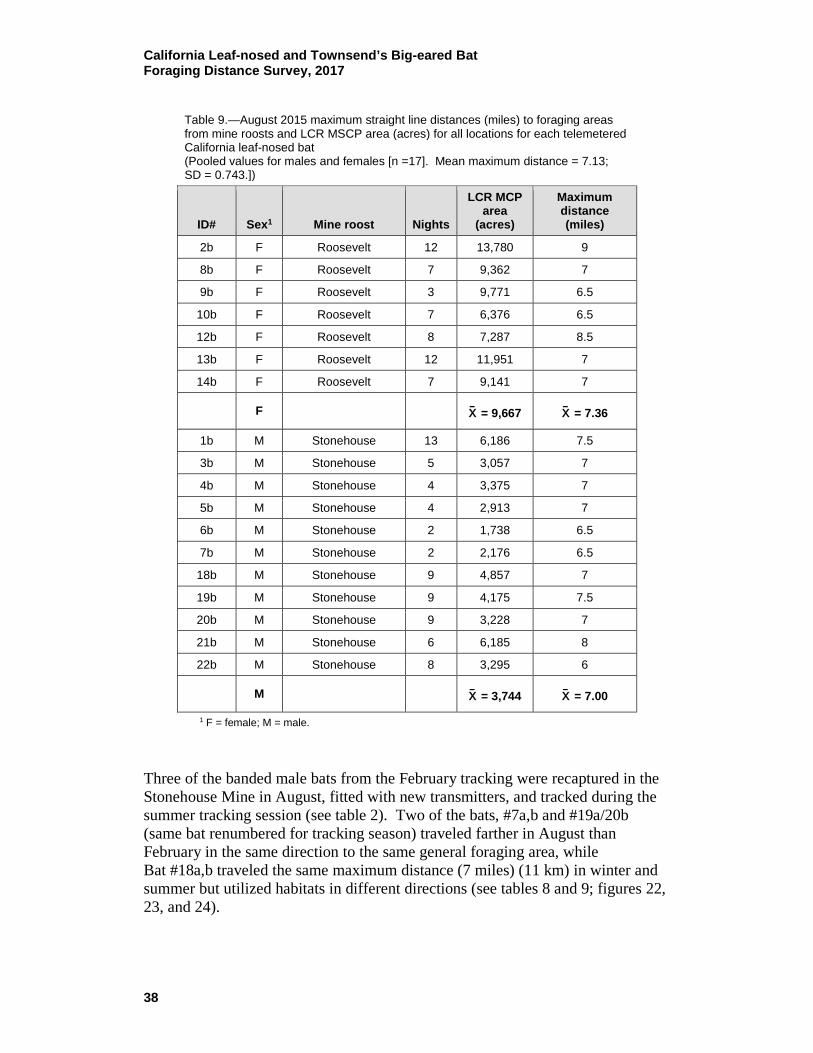
California Leaf-nosed and Townsend’s Big-eared Bat Foraging Distance Survey, 2017
38
Table 9.—August 2015 maximum straight line distances (miles) to foraging areas from mine roosts and LCR MSCP area (acres) for all locations for each telemetered California leaf-nosed bat (Pooled values for males and females [n =17]. Mean maximum distance = 7.13; SD = 0.743.])
ID# Sex1 Mine roost Nights
LCR MCP area
(acres)
Maximum distance (miles)
2b F Roosevelt 12 13,780 9
8b F Roosevelt 7 9,362 7
9b F Roosevelt 3 9,771 6.5
10b F Roosevelt 7 6,376 6.5
12b F Roosevelt 8 7,287 8.5
13b F Roosevelt 12 11,951 7
14b F Roosevelt 7 9,141 7
F x̄ = 9,667 x̄ = 7.36
1b M Stonehouse 13 6,186 7.5
3b M Stonehouse 5 3,057 7
4b M Stonehouse 4 3,375 7
5b M Stonehouse 4 2,913 7
6b M Stonehouse 2 1,738 6.5
7b M Stonehouse 2 2,176 6.5
18b M Stonehouse 9 4,857 7
19b M Stonehouse 9 4,175 7.5
20b M Stonehouse 9 3,228 7
21b M Stonehouse 6 6,185 8
22b M Stonehouse 8 3,295 6
M x̄ = 3,744 x̄ = 7.00
1 F = female; M = male.
Three of the banded male bats from the February tracking were recaptured in the Stonehouse Mine in August, fitted with new transmitters, and tracked during the summer tracking session (see table 2). Two of the bats, #7a,b and #19a/20b (same bat renumbered for tracking season) traveled farther in August than February in the same direction to the same general foraging area, while Bat #18a,b traveled the same maximum distance (7 miles) (11 km) in winter and summer but utilized habitats in different directions (see tables 8 and 9; figures 22, 23, and 24).

California Leaf-nosed and Townsend’s Big-eared Bat Foraging Distance Survey, 2017
39
Figure 16.—All foraging locations of 17 telemetered male and female California leaf-nosed bats roosting in the Stonehouse Mine, February 2015.
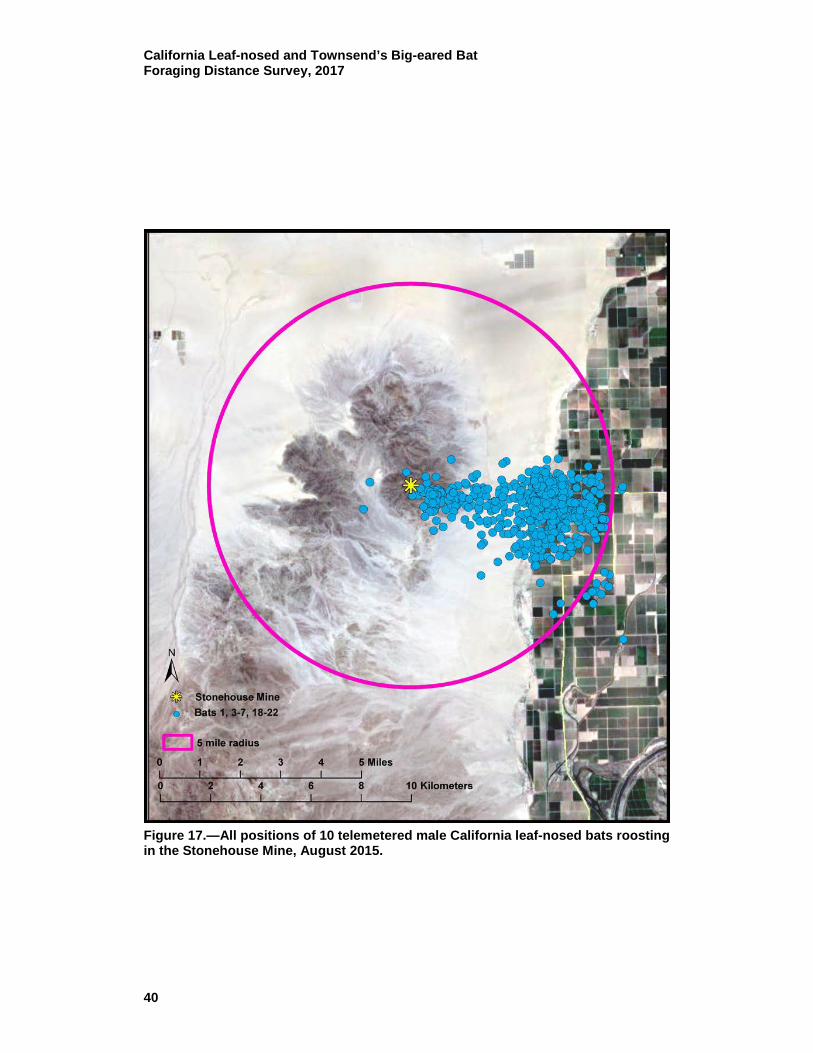
California Leaf-nosed and Townsend’s Big-eared Bat Foraging Distance Survey, 2017
40
Figure 17.—All positions of 10 telemetered male California leaf-nosed bats roosting in the Stonehouse Mine, August 2015.
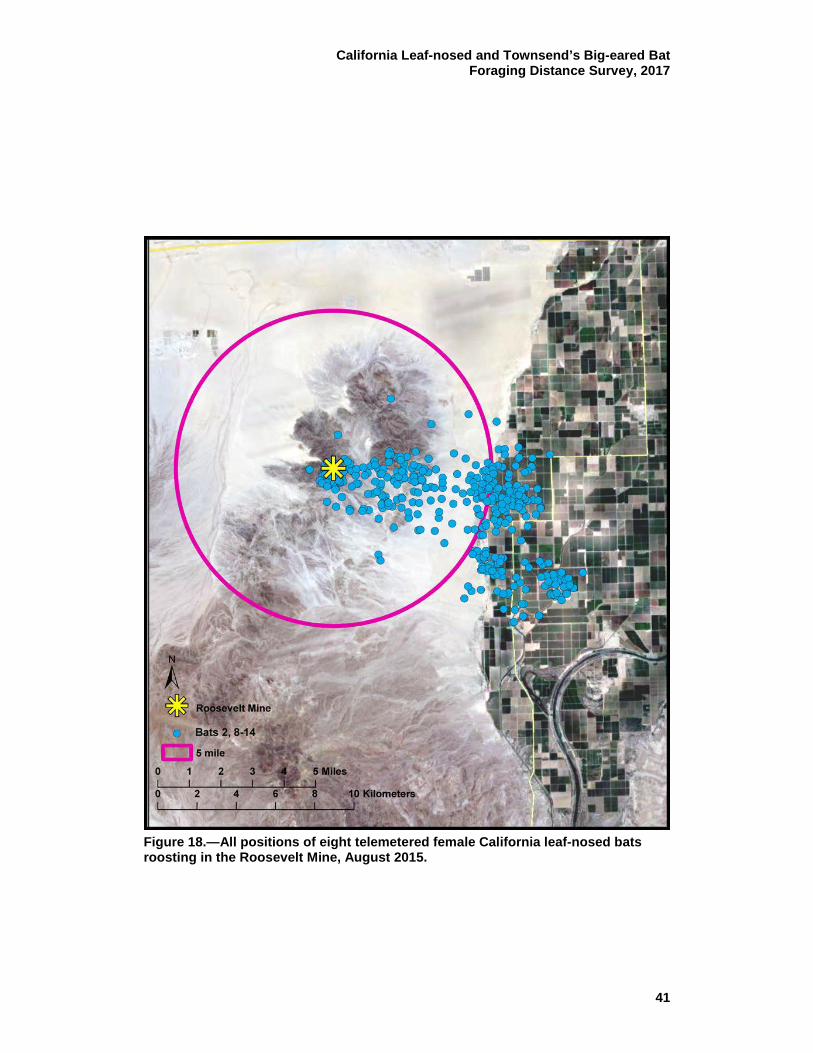
California Leaf-nosed and Townsend’s Big-eared Bat Foraging Distance Survey, 2017
41
Figure 18.—All positions of eight telemetered female California leaf-nosed bats roosting in the Roosevelt Mine, August 2015.

California Leaf-nosed and Townsend’s Big-eared Bat Foraging Distance Survey, 2017
42
Figure 19.—Track of Bat #1a (a female California leaf-nosed bat) on February 15, 2015, from Stonehouse Mine collected over 5.2 hours of ground and aerial tracking. Times of detection are included to show areas where the bat spent time.

California Leaf-nosed and Townsend’s Big-eared Bat Foraging Distance Survey, 2017
43
Figure 20.—GPS track of airplane for 4.5 hours on February 15, 2015. Blythe Airport is to the north.

California Leaf-nosed and Townsend’s Big-eared Bat Foraging Distance Survey, 2017
44
Figure 21.—Bat #1b (a male California leaf-nosed bat), August 5, 2015, roosting in the Stonehouse Mine. Tracks link detection points with straight lines. Foraging in agricultural area from 2044 to 2305 hours. The estimated path length is greater than 18.9 miles (30.3 km).
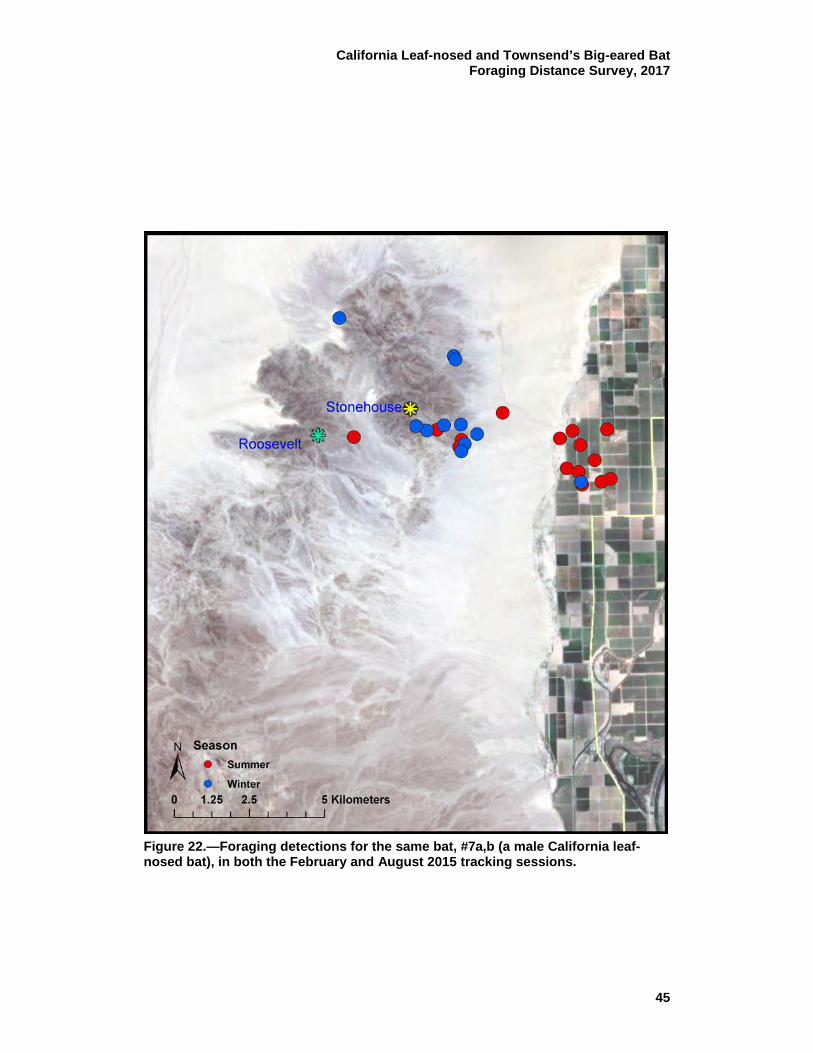
California Leaf-nosed and Townsend’s Big-eared Bat Foraging Distance Survey, 2017
45
Figure 22.—Foraging detections for the same bat, #7a,b (a male California leaf-nosed bat), in both the February and August 2015 tracking sessions.

California Leaf-nosed and Townsend’s Big-eared Bat Foraging Distance Survey, 2017
46
Figure 23.—Foraging detections for the same bat, #18a,b (a male California leaf-nosed bat), in both the February and August tracking 2015 sessions.
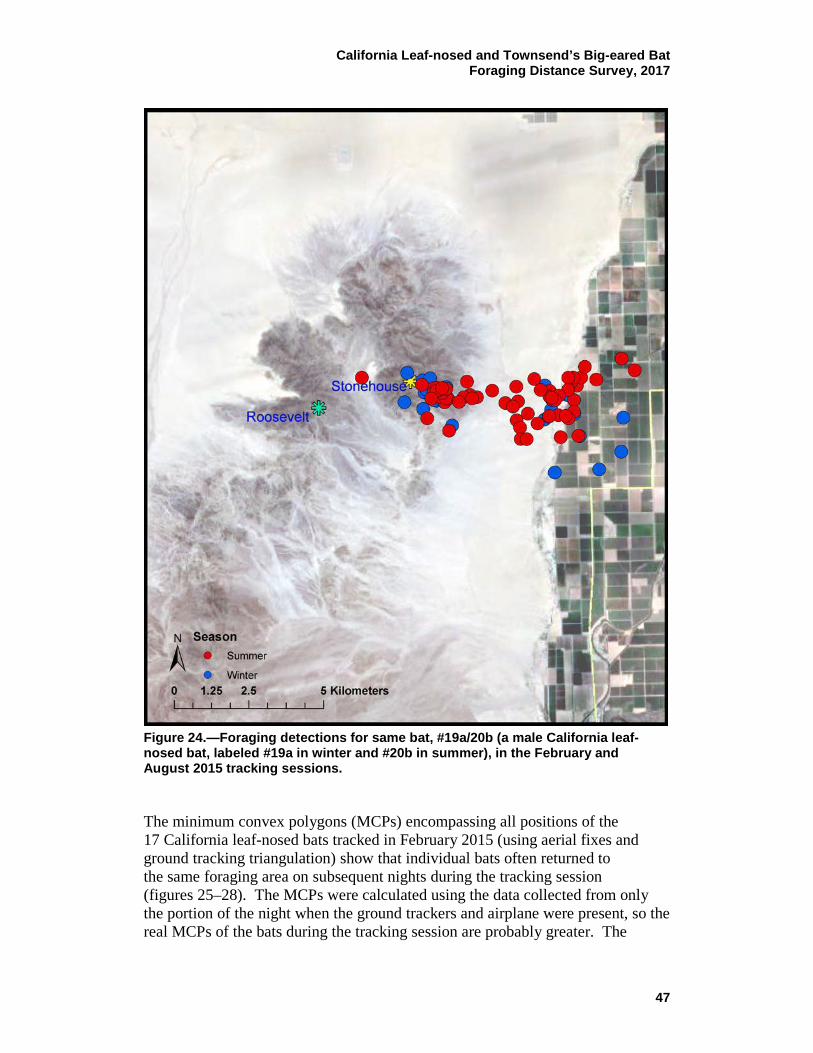
California Leaf-nosed and Townsend’s Big-eared Bat Foraging Distance Survey, 2017
47
Figure 24.—Foraging detections for same bat, #19a/20b (a male California leaf-nosed bat, labeled #19a in winter and #20b in summer), in the February and August 2015 tracking sessions. The minimum convex polygons (MCPs) encompassing all positions of the 17 California leaf-nosed bats tracked in February 2015 (using aerial fixes and ground tracking triangulation) show that individual bats often returned to the same foraging area on subsequent nights during the tracking session (figures 25–28). The MCPs were calculated using the data collected from only the portion of the night when the ground trackers and airplane were present, so the real MCPs of the bats during the tracking session are probably greater. The
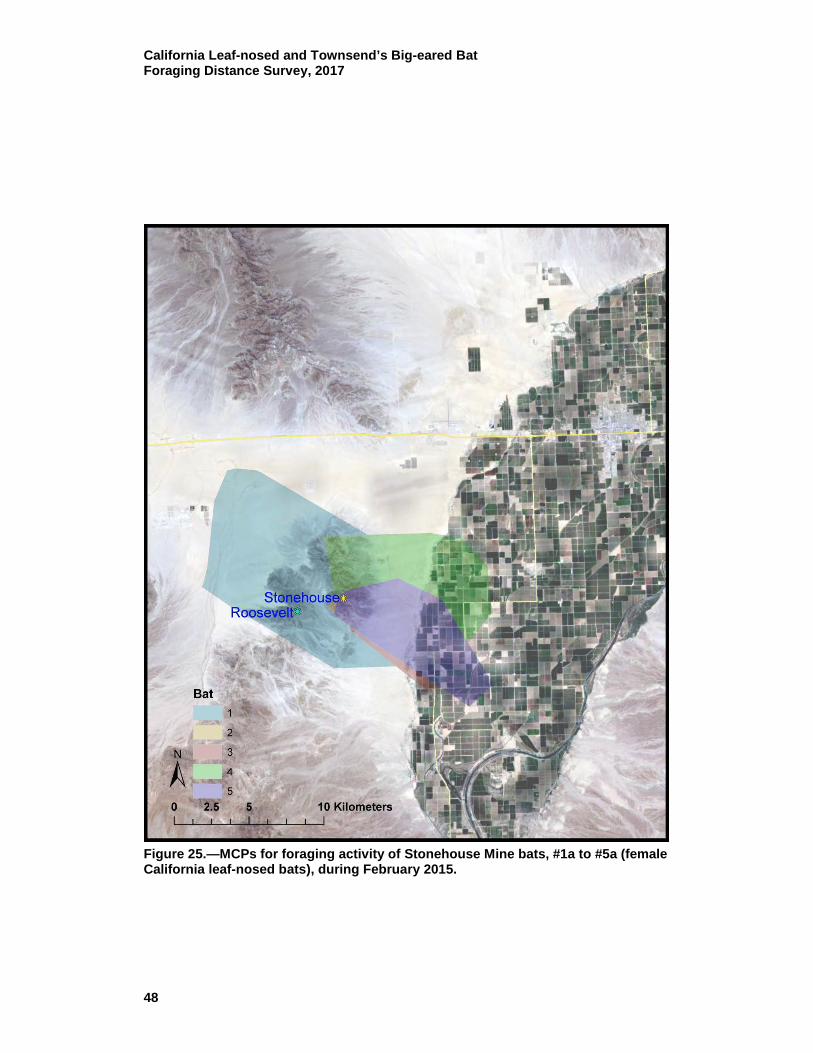
California Leaf-nosed and Townsend’s Big-eared Bat Foraging Distance Survey, 2017
48
Figure 25.—MCPs for foraging activity of Stonehouse Mine bats, #1a to #5a (female California leaf-nosed bats), during February 2015.
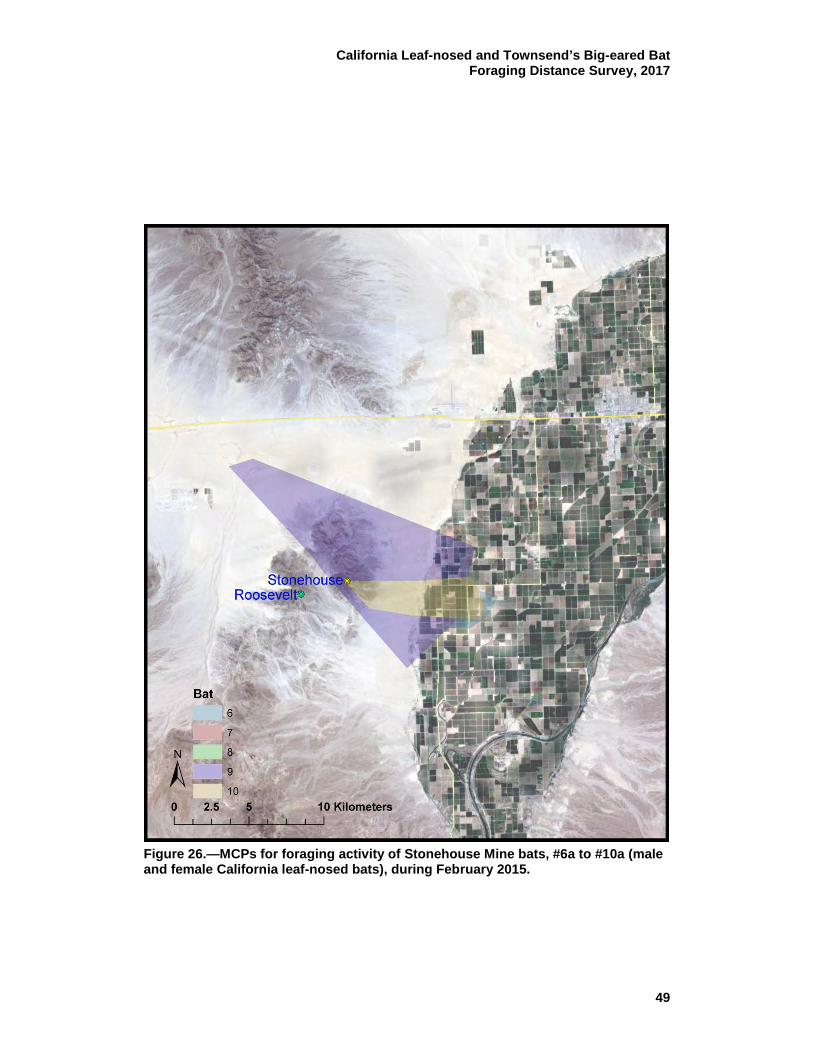
California Leaf-nosed and Townsend’s Big-eared Bat Foraging Distance Survey, 2017
49
Figure 26.—MCPs for foraging activity of Stonehouse Mine bats, #6a to #10a (male and female California leaf-nosed bats), during February 2015.

California Leaf-nosed and Townsend’s Big-eared Bat Foraging Distance Survey, 2017
50
Figure 27.—MCPs for foraging activity of Stonehouse Mine bats, #11a, #12a, and #16a (male and female California leaf-nosed bats), during February 2015.

California Leaf-nosed and Townsend’s Big-eared Bat Foraging Distance Survey, 2017
51
Figure 28.—MCPs for foraging activity of Stonehouse Mine bats, #17a to #20a (male California leaf-nosed bats), during February 2015.
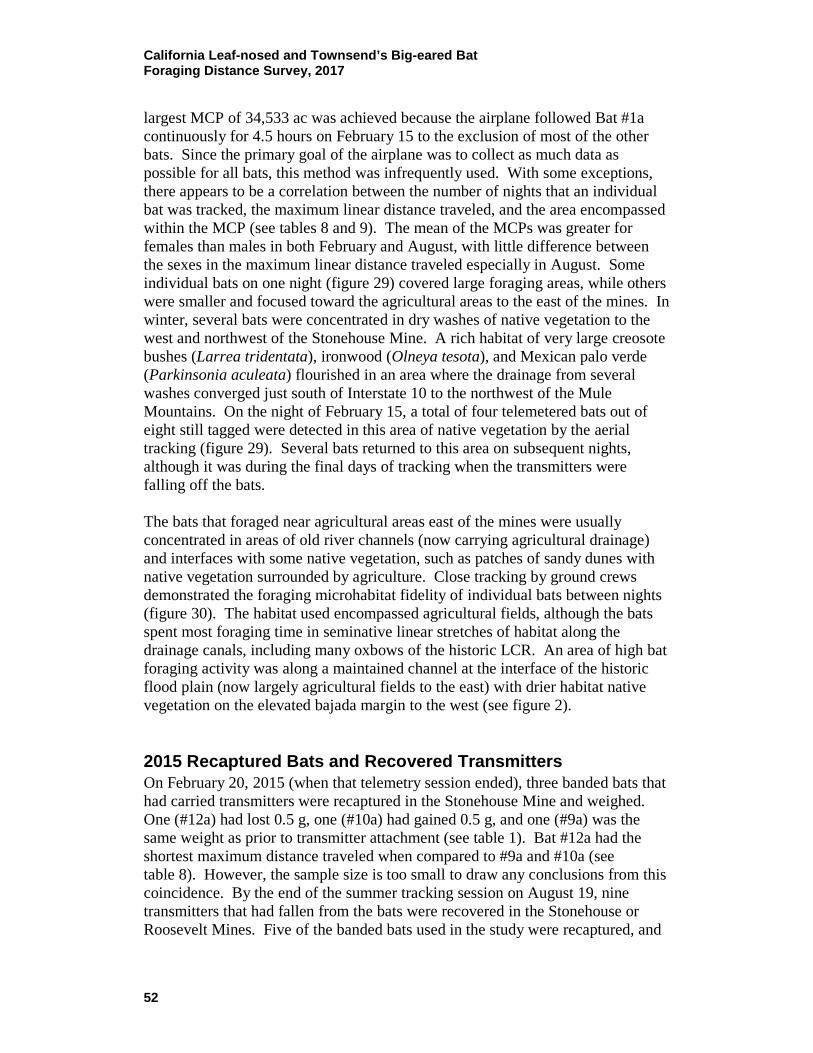
California Leaf-nosed and Townsend’s Big-eared Bat Foraging Distance Survey, 2017
52
largest MCP of 34,533 ac was achieved because the airplane followed Bat #1a continuously for 4.5 hours on February 15 to the exclusion of most of the other bats. Since the primary goal of the airplane was to collect as much data as possible for all bats, this method was infrequently used. With some exceptions, there appears to be a correlation between the number of nights that an individual bat was tracked, the maximum linear distance traveled, and the area encompassed within the MCP (see tables 8 and 9). The mean of the MCPs was greater for females than males in both February and August, with little difference between the sexes in the maximum linear distance traveled especially in August. Some individual bats on one night (figure 29) covered large foraging areas, while others were smaller and focused toward the agricultural areas to the east of the mines. In winter, several bats were concentrated in dry washes of native vegetation to the west and northwest of the Stonehouse Mine. A rich habitat of very large creosote bushes (Larrea tridentata), ironwood (Olneya tesota), and Mexican palo verde (Parkinsonia aculeata) flourished in an area where the drainage from several washes converged just south of Interstate 10 to the northwest of the Mule Mountains. On the night of February 15, a total of four telemetered bats out of eight still tagged were detected in this area of native vegetation by the aerial tracking (figure 29). Several bats returned to this area on subsequent nights, although it was during the final days of tracking when the transmitters were falling off the bats. The bats that foraged near agricultural areas east of the mines were usually concentrated in areas of old river channels (now carrying agricultural drainage) and interfaces with some native vegetation, such as patches of sandy dunes with native vegetation surrounded by agriculture. Close tracking by ground crews demonstrated the foraging microhabitat fidelity of individual bats between nights (figure 30). The habitat used encompassed agricultural fields, although the bats spent most foraging time in seminative linear stretches of habitat along the drainage canals, including many oxbows of the historic LCR. An area of high bat foraging activity was along a maintained channel at the interface of the historic flood plain (now largely agricultural fields to the east) with drier habitat native vegetation on the elevated bajada margin to the west (see figure 2). 2015 Recaptured Bats and Recovered Transmitters On February 20, 2015 (when that telemetry session ended), three banded bats that had carried transmitters were recaptured in the Stonehouse Mine and weighed. One (#12a) had lost 0.5 g, one (#10a) had gained 0.5 g, and one (#9a) was the same weight as prior to transmitter attachment (see table 1). Bat #12a had the shortest maximum distance traveled when compared to #9a and #10a (see table 8). However, the sample size is too small to draw any conclusions from this coincidence. By the end of the summer tracking session on August 19, nine transmitters that had fallen from the bats were recovered in the Stonehouse or Roosevelt Mines. Five of the banded bats used in the study were recaptured, and
California Leaf-nosed and Townsend’s Big-eared Bat Foraging Distance Survey, 2017
53
Figure 29.—All positions of eight telemetered male and female California leaf-nosed bats roosting in the Stonehouse Mine on the night of February 15, 2015.

California Leaf-nosed and Townsend’s Big-eared Bat Foraging Distance Survey, 2017
54
Figure 30.—Bat #22b (a male California leaf-nosed bat) locations for all nights August 9–16, 2015.
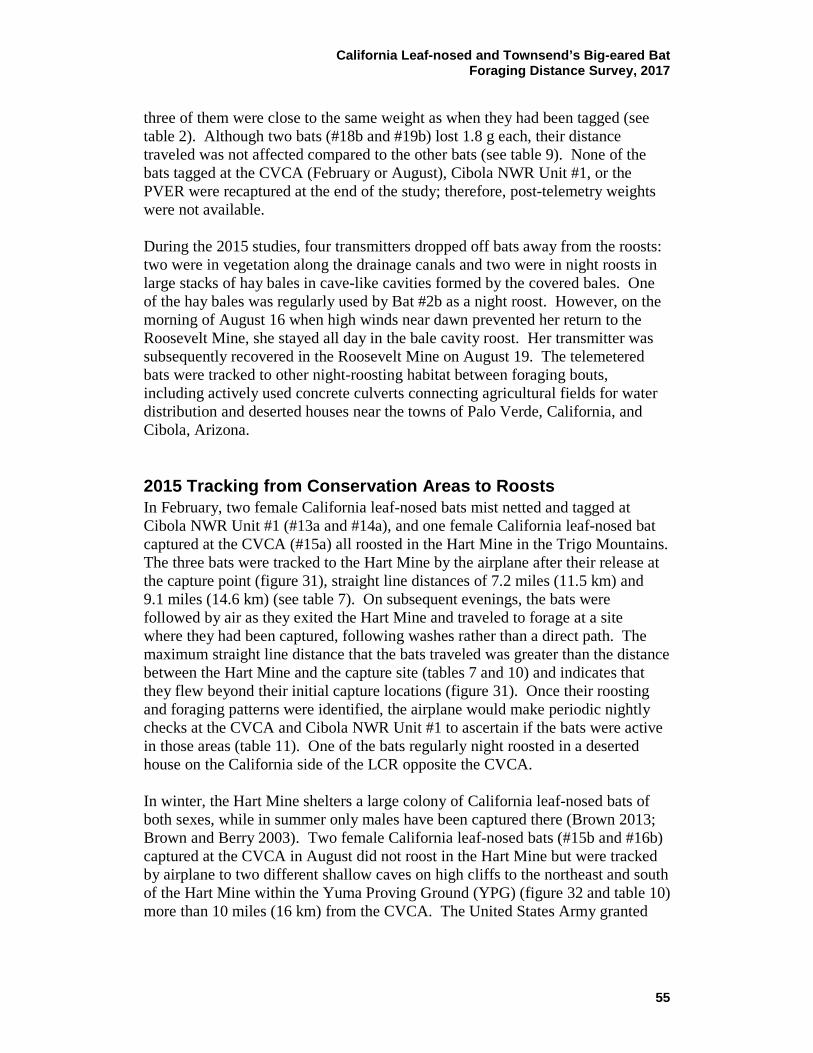
California Leaf-nosed and Townsend’s Big-eared Bat Foraging Distance Survey, 2017
55
three of them were close to the same weight as when they had been tagged (see table 2). Although two bats (#18b and #19b) lost 1.8 g each, their distance traveled was not affected compared to the other bats (see table 9). None of the bats tagged at the CVCA (February or August), Cibola NWR Unit #1, or the PVER were recaptured at the end of the study; therefore, post-telemetry weights were not available. During the 2015 studies, four transmitters dropped off bats away from the roosts: two were in vegetation along the drainage canals and two were in night roosts in large stacks of hay bales in cave-like cavities formed by the covered bales. One of the hay bales was regularly used by Bat #2b as a night roost. However, on the morning of August 16 when high winds near dawn prevented her return to the Roosevelt Mine, she stayed all day in the bale cavity roost. Her transmitter was subsequently recovered in the Roosevelt Mine on August 19. The telemetered bats were tracked to other night-roosting habitat between foraging bouts, including actively used concrete culverts connecting agricultural fields for water distribution and deserted houses near the towns of Palo Verde, California, and Cibola, Arizona. 2015 Tracking from Conservation Areas to Roosts In February, two female California leaf-nosed bats mist netted and tagged at Cibola NWR Unit #1 (#13a and #14a), and one female California leaf-nosed bat captured at the CVCA (#15a) all roosted in the Hart Mine in the Trigo Mountains. The three bats were tracked to the Hart Mine by the airplane after their release at the capture point (figure 31), straight line distances of 7.2 miles (11.5 km) and 9.1 miles (14.6 km) (see table 7). On subsequent evenings, the bats were followed by air as they exited the Hart Mine and traveled to forage at a site where they had been captured, following washes rather than a direct path. The maximum straight line distance that the bats traveled was greater than the distance between the Hart Mine and the capture site (tables 7 and 10) and indicates that they flew beyond their initial capture locations (figure 31). Once their roosting and foraging patterns were identified, the airplane would make periodic nightly checks at the CVCA and Cibola NWR Unit #1 to ascertain if the bats were active in those areas (table 11). One of the bats regularly night roosted in a deserted house on the California side of the LCR opposite the CVCA. In winter, the Hart Mine shelters a large colony of California leaf-nosed bats of both sexes, while in summer only males have been captured there (Brown 2013; Brown and Berry 2003). Two female California leaf-nosed bats (#15b and #16b) captured at the CVCA in August did not roost in the Hart Mine but were tracked by airplane to two different shallow caves on high cliffs to the northeast and south of the Hart Mine within the Yuma Proving Ground (YPG) (figure 32 and table 10) more than 10 miles (16 km) from the CVCA. The United States Army granted
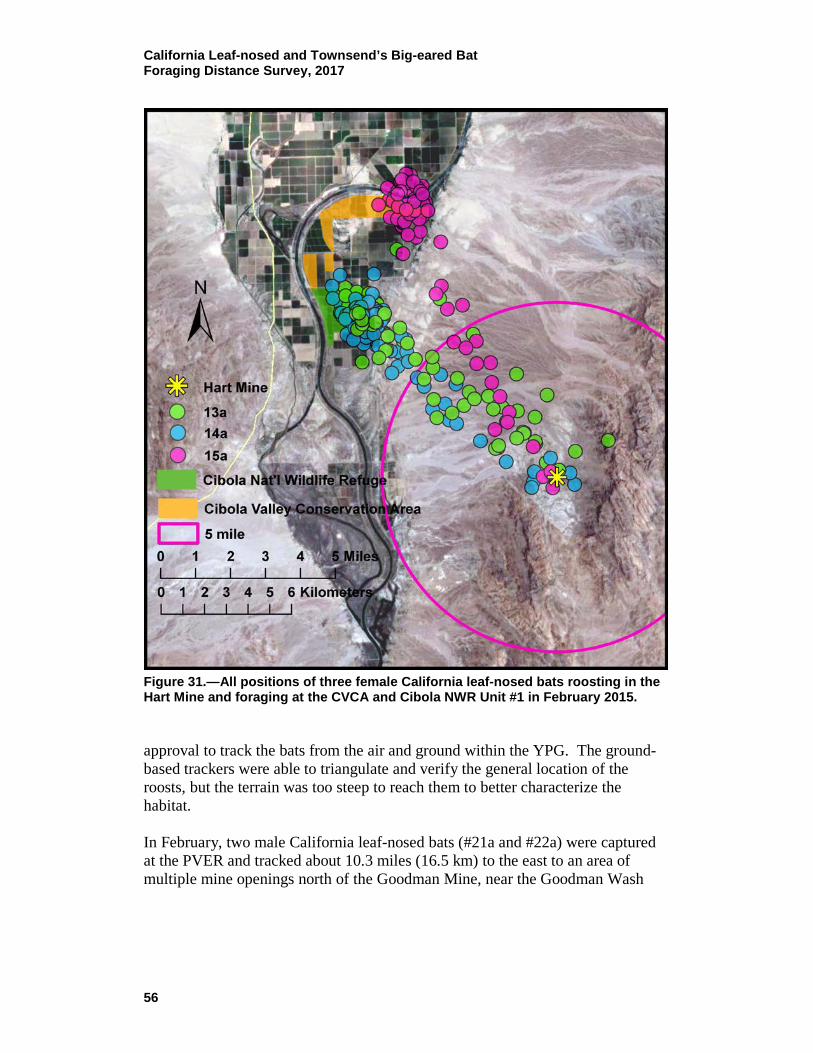
California Leaf-nosed and Townsend’s Big-eared Bat Foraging Distance Survey, 2017
56
Figure 31.—All positions of three female California leaf-nosed bats roosting in the Hart Mine and foraging at the CVCA and Cibola NWR Unit #1 in February 2015. approval to track the bats from the air and ground within the YPG. The ground-based trackers were able to triangulate and verify the general location of the roosts, but the terrain was too steep to reach them to better characterize the habitat. In February, two male California leaf-nosed bats (#21a and #22a) were captured at the PVER and tracked about 10.3 miles (16.5 km) to the east to an area of multiple mine openings north of the Goodman Mine, near the Goodman Wash
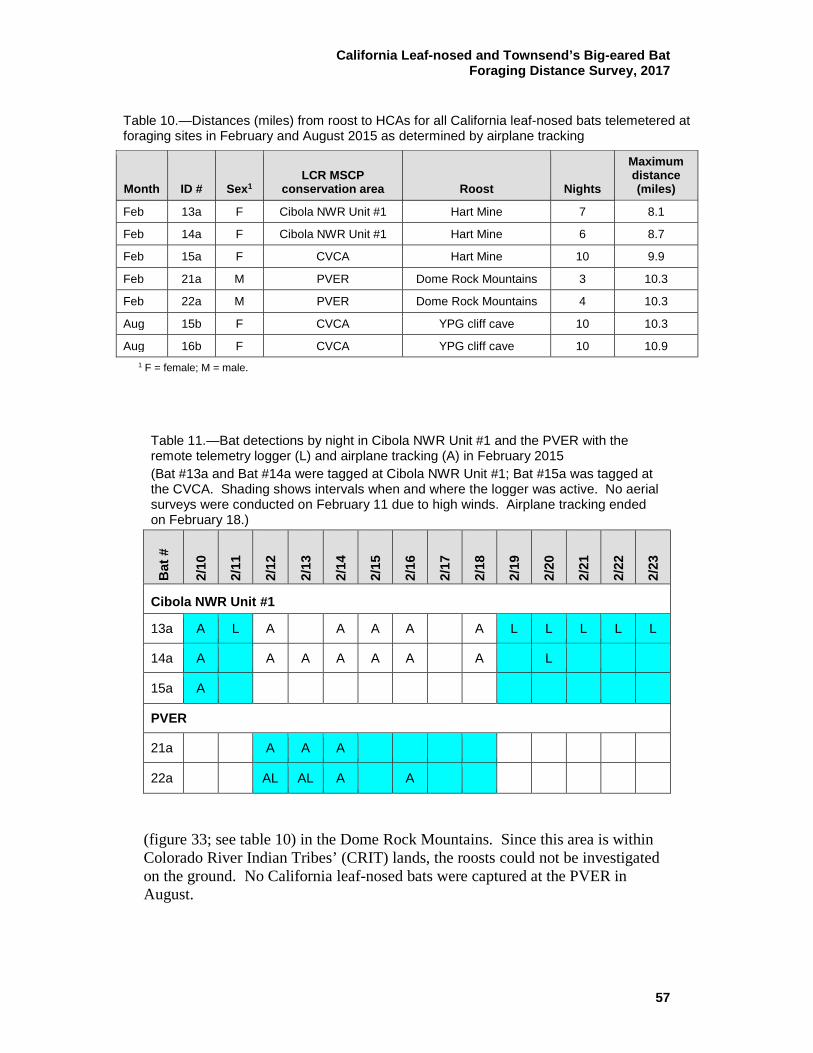
California Leaf-nosed and Townsend’s Big-eared Bat Foraging Distance Survey, 2017
57
Table 10.—Distances (miles) from roost to HCAs for all California leaf-nosed bats telemetered at foraging sites in February and August 2015 as determined by airplane tracking
Month ID # Sex1 LCR MSCP
conservation area Roost Nights
Maximum distance (miles)
Feb 13a F Cibola NWR Unit #1 Hart Mine 7 8.1
Feb 14a F Cibola NWR Unit #1 Hart Mine 6 8.7
Feb 15a F CVCA Hart Mine 10 9.9
Feb 21a M PVER Dome Rock Mountains 3 10.3
Feb 22a M PVER Dome Rock Mountains 4 10.3
Aug 15b F CVCA YPG cliff cave 10 10.3
Aug 16b F CVCA YPG cliff cave 10 10.9
1 F = female; M = male.
Table 11.—Bat detections by night in Cibola NWR Unit #1 and the PVER with the remote telemetry logger (L) and airplane tracking (A) in February 2015 (Bat #13a and Bat #14a were tagged at Cibola NWR Unit #1; Bat #15a was tagged at the CVCA. Shading shows intervals when and where the logger was active. No aerial surveys were conducted on February 11 due to high winds. Airplane tracking ended on February 18.)
Bat
#
2/10
2/11
2/12
2/13
2/14
2/15
2/16
2/17
2/18
2/19
2/20
2/21
2/22
2/23
Cibola NWR Unit #1
13a A L A A A A A L L L L L
14a A A A A A A A L
15a A
PVER
21a A A A
22a AL AL A A
(figure 33; see table 10) in the Dome Rock Mountains. Since this area is within Colorado River Indian Tribes’ (CRIT) lands, the roosts could not be investigated on the ground. No California leaf-nosed bats were captured at the PVER in August.

California Leaf-nosed and Townsend’s Big-eared Bat Foraging Distance Survey, 2017
58
Figure 32.—All positions of two female California leaf-nosed bats day roosting in caves in cliff faces and foraging at the CVCA and Cibola NWR Unit #1 in August 2015.

California Leaf-nosed and Townsend’s Big-eared Bat Foraging Distance Survey, 2017
59
Figure 33.—All positions of two bats, #21a and #22a (male California leaf-nosed bats), day roosting in a mine in the Dome Rock Mountains and foraging at the PVER in February 2015. After the first two bats were tagged at Cibola NWR Unit #1 in February, the remote telemetry data logger was moved there on February 10 for 3 nights until bats were tagged at the PVER. After 7 nights at the PVER, the logger was moved back to Cibola NWR Unit #1 on February 19, where it remained until February 24, near the end of the tracking session on (see table 5). Since the ground trackers were concentrating on the bats from the Stonehouse Mine, the logger and the airplane were the only methods employed for tracking these bats. The airplane made passes over the LCR MSCP conservation areas and HCAs for the period between February 10 and 18, when airplane tracking ended. There were no flights on February 11 due to high winds. In August, the CVCA was the only

California Leaf-nosed and Townsend’s Big-eared Bat Foraging Distance Survey, 2017
60
LCR MSCP conservation area or HCA in which bats were tagged. The data logger remained there from August 12 to 21, while airplane tracking ended on August 15. Table 11 (February) and table 12 (August) detail the nights that individual bats were detected by the remote logger and/or by the airplane during periodic flights over the LCR MSCP conservation areas and HCAs. The airplane could cover a much larger area and had a greater detection range and logged more bats in the HCAs, while the bat needed to fly quite close to the remote logger to be detected. However, the data logger was operating all night, while the airplane made sporadic passes over the area and was rarely flying in the early morning hours. The logger detections demonstrate the fidelity of individual bats (#13a, #22a, #15b, #16b, and #17b) to the small area where they were initially netted while foraging at Cibola NWR Unit #1. Bat #15a was repeatedly detected at its capture site at the CVCA by the airplane but only once at Cibola NWR Unit #1. There was no logger at the CVCA in February.
Table 12.—Bat detections by night at the CVCA with the remote telemetry logger (L) and airplane tracking (A) in August 2015 (All tabled bats were tagged at the CVCA. Shading shows the intervals when the logger was active [unit disabled on August 15]. Airplane tracking ended after August 15.)
Bat
#
8/5
8/6
8/7
8/8
8/9
8/10
8/11
8/12
8/13
8/14
8/15
8/16
8/17
8/18
8/19
8/20
8/21
15b A A A A A A A A L A L A L A L L L L
16b A A A A A A A A L A L A L A L L L L L L
17b A A A A L L L
Arizona Myotis Roost Although Arizona myotis was not a target species of this telemetry project, the capture of a post-lactating female (#17b) at the CVCA in August presented an opportunity to update the status of this species along the LCR. An extra transmitter was attached to the bat. She was tracked 5.9 miles (9.5 km) from the CVCA to a wooden bridge south of Palo Verde, California (see table 2; figure 34). When the bridge was observed at dusk on August 8, at least 35 Arizona myotis emerged from the presumed maternity colony. The remote data logger at the CVCA and the airplane flights demonstrated that she returned there to forage on at least 7 nights after the transmitter was attached (see table 12). For three of the nights the bat was not detected from the airplane, its presence at the CVCA was verified by the data logger.
California Leaf-nosed and Townsend’s Big-eared Bat Foraging Distance Survey, 2017
61
Figure 34.—All aerially tracked positions of the female Arizona myotis (#17b), including the capture site at the CVCA and the bridge day roost near the town of Palo Verde, California. February 2016: Yuma Area The February 2016 tracking session was conducted near Yuma, Arizona. On February 2, six male and six female California leaf-nosed bats (weighing between 11.9 to 13.3 g) were captured emerging from the 3C Mine in the Chocolate Mountains northwest of Yuma, Arizona (see table 3; figure 3). To determine the roost sites of California leaf-nosed bats using restoration areas and
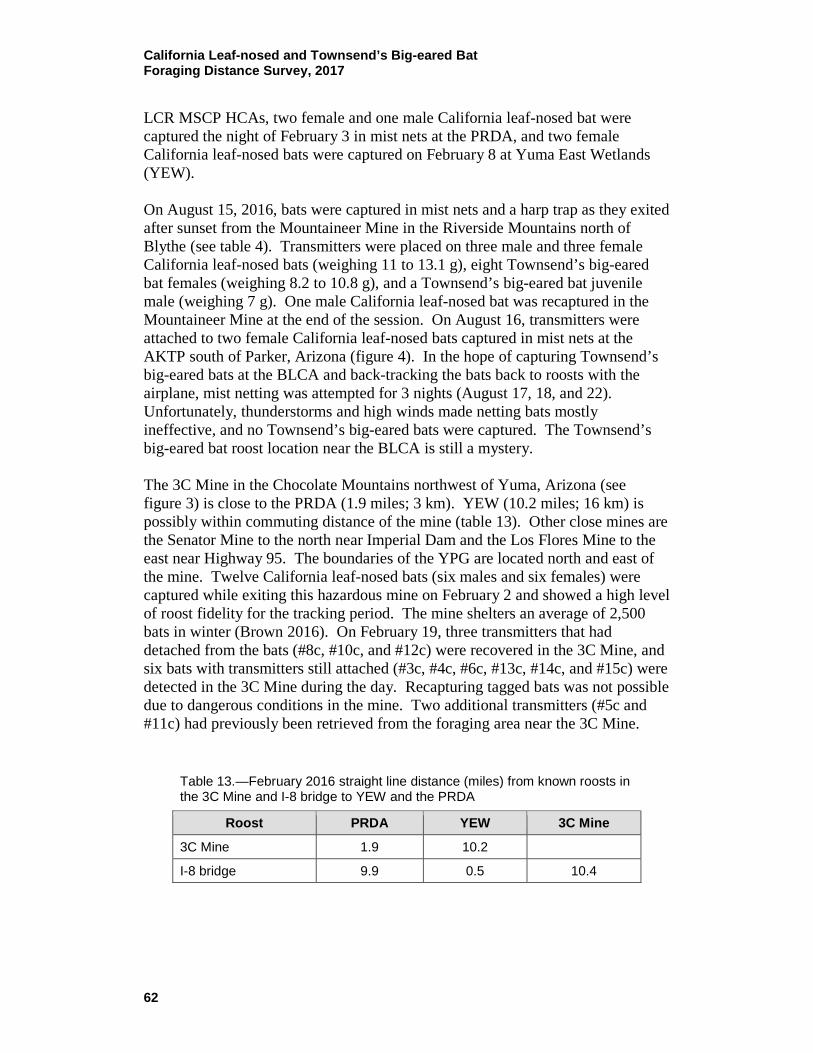
California Leaf-nosed and Townsend’s Big-eared Bat Foraging Distance Survey, 2017
62
LCR MSCP HCAs, two female and one male California leaf-nosed bat were captured the night of February 3 in mist nets at the PRDA, and two female California leaf-nosed bats were captured on February 8 at Yuma East Wetlands (YEW). On August 15, 2016, bats were captured in mist nets and a harp trap as they exited after sunset from the Mountaineer Mine in the Riverside Mountains north of Blythe (see table 4). Transmitters were placed on three male and three female California leaf-nosed bats (weighing 11 to 13.1 g), eight Townsend’s big-eared bat females (weighing 8.2 to 10.8 g), and a Townsend’s big-eared bat juvenile male (weighing 7 g). One male California leaf-nosed bat was recaptured in the Mountaineer Mine at the end of the session. On August 16, transmitters were attached to two female California leaf-nosed bats captured in mist nets at the AKTP south of Parker, Arizona (figure 4). In the hope of capturing Townsend’s big-eared bats at the BLCA and back-tracking the bats back to roosts with the airplane, mist netting was attempted for 3 nights (August 17, 18, and 22). Unfortunately, thunderstorms and high winds made netting bats mostly ineffective, and no Townsend’s big-eared bats were captured. The Townsend’s big-eared bat roost location near the BLCA is still a mystery. The 3C Mine in the Chocolate Mountains northwest of Yuma, Arizona (see figure 3) is close to the PRDA (1.9 miles; 3 km). YEW (10.2 miles; 16 km) is possibly within commuting distance of the mine (table 13). Other close mines are the Senator Mine to the north near Imperial Dam and the Los Flores Mine to the east near Highway 95. The boundaries of the YPG are located north and east of the mine. Twelve California leaf-nosed bats (six males and six females) were captured while exiting this hazardous mine on February 2 and showed a high level of roost fidelity for the tracking period. The mine shelters an average of 2,500 bats in winter (Brown 2016). On February 19, three transmitters that had detached from the bats (#8c, #10c, and #12c) were recovered in the 3C Mine, and six bats with transmitters still attached (#3c, #4c, #6c, #13c, #14c, and #15c) were detected in the 3C Mine during the day. Recapturing tagged bats was not possible due to dangerous conditions in the mine. Two additional transmitters (#5c and #11c) had previously been retrieved from the foraging area near the 3C Mine.
Table 13.—February 2016 straight line distance (miles) from known roosts in the 3C Mine and I-8 bridge to YEW and the PRDA
Roost PRDA YEW 3C Mine
3C Mine 1.9 10.2
I-8 bridge 9.9 0.5 10.4
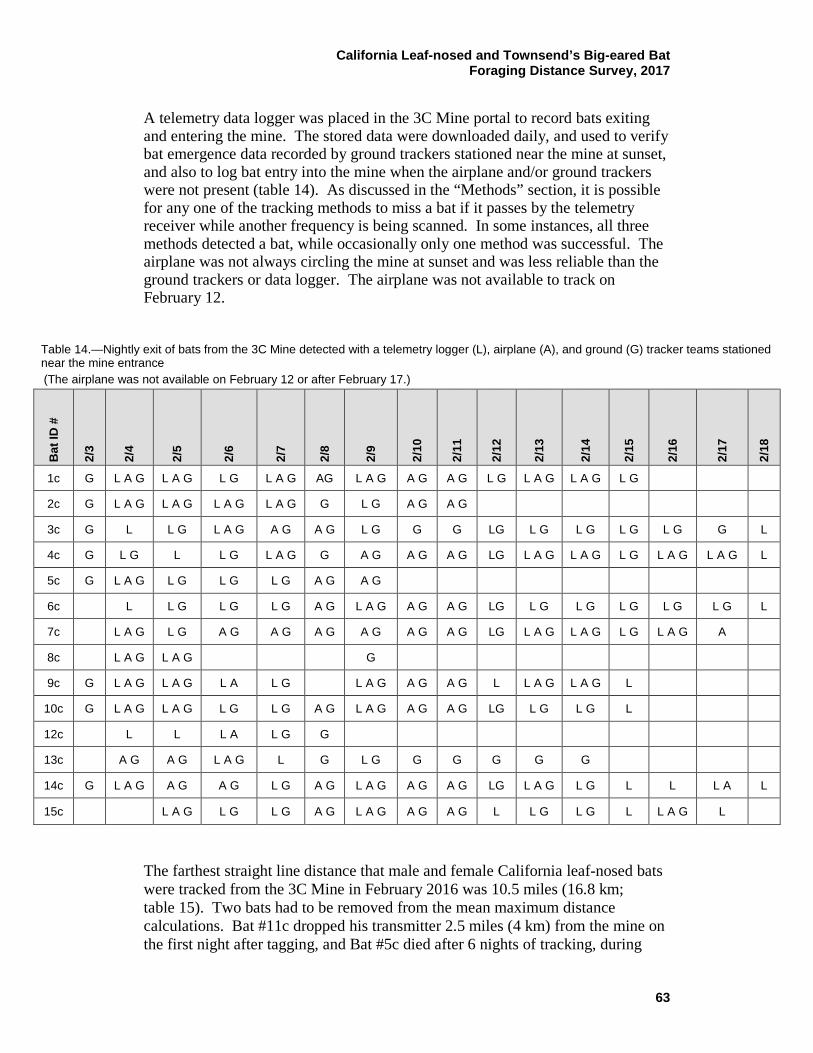
California Leaf-nosed and Townsend’s Big-eared Bat Foraging Distance Survey, 2017
63
A telemetry data logger was placed in the 3C Mine portal to record bats exiting and entering the mine. The stored data were downloaded daily, and used to verify bat emergence data recorded by ground trackers stationed near the mine at sunset, and also to log bat entry into the mine when the airplane and/or ground trackers were not present (table 14). As discussed in the “Methods” section, it is possible for any one of the tracking methods to miss a bat if it passes by the telemetry receiver while another frequency is being scanned. In some instances, all three methods detected a bat, while occasionally only one method was successful. The airplane was not always circling the mine at sunset and was less reliable than the ground trackers or data logger. The airplane was not available to track on February 12.
Table 14.—Nightly exit of bats from the 3C Mine detected with a telemetry logger (L), airplane (A), and ground (G) tracker teams stationed near the mine entrance (The airplane was not available on February 12 or after February 17.)
Bat
ID #
2/3
2/4
2/5
2/6
2/7
2/8
2/9
2/10
2/11
2/12
2/13
2/14
2/15
2/16
2/17
2/18
1c G L A G L A G L G L A G AG L A G A G A G L G L A G L A G L G
2c G L A G L A G L A G L A G G L G A G A G
3c G L L G L A G A G A G L G G G LG L G L G L G L G G L
4c G L G L L G L A G G A G A G A G LG L A G L A G L G L A G L A G L
5c G L A G L G L G L G A G A G
6c L L G L G L G A G L A G A G A G LG L G L G L G L G L G L
7c L A G L G A G A G A G A G A G A G LG L A G L A G L G L A G A
8c L A G L A G G
9c G L A G L A G L A L G L A G A G A G L L A G L A G L
10c G L A G L A G L G L G A G L A G A G A G LG L G L G L
12c L L L A L G G
13c A G A G L A G L G L G G G G G G
14c G L A G A G A G L G A G L A G A G A G LG L A G L G L L L A L
15c L A G L G L G A G L A G A G A G L L G L G L L A G L
The farthest straight line distance that male and female California leaf-nosed bats were tracked from the 3C Mine in February 2016 was 10.5 miles (16.8 km; table 15). Two bats had to be removed from the mean maximum distance calculations. Bat #11c dropped his transmitter 2.5 miles (4 km) from the mine on the first night after tagging, and Bat #5c died after 6 nights of tracking, during

California Leaf-nosed and Townsend’s Big-eared Bat Foraging Distance Survey, 2017
64
Table 15.—February 2016 maximum straight line distances (miles) to foraging areas from the 3C Mine and I-8 bridge roost for telemetered California leaf-nosed bats (Pooled mean for males and females at 3C Mine [n = 13; mean = 7.58; SD = 1.902])
Bat ID# Sex1 Mine Roost Nights
Maximum distance (miles)
1c F Mine 3C portal 13 10.5
2c F Mine 3C portal 9 7.5
3c F Mine 3C portal 14 6.5
4c F Mine 3C portal 14 6.5
6c F Mine 3C portal 13 8
13c F Mine 3C portal 14 7.5
14c F Mine 3C portal 14 8.5
Mean = 7.86
7c M Mine 3C portal 13 9.5
8c M Mine 3C portal 4 4.5
9c M Mine 3C portal 13 9.5
10c M Mine 3C portal 12 9.5
12c M Mine 3C portal 4 5
15c M Mine 3C portal 14 5.5
Mean = 7.25
16c F I-8 bridge 8 1.5
17c F I-8 bridge 9 1
Mean = 1.25 1 F = female; M = male.
which time she only flew within 1.5 miles (2.4 km) of the roost. All straight line measurements likely underestimate the distance covered by California leaf-nosed bats while foraging, as flight paths were not direct. The majority of the California leaf-nosed bats typically followed the LCR and All American Canal while traveling between the roost and the farthest foraging destinations. Figure 35 depicts all the foraging detections during the entire tracking period of bats tagged at the 3C Mine and the PRDA, showing some difference in foraging areas between males and females. The MCP of the foraging habitat of the males of 38,922 acres (ac) (15,751 hectares [ha]) is encompassed within the much larger MCP 52,659 ac (21,310 ha) of the tagged females (figure 36). The foraging locations of all bats on the night of February 10 are shown on figure 37. Several bats showed a high fidelity to a foraging area during the study (figure 38). Bat #1c (female) and Bat #7c (male)

California Leaf-nosed and Townsend’s Big-eared Bat Foraging Distance Survey, 2017
65
Figure 35.—Foraging locations of all bats tagged at the 3C Mine and the PRDA in February 2016. Females are red dots and males blue.

California Leaf-nosed and Townsend’s Big-eared Bat Foraging Distance Survey, 2017
66
Figure 36.—MCPs for foraging activity of 3C Mine male (38,922 ac [15,751 ha]) and female (52,659 ac [21,310 ha]) California leaf-nosed bats during February 2016.
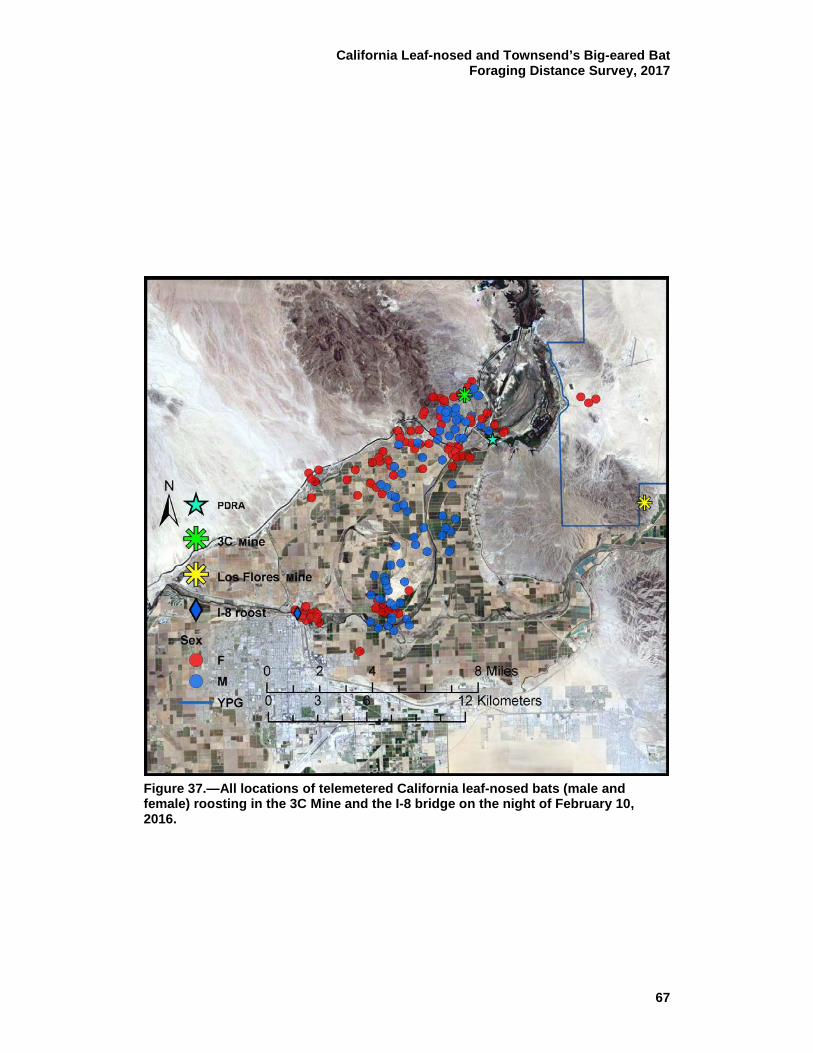
California Leaf-nosed and Townsend’s Big-eared Bat Foraging Distance Survey, 2017
67
Figure 37.—All locations of telemetered California leaf-nosed bats (male and female) roosting in the 3C Mine and the I-8 bridge on the night of February 10, 2016.

California Leaf-nosed and Townsend’s Big-eared Bat Foraging Distance Survey, 2017
68
Figure 38.—Tracked locations for California leaf-nosed bats, #1c, #6c, #7c, #13c, and #14c, for all nights of the February 2016 session, demonstrating foraging area fidelity.

California Leaf-nosed and Townsend’s Big-eared Bat Foraging Distance Survey, 2017
69
traveled south from the 3C Mine along the LCR to an area of natural vegetation near the confluence of the LCR and Gila River, while Bat #6c flew southwest to forage in a large wash west of the All American Canal. Bat #13c regularly flew to the northeast of the 3C Mine and foraged and night roosted on the YPG. Bat #14c headed east, and on several nights the airplane tracked this female to the Los Flores Mine to the east. Bat #7c (male) left the 3C Mine and immediately flew south to this area before returning to the mine 4.6 hours later (figure 39) after flying 29.6 miles (47.4 km). As in other tracking sessions, the airplane tracking provided data that would not have been available to the ground tracking teams, such as locating bats on the YPG (with prior permission), checking for bats at the Senator and Los Flores Mines, finding bats flying to the east and west of the agricultural area, and those tagged at YEW (figures 40 and 41). Flying in the area around the YPG required constant vigilance for military aircraft (that were not on the airplane radio frequency) and communication with the Yuma International Airport to the south to avoid commercial and general aviation traffic. While using the airplane’s communication system, bat transmitter signals could not be received. February 2016 Tracking from Conservation Areas to Roosts On February 3, 2016, transmitters were placed on two female (#13c and #14c) and one male (#15c) California leaf-nosed bat captured in mist nets set at the PRDA (see tables 3 and 15), 1.9 miles (3.1 km) east of the 3C Mine along the All American Canal by Laguna Dam (see table 13). These bats were tracked back to the 3C Mine and appeared to roost there almost every night, as judged by the detections at dusk and dawn on the telemetry data logger placed in the entrance or ground trackers (see table 14). Occasionally Bat #13c was not detected exiting the 3C Mine and may have been roosting in the Los Flores Mine (a known California leaf-nosed bat roost) or another nearby mine as judged by detections near there during periodic aircraft flights to the east. Bat #14c was also detected foraging near the Los Flores Mine (see figure 38). At the end of the tracking session on February 19, the three bats captured at the PRDA were in the 3C Mine but could not be captured due to the inaccessible area where they roosted. A telemetry data logger placed at the PRDA did not detect any of the tagged bats from the 3C Mine. Due to high human visitation in this popular fishing and recreational area, the data logger and antenna had to be placed out of view from roads, trails, and large cleared areas, and away from the mist-netting site. Unfortunately, the location chosen was also not frequented by bats that prefer to forage along vegetation edges and gaps.
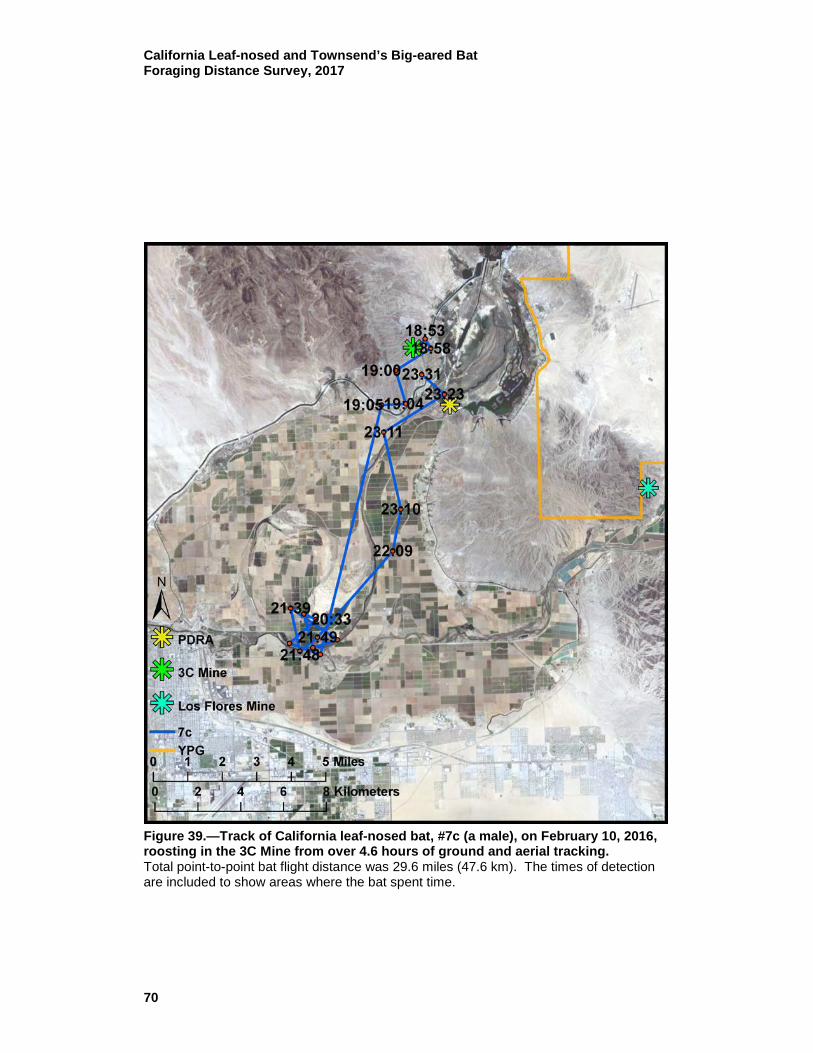
California Leaf-nosed and Townsend’s Big-eared Bat Foraging Distance Survey, 2017
70
Figure 39.—Track of California leaf-nosed bat, #7c (a male), on February 10, 2016, roosting in the 3C Mine from over 4.6 hours of ground and aerial tracking. Total point-to-point bat flight distance was 29.6 miles (47.6 km). The times of detection are included to show areas where the bat spent time.
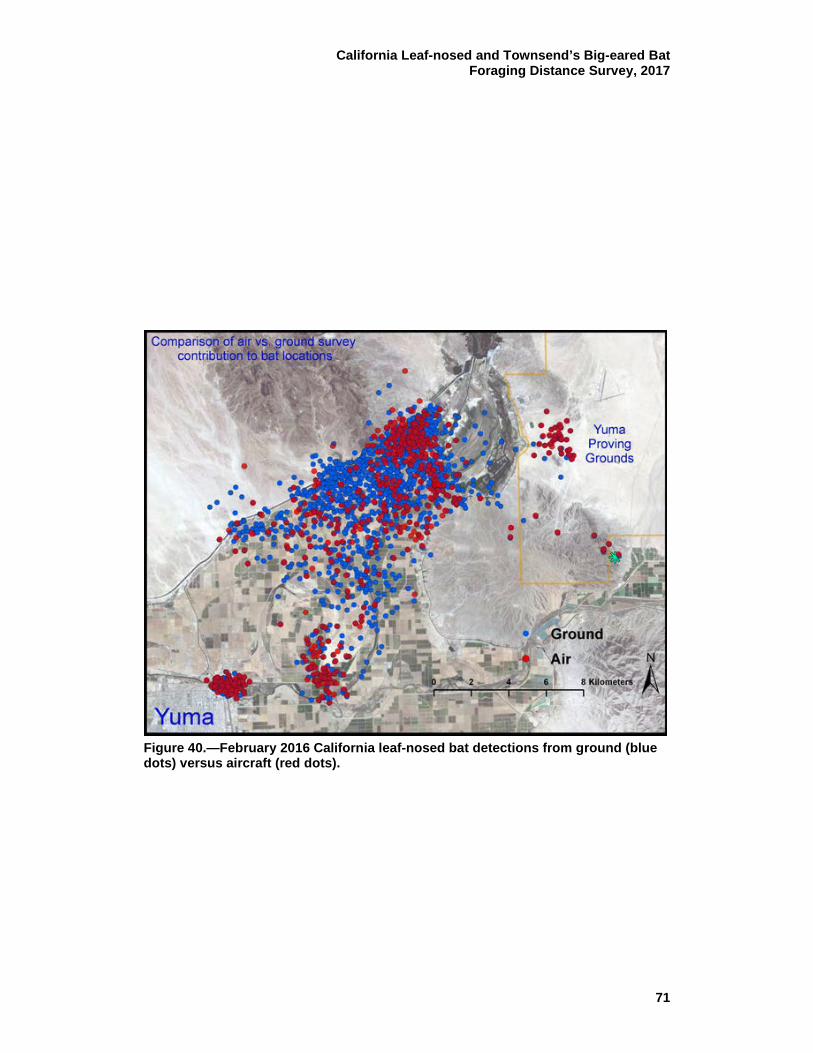
California Leaf-nosed and Townsend’s Big-eared Bat Foraging Distance Survey, 2017
71
Figure 40.—February 2016 California leaf-nosed bat detections from ground (blue dots) versus aircraft (red dots).

California Leaf-nosed and Townsend’s Big-eared Bat Foraging Distance Survey, 2017
72
Figure 41.—GPS track of airplane for 5.5 hours on February 16, 2016.
California Leaf-nosed and Townsend’s Big-eared Bat Foraging Distance Survey, 2017
73
Two female California leaf-nosed bats (#16c and #17c) were mist netted on February 8 at the YEW habitat creation area, a relatively recently planted restoration site close to urban Yuma and the I-8 bridge over the LCR (see table 3). The transmitters were detected in almost the same location as the bats’ release site when the airplane flew over before dark the next evening, and it was initially suspected that the bats had dropped their transmitters. Instead, intensive ground observer monitoring showed the bats were roosting inside the cave-like interior of the I-8 bridge, and their transmitters were detectable from the airplane when they were roosting there. The bats were mainly on the California side of the eastbound span in a thermally buffered side chamber. This was determined by entering the locked bridge interior with a Caltrans engineer on April 29, 2016. In February, about 35 California leaf-nosed bats were observed with night vision devices exiting from the bridge interior at dusk via gaps at the bridge abutment. An equal number of bats were present in the bridge in April, and both males and pregnant females were captured. The two bats (#16c and #17c) foraged within 1.5 miles (2.4 km) of the I-8 bridge either in YEW or other park areas along the LCR (figure 42). They night roosted between foraging bouts at the Yuma Territorial Prison, in the bridge, or in a deserted train station on the California side of the LCR. The 3C Mine is 10.2 miles (16.3 km) from YEW (see table 13). None of the tagged bats that roosted at the 3C Mine were ever detected at YEW, although both Bat #1c and Bat #7c (see figure 38) foraged at the bend in the LCR by the Gila River, a distance for them of about 10.5 miles (16.8 km) from the 3C Mine and only 2 miles (3.2 km) to the east of YEW (see figure 3). These data suggest that the California leaf-nosed bats roosting in the I-8 bridge could have arrived initially from the 3C Mine and that some bats from the 3C Mine could commute on a nightly basis. August 2016: Parker Area Townsend’s big-eared bats are one of the evaluation species for the LCR MSCP, and determining foraging distances for them from the maternity roost was a high priority. The Mountaineer Mine located southwest of Parker, Arizona, in the Riverside Mountains is the only known currently occupied roost for Townsend’s big-eared bats along the main stem of the LCR (Brown 2013, 2016; Brown and Berry 2003). In summer, California leaf-nosed bats and cave myotis (Myotis velifer) also share the roost. Estimating the colony size of Townsend’s big-eared bats is difficult because they roost in inaccessible parts of a mine down two shaft levels, and the species is very sensitive to disturbance. To conduct the annual census, observers watch both the adit and connecting shaft with night vision goggles during the evening bat exodus. Townsend’s big-eared bats have the same body dimensions and flight style as the more numerous California leaf-nosed bats, and the two cannot be distinguished in flight. The night following the exit count,
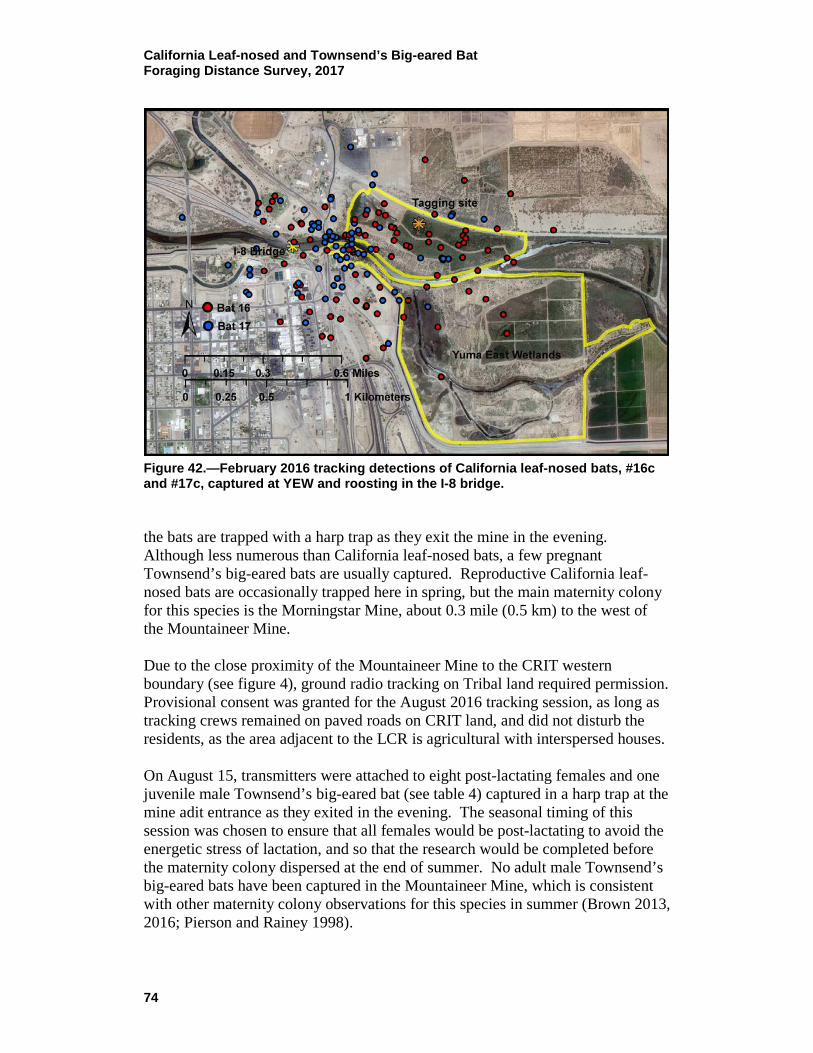
California Leaf-nosed and Townsend’s Big-eared Bat Foraging Distance Survey, 2017
74
Figure 42.—February 2016 tracking detections of California leaf-nosed bats, #16c and #17c, captured at YEW and roosting in the I-8 bridge. the bats are trapped with a harp trap as they exit the mine in the evening. Although less numerous than California leaf-nosed bats, a few pregnant Townsend’s big-eared bats are usually captured. Reproductive California leaf-nosed bats are occasionally trapped here in spring, but the main maternity colony for this species is the Morningstar Mine, about 0.3 mile (0.5 km) to the west of the Mountaineer Mine. Due to the close proximity of the Mountaineer Mine to the CRIT western boundary (see figure 4), ground radio tracking on Tribal land required permission. Provisional consent was granted for the August 2016 tracking session, as long as tracking crews remained on paved roads on CRIT land, and did not disturb the residents, as the area adjacent to the LCR is agricultural with interspersed houses. On August 15, transmitters were attached to eight post-lactating females and one juvenile male Townsend’s big-eared bat (see table 4) captured in a harp trap at the mine adit entrance as they exited in the evening. The seasonal timing of this session was chosen to ensure that all females would be post-lactating to avoid the energetic stress of lactation, and so that the research would be completed before the maternity colony dispersed at the end of summer. No adult male Townsend’s big-eared bats have been captured in the Mountaineer Mine, which is consistent with other maternity colony observations for this species in summer (Brown 2013, 2016; Pierson and Rainey 1998).
California Leaf-nosed and Townsend’s Big-eared Bat Foraging Distance Survey, 2017
75
Following the capture of the bats as they exited the Mountaineer Mine, none of the telemetered Townsend’s big-eared bats returned to the mine. Although the bats were active each evening, the ground trackers near the mine and the telemetry data logger at the mine portal did not detect the bats leaving the Mountaineer Mine. With the exception of one visit by a Townsend’s big-eared bat in the middle of one night, no activity by Townsend’s big-eared bats was detected in the mine over the next 2 weeks. Two other mines in the Riverside Mountains (Alice and Steece Mines) had historically sheltered Townsend’s big-eared bat colonies, but they had not been detected there for over 50 years (Brown and Berry 2003). The airplane circled the mountain wilderness area before sunset several nights to log the areas where emerging Townsend’s big-eared bats were first detected. When detections were plotted on a map, the Gold Dollar Mine appeared to be in the center of the emergence activity and in an area that was not easily accessible to ground tracking teams. Although located only 1 mile (1.6 km) west of the Mountaineer Mine, the difficult drive to the edge of the wilderness boundary and a strenuous hike in the afternoon heat on August 29 took over 5 hours. Seventy-five Townsend’s big-eared bats emerged from the mine, including five bats with transmitters still attached. Two more transmitters were recovered when the mine was entered after the bats had exited. Prior to August 29, a transmitter had been dropped by Bat #8d (Townsend’s big-eared bat) in a wash draining into the LCR on the California side of the LCR and another in a building night roost on CRIT land 7.2 miles (11.5 km) east of the Gold Dollar Mine. The bats were tracked through September 1, and none were recaptured by the end of the survey. Three bats’ transmitters (one California leaf-nosed bat and two Townsend’s big-eared bats) were dropped in the foraging area or night roosts, and four additional transmitters were recovered in day roosts in the Mountaineer (one California leaf-nosed bat), Gold Dollar (two Townsend’s big-eared bats), and Morningstar (one California leaf-nosed bat) Mines. The bats were tracked for 17 nights, and the maximum straight line distance that a Townsend’s big-eared bat was tracked was 9.5 miles (15.2 km), as shown in table 16. All straight line measurements likely underestimate the distance covered by Townsend’s big-eared bats while commuting and foraging, as flight paths were not direct. The airplane data demonstrated that the bats would usually head east upon emergence toward the LCR flood plain, but often they would first fly north to circle around the northern edge of the Riverside Mountains before heading to the LCR (figure 43). The MCP (38,354 ac) of the foraging habitat of Townsend’s big-eared bats (figure 44) encompasses an oxbow area of native vegetation west of the LCR on the California side near Lost Lake as well as a remnant of an old oxbow southeast of Poston, Arizona, beyond the agricultural fields. The bats were also detected in the intervening agricultural area. Figure 45 demonstrates the use of the Lost Lake oxbow feature and adjacent native habitat to the north along the LCR by all Townsend’s big-eared bats on August 21, 2016. Figure 46
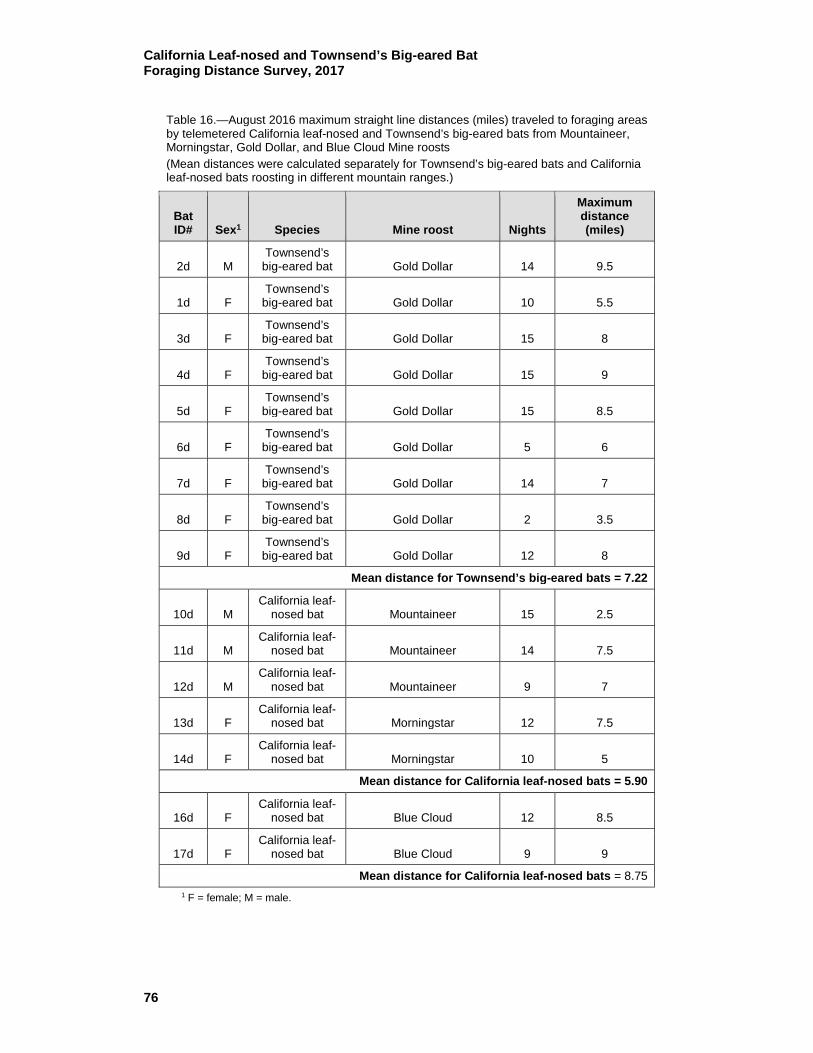
California Leaf-nosed and Townsend’s Big-eared Bat Foraging Distance Survey, 2017
76
Table 16.—August 2016 maximum straight line distances (miles) traveled to foraging areas by telemetered California leaf-nosed and Townsend’s big-eared bats from Mountaineer, Morningstar, Gold Dollar, and Blue Cloud Mine roosts (Mean distances were calculated separately for Townsend’s big-eared bats and California leaf-nosed bats roosting in different mountain ranges.)
Bat ID# Sex1 Species Mine roost Nights
Maximum distance (miles)
2d M Townsend’s
big-eared bat Gold Dollar 14 9.5
1d F Townsend’s
big-eared bat Gold Dollar 10 5.5
3d F Townsend’s
big-eared bat Gold Dollar 15 8
4d F Townsend’s
big-eared bat Gold Dollar 15 9
5d F Townsend’s
big-eared bat Gold Dollar 15 8.5
6d F Townsend’s
big-eared bat Gold Dollar 5 6
7d F Townsend’s
big-eared bat Gold Dollar 14 7
8d F Townsend’s
big-eared bat Gold Dollar 2 3.5
9d F Townsend’s
big-eared bat Gold Dollar 12 8
Mean distance for Townsend’s big-eared bats = 7.22
10d M California leaf-
nosed bat Mountaineer 15 2.5
11d M California leaf-
nosed bat Mountaineer 14 7.5
12d M California leaf-
nosed bat Mountaineer 9 7
13d F California leaf-
nosed bat Morningstar 12 7.5
14d F California leaf-
nosed bat Morningstar 10 5
Mean distance for California leaf-nosed bats = 5.90
16d F California leaf-
nosed bat Blue Cloud 12 8.5
17d F California leaf-
nosed bat Blue Cloud 9 9
Mean distance for California leaf-nosed bats = 8.75
1 F = female; M = male.
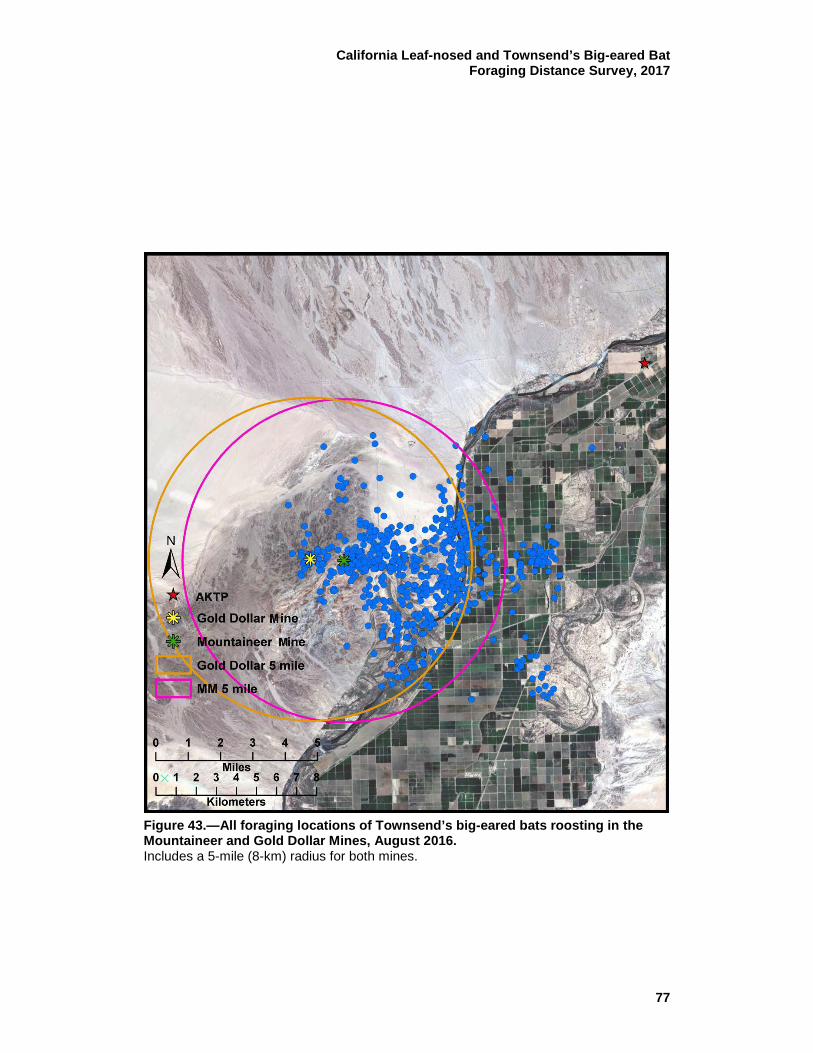
California Leaf-nosed and Townsend’s Big-eared Bat Foraging Distance Survey, 2017
77
Figure 43.—All foraging locations of Townsend’s big-eared bats roosting in the Mountaineer and Gold Dollar Mines, August 2016. Includes a 5-mile (8-km) radius for both mines.
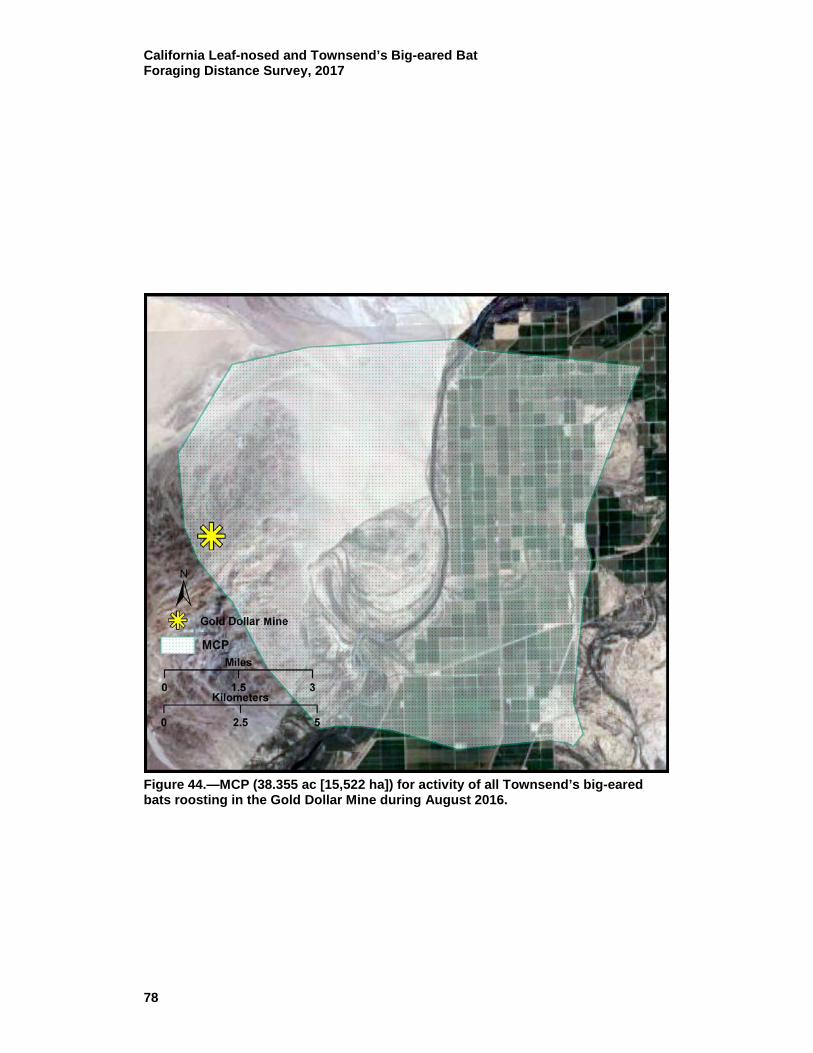
California Leaf-nosed and Townsend’s Big-eared Bat Foraging Distance Survey, 2017
78
Figure 44.—MCP (38.355 ac [15,522 ha]) for activity of all Townsend’s big-eared bats roosting in the Gold Dollar Mine during August 2016.
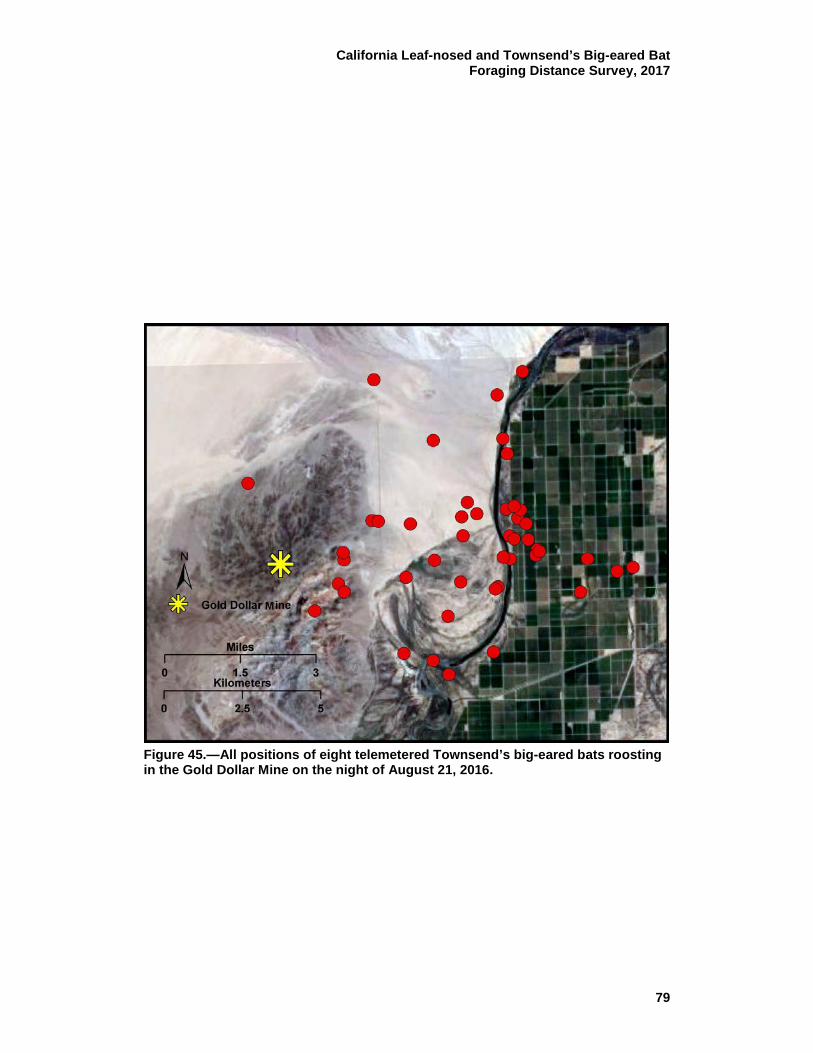
California Leaf-nosed and Townsend’s Big-eared Bat Foraging Distance Survey, 2017
79
Figure 45.—All positions of eight telemetered Townsend’s big-eared bats roosting in the Gold Dollar Mine on the night of August 21, 2016.
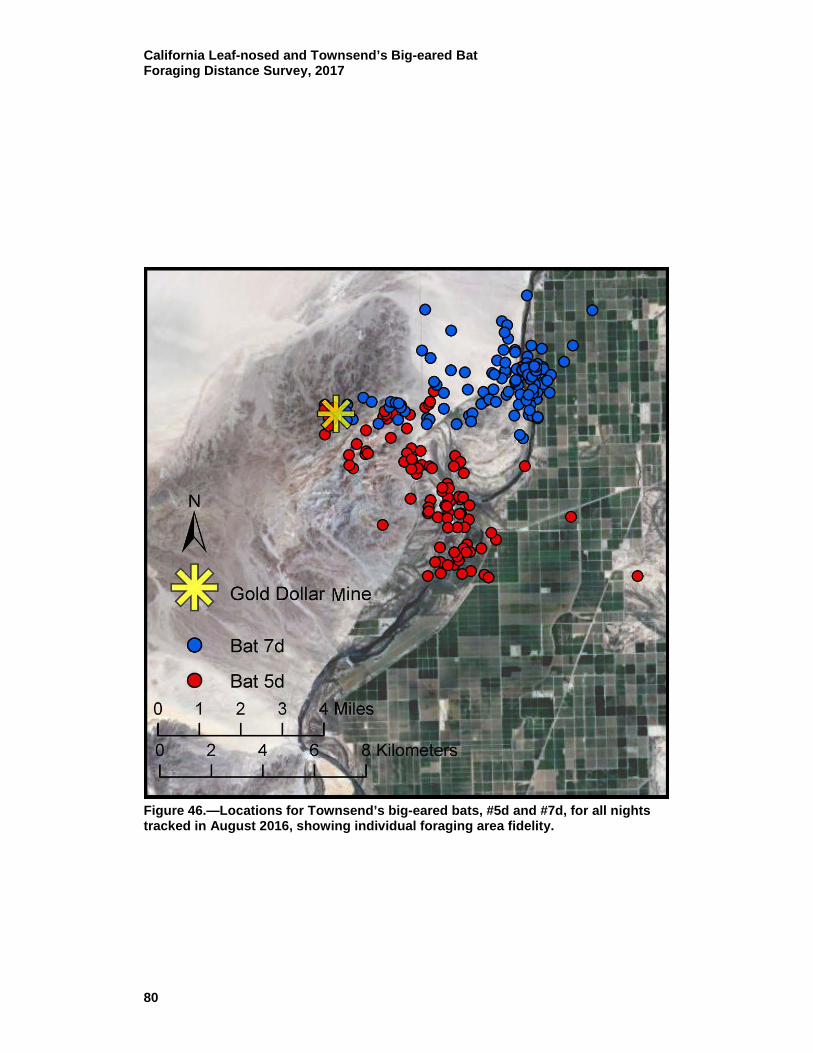
California Leaf-nosed and Townsend’s Big-eared Bat Foraging Distance Survey, 2017
80
Figure 46.—Locations for Townsend’s big-eared bats, #5d and #7d, for all nights tracked in August 2016, showing individual foraging area fidelity.

California Leaf-nosed and Townsend’s Big-eared Bat Foraging Distance Survey, 2017
81
shows the distinct foraging preference of two Townsend’s big-eared bats (#5d and #7d) for the entire tracking period. Two Townsend’s big-eared bats (#5d and #3d) were tracked by the airplane for 7.9 (12.6 km) and 10.8 miles (17.3 km) while foraging (figure 47). Since the area that the Townsend’s big-eared bats roosted and commuted from could not be covered by the ground tracking teams, the airplane was necessary in order to fill in the data for mountain areas west of the LCR and foraging areas on CRIT land not accessible by paved roads (figures 48 and 49). Thunderstorms and high winds prevented airplane tracking all or part of several nights. Flash floods one evening delayed the return of the ground tracking crew to Blythe for several hours. Although the Townsend’s big-eared bat was the focal species for this tracking session, transmitters were also attached to three male and three post-lactating female California leaf-nosed bats captured at the Mountaineer Mine adit portal (see table 4). Two of the male bats continued to roost in the Mountaineer Mine for the duration of the tracking session, but one male moved to the Calzona Mine drainage to the north of the Mountaineer Mine. There are several mine features in the area, and the exact mine used by Bat #12d was not located. The data logger at the adit portal of the Mountaineer Mine regularly logged Bat #10d and Bat #11d. At the end of the survey on September 1, Bat #10d, with a transmitter attached, was captured in the adit side of the mine, and the transmitter of Bat #11d could be detected on the shaft side, presumably still on the bat. Although the female California leaf-nosed bats were tagged at the Mountaineer Mine, they immediately moved to the Morningstar Mine. One of the females, Bat #15d, was found dead in the wash below the mine on the second night (and her distance traveled data were not included in analysis). By the end of the tracking session, Bat #14d dropped her transmitter in the Morningstar Mine, while Bat #13d lost her transmitter in a deserted building on CRIT land 5.1 miles (13.1 km) from the Morningstar Mine. The farthest straight line distance traveled from their roosts for male and female California leaf-nosed bats was 7.5 miles (12 km; see table 16) for Bat #13d, who was tracked to the native oxbow vegetation southeast of Poston, Arizona. Most of the bats foraged within 5 miles (8 km) northeast or east of the mine roosts (figure 50), often night roosting under the Agnes Wilson Road bridge over the LCR or in deserted buildings on CRIT land near the LCR. The MCPs of the two female California leaf-nosed bats were larger (12,991 ac) and totally overlapped that of the two males (8,173 ac; figure 51). The airplane was valuable in locating bats in the rugged mountain canyons and in areas to the northeast of the LCR on CRIT land (figures 49 and 52).
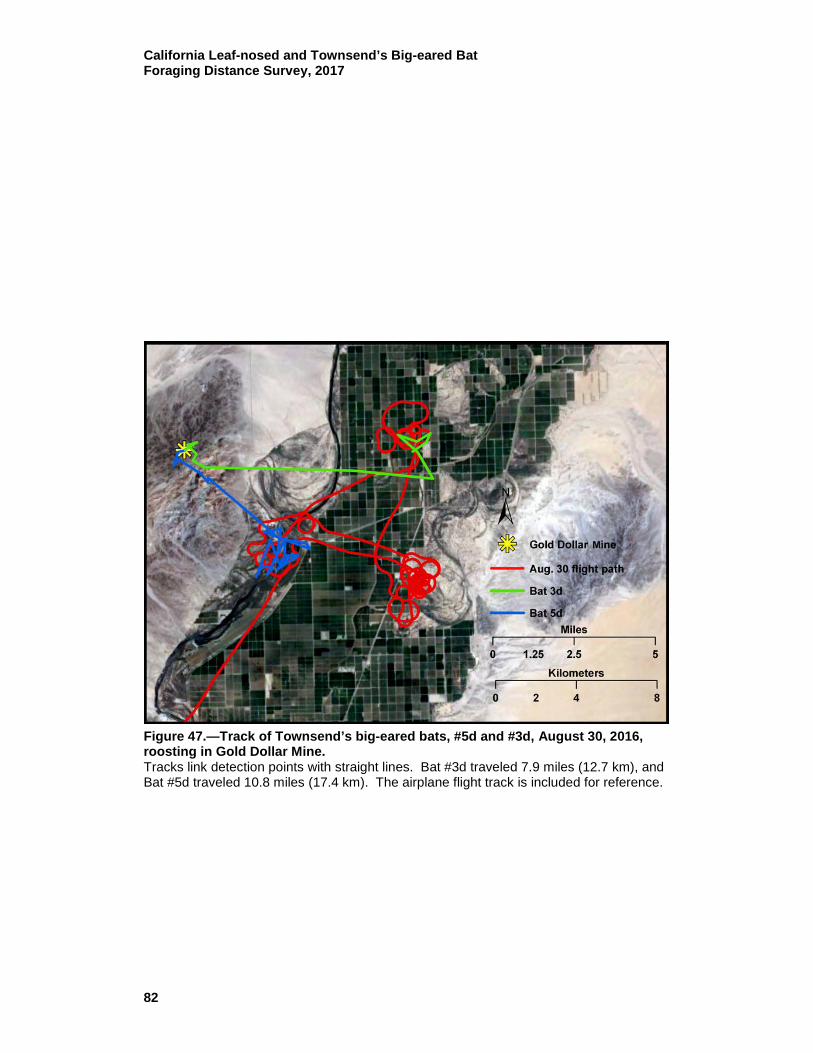
California Leaf-nosed and Townsend’s Big-eared Bat Foraging Distance Survey, 2017
82
Figure 47.—Track of Townsend’s big-eared bats, #5d and #3d, August 30, 2016, roosting in Gold Dollar Mine. Tracks link detection points with straight lines. Bat #3d traveled 7.9 miles (12.7 km), and Bat #5d traveled 10.8 miles (17.4 km). The airplane flight track is included for reference.
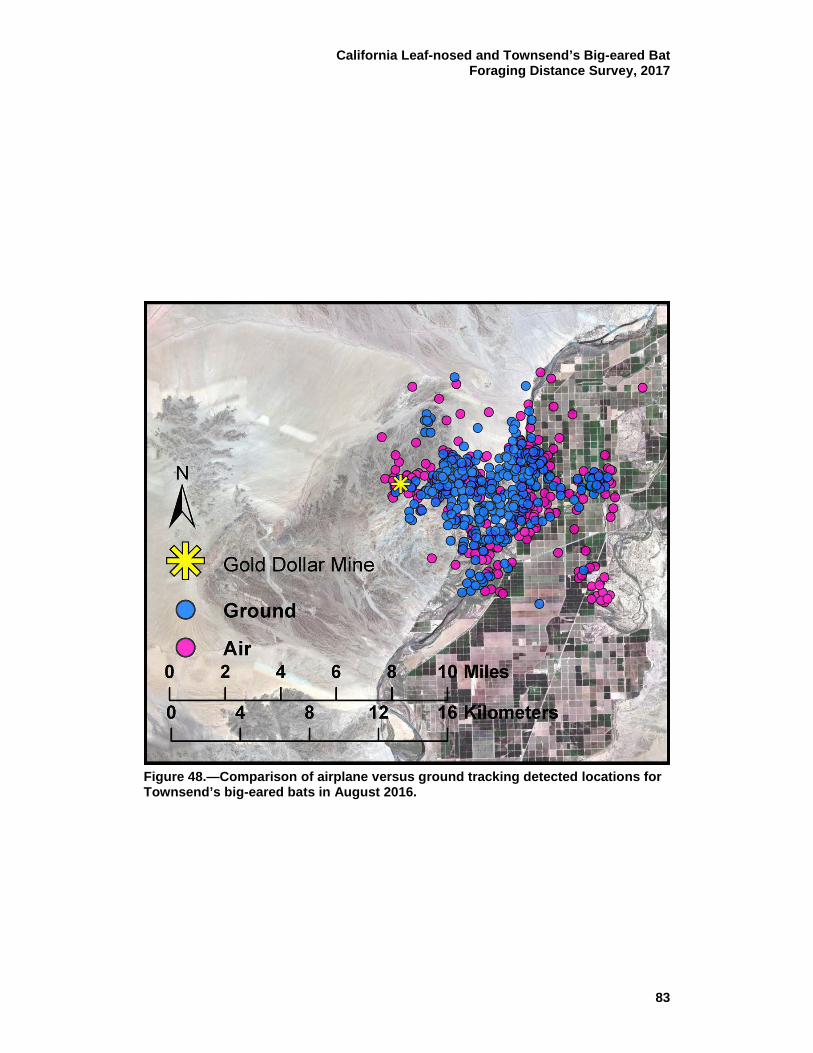
California Leaf-nosed and Townsend’s Big-eared Bat Foraging Distance Survey, 2017
83
Figure 48.—Comparison of airplane versus ground tracking detected locations for Townsend’s big-eared bats in August 2016.

California Leaf-nosed and Townsend’s Big-eared Bat Foraging Distance Survey, 2017
84
Figure 49.—Airplane GPS track, August 19, 2016, while searching for new Townsend’s big-eared bat roosts in the Riverside Mountains and roosts of California leaf-nosed bats, #16d and #17d, tagged at the AKTP.

California Leaf-nosed and Townsend’s Big-eared Bat Foraging Distance Survey, 2017
85
Figure 50.—All foraging locations of telemetered California leaf-nosed bats roosting in the Mountaineer and Morningstar Mines, August 2016. Includes a 5-mile (8-km) radius for both mines.

California Leaf-nosed and Townsend’s Big-eared Bat Foraging Distance Survey, 2017
86
Figure 51.—MCPs for foraging activity of Mountaineer Mine (male, 20,195 ac [8,173 ha]) and Morningstar Mine (female, 12,991 ac [5,257 ha]) California leaf-nosed bats during August 2016.
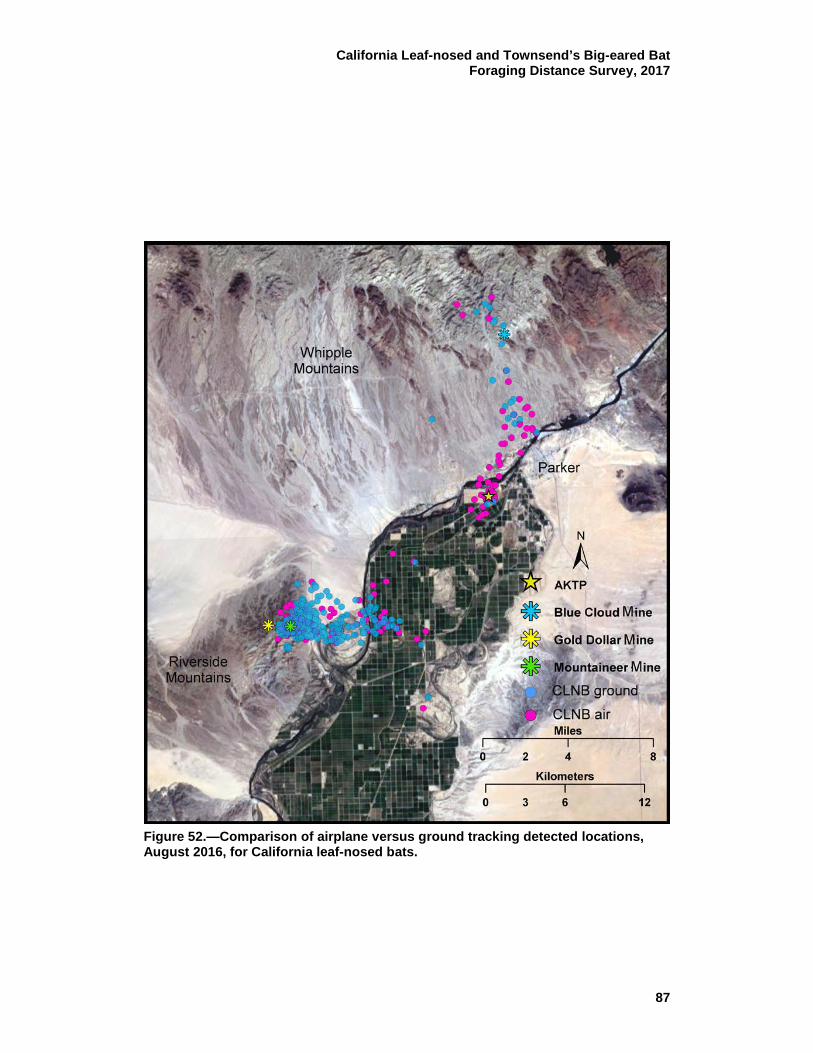
California Leaf-nosed and Townsend’s Big-eared Bat Foraging Distance Survey, 2017
87
Figure 52.—Comparison of airplane versus ground tracking detected locations, August 2016, for California leaf-nosed bats.

California Leaf-nosed and Townsend’s Big-eared Bat Foraging Distance Survey, 2017
88
August 2016 Tracking from the ‘Ahakhav Tribal Preserve to Roosts Two female California leaf-nosed bats were mist netted on August 16 at the AKTP on CRIT land south of Parker, Arizona. The bats did not leave the restoration area immediately after tagging and could not be back-tracked to a roost that night. The following evening after sunset, the airplane detected the bat (#17d) in the Riverside Mountains south of the Mountaineer Mine, as did one of the ground tracking teams. The bat returned to forage at the AKTP directly and was not located in the vicinity of the Riverside Mountains again (table 17).
Table 17.—August 2016 straight line distance (miles) for bat flights from known roosts to the AKTP
Roost AKTP
Mountaineer Mine 11.2
Gold Dollar Mine 11.6
Blue Cloud Mine 7.6 Several evenings were occupied searching by air for the emerging bats north of Parker in the Buckskin Mountains and northwest of Parker in the Whipple Mountain Wilderness Area. One of the bats (#16d) emerged in the vicinity of the Blue Cloud Mine (figure 53), while the other (#17d) was located in the area of a major wash downstream of the mine. No mines were located in the area where the signals of Bat #17d appeared, but in the steep-sided washes there were apparently deep natural caves that were inaccessible from the ground. Several days of ground surveys by tracking teams in the wilderness area failed to locate the precise roosts, but aerial detections placed Bat #16d 8.5 miles (13.6 km) and Bat #17d 9 miles (14.4 km) from the AKTP. Since the precise roosts were not determined, all distances traveled to the AKTP are estimates (see tables 16 and 17). A female California leaf-nosed bat previously banded at the AKTP (Calvert 2016b) was found in a mine adit near the Blue Cloud Mine. Bat #16d and Bat #17d continued to forage each night at the AKTP, flying to the restoration area directly after emergence from their underground roosts. Neither of these bats was recaptured by the end of the tracking period on September 1, nor were their transmitters recovered.
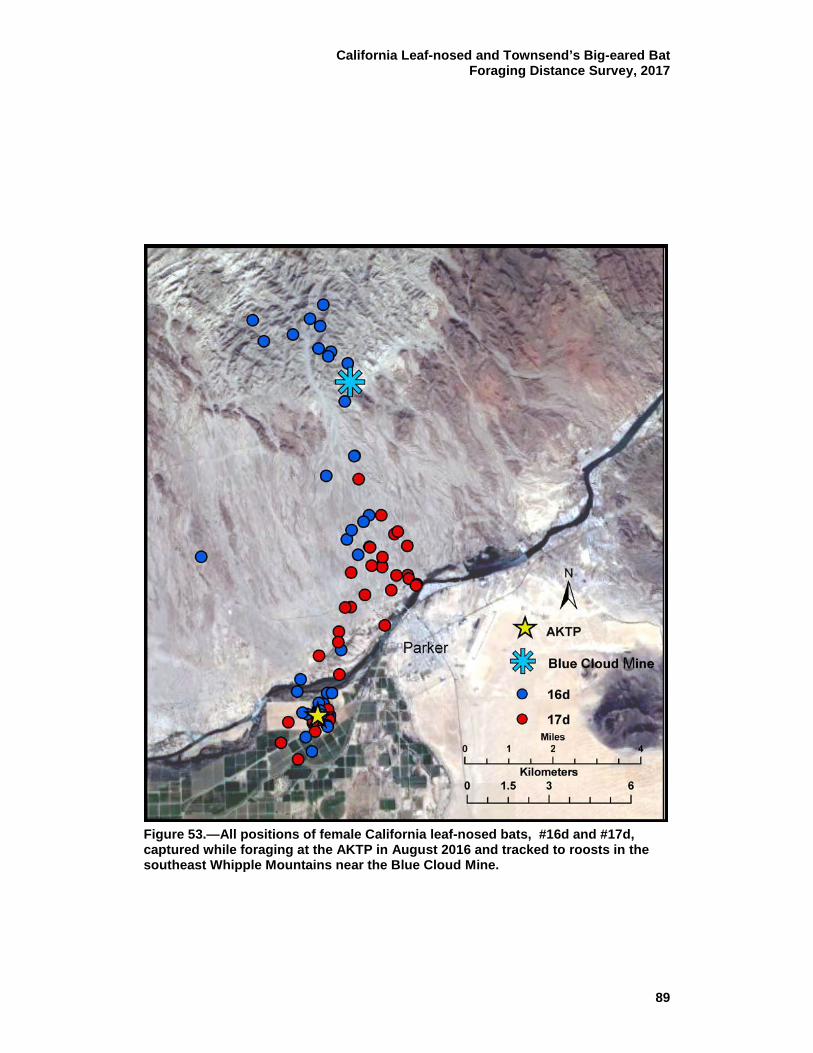
California Leaf-nosed and Townsend’s Big-eared Bat Foraging Distance Survey, 2017
89
Figure 53.—All positions of female California leaf-nosed bats, #16d and #17d, captured while foraging at the AKTP in August 2016 and tracked to roosts in the southeast Whipple Mountains near the Blue Cloud Mine.

California Leaf-nosed and Townsend’s Big-eared Bat Foraging Distance Survey, 2017
90
Airplane tracking was more difficult during this session, as fuel was not available at the Parker Airport in the evening, so the airplane needed to return to Blythe. The maximum total flight time was 5 hours each night, with over an hour being commuting time from Blythe. At times, the airplane and crew remained for several hours on the ground at the Parker Airport while waiting for the capture and release of bats at the AKTP or BLCA.
DISCUSSION The 2015 to 2016 telemetry project met the goals of determining the foraging distances traveled by California leaf-nosed and Townsend’s big-eared bats from their roosts and from LCR MSCP conservation areas and HCAs to roosts (some of which were previously unknown), and to document foraging areas. The farthest detection from the roost for California leaf-nosed bats was 10.9 miles (17.4 km) for Bat #16b and 9.5 miles (15.2 km) for Townsend’s big-eared bats, Bat #2d (see tables 10 and 16). These measurements were usually calculated as straight line distances between the known roost and farthest detection from it. However, the bats seldom flew a straight path and typically followed the wash terrain. California Leaf-nosed Bats California leaf-nosed bats fly close to vegetation, gleaning large moths and inactive, diurnal insects such as butterflies, grasshoppers, and katydids (Anderson 1969; Huey 1925; Stager 1943; Vaughan 1959). Although California leaf-nosed bats can echolocate, they appear to forage largely by utilizing prey-produced sounds and vision, even at low ambient light levels. The strategy of gleaning larger prey from the substrate appears to reduce the total time and energy necessary for foraging compared to aerial insectivory (Bell 1985; Bell and Fenton 1986). In telemetry studies in the California and Arizona desert, California leaf-nosed bats foraged in arborescent dry wash vegetation (Brown et al. 1993, 1999; Dalton et al. 2000). In the Cargo Muchacho Mountains of California (Brown et al. 1993) in June 1992, radio-tagged male California leaf-nosed bats traveled at least 5 miles (8 km). The transmitter signals were detectable most of the evening since the bats roosted in shallow mines or trees between foraging bouts. In June 1993, female California leaf-nosed bats were also tracked, and they shared foraging areas with males, but returned to the maternity roost several times nightly to nurse dependent young instead of occupying a separate night roost. During the December 1992 survey, bats of both sexes foraged within 1 mile (1.6 km) of their deep, warm mine roosts (> 80 degrees Fahrenheit [ºF]) and stayed on the surface

California Leaf-nosed and Townsend’s Big-eared Bat Foraging Distance Survey, 2017
91
for less than an hour per foraging bout. That winter temperatures were low, dropping to about 40 ºF. Since California leaf-nosed bats cannot lower their body temperatures to hibernate in winter, they remain active year round in the temperate zone by selecting warm roosts (Brown and Berry 1998, 2004; Bell et al. 1986). In southern Arizona, desert trees are not confined to washes, and telemetered California leaf-nosed bats ranged over the hills as well as in the valleys and washes, spreading out in multiple directions from the roost (Brown et al. 1999; Dalton et al. 2000). As in the California study (Brown et al. 1993), California leaf-nosed bats had smaller foraging areas in winter and remained on the surface for shorter periods of time than in summer. These surveys were conducted with ground-based tracking only, and not all bats were detected at all times, so the maximum foraging distances obtained may have been limited by the geographic scope of the technique. In the current 2015–16 surveys, 68 California leaf-nosed bats (33 males and 35 females) in 3 distinct geographic regions along the LCR were tacked for 4 sessions. The roost was not the center of the foraging habitat and often represented the apex of a triangular fan directed toward the LCR. This result has conservation implications since impact mitigation for some projects on public lands have required that foraging habitat be protected only within a 5-mile (8 km) radius of a roost. As shown in the current study, California leaf-nosed bats will travel more than 10 miles (16 km) from a roost in one direction while foraging (see figure 15). Most of the bats tracked were active in the more mesic foraging habitat near the LCR. Although this study demonstrated that California leaf-nosed bats, Bat #1a and Bat #1c, were capable of flying the 10 miles (16 km) to the CVCA (see table 7) from the Stonehouse or Roosevelt Mines during foraging bouts, no telemetered bats from those mines were detected at the conservation areas during the course of the study, either by remote data loggers at conservation areas or airplane tracking. However, the 17 California leaf-nosed bats tagged in winter and the 19 California leaf-nosed bats tagged in summer from the Stonehouse and Roosevelt Mines are only a small sample of the several thousand California leaf-nosed bats living in these mines (Brown 2013, 2016). The concentration of the tagged bats in the same general foraging area along the LCR in both tracking sessions in 2015 is remarkable. The remnant native vegetation at the margins of irrigated agricultural fields appears to provide adequate prey resources and removes the need for California leaf-nosed bats to travel farther east to the LCR MSCP conservation areas and other HCAs. The lush planted cottonwoods (Populus fremontii) and willows (Salix goodingii) at the CVCA and Cibola NWR Unit #1 are destinations for California leaf-nosed bats (#13a, #14a, #151, #15b, and #16b). These bats roosted in the Hart Mine and more arid day roosts to the east and south of the LCR on the YPG from over
California Leaf-nosed and Townsend’s Big-eared Bat Foraging Distance Survey, 2017
92
10 miles (16 km) away (see table 10; figure 32). The fidelity of bats tagged at the PVER, Cibola NWR Unit #1, and the CVCA in February and/or August 2015 to the area in the conservation areas where they initially were captured while foraging was demonstrated by the repeated detection of those individuals by the remote logger placed adjacent to the mist-netting sites (see tables 11 and 12). In February 2016, the data logger at the PRDA for security reasons was placed away from the dirt foot and vehicle track where the bats were captured. Even though Bat #13c, Bat #14c, and Bat #15c were detected most nights by air and ground tracking at the PRDA, the logger never detected these bats at the more secluded location away from the netting site. Foraging areas and distances can change between seasons for California leaf-nosed bats probably due to changes and availability of the prey insects. In February, the northwest foraging area with very large creosote bushes and microphyll woodland vegetation was visited by four of the eight bats with transmitters still attached (#1a, #9a, #16a, and #18a). However, no bats in August were tracked to this area. During the winter and summer 2015 tracking of California leaf-nosed bats from the Stonehouse Mine, three males were recaptured in August that had been originally tagged in February. During the February session, Bat #18a,b was tracked to this northwest area, while in August that bat foraged on the LCR flood plain to the east (see figure 23). The two other males, Bat #7a and Bat #19a, foraged in the same areas toward the agricultural fields to the east in both seasons (see figures 22 and 24). For the first three tracking sessions, female California leaf-nosed bats traveled slightly farther than males, had larger MCPs, and at times used different foraging areas (see tables 8, 9, and 15; figures 16, 17, 18, and 35). For August 2016, both sexes foraged closer to the roosts than bats in prior tracking sessions (see table 16), although the sample size of California leaf-nosed bats for that session was smaller (n = 5). The foraging areas of males and females, as judged by the MCP, overlapped (see figure 50). If pregnant or lactating California leaf-nosed bats had been tracked, different foraging areas, distances, and MCPs might have emerged. The transmitter weight and position can increase the energetic demands and alter maneuverability for bats at any time of the year (Aldridge and Brigham 1988). During pregnancy and lactation, the female bats have higher energy demands and forage longer without the addition of carrying a transmitter while foraging. A prior California leaf-nosed bat telemetry study resulted in the death of the both the lactating female and her pup (Brown et al. 1993). Consequently, bats have not been tracked during this reproductive period again. The distance flown by foraging bats tracked in this study during the night was much greater than twice the maximum straight line distance traveled from the roost to the foraging area. On February 15, 2015, a female California leaf-nosed bat (#1a) was continuously tracked by an airplane and ground trackers for
California Leaf-nosed and Townsend’s Big-eared Bat Foraging Distance Survey, 2017
93
5.2 hours (until 2315) and traveled over 50 miles (80 km) during that period (see figure 19), although the farthest straight line distance from the roost during this period was only 7.5 miles (12.1 km). After the tracking teams left the area around 0100, this bat could have continued to forage and travel farther. In February 2016, the telemetry data logger 20 feet inside the 3C Mine portal recorded bat activity throughout the night, although it could not differentiate if bats exited or entered. The maximum distance values generated by this project (see tables 8, 9, 10, 15, and 16) are actually the “minimum” maximum distance that a bat probably flew. All of the distances for tracking were generated by triangulation between ground tracking teams and detections from the airplane. However, both air and ground tracking teams were not usually active in the 4 to 5 pre-dawn hours (depending on the season). In previous tracking studies, most California leaf-nosed bats became inactive by midnight, and either night roosted near the foraging area or returned to the mine roost (Brown et al. 1993, 1999; Dalton et al. 2000). This period can yield little data and may be cold (in winter) for the ground crew, so tracking usually stops when few or no bats are detected for an hour. Bat activity typically increases in the hour before dawn, and the bats may forage again before returning to their day roosts. On August 15, 2015, the ground crew teams tracked all night, and the airplane flew from 0030 until after dawn on August 16. The remaining seven bats with transmitters were relatively inactive during this period. In both winter and summer 2015, some California leaf-nosed bats night roosted in stacks of hay bales (#6a, #1b, #2b, and #3b), which were constantly being created and removed by the farmers. Two transmitters were recovered from small cavities between the covered bales (#6a and #3b). One of the telemetered bats, (#2b), night roosted on August 15 in a chamber within one of the numerous fabric covered stacks of alfalfa (Medicago sativa) hay bales. When the signal was still there at dawn, it was assumed that she had dropped her transmitter. However, the pre-dawn hours were quite windy, and during the following evening of August 16 she returned to the Roosevelt Mine roost. Other more permanent night roosts used by California leaf-nosed bats were in deserted buildings (#1a and #15b) and 3-foot-diameter concrete irrigation culverts between agricultural fields (#1a and #2b). In August 2016, a California leaf-nosed bat, Bat #13d, night roosted in deserted buildings on CRIT land, and Bat #14d roosted under the Agnes Wilson Bridge over the LCR. One of the houses on the Arizona side of the LCR used by night roosting bats, Bat #1d, Bat #7d, and Bat #14d, tagged at the Mountaineer Mine also had a small resident maternity colony of California leaf-nosed bats during the day. The back-tracking of California leaf-nosed bats from the conservation areas and HCAs identified new roosting sites. Most known winter colonies of California leaf-nosed bats in the United States are in warm, deep mines and caves (Brown and Berry 2004), although there are no large caves in the project area along the
California Leaf-nosed and Townsend’s Big-eared Bat Foraging Distance Survey, 2017
94
LCR. Outside temperatures in the desert are hot in late spring and summer, and maternity colonies roost in shallower mines, caves, and even in buildings (Brown and Berry 1998, 2004). A small maternity colony of California leaf-nosed bats is known to roost in a shallow cave in the eastern Big Maria Mountains not far from the LCR (Brown and Berry 1998, 2004). In February 2015, the California leaf-nosed bats captured at the PVER were tracked to a mine complex near Goodman Wash in the Dome Rock Mountains on CRIT land that could not be accessed on the ground. In August 2015, the two female California leaf-nosed bats captured at the CVCA (#15b and #16b) roosted in inaccessible rock cavities on the YPG. Reclamation (Calvert 2016a, 2016b) has regularly mist netted California leaf-nosed bats, including reproductive females, at the AKTP. A nearby California leaf-nosed bat roost is in the Rio Vista Mine in the Buckskin Mountains north of Parker). However, the two post-lactating females, Bat #16d and Bat #17d, telemetered at the AKTP were determined to be day roosting near the Blue Cloud Mine to the northwest in the Whipple Mountain Wilderness Area (see figure 53). The rugged terrain with no road access, and the need to keep the limited ground tracking teams to the south in the Riverside Mountains monitoring Townsend’s big-eared bats, made identifying the roost locations difficult. One of the bats (#17d) appeared to emerge in an area of deep, narrow canyons with eroded cavities in the walls to the south of the Blue Cloud Mine. A ground team was in that area one night, but did not localize the roost before the bat presumably dropped the transmitter and was not detected again. Bat #16d was detected by air, emerging northwest of the Blue Cloud Mine, but again the exact location was not reachable by a ground team. The distance traveled was probably greater than the 7.6 miles (12.2 km; see table 17) between the Blue Cloud Mine and AKTP. The link between this mine area and the AKTP was supported by the capture of a female California leaf-nosed bat in a mine near the Blue Cloud that had been banded at the AKTP (Calvert 2016b). The most novel discovery from LCR MSCP conservation area back-tracking was locating a small colony of California leaf-nosed bats roosting inside the I-8 bridge near YEW. YEW is a relatively recently restored area (planted between 2000 and 2013). It is speculated that bats from the 3C Mine started foraging in the YEW area and discovered the relatively warm bridge interior (78 ºF) as a roosting area, which could eliminate the long commute from the 3C Mine (82 ºF). They could forage at YEW, within a mile of the bridge (see figure 42), energetically balancing a slightly cooler roost with the shorter foraging distance (Bell et al. 1986). The exit counts in February and April 2016 of about 35 bats suggests year-round use. Possibly as the vegetation matures at YEW, the carrying capacity of the foraging habitat could support more bats roosting in the bridge.
California Leaf-nosed and Townsend’s Big-eared Bat Foraging Distance Survey, 2017
95
Townsend’s Big-eared Bats The following discussion of Townsend’s big-eared bats is applicable to both western subspecies (Corynorhinus townsendii townsendii and pallescens). The current survey is the first telemetry study of foraging behavior and flight distance of Townsend’s big-eared bats in the California desert. Townsend’s big-eared bats captured at the Mountaineer Mine (bats quickly relocated to the Gold Dollar Mine) were tracked a maximum of 9.5 miles (15.2 km) from the roost with an MCP encompassing 38,355 ac (15,522 ha) (see figure 44). The movement after roost emergence was directed to the northeast and east in a broader fan toward the LCR (see figure 43). The foraging habitat varied between native vegetation along the LCR and remnant oxbows of the historic LCR near Poston, to planted trees (possibly cottonwoods) associated with buildings on CRIT land. Because the ground trackers could not leave paved roads, foraging habitat on CRIT land was not precisely determined. Individual bats exhibited foraging area fidelity (#3d, #5d, and #7d; see figure 46) and made regular stops to night roost in several buildings on CRIT land (#1d, #7d, and #9d), including the building with the California leaf-nosed bat maternity colony near Agnes Wilson Bridge. This night roosting behavior in structures is common for Townsend’s big-eared bats in other areas (Pierson and Rainey 1998). For Townsend’s big-eared bats, this survey did not generate any data on foraging area differences between seasons and sexes, since the female bats only roost in the Mountaineer Mine in spring and summer, and no adult males are present. The Townsend’s big-eared bats were only tracked in August 2016. Eight bats were post-reproductive females and one was a juvenile male (#2d), which flew farther than any of the females (see table 16). Although efforts to mist net and tag any Townsend’s big-eared bats at the BLCA in the Havasu National Wildlife Refuge in August 2015 and 2016 were unsuccessful, finding and protecting the maternity colony for the reproductive females captured there previously (Calvert 2012) is still an important goal for Brown Berry Consulting. In August 2016, as soon as the Townsend’s big-eared bats were captured and tagged while exiting the Mountaineer Mine, they immediately abandoned the mine as a day roost. One bat (#5d) subsequently visited the Mountaineer Mine on one occasion in the middle of the night as determined by the data logger installed there. It took several nights of aerial tracking over the Riverside Mountain Wilderness Area to find the relocated Townsend’s big-eared bats in the Gold Dollar Mine about 1 mile (1.6 km) to the west of the Mountaineer Mine. Following a difficult drive and hike a few days later, all of the remaining telemetered Townsend’s big-eared bats were discovered along with a considerable amount of Townsend’s big-eared bat guano. The Gold Dollar Mine had been last visited by Dr. Patricia Brown in July 2003 in a search for Townsend’s big-eared bat roosts, and no Townsend’s big-eared bats were present then (Brown 2013, 2016).
California Leaf-nosed and Townsend’s Big-eared Bat Foraging Distance Survey, 2017
96
Roost abandonment following even slight human intrusion is one suspected reason that the species has declined across the Western United States and is considered a Species of Special Management Concern for most State and Federal agencies. Until the discovery of the roost in the Gold Dollar Mine, the Mountaineer Mine was the only mine along the LCR where Townsend’s big-eared bats had been captured in the last 60 years. Grinnell (1914) first discovered the “pale lump-nosed bat” in the Riverside Mountains roosting “at the end of a sloping drift in the Steece copper mine.” Howell (1920) visited the Old Senator Mine near the LCR (5.9 miles [9.5 km] north of the Potholes Mine) on May 14, 1918, and “found about a hundred females, each with a naked young from a few days old to a quarter grown, clinging to the roof of a gallery at the two-hundred-foot level. They were in close formation, but not touching one another, and, although not as wild as California leaf-nosed bats, they were quite ready to fly. The only way we could capture them was wildly to grab at a bunch with both hands.” As noted by Dr. Ken Stager (1939), cave myotis in the Alice Mine were “rivaled in numbers by Corynorhinus rafinesquii pallescens and Macrotus californicus only. A cluster of Townsend’s big-eared bats 3 feet by 12 feet across was found in the main level of the Alice Mine in the Riverside Mountains (Stager 1939). The estimated cluster density in most maternity colonies is 100 bats per square foot (Pierson and Rainey 1998). At this density, the colony in the Alice Mine in the 1930s would have been over 3,000 bats and would have been the largest colony known from California. The last specimen collected from the Alice Mine was in April 1954. When Dr. Patricia Brown first visited the Alice Mine in August 1968, piles of old guano remained, but these have now been trampled to dust. In the early 1960s, Musgrove (Cockrum et al. 1996) banded or collected from a Townsend’s big-eared bat maternity colony in the Homestake Mine near Davis Dam in Nevada. During several visits to this mine since May 2001, no evidence of this species was found (Brown 2013, 2016). The population status (stable or declining) of the Mountaineer Mine colony is unknown. Since 2002, a few female Townsend’s big-eared bats have been captured in mist nets or harp traps as they exited the Mountaineer Mine after dark (Brown and Berry 2003; Brown 2016). However, determining the size of the Townsend’s big-eared bat colony is difficult since it is impossible to differentiate between California leaf-nosed and Townsend’s big-eared bats and as they exit the mine. Regular entry into the roost could cause abandonment, as Townsend’s big-eared bats are very sensitive to disturbance. A cluster of less than 50 bats was present on the third level down the Mountaineer Mine in July 2003, when it was entered during the day (Brown 2013). Fresh (not dusty) beer cans were evidence of human intrusion even at the lower levels, which require climbing down dangerous old mining ladders. A bat gate was installed on the Mountaineer Mine adit and a large cupola over the shaft in late fall 2012 to protect people and bats.

California Leaf-nosed and Townsend’s Big-eared Bat Foraging Distance Survey, 2017
97
The proximity of good foraging habitat appears to be a determining factor in roost selection. In recent surveys in the Panamint Mountains in California, mines with suitable temperatures were occupied by large maternity colonies (> 100 bats) only if they were within 2 miles (3.2 km) of a canyon with water (Dr. P. Brown, personal observation). Brown et al. (1994) determined by radio telemetry that this species on Santa Cruz Island bypassed lush introduced vegetation near their day roost, and traveled up to 3 miles (4.8 km) to feed in native oak and ironwood forest. Although the diet of California populations of Townsend’s big-eared bats has not been analyzed, elsewhere this species is a lepidopteran specialist, feeding primarily (> 90% of the diet) on medium-sized moths (Sample and Whitmore 1993; Whitaker, Jr. et al. 1977, 1981). The dense native riparian vegetation documented by Dr. Stager (1939) has been removed along the LCR over the past 50 years and replaced with agricultural fields that are subjected to extensive pesticide spraying. In forested areas, spraying for lepidopteran species may alter the prey base for Townsend’s big-eared bats (Perkins and Schommer 1991). The loss of foraging habitat, combined with pesticide spraying, may be contributing factors in the decline of Townsend’s big-eared bats. Along the relatively pristine flood plain of the Bill Williams River, Townsend’s big-eared bats are mist netted in the warmer months (Brown and Berry 2003; Calvert 2012); a large maternity colony occupies one of the Planet Mines (Brown 2016). The decline in Townsend’s big-eared bat numbers across the Western United States is documented in the conservation assessment and strategy (Pierson et al. 1999) prepared by scientists and land managers for the Idaho Conservation Effort. The former Category 2 candidate is currently a U.S. Fish and Wildlife Service and California Department of Fish and Wildlife (CDFW) species of concern, and it is considered sensitive by most districts of the Bureau of Land Management and U.S. Forest Service. The Western Bat Working Group rates the Townsend’s big-eared bat as having a high risk of imperilment across its range. Studies conducted by Pierson and Rainey (1998) for the CDFW showed marked population declines for this species in many areas of California, and they recommended that Townsend’s big-eared bats be listed as threatened in the State. Although several causative factors can be identified, roost disturbance or destruction appears to be the most important reason for the decline of Townsend’s big-eared bats in most areas (Pierson et al. 1999). The tendency for this species to roost in highly visible clusters on open surfaces near roost entrances makes them particularly vulnerable to disturbance. Additionally, low reproductive potential and high roost fidelity increase the risks for the species. In all but 2 of 38 documented cases, roost loss in California was directly linked to human activity (e.g., demolition, renewed mining, entrance closure, human-induced fire, renovation, or roost disturbance) (Pierson and Rainey 1998). Townsend’s big-eared bats are so sensitive to human disturbance that a single entry into a maternity roost can cause a colony to abandon or move to an alternate roost, often with females leaving their non-volant pups behind (Graham 1966; Stihler and Hall 1993; Dr. P. Brown, personal
California Leaf-nosed and Townsend’s Big-eared Bat Foraging Distance Survey, 2017
98
observation). Inappropriate behavior on the part of well-intentioned researchers and others (i.e., entry into maternity roosts or hibernacula and capturing animals in roosts) can also contribute to population declines. Arizona Myotis A century ago, Arizona myotis were a relatively common species along the LCR before the dams and agricultural conversion changed the riparian flood plain (Grinnell 1914). The August 2015 capture of a post-lactating female at the CVCA and subsequent tracking of the bat to a bridge over a canal south of Palo Verde, California (see figure 34) is the first verified record of Arizona myotis roosting in California in over 70 years (Brown and Berry 2003). Previously, Reclamation (Calvert 2016a, 2016b) had captured reproductive female and juvenile Arizona myotis along the LCR at the AKTP and a non-reproductive female and a juvenile male at Cibola NWR Unit #1 (Calvert and Neiswenter 2012). The Arizona Game and Fish Department biologists tracked a Arizona myotis to a roost in the skirts of a non-native palm tree near the AKTP, where tagged yellow bats also roosted (Calvert 2016a). When first described in 1905 (Hollister 1909), the Arizona myotis was named the Hollister’s bat, and the topotype was collected in May 1905, 10 miles (16 km) north of Needles at Fort Mojave on the California side of the LCR in the “dense cottonwood bottomlands of the Colorado River.” In fact, H.W. Henshaw of the Wheeler Expedition in 1875 had collected a specimen in the “Mojave Desert” and deposited it in the U.S. National Museum (Cockrum et al. 1996). In May 1910, Joseph Grinnell (1914), on a float trip on the LCR from Needles to Yuma, collected a female Hollister bat 4 miles (6.4 km) south of Potholes “shot at late dusk close to the riverbank between files of cottonwoods, in just the same location as those taken by Hollister.” The next five specimens were collected “four miles northeast of Yuma, California” and were “shot over water in a back eddy of the river. Here the bats arrived in considerable numbers at early dusk to drink, flitting down to the water’s surface and dipping several times before flying off among the willows and cottonwoods.” Grinnell “used a boat in shooting and retrieving the specimens.” Other specimens were collected in 1924 from Potholes (San Diego County Museum) and in 1930 from Fort Yuma (California Academy of Sciences). In August 1937, Dr. Stager (1943) collected a male Arizona myotis in a mine in the Riverside Mountains and in 1939 discovered a large maternity colony (approximately 800 bats) roosting between horizontal support beams of a bridge on the LCR at Blythe prior to the current I-10. Between 1939 and 1945, Dr. Stager and Dr. Denny Constantine collected 87 specimens (primarily females) from this bridge (deposited in the Los Angeles County Museum of Natural History). The bridge was torn down in the 1950s, and the colony was
California Leaf-nosed and Townsend’s Big-eared Bat Foraging Distance Survey, 2017
99
never rediscovered. In 1942, Couffer collected three females in Ripley, 5 miles (8 km) south of Blythe and north of Palo Verde. Since 1945, no more Arizona myotis have been observed or collected from the LCR in California until August\ 2015, despite repeated attempts by Dr. Patricia Brown since 1970. The “dense cottonwood bottomlands” described by Hollister (1909) and Grinnell (1914) no longer exist along the LCR. The Arizona myotis appear to require the presence of native riparian vegetation, and the current occurrence of this species in acoustic and mist-netting records could be a good indicator of the success of habitat restoration activities along the LCR.
CONCLUSIONS
• Telemetered California leaf-nosed and Townsend’s big-eared bats traveled up to 10 miles (16 km) measured in a straight line from their roosts when foraging. However, the observed routes involved followed the terrain and were often circuitous. Individual California leaf-nosed bats tracked from the ground and airplane could travel over 50 miles (80 km) while foraging during only part of a night. California leaf-nosed bats traveled over 10 miles (16 km) one way to forage in LCR MSCP conservation areas and HCAs.
• Over the duration of a tracking session, individual California leaf-nosed and Townsend’s big-eared bats exhibited foraging area fidelity. Foraging areas for California leaf-nosed bats can vary seasonally. Female California leaf-nosed bats traveled on average farther than males while foraging and had larger MCPs.
• The roost was not the center of foraging movements. Along the LCR, the direction of movement for the telemetered bats was mainly toward the LCR, with the roost being the apex of a fan spreading out toward the LCR.
• New California leaf-nosed bat roosts (other than mines) discovered through telemetry included cavities in high cliffs and deep washes, abandoned buildings, cavities in hay bales, and in the extensive interior cavity of the reinforced concrete I-8 bridge over the LCR. Except for the I-8 bridge, all of the other roost types were only used in the summer tracking periods. All day roosts for Townsend’s big-eared bats were in mines, but identified night roosts were in abandoned or rarely used buildings.

California Leaf-nosed and Townsend’s Big-eared Bat Foraging Distance Survey, 2017
100
• Consistent with the widely reported pattern of high disturbance sensitivity, post-lactating Townsend’s big-eared bats switched roosts after capture and transmitter attachment. California leaf-nosed bats generally did not change roosts.
• Aerial tracking provides a much greater detection range than ground tracking and can locate bats in areas with limited ground access (e.g., military or Tribal lands and wilderness areas). The airplane crew can coordinate activity of ground tracking crews in multiple locations over a 12-mile (20-km) distance in real time and can direct ground trackers toward bats in locations where their transmitter signals are blocked by terrain.
• Ground tracking is necessary to document habitat use, find night roosts, recover dropped transmitters, and to triangulate bat foraging locations, especially in the absence of an airplane.
• Remote telemetry data loggers can be used to record visits of bats to roosts and foraging areas. Despite a limited detection volume with a single omnidirectional antenna, they documented repeated nightly visits of California leaf-nosed bats to the same regions in HCAs where they had been captured and tagged during foraging.

California Leaf-nosed and Townsend’s Big-eared Bat Foraging Distance Survey, 2017
101
LITERATURE CITED Aldridge, H.D.J.N. and R.M. Brigham. 1988. Load carrying and maneuverability
in an insectivorous bat: a test of the 5% rule of radio-telemetry. Journal of Mammalogy 69(2):379–382.
Amelon, S.K., D.C. Dalton, J.J. Millspaugh, and S.A. Wolf. 2009.
Radiotelemetry techniques and analysis. Pages 57–77 in T.H. Kunz and S. Parsons (editors). Ecological and Behavioral Methods for the Study of Bats, 2nd ed. Johns Hopkins University Press, Baltimore, Maryland. 2009.
Anderson, S. 1969. Macrotus waterhousii. Mammalian Species 1:1–14. Bartolommeia, P., S. Francuccia, and F. Pezzo. 2012. Accuracy of conventional
radio telemetry estimates: a practical procedure of measurement. Hystrix 23:12–18.
Bell, G.P. 1985. The sensory basis of prey location by the California leaf-nosed
bat, Macrotus californicus (Chiroptera: Phyllostomatidae). Behavioral Ecology and Sociobiology 16:343–7.
Bell, G.P. and M.B. Fenton. 1986. Visual acuity, sensitivity and binocularity
in a gleaning insectivorous bat, Macrotus californicus (Chiroptera: Phyllostomidae). Animal Behaviour 34:409–414.
Bell, G.P., G.A. Bartholomew, and K.A. Nagy. 1986. The role of energetics,
water economy, foraging behavior, and geothermal refugia in the distribution of the bat, Macrotus californicus. Journal of Comparative Physiology 156B:441–50.
Beyer, H. L. 2012. Geospatial Modelling Environment (Version 0.7.2.1).
(software). http://www.spatialecology.com/gme
Brown, P.E. 2013. Roost Surveys and Monitoring for Lower Colorado River Bat
Species, 2013 Annual Report. Submitted to the Bureau of Reclamation, Boulder City, Nevada, by Brown-Berry Biological Consulting, Bishop, California.
_____. 2016. Roost Surveys and Monitoring for Lower Colorado River Bat
Species, 2016 Final Report. Submitted to the Bureau of Reclamation, Boulder City, Nevada, by Brown-Berry Biological Consulting, Bishop, California. 67 p.
California Leaf-nosed and Townsend’s Big-eared Bat Foraging Distance Survey, 2017
102
Brown, P.E. and R.D. Berry. 1998. The updated status and range of the California leaf-nosed bat (Macrotus californicus) in California. Report to the California Department of Fish and Game.
_____. 2003. Baseline Surveys and the Development of Monitoring Protocol for
Lower Colorado River Bat Species. Report prepared for the National Fish and Wildlife Foundation, Washington D.C., for the Lower Colorado River Multi-Species Conservation Program. Project #2000-0304-002. 76 p.
_____. 2004. Roost Surveys and Habitat Requirements of Rare Southwestern
Bats: California Leaf-nosed and Allen’s Lappet-browed Bats, with Observations on Townsend’s Big-eared and Western Mastiff Bats. U.S. Geological Survey, Species at Risk Report 99HQAG0046. 58 p.
Brown, P.E., R.D. Berry, and C.P. Brown. 1993. Foraging behavior of the
California leaf-nosed bat (Macrotus californicus) as determined by radio-telemetry [abstract]. Bat Research News 34(4):104.
_____. 1994. Foraging behavior of Townsend’s big-eared bats (Plecotus
townsendii) on Santa Cruz Island. Fourth California Islands Symposium, Santa Barbara Museum of Natural History, Santa Barbara, California.
Brown, P.E., R. Berry, V. Dalton, and D. Dalton. 1999. Foraging behavior of the
California leaf-nosed bat (Macrotus californicus) in the Arizona Desert [abstract]. Bat Research News 40(4).
Calenge, C. 2006. The package adehabitat for the R software: a tool for
the analysis of space and habitat use by animals. Ecological Modelling 197:516–519.
_____. 2012. Post-Development Bat Monitoring of Habitat Creation Areas
Along the Lower Colorado River, 2010 Capture Surveys. Lower Colorado River Multi-Species Conservation Program, Bureau of Reclamation, Lower Colorado Region, Boulder City, Nevada. 23 p.
_____. 2016a. Post-Development Bat Monitoring of Conservation Areas and the
‘Ahakhav Tribal Preserve Along the Lower Colorado River, 2013–2014 Capture Surveys. Lower Colorado River Multi-Species Conservation Program, Bureau of Reclamation, Boulder City, Nevada. 40 p.
_____. 2016b. Post-Development Bat Monitoring of Conservation Areas and the
‘Ahakhav Tribal Preserve Along the Lower Colorado River, 2015 Capture Surveys. Lower Colorado River Multi-Species Conservation Program, Bureau of Reclamation, Boulder City, Nevada. 29 p.

California Leaf-nosed and Townsend’s Big-eared Bat Foraging Distance Survey, 2017
103
Calvert, A.W. and S.L. Neiswenter. 2012. Bats in riparian restoration sites along the Lower Colorado River, Arizona. The Southwestern Naturalist 57(3):340–342.
Carter, T.C., T.J. Sichmeller, and M.G. Hohmann. 2009. A field- and laboratory-
based comparison of adhesives for attaching radio transmitters to small insectivorous bats. Bat Research News 50(4):81–85.
Cockrum, E.L., B. Musgrove, and Y. Petryszyn. 1996. Bats of Mojave County,
Arizona. Occasional Papers, The Museum, Texas Tech University Number 157:1–71.
Dalton, V.M., D.C. Dalton, P.E. Brown, and R.D. Berry. 2000. Foraging Habitat
and Activity of the California Leaf-nosed Bat, Macrotus californicus, Located on the Eastern Section of the Barry M. Goldwater Air Force Range, Arizona. Report prepared for ARCADIS by Geraghty & Miller, Inc., Work Order No. 518014082598-01.
Data East. 2014. XTools Pro ArcGIS 10.x utility extension. Data East Soft,
LLC. http://www.dataeast.com/en/
Ecological Software Solutions, LLC. 2015. LOAS Software calculates locations
from radio telemetry studies. http://www.ecostats.com/web/LOAS
Environmental Systems Research Institute (ESRI). 2014. ArcGIS for Desktop
Release 10.2. Redlands, California. Fleming, C.H., J.M. Calabrese, T. Mueller, K.A. Olson, P. Leimgruber, and
W.F. Fagan. 2014. Non-Markovian maximum likelihood estimation of autocorrelated movement processes. Methods in Ecology and Evolution 5:462–472.
Fuller, M.R., J.J. Millspaugh, K.B. Church, and R.E. Kenward. 2005. Wildlife
radiotelemetry. Pages 377–417 in Research and Management Techniques for Wildlife and Habitats. T.A. Bookhout (editor). The Wildlife Society, Bethesda, Maryland.
Gabrisch, G. 2014. Proprietary Python script for Bruce Miller to create lines and
polygons of uncertainty from fixed observer points. A Two-Bit Algorithms product.
Graham, R.E. 1966. Observations on the roosting habits of the big-eared bat,
Plecotus townsendii in California limestone caves. Cave Notes 8:17–22.

California Leaf-nosed and Townsend’s Big-eared Bat Foraging Distance Survey, 2017
104
Grinnell, J. 1914. An account of the mammals and birds of the lower Colorado Valley with especial reference to the distributional problems represented. University of California Publications in Zoology 12:51–294.
Handley, C.O. 1959. A revision of the American bats of the genera Euderma and
Plecotus. Proceedings of the United States National Museum 110:95–246. Hollister, N. 1909. Two new bats from the southwestern United States.
Proceedings of the Biological Society of Washington 22:43–44. Howell, A.B. 1920. Some Californian experiences with bat roosts. Journal of
Mammalogy 1(4):169–177. Huey, L.M. 1925. Food of the California leaf-nosed bat. Journal of
Mammalogy 6:196–197. Millspaugh, J.J. and J.M. Marzluff. 2001. Radio Tracking and Animal
Populations. Academic Press, San Diego, California. 474 p. Murphy, A. 2016. GPS Utility V. 5.23.
http://www.gpsu.co.uk Perkins, J.M. and T. Schommer. 1991. Survey Protocol and an Interim Species
Strategy for Plecotus townsendii in the Blue Mountains of Oregon and Washington. Unpublished report. Wallawa-Whitman National Forest, Baker, Oregon.
Piaggio, A.J. and S.L. Perkins. 2005. Molecular phylogeny of North American
long-eared bats (Vespertilionidae: Corynorhinus); inter- and intraspecific relationships inferred from mitochondrial and nuclear DNA sequences. Molecular Phylogenetics and Evolution 37(3):762–775.
Piaggio, A.J., K.W. Navo, and C.W. Stihler. 2009. Intraspecific comparison
of population structure, genetic diversity, and dispersal among three subspecies of Townsend’s big-eared bats, Corynorhinus townsendii townsendii, C. t. pallescens, and the endangered C. t. virginianus. Conservation Genetics 10(1):143–159.
Pierson, E.D. and G.M. Fellers. 1993. Injuries to Plecotus townsendii by lipped
wing bands. Bat Research News 34(4):89–91. Pierson, E.D. and W.E. Rainey. 1998. The Distribution, Status and Management
of Townsend’s Big-eared Bat (Corynorhinus townsendii) in California. California Department of Fish and Game, Bird and Mammal Conservation Program. Technical Report Number 96-7. 34 p.

California Leaf-nosed and Townsend’s Big-eared Bat Foraging Distance Survey, 2017
105
Pierson, E.D., M.C. Wackenhut, J.S. Altenbach, P. Bradley, P. Call, D.L. Genter, C.E. Harris, B.L. Keller, B. Lengus, L. Lewis, B. Luce, K.W. Navo, J.M. Perkins, S. Smith, and L. Welch. 1999. Species Conservation Assessment and Strategy for Townsend’s Big-eared Bat (Corynorhinus townsendii and Corynorhinus townsendii pallescens). Idaho Conservation Effort, Idaho Department of Fish and Game, Boise, Idaho.
R Core Team. 2016. R: A language and environment for statistical computing.
R Foundation for Statistical Computing, Vienna, Austria. https://www.R-project.org/
Sample, B.E. and R.C. Whitmore. 1993. Food habits of the endangered Virginia
big-eared bat in West Virginia. Journal of Mammalogy 74:428–435. Stager, K.E. 1939. Status of Myotis velifer in California, with notes on its life
history. Journal of Mammalogy 20:225–228. _____. 1943. Remarks on Myotis occultus in California. Journal of Mammalogy
24:197–199. Stihler, C.W. and J.S. Hall. 1993. Endangered bat populations in West Virginia
caves gated or fenced to reduce human disturbance. Bat Research News 34(4):130.
Vaughan, T.A. 1959. Functional Morphology of Three Bats: Eumops, Myotis
and Macrotus, Volume 12. University of Kansas Museum of Natural History Publications. 153 p.
Whitaker, J.O., Jr., C. Maser, and L.E. Keller. 1977. Food habits of bats of
western Oregon. Northwest Science 51:46–55. Whitaker, J.O., Jr., C. Maser, and S.P. Cross. 1981. Food habits of
eastern Oregon bats, based on stomach and scat analyses. Northwest Science 55:281–292.
California Leaf-nosed and Townsend’s Big-eared Bat Foraging Distance Survey, 2017
107
ACKNOWLEDGMENTS This project was funded by Reclamation/LCR MSCP. Dedicated to the memory of Dr. Bob Berry, who developed this method of nocturnal aerial tracking of foraging bats. The following people provided field assistance and/or logistical support: Allen Calvert, Mary Ellen Chavez, Jeff Hill, Joe Kahl, Nathan Lenon, Barbara Raulston, Carrie Ronning, and Jenny Smith (Reclamation); Lin Piest and Angie McIntire (Arizona Game and Fish Department); Richard Kim (CDFW); Chris Reddins (U.S. Fish and Wildlife Service); and Susan and Bill Broderick, Jill Carpenter, Joey Curti, Tom Dayton, Victor Gibbs, Kristi Holcomb, Jackie Leivas, Erin McConnel, Dr. Bruce and Carolyn Miller, Karen Mullen, Rob Mulligan, Erika Noel, Joe Osinski, Ashley Pryor, Denyse Racine, Julia Sittig, Laura Stockton, Tommy Tymons, Bea Vizcarra, Kei Yasuda, and Dr. Bob Zimmerman. Pilots: Geoff Pope and Glen Enzfelder. And...the bats who carried the transmitters.