Embed Size (px)
Citation preview
CALIFORNIA INFRASTRUCTURE AND ECONOMIC DEVELOPMENT BANK FUND AND CALIFORNIA INFRASTRUCTURE GUARANTEE
TRUST FUND, ENTERPRISE FUNDS OF THE CALIFORNIA INFRASTRUCTURE AND
ECONOMIC DEVELOPMENT BANK (A Component Unit of the State of California)
COMPREHENSIVE ANNUAL FINANCIAL REPORT
FOR THE FISCAL YEAR ENDED JUNE 30, 2016
Diane J. Nanik, Fiscal Unit Manager
California Infrastructure and Economic Development Bank
This page has been intentionally left blank.
CALIFORNIA INFRASTRUCTURE AND ECONOMIC DEVELOPMENT BANK FUND AND CALIFORNIA INFRASTRUCTURE GUARANTEE
TRUST FUND, ENTERPRISE FUNDS OF THE CALIFORNIA INFRASTRUCTURE AND ECONOMIC DEVELOPMENT BANK
FOR THE FISCAL YEAR ENDED JUNE 30, 2016
TABLE OF CONTENTS PAGE
INTRODUCTORY SECTION
Letter of Transmittal 3
Organization Chart 6
Principal Officials 7
FINANCIAL SECTION
Independent Auditor’s Report 8
Management’s Discussion and Analysis 10
Fund Financial Statements
Statement of Net Position 18 Statement of Revenues, Expenses, and Changes in Fund Net Position 19 Statement of Cash Flows 20 Notes to the Financial Statements 21
Required Supplementary Information
Schedule of the Funds’ Proportionate Share of the Net Pension Liability 43 Schedule of Funds’ Contributions 44
STATISTICAL SECTION
Financial Trends
Schedule of Net Position 45 Schedule of Revenues, Expenses, and Changes in Fund Net Position 47 Infrastructure State Revolving Fund (ISRF) Program Ten Largest Borrowers 49
Revenue Capacity
Schedule of Program Loans Receivable and Interest Rates 50
Debt Capacity
Schedule of Statutory Debt Limit Capacity 52 Schedule of Outstanding ISRF Program Bonds and Related Debt Ratio 54 Schedule of Aggregate Pledged Resources Coverage for ISRF Program Bonds 56
Demographics and Economic Information
California Demographic and Economic Indicators 57 California Employment by Industry 59
Operating Information
Number of Employees by Identifiable Activity 60 Major Program Activity 61
This page has been intentionally left blank.

INTRODUCTORY SECTION
This page has been intentionally left blank.
CALIFORNIA INFRASTRUCTURE AND ECONOMIC DEVELOPMENT BANK
3
October 13, 2016 To the Board of Directors: I am pleased to submit for the fiscal year ended June 30, 2016 the Comprehensive Annual Financial Report (CAFR) of the California Infrastructure and Economic Development Bank Fund and the California Infrastructure Guarantee Trust Fund, enterprise funds of the California Infrastructure and Economic Development Bank (IBank), a component unit of the State of California. The CAFR includes the financial activities of IBank’s Infrastructure State Revolving Fund (ISRF) Program, the California Lending for Energy and Environmental Needs (CLEEN) Center Program and Conduit Bond Program included in the California Infrastructure and Economic Development Bank Fund (CIEDB Fund) and the California Infrastructure Guarantee Trust Fund (Guarantee Trust Fund) (collectively, the CIEDB Fund and the Guarantee Trust Fund are the Funds). The continuing disclosure agreements related to IBank’s revenue bonds that provided funding for the ISRF Program (ISRF Program Bonds) require annual audited financial statements and this CAFR fulfills that requirement. The net position of the Funds was $280,326,209 as of June 30, 2016, all of which was restricted. Net position increased by $34,369 over the previous fiscal year directly as a result of positive investment earnings to offset the operating loss. This year the demand for IBank’s current infrastructure program continues to increase, while at the same time IBank launched its new clean energy, water and environmental program to address the funding requirements of a wider spectrum of local governments and communities within the State of California (State). Local governments and communities have seriously begun to address the much-needed infrastructure, economic development, clean energy, water and environmental projects that have been delayed for many years, but are vital to the success and growth of the State’s economy. The limits on affordable funds and financings continue to be a major consideration when starting such projects that are needed to improve the quality of life throughout the State and preserve California’s infrastructure, environment and economy. IBank is now recognized as a major contributor to the success of the State’s economic renewal. Management assumes full responsibility for the completeness and reliability of the information contained in this report, based upon a comprehensive framework of internal control that is established for this purpose. Because the cost of internal control should not exceed anticipated benefits, the objective is to provide reasonable, rather than absolute, assurance that the financial statements are free of any material misstatements. Macias Gini & O’Connell LLP has issued an unmodified (“clean”) opinion on the Funds’ financial statements for the fiscal year ended June 30, 2016. The independent auditor’s report is located at the front of the financial section of this report. Management’s discussion and analysis (MD&A) immediately follows the independent auditor’s report and provides a narrative introduction, overview and analysis of the financial statements. The MD&A complements this letter of transmittal and should be read in conjunction with it.
CALIFORNIA INFRASTRUCTURE AND ECONOMIC DEVELOPMENT BANK
4
Profile of IBank IBank was established in 1994 to promote economic revitalization, enable future development, and encourage a healthy climate for jobs in California. IBank operates pursuant to the Bergeson-Peace Infrastructure and Economic Development Bank Act contained in the California Government Code section 63000 et seq. IBank is a component unit of the State of California located within the Governor’s Office of Business and Economic Development (GO-Biz) and is governed by a five-member Board of Directors. IBank has broad authority to issue tax-exempt and taxable revenue bonds, provide financing to public agencies and certain tax-exempt non-profit organizations that are sponsored by public agencies, provide credit enhancements, including guarantees, acquire or lease facilities, and leverage State and Federal funds. IBank's current programs include the ISRF Program, 501(c)(3) Revenue Bond Program, Industrial Development Revenue Bond Program, Exempt Facility Revenue Bond Program, Public Agency Revenue Bond Program and the CLEEN Center programs. The CLEEN Center financed its first energy efficiency project for $3,000,000 to fund the acquisition of city street lights and light emitting diode (LED) retrofit under its Statewide Energy Efficiency Program during the fiscal year ended June 30, 2016. The Small Business Finance Center (SBFC) became a program of IBank during the 2013-14 fiscal year; however, the SBFC’s financial activities are not included in this report. With the exception of funds for program support and the SBLGP administration, which must be annually appropriated by the State Legislature, all IBank funds are continuously appropriated without regard to fiscal year. Continuous appropriation authority means that no further appropriations are necessary to expend funds held in either the CIEDB Fund or the Guarantee Trust Fund. Economic Condition On a year-over-year basis (July 2015 to July 2016 seasonally adjusted), nonfarm payroll employment (wage and salary jobs) in California increased by 374,600 jobs (up 2.3 percent) and continues the State’s seventh year of expansion. In July California’s nonfarm payroll jobs increased by 36,400 for a total gain of 2,302,500 since the recovery began in 2010. The State’s unemployment rate decreased from 6.1 percent in July 2015 to 5.4 percent in June 2016. Education and health services posted the largest year-over-year gain, adding 87,000 jobs, followed by professional and business services with a gain of 77,800 jobs. Other categories adding jobs over the year included leisure and hospitality (65,900), trade, transportation and utilities (53,500), and government (44,600). Governor Brown has signed a balanced, on-time 2016-2017 budget that prepares the State for the next recession by increasing the Rainy Day Fund to a total balance of $6.7 billion and limiting new ongoing spending obligations. Demand for the ISRF Program increases with 213 inquiries in fiscal year 2015-2016 over the 94 inquiries experienced in fiscal year 2014-2015. The increase in the credit quality of the borrowers and the amount of financing requested in excess of $1.1 billion, clearly demonstrates that the demand over the past year for ISRF Program financings for infrastructure and economic development projects continue to intensify. We anticipate sustained demand for IBank’s ISRF Program and CLEEN Center Program as the State’s economy continues to grow and prospective borrowers are better positioned to finance public infrastructure, water and private development projects through IBank’s low-cost programs. All required repayments were made by the borrowers on ISRF Program Loans during the fiscal year and continued timely repayment is expected.
CALIFORNIA INFRASTRUCTURE AND ECONOMIC DEVELOPMENT BANK
5
For the first time since IBank began issuing ISRF Revenue Bonds in 2004, Moody’s Investors Service (Moody’s) awarded its highest rating—“Aaa”—to the 2016A Bonds. In addition to awarding its “Aaa” rating to the 2016A Bonds, Moody’s upgraded IBank’s Series 2014A and Series 2015A Bonds to “Aaa”, from “Aa1”. Standard and Poor’s Rating Services (S&P) and Fitch Ratings (Fitch) each also awarded a “AAA” rating to the 2016A Bonds and affirmed their respective “AAA” rating on the 2014A and 2015A Bonds. The credit rating agencies (Rating Agencies) cited pool diversity, sound program management, financial policies, and market position, among other factors, as support for the ratings. All outstanding ISRF Revenue Bonds now have the top rating from each of the ‘Big Three’ Rating Agencies–Standard and Poor’s Rating Services (S&P) (“AAA”), Fitch Ratings (Fitch) (“AAA”), and Moody’s Investors Service (Moody’s) (“Aaa,”). These strong ratings reflect the ISRF Program’s extremely strong financial risk score and very strong enterprise risk score.
Long-term Financial Planning IBank’s priorities for the upcoming years include but are not limited to the following: providing funding to infrastructure, clean energy, water, environmental and economic development projects, creating sector-specific financing instruments and funds, developing public-private investment opportunities, and facilitating state-wide outreach to potential customers for all of IBank’s programs. These priorities will provide access to more affordable funds for California infrastructure, clean energy, water, environmental and economic development projects, while maintaining the Funds’ positive net position. I wish to acknowledge all of the staff of the California Infrastructure and Economic Development Bank for their consistent dedication and contribution to the success of the organization and the State. In particular, I wish to acknowledge the Fiscal Unit staff for the preparation of this Comprehensive Annual Financial Report. Respectfully submitted, Teveia R. Barnes
Executive Director
CALIFORNIA INFRASTRUCTURE AND ECONOMIC DEVELOPMENT BANK FUND AND CALIFORNIA INFRASTRUCTURE GUARANTEE
TRUST FUND, ENTERPRISE FUNDS OF THE CALIFORNIA INFRASTRUCTURE AND ECONOMIC DEVELOPMENT BANK
FOR THE FISCAL YEAR ENDED JUNE 30, 2016
6
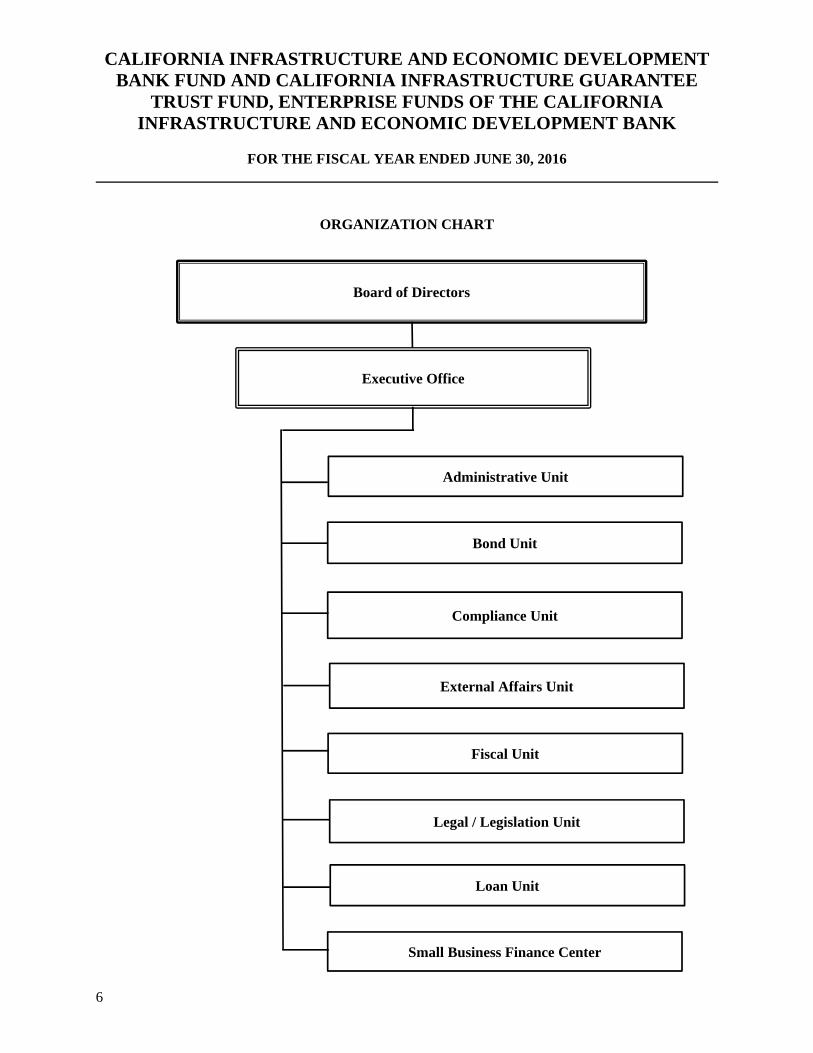
ORGANIZATION CHART
Bond Unit
Board of Directors
Administrative Unit
Executive Office
Compliance Unit
Fiscal Unit
Legal / Legislation Unit
Small Business Finance Center
External Affairs Unit
Loan Unit
CALIFORNIA INFRASTRUCTURE AND ECONOMIC DEVELOPMENT BANK FUND AND CALIFORNIA INFRASTRUCTURE GUARANTEE
TRUST FUND, ENTERPRISE FUNDS OF THE CALIFORNIA INFRASTRUCTURE AND ECONOMIC DEVELOPMENT BANK
FOR THE FISCAL YEAR ENDED JUNE 30, 2016
7
PRINCIPAL OFFICIALS (As of the date of issuance of the CAFR)
IBank Board of Directors
Panorea Avdis, Director, Governor’s Office of Business and Economic Development
John Chiang, State Treasurer
Brian P. Kelly, Secretary of the California State Transportation Agency
Michael Cohen, Director of the Department of Finance
Peter Luchetti, Governor’s Appointee
IBank Executive Office and Management Staff
Teveia R. Barnes, Executive Director
Nancee Trombley, Chief Deputy Executive Director and Chief Compliance Officer
Diane J. Nanik, Fiscal Unit Manager
Diane Cummings, Deputy Director of Credit and Chief Credit Officer
Fritz Pahland, General Counsel
Alice Scott, Deputy Director of External Affairs
Stefan Spich, Deputy Director of Legislative Affairs
Fariba Khoie, Bond Unit Manager
Thomas Dear, Loan Origination Manager
Margrit Lockett, Loan Servicing Manager
Emily Burgos, Small Business Finance Center Manager

FINANCIAL SECTION
Century City
Los Angeles
Newport Beach
Oakland
Sacramento
San Diego
San Francisco
Walnut Creek
Woodland Hills
www.mgocpa.com Macias Gini & O’Connell LLP 3000 S Street, Suite 300 Sacramento, CA 95816
Independent Auditor’s Report
To the Board of Directors of the
California Infrastructure and Economic Development Bank
Sacramento, California
Report on the Financial Statements
We have audited the accompanying financial statements of the California Infrastructure and Economic
Development Bank Fund and California Infrastructure Guarantee Trust Fund (collectively, the Funds),
enterprise funds of the California Infrastructure and Economic Development Bank (IBank), a component
unit of the State of California, as of and for the fiscal year ended June 30, 2016, and the related notes to
the financial statements, as listed in the table of contents.
Management’s Responsibility for the Financial Statements
Management is responsible for the preparation and fair presentation of these financial statements in
accordance with accounting principles generally accepted in the United States of America; this includes
the design, implementation, and maintenance of internal control relevant to the preparation and fair
presentation of financial statements that are free from material misstatement, whether due to fraud or
error.
Auditor’s Responsibility
Our responsibility is to express an opinion on these financial statements based on our audit. We
conducted our audit in accordance with auditing standards generally accepted in the United States of
America and the standards applicable to financial audits contained in Government Auditing Standards,
issued by the Comptroller General of the United States. Those standards require that we plan and perform
the audit to obtain reasonable assurance about whether the financial statements are free from material
misstatement.
An audit involves performing procedures to obtain audit evidence about the amounts and disclosures in
the financial statements. The procedures selected depend on the auditor’s judgment, including the
assessment of the risks of material misstatement of the financial statements, whether due to fraud or error.
In making those risk assessments, the auditor considers internal control relevant to the entity’s preparation
and fair presentation of the financial statements in order to design audit procedures that are appropriate in
the circumstances, but not for the purpose of expressing an opinion on the effectiveness of the entity’s
internal control. Accordingly, we express no such opinion. An audit also includes evaluating the
appropriateness of accounting policies used and the reasonableness of significant accounting estimates
made by management, as well as evaluating the overall presentation of the financial statements.
We believe that the audit evidence we have obtained is sufficient and appropriate to provide a basis for
our audit opinion.
Opinion
In our opinion, the financial statements referred to above present fairly, in all material respects, the
financial position of the Funds of IBank, as of June 30, 2016, and the changes in their financial position
and their cash flows for the fiscal year then ended in accordance with accounting principles generally
accepted in the United States of America.
8
Emphasis of Matter
Basis of Presentation
As discussed in Note 2.A, the financial statements present only the Funds and do not purport to, and do
not, present fairly the financial position of IBank as of June 30, 2016, the changes in its financial position,
or, where applicable, its cash flows for the fiscal year then ended in accordance with accounting
principles generally accepted in the United States of America. IBank’s California Small Business
Expansion Fund, its only other fund, is included in and subject to the audit of the State of California’s
financial statements. Our opinion is not modified with respect to this matter.
Other Matters
Required Supplementary Information
Accounting principles generally accepted in the United States of America require that the management’s
discussion and analysis, schedule of the Funds’ proportionate share of the net pension liability, and the
schedule of Funds’ contributions, as listed in the table of contents, be presented to supplement the fund
financial statements. Such information, although not a part of the fund financial statements, is required
by the Governmental Accounting Standards Board who considers it to be an essential part of financial
reporting for placing the fund financial statements in an appropriate operational, economic, or historical
context. We have applied certain limited procedures to the required supplementary information in
accordance with auditing standards generally accepted in the United States of America, which consisted
of inquiries of management about the methods of preparing the information and comparing the
information for consistency with management’s responses to our inquiries, the fund financial statements,
and other knowledge we obtained during our audit of the fund financial statements. We do not express an
opinion or provide any assurance on the information because the limited procedures do not provide us
with sufficient evidence to express an opinion or provide any assurance.
Other Information
Our audit was conducted for the purpose of forming an opinion on the fund financial statements. The
introductory and statistical sections are presented for purposes of additional analysis and are not required
parts of the fund financial statements.
The introductory and statistical sections have not been subjected to the auditing procedures applied in the
audit of the fund financial statements, and accordingly, we do not express an opinion or provide any
assurance on them.
Other Reporting Required by Government Auditing Standards
In accordance with Government Auditing Standards, we have also issued our report dated October 13,
2016, on our consideration of IBank’s internal control over financial reporting as it relates to the Funds
and on our tests of its compliance with certain provisions of laws, regulations, contracts, and grant
agreements and other matters. The purpose of that report is to describe the scope of our testing of internal
control over financial reporting and compliance and the results of that testing, and not to provide an
opinion on internal control over financial reporting or on compliance. That report is an integral part of an
audit performed in accordance with Government Auditing Standards in considering IBank’s internal
control over financial reporting and compliance as it relates to the Funds.
Sacramento, California
October 13, 2016
9
CALIFORNIA INFRASTRUCTURE AND ECONOMIC DEVELOPMENT BANK FUND AND CALIFORNIA INFRASTRUCTURE GUARANTEE
TRUST FUND, ENTERPRISE FUNDS OF THE CALIFORNIA INFRASTRUCTURE AND ECONOMIC DEVELOPMENT BANK
MANAGEMENT’S DISCUSSION AND ANALYSIS FOR THE FISCAL YEAR ENDED JUNE 30, 2016
10
Introduction The following Management’s Discussion and Analysis (MD&A) provides an overview to the financial statements of the California Infrastructure and Economic Development Bank Fund (CIEDB Fund) and California Infrastructure Guarantee Trust Fund (Guarantee Trust Fund), enterprise funds of the California Infrastructure and Economic Development Bank (IBank), a component unit of the State of California (State), a description of its activities, and an analysis of the financial position of the CIEDB Fund and the Guarantee Trust Fund for the fiscal year ended June 30, 2016 (collectively, the CIEDB Fund and the Guarantee Trust Fund are the Funds). The Funds do not receive any State General Fund support. The Funds’ programs continue to provide revenues sufficient to support all operating expenses. The information presented in this section should be read in conjunction with the information in our letter of transmittal on pages 3-5 of this report and the financial statements and notes that follow this section. IBank and Current Programs IBank is a State of California financing authority whose mission is to finance public infrastructure and private development that promote a healthy climate for jobs, contribute to a strong California economy, and improve the quality of life in California communities. IBank has broad authority to issue tax-exempt and taxable revenue bonds, provide financing to public agencies, provide credit enhancements, including guarantees, acquire or lease facilities, and leverage State and Federal funds. The Funds’ current operations are funded solely from fees, interest earnings, and Infrastructure State Revolving Fund Program loan1 repayments. IBank is a component unit of the State of California (State) and the Funds’ financial statements are included in the State’s Comprehensive Annual Financial Report. IBank’s major programs include the Infrastructure State Revolving Fund (ISRF) Program, which is a revolving loan program that provides financing to local government entities for eighteen categories of public infrastructure and economic expansion projects, and a variety of conduit revenue bond financing programs, including the Industrial Development Bond Program for manufacturing and processing companies, the 501(c)(3) Revenue Bond Program for nonprofit public benefit corporations, State School Fund Bond Program and the Public Agency Revenue Bond Program for governmental entities. Conduit bonds issued by IBank are a limited obligation of IBank payable solely from the revenues generated by the underlying borrower. The Small Business Loan Guarantee Program, which issues guarantees to lenders of loans to small businesses having difficulty securing financing on their own, was established under the Small Business Finance Center, a program of IBank, in October 2013. However, the Small Business Finance Center’s financial activities and position are not included in this report.
1 “Loan” is generically used to refer to a loan, a lease or an installment sale agreement.
CALIFORNIA INFRASTRUCTURE AND ECONOMIC DEVELOPMENT BANK FUND AND CALIFORNIA INFRASTRUCTURE GUARANTEE
TRUST FUND, ENTERPRISE FUNDS OF THE CALIFORNIA INFRASTRUCTURE AND ECONOMIC DEVELOPMENT BANK
MANAGEMENT’S DISCUSSION AND ANALYSIS FOR THE FISCAL YEAR ENDED JUNE 30, 2016
11
On August 25, 2015, the IBank Board of Directors approved the criteria, priorities and guidelines to select and underwrite projects for financing under the California Lending for Energy and Environmental Needs (CLEEN) Center. IBank’s CLEEN Center provides low-cost financing to eligible State and local governments, and public universities, schools, and hospitals. The approved eligible projects include commercially proven technologies that are expected to result in carbon reduction benefits, water conservation or other environmental benefits within the State, including energy efficiency, renewable energy, energy storage, alternative technologies, alternative fuels, transportation and water. IBank financed its first energy efficiency project under the CLEEN Center in May 2016. Financial Highlights 2015-16
The net position of the Funds was $280.3 million as of June 30, 2016, all of which was restricted. There was an operating loss of $710 thousand. The operating loss was offset by investments earnings and resulted in an increase in net positon of $34 thousand.
Total cash, cash equivalents, and investments increased during the fiscal year by $195.1 million or 91% primarily as a result of proceeds received from the issuance of the 2016A ISRF Program Bonds and loan repayments exceeding loan disbursements and bond debt service payments.
Total loans receivable decreased during the fiscal year by $2.4 million because loan repayments exceeded new loans closed during the fiscal year.
The revenue bonds payable increased by $164.3 million or 79% primarily due to the issuance of $141.6 million in 2016A ISRF Program Bonds on June 14, 2016.
Overview of the Financial Statements The financial section of this annual financial report consists of this MD&A, the financial statements, and the notes to the financial statements. This MD&A is a discussion of many aspects of the Funds’ operations and financial status and its information was compiled from the Funds’ financial statements and accompanying notes. The financial statements have been prepared using the economic resources measurement focus and accrual basis of accounting in accordance with generally accepted accounting principles and include the following three statements:
The Statement of Net Position presents information on the assets, liabilities and deferred inflows/outflows of resources of the Funds, with the difference reported as net position. Over time, increases or decreases in net position are expected to serve as a useful indicator of whether the financial position of the Funds are improving or deteriorating.
CALIFORNIA INFRASTRUCTURE AND ECONOMIC DEVELOPMENT BANK FUND AND CALIFORNIA INFRASTRUCTURE GUARANTEE
TRUST FUND, ENTERPRISE FUNDS OF THE CALIFORNIA INFRASTRUCTURE AND ECONOMIC DEVELOPMENT BANK
MANAGEMENT’S DISCUSSION AND ANALYSIS FOR THE FISCAL YEAR ENDED JUNE 30, 2016
12
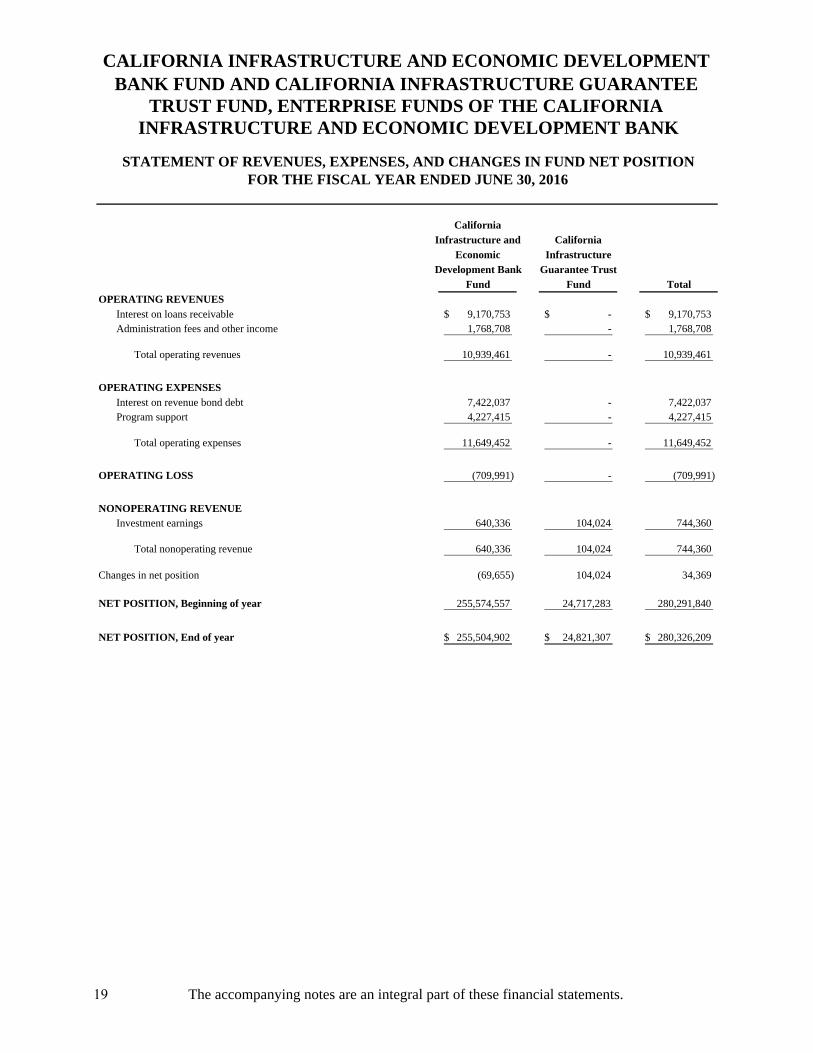
The Statement of Revenues, Expenses, and Changes in Fund Net Position presents information reflecting how the net position of the Funds changed during the fiscal year. All changes in net position are reported as soon as the underlying event giving rise to the change occurs, regardless of the timing of the cash flows. Thus, revenues and expenses are reported in the statement for some items that will only result in cash flows in future fiscal periods.
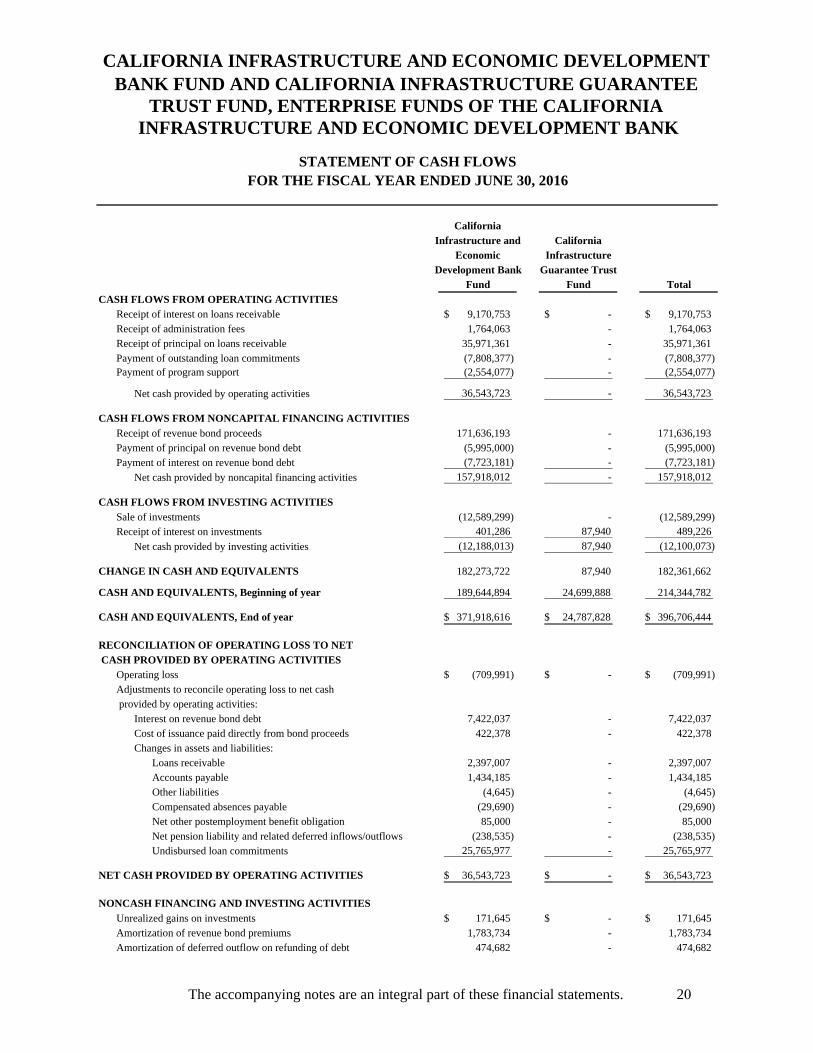
The Statement of Cash Flows reports the cash flows from operating activities, noncapital financing activities and investing activities, and the resulting impacts to cash and cash equivalents for the fiscal year.
The financial statements included in this annual financial report are those of IBank’s CIEDB Fund and Guarantee Trust Fund. As discussed in Note 1, The Financial Reporting Entity, the financial statements herein are intended to present the financial position, change in financial position and cash flows of only IBank’s ISRF Program, CLEEN Center Program and Conduit Bond Program. The financial statements do not purport to present the financial position of the Small Business Loan Guarantee Program or any other reporting entity. The Notes to the Financial Statements provide additional information that is essential to a full understanding of the data provided in the financial statements. These notes can be found immediately following the financial statements.
CALIFORNIA INFRASTRUCTURE AND ECONOMIC DEVELOPMENT BANK FUND AND CALIFORNIA INFRASTRUCTURE GUARANTEE
TRUST FUND, ENTERPRISE FUNDS OF THE CALIFORNIA INFRASTRUCTURE AND ECONOMIC DEVELOPMENT BANK
MANAGEMENT’S DISCUSSION AND ANALYSIS FOR THE FISCAL YEAR ENDED JUNE 30, 2016
13
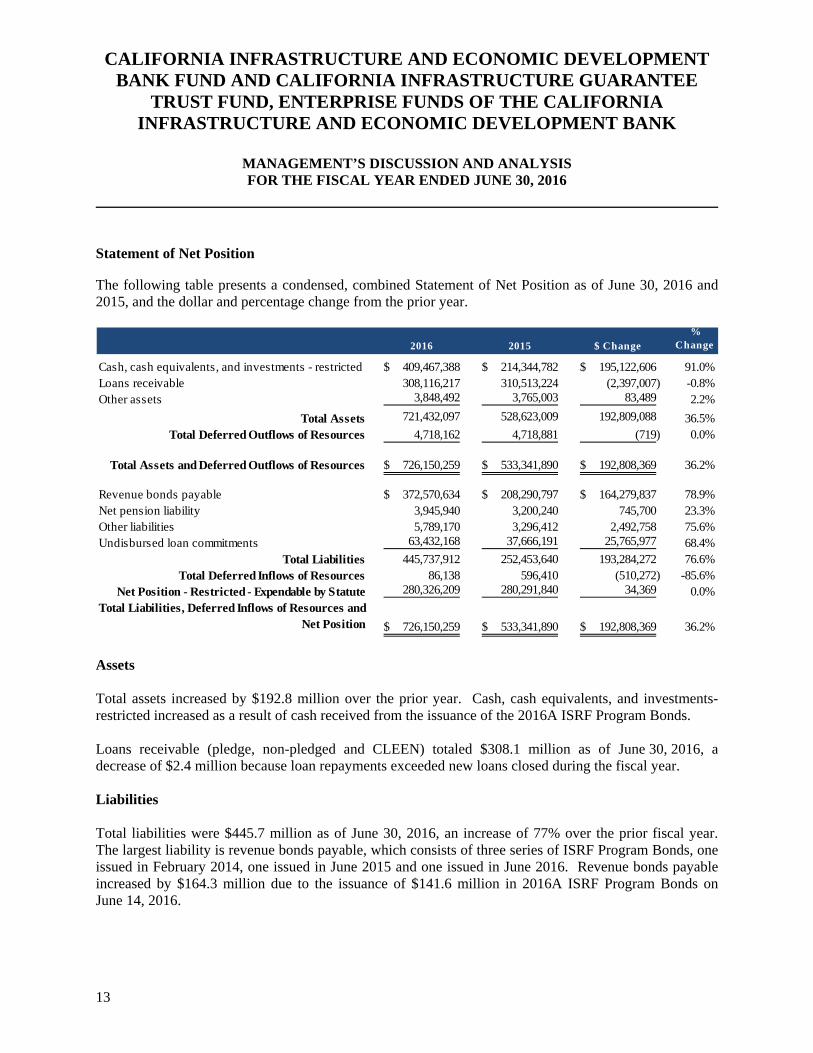
Statement of Net Position
The following table presents a condensed, combined Statement of Net Position as of June 30, 2016 and 2015, and the dollar and percentage change from the prior year.
Assets Total assets increased by $192.8 million over the prior year. Cash, cash equivalents, and investments-restricted increased as a result of cash received from the issuance of the 2016A ISRF Program Bonds. Loans receivable (pledge, non-pledged and CLEEN) totaled $308.1 million as of June 30, 2016, a decrease of $2.4 million because loan repayments exceeded new loans closed during the fiscal year. Liabilities Total liabilities were $445.7 million as of June 30, 2016, an increase of 77% over the prior fiscal year. The largest liability is revenue bonds payable, which consists of three series of ISRF Program Bonds, one issued in February 2014, one issued in June 2015 and one issued in June 2016. Revenue bonds payable increased by $164.3 million due to the issuance of $141.6 million in 2016A ISRF Program Bonds on June 14, 2016.
2016 2015 $ Change%
Change
Cash, cash equivalents, and investments - restricted 409,467,388$ 214,344,782$ 195,122,606$ 91.0%Loans receivable 308,116,217 310,513,224 (2,397,007) -0.8%Other assets 3,848,492 3,765,003 83,489 2.2%
Total Assets 721,432,097 528,623,009 192,809,088 36.5%Total Deferred Outflows of Resources 4,718,162 4,718,881 (719) 0.0%
Total Assets and Deferred Outflows of Resources 726,150,259$ 533,341,890$ 192,808,369$ 36.2%
Revenue bonds payable 372,570,634$ 208,290,797$ 164,279,837$ 78.9%Net pension liability 3,945,940 3,200,240 745,700 23.3%Other liabilities 5,789,170 3,296,412 2,492,758 75.6%Undisbursed loan commitments 63,432,168 37,666,191 25,765,977 68.4%
Total Liabilities 445,737,912 252,453,640 193,284,272 76.6%Total Deferred Inflows of Resources 86,138 596,410 (510,272) -85.6%
Net Position - Restricted - Expendable by Statute 280,326,209 280,291,840 34,369 0.0%Total Liabilities, Deferred Inflows of Resources and
Net Position 726,150,259$ 533,341,890$ 192,808,369$ 36.2%
CALIFORNIA INFRASTRUCTURE AND ECONOMIC DEVELOPMENT BANK FUND AND CALIFORNIA INFRASTRUCTURE GUARANTEE
TRUST FUND, ENTERPRISE FUNDS OF THE CALIFORNIA INFRASTRUCTURE AND ECONOMIC DEVELOPMENT BANK
MANAGEMENT’S DISCUSSION AND ANALYSIS FOR THE FISCAL YEAR ENDED JUNE 30, 2016
14
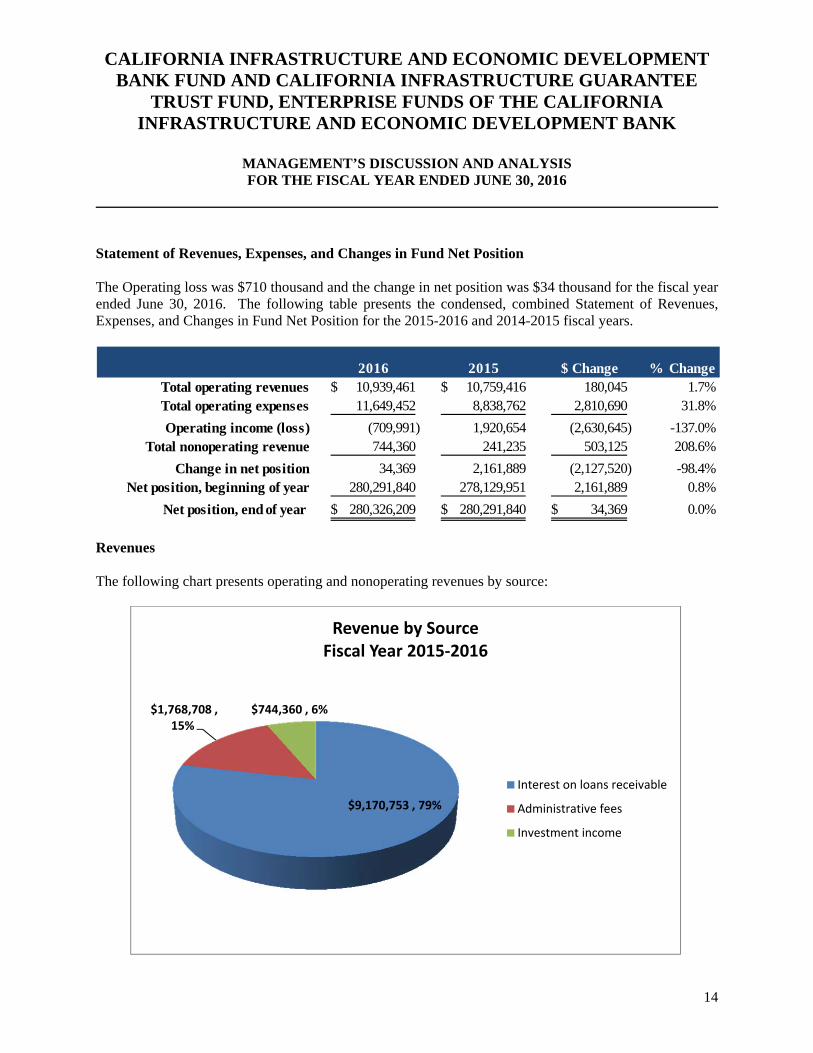
Statement of Revenues, Expenses, and Changes in Fund Net Position The Operating loss was $710 thousand and the change in net position was $34 thousand for the fiscal year ended June 30, 2016. The following table presents the condensed, combined Statement of Revenues, Expenses, and Changes in Fund Net Position for the 2015-2016 and 2014-2015 fiscal years.
Revenues The following chart presents operating and nonoperating revenues by source:
2016 2015 $ Change % Change10,939,461$ 10,759,416$ 180,045 1.7%11,649,452 8,838,762 2,810,690 31.8%
Operating income (loss) (709,991) 1,920,654 (2,630,645) -137.0%744,360 241,235 503,125 208.6%
34,369 2,161,889 (2,127,520) -98.4%280,291,840 278,129,951 2,161,889 0.8%
280,326,209$ 280,291,840$ 34,369$ 0.0%
Net position, beginning of year
Total nonoperating revenue
Change in net position
Net position, end of year
Total operating revenuesTotal operating expenses
$9,170,753 , 79%
$1,768,708 , 15%
$744,360 , 6%
Revenue by SourceFiscal Year 2015‐2016
Interest on loans receivable
Administrative fees
Investment income
CALIFORNIA INFRASTRUCTURE AND ECONOMIC DEVELOPMENT BANK FUND AND CALIFORNIA INFRASTRUCTURE GUARANTEE
TRUST FUND, ENTERPRISE FUNDS OF THE CALIFORNIA INFRASTRUCTURE AND ECONOMIC DEVELOPMENT BANK
MANAGEMENT’S DISCUSSION AND ANALYSIS FOR THE FISCAL YEAR ENDED JUNE 30, 2016
15
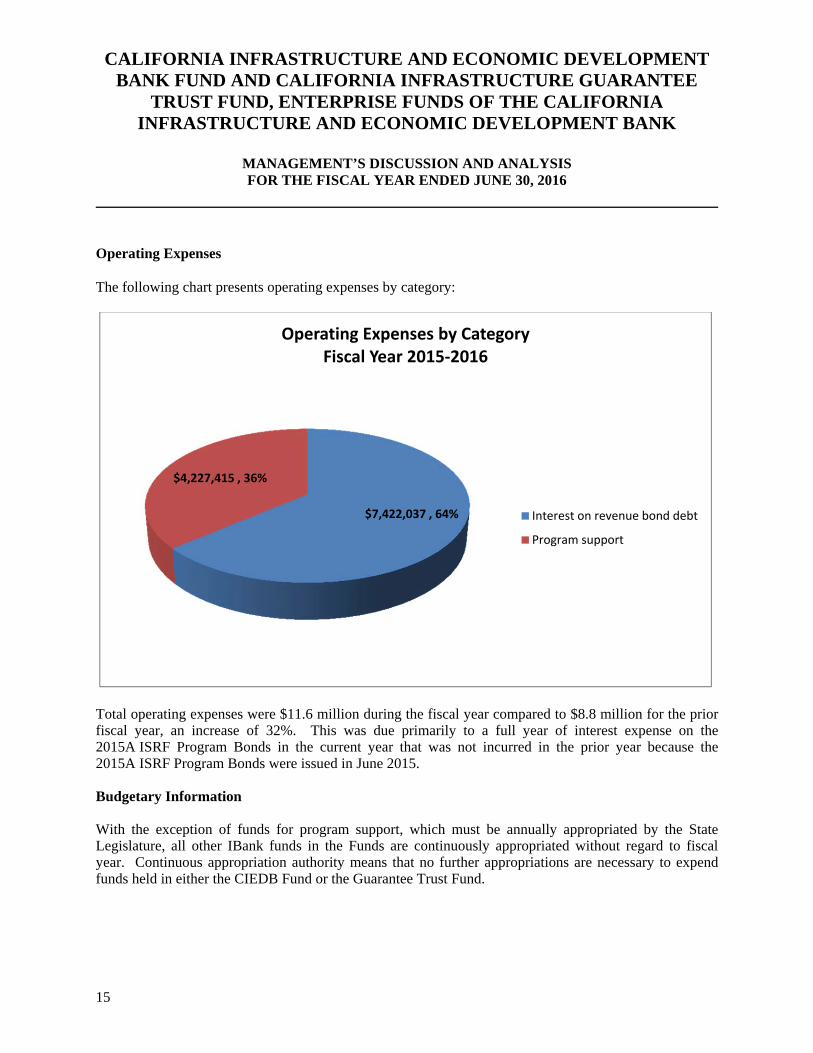
Operating Expenses The following chart presents operating expenses by category:
Total operating expenses were $11.6 million during the fiscal year compared to $8.8 million for the prior fiscal year, an increase of 32%. This was due primarily to a full year of interest expense on the 2015A ISRF Program Bonds in the current year that was not incurred in the prior year because the 2015A ISRF Program Bonds were issued in June 2015. Budgetary Information With the exception of funds for program support, which must be annually appropriated by the State Legislature, all other IBank funds in the Funds are continuously appropriated without regard to fiscal year. Continuous appropriation authority means that no further appropriations are necessary to expend funds held in either the CIEDB Fund or the Guarantee Trust Fund.
$7,422,037 , 64%
$4,227,415 , 36%
Operating Expenses by CategoryFiscal Year 2015‐2016
Interest on revenue bond debt
Program support
CALIFORNIA INFRASTRUCTURE AND ECONOMIC DEVELOPMENT BANK FUND AND CALIFORNIA INFRASTRUCTURE GUARANTEE
TRUST FUND, ENTERPRISE FUNDS OF THE CALIFORNIA INFRASTRUCTURE AND ECONOMIC DEVELOPMENT BANK
MANAGEMENT’S DISCUSSION AND ANALYSIS FOR THE FISCAL YEAR ENDED JUNE 30, 2016
16
Debt Administration IBank administers the ISRF Program, a leveraged revolving loan program. Initial ISRF Program Loans were funded with previous State General Fund appropriations. IBank issued $51.37 million in ISRF Program Revenue Bonds in March 2004, $52.80 million in December 2005, $48.37 million in September 2008, $95.96 million in February 2014, $90.1 million in June 2015 and $141.6 million in June 2016 (collectively, ISRF Program Bonds) to provide additional funding for ISRF Program Loans. The 2014A ISRF Program Bonds were issued to refund the 2004 and 2005 ISRF Program Bonds and to refinance existing bond anticipation loans. The 2015A ISRF Program Bonds were issued to refund the 2008 ISRF Program Bonds and to refinance existing bond anticipation loans. The ISRF Program Bonds were sold without a credit enhancement, and in 2004 and 2005, were initially rated AA, Aa2, and AA by Standard & Poor’s, Moody’s Investors Service, and Fitch Ratings, respectively. Upon the issuance of the 2008 ISRF Program Bonds, Standard & Poor’s and Fitch Ratings raised the ratings on the ISRF Program Bonds to AA+, citing proactive and strong program oversight and management, and thorough ongoing surveillance of existing Loans as key factors to the high credit ratings on the bonds. The 2014A and 2015A ISRF Program Bonds were assigned a rating of AAA, Aa1, and AAA by Standard & Poor’s (S&P), Moody’s Investors Service (Moody’s), and Fitch Ratings (Fitch), respectively. S&P and Fitch assigned a stable outlook to the 2014A and 2015A ISRF Program Bonds. Moody’s assigned a stable outlook to the 2014A ISRF Program Bonds and a positive outlook to the 2015A ISRF Program Bonds. Moody’s rated the 2016A ISRF Program Bonds Aaa. In addition, Moody’s upgraded IBank’s Series 2014A and Series 2015A Bonds to Aaa, from Aa1. S&P and Fitch each rated the 2016A ISRF Program Bonds AAA and affirmed their respective AAA rating on the 2014A and 2015A ISRF Program Bonds. The credit rating agencies cited pool diversity, sound program management, financial policies, and market position, among other factors, as support for the ratings. All outstanding ISRF Program Bonds now have the top rating from S&P (AAA), Fitch (AAA), and Moody’s S&P (Aaa). These strong ratings reflect the ISRF Program’s extremely strong financial risk score and very strong enterprise risk score. In addition, these strong ratings reflect the ISRF Program’s ability to withstand defaults by the ISRF Program’s borrowers while the ISRF Program could continue to pay the ISRF Program’s bondholders. Existing ISRF Program Loans are either funded from previous State General Fund appropriations, interest earned on the ISRF Program Loans, the repayment of principal on ISRF Program loans receivable, investment earnings, administration fee revenue, or the proceeds of ISRF Program Bonds. The 2014A, 2015A and 2016A ISRF Program Bonds are each structured under an open-indenture model. All ISRF Program Bonds are limited obligations of IBank payable solely from and secured solely by pledged ISRF Program Loan repayments, reserves, and reserve account interest earnings. Note 4 of the Notes to the Financial Statements contains additional information about the outstanding ISRF Program Bonds. IBank also issues conduit revenue bonds including Industrial Development Bonds for certain privately-owned manufacturing and processing businesses, 501(c)(3) Revenue Bonds for nonprofit entities, State School Fund Bonds for financially troubled public school districts, and Public Agency Revenue Bonds for other state and local governmental entities. During the fiscal year, IBank served as the issuer for $916,542,000 of conduit revenue bonds. Conduit bonds are a limited obligation of IBank payable solely from the pledged revenues of the conduit borrower. As such, except for administration fee revenue related to the conduit bond programs, conduit bond financial information is not reflected in the Funds’ financial statements.
CALIFORNIA INFRASTRUCTURE AND ECONOMIC DEVELOPMENT BANK FUND AND CALIFORNIA INFRASTRUCTURE GUARANTEE
TRUST FUND, ENTERPRISE FUNDS OF THE CALIFORNIA INFRASTRUCTURE AND ECONOMIC DEVELOPMENT BANK
MANAGEMENT’S DISCUSSION AND ANALYSIS FOR THE FISCAL YEAR ENDED JUNE 30, 2016
17
Requests for Information This financial report is designed to provide interested parties with a general overview of the finances of the Funds. Questions concerning the information provided in this report or requests for additional information should be addressed to Teveia R. Barnes, Executive Director, California Infrastructure and Economic Development Bank, P.O. Box 2830, Sacramento, California 95812-2830.
California
Infrastructure and California
Economic Infrastructure
Development Bank Guarantee Trust
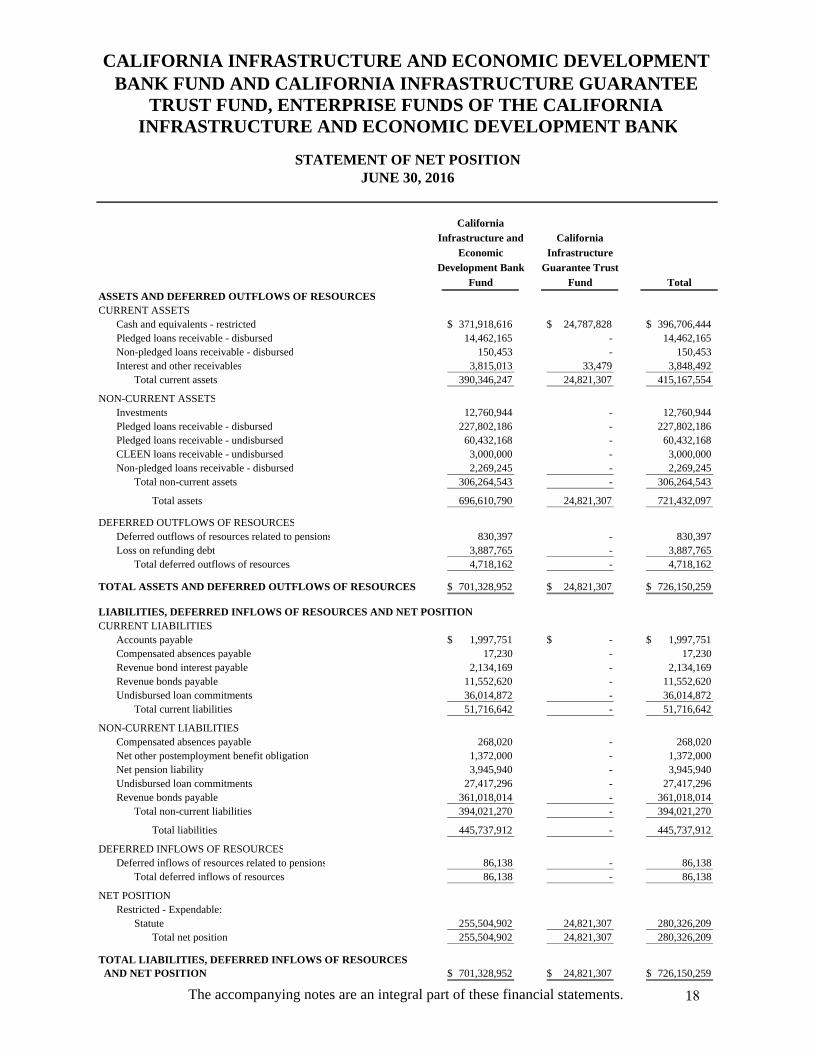
Fund Fund TotalASSETS AND DEFERRED OUTFLOWS OF RESOURCESCURRENT ASSETS
Cash and equivalents - restricted 371,918,616$ 24,787,828$ 396,706,444$ Pledged loans receivable - disbursed 14,462,165 - 14,462,165 Non-pledged loans receivable - disbursed 150,453 - 150,453 Interest and other receivables 3,815,013 33,479 3,848,492
Total current assets 390,346,247 24,821,307 415,167,554
NON-CURRENT ASSETSInvestments 12,760,944 - 12,760,944 Pledged loans receivable - disbursed 227,802,186 - 227,802,186 Pledged loans receivable - undisbursed 60,432,168 - 60,432,168 CLEEN loans receivable - undisbursed 3,000,000 - 3,000,000 Non-pledged loans receivable - disbursed 2,269,245 - 2,269,245
Total non-current assets 306,264,543 - 306,264,543
Total assets 696,610,790 24,821,307 721,432,097
DEFERRED OUTFLOWS OF RESOURCESDeferred outflows of resources related to pensions 830,397 - 830,397 Loss on refunding debt 3,887,765 - 3,887,765
4,718,162 - 4,718,162
TOTAL ASSETS AND DEFERRED OUTFLOWS OF RESOURCES 701,328,952$ 24,821,307$ 726,150,259$
LIABILITIES, DEFERRED INFLOWS OF RESOURCES AND NET POSITION
Accounts payable 1,997,751$ -$ 1,997,751$ Compensated absences payable 17,230 - 17,230 Revenue bond interest payable 2,134,169 - 2,134,169 Revenue bonds payable 11,552,620 - 11,552,620 Undisbursed loan commitments 36,014,872 - 36,014,872
Total current liabilities 51,716,642 - 51,716,642
Compensated absences payable 268,020 - 268,020 Net other postemployment benefit obligation 1,372,000 - 1,372,000 Net pension liability 3,945,940 - 3,945,940 Undisbursed loan commitments 27,417,296 - 27,417,296 Revenue bonds payable 361,018,014 - 361,018,014
Total non-current liabilities 394,021,270 - 394,021,270
Total liabilities 445,737,912 - 445,737,912
DEFERRED INFLOWS OF RESOURCESDeferred inflows of resources related to pensions 86,138 - 86,138
86,138 - 86,138
NET POSITION Restricted - Expendable:
Statute 255,504,902 24,821,307 280,326,209 Total net position 255,504,902 24,821,307 280,326,209
TOTAL LIABILITIES, DEFERRED INFLOWS OF RESOURCES AND NET POSITION 701,328,952$ 24,821,307$ 726,150,259$
Total deferred inflows of resources
NON-CURRENT LIABILITIES
Total deferred outflows of resources
JUNE 30, 2016
BANK FUND AND CALIFORNIA INFRASTRUCTURE GUARANTEE CALIFORNIA INFRASTRUCTURE AND ECONOMIC DEVELOPMENT
INFRASTRUCTURE AND ECONOMIC DEVELOPMENT BANK
STATEMENT OF NET POSITION
CURRENT LIABILITIES
TRUST FUND, ENTERPRISE FUNDS OF THE CALIFORNIA
The accompanying notes are an integral part of these financial statements. 18
California
Infrastructure and California
Economic Infrastructure
Development Bank Guarantee Trust
Fund Fund Total
OPERATING REVENUES
9,170,753$ -$ 9,170,753$ 1,768,708 - 1,768,708
10,939,461 - 10,939,461
OPERATING EXPENSES
7,422,037 - 7,422,037 4,227,415 - 4,227,415
11,649,452 - 11,649,452
OPERATING LOSS (709,991) - (709,991)
NONOPERATING REVENUE640,336 104,024 744,360
640,336 104,024 744,360
(69,655) 104,024 34,369
NET POSITION, Beginning of year 255,574,557 24,717,283 280,291,840
NET POSITION, End of year 255,504,902$ 24,821,307$ 280,326,209$
BANK FUND AND CALIFORNIA INFRASTRUCTURE GUARANTEE CALIFORNIA INFRASTRUCTURE AND ECONOMIC DEVELOPMENT
INFRASTRUCTURE AND ECONOMIC DEVELOPMENT BANK
STATEMENT OF REVENUES, EXPENSES, AND CHANGES IN FUND NET POSITION
Changes in net position
Interest on loans receivable
Total operating revenues
Interest on revenue bond debtProgram support
Administration fees and other income
Investment earnings
Total nonoperating revenue
Total operating expenses
FOR THE FISCAL YEAR ENDED JUNE 30, 2016
TRUST FUND, ENTERPRISE FUNDS OF THE CALIFORNIA
19 The accompanying notes are an integral part of these financial statements.
CaliforniaInfrastructure and California
Economic InfrastructureDevelopment Bank Guarantee Trust
Fund Fund Total
CASH FLOWS FROM OPERATING ACTIVITIESReceipt of interest on loans receivable 9,170,753$ -$ 9,170,753$ Receipt of administration fees 1,764,063 - 1,764,063 Receipt of principal on loans receivable 35,971,361 - 35,971,361 Payment of outstanding loan commitments (7,808,377) - (7,808,377) Payment of program support (2,554,077) - (2,554,077)
Net cash provided by operating activities 36,543,723 - 36,543,723
CASH FLOWS FROM NONCAPITAL FINANCING ACTIVITIES
Receipt of revenue bond proceeds 171,636,193 - 171,636,193 Payment of principal on revenue bond debt (5,995,000) - (5,995,000) Payment of interest on revenue bond debt (7,723,181) - (7,723,181)
Net cash provided by noncapital financing activities 157,918,012 - 157,918,012
CASH FLOWS FROM INVESTING ACTIVITIES
Sale of investments (12,589,299) - (12,589,299) Receipt of interest on investments 401,286 87,940 489,226
Net cash provided by investing activities (12,188,013) 87,940 (12,100,073)
CHANGE IN CASH AND EQUIVALENTS 182,273,722 87,940 182,361,662
CASH AND EQUIVALENTS, Beginning of year 189,644,894 24,699,888 214,344,782
CASH AND EQUIVALENTS, End of year 371,918,616$ 24,787,828$ 396,706,444$
RECONCILIATION OF OPERATING LOSS TO NET
CASH PROVIDED BY OPERATING ACTIVITIESOperating loss (709,991)$ -$ (709,991)$ Adjustments to reconcile operating loss to net cash provided by operating activities:
Interest on revenue bond debt 7,422,037 - 7,422,037 Cost of issuance paid directly from bond proceeds 422,378 - 422,378 Changes in assets and liabilities:
Loans receivable 2,397,007 - 2,397,007 Accounts payable 1,434,185 - 1,434,185 Other liabilities (4,645) - (4,645) Compensated absences payable (29,690) - (29,690) Net other postemployment benefit obligation 85,000 - 85,000 Net pension liability and related deferred inflows/outflows (238,535) - (238,535) Undisbursed loan commitments 25,765,977 - 25,765,977
NET CASH PROVIDED BY OPERATING ACTIVITIES 36,543,723$ -$ 36,543,723$
NONCASH FINANCING AND INVESTING ACTIVITIES
Unrealized gains on investments 171,645$ -$ 171,645$ Amortization of revenue bond premiums 1,783,734 - 1,783,734 Amortization of deferred outflow on refunding of debt 474,682 - 474,682
FOR THE FISCAL YEAR ENDED JUNE 30, 2016
BANK FUND AND CALIFORNIA INFRASTRUCTURE GUARANTEE CALIFORNIA INFRASTRUCTURE AND ECONOMIC DEVELOPMENT
INFRASTRUCTURE AND ECONOMIC DEVELOPMENT BANK
STATEMENT OF CASH FLOWS
TRUST FUND, ENTERPRISE FUNDS OF THE CALIFORNIA
The accompanying notes are an integral part of these financial statements. 20
This page has been intentionally left blank.
CALIFORNIA INFRASTRUCTURE AND ECONOMIC DEVELOPMENT BANK FUND AND CALIFORNIA INFRASTRUCTURE GUARANTEE
TRUST FUND, ENTERPRISE FUNDS OF THE CALIFORNIA INFRASTRUCTURE AND ECONOMIC DEVELOPMENT BANK
NOTES TO THE FINANCIAL STATEMENTS FOR THE FISCAL YEAR ENDED JUNE 30, 2016
21
1. THE FINANCIAL REPORTING ENTITY
The California Infrastructure and Economic Development Bank, a component unit of the State of California (State), is a public instrumentality of the State, organized and existing pursuant to the Bergeson-Peace Infrastructure and Economic Development Bank Act, constituting Division 1 of Title 6.7 of the California Government Code commencing with Section 63000 (Act). The California Infrastructure and Economic Development Bank has broad authority to issue tax-exempt and taxable revenue bonds, provide financing to public agencies, provide credit enhancements, including guarantees, acquire or lease facilities, and leverage State and Federal funds. The mission of the California Infrastructure and Economic Development Bank is to finance public infrastructure, clean energy, environmental and economic development projects that promote a healthy climate for job creation and retention, contribute to a strong California economy, and a healthy environment, and improve the quality of life in California communities. The California Infrastructure and Economic Development Bank is governed by a five-member Board of Directors (Board) consisting of the Director of the Governor’s Office of Business and Economic Development, who serves as the chair, the Director of the Department of Finance, the State Treasurer, the Secretary of the State Transportation Agency, and an appointee of the Governor.
The California Infrastructure and Economic Development Bank (IBank) issues loans to municipal entities pursuant to the Infrastructure State Revolving Fund (ISRF) Program, the activities of which are accounted for in the California Infrastructure and Economic Development Bank Fund (CIEDB Fund) and the California Infrastructure Guarantee Trust Fund (Guarantee Trust Fund) (collectively, the CIEDB Fund and the Guarantee Trust Fund are the Funds), enterprise funds of IBank. The ISRF Program provides financing to local government entities for a wide variety of infrastructure projects throughout the State. Eligible ISRF Program borrowers include cities, counties, special districts, assessment districts, joint power authorities, non-profit corporations formed by local government entities, and non-profit organizations sponsored by a governmental entity. IBank issues revenue bonds (ISRF Program Bonds) to provide additional funding for the ISRF Program. The ISRF Program Bond indentures require an independent audit of the ISRF Programs. IBank also serves as a conduit issuer of revenue bonds, loans, and commercial paper for private, nonprofit and other governmental entities (Conduit Bond Programs), the activities of which are also accounted for in the Funds. Legislation requires an audit of IBank’s activities under the Conduit Bond Program.
On August 25, 2015, the IBank Board of Directors approved the criteria, priorities and guidelines to select and underwrite projects for financing under the California Lending for Energy and Environmental Needs (CLEEN) Center, the activities of which are also accounted for in the Funds. IBank’s CLEEN Center provides low-cost financing to eligible State and local governments, and public universities, schools, and hospitals. The approved eligible projects include commercially proven technologies that are expected to result in carbon reduction benefits, water conservation or other environmental benefits within the State, including energy efficiency, renewable energy, energy storage, alternative technologies, alternative fuels, transportation and water. IBank financed its first energy efficiency project under the CLEEN Center in May 2016.
CALIFORNIA INFRASTRUCTURE AND ECONOMIC DEVELOPMENT BANK FUND AND CALIFORNIA INFRASTRUCTURE GUARANTEE
TRUST FUND, ENTERPRISE FUNDS OF THE CALIFORNIA INFRASTRUCTURE AND ECONOMIC DEVELOPMENT BANK
NOTES TO THE FINANCIAL STATEMENTS FOR THE FISCAL YEAR ENDED JUNE 30, 2016
22
Effective October 4, 2013, the Small Business Financial Assistance Act of 2013 created the Small Business Finance Center at the California Infrastructure and Economic Development Bank and transferred the California Small Business Expansion Fund, which accounts for the activities of the California Small Business Loan Guarantee Program (SBLGP), to the California Infrastructure and Economic Development Bank. The SBLGP provides repayment guarantees to lenders of loans to small businesses having difficulty securing financing on their own. The guarantees are issued by non-profit financial development corporations, on behalf of the California Infrastructure and Economic Development Bank, to banks and other lenders to help small business owners finance their business plans, including expanding operations, purchasing new equipment and infusing small businesses with working capital. Guarantees may also be issued on loans for start-up costs. The California Small Business Expansion Fund is not included in these financial statements.
2. SUMMARY OF SIGNIFICANT ACCOUNTING POLICIES
A. BASIS OF PRESENTATION / FUND FINANCIAL STATEMENTS
The financial statements presented in this report include only the financial activities of the Funds and do not purport to, and do not present fairly the financial position of IBank as of June 30, 2016, the changes in its financial position, or, where applicable, its cash flows for the fiscal year then ended in accordance with accounting principles generally accepted in the United States of America. IBank’s California Small Business Expansion Fund, its only other fund, is included in and subject to the audit of the State of California’s financial statements.
Monies in the Funds are held within the California State Treasury or by the bond trustees for the ISRF Program Bonds (Trustees).
CIEDB Fund – With the exception of amounts spent for program support that require an annual appropriation by the State Legislature, the CIEDB Fund is continuously appropriated without regard to fiscal year and is available for expenditure for the program related purposes stated in the Act. The CIEDB Fund is an enterprise fund that includes the CLEEN Center programs. The CLEEN Center programs are currently funded with IBank equity.
Guarantee Trust Fund – The Guarantee Trust Fund is continuously appropriated to IBank without regard to fiscal year for the purpose of insuring all or a portion of the accounts and subaccounts within the CIEDB Fund, any contracts or obligations of IBank or a sponsor, as that term is defined in the Act, and all or a part of any series of bonds issued by IBank, by a special purpose trust or by a sponsor. Uncommitted monies may be transferred between the CIEDB Fund and the Guarantee Trust Fund when appropriate to accomplish the financing objectives of IBank. The Guarantee Trust Fund is an enterprise fund.
CALIFORNIA INFRASTRUCTURE AND ECONOMIC DEVELOPMENT BANK FUND AND CALIFORNIA INFRASTRUCTURE GUARANTEE
TRUST FUND, ENTERPRISE FUNDS OF THE CALIFORNIA INFRASTRUCTURE AND ECONOMIC DEVELOPMENT BANK
NOTES TO THE FINANCIAL STATEMENTS FOR THE FISCAL YEAR ENDED JUNE 30, 2016
23
B. ACCOUNTING PRINCIPLES
The accompanying financial statements have been prepared using the economic resources measurement focus and accrual basis of accounting in accordance with accounting principles generally accepted in the United States of America as applied to governmental agencies. The Governmental Accounting Standards Board (GASB) is the accepted standard-setting body for establishing governmental accounting and financial reporting principles.
The Funds distinguish operating revenues and expenses from nonoperating items. Operating revenues and expenses generally result from providing financial services in connection with principal ongoing operations. The primary operating revenue reported in the Funds is financing income, representing interest on loans provided to ISRF Program borrowers. Also recognized in the Funds as operating revenue are the fees charged to ISRF Program borrowers and Conduit Bond Programs borrowers. Operating expenses primarily include interest expense on the ISRF Program Bonds and program support expenses. Investment income is reported as nonoperating revenue.
C. CASH AND EQUIVALENTS AND INVESTMENTS
IBank considers all short-term investments with an original maturity of three months or less to be cash equivalents. Cash and investments held in either the State’s Surplus Money Investment Fund (SMIF), an internal investment pool, money market deposit accounts or funds held by the Trustees are considered to be highly liquid and cash equivalents. All investment income, including changes in the fair value of investments, is recognized as revenue in the Statement of Revenues, Expenses, and Changes in Fund Net Position.
In accordance with GASB Statement No. 40, Deposit and Investment Risk Disclosures (Amendment of GASB No. 3), certain disclosure requirements, if applicable, for deposits and investment risks are specified relating to the following risks: interest rate, credit, custodial credit, concentrations of credit and foreign currency. In addition, other disclosures are specified including, but not limited to, the use of certain methods to present deposits and investments, highly sensitive investments and credit quality at year-end.
Certificates of deposit are recorded at cost. It is the intent of IBank to hold these certificates of deposit until maturity. IBank holds investments that are measured at fair value on a recurring basis. IBank categorizes its fair value measurements within the fair value hierarchy established by generally accepted accounting principles. The hierarchy is based on the valuation inputs used to measure the fair value of assets. Level 1 inputs are quoted prices in active markets for identical assets; Level 2 inputs are significant other observable inputs; Level 3 inputs are significant unobservable inputs.
CALIFORNIA INFRASTRUCTURE AND ECONOMIC DEVELOPMENT BANK FUND AND CALIFORNIA INFRASTRUCTURE GUARANTEE
TRUST FUND, ENTERPRISE FUNDS OF THE CALIFORNIA INFRASTRUCTURE AND ECONOMIC DEVELOPMENT BANK
NOTES TO THE FINANCIAL STATEMENTS
FOR THE FISCAL YEAR ENDED JUNE 30, 2016
24
D. LOANS RECEIVABLE
IBank enters into loan agreements, installment sale agreements and lease agreements (Loans) to finance public infrastructure and economic development projects and projects for non-profit organizations sponsored by governmental entities pursuant to the ISRF Program. A majority of the Loans are pledged to the 2014A ISRF Program Bonds, 2015A ISRF Program Bonds and the 2016A ISRF Program Bonds (Series Pledged Loans). Loans receivable includes pledged and non-pledged Loans. Pledged and non-pledged Loans receivable consists of two components – the disbursed and the undisbursed amount of Loans. The disbursed amount of pledged Loans receivable includes amounts drawn by the borrower for reimbursement or payment of project costs. The undisbursed amount of pledged Loans receivable includes the balance available to be drawn by the borrowers and draws submitted for payment but unpaid at year-end, and is offset by a liability for outstanding undisbursed loan commitments. The current portion of undisbursed pledged and non-pledged Loan commitments is an estimate and is generally based upon projections provided by borrowers. These estimates are subject to change due to unforeseen weather conditions, construction delays related to change orders, delayed material shipment, subcontractor performance problems and other factors that cannot be reasonably predicted.
Prior to the issuance of the ISRF Program Bonds, Loans were funded solely by General Fund appropriations received from the State, Loan repayments, fee revenue, and investment income. Since the issuance of the ISRF Program Bonds, Loans have been funded from the proceeds of the ISRF Program Bonds and/or from proceeds of Loan repayments, fee revenue and investment income. There is no provision for uncollectible accounts as all Loans are current and expected at this time to be repaid according to the scheduled terms.
E. ISSUANCE COSTS
Costs associated with the issuance of each series of the ISRF Program Bonds included bond counsel and disclosure counsel fees, trustee fees, rating agency fees, underwriting costs, financial advisor fees and other miscellaneous expenses. The ISRF Program bond issuance costs are recognized as an expense when incurred.
F. REVENUE BONDS PAYABLE
Revenue bonds payable are stated at their unpaid balance plus any remaining unamortized premiums. Bond premiums are amortized using the effective-interest method over the terms of the respective ISRF Program Bonds. The ISRF Program Bonds are subject to mandatory and optional redemption prior to their stated maturity. The ISRF Program Bonds are not obligations of the State, and the taxing power of the State is not pledged for their payments. The obligation of IBank to make such payments is a limited obligation, payable solely from the ISRF Program Bonds collateral pledged by IBank.
CALIFORNIA INFRASTRUCTURE AND ECONOMIC DEVELOPMENT BANK FUND AND CALIFORNIA INFRASTRUCTURE GUARANTEE
TRUST FUND, ENTERPRISE FUNDS OF THE CALIFORNIA INFRASTRUCTURE AND ECONOMIC DEVELOPMENT BANK
NOTES TO THE FINANCIAL STATEMENTS
FOR THE FISCAL YEAR ENDED JUNE 30, 2016
25
G. LOAN AND CONDUIT BOND FEES
IBank charges an origination fee and an annual servicing fee to ISRF Program borrowers. The origination fee is due upon execution of the Loan agreement and is collected no later than the date of the borrower’s first disbursement. Loan origination fees are recognized as revenue when due. The annual servicing fee is recognized as revenue when earned. IBank also charges application, bond issuance and annual fees to Conduit Bond Programs borrowers. Conduit bond fees are recognized as revenue when earned.
H. COMPENSATED ABSENCES PAYABLE
Compensated absences payable represents employees’ earned but unused vacation, annual leave, and other similar leave program balances which are eligible for payment upon separation from state service. Unused sick-leave balances are not included as they are converted to additional service credit used in the calculation of postemployment benefits. Compensated absences payable is a long-term obligation because leave earned in the current period is considered to be used before any unused leave from prior years (LIFO) and it is anticipated that employees will not generally use more leave than the amount earned in the current period.
I. DEFERRED OUTFLOWS/DEFERRED INFLOWS OF RESOURCES
In addition to assets and liabilities, the statement of net position reports separate sections for deferred outflows of resources and deferred inflows of resources. Deferred outflows of resources represent a consumption of resources that applies to a future period(s) and will not be recognized as an outflow of resources (expense) until then. Conversely, deferred inflows of resources represent an acquisition of resources that applies to a future period(s) and will not be recognized as an inflow of resources (revenue) until that time.
The loss on refunding debt resulting from the difference in the carrying value and reacquisition price of the refunded debt, is reported as a deferred outflow of resources and is amortized over the shorter of the life of the refunded debt or refunding bond.
Contributions made to the pension plan after the measurement date but before the fiscal year-end are recorded as a deferred outflow of resources and will reduce the net pension liability in the next fiscal year.
Additional factors involved in the calculation of IBank's pension expense and net pension liability include the differences between expected and actual experience, changes in assumptions, differences between projected and actual investment earnings, changes in proportion, and differences between IBank’s contributions and proportionate share of contributions. These factors are recorded as deferred outflows and inflows of resources and amortized over various periods. See Note 7 for further details related to these pension deferred outflows and inflows.
CALIFORNIA INFRASTRUCTURE AND ECONOMIC DEVELOPMENT BANK FUND AND CALIFORNIA INFRASTRUCTURE GUARANTEE
TRUST FUND, ENTERPRISE FUNDS OF THE CALIFORNIA INFRASTRUCTURE AND ECONOMIC DEVELOPMENT BANK
NOTES TO THE FINANCIAL STATEMENTS
FOR THE FISCAL YEAR ENDED JUNE 30, 2016
26
J. PENSIONS For purposes of measuring the net pension liability and deferred outflows/inflows of resources related to pensions, and pension expense, information about the fiduciary net position of the Funds’ portion of the California Public Employees’ Retirement System (CalPERS) Miscellaneous Plan (Plan) and additions to/deductions from the Plan’s fiduciary net position have been determined on the same basis as they are reported by CalPERS. For this purpose, benefit payments (including refunds of employee contributions) are recognized when due and payable in accordance with the benefit terms. Investments are reported at fair value.
K. CLASSIFICATION OF NET POSITION
Restricted net position represents amounts restricted due to external restrictions imposed by creditors, laws or regulations of the government, and restrictions imposed by law through constitutional provisions or enabling legislation. The net position reported in the Funds is restricted by statute for programs established by IBank and for programs administered pursuant to the Act.
L. USE OF ESTIMATES
The preparation of financial statements in conformity with accounting principles generally accepted in the United States of America requires management to make estimates and assumptions that affect the reported amounts of assets and liabilities at the reporting date and revenues and expenses during the reporting period. Actual results could differ from those estimates.
M. CURRENT YEAR GASB IMPLEMENTATION
For the year ended June 30, 2016, IBank implemented GASB Statement No. 72 (GASB 72), Fair Value Measurement and Application. The primary objective of GASB 72 is to provide guidance for applying fair value to certain investments and disclosures related to all fair value measurements. There was no material impact on IBank's financial statements as a result of the implementation of Statement No. 72. All required disclosures were added to Note 3.
3. CASH AND EQUIVALENTS AND INVESTMENTS
IBank follows GASB Statement No. 40, Deposit and Investment Risk Disclosures. This statement requires the disclosure of the interest rate, credit, custodial credit, concentration of credit and foreign currency risks to the extent that they exist at the date of the Statement of Net Position. Additional disclosure detail required by GASB Statement No. 40 for cash deposits, investments, and derivatives within the State’s centralized treasury system can be found in the State’s Comprehensive Annual Financial Report for the fiscal year ended June 30, 2015, which is the latest available.
CALIFORNIA INFRASTRUCTURE AND ECONOMIC DEVELOPMENT BANK FUND AND CALIFORNIA INFRASTRUCTURE GUARANTEE
TRUST FUND, ENTERPRISE FUNDS OF THE CALIFORNIA INFRASTRUCTURE AND ECONOMIC DEVELOPMENT BANK
NOTES TO THE FINANCIAL STATEMENTS
FOR THE FISCAL YEAR ENDED JUNE 30, 2016
27
Due to the specified nature of the activities reported in the Funds as established in the Act, all cash, cash equivalents, and investments are considered restricted at June 30, 2016, since these funds cannot be spent for any purpose other than as established in the Act.
Investments are made pursuant to an investment policy initially adopted by the Board in March 2006 and as amended by the Board on April 27, 2010. The Investment Policy, with certain clarifications and changes, was reviewed and approved by the Board on February 24, 2015. The Investment Policy provides guidelines for the prudent investment while maximizing efficiency and financial return in conformance with all applicable State statutes governing the investment of public funds, with the foremost objectives being safety and liquidity.
Pursuant to the Investment Policy, IBank may, from time to time, direct the State Treasurer (Treasurer) to invest monies in the CIEDB Fund and Guarantee Trust Fund held within the State’s centralized treasury system that are not required for its current needs, in any eligible securities specified in Government Code Section 16430 as IBank shall designate. IBank may direct the Treasurer to invest monies in the Guarantee Trust Fund in certain repurchase agreements, investment agreements and subordinated securities as specified in Government Code Section 63062(a). IBank may direct the Treasurer to deposit monies in the Funds in interest-bearing accounts in qualified public depositories as established by State law, including any bank in the State or in any savings and loan association in the State. IBank may alternatively require the transfer of monies in the Funds to the SMIF for investment.
Government Code Sections 63052(e), 63062(b) and 5922(d) provide that bond proceeds and monies set aside and pledged to the repayment of bonds may be invested in securities or obligations described in the indenture for those bonds. Monies in each of the accounts with respect to the 2014A ISRF Program Bonds, 2015A ISRF Program Bonds and 2016A ISRF Program Bonds issued under the Indenture, dated as of February 1, 2014, between IBank and US Bank National Association, as trustee, (Trustee) as supplemented and amended by the First Supplemental Indenture dated as of February 1, 2014 between IBank and the Trustee, the Second Supplemental Indenture dated as of June 1, 2015 between IBank and the Trustee and the Third Supplemental Indenture dated as of June 1, 2016 between IBank and the Trustee (Indenture) are held by the Trustee and shall be invested and reinvested by the Trustee in permitted investments, as that term is defined in the Indenture. The permitted investments mature or are subject to redemption by the owner thereof prior to the date such funds are expected to be needed.
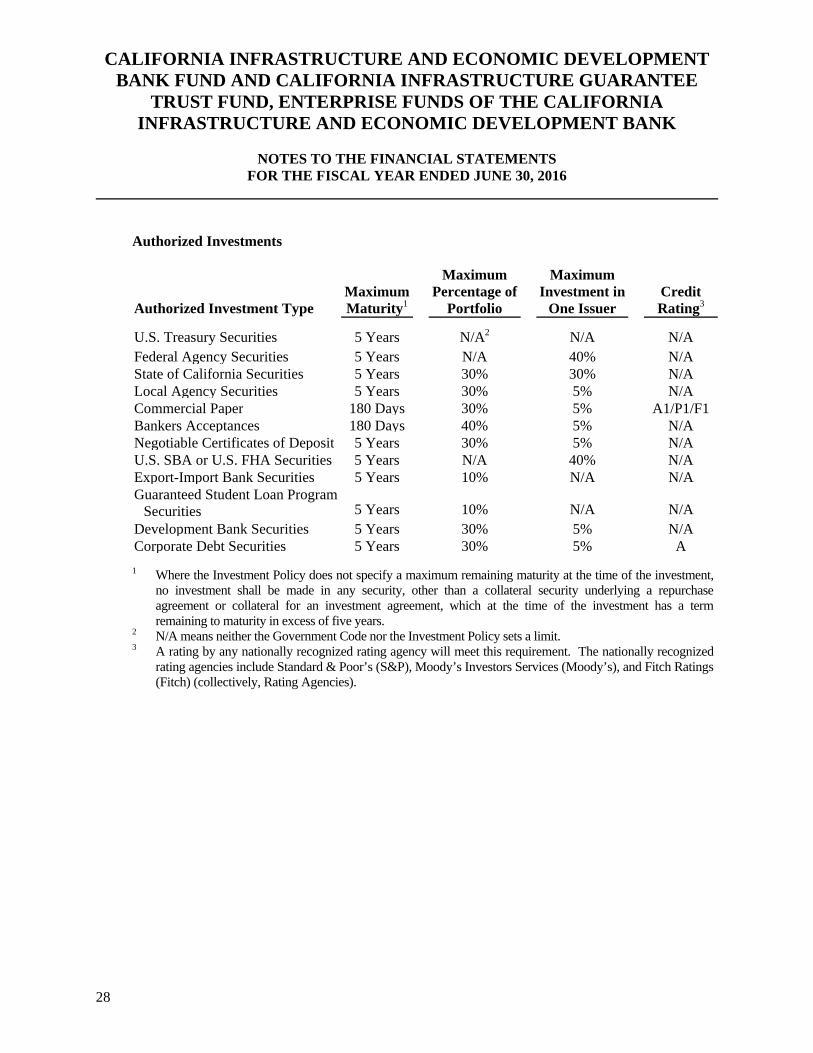
Investments Authorized by the California Government Code and the Investment Policy
The following table identifies the investment types that are authorized by Government Code sections 16430, 5922(d), 63052(d) and (e), and 63062(a) and (b) or the Investment Policy, where more restrictive. The table below also identifies certain provisions of the California Government Code, or the Investment Policy, where more restrictive, that address interest rate risk, credit risk, and concentration of credit risk. This table does not address investments of debt proceeds and other monies held by the Trustees that are governed by the provisions of the Indenture, but rather the general provisions of the California Government Code or the Investment Policy.
CALIFORNIA INFRASTRUCTURE AND ECONOMIC DEVELOPMENT BANK FUND AND CALIFORNIA INFRASTRUCTURE GUARANTEE
TRUST FUND, ENTERPRISE FUNDS OF THE CALIFORNIA INFRASTRUCTURE AND ECONOMIC DEVELOPMENT BANK
NOTES TO THE FINANCIAL STATEMENTS
FOR THE FISCAL YEAR ENDED JUNE 30, 2016
28
Authorized Investments Authorized Investment Type
MaximumMaturity1
Maximum Percentage of
Portfolio
Maximum Investment in
One Issuer
Credit Rating3
U.S. Treasury Securities 5 Years N/A2 N/A N/A Federal Agency Securities 5 Years N/A 40% N/AState of California Securities 5 Years 30% 30% N/ALocal Agency Securities 5 Years 30% 5% N/ACommercial Paper 180 Days 30% 5% A1/P1/F1Bankers Acceptances 180 Days 40% 5% N/ANegotiable Certificates of Deposit 5 Years 30% 5% N/AU.S. SBA or U.S. FHA Securities 5 Years N/A 40% N/AExport-Import Bank Securities 5 Years 10% N/A N/AGuaranteed Student Loan Program
Securities 5 Years 10% N/A N/A Development Bank Securities 5 Years 30% 5% N/ACorporate Debt Securities 5 Years 30% 5% A 1 Where the Investment Policy does not specify a maximum remaining maturity at the time of the investment,
no investment shall be made in any security, other than a collateral security underlying a repurchase agreement or collateral for an investment agreement, which at the time of the investment has a term remaining to maturity in excess of five years.
2 N/A means neither the Government Code nor the Investment Policy sets a limit. 3 A rating by any nationally recognized rating agency will meet this requirement. The nationally recognized
rating agencies include Standard & Poor’s (S&P), Moody’s Investors Services (Moody’s), and Fitch Ratings (Fitch) (collectively, Rating Agencies).
CALIFORNIA INFRASTRUCTURE AND ECONOMIC DEVELOPMENT BANK FUND AND CALIFORNIA INFRASTRUCTURE GUARANTEE
TRUST FUND, ENTERPRISE FUNDS OF THE CALIFORNIA INFRASTRUCTURE AND ECONOMIC DEVELOPMENT BANK
NOTES TO THE FINANCIAL STATEMENTS
FOR THE FISCAL YEAR ENDED JUNE 30, 2016
29
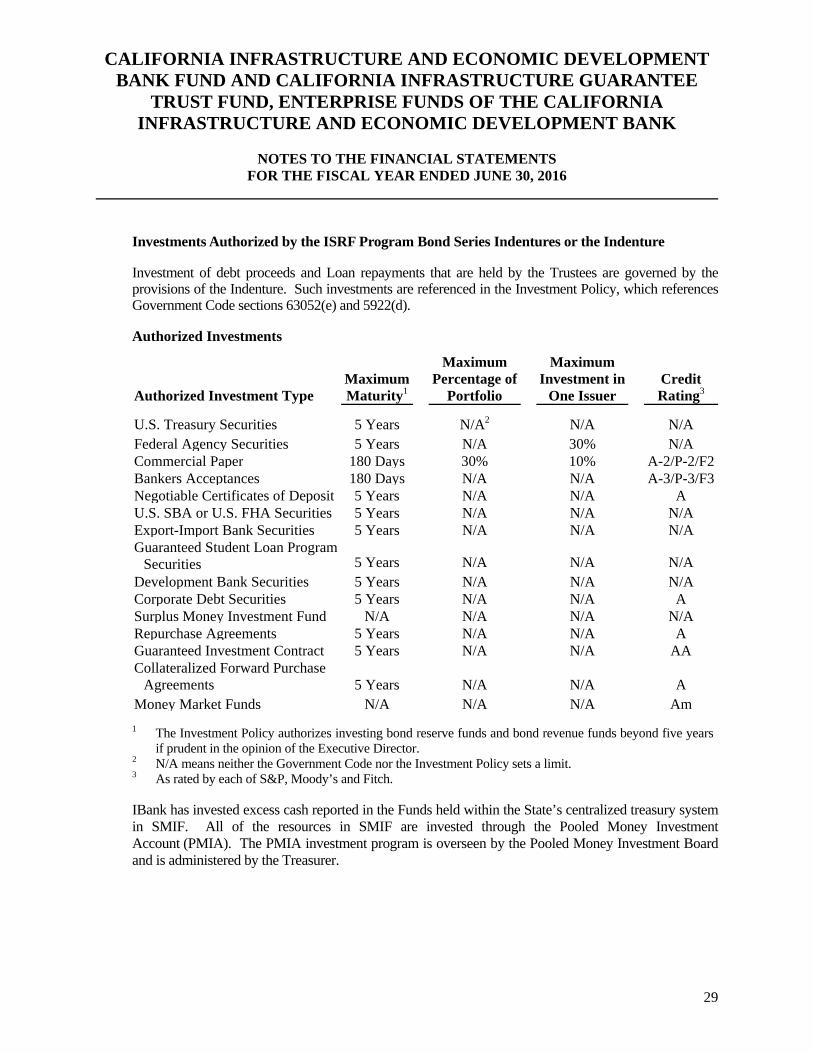
Investments Authorized by the ISRF Program Bond Series Indentures or the Indenture
Investment of debt proceeds and Loan repayments that are held by the Trustees are governed by the provisions of the Indenture. Such investments are referenced in the Investment Policy, which references Government Code sections 63052(e) and 5922(d).
Authorized Investments
Authorized Investment Type
MaximumMaturity1
Maximum Percentage of
Portfolio
Maximum Investment in
One Issuer
Credit Rating3
U.S. Treasury Securities 5 Years N/A2 N/A N/A Federal Agency Securities 5 Years N/A 30% N/ACommercial Paper 180 Days 30% 10% A-2/P-2/F2Bankers Acceptances 180 Days N/A N/A A-3/P-3/F3Negotiable Certificates of Deposit 5 Years N/A N/A AU.S. SBA or U.S. FHA Securities 5 Years N/A N/A N/AExport-Import Bank Securities 5 Years N/A N/A N/AGuaranteed Student Loan Program
Securities 5 Years N/A N/A N/A Development Bank Securities 5 Years N/A N/A N/ACorporate Debt Securities 5 Years N/A N/A ASurplus Money Investment Fund N/A N/A N/A N/ARepurchase Agreements 5 Years N/A N/A AGuaranteed Investment Contract 5 Years N/A N/A AACollateralized Forward Purchase
Agreements 5 Years N/A N/A A Money Market Funds N/A N/A N/A Am 1 The Investment Policy authorizes investing bond reserve funds and bond revenue funds beyond five years
if prudent in the opinion of the Executive Director. 2 N/A means neither the Government Code nor the Investment Policy sets a limit. 3 As rated by each of S&P, Moody’s and Fitch.
IBank has invested excess cash reported in the Funds held within the State’s centralized treasury system in SMIF. All of the resources in SMIF are invested through the Pooled Money Investment Account (PMIA). The PMIA investment program is overseen by the Pooled Money Investment Board and is administered by the Treasurer.
CALIFORNIA INFRASTRUCTURE AND ECONOMIC DEVELOPMENT BANK FUND AND CALIFORNIA INFRASTRUCTURE GUARANTEE
TRUST FUND, ENTERPRISE FUNDS OF THE CALIFORNIA INFRASTRUCTURE AND ECONOMIC DEVELOPMENT BANK
NOTES TO THE FINANCIAL STATEMENTS
FOR THE FISCAL YEAR ENDED JUNE 30, 2016
30
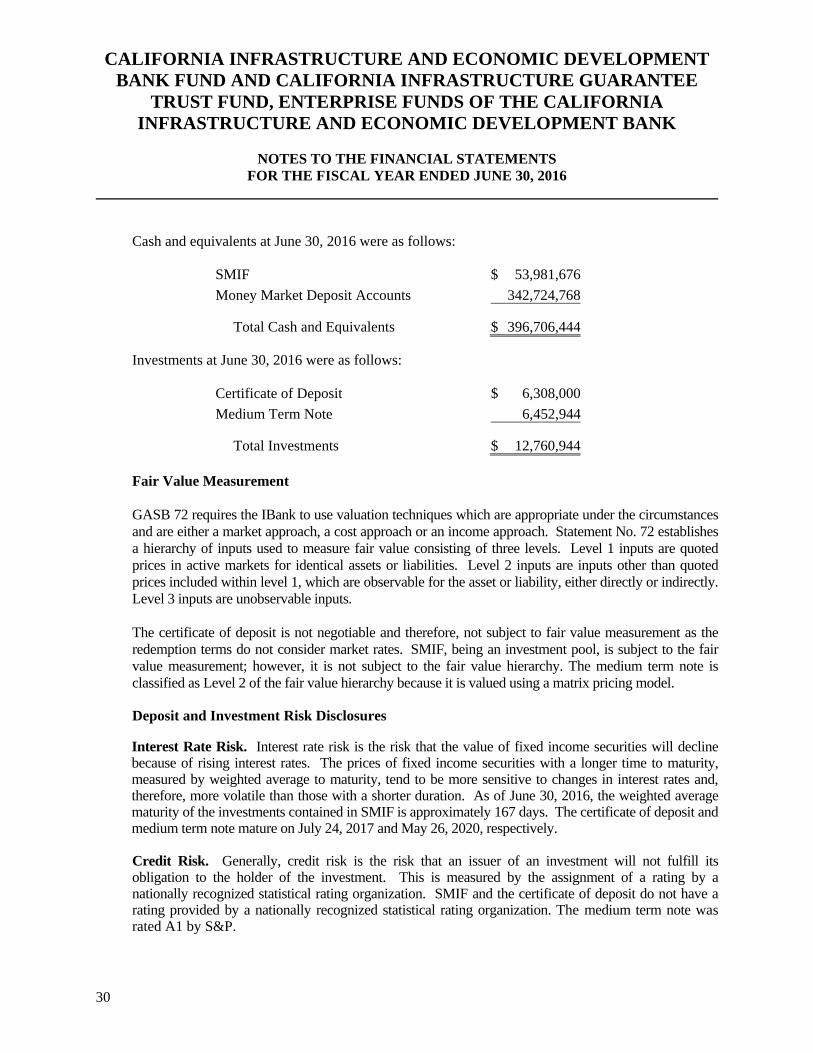
Cash and equivalents at June 30, 2016 were as follows:
SMIF $ 53,981,676
Money Market Deposit Accounts 342,724,768
Total Cash and Equivalents $ 396,706,444
Investments at June 30, 2016 were as follows:
Certificate of Deposit $ 6,308,000
Medium Term Note 6,452,944
Total Investments $ 12,760,944 Fair Value Measurement GASB 72 requires the IBank to use valuation techniques which are appropriate under the circumstances and are either a market approach, a cost approach or an income approach. Statement No. 72 establishes a hierarchy of inputs used to measure fair value consisting of three levels. Level 1 inputs are quoted prices in active markets for identical assets or liabilities. Level 2 inputs are inputs other than quoted prices included within level 1, which are observable for the asset or liability, either directly or indirectly. Level 3 inputs are unobservable inputs. The certificate of deposit is not negotiable and therefore, not subject to fair value measurement as the redemption terms do not consider market rates. SMIF, being an investment pool, is subject to the fair value measurement; however, it is not subject to the fair value hierarchy. The medium term note is classified as Level 2 of the fair value hierarchy because it is valued using a matrix pricing model. Deposit and Investment Risk Disclosures
Interest Rate Risk. Interest rate risk is the risk that the value of fixed income securities will decline because of rising interest rates. The prices of fixed income securities with a longer time to maturity, measured by weighted average to maturity, tend to be more sensitive to changes in interest rates and, therefore, more volatile than those with a shorter duration. As of June 30, 2016, the weighted average maturity of the investments contained in SMIF is approximately 167 days. The certificate of deposit and medium term note mature on July 24, 2017 and May 26, 2020, respectively. Credit Risk. Generally, credit risk is the risk that an issuer of an investment will not fulfill its obligation to the holder of the investment. This is measured by the assignment of a rating by a nationally recognized statistical rating organization. SMIF and the certificate of deposit do not have a rating provided by a nationally recognized statistical rating organization. The medium term note was rated A1 by S&P.
CALIFORNIA INFRASTRUCTURE AND ECONOMIC DEVELOPMENT BANK FUND AND CALIFORNIA INFRASTRUCTURE GUARANTEE
TRUST FUND, ENTERPRISE FUNDS OF THE CALIFORNIA INFRASTRUCTURE AND ECONOMIC DEVELOPMENT BANK
NOTES TO THE FINANCIAL STATEMENTS
FOR THE FISCAL YEAR ENDED JUNE 30, 2016
31
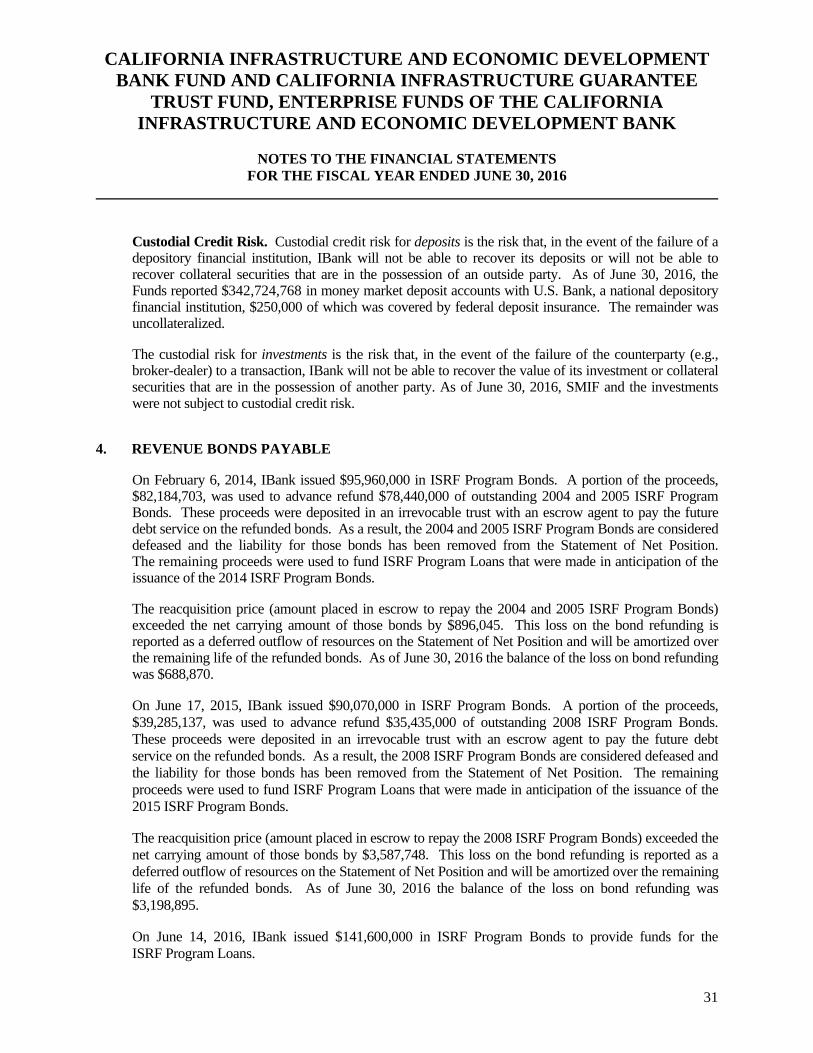
Custodial Credit Risk. Custodial credit risk for deposits is the risk that, in the event of the failure of a depository financial institution, IBank will not be able to recover its deposits or will not be able to recover collateral securities that are in the possession of an outside party. As of June 30, 2016, the Funds reported $342,724,768 in money market deposit accounts with U.S. Bank, a national depository financial institution, $250,000 of which was covered by federal deposit insurance. The remainder was uncollateralized.
The custodial risk for investments is the risk that, in the event of the failure of the counterparty (e.g., broker-dealer) to a transaction, IBank will not be able to recover the value of its investment or collateral securities that are in the possession of another party. As of June 30, 2016, SMIF and the investments were not subject to custodial credit risk.
4. REVENUE BONDS PAYABLE
On February 6, 2014, IBank issued $95,960,000 in ISRF Program Bonds. A portion of the proceeds, $82,184,703, was used to advance refund $78,440,000 of outstanding 2004 and 2005 ISRF Program Bonds. These proceeds were deposited in an irrevocable trust with an escrow agent to pay the future debt service on the refunded bonds. As a result, the 2004 and 2005 ISRF Program Bonds are considered defeased and the liability for those bonds has been removed from the Statement of Net Position. The remaining proceeds were used to fund ISRF Program Loans that were made in anticipation of the issuance of the 2014 ISRF Program Bonds.
The reacquisition price (amount placed in escrow to repay the 2004 and 2005 ISRF Program Bonds) exceeded the net carrying amount of those bonds by $896,045. This loss on the bond refunding is reported as a deferred outflow of resources on the Statement of Net Position and will be amortized over the remaining life of the refunded bonds. As of June 30, 2016 the balance of the loss on bond refunding was $688,870.
On June 17, 2015, IBank issued $90,070,000 in ISRF Program Bonds. A portion of the proceeds, $39,285,137, was used to advance refund $35,435,000 of outstanding 2008 ISRF Program Bonds. These proceeds were deposited in an irrevocable trust with an escrow agent to pay the future debt service on the refunded bonds. As a result, the 2008 ISRF Program Bonds are considered defeased and the liability for those bonds has been removed from the Statement of Net Position. The remaining proceeds were used to fund ISRF Program Loans that were made in anticipation of the issuance of the 2015 ISRF Program Bonds.
The reacquisition price (amount placed in escrow to repay the 2008 ISRF Program Bonds) exceeded the net carrying amount of those bonds by $3,587,748. This loss on the bond refunding is reported as a deferred outflow of resources on the Statement of Net Position and will be amortized over the remaining life of the refunded bonds. As of June 30, 2016 the balance of the loss on bond refunding was $3,198,895.
On June 14, 2016, IBank issued $141,600,000 in ISRF Program Bonds to provide funds for the ISRF Program Loans.
CALIFORNIA INFRASTRUCTURE AND ECONOMIC DEVELOPMENT BANK FUND AND CALIFORNIA INFRASTRUCTURE GUARANTEE
TRUST FUND, ENTERPRISE FUNDS OF THE CALIFORNIA INFRASTRUCTURE AND ECONOMIC DEVELOPMENT BANK
NOTES TO THE FINANCIAL STATEMENTS
FOR THE FISCAL YEAR ENDED JUNE 30, 2016
32
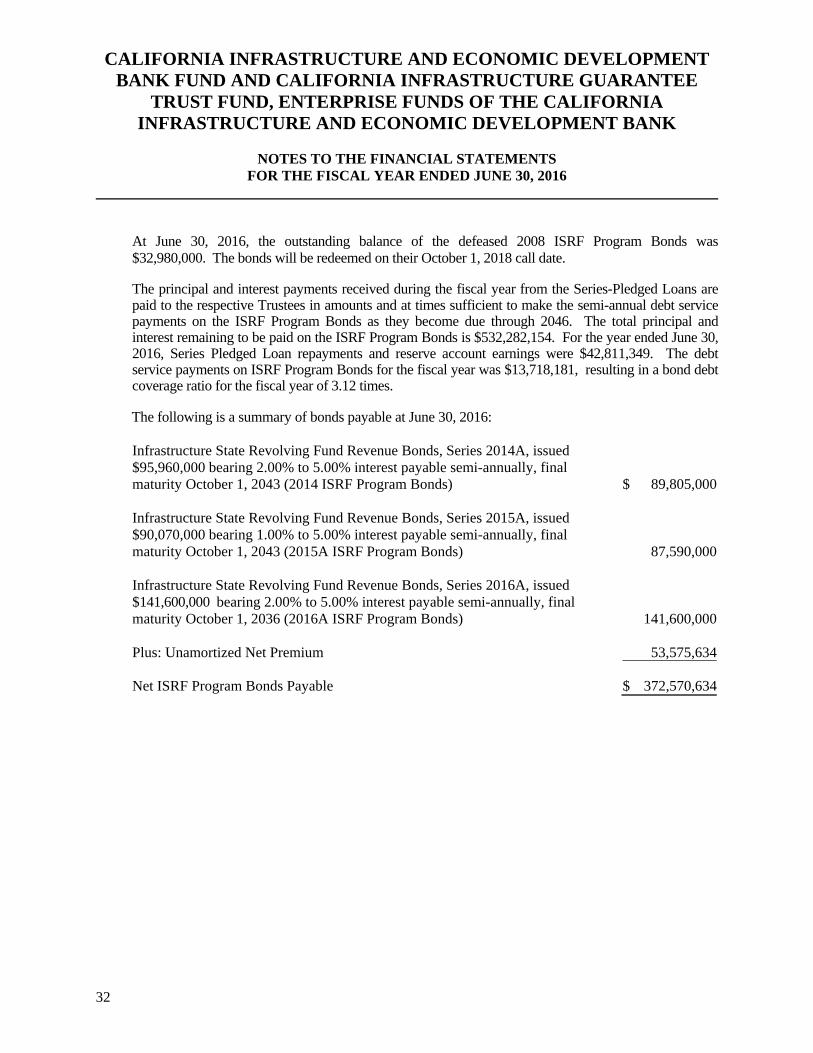
At June 30, 2016, the outstanding balance of the defeased 2008 ISRF Program Bonds was $32,980,000. The bonds will be redeemed on their October 1, 2018 call date.
The principal and interest payments received during the fiscal year from the Series-Pledged Loans are paid to the respective Trustees in amounts and at times sufficient to make the semi-annual debt service payments on the ISRF Program Bonds as they become due through 2046. The total principal and interest remaining to be paid on the ISRF Program Bonds is $532,282,154. For the year ended June 30, 2016, Series Pledged Loan repayments and reserve account earnings were $42,811,349. The debt service payments on ISRF Program Bonds for the fiscal year was $13,718,181, resulting in a bond debt coverage ratio for the fiscal year of 3.12 times.
The following is a summary of bonds payable at June 30, 2016: Infrastructure State Revolving Fund Revenue Bonds, Series 2014A, issued $95,960,000 bearing 2.00% to 5.00% interest payable semi-annually, final maturity October 1, 2043 (2014 ISRF Program Bonds) $ 89,805,000 Infrastructure State Revolving Fund Revenue Bonds, Series 2015A, issued $90,070,000 bearing 1.00% to 5.00% interest payable semi-annually, final maturity October 1, 2043 (2015A ISRF Program Bonds)
87,590,000 Infrastructure State Revolving Fund Revenue Bonds, Series 2016A, issued $141,600,000 bearing 2.00% to 5.00% interest payable semi-annually, final maturity October 1, 2036 (2016A ISRF Program Bonds)
141,600,000 Plus: Unamortized Net Premium
53,575,634
Net ISRF Program Bonds Payable $ 372,570,634
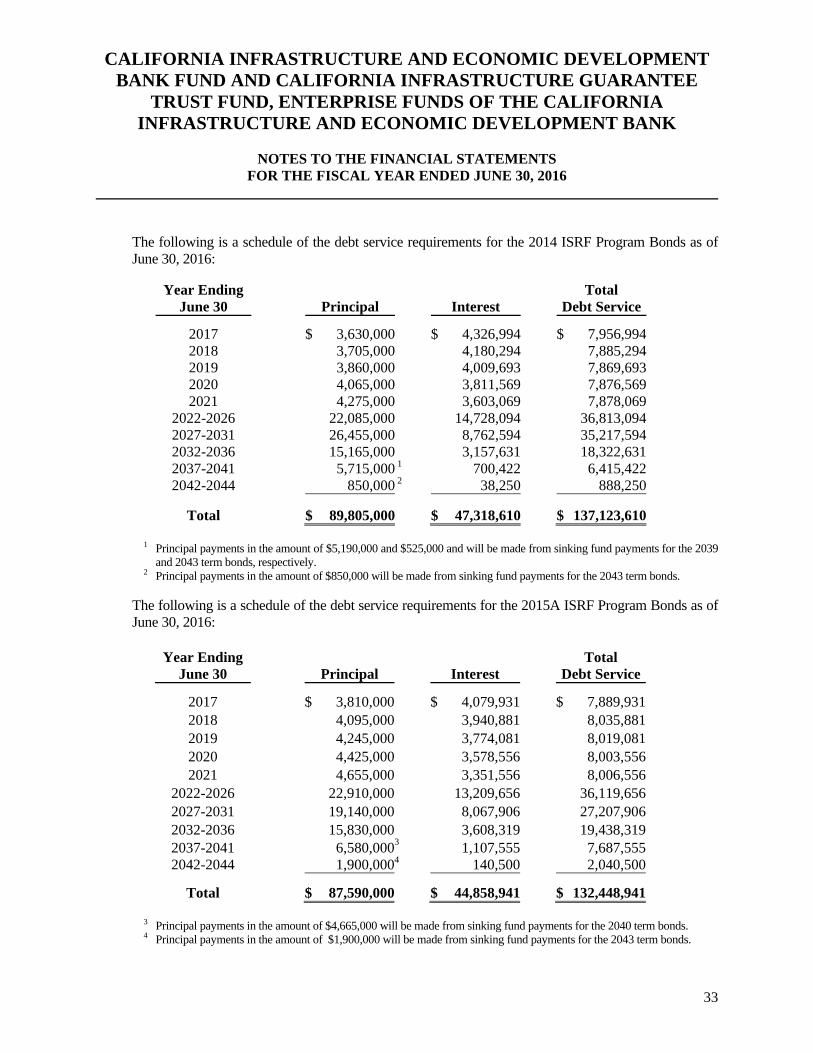
CALIFORNIA INFRASTRUCTURE AND ECONOMIC DEVELOPMENT BANK FUND AND CALIFORNIA INFRASTRUCTURE GUARANTEE
TRUST FUND, ENTERPRISE FUNDS OF THE CALIFORNIA INFRASTRUCTURE AND ECONOMIC DEVELOPMENT BANK
NOTES TO THE FINANCIAL STATEMENTS
FOR THE FISCAL YEAR ENDED JUNE 30, 2016
33
The following is a schedule of the debt service requirements for the 2014 ISRF Program Bonds as of June 30, 2016:
Year Ending June 30
Principal
Interest
Total Debt Service
2017 $ 3,630,000 $ 4,326,994 $ 7,956,9942018 3,705,000 4,180,294 7,885,2942019 3,860,000 4,009,693 7,869,6932020 4,065,000 3,811,569 7,876,5692021 4,275,000 3,603,069 7,878,069
2022-2026 22,085,000 14,728,094 36,813,0942027-2031 26,455,000 8,762,594 35,217,5942032-2036 15,165,000 3,157,631 18,322,6312037-2041 5,715,000 1 700,422 6,415,4222042-2044 850,000 2 38,250 888,250
Total $ 89,805,000 $ 47,318,610 $ 137,123,610
1 Principal payments in the amount of $5,190,000 and $525,000 and will be made from sinking fund payments for the 2039 and 2043 term bonds, respectively.
2 Principal payments in the amount of $850,000 will be made from sinking fund payments for the 2043 term bonds.
The following is a schedule of the debt service requirements for the 2015A ISRF Program Bonds as of June 30, 2016:
Year Ending June 30
Principal
Interest
Total Debt Service
2017 $ 3,810,000 $ 4,079,931 $ 7,889,9312018 4,095,000 3,940,881 8,035,8812019 4,245,000 3,774,081 8,019,0812020 4,425,000 3,578,556 8,003,5562021 4,655,000 3,351,556 8,006,556
2022-2026 22,910,000 13,209,656 36,119,6562027-2031 19,140,000 8,067,906 27,207,9062032-2036 15,830,000 3,608,319 19,438,319 2037-2041 6,580,0003 1,107,555 7,687,555 2042-2044 1,900,0004 140,500 2,040,500
Total $ 87,590,000 $ 44,858,941 $ 132,448,941
3 Principal payments in the amount of $4,665,000 will be made from sinking fund payments for the 2040 term bonds. 4 Principal payments in the amount of $1,900,000 will be made from sinking fund payments for the 2043 term bonds.
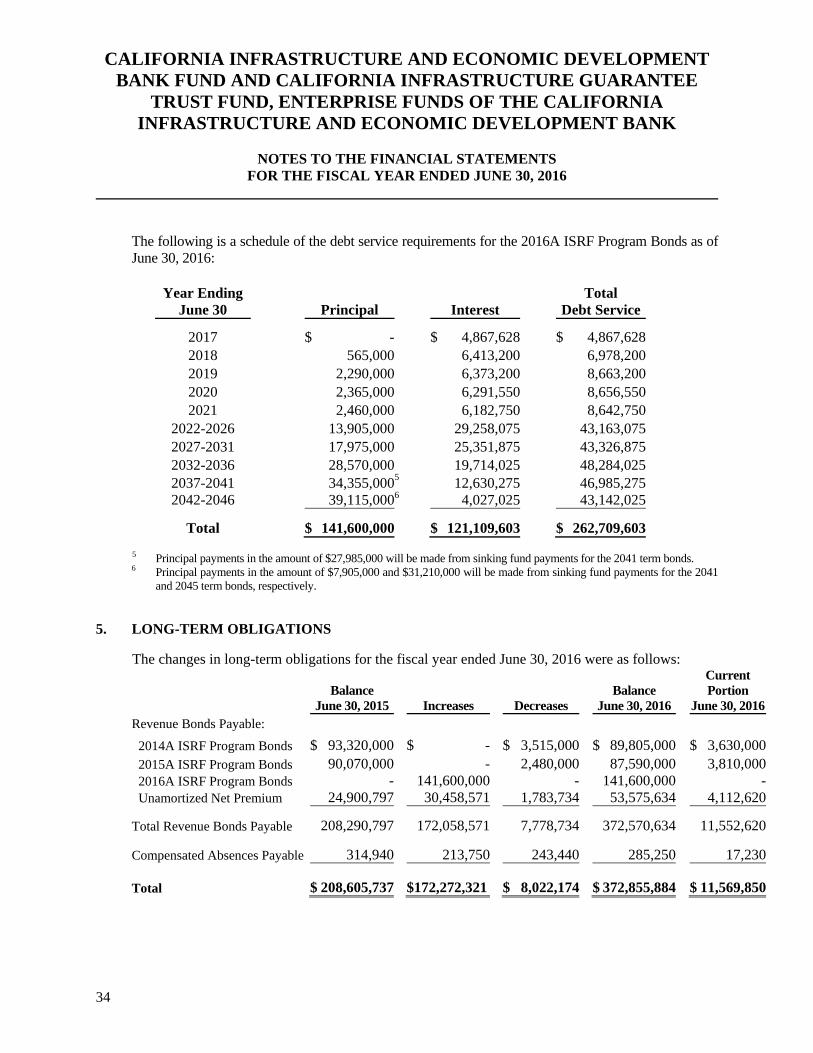
CALIFORNIA INFRASTRUCTURE AND ECONOMIC DEVELOPMENT BANK FUND AND CALIFORNIA INFRASTRUCTURE GUARANTEE
TRUST FUND, ENTERPRISE FUNDS OF THE CALIFORNIA INFRASTRUCTURE AND ECONOMIC DEVELOPMENT BANK
NOTES TO THE FINANCIAL STATEMENTS
FOR THE FISCAL YEAR ENDED JUNE 30, 2016
34
The following is a schedule of the debt service requirements for the 2016A ISRF Program Bonds as of June 30, 2016:
Year Ending June 30
Principal
Interest
Total Debt Service
2017 $ - $ 4,867,628 $ 4,867,6282018 565,000 6,413,200 6,978,2002019 2,290,000 6,373,200 8,663,2002020 2,365,000 6,291,550 8,656,5502021 2,460,000 6,182,750 8,642,750
2022-2026 13,905,000 29,258,075 43,163,0752027-2031 17,975,000 25,351,875 43,326,8752032-2036 28,570,000 19,714,025 48,284,025 2037-2041 34,355,0005 12,630,275 46,985,275 2042-2046 39,115,0006 4,027,025 43,142,025
Total $ 141,600,000 $ 121,109,603 $ 262,709,603
5 Principal payments in the amount of $27,985,000 will be made from sinking fund payments for the 2041 term bonds. 6 Principal payments in the amount of $7,905,000 and $31,210,000 will be made from sinking fund payments for the 2041
and 2045 term bonds, respectively.
5. LONG-TERM OBLIGATIONS
The changes in long-term obligations for the fiscal year ended June 30, 2016 were as follows:
Balance June 30, 2015
Increases
Decreases
Balance June 30, 2016
Current Portion
June 30, 2016Revenue Bonds Payable:
2014A ISRF Program Bonds $ 93,320,000 $ - $ 3,515,000 $ 89,805,000 $ 3,630,000 2015A ISRF Program Bonds 90,070,000 - 2,480,000 87,590,000 3,810,000 2016A ISRF Program Bonds - 141,600,000 - 141,600,000 - Unamortized Net Premium 24,900,797 30,458,571 1,783,734 53,575,634 4,112,620
Total Revenue Bonds Payable 208,290,797 172,058,571 7,778,734 372,570,634 11,552,620
Compensated Absences Payable 314,940 213,750 243,440 285,250 17,230 Total $ 208,605,737 $172,272,321 $ 8,022,174 $ 372,855,884 $ 11,569,850
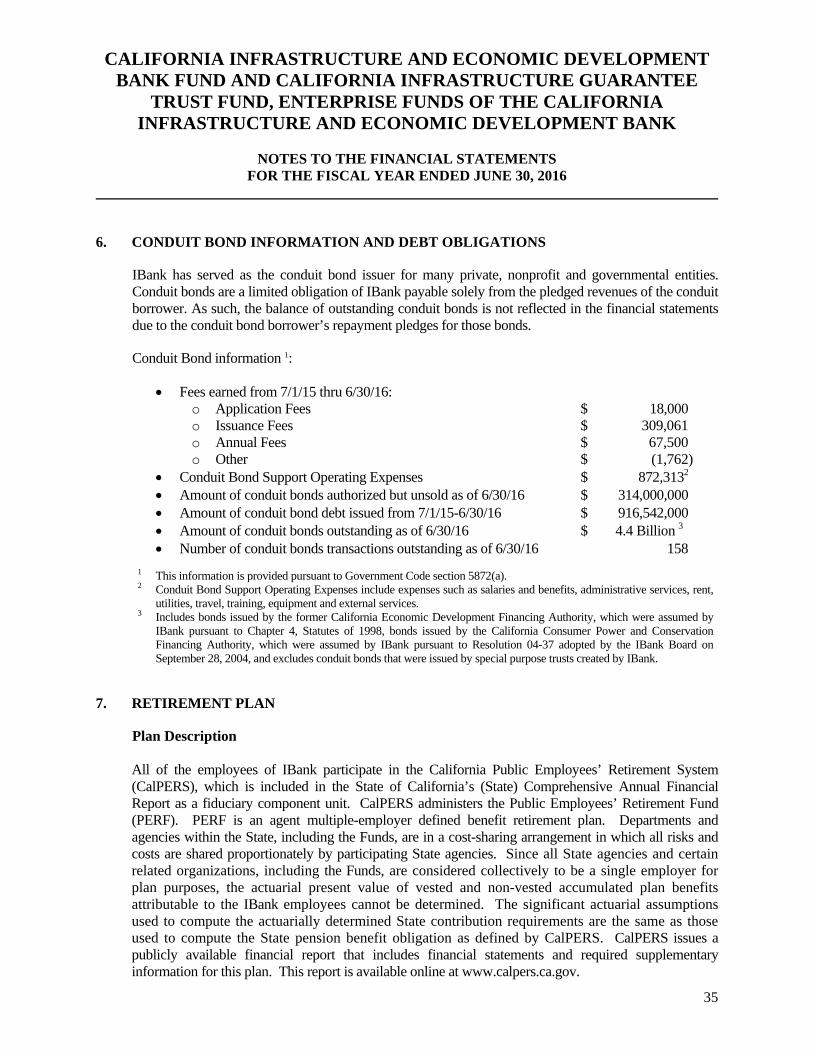
CALIFORNIA INFRASTRUCTURE AND ECONOMIC DEVELOPMENT BANK FUND AND CALIFORNIA INFRASTRUCTURE GUARANTEE
TRUST FUND, ENTERPRISE FUNDS OF THE CALIFORNIA INFRASTRUCTURE AND ECONOMIC DEVELOPMENT BANK
NOTES TO THE FINANCIAL STATEMENTS
FOR THE FISCAL YEAR ENDED JUNE 30, 2016
35
6. CONDUIT BOND INFORMATION AND DEBT OBLIGATIONS
IBank has served as the conduit bond issuer for many private, nonprofit and governmental entities. Conduit bonds are a limited obligation of IBank payable solely from the pledged revenues of the conduit borrower. As such, the balance of outstanding conduit bonds is not reflected in the financial statements due to the conduit bond borrower’s repayment pledges for those bonds.
Conduit Bond information 1:
Fees earned from 7/1/15 thru 6/30/16: o Application Fees $ 18,000 o Issuance Fees $ 309,061 o Annual Fees $ 67,500 o Other $ (1,762)
Conduit Bond Support Operating Expenses $ 872,3132 Amount of conduit bonds authorized but unsold as of 6/30/16 $ 314,000,000 Amount of conduit bond debt issued from 7/1/15-6/30/16 $ 916,542,000 Amount of conduit bonds outstanding as of 6/30/16 $ 4.4 Billion 3 Number of conduit bonds transactions outstanding as of 6/30/16 158
1 This information is provided pursuant to Government Code section 5872(a). 2 Conduit Bond Support Operating Expenses include expenses such as salaries and benefits, administrative services, rent,
utilities, travel, training, equipment and external services. 3 Includes bonds issued by the former California Economic Development Financing Authority, which were assumed by
IBank pursuant to Chapter 4, Statutes of 1998, bonds issued by the California Consumer Power and Conservation Financing Authority, which were assumed by IBank pursuant to Resolution 04-37 adopted by the IBank Board on September 28, 2004, and excludes conduit bonds that were issued by special purpose trusts created by IBank.
7. RETIREMENT PLAN
Plan Description All of the employees of IBank participate in the California Public Employees’ Retirement System (CalPERS), which is included in the State of California’s (State) Comprehensive Annual Financial Report as a fiduciary component unit. CalPERS administers the Public Employees’ Retirement Fund (PERF). PERF is an agent multiple-employer defined benefit retirement plan. Departments and agencies within the State, including the Funds, are in a cost-sharing arrangement in which all risks and costs are shared proportionately by participating State agencies. Since all State agencies and certain related organizations, including the Funds, are considered collectively to be a single employer for plan purposes, the actuarial present value of vested and non-vested accumulated plan benefits attributable to the IBank employees cannot be determined. The significant actuarial assumptions used to compute the actuarially determined State contribution requirements are the same as those used to compute the State pension benefit obligation as defined by CalPERS. CalPERS issues a publicly available financial report that includes financial statements and required supplementary information for this plan. This report is available online at www.calpers.ca.gov.
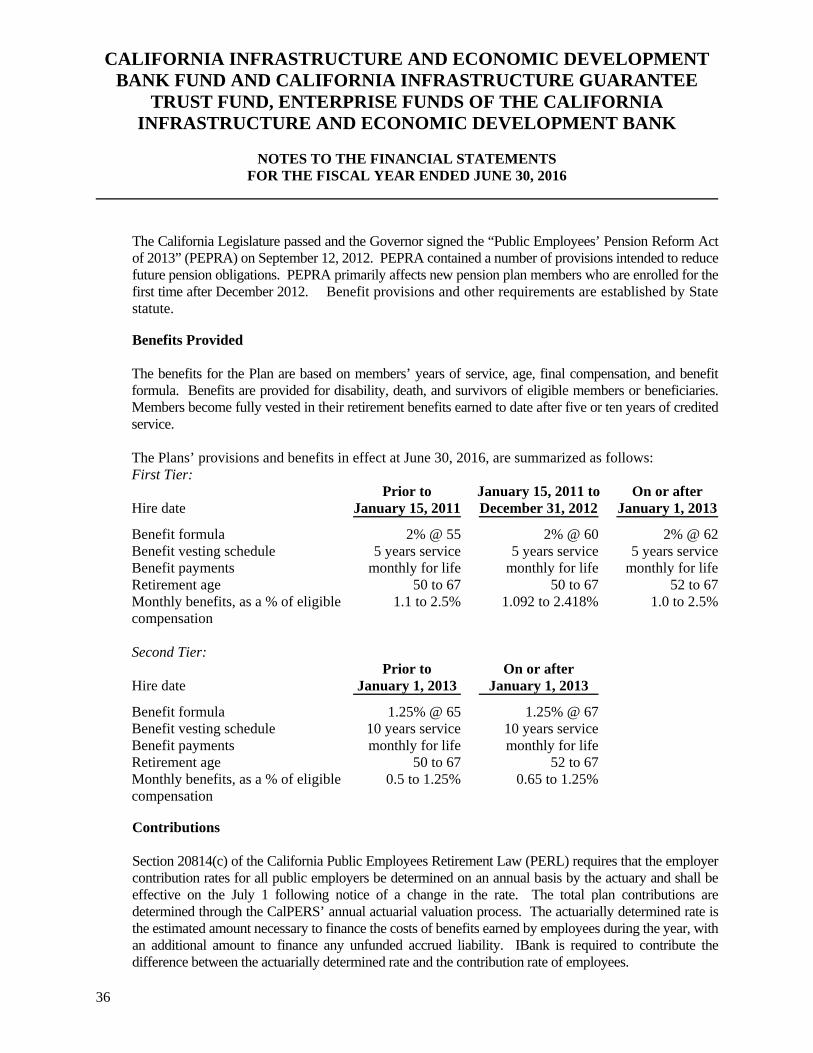
CALIFORNIA INFRASTRUCTURE AND ECONOMIC DEVELOPMENT BANK FUND AND CALIFORNIA INFRASTRUCTURE GUARANTEE
TRUST FUND, ENTERPRISE FUNDS OF THE CALIFORNIA INFRASTRUCTURE AND ECONOMIC DEVELOPMENT BANK
NOTES TO THE FINANCIAL STATEMENTS
FOR THE FISCAL YEAR ENDED JUNE 30, 2016
36
The California Legislature passed and the Governor signed the “Public Employees’ Pension Reform Act of 2013” (PEPRA) on September 12, 2012. PEPRA contained a number of provisions intended to reduce future pension obligations. PEPRA primarily affects new pension plan members who are enrolled for the first time after December 2012. Benefit provisions and other requirements are established by State statute.
Benefits Provided
The benefits for the Plan are based on members’ years of service, age, final compensation, and benefit formula. Benefits are provided for disability, death, and survivors of eligible members or beneficiaries. Members become fully vested in their retirement benefits earned to date after five or ten years of credited service. The Plans’ provisions and benefits in effect at June 30, 2016, are summarized as follows: First Tier:
Hire date Prior to
January 15, 2011January 15, 2011 to December 31, 2012
On or after January 1, 2013
Benefit formula 2% @ 55 2% @ 60 2% @ 62Benefit vesting schedule 5 years service 5 years service 5 years serviceBenefit payments monthly for life monthly for life monthly for lifeRetirement age 50 to 67 50 to 67 52 to 67Monthly benefits, as a % of eligible compensation
1.1 to 2.5% 1.092 to 2.418% 1.0 to 2.5%
Second Tier:
Hire date Prior to
January 1, 2013 On or after
January 1, 2013
Benefit formula 1.25% @ 65 1.25% @ 67Benefit vesting schedule 10 years service 10 years serviceBenefit payments monthly for life monthly for lifeRetirement age 50 to 67 52 to 67Monthly benefits, as a % of eligible compensation
0.5 to 1.25% 0.65 to 1.25%
Contributions Section 20814(c) of the California Public Employees Retirement Law (PERL) requires that the employer contribution rates for all public employers be determined on an annual basis by the actuary and shall be effective on the July 1 following notice of a change in the rate. The total plan contributions are determined through the CalPERS’ annual actuarial valuation process. The actuarially determined rate is the estimated amount necessary to finance the costs of benefits earned by employees during the year, with an additional amount to finance any unfunded accrued liability. IBank is required to contribute the difference between the actuarially determined rate and the contribution rate of employees.
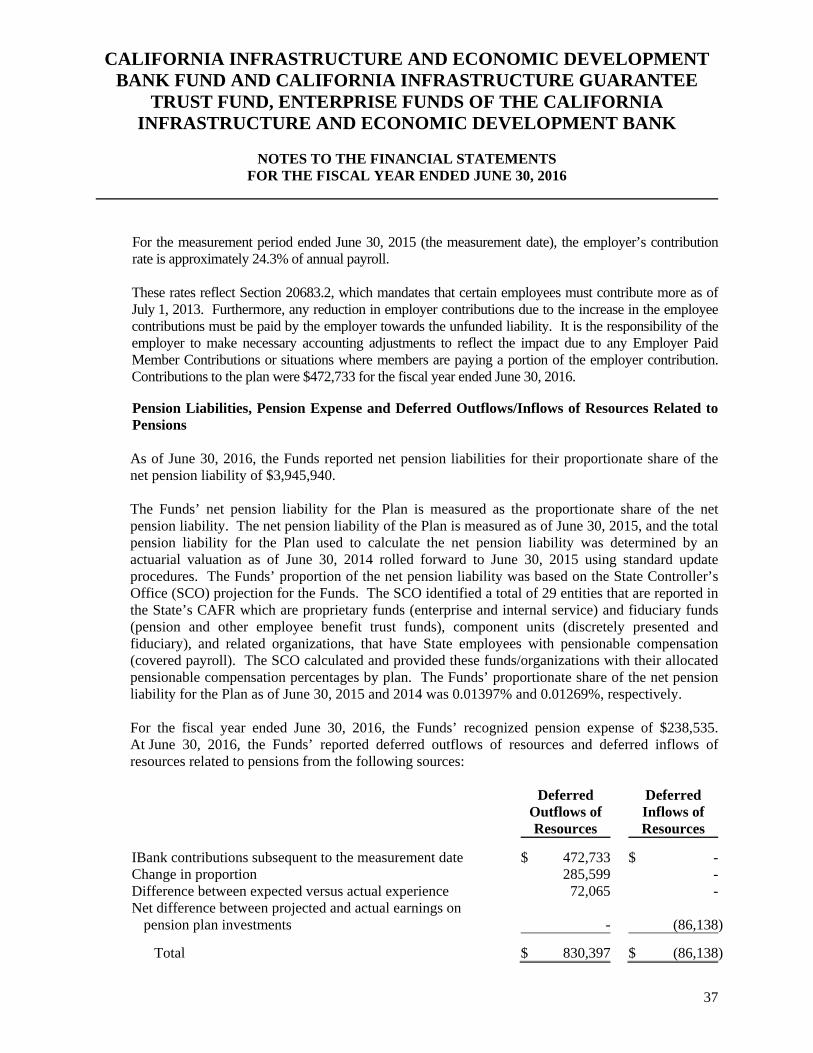
CALIFORNIA INFRASTRUCTURE AND ECONOMIC DEVELOPMENT BANK FUND AND CALIFORNIA INFRASTRUCTURE GUARANTEE
TRUST FUND, ENTERPRISE FUNDS OF THE CALIFORNIA INFRASTRUCTURE AND ECONOMIC DEVELOPMENT BANK
NOTES TO THE FINANCIAL STATEMENTS
FOR THE FISCAL YEAR ENDED JUNE 30, 2016
37
For the measurement period ended June 30, 2015 (the measurement date), the employer’s contribution rate is approximately 24.3% of annual payroll. These rates reflect Section 20683.2, which mandates that certain employees must contribute more as of July 1, 2013. Furthermore, any reduction in employer contributions due to the increase in the employee contributions must be paid by the employer towards the unfunded liability. It is the responsibility of the employer to make necessary accounting adjustments to reflect the impact due to any Employer Paid Member Contributions or situations where members are paying a portion of the employer contribution. Contributions to the plan were $472,733 for the fiscal year ended June 30, 2016.
Pension Liabilities, Pension Expense and Deferred Outflows/Inflows of Resources Related to Pensions As of June 30, 2016, the Funds reported net pension liabilities for their proportionate share of the net pension liability of $3,945,940. The Funds’ net pension liability for the Plan is measured as the proportionate share of the net pension liability. The net pension liability of the Plan is measured as of June 30, 2015, and the total pension liability for the Plan used to calculate the net pension liability was determined by an actuarial valuation as of June 30, 2014 rolled forward to June 30, 2015 using standard update procedures. The Funds’ proportion of the net pension liability was based on the State Controller’s Office (SCO) projection for the Funds. The SCO identified a total of 29 entities that are reported in the State’s CAFR which are proprietary funds (enterprise and internal service) and fiduciary funds (pension and other employee benefit trust funds), component units (discretely presented and fiduciary), and related organizations, that have State employees with pensionable compensation (covered payroll). The SCO calculated and provided these funds/organizations with their allocated pensionable compensation percentages by plan. The Funds’ proportionate share of the net pension liability for the Plan as of June 30, 2015 and 2014 was 0.01397% and 0.01269%, respectively. For the fiscal year ended June 30, 2016, the Funds’ recognized pension expense of $238,535. At June 30, 2016, the Funds’ reported deferred outflows of resources and deferred inflows of resources related to pensions from the following sources:
Deferred Outflows of Resources
Deferred Inflows of Resources
IBank contributions subsequent to the measurement date $ 472,733 $ -Change in proportion 285,599 -Difference between expected versus actual experience 72,065 -Net difference between projected and actual earnings on
pension plan investments
- (86,138)
Total $ 830,397 $ (86,138)
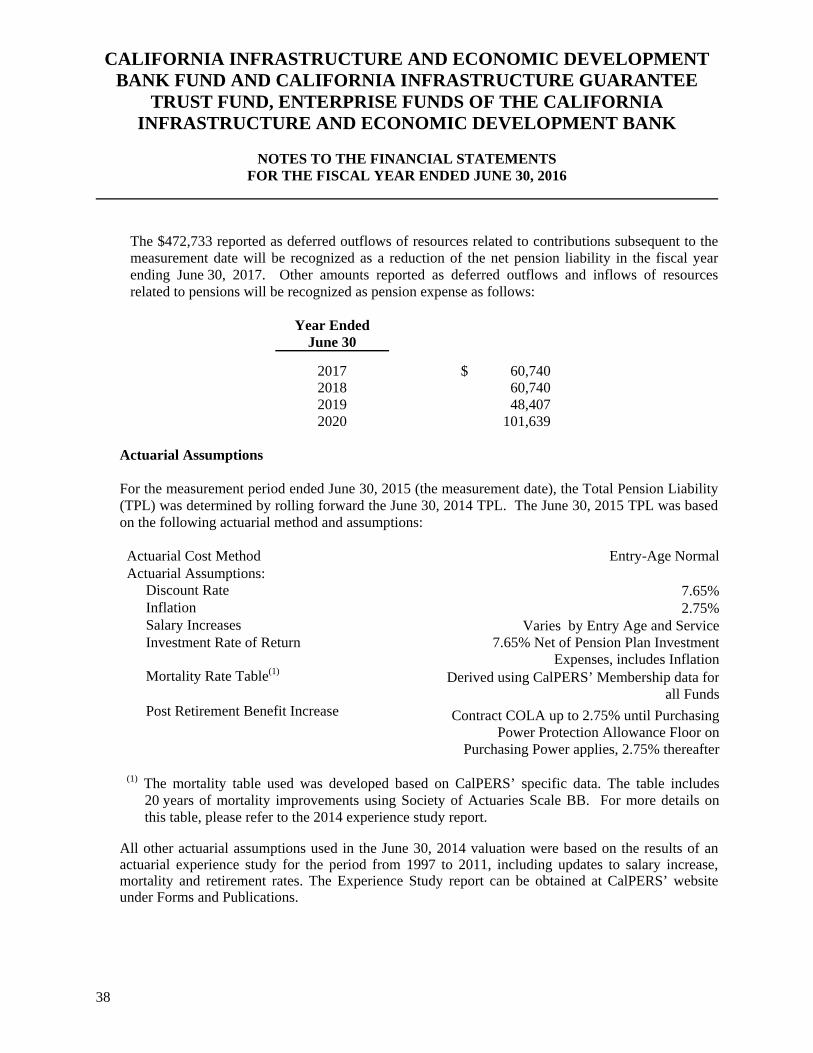
CALIFORNIA INFRASTRUCTURE AND ECONOMIC DEVELOPMENT BANK FUND AND CALIFORNIA INFRASTRUCTURE GUARANTEE
TRUST FUND, ENTERPRISE FUNDS OF THE CALIFORNIA INFRASTRUCTURE AND ECONOMIC DEVELOPMENT BANK
NOTES TO THE FINANCIAL STATEMENTS
FOR THE FISCAL YEAR ENDED JUNE 30, 2016
38
The $472,733 reported as deferred outflows of resources related to contributions subsequent to the measurement date will be recognized as a reduction of the net pension liability in the fiscal year ending June 30, 2017. Other amounts reported as deferred outflows and inflows of resources related to pensions will be recognized as pension expense as follows:
Year Ended June 30
2017 $ 60,740 2018 60,740 2019 48,407 2020 101,639
Actuarial Assumptions For the measurement period ended June 30, 2015 (the measurement date), the Total Pension Liability (TPL) was determined by rolling forward the June 30, 2014 TPL. The June 30, 2015 TPL was based on the following actuarial method and assumptions: Actuarial Cost Method Entry-Age Normal Actuarial Assumptions:
Discount Rate 7.65%Inflation 2.75%Salary Increases Varies by Entry Age and ServiceInvestment Rate of Return 7.65% Net of Pension Plan Investment
Expenses, includes InflationMortality Rate Table(1) Derived using CalPERS’ Membership data for
all FundsPost Retirement Benefit Increase Contract COLA up to 2.75% until Purchasing
Power Protection Allowance Floor on Purchasing Power applies, 2.75% thereafter
(1) The mortality table used was developed based on CalPERS’ specific data. The table includes
20 years of mortality improvements using Society of Actuaries Scale BB. For more details on this table, please refer to the 2014 experience study report.
All other actuarial assumptions used in the June 30, 2014 valuation were based on the results of an actuarial experience study for the period from 1997 to 2011, including updates to salary increase, mortality and retirement rates. The Experience Study report can be obtained at CalPERS’ website under Forms and Publications.
CALIFORNIA INFRASTRUCTURE AND ECONOMIC DEVELOPMENT BANK FUND AND CALIFORNIA INFRASTRUCTURE GUARANTEE
TRUST FUND, ENTERPRISE FUNDS OF THE CALIFORNIA INFRASTRUCTURE AND ECONOMIC DEVELOPMENT BANK
NOTES TO THE FINANCIAL STATEMENTS
FOR THE FISCAL YEAR ENDED JUNE 30, 2016
39
Change of Assumptions GASB 68 states that the long-term expected rate of return should be determined net of pension plan investment expenses, but without reduction for pension plan administrative expense. The discount rate changed from 7.50% (net of administrative expenses in 2014) to 7.65% as of the June 30, 2015 measurement date to correct the adjustment, which previously reduced the discount rate for administrative expenses.
Discount Rate The discount rate used to measure the TPL was 7.65% for the Plan. To determine whether the municipal bond rate should be used in the calculation of a discount rate for each plan, CalPERS stress tested plans that would most likely result in a discount rate that would be different from the actuarially assumed discount rate. Based on the testing, none of the tested plans run out of assets. Therefore, the current 7.65% discount rate is appropriate and the use of the municipal bond rate calculation is not necessary. The stress test results are presented in a detailed report called “GASB Crossover Testing Report” that can be obtained at CalPERS’ website under the GASB 68 section. The long-term expected rate of return on pension plan investments was determined using a building-block method in which best-estimate ranges of expected future real rates of return (expected returns, net of pension plan investment expense and inflation) are developed for each major asset class. In determining the long-term expected rate of return, CalPERS took into account both short-term and long-term market return expectations as well as the expected pension fund cash flows. Such cash flows were developed assuming that both members and employers will make their required contributions on time and as scheduled in all future years. Using historical returns of all the funds’ asset classes, expected compound returns were calculated over the short-term (first 10 years) and the long-term (11-60 years) using a building-block approach. Using the expected nominal returns for both short-term and long-term, the present value of benefits was calculated for each fund. The expected rate of return was set by calculating the single equivalent expected return that arrived at the same present value of benefits for cash flows as the one calculated using both short-term and long-term returns. The expected rate of return was then set equivalent to the single equivalent rate calculated above and rounded down to the nearest one quarter of one percent.
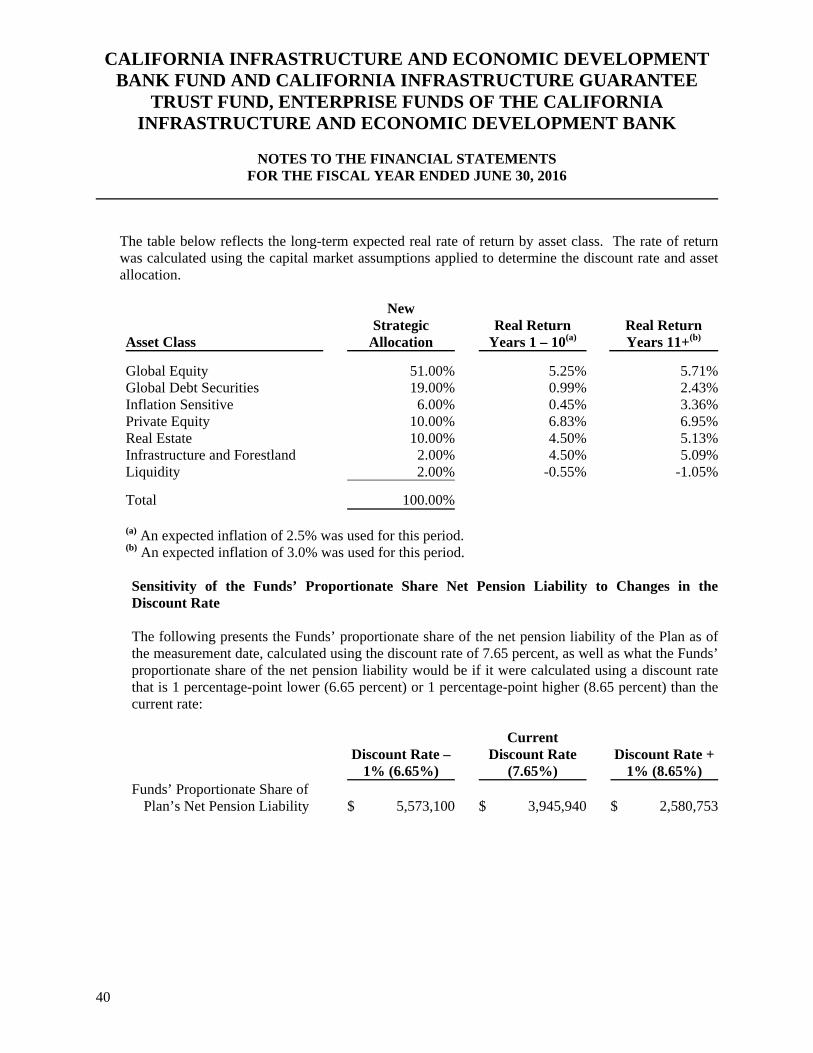
CALIFORNIA INFRASTRUCTURE AND ECONOMIC DEVELOPMENT BANK FUND AND CALIFORNIA INFRASTRUCTURE GUARANTEE
TRUST FUND, ENTERPRISE FUNDS OF THE CALIFORNIA INFRASTRUCTURE AND ECONOMIC DEVELOPMENT BANK
NOTES TO THE FINANCIAL STATEMENTS
FOR THE FISCAL YEAR ENDED JUNE 30, 2016
40
The table below reflects the long-term expected real rate of return by asset class. The rate of return was calculated using the capital market assumptions applied to determine the discount rate and asset allocation.
Asset Class
New
Strategic Allocation
Real Return Years 1 – 10(a)
Real Return Years 11+(b)
Global Equity 51.00% 5.25% 5.71%Global Debt Securities 19.00% 0.99% 2.43%Inflation Sensitive 6.00% 0.45% 3.36%Private Equity 10.00% 6.83% 6.95%Real Estate 10.00% 4.50% 5.13%Infrastructure and Forestland 2.00% 4.50% 5.09%Liquidity 2.00% -0.55% -1.05%
Total 100.00% (a) An expected inflation of 2.5% was used for this period. (b) An expected inflation of 3.0% was used for this period. Sensitivity of the Funds’ Proportionate Share Net Pension Liability to Changes in the Discount Rate The following presents the Funds’ proportionate share of the net pension liability of the Plan as of the measurement date, calculated using the discount rate of 7.65 percent, as well as what the Funds’ proportionate share of the net pension liability would be if it were calculated using a discount rate that is 1 percentage-point lower (6.65 percent) or 1 percentage-point higher (8.65 percent) than the current rate:
Discount Rate – 1% (6.65%)
Current Discount Rate
(7.65%) Discount Rate +
1% (8.65%) Funds’ Proportionate Share of
Plan’s Net Pension Liability $ 5,573,100 $ 3,945,940 $ 2,580,753
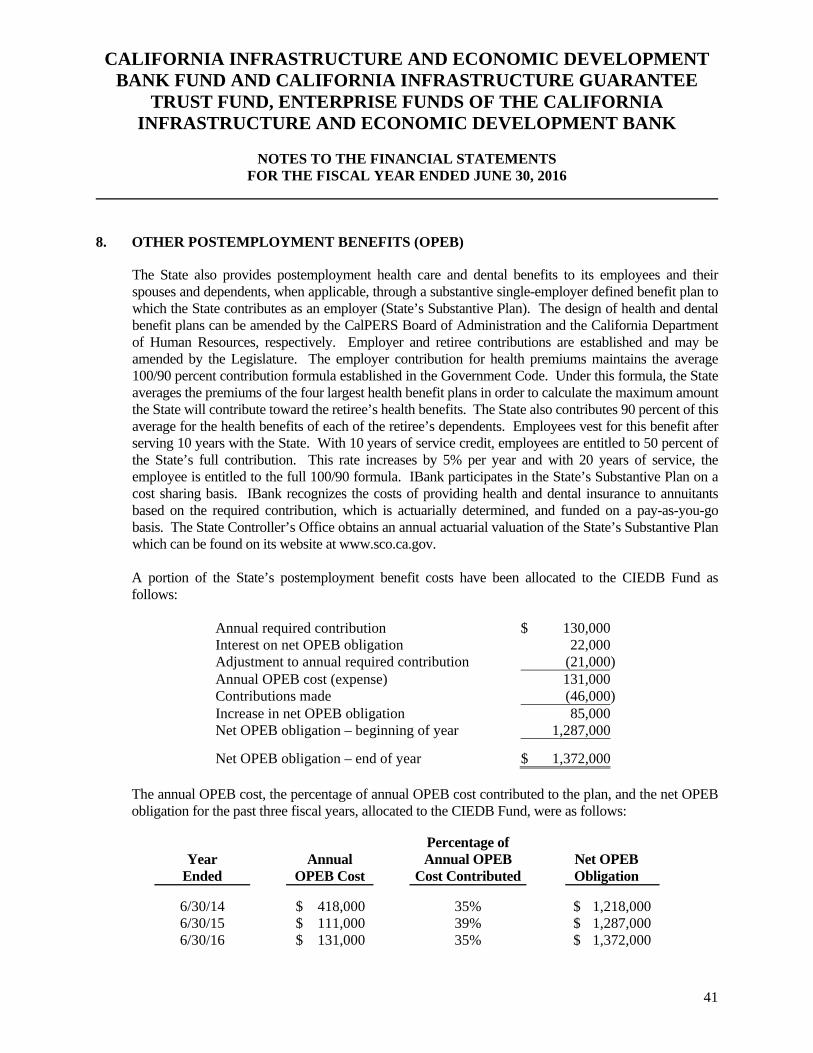
CALIFORNIA INFRASTRUCTURE AND ECONOMIC DEVELOPMENT BANK FUND AND CALIFORNIA INFRASTRUCTURE GUARANTEE
TRUST FUND, ENTERPRISE FUNDS OF THE CALIFORNIA INFRASTRUCTURE AND ECONOMIC DEVELOPMENT BANK
NOTES TO THE FINANCIAL STATEMENTS
FOR THE FISCAL YEAR ENDED JUNE 30, 2016
41
8. OTHER POSTEMPLOYMENT BENEFITS (OPEB)
The State also provides postemployment health care and dental benefits to its employees and their spouses and dependents, when applicable, through a substantive single-employer defined benefit plan to which the State contributes as an employer (State’s Substantive Plan). The design of health and dental benefit plans can be amended by the CalPERS Board of Administration and the California Department of Human Resources, respectively. Employer and retiree contributions are established and may be amended by the Legislature. The employer contribution for health premiums maintains the average 100/90 percent contribution formula established in the Government Code. Under this formula, the State averages the premiums of the four largest health benefit plans in order to calculate the maximum amount the State will contribute toward the retiree’s health benefits. The State also contributes 90 percent of this average for the health benefits of each of the retiree’s dependents. Employees vest for this benefit after serving 10 years with the State. With 10 years of service credit, employees are entitled to 50 percent of the State’s full contribution. This rate increases by 5% per year and with 20 years of service, the employee is entitled to the full 100/90 formula. IBank participates in the State’s Substantive Plan on a cost sharing basis. IBank recognizes the costs of providing health and dental insurance to annuitants based on the required contribution, which is actuarially determined, and funded on a pay-as-you-go basis. The State Controller’s Office obtains an annual actuarial valuation of the State’s Substantive Plan which can be found on its website at www.sco.ca.gov. A portion of the State’s postemployment benefit costs have been allocated to the CIEDB Fund as follows:
Annual required contribution $ 130,000Interest on net OPEB obligation 22,000Adjustment to annual required contribution (21,000) Annual OPEB cost (expense) 131,000 Contributions made (46,000) Increase in net OPEB obligation 85,000Net OPEB obligation – beginning of year 1,287,000
Net OPEB obligation – end of year $ 1,372,000
The annual OPEB cost, the percentage of annual OPEB cost contributed to the plan, and the net OPEB obligation for the past three fiscal years, allocated to the CIEDB Fund, were as follows:
Percentage of
Year Annual Annual OPEB Net OPEB Ended OPEB Cost Cost Contributed Obligation
6/30/14 $ 418,000 35% $ 1,218,000 6/30/15 $ 111,000 39% $ 1,287,000 6/30/16 $ 131,000 35% $ 1,372,000
CALIFORNIA INFRASTRUCTURE AND ECONOMIC DEVELOPMENT BANK FUND AND CALIFORNIA INFRASTRUCTURE GUARANTEE
TRUST FUND, ENTERPRISE FUNDS OF THE CALIFORNIA INFRASTRUCTURE AND ECONOMIC DEVELOPMENT BANK
NOTES TO THE FINANCIAL STATEMENTS
FOR THE FISCAL YEAR ENDED JUNE 30, 2016
42
Additional disclosure detail required by GASB Statement No. 45, regarding other postemployment benefits is presented in the State’s Comprehensive Annual Financial Report for the year ended June 30, 2015, which is the latest available on the State Controller’s Office website at www.sco.ca.gov.
9. COMMITMENTS
In June 2003, the Board approved a preliminary loan guarantee commitment for the Imperial Irrigation District (IID). The preliminary loan guarantee commitment established a conditional obligation to guarantee a future issuance of revenue bonds by IID (IID Bonds) for the purpose of financing a water supply project (IID Guarantee). During the 2003-2004 fiscal year, IBank transferred $20 million from the CIEDB Fund to the Guarantee Trust Fund in conjunction with the preliminary loan guarantee commitment for the IID. In October 2010, the State Legislature enacted Senate Bill 856 (SB 856) that directed IBank to deposit a specified amount required for the IID Guarantee in a reserve account within the Guarantee Trust Fund. SB 856 further directed that this IID Guarantee amount be held for the benefit of bondholders of potential IID Bonds. At June 30, 2016, the required IID Guarantee amount was on deposit in a reserve account within the Guarantee Trust Fund, and no IID Guarantee or IID Bonds have been approved or issued.
As of June 30, 2016 the Board had conditionally approved four Loans totaling approximately $59.5 million that did not yet have fully executed loan documentation. When IBank and the borrower execute the required loan documentation, IBank will be obligated to fund the Loan.
10. CONTINGENCIES
One borrower with a Loan pledged to the common pool of loans supporting the 2014 and 2015 ISRF Bonds declared a fiscal emergency on July 18, 2012, and filed a Chapter 9 bankruptcy petition on August 1, 2012. On August 28, 2013, the federal bankruptcy court judge ruled that the borrower was eligible for Chapter 9 bankruptcy protection. On May 29, 2015 the borrower filed a plan of adjustment with the bankruptcy court reflecting an intent to continue routine debt service payments to IBank. IBank filed a proof claim in bankruptcy court on June 17, 2015. As of June 30, 2016, the plan of adjustment was still under consideration before the bankruptcy court. The borrower made all scheduled Loan payments during the fiscal year and the subsequent payments due on August 1, 2016; the borrower’s next scheduled Loan payments are due February 1, 2017.
REQUIRED SUPPLEMENTARY INFORMATION
This page has been intentionally left blank.
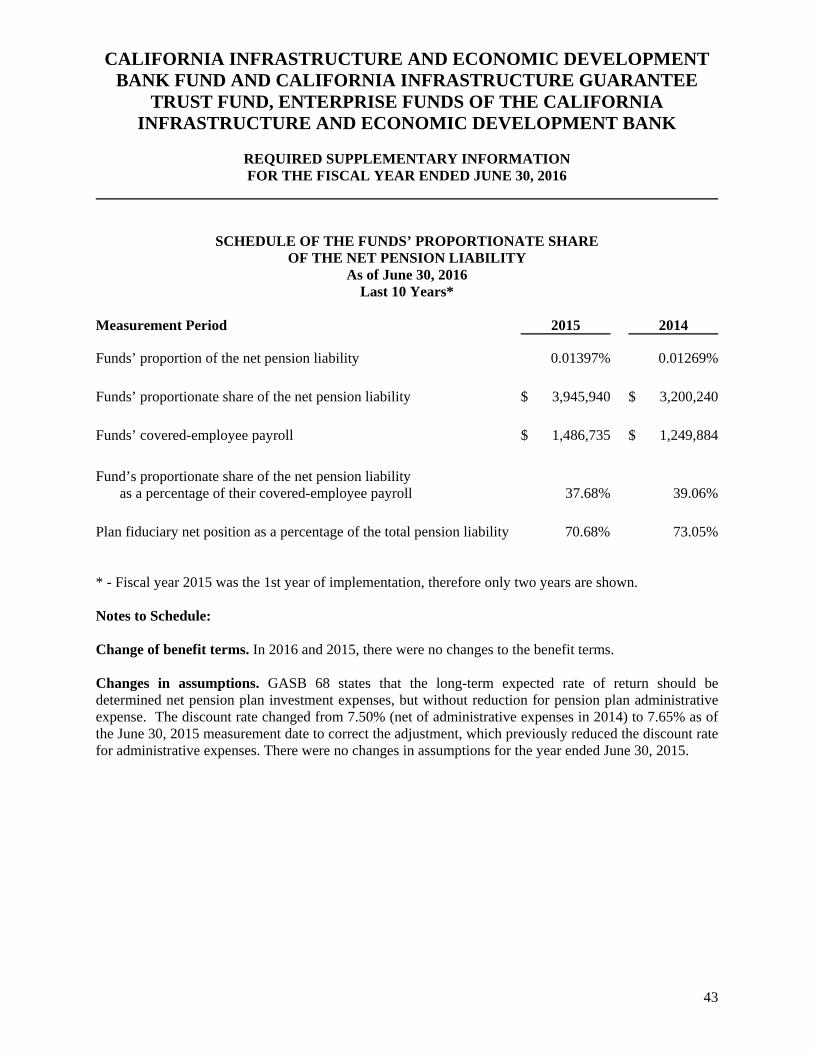
CALIFORNIA INFRASTRUCTURE AND ECONOMIC DEVELOPMENT BANK FUND AND CALIFORNIA INFRASTRUCTURE GUARANTEE
TRUST FUND, ENTERPRISE FUNDS OF THE CALIFORNIA INFRASTRUCTURE AND ECONOMIC DEVELOPMENT BANK
REQUIRED SUPPLEMENTARY INFORMATION FOR THE FISCAL YEAR ENDED JUNE 30, 2016
43
SCHEDULE OF THE FUNDS’ PROPORTIONATE SHARE OF THE NET PENSION LIABILITY
As of June 30, 2016 Last 10 Years*
Measurement Period 2015 2014
Funds’ proportion of the net pension liability 0.01397% 0.01269% Funds’ proportionate share of the net pension liability $ 3,945,940 $ 3,200,240 Funds’ covered-employee payroll $ 1,486,735 $ 1,249,884
Fund’s proportionate share of the net pension liability as a percentage of their covered-employee payroll 37.68% 39.06%
Plan fiduciary net position as a percentage of the total pension liability 70.68% 73.05% * - Fiscal year 2015 was the 1st year of implementation, therefore only two years are shown. Notes to Schedule: Change of benefit terms. In 2016 and 2015, there were no changes to the benefit terms. Changes in assumptions. GASB 68 states that the long-term expected rate of return should be determined net pension plan investment expenses, but without reduction for pension plan administrative expense. The discount rate changed from 7.50% (net of administrative expenses in 2014) to 7.65% as of the June 30, 2015 measurement date to correct the adjustment, which previously reduced the discount rate for administrative expenses. There were no changes in assumptions for the year ended June 30, 2015.
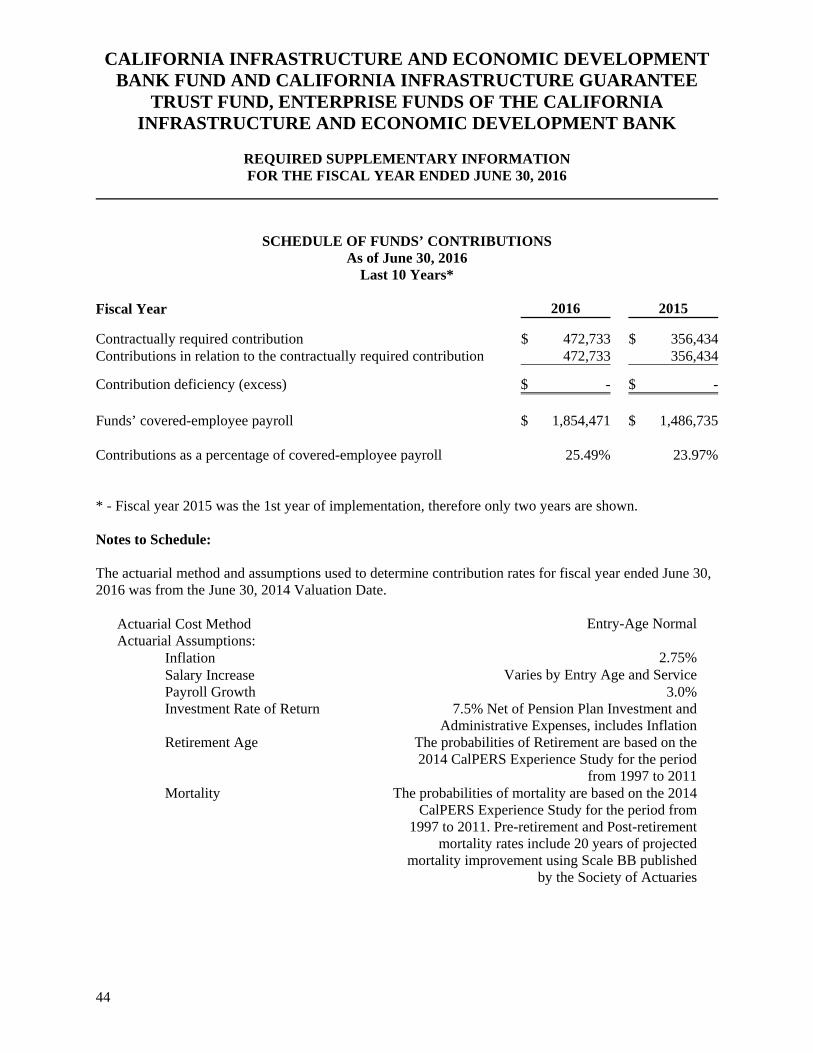
CALIFORNIA INFRASTRUCTURE AND ECONOMIC DEVELOPMENT BANK FUND AND CALIFORNIA INFRASTRUCTURE GUARANTEE
TRUST FUND, ENTERPRISE FUNDS OF THE CALIFORNIA INFRASTRUCTURE AND ECONOMIC DEVELOPMENT BANK
REQUIRED SUPPLEMENTARY INFORMATION FOR THE FISCAL YEAR ENDED JUNE 30, 2016
44
SCHEDULE OF FUNDS’ CONTRIBUTIONS As of June 30, 2016
Last 10 Years* Fiscal Year 2016 2015
Contractually required contribution $ 472,733 $ 356,434Contributions in relation to the contractually required contribution 472,733 356,434
Contribution deficiency (excess) $ - $ - Funds’ covered-employee payroll $ 1,854,471
$ 1,486,735
Contributions as a percentage of covered-employee payroll 25.49% 23.97%
* - Fiscal year 2015 was the 1st year of implementation, therefore only two years are shown. Notes to Schedule: The actuarial method and assumptions used to determine contribution rates for fiscal year ended June 30, 2016 was from the June 30, 2014 Valuation Date.
Actuarial Cost Method Entry-Age NormalActuarial Assumptions:
Inflation 2.75%Salary Increase Varies by Entry Age and ServicePayroll Growth 3.0%Investment Rate of Return 7.5% Net of Pension Plan Investment and
Administrative Expenses, includes InflationRetirement Age The probabilities of Retirement are based on the
2014 CalPERS Experience Study for the periodfrom 1997 to 2011
Mortality The probabilities of mortality are based on the 2014CalPERS Experience Study for the period from
1997 to 2011. Pre-retirement and Post-retirementmortality rates include 20 years of projected
mortality improvement using Scale BB publishedby the Society of Actuaries

STATISTICAL SECTION

This page has been intentionally left blank.
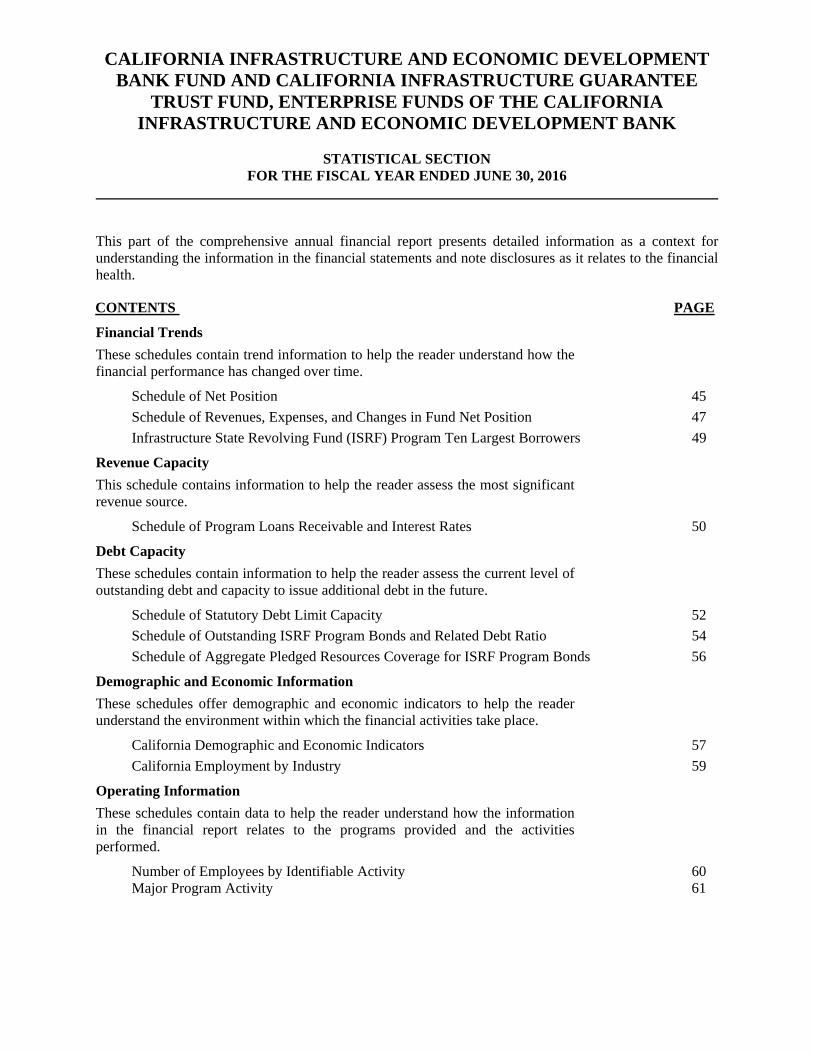
CALIFORNIA INFRASTRUCTURE AND ECONOMIC DEVELOPMENT BANK FUND AND CALIFORNIA INFRASTRUCTURE GUARANTEE
TRUST FUND, ENTERPRISE FUNDS OF THE CALIFORNIA INFRASTRUCTURE AND ECONOMIC DEVELOPMENT BANK
STATISTICAL SECTION
FOR THE FISCAL YEAR ENDED JUNE 30, 2016
This part of the comprehensive annual financial report presents detailed information as a context for understanding the information in the financial statements and note disclosures as it relates to the financial health.
CONTENTS PAGE
Financial Trends
These schedules contain trend information to help the reader understand how the financial performance has changed over time.
Schedule of Net Position 45
Schedule of Revenues, Expenses, and Changes in Fund Net Position 47
Infrastructure State Revolving Fund (ISRF) Program Ten Largest Borrowers 49
Revenue Capacity
This schedule contains information to help the reader assess the most significant revenue source.
Schedule of Program Loans Receivable and Interest Rates 50
Debt Capacity
These schedules contain information to help the reader assess the current level of outstanding debt and capacity to issue additional debt in the future.
Schedule of Statutory Debt Limit Capacity 52
Schedule of Outstanding ISRF Program Bonds and Related Debt Ratio 54
Schedule of Aggregate Pledged Resources Coverage for ISRF Program Bonds 56
Demographic and Economic Information
These schedules offer demographic and economic indicators to help the reader understand the environment within which the financial activities take place.
California Demographic and Economic Indicators 57
California Employment by Industry 59
Operating Information
These schedules contain data to help the reader understand how the information in the financial report relates to the programs provided and the activities performed.
Number of Employees by Identifiable Activity 60 Major Program Activity 61
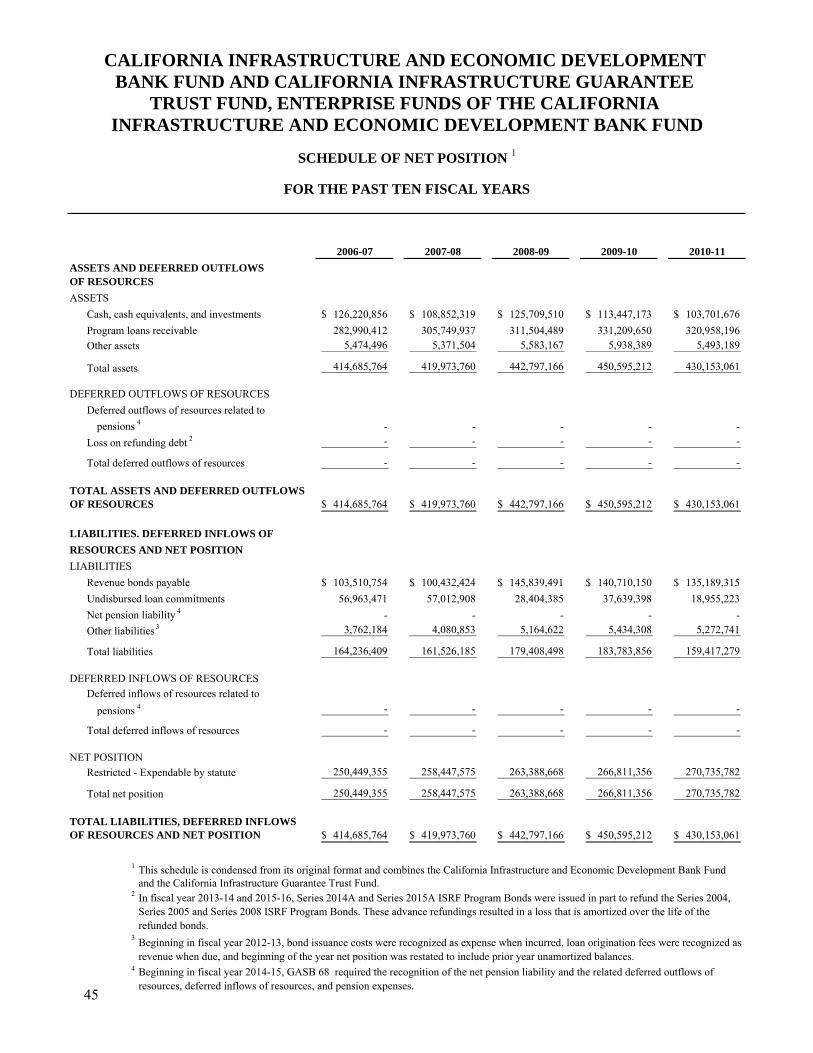
2006-07 2007-08 2008-09 2009-10 2010-11
ASSETS AND DEFERRED OUTFLOWSOF RESOURCES
ASSETS
Cash, cash equivalents, and investments 126,220,856$ 108,852,319$ 125,709,510$ 113,447,173$ 103,701,676$
Program loans receivable 282,990,412 305,749,937 311,504,489 331,209,650 320,958,196
Other assets 5,474,496 5,371,504 5,583,167 5,938,389 5,493,189
Total assets 414,685,764 419,973,760 442,797,166 450,595,212 430,153,061
DEFERRED OUTFLOWS OF RESOURCES
Deferred outflows of resources related to
pensions 4 - - - - -
Loss on refunding debt 2 - - - - -
Total deferred outflows of resources - - - - -
TOTAL ASSETS AND DEFERRED OUTFLOWSOF RESOURCES 414,685,764$ 419,973,760$ 442,797,166$ 450,595,212$ 430,153,061$
LIABILITIES. DEFERRED INFLOWS OF
RESOURCES AND NET POSITION
LIABILITIES
Revenue bonds payable 103,510,754$ 100,432,424$ 145,839,491$ 140,710,150$ 135,189,315$
Undisbursed loan commitments 56,963,471 57,012,908 28,404,385 37,639,398 18,955,223
Net pension liability 4 - - - - - 3,762,184 4,080,853 5,164,622 5,434,308 5,272,741
Total liabilities 164,236,409 161,526,185 179,408,498 183,783,856 159,417,279
DEFERRED INFLOWS OF RESOURCES
Deferred inflows of resources related to
pensions 4 - - - - -
Total deferred inflows of resources - - - - -
NET POSITION
Restricted - Expendable by statute 250,449,355 258,447,575 263,388,668 266,811,356 270,735,782
Total net position 250,449,355 258,447,575 263,388,668 266,811,356 270,735,782
TOTAL LIABILITIES, DEFERRED INFLOWS OF RESOURCES AND NET POSITION 414,685,764$ 419,973,760$ 442,797,166$ 450,595,212$ 430,153,061$
1
2
3
4 Beginning in fiscal year 2014-15, GASB 68 required the recognition of the net pension liability and the related deferred outflows of resources, deferred inflows of resources, and pension expenses.
Beginning in fiscal year 2012-13, bond issuance costs were recognized as expense when incurred, loan origination fees were recognized as revenue when due, and beginning of the year net position was restated to include prior year unamortized balances.
In fiscal year 2013-14 and 2015-16, Series 2014A and Series 2015A ISRF Program Bonds were issued in part to refund the Series 2004,
This schedule is condensed from its original format and combines the California Infrastructure and Economic Development Bank Fundand the California Infrastructure Guarantee Trust Fund.
Series 2005 and Series 2008 ISRF Program Bonds. These advance refundings resulted in a loss that is amortized over the life of the refunded bonds.
BANK FUND AND CALIFORNIA INFRASTRUCTURE GUARANTEE TRUST FUND, ENTERPRISE FUNDS OF THE CALIFORNIA
CALIFORNIA INFRASTRUCTURE AND ECONOMIC DEVELOPMENT
INFRASTRUCTURE AND ECONOMIC DEVELOPMENT BANK FUND
SCHEDULE OF NET POSITION 1
FOR THE PAST TEN FISCAL YEARS
Other liabilities 3
45
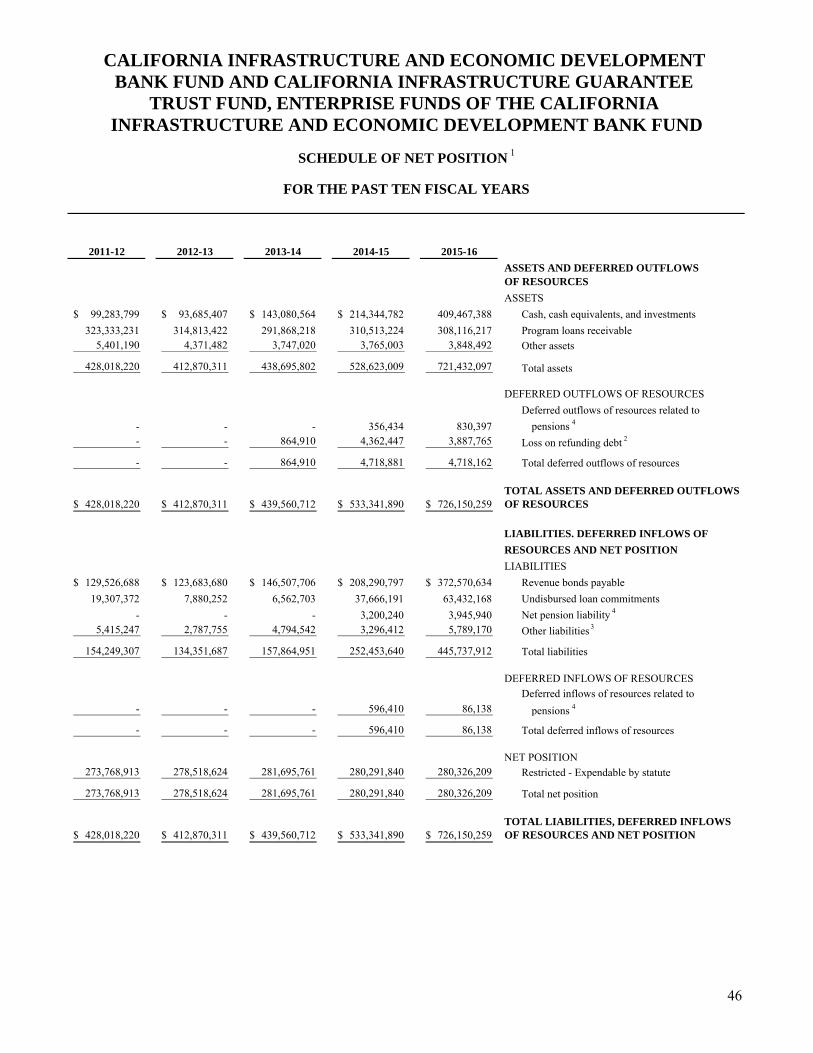
2011-12 2012-13 2013-14 2014-15 2015-16
ASSETS AND DEFERRED OUTFLOWSOF RESOURCES
ASSETS
99,283,799$ 93,685,407$ 143,080,564$ 214,344,782$ 409,467,388 Cash, cash equivalents, and investments
323,333,231 314,813,422 291,868,218 310,513,224 308,116,217 Program loans receivable5,401,190 4,371,482 3,747,020 3,765,003 3,848,492 Other assets
428,018,220 412,870,311 438,695,802 528,623,009 721,432,097 Total assets
DEFERRED OUTFLOWS OF RESOURCES
Deferred outflows of resources related to
- - - 356,434 830,397 pensions 4
- - 864,910 4,362,447 3,887,765 Loss on refunding debt 2
- - 864,910 4,718,881 4,718,162 Total deferred outflows of resources
TOTAL ASSETS AND DEFERRED OUTFLOWS428,018,220$ 412,870,311$ 439,560,712$ 533,341,890$ 726,150,259$ OF RESOURCES
LIABILITIES. DEFERRED INFLOWS OF
RESOURCES AND NET POSITION
LIABILITIES
129,526,688$ 123,683,680$ 146,507,706$ 208,290,797$ 372,570,634$ Revenue bonds payable
19,307,372 7,880,252 6,562,703 37,666,191 63,432,168 Undisbursed loan commitments
- - - 3,200,240 3,945,940 Net pension liability 4
5,415,247 2,787,755 4,794,542 3,296,412 5,789,170
154,249,307 134,351,687 157,864,951 252,453,640 445,737,912 Total liabilities
DEFERRED INFLOWS OF RESOURCES
Deferred inflows of resources related to
- - - 596,410 86,138 pensions 4
- - - 596,410 86,138 Total deferred inflows of resources
NET POSITION273,768,913 278,518,624 281,695,761 280,291,840 280,326,209 Restricted - Expendable by statute
273,768,913 278,518,624 281,695,761 280,291,840 280,326,209 Total net position
TOTAL LIABILITIES, DEFERRED INFLOWS 428,018,220$ 412,870,311$ 439,560,712$ 533,341,890$ 726,150,259$ OF RESOURCES AND NET POSITION
CALIFORNIA INFRASTRUCTURE AND ECONOMIC DEVELOPMENT BANK FUND AND CALIFORNIA INFRASTRUCTURE GUARANTEE
TRUST FUND, ENTERPRISE FUNDS OF THE CALIFORNIA INFRASTRUCTURE AND ECONOMIC DEVELOPMENT BANK FUND
Other liabilities 3
SCHEDULE OF NET POSITION 1
FOR THE PAST TEN FISCAL YEARS
46
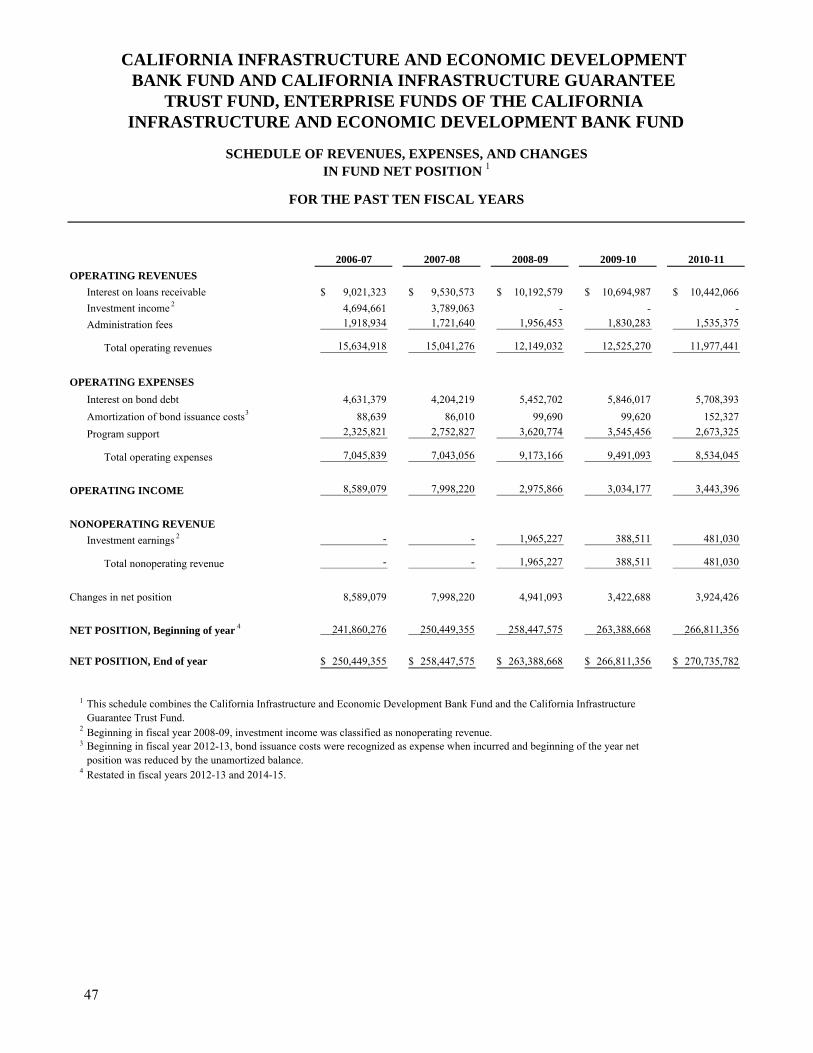
2006-07 2007-08 2008-09 2009-10 2010-11
OPERATING REVENUES
Interest on loans receivable 9,021,323$ 9,530,573$ 10,192,579$ 10,694,987$ 10,442,066$
Investment income 2 4,694,661 3,789,063 - - -
Administration fees 1,918,934 1,721,640 1,956,453 1,830,283 1,535,375
Total operating revenues 15,634,918 15,041,276 12,149,032 12,525,270 11,977,441
OPERATING EXPENSES
Interest on bond debt 4,631,379 4,204,219 5,452,702 5,846,017 5,708,393
88,639 86,010 99,690 99,620 152,327
Program support 2,325,821 2,752,827 3,620,774 3,545,456 2,673,325
Total operating expenses 7,045,839 7,043,056 9,173,166 9,491,093 8,534,045
OPERATING INCOME 8,589,079 7,998,220 2,975,866 3,034,177 3,443,396
NONOPERATING REVENUE
Investment earnings 2 - - 1,965,227 388,511 481,030
Total nonoperating revenue - - 1,965,227 388,511 481,030
Changes in net position 8,589,079 7,998,220 4,941,093 3,422,688 3,924,426
NET POSITION, Beginning of year 4 241,860,276 250,449,355 258,447,575 263,388,668 266,811,356
NET POSITION, End of year 250,449,355$ 258,447,575$ 263,388,668$ 266,811,356$ 270,735,782$
1
2 Beginning in fiscal year 2008-09, investment income was classified as nonoperating revenue.3
4 Restated in fiscal years 2012-13 and 2014-15.
This schedule combines the California Infrastructure and Economic Development Bank Fund and the California Infrastructure Guarantee Trust Fund.
Beginning in fiscal year 2012-13, bond issuance costs were recognized as expense when incurred and beginning of the year net position was reduced by the unamortized balance.
IN FUND NET POSITION 1
FOR THE PAST TEN FISCAL YEARS
CALIFORNIA INFRASTRUCTURE AND ECONOMIC DEVELOPMENT BANK FUND AND CALIFORNIA INFRASTRUCTURE GUARANTEE
INFRASTRUCTURE AND ECONOMIC DEVELOPMENT BANK FUND
SCHEDULE OF REVENUES, EXPENSES, AND CHANGES
TRUST FUND, ENTERPRISE FUNDS OF THE CALIFORNIA
Amortization of bond issuance costs 3
47
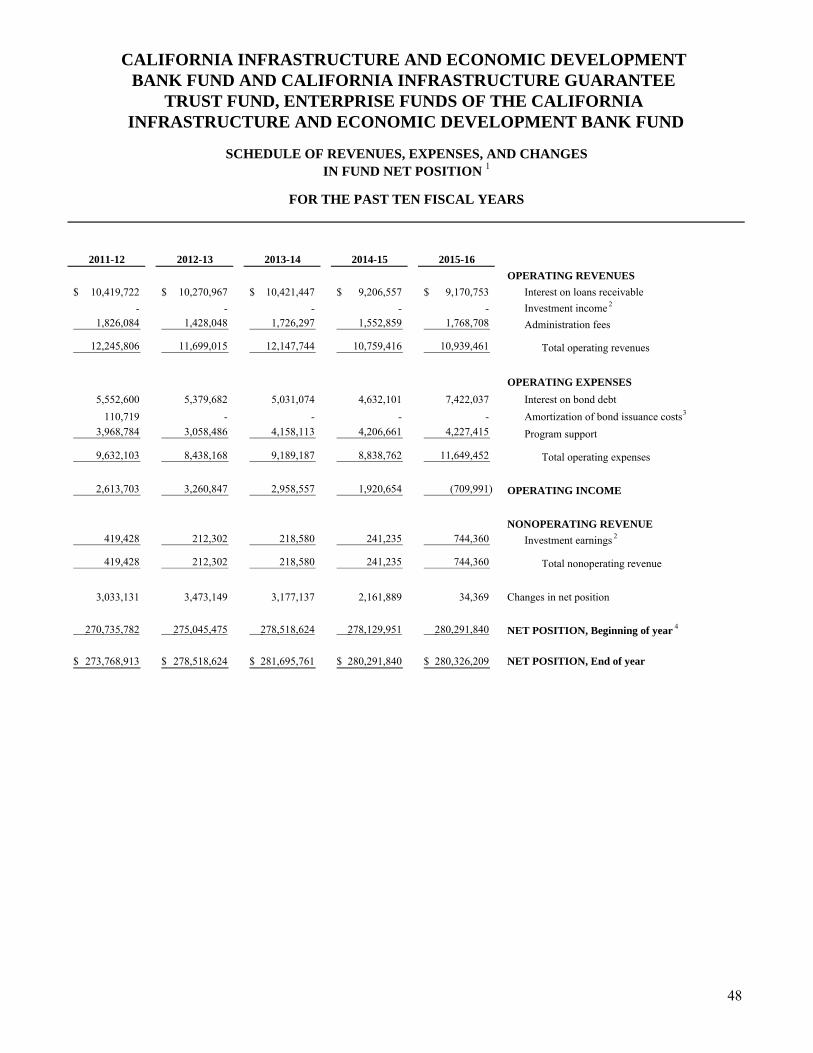
2011-12 2012-13 2013-14 2014-15 2015-16
OPERATING REVENUES
10,419,722$ 10,270,967$ 10,421,447$ 9,206,557$ 9,170,753$ Interest on loans receivable
- - - - - Investment income 2
1,826,084 1,428,048 1,726,297 1,552,859 1,768,708 Administration fees
12,245,806 11,699,015 12,147,744 10,759,416 10,939,461 Total operating revenues
OPERATING EXPENSES
5,552,600 5,379,682 5,031,074 4,632,101 7,422,037
110,719 - - - - 3,968,784 3,058,486 4,158,113 4,206,661 4,227,415
9,632,103 8,438,168 9,189,187 8,838,762 11,649,452 Total operating expenses
2,613,703 3,260,847 2,958,557 1,920,654 (709,991) OPERATING INCOME
NONOPERATING REVENUE419,428 212,302 218,580 241,235 744,360 Investment earnings 2
419,428 212,302 218,580 241,235 744,360
3,033,131 3,473,149 3,177,137 2,161,889 34,369 Changes in net position
270,735,782 275,045,475 278,518,624 278,129,951 280,291,840
273,768,913$ 278,518,624$ 281,695,761$ 280,291,840$ 280,326,209$ NET POSITION, End of year
Interest on bond debt
Program support
Total nonoperating revenue
NET POSITION, Beginning of year 4
Amortization of bond issuance costs 3
IN FUND NET POSITION 1
FOR THE PAST TEN FISCAL YEARS
CALIFORNIA INFRASTRUCTURE AND ECONOMIC DEVELOPMENT BANK FUND AND CALIFORNIA INFRASTRUCTURE GUARANTEE
TRUST FUND, ENTERPRISE FUNDS OF THE CALIFORNIA INFRASTRUCTURE AND ECONOMIC DEVELOPMENT BANK FUND
SCHEDULE OF REVENUES, EXPENSES, AND CHANGES
48
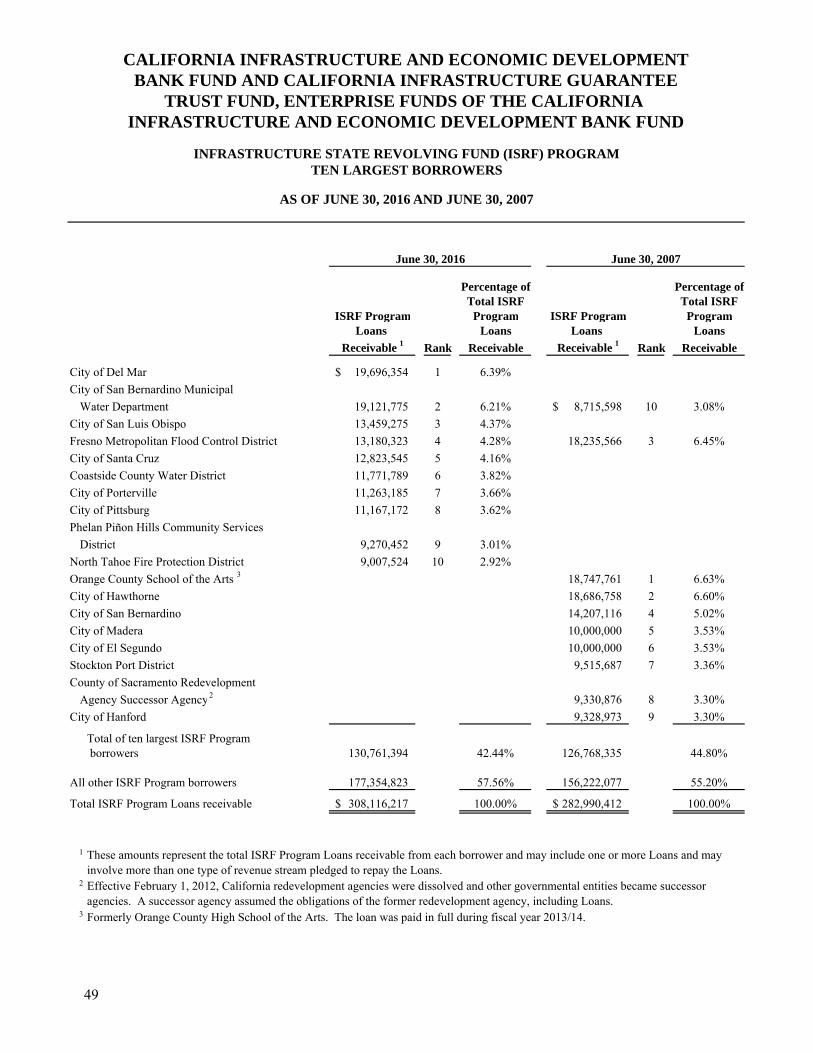
Percentage of Percentage ofTotal ISRF Total ISRF
ISRF Program Program ISRF Program ProgramLoans Loans Loans Loans
Receivable 1 Rank Receivable Receivable 1 Rank Receivable
City of Del Mar 19,696,354$ 1 6.39%
City of San Bernardino Municipal
Water Department 19,121,775 2 6.21% 8,715,598$ 10 3.08%
City of San Luis Obispo 13,459,275 3 4.37%
Fresno Metropolitan Flood Control District 13,180,323 4 4.28% 18,235,566 3 6.45%
City of Santa Cruz 12,823,545 5 4.16%
Coastside County Water District 11,771,789 6 3.82%
City of Porterville 11,263,185 7 3.66%
City of Pittsburg 11,167,172 8 3.62%
Phelan Piñon Hills Community Services
District 9,270,452 9 3.01%
North Tahoe Fire Protection District 9,007,524 10 2.92%
Orange County School of the Arts 3 18,747,761 1 6.63%
City of Hawthorne 18,686,758 2 6.60%
City of San Bernardino 14,207,116 4 5.02%
City of Madera 10,000,000 5 3.53%
City of El Segundo 10,000,000 6 3.53%
Stockton Port District 9,515,687 7 3.36%
County of Sacramento Redevelopment
Agency Successor Agency 2 9,330,876 8 3.30%
City of Hanford 9,328,973 9 3.30%
Total of ten largest ISRF Program borrowers 130,761,394 42.44% 126,768,335 44.80%
All other ISRF Program borrowers 177,354,823 57.56% 156,222,077 55.20%
Total ISRF Program Loans receivable 308,116,217$ 100.00% 282,990,412$ 100.00%
1
2
3
These amounts represent the total ISRF Program Loans receivable from each borrower and may include one or more Loans and may involve more than one type of revenue stream pledged to repay the Loans.
June 30, 2007June 30, 2016
Formerly Orange County High School of the Arts. The loan was paid in full during fiscal year 2013/14.
Effective February 1, 2012, California redevelopment agencies were dissolved and other governmental entities became successor agencies. A successor agency assumed the obligations of the former redevelopment agency, including Loans.
AS OF JUNE 30, 2016 AND JUNE 30, 2007
CALIFORNIA INFRASTRUCTURE AND ECONOMIC DEVELOPMENT BANK FUND AND CALIFORNIA INFRASTRUCTURE GUARANTEE
INFRASTRUCTURE AND ECONOMIC DEVELOPMENT BANK FUND
INFRASTRUCTURE STATE REVOLVING FUND (ISRF) PROGRAMTEN LARGEST BORROWERS
TRUST FUND, ENTERPRISE FUNDS OF THE CALIFORNIA
49

This page has been intentionally left blank.
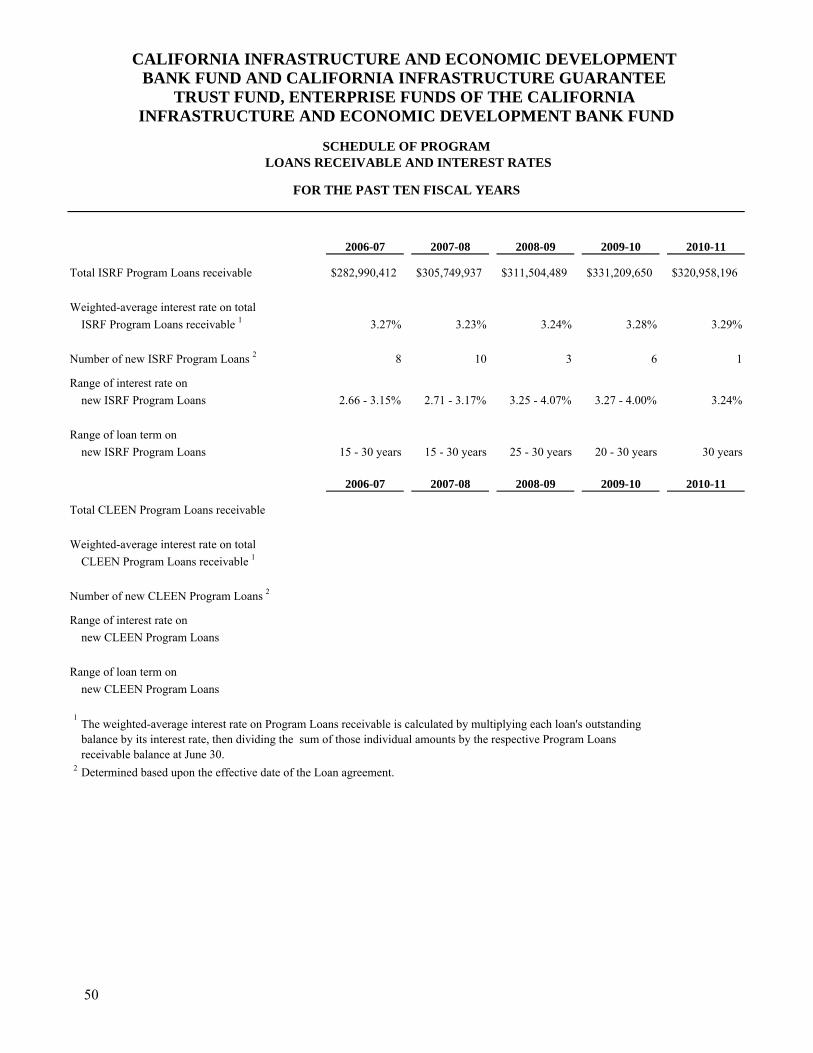
2006-07 2007-08 2008-09 2009-10 2010-11
Total ISRF Program Loans receivable $282,990,412 $305,749,937 $311,504,489 $331,209,650 $320,958,196
Weighted-average interest rate on total
ISRF Program Loans receivable 1 3.27% 3.23% 3.24% 3.28% 3.29%
Number of new ISRF Program Loans 2 8 10 3 6 1
Range of interest rate on
new ISRF Program Loans 2.66 - 3.15% 2.71 - 3.17% 3.25 - 4.07% 3.27 - 4.00% 3.24%
Range of loan term on
new ISRF Program Loans 15 - 30 years 15 - 30 years 25 - 30 years 20 - 30 years 30 years
2006-07 2007-08 2008-09 2009-10 2010-11
Total CLEEN Program Loans receivable
Weighted-average interest rate on total
CLEEN Program Loans receivable 1
Number of new CLEEN Program Loans 2
Range of interest rate on
new CLEEN Program Loans
Range of loan term on
new CLEEN Program Loans
1
2
LOANS RECEIVABLE AND INTEREST RATES
TRUST FUND, ENTERPRISE FUNDS OF THE CALIFORNIA
The weighted-average interest rate on Program Loans receivable is calculated by multiplying each loan's outstanding balance by its interest rate, then dividing the sum of those individual amounts by the respective Program Loans receivable balance at June 30.
Determined based upon the effective date of the Loan agreement.
FOR THE PAST TEN FISCAL YEARS
CALIFORNIA INFRASTRUCTURE AND ECONOMIC DEVELOPMENT BANK FUND AND CALIFORNIA INFRASTRUCTURE GUARANTEE
INFRASTRUCTURE AND ECONOMIC DEVELOPMENT BANK FUND
SCHEDULE OF PROGRAM
50
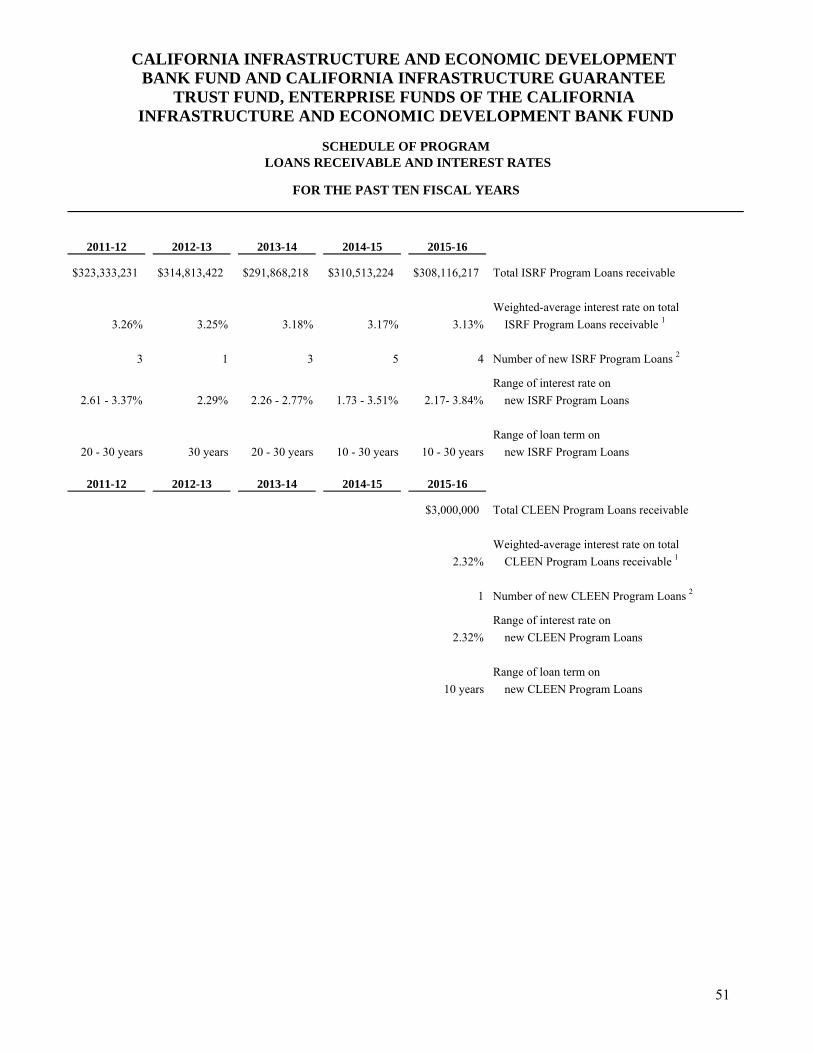
2011-12 2012-13 2013-14 2014-15 2015-16
$323,333,231 $314,813,422 $291,868,218 $310,513,224 $308,116,217 Total ISRF Program Loans receivable
Weighted-average interest rate on total
3.26% 3.25% 3.18% 3.17% 3.13% ISRF Program Loans receivable 1
3 1 3 5 4 Number of new ISRF Program Loans 2
Range of interest rate on
2.61 - 3.37% 2.29% 2.26 - 2.77% 1.73 - 3.51% 2.17- 3.84% new ISRF Program Loans
Range of loan term on
20 - 30 years 30 years 20 - 30 years 10 - 30 years 10 - 30 years new ISRF Program Loans
2011-12 2012-13 2013-14 2014-15 2015-16
$3,000,000 Total CLEEN Program Loans receivable
Weighted-average interest rate on total
2.32% CLEEN Program Loans receivable 1
1 Number of new CLEEN Program Loans 2
Range of interest rate on
2.32% new CLEEN Program Loans
Range of loan term on
10 years new CLEEN Program Loans
LOANS RECEIVABLE AND INTEREST RATES
FOR THE PAST TEN FISCAL YEARS
CALIFORNIA INFRASTRUCTURE AND ECONOMIC DEVELOPMENT BANK FUND AND CALIFORNIA INFRASTRUCTURE GUARANTEE
TRUST FUND, ENTERPRISE FUNDS OF THE CALIFORNIA INFRASTRUCTURE AND ECONOMIC DEVELOPMENT BANK FUND
SCHEDULE OF PROGRAM
51
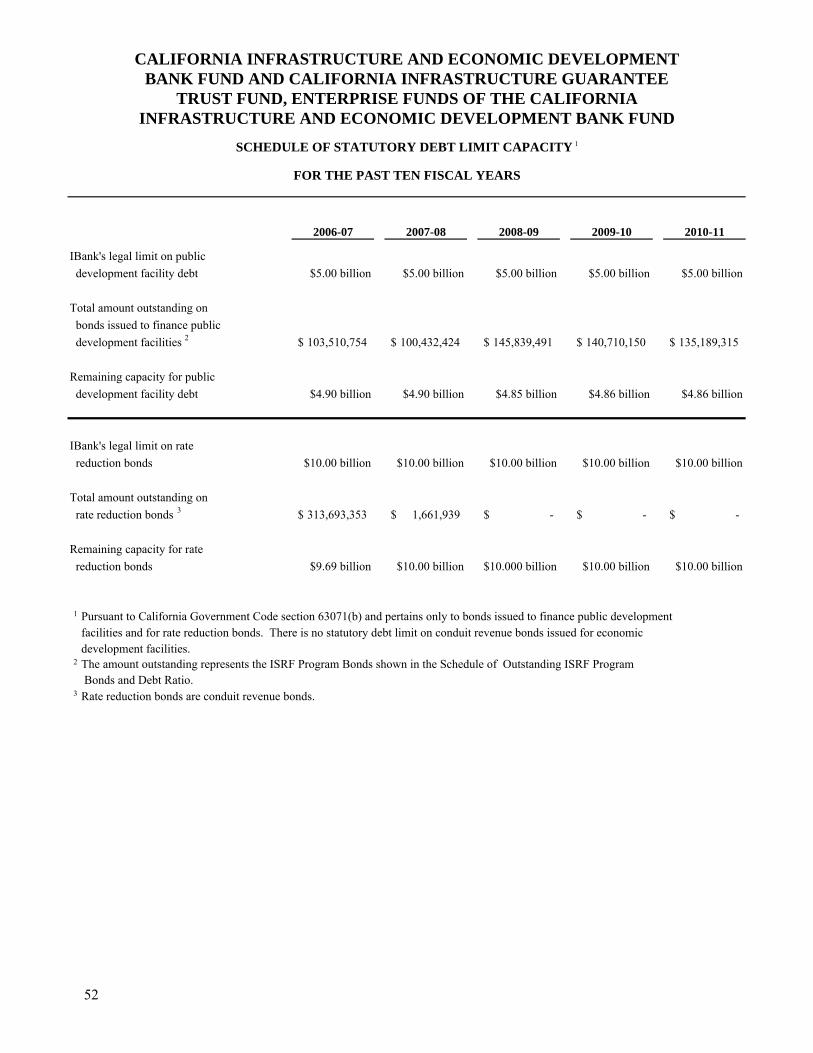
2006-07 2007-08 2008-09 2009-10 2010-11
IBank's legal limit on public
development facility debt $5.00 billion $5.00 billion $5.00 billion $5.00 billion $5.00 billion
Total amount outstanding on
bonds issued to finance public
development facilities 2 103,510,754$ 100,432,424$ 145,839,491$ 140,710,150$ 135,189,315$
Remaining capacity for public
development facility debt $4.90 billion $4.90 billion $4.85 billion $4.86 billion $4.86 billion
IBank's legal limit on rate
reduction bonds $10.00 billion $10.00 billion $10.00 billion $10.00 billion $10.00 billion
Total amount outstanding on
rate reduction bonds 3 313,693,353$ 1,661,939$ -$ -$ -$
Remaining capacity for rate
reduction bonds $9.69 billion $10.00 billion $10.000 billion $10.00 billion $10.00 billion
1
development facilities.2
3
SCHEDULE OF STATUTORY DEBT LIMIT CAPACITY 1
FOR THE PAST TEN FISCAL YEARS
TRUST FUND, ENTERPRISE FUNDS OF THE CALIFORNIA
Rate reduction bonds are conduit revenue bonds.
Pursuant to California Government Code section 63071(b) and pertains only to bonds issued to finance public development facilities and for rate reduction bonds. There is no statutory debt limit on conduit revenue bonds issued for economic
Bonds and Debt Ratio. The amount outstanding represents the ISRF Program Bonds shown in the Schedule of Outstanding ISRF Program
CALIFORNIA INFRASTRUCTURE AND ECONOMIC DEVELOPMENT BANK FUND AND CALIFORNIA INFRASTRUCTURE GUARANTEE
INFRASTRUCTURE AND ECONOMIC DEVELOPMENT BANK FUND
52
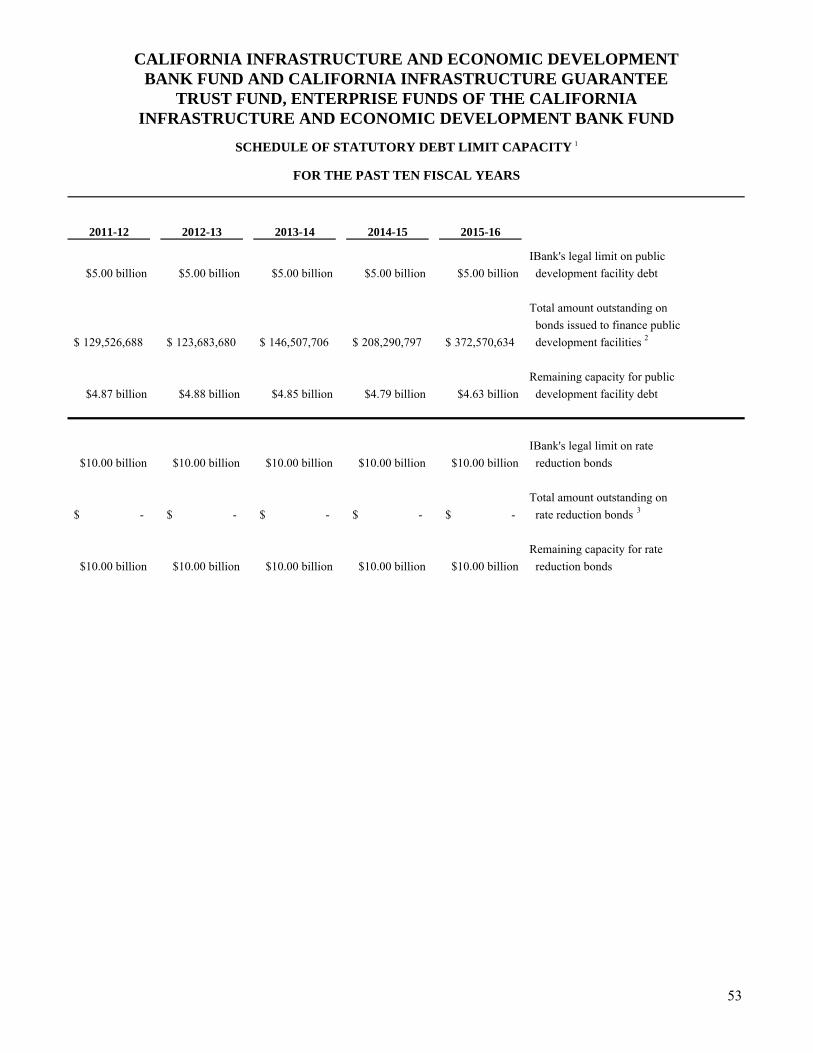
2011-12 2012-13 2013-14 2014-15 2015-16
IBank's legal limit on public
$5.00 billion $5.00 billion $5.00 billion $5.00 billion $5.00 billion development facility debt
Total amount outstanding on
bonds issued to finance public
129,526,688$ 123,683,680$ 146,507,706$ 208,290,797$ 372,570,634$ development facilities 2
Remaining capacity for public
$4.87 billion $4.88 billion $4.85 billion $4.79 billion $4.63 billion development facility debt
IBank's legal limit on rate
$10.00 billion $10.00 billion $10.00 billion $10.00 billion $10.00 billion reduction bonds
Total amount outstanding on
-$ -$ -$ -$ -$ rate reduction bonds 3
Remaining capacity for rate
$10.00 billion $10.00 billion $10.00 billion $10.00 billion $10.00 billion reduction bonds
SCHEDULE OF STATUTORY DEBT LIMIT CAPACITY 1
FOR THE PAST TEN FISCAL YEARS
CALIFORNIA INFRASTRUCTURE AND ECONOMIC DEVELOPMENT BANK FUND AND CALIFORNIA INFRASTRUCTURE GUARANTEE
TRUST FUND, ENTERPRISE FUNDS OF THE CALIFORNIAINFRASTRUCTURE AND ECONOMIC DEVELOPMENT BANK FUND
53
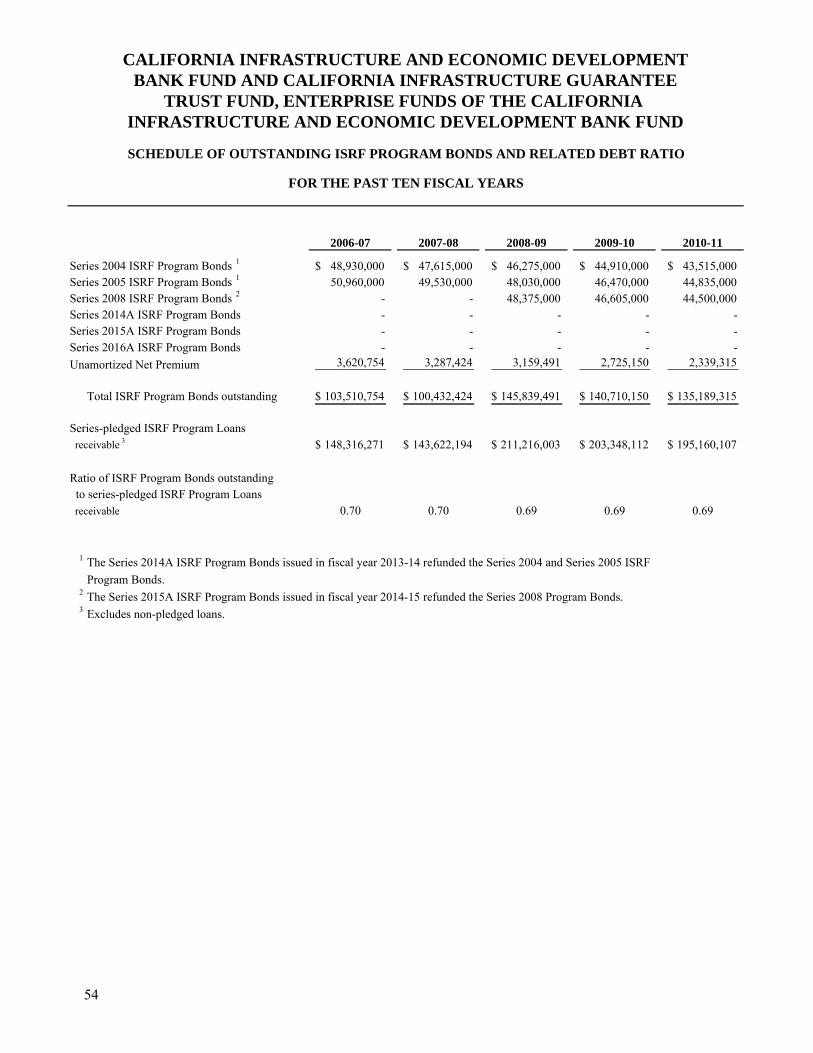
2006-07 2007-08 2008-09 2009-10 2010-11
48,930,000$ 47,615,000$ 46,275,000$ 44,910,000$ 43,515,000$ 50,960,000 49,530,000 48,030,000 46,470,000 44,835,000
- - 48,375,000 46,605,000 44,500,000 - - - - - - - - - -
Series 2016A ISRF Program Bonds - - - - -
Unamortized Net Premium 3,620,754 3,287,424 3,159,491 2,725,150 2,339,315
103,510,754$ 100,432,424$ 145,839,491$ 140,710,150$ 135,189,315$
receivable 3 148,316,271$ 143,622,194$ 211,216,003$ 203,348,112$ 195,160,107$
receivable 0.70 0.70 0.69 0.69 0.69
1 The Series 2014A ISRF Program Bonds issued in fiscal year 2013-14 refunded the Series 2004 and Series 2005 ISRF
Program Bonds.2 The Series 2015A ISRF Program Bonds issued in fiscal year 2014-15 refunded the Series 2008 Program Bonds.3 Excludes non-pledged loans.
Series 2014A ISRF Program Bonds
CALIFORNIA INFRASTRUCTURE AND ECONOMIC DEVELOPMENT BANK FUND AND CALIFORNIA INFRASTRUCTURE GUARANTEE
TRUST FUND, ENTERPRISE FUNDS OF THE CALIFORNIA INFRASTRUCTURE AND ECONOMIC DEVELOPMENT BANK FUND
FOR THE PAST TEN FISCAL YEARS
SCHEDULE OF OUTSTANDING ISRF PROGRAM BONDS AND RELATED DEBT RATIO
Ratio of ISRF Program Bonds outstanding to series-pledged ISRF Program Loans
Series 2004 ISRF Program Bonds 1
Series 2005 ISRF Program Bonds 1
Series 2015A ISRF Program Bonds
Total ISRF Program Bonds outstanding
Series-pledged ISRF Program Loans
Series 2008 ISRF Program Bonds 2
54
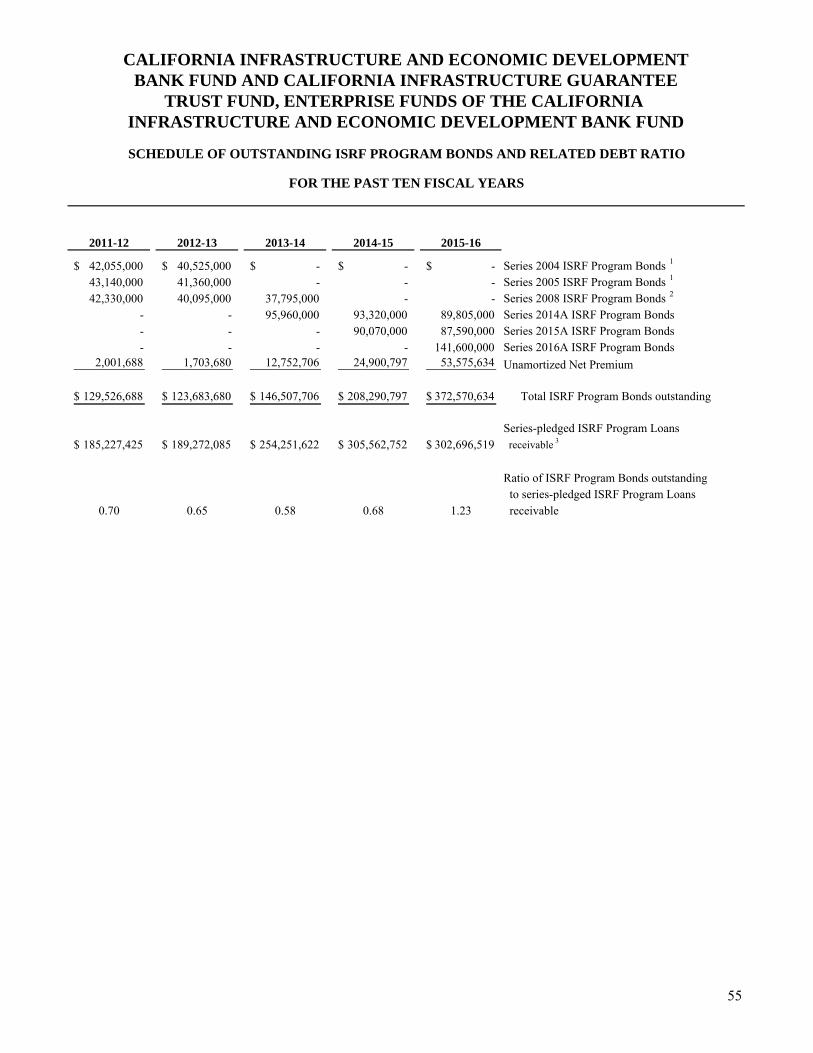
2011-12 2012-13 2013-14 2014-15 2015-16
42,055,000$ 40,525,000$ -$ -$ -$ 43,140,000 41,360,000 - - - 42,330,000 40,095,000 37,795,000 - -
- - 95,960,000 93,320,000 89,805,000 - - - 90,070,000 87,590,000 - - - - 141,600,000
2,001,688 1,703,680 12,752,706 24,900,797 53,575,634 Unamortized Net Premium
129,526,688$ 123,683,680$ 146,507,706$ 208,290,797$ 372,570,634$
185,227,425$ 189,272,085$ 254,251,622$ 305,562,752$ 302,696,519$ receivable 3
0.70 0.65 0.58 0.68 1.23 receivable
Series 2016A ISRF Program Bonds
Series 2014A ISRF Program Bonds
FOR THE PAST TEN FISCAL YEARS
CALIFORNIA INFRASTRUCTURE AND ECONOMIC DEVELOPMENT BANK FUND AND CALIFORNIA INFRASTRUCTURE GUARANTEE
TRUST FUND, ENTERPRISE FUNDS OF THE CALIFORNIA INFRASTRUCTURE AND ECONOMIC DEVELOPMENT BANK FUND
SCHEDULE OF OUTSTANDING ISRF PROGRAM BONDS AND RELATED DEBT RATIO
Series 2004 ISRF Program Bonds 1
Series 2015A ISRF Program Bonds
Total ISRF Program Bonds outstanding
Series-pledged ISRF Program Loans
Ratio of ISRF Program Bonds outstanding to series-pledged ISRF Program Loans
Series 2008 ISRF Program Bonds 2Series 2005 ISRF Program Bonds 1
55
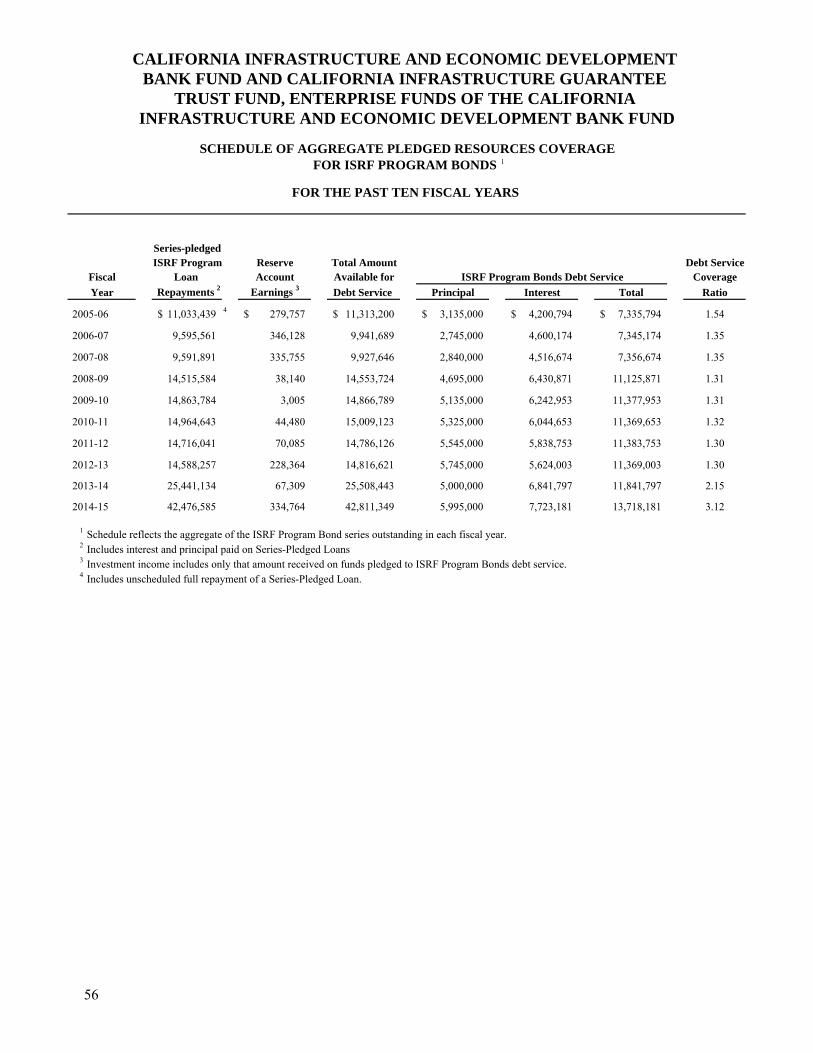
Series-pledgedISRF Program Reserve Total Amount Debt Service
Loan Account Available for Coverage
Repayments 2 Earnings 3 Debt Service Principal Interest Total Ratio
2005-06 11,033,439$ 4 279,757$ 11,313,200$ 3,135,000$ 4,200,794$ 7,335,794$ 1.54
2006-07 9,595,561 346,128 9,941,689 2,745,000 4,600,174 7,345,174 1.35
2007-08 9,591,891 335,755 9,927,646 2,840,000 4,516,674 7,356,674 1.35
2008-09 14,515,584 38,140 14,553,724 4,695,000 6,430,871 11,125,871 1.31
2009-10 14,863,784 3,005 14,866,789 5,135,000 6,242,953 11,377,953 1.31
2010-11 14,964,643 44,480 15,009,123 5,325,000 6,044,653 11,369,653 1.32
2011-12 14,716,041 70,085 14,786,126 5,545,000 5,838,753 11,383,753 1.30
2012-13 14,588,257 228,364 14,816,621 5,745,000 5,624,003 11,369,003 1.30
2013-14 25,441,134 67,309 25,508,443 5,000,000 6,841,797 11,841,797 2.15
2014-15 42,476,585 334,764 42,811,349 5,995,000 7,723,181 13,718,181 3.12
1 Schedule reflects the aggregate of the ISRF Program Bond series outstanding in each fiscal year.2 Includes interest and principal paid on Series-Pledged Loans 3 Investment income includes only that amount received on funds pledged to ISRF Program Bonds debt service.4 Includes unscheduled full repayment of a Series-Pledged Loan.
FOR THE PAST TEN FISCAL YEARS
Fiscal ISRF Program Bonds Debt Service
Year
CALIFORNIA INFRASTRUCTURE AND ECONOMIC DEVELOPMENT BANK FUND AND CALIFORNIA INFRASTRUCTURE GUARANTEE
INFRASTRUCTURE AND ECONOMIC DEVELOPMENT BANK FUND
SCHEDULE OF AGGREGATE PLEDGED RESOURCES COVERAGE FOR ISRF PROGRAM BONDS 1
TRUST FUND, ENTERPRISE FUNDS OF THE CALIFORNIA
56

This page has been intentionally left blank.
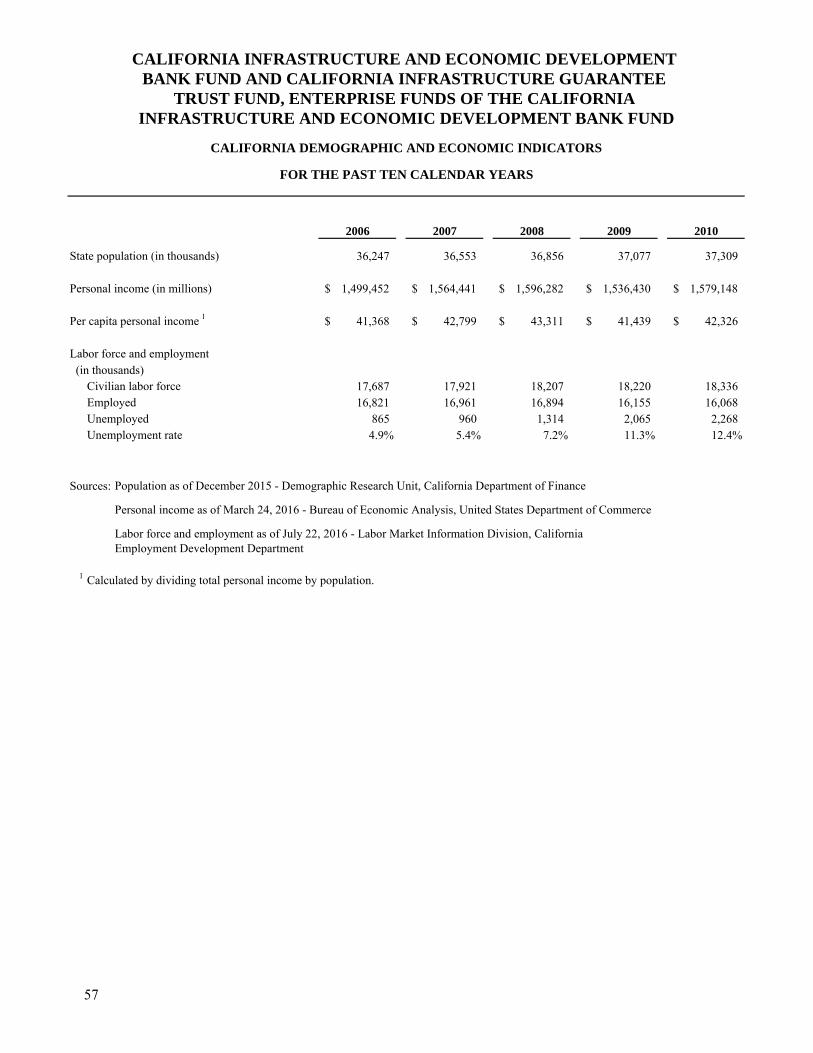
2006 2007 2008 2009 2010
36,247 36,553 36,856 37,077 37,309
1,499,452$ 1,564,441$ 1,596,282$ 1,536,430$ 1,579,148$
41,368$ 42,799$ 43,311$ 41,439$ 42,326$
(in thousands)17,687 17,921 18,207 18,220 18,336 16,821 16,961 16,894 16,155 16,068
865 960 1,314 2,065 2,268 4.9% 5.4% 7.2% 11.3% 12.4%
Sources:
1 Calculated by dividing total personal income by population.
Unemployment rate
EmployedUnemployed
State population (in thousands)
Personal income (in millions)
Per capita personal income 1
CALIFORNIA INFRASTRUCTURE AND ECONOMIC DEVELOPMENT BANK FUND AND CALIFORNIA INFRASTRUCTURE GUARANTEE
INFRASTRUCTURE AND ECONOMIC DEVELOPMENT BANK FUND
CALIFORNIA DEMOGRAPHIC AND ECONOMIC INDICATORS
TRUST FUND, ENTERPRISE FUNDS OF THE CALIFORNIA
FOR THE PAST TEN CALENDAR YEARS
Labor force and employment as of July 22, 2016 - Labor Market Information Division, CaliforniaEmployment Development Department
Personal income as of March 24, 2016 - Bureau of Economic Analysis, United States Department of Commerce
Population as of December 2015 - Demographic Research Unit, California Department of Finance
Labor force and employment
Civilian labor force
57
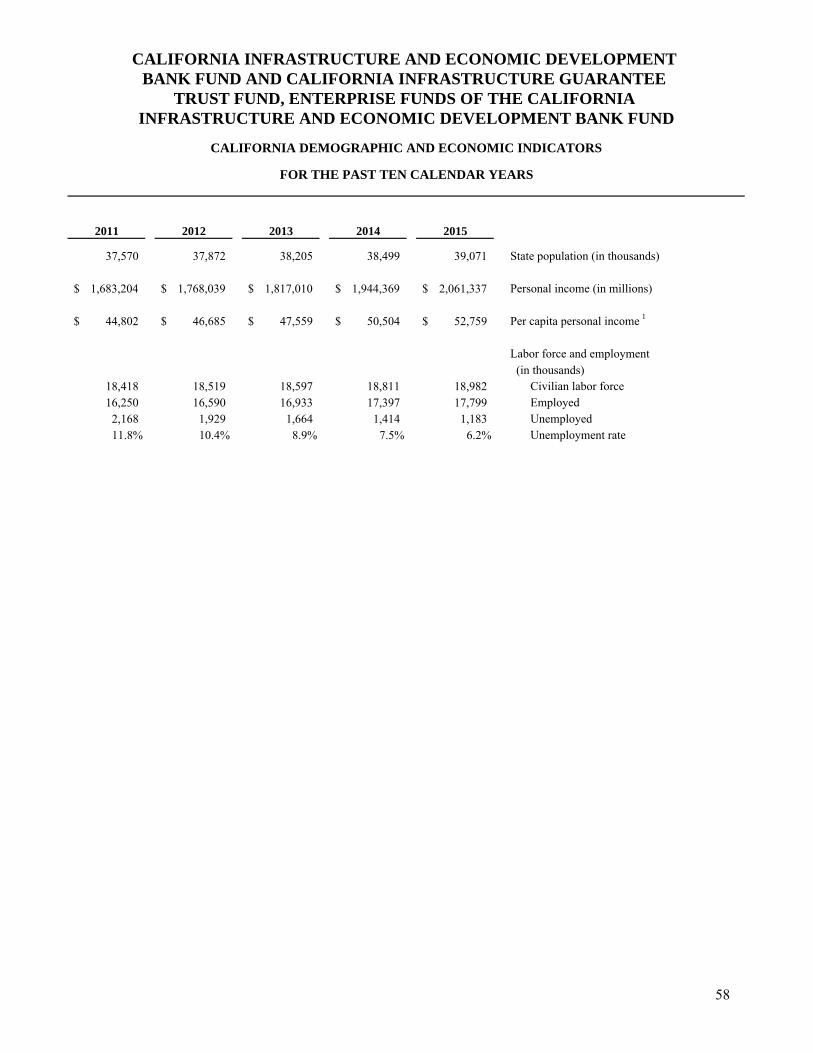
2011 2012 2013 2014 2015
37,570 37,872 38,205 38,499 39,071
1,683,204$ 1,768,039$ 1,817,010$ 1,944,369$ 2,061,337$
44,802$ 46,685$ 47,559$ 50,504$ 52,759$
(in thousands)18,418 18,519 18,597 18,811 18,982 16,250 16,590 16,933 17,397 17,799
2,168 1,929 1,664 1,414 1,183 11.8% 10.4% 8.9% 7.5% 6.2%
Personal income (in millions)
Per capita personal income 1
Labor force and employment
Civilian labor force
CALIFORNIA INFRASTRUCTURE AND ECONOMIC DEVELOPMENT BANK FUND AND CALIFORNIA INFRASTRUCTURE GUARANTEE
TRUST FUND, ENTERPRISE FUNDS OF THE CALIFORNIA INFRASTRUCTURE AND ECONOMIC DEVELOPMENT BANK FUND
CALIFORNIA DEMOGRAPHIC AND ECONOMIC INDICATORS
UnemployedUnemployment rate
FOR THE PAST TEN CALENDAR YEARS
Employed
State population (in thousands)
58
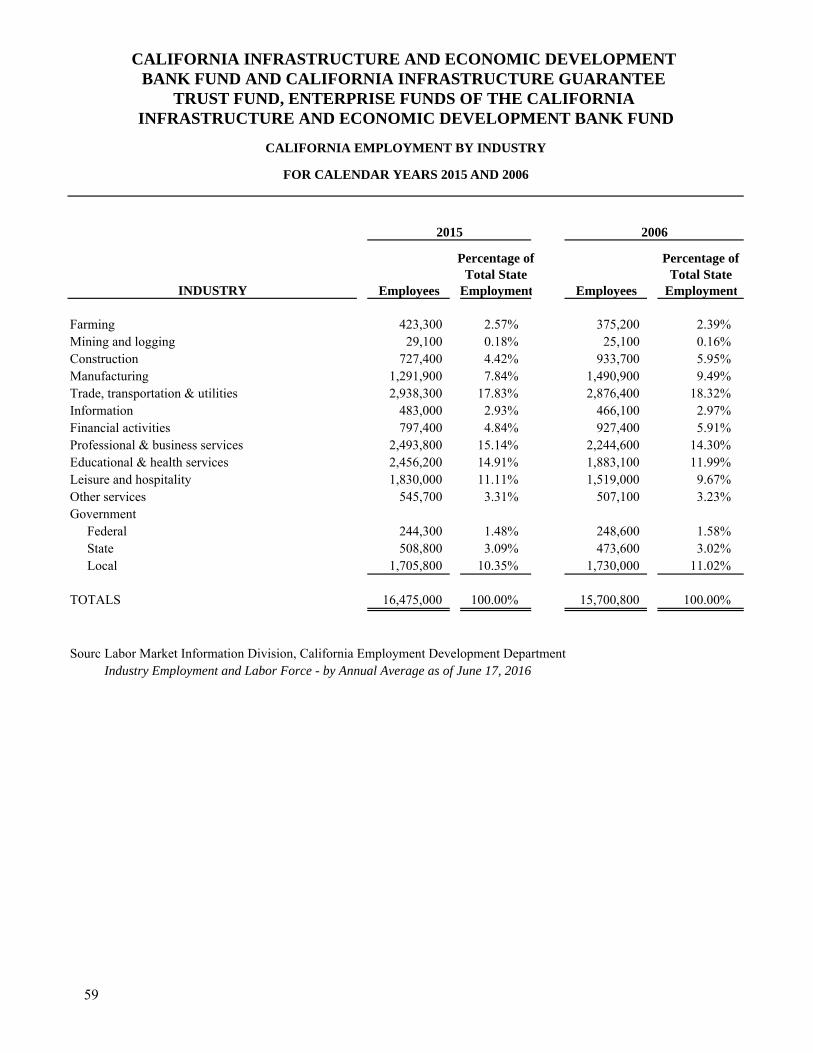
Percentage of Percentage ofTotal State Total State
Employees Employment Employees Employment
Farming 423,300 2.57% 375,200 2.39%Mining and logging 29,100 0.18% 25,100 0.16%Construction 727,400 4.42% 933,700 5.95%Manufacturing 1,291,900 7.84% 1,490,900 9.49%Trade, transportation & utilities 2,938,300 17.83% 2,876,400 18.32%Information 483,000 2.93% 466,100 2.97%Financial activities 797,400 4.84% 927,400 5.91%Professional & business services 2,493,800 15.14% 2,244,600 14.30%Educational & health services 2,456,200 14.91% 1,883,100 11.99%Leisure and hospitality 1,830,000 11.11% 1,519,000 9.67%Other services 545,700 3.31% 507,100 3.23%Government
Federal 244,300 1.48% 248,600 1.58%State 508,800 3.09% 473,600 3.02%Local 1,705,800 10.35% 1,730,000 11.02%
TOTALS 16,475,000 100.00% 15,700,800 100.00%
SourceLabor Market Information Division, California Employment Development DepartmentIndustry Employment and Labor Force - by Annual Average as of June 17, 2016
INDUSTRY
2015 2006
FOR CALENDAR YEARS 2015 AND 2006
CALIFORNIA INFRASTRUCTURE AND ECONOMIC DEVELOPMENT BANK FUND AND CALIFORNIA INFRASTRUCTURE GUARANTEE
INFRASTRUCTURE AND ECONOMIC DEVELOPMENT BANK FUND
CALIFORNIA EMPLOYMENT BY INDUSTRY
TRUST FUND, ENTERPRISE FUNDS OF THE CALIFORNIA
59
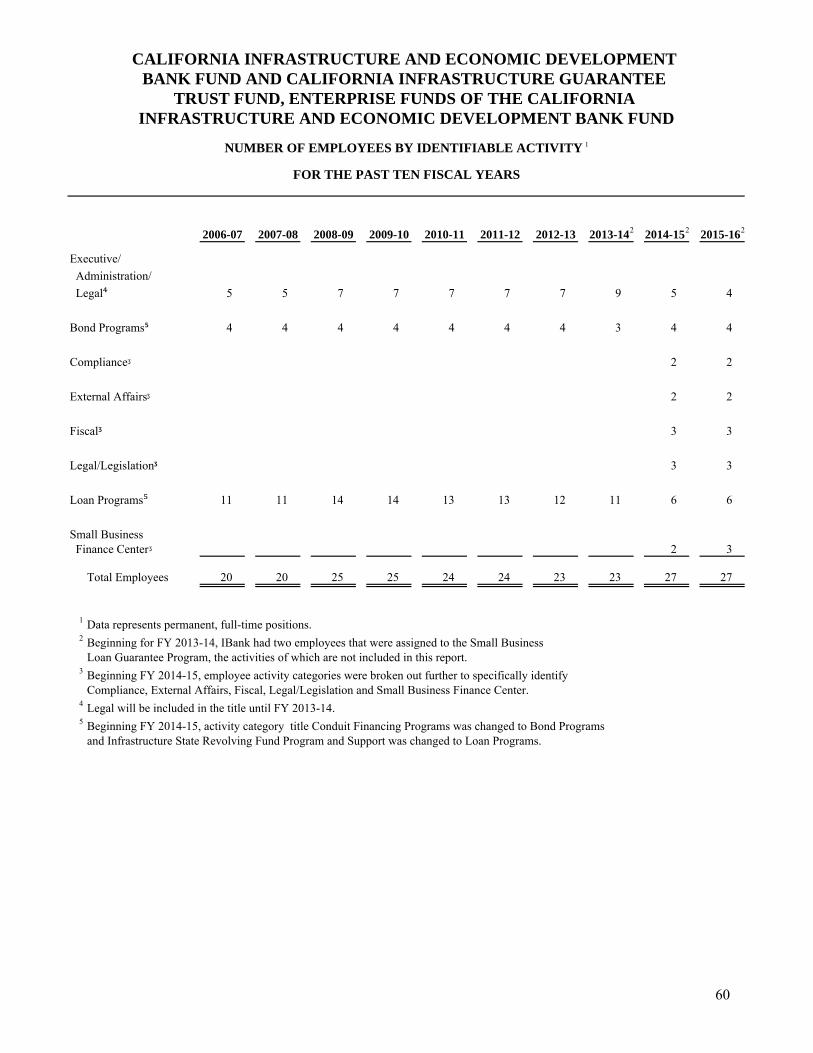
2006-07 2007-08 2008-09 2009-10 2010-11 2011-12 2012-13 2013-142 2014-152 2015-162
Executive/
Administration/
Legal⁴ 5 5 7 7 7 7 7 9 5 4
Bond Programs⁵ 4 4 4 4 4 4 4 3 4 4
Complianceᶾ 2 2
External Affairsᶾ 2 2
Fiscalᶾ 3 3
Legal/Legislationᶾ 3 3
Loan Programs⁵ 11 11 14 14 13 13 12 11 6 6
Small Business Finance Centerᶾ 2 3
Total Employees 20 20 25 25 24 24 23 23 27 27
1 Data represents permanent, full-time positions.2 Beginning for FY 2013-14, IBank had two employees that were assigned to the Small Business
Loan Guarantee Program, the activities of which are not included in this report.3 Beginning FY 2014-15, employee activity categories were broken out further to specifically identify
Compliance, External Affairs, Fiscal, Legal/Legislation and Small Business Finance Center. 4 Legal will be included in the title until FY 2013-14. 5 Beginning FY 2014-15, activity category title Conduit Financing Programs was changed to Bond Programs
and Infrastructure State Revolving Fund Program and Support was changed to Loan Programs.
CALIFORNIA INFRASTRUCTURE AND ECONOMIC DEVELOPMENT
INFRASTRUCTURE AND ECONOMIC DEVELOPMENT BANK FUND
NUMBER OF EMPLOYEES BY IDENTIFIABLE ACTIVITY 1
FOR THE PAST TEN FISCAL YEARS
TRUST FUND, ENTERPRISE FUNDS OF THE CALIFORNIA BANK FUND AND CALIFORNIA INFRASTRUCTURE GUARANTEE
60
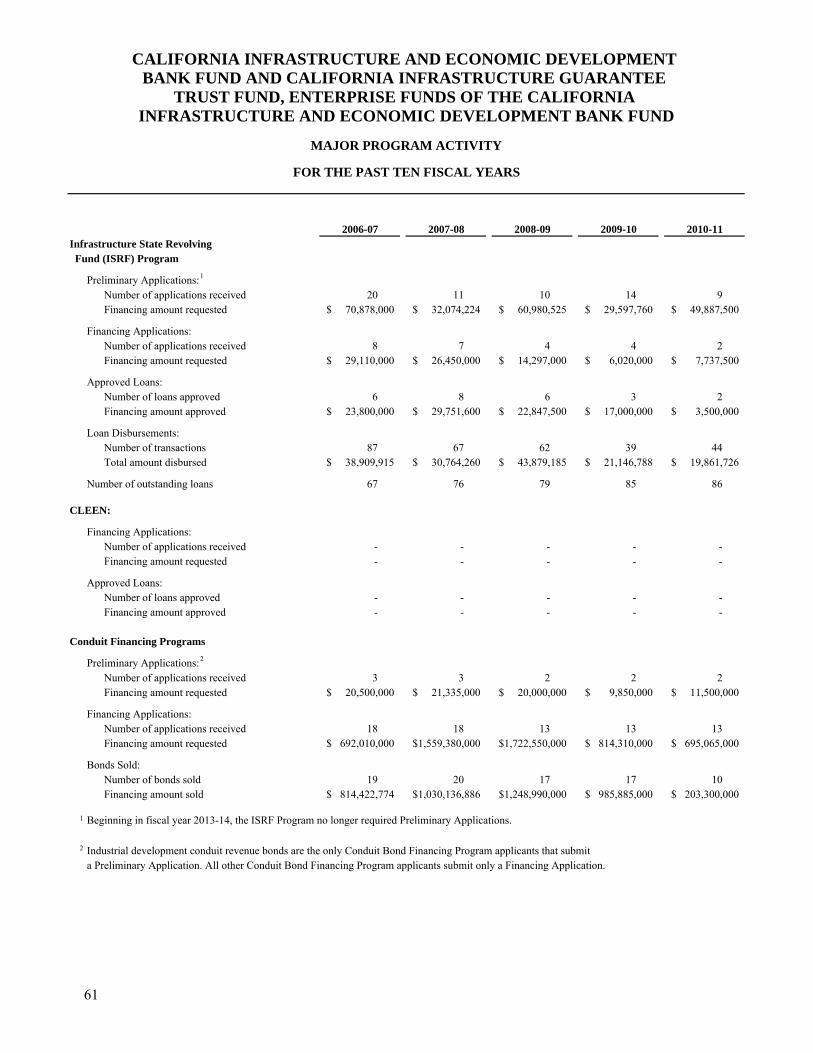
2006-07 2007-08 2008-09 2009-10 2010-11Infrastructure State Revolving Fund (ISRF) Program
Preliminary Applications: 1
Number of applications received 20 11 10 14 9Financing amount requested 70,878,000$ 32,074,224$ 60,980,525$ 29,597,760$ 49,887,500$
Financing Applications:Number of applications received 8 7 4 4 2Financing amount requested 29,110,000$ 26,450,000$ 14,297,000$ 6,020,000$ 7,737,500$
Approved Loans:Number of loans approved 6 8 6 3 2Financing amount approved 23,800,000$ 29,751,600$ 22,847,500$ 17,000,000$ 3,500,000$
Loan Disbursements:Number of transactions 87 67 62 39 44Total amount disbursed 38,909,915$ 30,764,260$ 43,879,185$ 21,146,788$ 19,861,726$
Number of outstanding loans 67 76 79 85 86
CLEEN:
Financing Applications:Number of applications received - - - - -Financing amount requested - - - - -
Approved Loans:Number of loans approved - - - - -Financing amount approved - - - - -
Conduit Financing Programs
Preliminary Applications: 2
Number of applications received 3 3 2 2 2Financing amount requested 20,500,000$ 21,335,000$ 20,000,000$ 9,850,000$ 11,500,000$
Financing Applications:Number of applications received 18 18 13 13 13Financing amount requested 692,010,000$ 1,559,380,000$ 1,722,550,000$ 814,310,000$ 695,065,000$
Bonds Sold:Number of bonds sold 19 20 17 17 10Financing amount sold 814,422,774$ 1,030,136,886$ 1,248,990,000$ 985,885,000$ 203,300,000$
1
2 Industrial development conduit revenue bonds are the only Conduit Bond Financing Program applicants that submit a Preliminary Application. All other Conduit Bond Financing Program applicants submit only a Financing Application.
Beginning in fiscal year 2013-14, the ISRF Program no longer required Preliminary Applications.
FOR THE PAST TEN FISCAL YEARS
CALIFORNIA INFRASTRUCTURE AND ECONOMIC DEVELOPMENT BANK FUND AND CALIFORNIA INFRASTRUCTURE GUARANTEE
INFRASTRUCTURE AND ECONOMIC DEVELOPMENT BANK FUND
MAJOR PROGRAM ACTIVITY
TRUST FUND, ENTERPRISE FUNDS OF THE CALIFORNIA
61
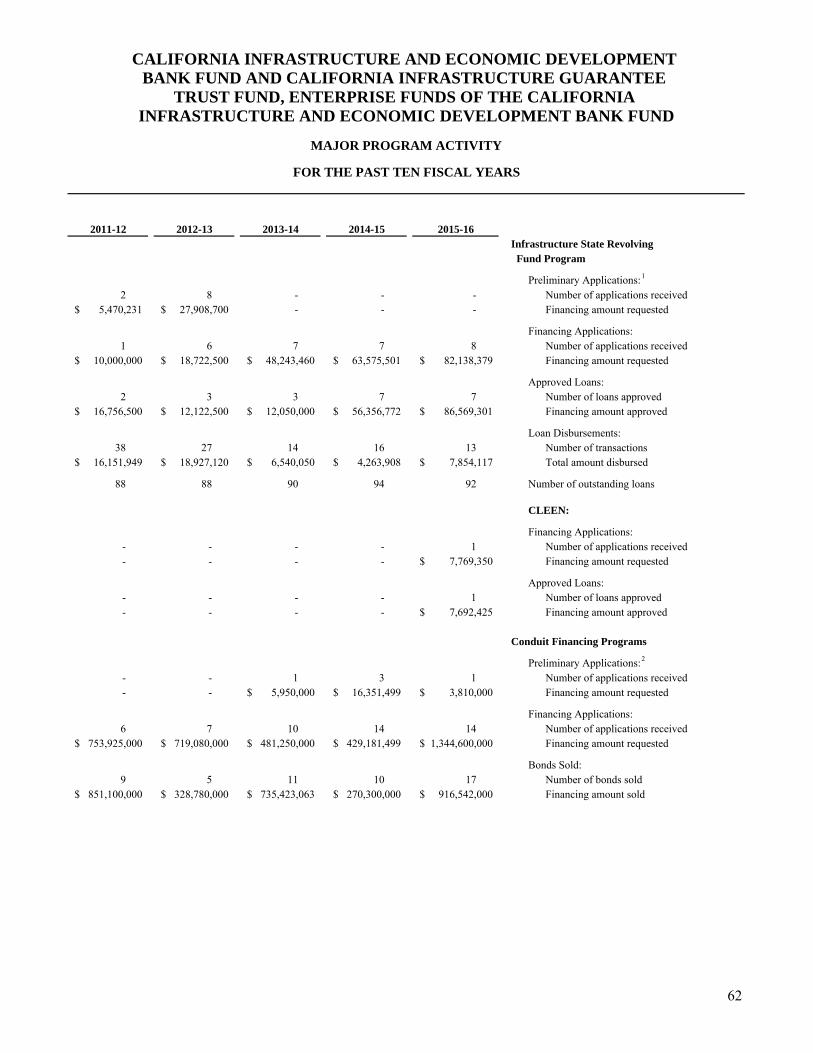
2011-12 2012-13 2013-14 2014-15 2015-16Infrastructure State Revolving Fund Program
Preliminary Applications: 1
2 8 - - - Number of applications received5,470,231$ 27,908,700$ - - - Financing amount requested
Financing Applications:1 6 7 7 8 Number of applications received
10,000,000$ 18,722,500$ 48,243,460$ 63,575,501$ 82,138,379$ Financing amount requested
Approved Loans:2 3 3 7 7 Number of loans approved
16,756,500$ 12,122,500$ 12,050,000$ 56,356,772$ 86,569,301$ Financing amount approved
Loan Disbursements:38 27 14 16 13 Number of transactions
16,151,949$ 18,927,120$ 6,540,050$ 4,263,908$ 7,854,117$ Total amount disbursed
88 88 90 94 92 Number of outstanding loans
CLEEN:
Financing Applications:- - - - 1 Number of applications received- - - - 7,769,350$ Financing amount requested
Approved Loans:- - - - 1 Number of loans approved- - - - 7,692,425$ Financing amount approved
Conduit Financing Programs
Preliminary Applications: 2
- - 1 3 1 Number of applications received- - 5,950,000$ 16,351,499$ 3,810,000$ Financing amount requested
Financing Applications:6 7 10 14 14 Number of applications received
753,925,000$ 719,080,000$ 481,250,000$ 429,181,499$ 1,344,600,000$ Financing amount requested
Bonds Sold:9 5 11 10 17 Number of bonds sold
851,100,000$ 328,780,000$ 735,423,063$ 270,300,000$ 916,542,000$ Financing amount sold
FOR THE PAST TEN FISCAL YEARS
CALIFORNIA INFRASTRUCTURE AND ECONOMIC DEVELOPMENT BANK FUND AND CALIFORNIA INFRASTRUCTURE GUARANTEE
TRUST FUND, ENTERPRISE FUNDS OF THE CALIFORNIA INFRASTRUCTURE AND ECONOMIC DEVELOPMENT BANK FUND
MAJOR PROGRAM ACTIVITY
62
This Comprehensive Annual Financial Report was prepared by the California Infrastructure and Economic Development Bank’s Fiscal Unit.
Diane J. Nanik Fiscal Unit Manager
Betty Daquioag-Correa
Senior Accounting Officer
Tracey Thompson Senior Accounting Officer
The Fiscal Unit was assisted by other IBank staff and the staff of the Governor’s Office of Business and Economic Development, the California Department of General Service Contracted Fiscal Services Unit, and the California Department of Resources Recycling and Recovery Information Technology Services Branch.
To obtain copies of this report, please contact:
TEVEIA R. BARNES, EXECUTIVE DIRECTOR California Infrastructure and Economic Development Bank
P.O. Box 2830 Sacramento, CA 95812-2830
(916) 341-6600
This report is also available on IBank’s website at www.ibank.ca.gov.