Embed Size (px)
Citation preview
Breathing RoomCalifornia Has Room
To Preserve and Protect Construction Jobs
And Still Exceed
Its Goals for Reducing Emissions from Off-Road Fleets
April 21, 2010
2
California’s New
In-Use Off-Road Diesel-Fueled Fleets Regulation
• Approved in July 2007
• Separately addresses emissions of nitrogen oxides (NOx) and
particulate matter (PM)
• Applies to four industry categories – but just one of the four
(Construction and Mining) accounts for at least 80% of the
regulated equipment
3
California’s New
In-Use Off-Road Diesel-Fueled Fleets Regulation
• Established reporting requirements that took effect in April (large
fleets), June (medium fleets) and August (small fleets) of 2009
• Established fleet average requirements that were originally
scheduled to take effect in March of 2010 (large fleets), 2013
(medium fleets) and 2015 (small fleets)

4
California’s New
In-Use Off-Road Diesel-Fueled Fleets Regulation
• Based on 2000 emissions inventory
• OFFROAD model
• Best data then available to CARB
• Baseline emissions for 2000
• Forecast for future years
• Calibrated to drop NOx and PM emissions to specified levels
• Compliance with State Implementation Plan
• Environmental benefits versus economic burdens
5
Scope of Presentation
• A Quick Review
• The Fundamentals of the OFFROAD Model
• 2000 Emissions Inventory
• 2009 Emissions Inventory
• DOORS Data Provided on September 26, 2009
6
Scope of Presentation
• Updated 2009 Emissions Inventory
• DOORS Data Provided on February 17, 2009
• BOE and EIA Data on Diesel Fuel that Off-Road Equipment
Consumed in 2009
• Labor Union Data on the Hours that Operators Worked in 2009
• Conclusions
7
Bottom Line
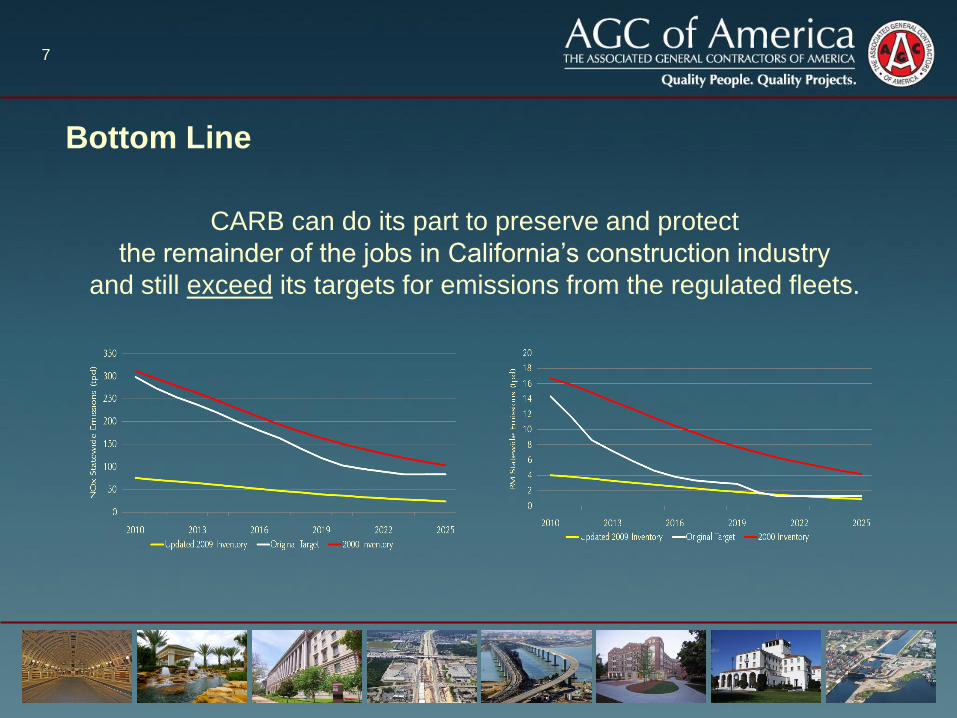
CARB can do its part to preserve and protect
the remainder of the jobs in California’s construction industry
and still exceed its targets for emissions from the regulated fleets.
8
Fundamentals of the OFFROAD Model
• “Bottom Up” model designed to estimate current and project future
emissions from off-road engines and vehicles
• Agricultural, recreational, construction, mining, and other categories,
but not rail or marine
• Estimates and forecasts of emissions of hydrocarbons and carbon
monoxide, as well as NOx and PM
• Also diesel fuel diesel consumption
9
Fundamentals of the OFFROAD Model
• Originated in the mid-1990’s
• Many assumptions and methodologies dating back to that period
• Not well documented
• Literally thousands of calculations
• But fundamental structure relatively straightforward
10
Fundamentals of the OFFROAD Model
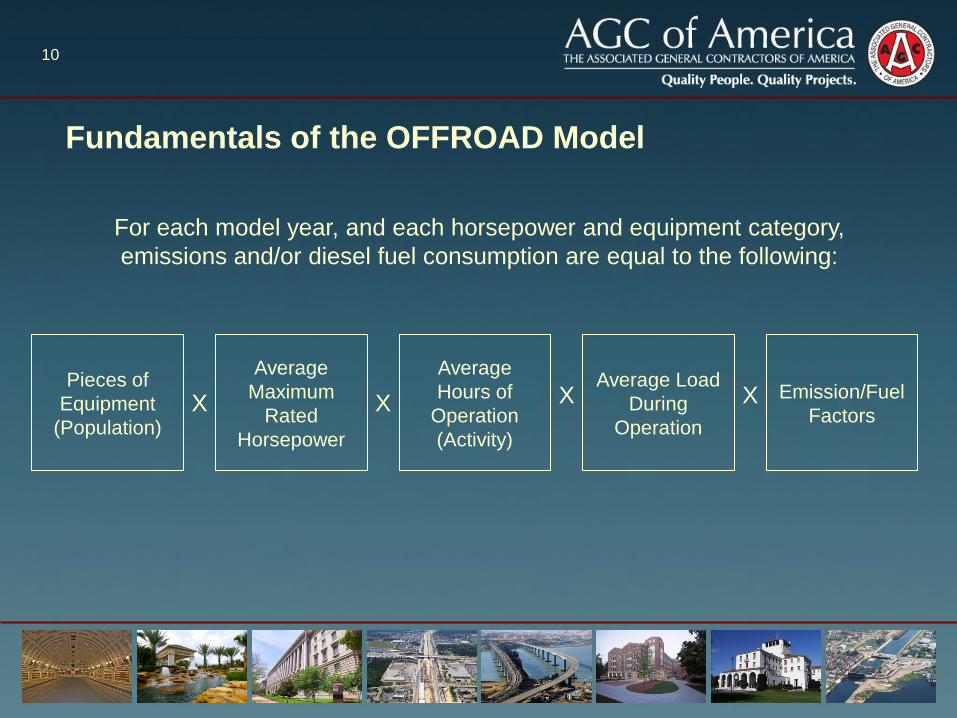
For each model year, and each horsepower and equipment category,
emissions and/or diesel fuel consumption are equal to the following:
Pieces of
Equipment
(Population)
Average
Maximum
Rated
Horsepower
Average Load
During
Operation
Average
Hours of
Operation
(Activity)
Emission/Fuel
Factors X X X X
11
Fundamentals of the OFFROAD Model
• Different Emission Factors for each pollutant
• Vary with age of engine
• Also adjusted for unique fuel mixture that California requires
• Measured in grams of pollutant per brake horsepower of engine
work
• Also Diesel Fuel Consumption Factors
• Measured in gallons of diesel fuel per brake horsepower of engine
work
• Selected factor depends on purpose of estimate and/or forecast
• Same inputs
12
Fundamentals of the OFFROAD Model
• Calculates and aggregates results for each model year of each
horsepower and equipment category to produce baseline estimate for a
particular year
• Applies a growth factor to make forecasts for future years
• Constant annual rate of growth for each population of equipment,
equal to nearly 2% for Construction and Mining equipment
• Apparently related to employment data but precise relationship
uncertain
13
Fundamentals of the OFFROAD Model
• Not responsive to short-term swings in the economy
• Activity assumed to be constant from year to year
• Baseline estimates likely to be wide of the mark for any one year
• Low for years of unusually high activity
• High for years of unusually low activity
14
2000 Emissions Inventory
• Starting point for new regulation
• Baseline estimate for year 2000
• Earlier surveys and studies used to estimate inputs
• Population
• Average Maximum Rated Horsepower
• Activity
• Load Factors
• Age Distribution
15
2000 Emissions Inventory
• Baseline estimate for year 2000
• Emission Factors linked to regulatory standards through engine
testing data
• Forecasts for future emissions
• Based on Growth Factor

16
2000 Emissions Inventory
for NOx
• OFFROAD model estimated 325 tons per
day (tpd) in 2009
• OFFROAD model then projected steadily
declining emissions through 2025
• Down anywhere from 4.3% to 8% per
year from 2010 to 2025
• Down a cumulative total of 68.2% (to
103.2 tpd) between 2009 and 2025
NOx Emissions
From Regulated Fleets
(Tons Per Day)
Year
2000
Inventory
2009 325.0
2010 311.0
2011 294.6
2012 278.6
2013 262.8
2014 246.0
2015 227.5
2016 209.9
2017 193.3
2018 177.8
2019 164.0
2020 150.8
2021 139.6
2022 128.8
2023 119.3
2024 110.7
2025 103.2

17
2000 Emissions Inventory
for NOx

18
2000 Emissions Inventory
for PM
• OFFROAD model estimated 17.49 tpd in
2009
• OFFROAD model then projected steadily
declining emissions through 2025
• Down anywhere from 4.6% to 10.2%
per year though 2025
• Down a cumulative total of 76.2% (to
4.2 tpd) between 2009 and 2025
PM Emissions
From Regulated Fleets
(Tons Per Day)
Year
2000
Inventory
2009 17.49
2010 16.69
2011 15.86
2012 14.82
2013 13.71
2014 12.65
2015 11.54
2016 10.48
2017 9.53
2018 8.56
2019 7.71
2020 6.98
2021 6.29
2022 5.69
2023 5.14
2024 4.64
2025 4.17

19
2000 Emissions Inventory
for PM
20
2009 Emissions Inventory
• New regulation’s reporting requirements took effect between April and
August of 2009
• Opportunity to take fresh look at emissions inventory
• Embedded in DOORS data were new and better values for three inputs
needed to estimate emissions in 2009
• Population
• Average Maximum Rated Horsepower
• Age Distribution
21
2009 Emissions Inventory
• As did CARB, AGC relied on OFFROAD model
• No modifications or adjustments to model itself
• No changes to formula
• Originally estimated and/or assumed values for Activity and Load
• Same Emission Factors
• Same Growth Factor

22
2009 Emissions Inventory
• AGC merely substituted DOORS data provided in September of 2009 for
surveys and studies on which CARB had relied
• OFFROAD model estimates for 2009
• OFFROAD model forecasts for future years
23
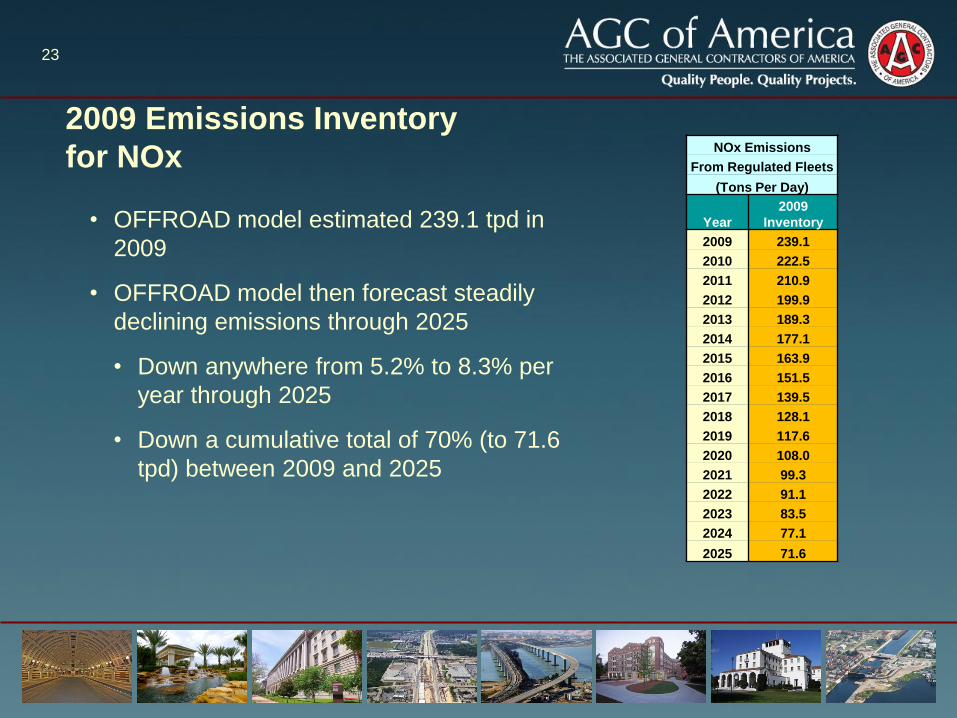
2009 Emissions Inventory
for NOx
• OFFROAD model estimated 239.1 tpd in
2009
• OFFROAD model then forecast steadily
declining emissions through 2025
• Down anywhere from 5.2% to 8.3% per
year through 2025
• Down a cumulative total of 70% (to 71.6
tpd) between 2009 and 2025
NOx Emissions
From Regulated Fleets
(Tons Per Day)
Year
2009
Inventory
2009 239.1
2010 222.5
2011 210.9
2012 199.9
2013 189.3
2014 177.1
2015 163.9
2016 151.5
2017 139.5
2018 128.1
2019 117.6
2020 108.0
2021 99.3
2022 91.1
2023 83.5
2024 77.1
2025 71.6

24
2009 Emissions Inventory
for NOx
• Close to originally forecast rate of decline
in NOx emissions
• 2000 Inventory: 4.3% to 8%
• 2009 Inventory: 5.2% to 8.3%
• Also close to originally forecast decline in
NOx emissions over entire period
• 2000 Inventory: 68.2%
• 2009 Inventory: 70%
NOx Emissions
From Regulated Fleets
(Tons Per Day)
Year
2000
Inventory
2009
Inventory
2009 325.0 239.1
2010 311.0 222.5
2011 294.6 210.9
2012 278.6 199.9
2013 262.8 189.3
2014 246.0 177.1
2015 227.5 163.9
2016 209.9 151.5
2017 193.3 139.5
2018 177.8 128.1
2019 164.0 117.6
2020 150.8 108.0
2021 139.6 99.3
2022 128.8 91.1
2023 119.3 83.5
2024 110.7 77.1
2025 103.2 71.6
25
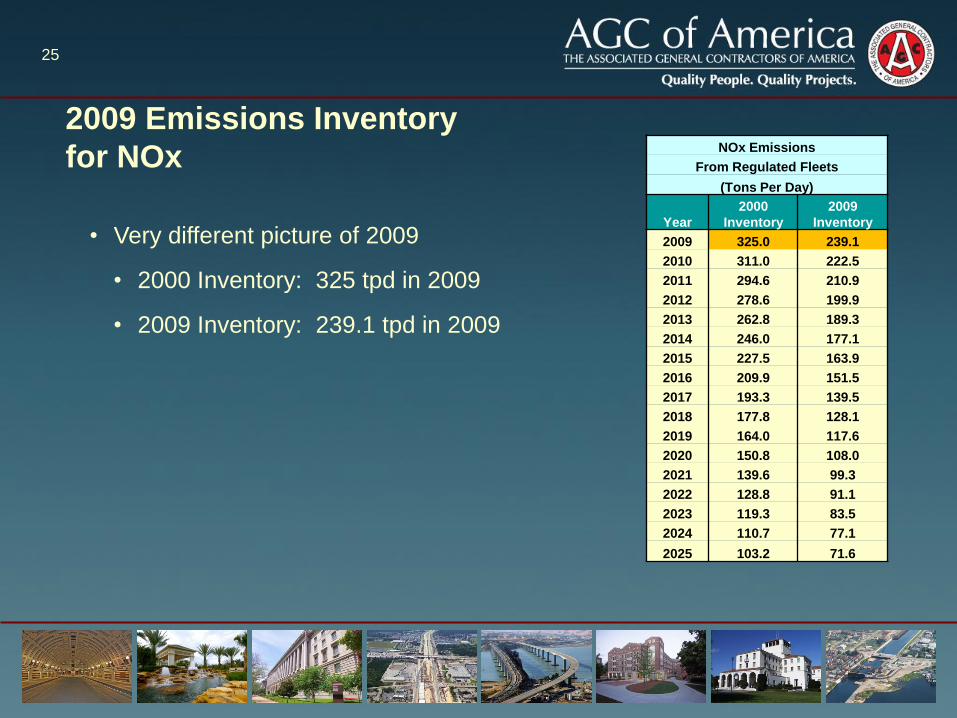
2009 Emissions Inventory
for NOx
• Very different picture of 2009
• 2000 Inventory: 325 tpd in 2009
• 2009 Inventory: 239.1 tpd in 2009
NOx Emissions
From Regulated Fleets
(Tons Per Day)
Year
2000
Inventory
2009
Inventory
2009 325.0 239.1
2010 311.0 222.5
2011 294.6 210.9
2012 278.6 199.9
2013 262.8 189.3
2014 246.0 177.1
2015 227.5 163.9
2016 209.9 151.5
2017 193.3 139.5
2018 177.8 128.1
2019 164.0 117.6
2020 150.8 108.0
2021 139.6 99.3
2022 128.8 91.1
2023 119.3 83.5
2024 110.7 77.1
2025 103.2 71.6
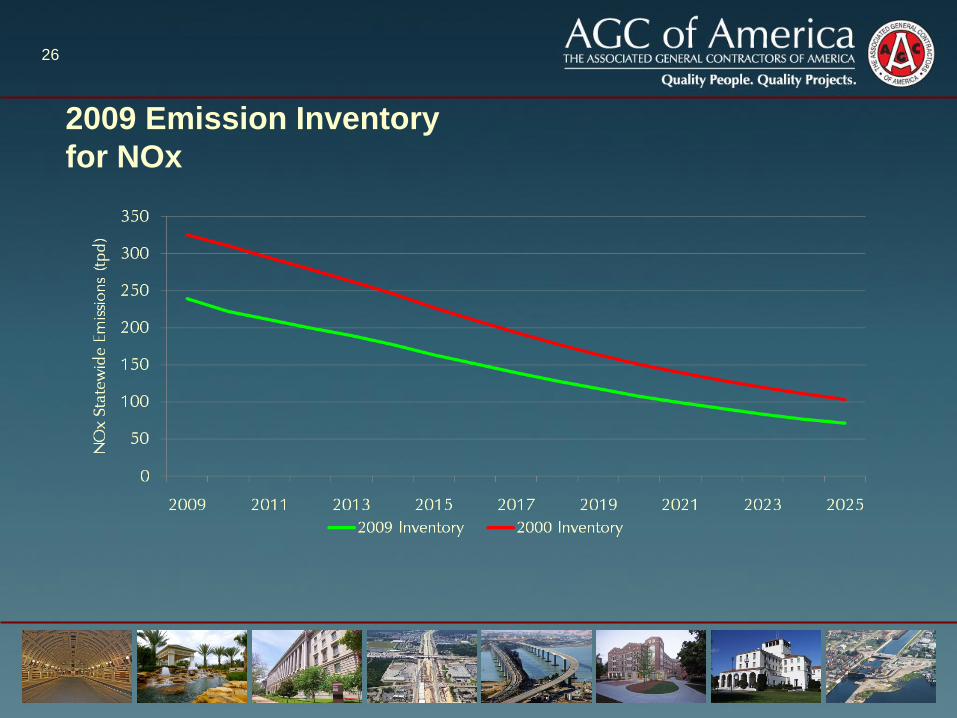
26
2009 Emission Inventory
for NOx
27
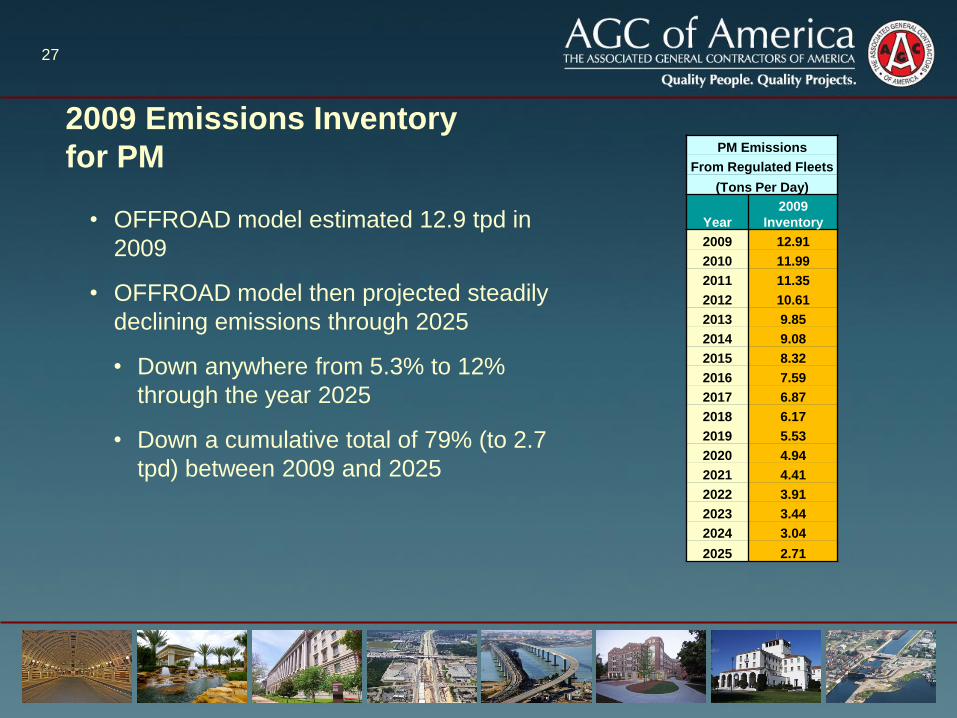
2009 Emissions Inventory
for PM
• OFFROAD model estimated 12.9 tpd in
2009
• OFFROAD model then projected steadily
declining emissions through 2025
• Down anywhere from 5.3% to 12%
through the year 2025
• Down a cumulative total of 79% (to 2.7
tpd) between 2009 and 2025
PM Emissions
From Regulated Fleets
(Tons Per Day)
Year
2009
Inventory
2009 12.91
2010 11.99
2011 11.35
2012 10.61
2013 9.85
2014 9.08
2015 8.32
2016 7.59
2017 6.87
2018 6.17
2019 5.53
2020 4.94
2021 4.41
2022 3.91
2023 3.44
2024 3.04
2025 2.71
28
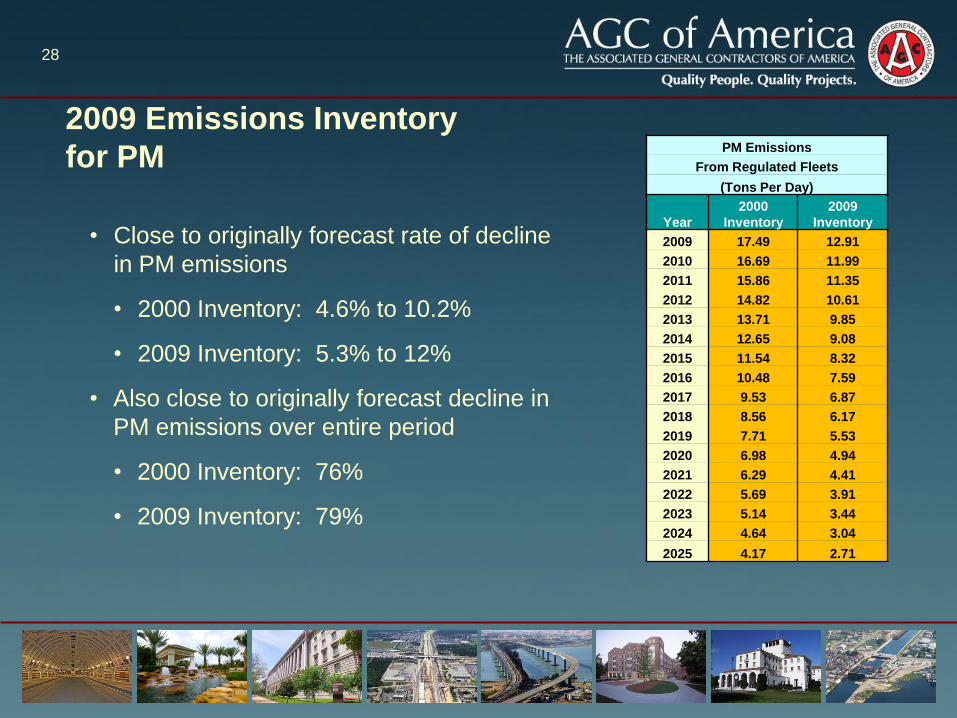
2009 Emissions Inventory
for PM
• Close to originally forecast rate of decline
in PM emissions
• 2000 Inventory: 4.6% to 10.2%
• 2009 Inventory: 5.3% to 12%
• Also close to originally forecast decline in
PM emissions over entire period
• 2000 Inventory: 76%
• 2009 Inventory: 79%
PM Emissions
From Regulated Fleets
(Tons Per Day)
Year
2000
Inventory
2009
Inventory
2009 17.49 12.91
2010 16.69 11.99
2011 15.86 11.35
2012 14.82 10.61
2013 13.71 9.85
2014 12.65 9.08
2015 11.54 8.32
2016 10.48 7.59
2017 9.53 6.87
2018 8.56 6.17
2019 7.71 5.53
2020 6.98 4.94
2021 6.29 4.41
2022 5.69 3.91
2023 5.14 3.44
2024 4.64 3.04
2025 4.17 2.71

29
2009 Emissions Inventory
for PM
• Very different picture of 2009
• 2000 Inventory: 17.5 tpd
• 2009 Inventory: 12.9 tpd
PM Emissions
From Regulated Fleets
(Tons Per Day)
Year
2000
Inventory
2009
Inventory
2009 17.49 12.91
2010 16.69 11.99
2011 15.86 11.35
2012 14.82 10.61
2013 13.71 9.85
2014 12.65 9.08
2015 11.54 8.32
2016 10.48 7.59
2017 9.53 6.87
2018 8.56 6.17
2019 7.71 5.53
2020 6.98 4.94
2021 6.29 4.41
2022 5.69 3.91
2023 5.14 3.44
2024 4.64 3.04
2025 4.17 2.71
30
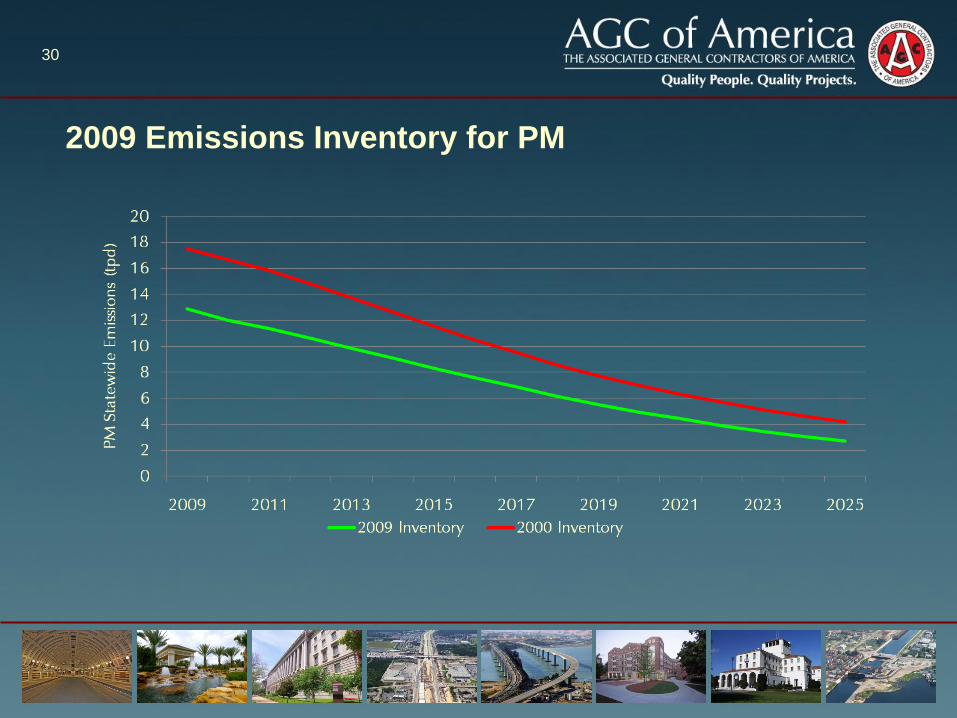
2009 Emissions Inventory for PM

31
Updated 2009 Emissions Inventory
• 2010 presented opportunity to further refine values needed to estimate
emissions in 2009
• Additional data had continued to trickle into CARB
• Total population of reported equipment grew from 126,267 to
156,929 by February of 2010
• Population, Average Maximum Horsepower and Age Distribution
• Also “low use” equipment, which had grown in proportion to total
32
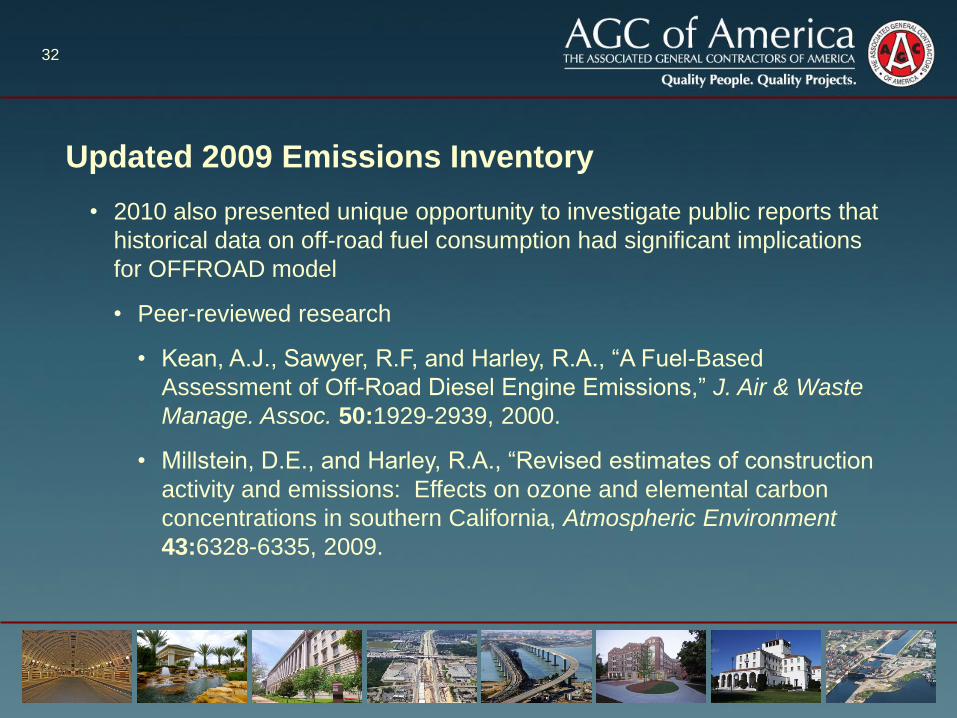
Updated 2009 Emissions Inventory
• 2010 also presented unique opportunity to investigate public reports that
historical data on off-road fuel consumption had significant implications
for OFFROAD model
• Peer-reviewed research
• Kean, A.J., Sawyer, R.F, and Harley, R.A., “A Fuel-Based
Assessment of Off-Road Diesel Engine Emissions,” J. Air & Waste
Manage. Assoc. 50:1929-2939, 2000.
• Millstein, D.E., and Harley, R.A., “Revised estimates of construction
activity and emissions: Effects on ozone and elemental carbon
concentrations in southern California, Atmospheric Environment
43:6328-6335, 2009.
33
Updated 2009 Emissions Inventory
• Not only DOORS data but also other data for all of 2009 became
available in 2010
• Red dye diesel fuel that all off-road equipment burned in 2009
• Hours that equipment operators worked in 2009
• Sources of additional data included Locals 3 and 12 of International
Union of Operating Engineers, California Board of Equalization, and
Energy Information Administration of U.S. Department of Energy
34
Updated 2009 Emissions Inventory
• Again, AGC began with OFFROAD model
• No modifications or adjustments to model itself
• No changes to formula
• Originally estimated and/or assumed values for Activity and Load
• Same Emission and Fuel Factors
• Same Growth Factor
35
Updated 2009 Emissions Inventory
• First, AGC substituted DOORS data provided in February of 2010 for
DOORS data provided in September of 2009
• Second, AGC accounted for equipment reported to be low use
• 7.5% of total population of equipment
• Assumed to operate no more than 100 hours per year, as required by
regulation
• Scaling factor equal to 0.16
• Ratio of regulatory limit (100 hours per year) to otherwise estimated
and/or assumed hours of operation
36
Updated 2009 Emissions Inventory
• Third, AGC confirmed and quantified disparity between actual data and
model’s estimates of off-road diesel fuel consumption for 2009
• Finally, AGC aligned model with actual data on off-road diesel fuel
consumption
• Actual Fuel Consumption Factor equal to 0.282
• Ratio of off-road fuel consumption in 2009 to OFFROAD model’s
estimate of same
• External to model itself
37
Updated 2009 Emissions Inventory
• Third step in process the most challenging
• Simple and straightforward question: how did actual data compare
with model’s estimates for 2009
• Actual data divided by model’s estimate should equal one
• Challenges were two
• Ensuring apples-to-apples comparison
• Adjusting for short-term fluctuations in Activity
38
Updated 2009 Emissions Inventory
• Total gallons of red-dye fuel that Board of Equalization (BOE) reported to
be sold for off-road use in 2009 provided starting point
• 14.59% of that total allocated to construction
• Equal to allocation that Energy Information Agency made in 2008
• Most recent year
• Conservative allocation, as construction industry more depressed
than other sectors in 2009
39
Updated 2009 Emissions Inventory
• 25% of construction equipment’s share of red-dye fuel then added to
that figure – to account for clear fuel that off-road construction
equipment also consumed in 2009
• Most recent year for which BOE has complete data on such fuel is
2006
• In 2004, 2005 and 2006, ratio of clear to red-dye fuel that off-road
equipment consumed ranged from 21.1% to 25.1%
• Selected ratio equal to actual ratio for 2005
40
Updated 2009 Emissions Inventory
• 10% of all fuel that off-road construction equipment consumed in 2009
then added to that figure – to account for mining portion of combined
Construction and Mining category that OFFROAD model addresses
• Necessary for apples-to-apples comparison
• Mining equipment equal to 1% of all equipment in construction and
mining category
• Baker, R., "Characterization of the Off-Road Equipment
Population,“ Eastern Research Group, Final Report to the
California Air Resources Board, December 2008.
• Conservative assumption that mining equipment has significantly
higher Activity and/or Load Factors – together, ten times
construction

41
Updated 2009 Emissions Inventory
• 12.4% of all fuel that construction and mining equipment consumed in
2009 then added to that figure – to account for Airport Ground Support,
Industrial, and Oil Drilling categories of off-road equipment
• Model also addresses, and regulation also covers, those three
categories of off-road diesel equipment
• Model itself yields ratio
• Combined estimate for other three categories relative to estimate
for Construction and Mining
• Also necessary for apples-to-apples comparison
42
Updated 2009 Emissions Inventory
• Hours that operating engineers reported in 2005 and 2009 formed
starting for downward adjustment of Activity
• Activity factor built into model assumed to equal 2005
• Another conservative assumption, as 2005 was peak year for GDP
originating in California construction industry
• Hours that operating engineers reported working fell 39.5% between
that year and 2009
• After accounting for changes in population and mix of equipment over
same period, downward adjustment for drop in Activity came to 32%
43
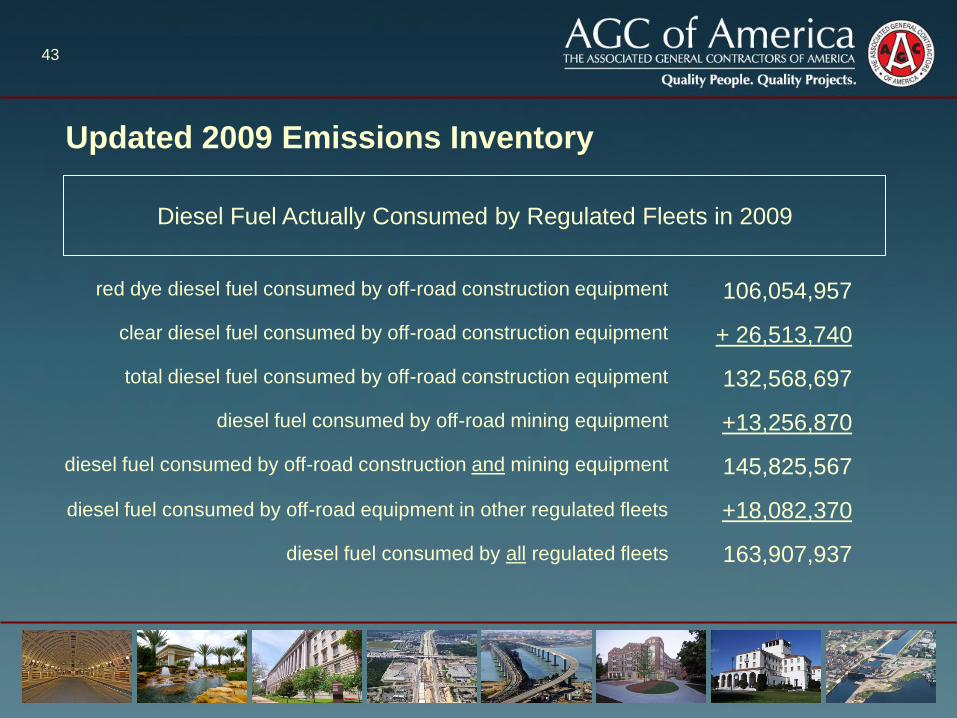
Updated 2009 Emissions Inventory
106,054,957
+ 26,513,740
132,568,697
+13,256,870
145,825,567
+18,082,370
163,907,937
red dye diesel fuel consumed by off-road construction equipment
clear diesel fuel consumed by off-road construction equipment
total diesel fuel consumed by off-road construction equipment
diesel fuel consumed by off-road mining equipment
diesel fuel consumed by off-road construction and mining equipment
diesel fuel consumed by off-road equipment in other regulated fleets
diesel fuel consumed by all regulated fleets
Diesel Fuel Actually Consumed by Regulated Fleets in 2009
44
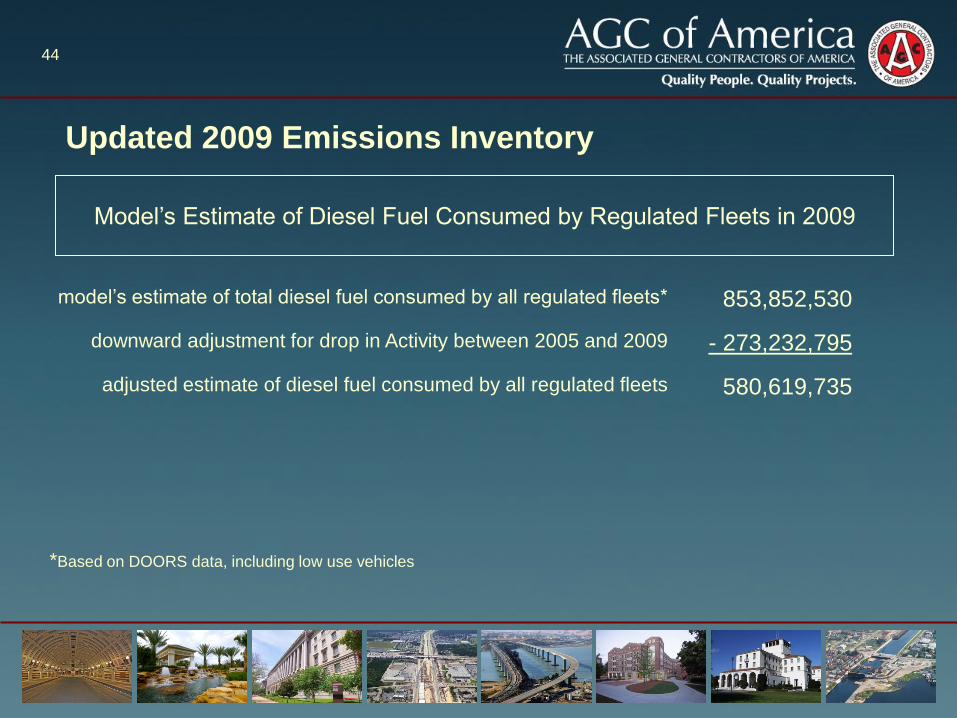
Updated 2009 Emissions Inventory
853,852,530
- 273,232,795
580,619,735
model’s estimate of total diesel fuel consumed by all regulated fleets*
downward adjustment for drop in Activity between 2005 and 2009
adjusted estimate of diesel fuel consumed by all regulated fleets
Model’s Estimate of Diesel Fuel Consumed by Regulated Fleets in 2009
*Based on DOORS data, including low use vehicles

45
Updated 2009 Emissions Inventory
163,907,937
÷ 580,619,735
0.282
total diesel fuel actually consumed by all regulated fleets in 2009
model’s downwardly adjusted
estimate of diesel fuel consumed by all regulated fleets in 2009*
adjustment factor
Actual Fuel Consumption Factor
*Based on DOORS data, including low use vehicles

46
Updated 2009 Emissions Inventory
• Started with original OFFROAD model
• Based on DOORS data, updated inputs for Population, Average
Maximum Horsepower and Age Distribution
• Also applied scaling factor to “low use” equipment
• Applied Actual Fuel Consumption factor
47
Updated 2009 Emissions Inventory
• No adjustment for Activity
• Only used to calculate Actual Fuel Consumption factor
• Same Activity that CARB assumed when it developed its 2000
emissions inventory
• Same Activity that model would assume in absence of any recession
• No change in Growth Factor
• Same Growth Factor that CARB assumed when it developed its 2000
emissions inventory
• Same growth that model would assume in absence of any recession
48
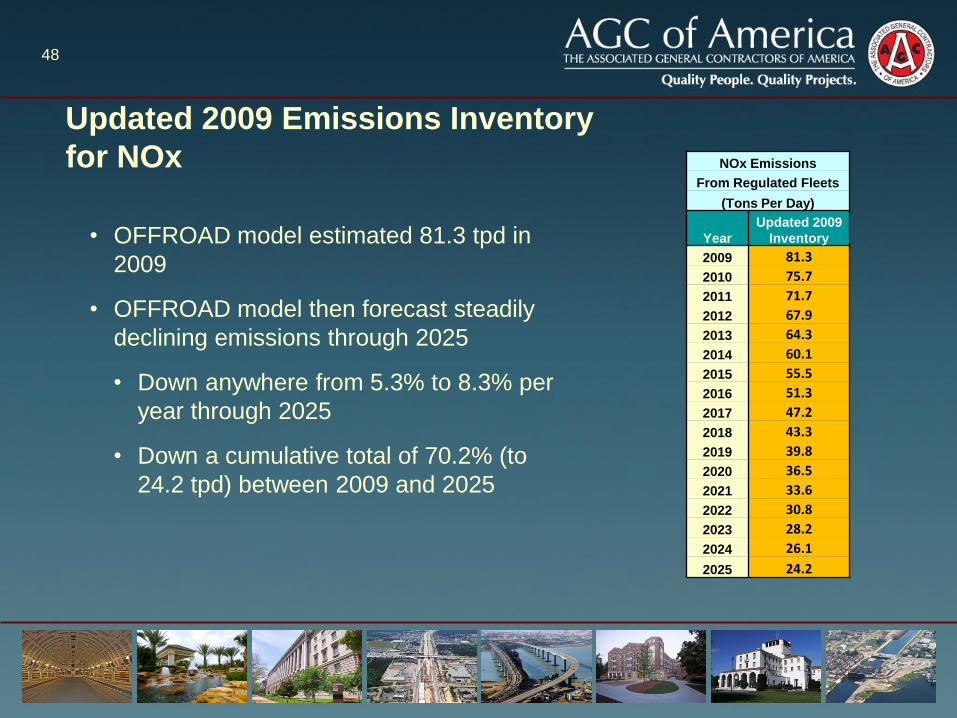
Updated 2009 Emissions Inventory
for NOx
• OFFROAD model estimated 81.3 tpd in
2009
• OFFROAD model then forecast steadily
declining emissions through 2025
• Down anywhere from 5.3% to 8.3% per
year through 2025
• Down a cumulative total of 70.2% (to
24.2 tpd) between 2009 and 2025
NOx Emissions
From Regulated Fleets
(Tons Per Day)
Year
Updated 2009
Inventory
2009 81.3
2010 75.7
2011 71.7
2012 67.9
2013 64.3
2014 60.1
2015 55.5
2016 51.3
2017 47.2
2018 43.3
2019 39.8
2020 36.5
2021 33.6
2022 30.8
2023 28.2
2024 26.1
2025 24.2

49
Updated 2009 Emissions Inventory
for NOx
• Still close to originally forecast rate of
decline in NOx emissions
• 2000 Inventory: 4.3% to 8%
• Updated 2009 Inventory: 5.3% to 8.3%
• Still close to originally forecast decline of
NOx emissions over entire period
• 2000 Inventory: 68.2%
• Updated 2009 Inventory: 70.2%
NOx Emissions
From Regulated Fleets
(Tons Per Day)
Year
2000
Inventory
Updated 2009
Inventory
2009 325.0 81.3
2010 311.0 75.7
2011 294.6 71.7
2012 278.6 67.9
2013 262.8 64.3
2014 246.0 60.1
2015 227.5 55.5
2016 209.9 51.3
2017 193.3 47.2
2018 177.8 43.3
2019 164.0 39.8
2020 150.8 36.5
2021 139.6 33.6
2022 128.8 30.8
2023 119.3 28.2
2024 110.7 26.1
2025 103.2 24.2

50
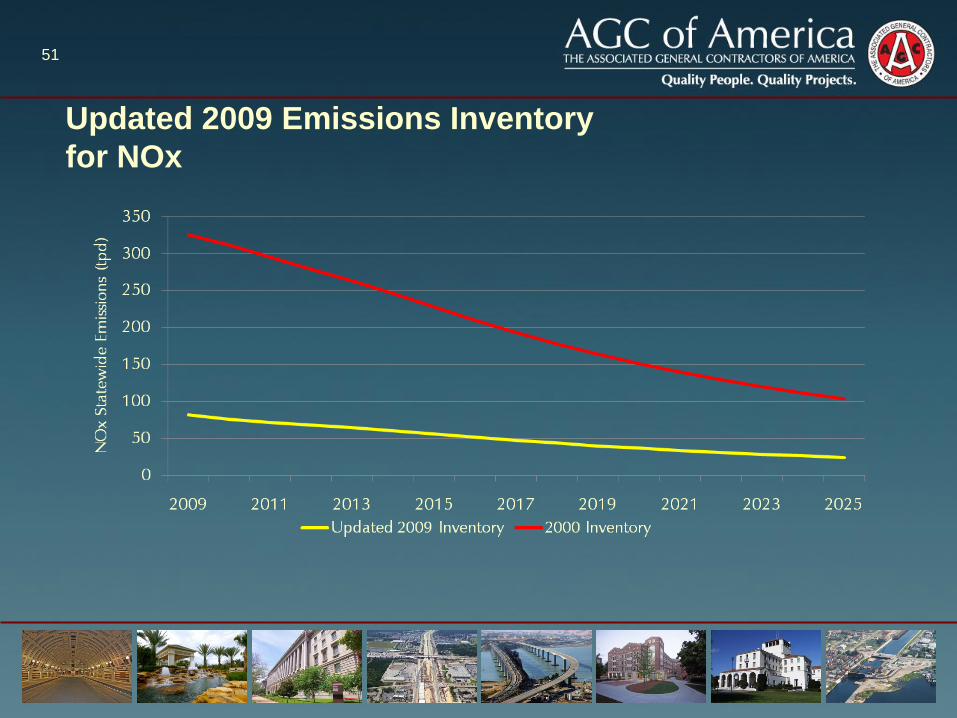
Updated 2009 Emissions Inventory
for NOx
• But even bigger difference between
originally forecast and newly estimated
emissions in 2009
• 2000 Inventory: 325 tpd in 2009
• Updated 2009 Inventory: 81.3 tpd in
2009
NOx Emissions
From Regulated Fleets
(Tons Per Day)
Year
2000
Inventory
Updated 2009
Inventory
2009 325.0 81.3
2010 311.0 75.7
2011 294.6 71.7
2012 278.6 67.9
2013 262.8 64.3
2014 246.0 60.1
2015 227.5 55.5
2016 209.9 51.3
2017 193.3 47.2
2018 177.8 43.3
2019 164.0 39.8
2020 150.8 36.5
2021 139.6 33.6
2022 128.8 30.8
2023 119.3 28.2
2024 110.7 26.1
2025 103.2 24.2
51
Updated 2009 Emissions Inventory
for NOx

52
Updated 2009 Emissions Inventory
for PM
• OFFROAD model estimated 4.34 tpd in
2009
• OFFROAD model then projected steadily
declining emissions through 2025
• Down anywhere from 5.4% to 11.9%
through the year 2025
• Down a cumulative total of 79% (to 0.91
tpd) between 2009 and 2025
PM Emissions
From Regulated Fleets
(Tons Per Day)
Year
Updated 2009
Inventory
2009 4.34
2010 4.03
2011 3.81
2012 3.56
2013 3.31
2014 3.05
2015 2.79
2016 2.54
2017 2.30
2018 2.07
2019 1.85
2020 1.65
2021 1.48
2022 1.31
2023 1.15
2024 1.02
2025 0.91

53
Updated 2009 Emissions Inventory
for PM
• Still close to originally forecast rate of
decline in PM emissions
• 2000 Inventory: 4.6% to 10.2%
• Updated 2009 Inventory: 5.4% to
11.9%
• Also close to originally forecast decline in
PM emissions over entire period
• 2000 Inventory: 76%
• Updated 2009 Inventory: 79%
PM Emissions
From Regulated Fleets
(Tons Per Day)
Year
2000
Inventory
Updated 2009
Inventory
2009 17.49 4.34
2010 16.69 4.03
2011 15.86 3.81
2012 14.82 3.56
2013 13.71 3.31
2014 12.65 3.05
2015 11.54 2.79
2016 10.48 2.54
2017 9.53 2.30
2018 8.56 2.07
2019 7.71 1.85
2020 6.98 1.65
2021 6.29 1.48
2022 5.69 1.31
2023 5.14 1.15
2024 4.64 1.02
2025 4.17 0.91
54
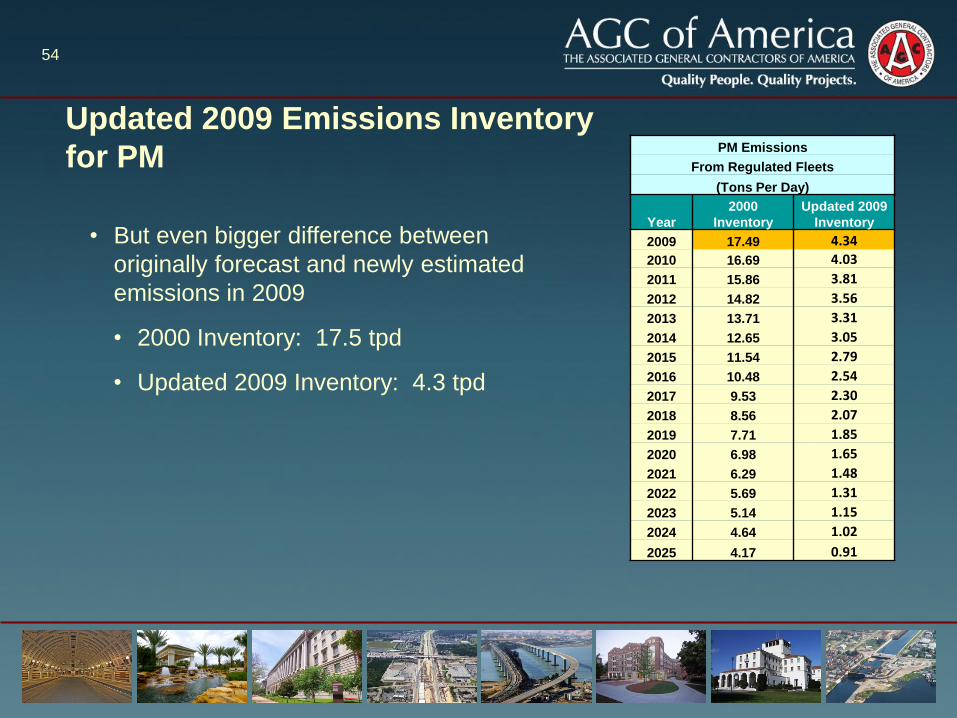
Updated 2009 Emissions Inventory
for PM
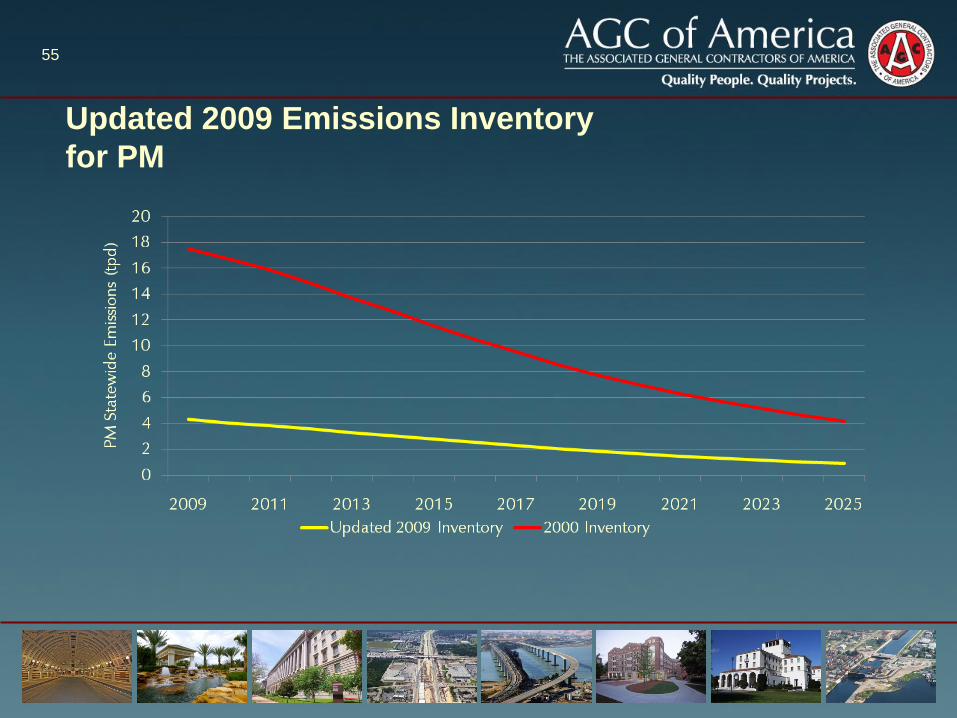
• But even bigger difference between
originally forecast and newly estimated
emissions in 2009
• 2000 Inventory: 17.5 tpd
• Updated 2009 Inventory: 4.3 tpd
PM Emissions
From Regulated Fleets
(Tons Per Day)
Year
2000
Inventory
Updated 2009
Inventory
2009 17.49 4.34
2010 16.69 4.03
2011 15.86 3.81
2012 14.82 3.56
2013 13.71 3.31
2014 12.65 3.05
2015 11.54 2.79
2016 10.48 2.54
2017 9.53 2.30
2018 8.56 2.07
2019 7.71 1.85
2020 6.98 1.65
2021 6.29 1.48
2022 5.69 1.31
2023 5.14 1.15
2024 4.64 1.02
2025 4.17 0.91
55
Updated 2009 Emissions Inventory
for PM

56
Why the Differences
• Updated 2009 emission inventory dramatically differs from 2000
emissions inventory for several reasons
• Population of Equipment: 156,929 versus 191,678
• Low use category of equipment: 100 hours versus 625 hours
• Diesel fuel that regulated fleets actually consume: 163,907,937 versus
580,619,735 in 2009
• After controlling for Population, Average Maximum Horsepower and
Age Distribution, and adjusting for drop in Activity

57
Why the Differences
• NOT recession
• Inventory based on same level of Activity that CARB assumed prior
to recession
• Except to extent that downturn restrained growth in population of off-
road equipment between 2000 and 2009
• NOT forecast of slow economic recovery
• Inventory based on same Growth Factor that CARB applied prior to
recession
58
Conclusions
• CARB has more than enough room to grant AGC’s request for further
relief from the new regulation and still hit, indeed exceed, the Board’s
original targets for emissions from the regulated fleets.
• True for NOx
• Also true for PM
59
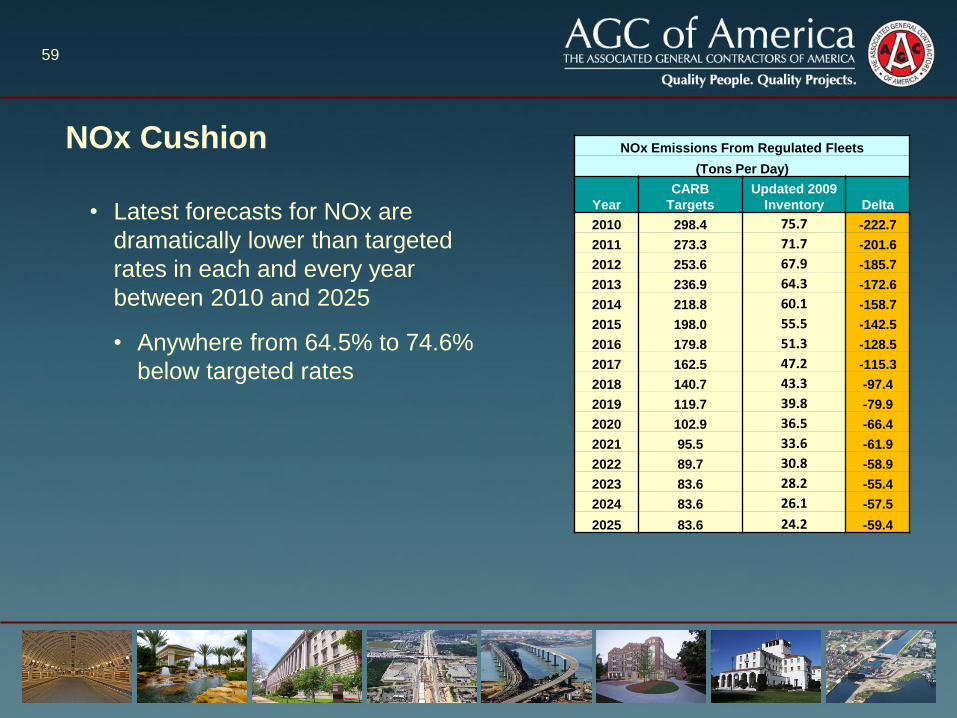
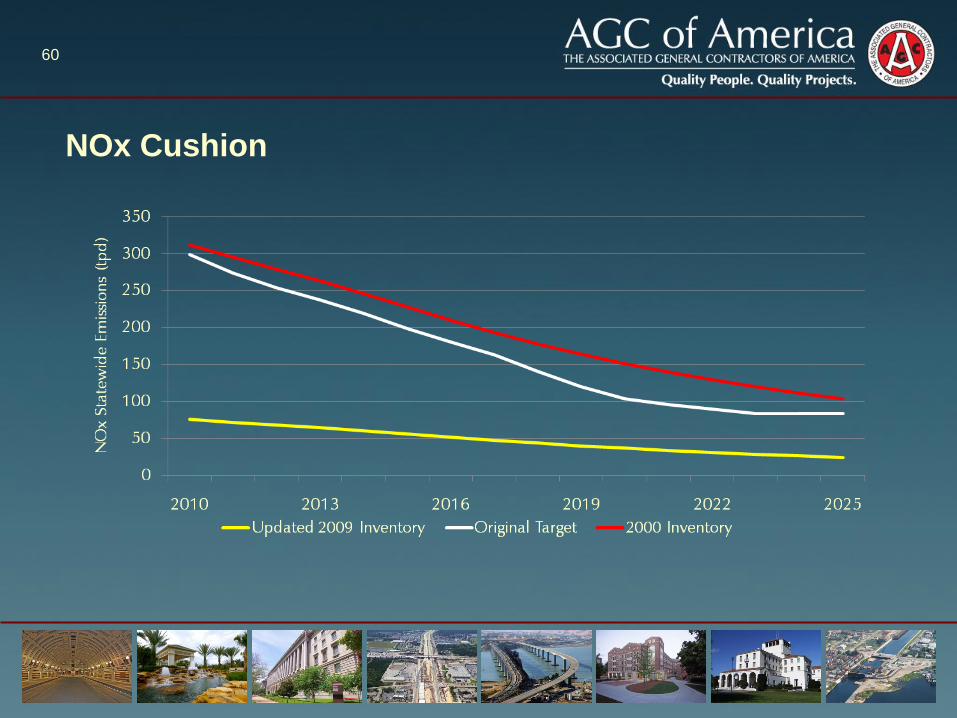
NOx Cushion
• Latest forecasts for NOx are
dramatically lower than targeted
rates in each and every year
between 2010 and 2025
• Anywhere from 64.5% to 74.6%
below targeted rates
NOx Emissions From Regulated Fleets
(Tons Per Day)
Year
CARB
Targets
Updated 2009
Inventory Delta
2010 298.4 75.7 -222.7
2011 273.3 71.7 -201.6
2012 253.6 67.9 -185.7
2013 236.9 64.3 -172.6
2014 218.8 60.1 -158.7
2015 198.0 55.5 -142.5
2016 179.8 51.3 -128.5
2017 162.5 47.2 -115.3
2018 140.7 43.3 -97.4
2019 119.7 39.8 -79.9
2020 102.9 36.5 -66.4
2021 95.5 33.6 -61.9
2022 89.7 30.8 -58.9
2023 83.6 28.2 -55.4
2024 83.6 26.1 -57.5
2025 83.6 24.2 -59.4
60
NOx Cushion
61
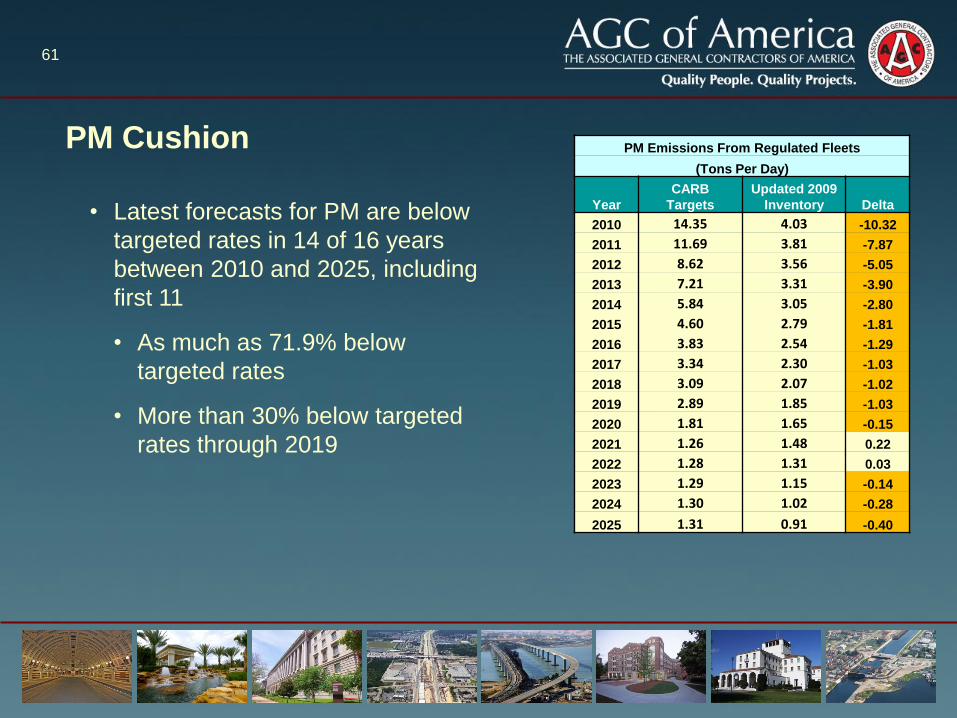
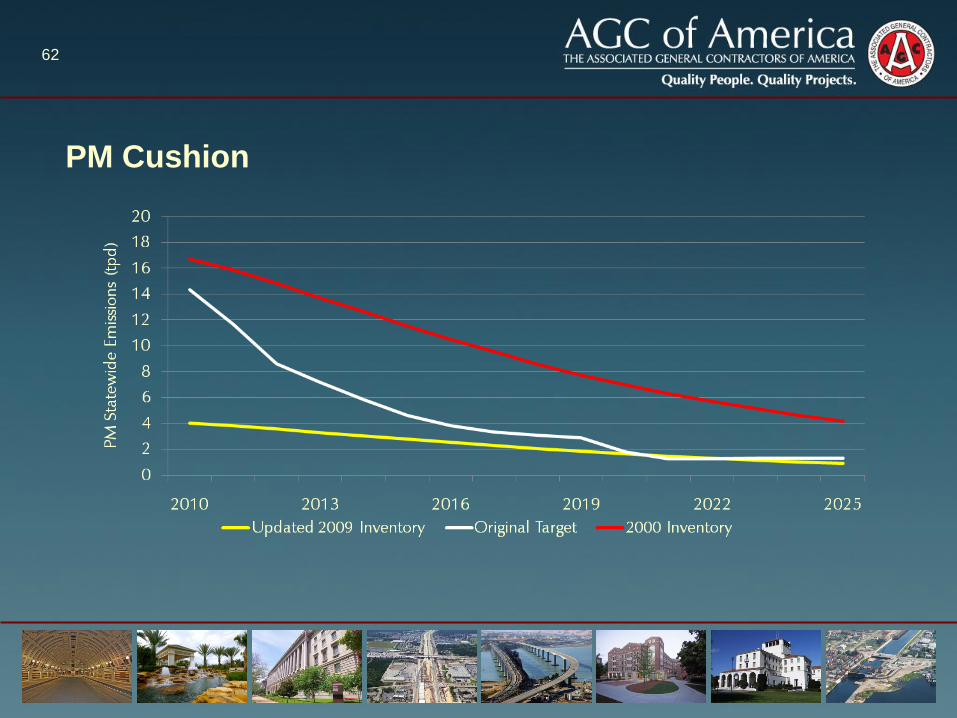
PM Cushion
• Latest forecasts for PM are below
targeted rates in 14 of 16 years
between 2010 and 2025, including
first 11
• As much as 71.9% below
targeted rates
• More than 30% below targeted
rates through 2019
PM Emissions From Regulated Fleets
(Tons Per Day)
Year
CARB
Targets
Updated 2009
Inventory Delta
2010 14.35 4.03 -10.32
2011 11.69 3.81 -7.87
2012 8.62 3.56 -5.05
2013 7.21 3.31 -3.90
2014 5.84 3.05 -2.80
2015 4.60 2.79 -1.81
2016 3.83 2.54 -1.29
2017 3.34 2.30 -1.03
2018 3.09 2.07 -1.02
2019 2.89 1.85 -1.03
2020 1.81 1.65 -0.15
2021 1.26 1.48 0.22
2022 1.28 1.31 0.03
2023 1.29 1.15 -0.14
2024 1.30 1.02 -0.28
2025 1.31 0.91 -0.40
62
PM Cushion
63
Conclusions
• AGC has asked CARB for the following:
• Apply the small fleet requirements to all fleets
• Clarify that exempt vehicles are excluded from all calculations of
horsepower, average fleet emissions and the like
• Create a “safe harbor” for fleet owners at risk of suffering serious
financial harm, capping the expenditure that any one owner would
have to make in any one year
• CARB has emissions cushion to make these changes and still meet,
indeed exceed, its targets for emissions from regulated fleets

Thank you.
Michael E. Kennedy, Esq.
General Counsel
Associated General Contractors of America
2300 Wilson Boulevard, Suite 400
Arlington, VA 22201
Direct: 703-837-5335 Email: [email protected]