Embed Size (px)
Citation preview
LLNL-TR-676618-Draft California GAMA Special Study: Field-based Study of Septic System Impact on Groundwater (A Feasibility Study)
Bradley K. Esser, Jean E. Moran*, Roald Leif and Michael J. Singleton
Lawrence Livermore National Laboratory *California State University, East Bay
September, 2007 Draft Report for the California State Water Resources Control Board GAMA Special Studies Task 5.1: Field-based Studies of Water Quality Impacts of Septic Systems to Groundwater Basins

Disclaimer This document was prepared as an account of work sponsored by an agency of the United States government. Neither the United States government nor Lawrence Livermore National Security, LLC, nor any of their employees makes any warranty, expressed or implied, or assumes any legal liability or responsibility for the accuracy, completeness, or usefulness of any information, apparatus, product, or process disclosed, or represents that its use would not infringe privately owned rights. Reference herein to any specific commercial product, process, or service by trade name, trademark, manufacturer, or otherwise does not necessarily constitute or imply its endorsement, recommendation, or favoring by the United States government or Lawrence Livermore National Security, LLC. The views and opinions of authors expressed herein do not necessarily state or reflect those of the United States government or Lawrence Livermore National Security, LLC, and shall not be used for advertising or product endorsement purposes.
Auspices Statement This work performed under the auspices of the U.S. Department of Energy by Lawrence Livermore National Laboratory under Contract DE-AC52-07NA27344.
GAMA: AMBIENT GROUNDWATER MONITORING & ASSESSMENT PROGRAM
SPECIAL STUDY
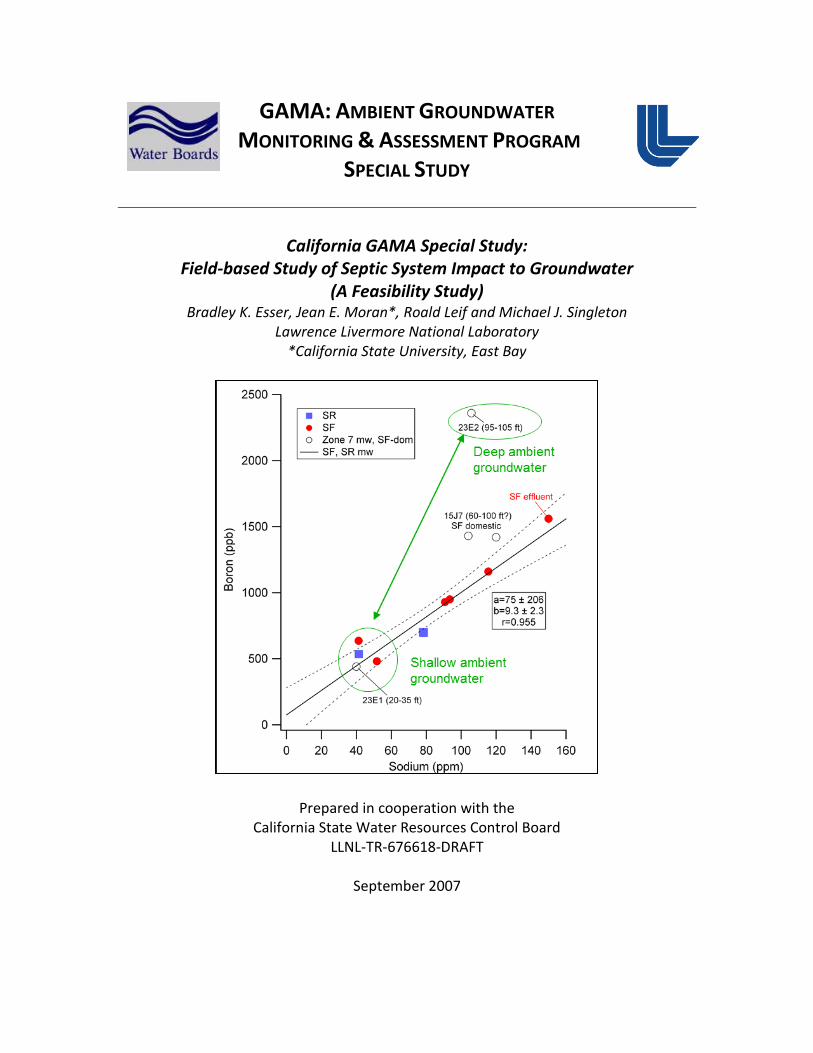
California GAMA Special Study:
Field-based Study of Septic System Impact to Groundwater (A Feasibility Study)
Bradley K. Esser, Jean E. Moran*, Roald Leif and Michael J. Singleton Lawrence Livermore National Laboratory
*California State University, East Bay
Prepared in cooperation with the California State Water Resources Control Board
LLNL-TR-676618-DRAFT
September 2007

Suggested citation: Bradley K. Esser, Jean E. Moran*, Roald Leif and Michael J. Singleton (2007) California GAMA Special Study: Field-based study of septic system impact on groundwater (A feasibility study). Lawrence Livermore National Laboratory LLNL-TR-676618, 23 pp.
Field-based study of septic system impact on groundwater (A feasibility study)
LLNL-TR-676618-DRAFT 1
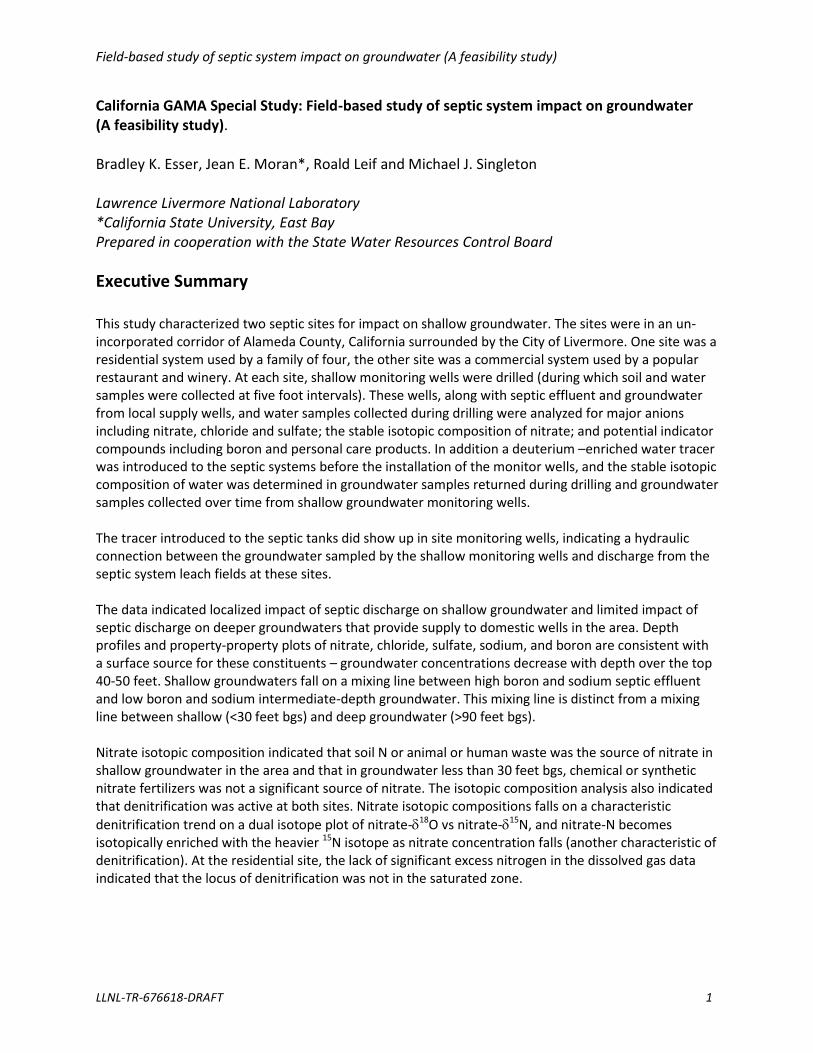
California GAMA Special Study: Field-based study of septic system impact on groundwater (A feasibility study). Bradley K. Esser, Jean E. Moran*, Roald Leif and Michael J. Singleton Lawrence Livermore National Laboratory *California State University, East Bay Prepared in cooperation with the State Water Resources Control Board
Executive Summary This study characterized two septic sites for impact on shallow groundwater. The sites were in an un-incorporated corridor of Alameda County, California surrounded by the City of Livermore. One site was a residential system used by a family of four, the other site was a commercial system used by a popular restaurant and winery. At each site, shallow monitoring wells were drilled (during which soil and water samples were collected at five foot intervals). These wells, along with septic effluent and groundwater from local supply wells, and water samples collected during drilling were analyzed for major anions including nitrate, chloride and sulfate; the stable isotopic composition of nitrate; and potential indicator compounds including boron and personal care products. In addition a deuterium –enriched water tracer was introduced to the septic systems before the installation of the monitor wells, and the stable isotopic composition of water was determined in groundwater samples returned during drilling and groundwater samples collected over time from shallow groundwater monitoring wells. The tracer introduced to the septic tanks did show up in site monitoring wells, indicating a hydraulic connection between the groundwater sampled by the shallow monitoring wells and discharge from the septic system leach fields at these sites. The data indicated localized impact of septic discharge on shallow groundwater and limited impact of septic discharge on deeper groundwaters that provide supply to domestic wells in the area. Depth profiles and property-property plots of nitrate, chloride, sulfate, sodium, and boron are consistent with a surface source for these constituents – groundwater concentrations decrease with depth over the top 40-50 feet. Shallow groundwaters fall on a mixing line between high boron and sodium septic effluent and low boron and sodium intermediate-depth groundwater. This mixing line is distinct from a mixing line between shallow (<30 feet bgs) and deep groundwater (>90 feet bgs). Nitrate isotopic composition indicated that soil N or animal or human waste was the source of nitrate in shallow groundwater in the area and that in groundwater less than 30 feet bgs, chemical or synthetic nitrate fertilizers was not a significant source of nitrate. The isotopic composition analysis also indicated that denitrification was active at both sites. Nitrate isotopic compositions falls on a characteristic
denitrification trend on a dual isotope plot of nitrate-18O vs nitrate-15N, and nitrate-N becomes isotopically enriched with the heavier 15N isotope as nitrate concentration falls (another characteristic of denitrification). At the residential site, the lack of significant excess nitrogen in the dissolved gas data indicated that the locus of denitrification was not in the saturated zone.
Esser, Moran, Leif and Singleton (2007)
2 California GAMA Special Study
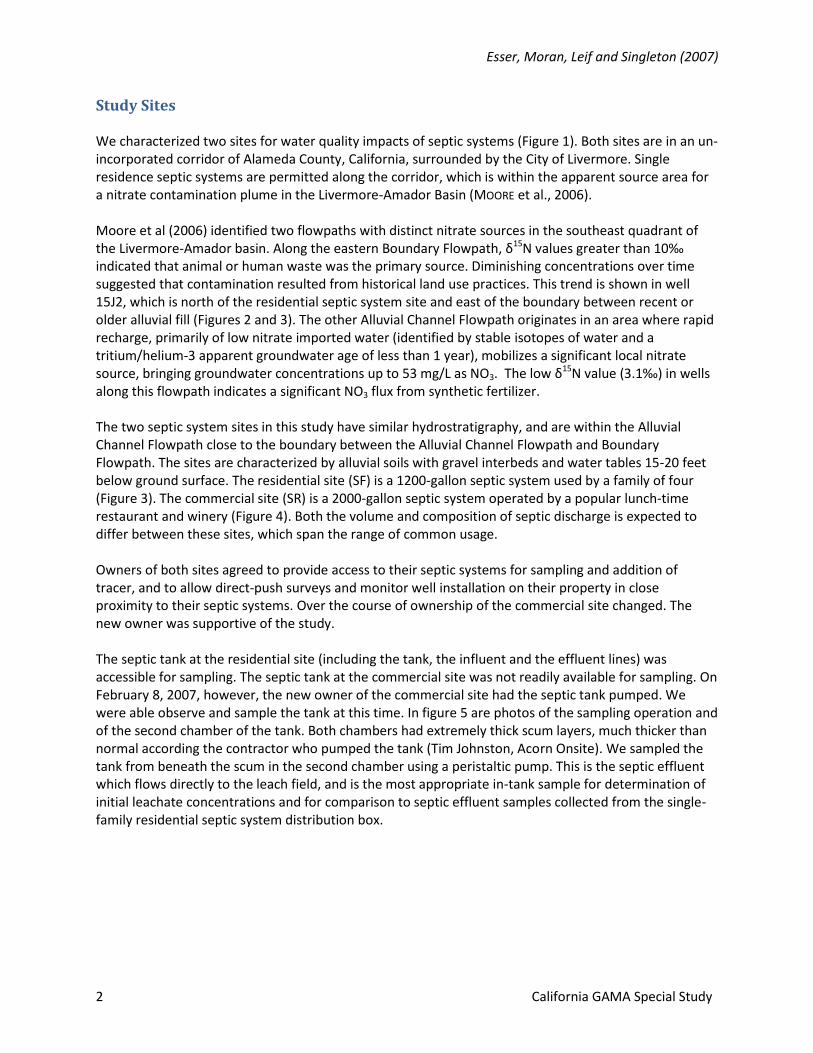
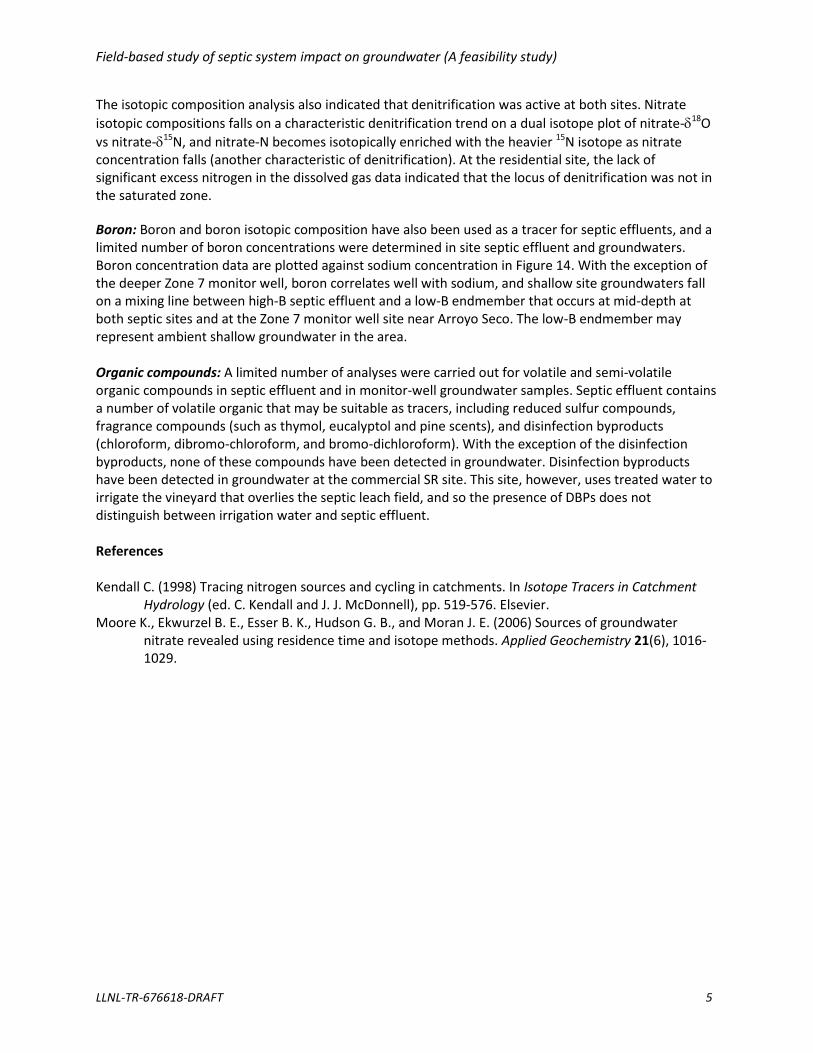
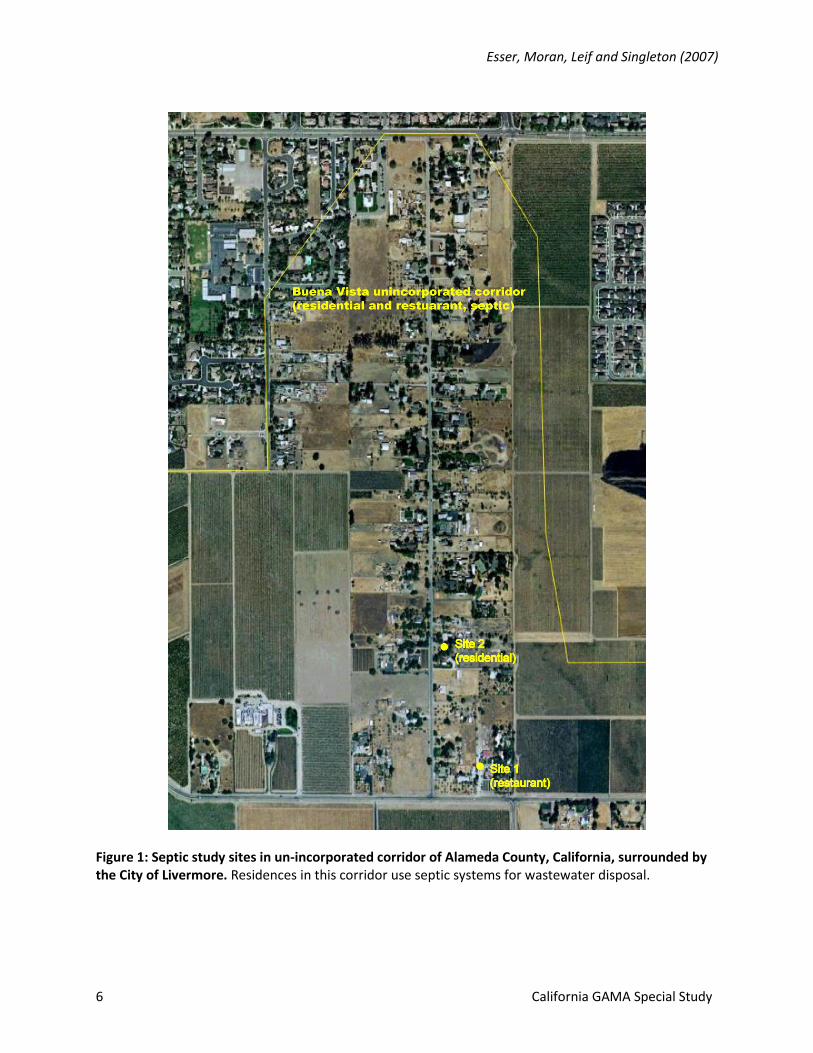
Study Sites We characterized two sites for water quality impacts of septic systems (Figure 1). Both sites are in an un-incorporated corridor of Alameda County, California, surrounded by the City of Livermore. Single residence septic systems are permitted along the corridor, which is within the apparent source area for a nitrate contamination plume in the Livermore-Amador Basin (MOORE et al., 2006). Moore et al (2006) identified two flowpaths with distinct nitrate sources in the southeast quadrant of the Livermore-Amador basin. Along the eastern Boundary Flowpath, δ15N values greater than 10‰ indicated that animal or human waste was the primary source. Diminishing concentrations over time suggested that contamination resulted from historical land use practices. This trend is shown in well 15J2, which is north of the residential septic system site and east of the boundary between recent or older alluvial fill (Figures 2 and 3). The other Alluvial Channel Flowpath originates in an area where rapid recharge, primarily of low nitrate imported water (identified by stable isotopes of water and a tritium/helium-3 apparent groundwater age of less than 1 year), mobilizes a significant local nitrate source, bringing groundwater concentrations up to 53 mg/L as NO3. The low δ15N value (3.1‰) in wells along this flowpath indicates a significant NO3 flux from synthetic fertilizer.
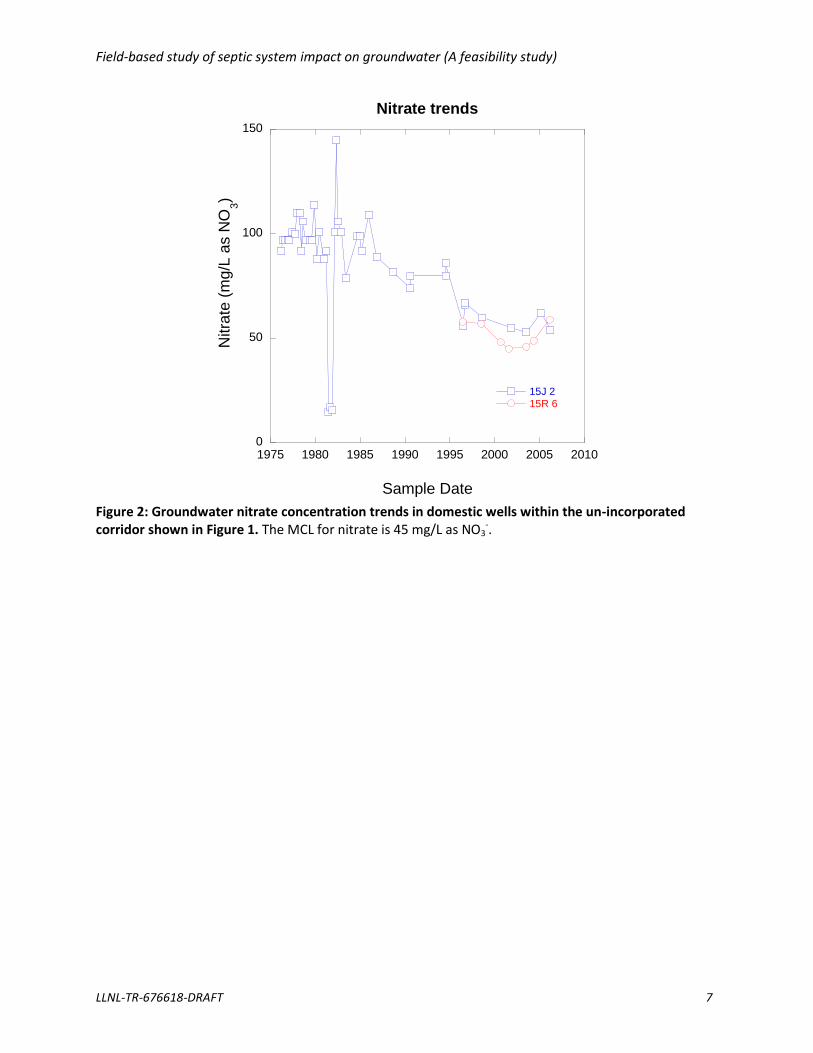
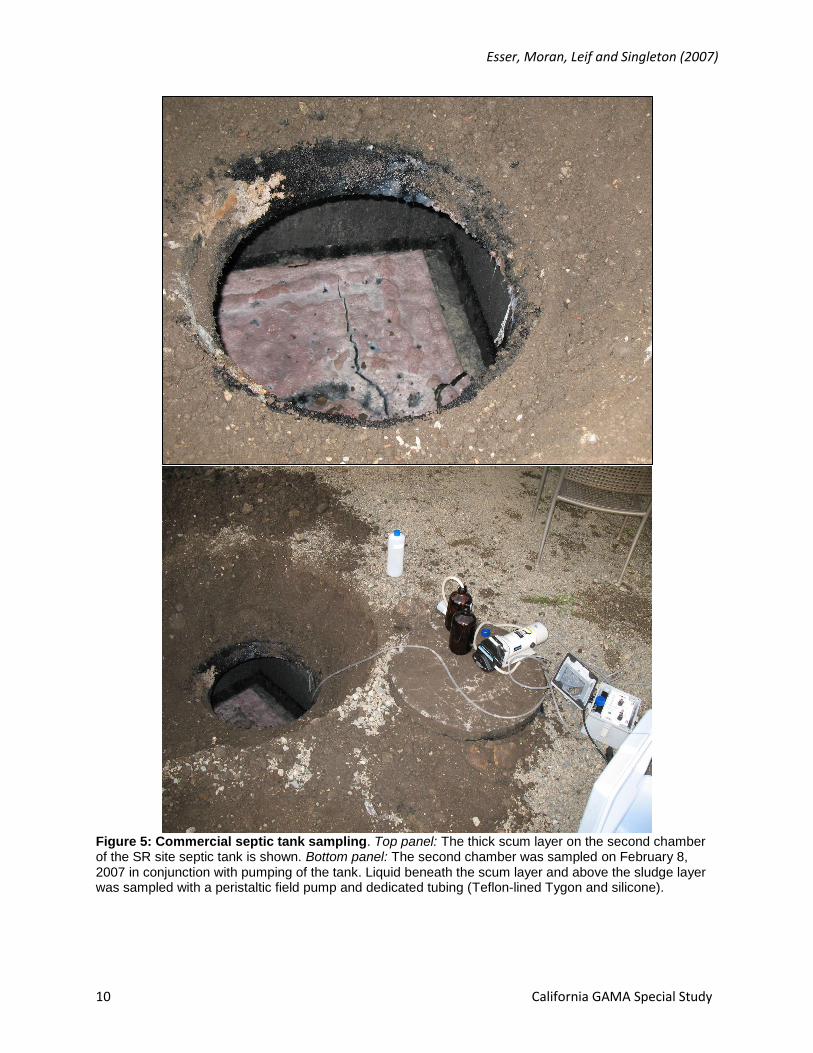
The two septic system sites in this study have similar hydrostratigraphy, and are within the Alluvial Channel Flowpath close to the boundary between the Alluvial Channel Flowpath and Boundary Flowpath. The sites are characterized by alluvial soils with gravel interbeds and water tables 15-20 feet below ground surface. The residential site (SF) is a 1200-gallon septic system used by a family of four (Figure 3). The commercial site (SR) is a 2000-gallon septic system operated by a popular lunch-time restaurant and winery (Figure 4). Both the volume and composition of septic discharge is expected to differ between these sites, which span the range of common usage. Owners of both sites agreed to provide access to their septic systems for sampling and addition of tracer, and to allow direct-push surveys and monitor well installation on their property in close proximity to their septic systems. Over the course of ownership of the commercial site changed. The new owner was supportive of the study. The septic tank at the residential site (including the tank, the influent and the effluent lines) was accessible for sampling. The septic tank at the commercial site was not readily available for sampling. On February 8, 2007, however, the new owner of the commercial site had the septic tank pumped. We were able observe and sample the tank at this time. In figure 5 are photos of the sampling operation and of the second chamber of the tank. Both chambers had extremely thick scum layers, much thicker than normal according the contractor who pumped the tank (Tim Johnston, Acorn Onsite). We sampled the tank from beneath the scum in the second chamber using a peristaltic pump. This is the septic effluent which flows directly to the leach field, and is the most appropriate in-tank sample for determination of initial leachate concentrations and for comparison to septic effluent samples collected from the single-family residential septic system distribution box.
Field-based study of septic system impact on groundwater (A feasibility study)
LLNL-TR-676618-DRAFT 3
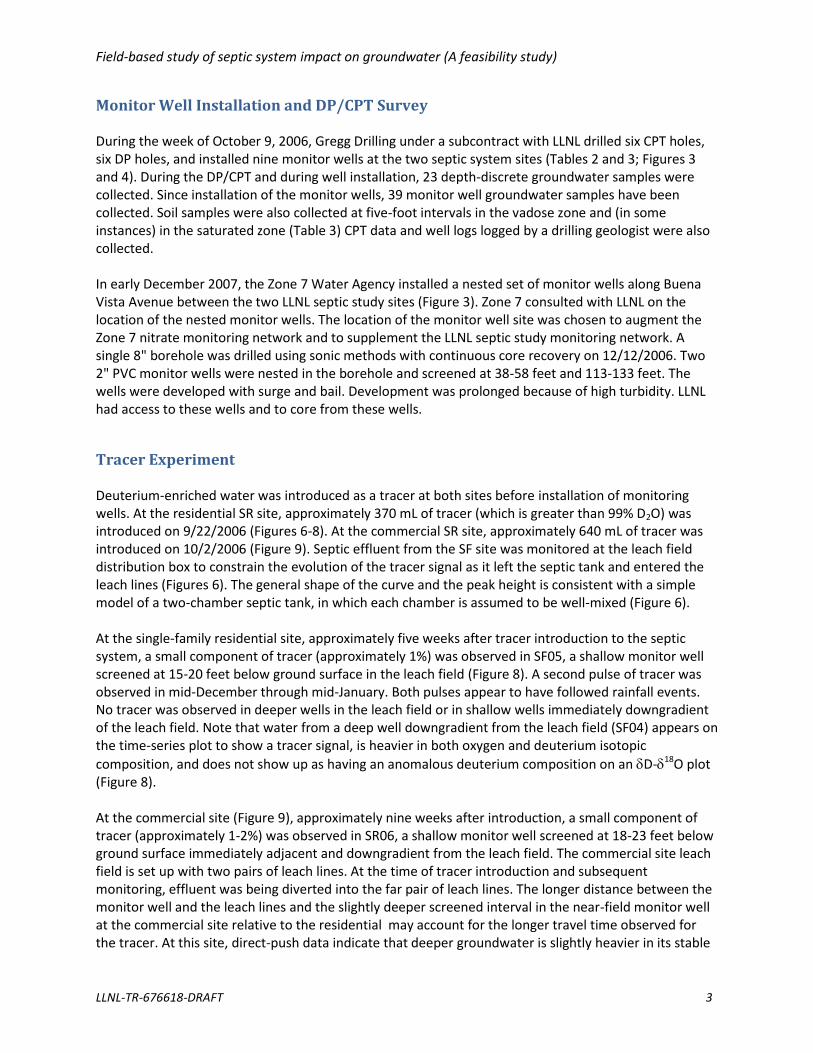
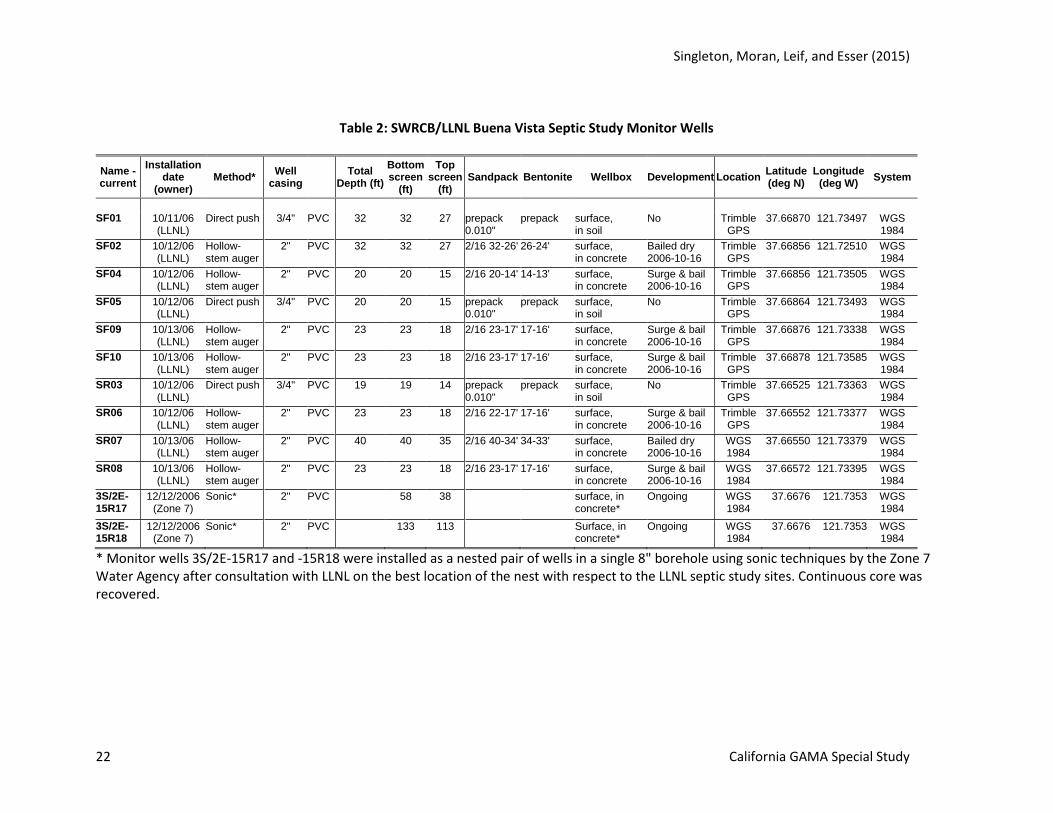
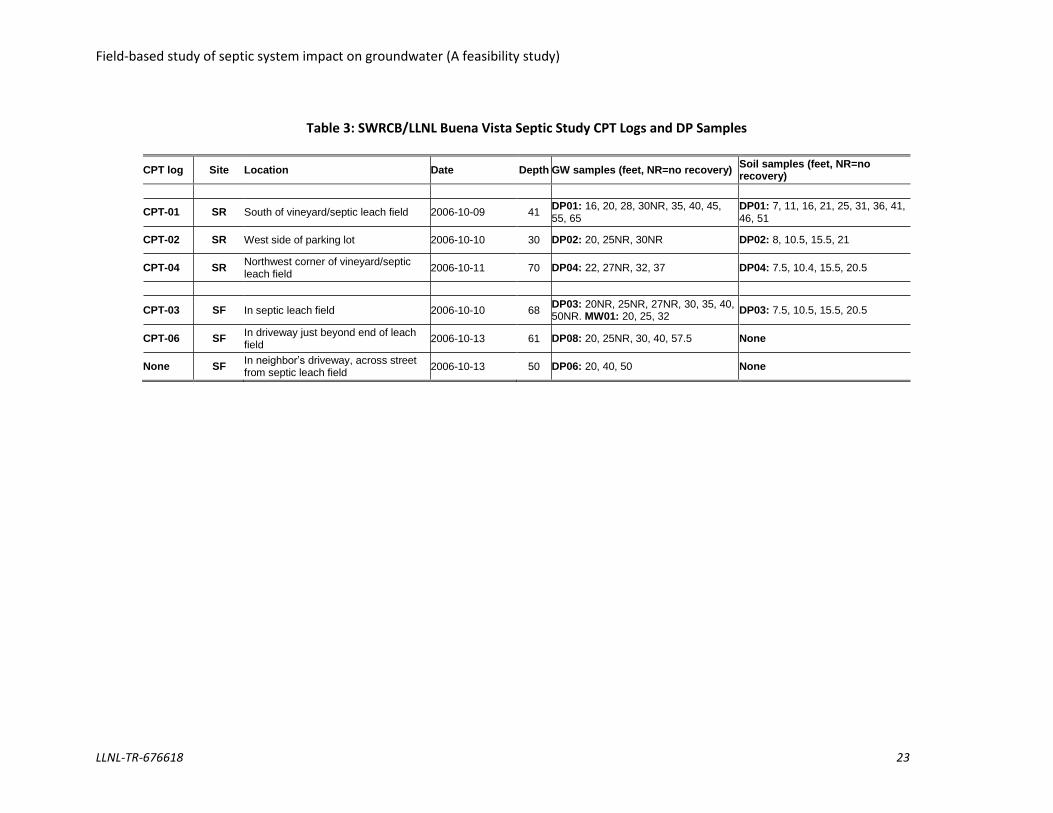
Monitor Well Installation and DP/CPT Survey During the week of October 9, 2006, Gregg Drilling under a subcontract with LLNL drilled six CPT holes, six DP holes, and installed nine monitor wells at the two septic system sites (Tables 2 and 3; Figures 3 and 4). During the DP/CPT and during well installation, 23 depth-discrete groundwater samples were collected. Since installation of the monitor wells, 39 monitor well groundwater samples have been collected. Soil samples were also collected at five-foot intervals in the vadose zone and (in some instances) in the saturated zone (Table 3) CPT data and well logs logged by a drilling geologist were also collected. In early December 2007, the Zone 7 Water Agency installed a nested set of monitor wells along Buena Vista Avenue between the two LLNL septic study sites (Figure 3). Zone 7 consulted with LLNL on the location of the nested monitor wells. The location of the monitor well site was chosen to augment the Zone 7 nitrate monitoring network and to supplement the LLNL septic study monitoring network. A single 8" borehole was drilled using sonic methods with continuous core recovery on 12/12/2006. Two 2" PVC monitor wells were nested in the borehole and screened at 38-58 feet and 113-133 feet. The wells were developed with surge and bail. Development was prolonged because of high turbidity. LLNL had access to these wells and to core from these wells.
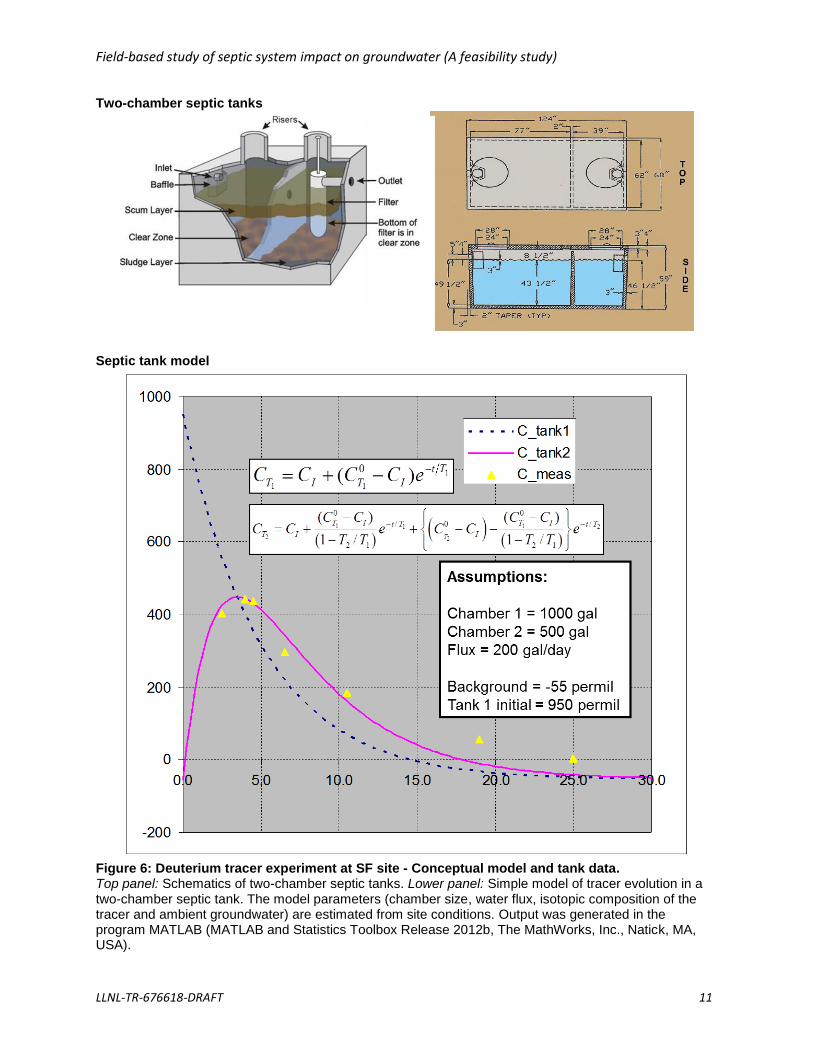
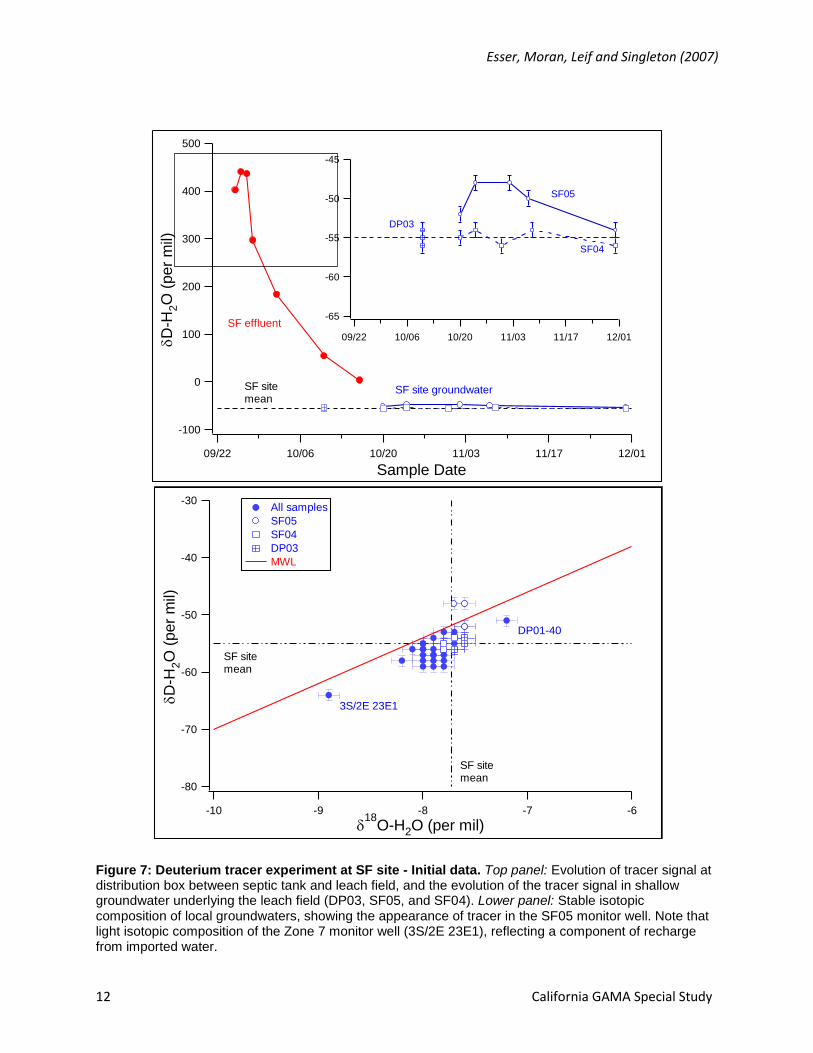
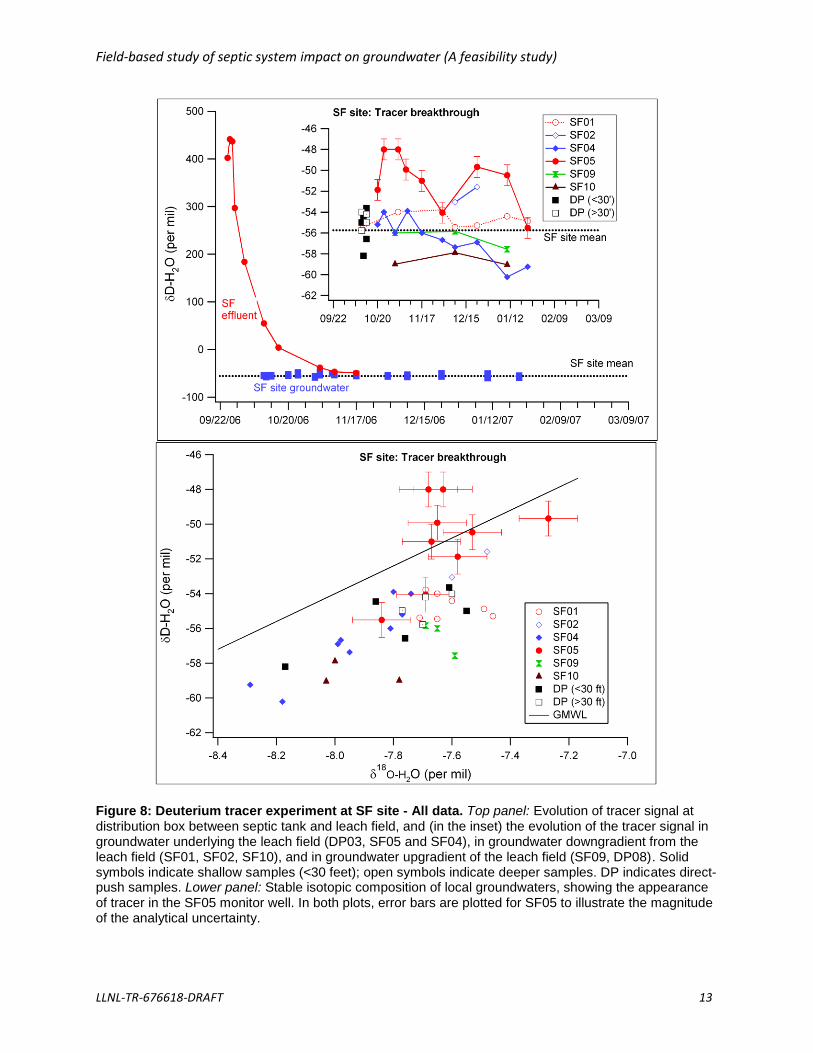
Tracer Experiment Deuterium-enriched water was introduced as a tracer at both sites before installation of monitoring wells. At the residential SR site, approximately 370 mL of tracer (which is greater than 99% D2O) was introduced on 9/22/2006 (Figures 6-8). At the commercial SR site, approximately 640 mL of tracer was introduced on 10/2/2006 (Figure 9). Septic effluent from the SF site was monitored at the leach field distribution box to constrain the evolution of the tracer signal as it left the septic tank and entered the leach lines (Figures 6). The general shape of the curve and the peak height is consistent with a simple model of a two-chamber septic tank, in which each chamber is assumed to be well-mixed (Figure 6). At the single-family residential site, approximately five weeks after tracer introduction to the septic system, a small component of tracer (approximately 1%) was observed in SF05, a shallow monitor well screened at 15-20 feet below ground surface in the leach field (Figure 8). A second pulse of tracer was observed in mid-December through mid-January. Both pulses appear to have followed rainfall events. No tracer was observed in deeper wells in the leach field or in shallow wells immediately downgradient of the leach field. Note that water from a deep well downgradient from the leach field (SF04) appears on the time-series plot to show a tracer signal, is heavier in both oxygen and deuterium isotopic
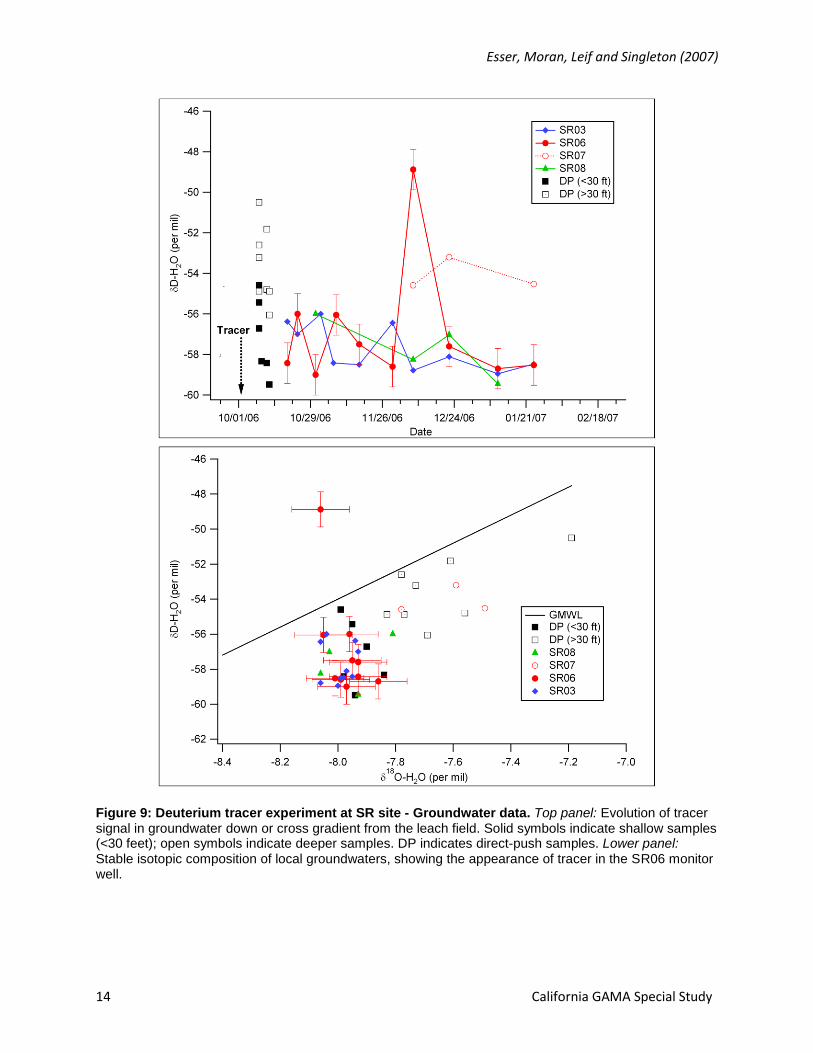
composition, and does not show up as having an anomalous deuterium composition on an D-18O plot (Figure 8). At the commercial site (Figure 9), approximately nine weeks after introduction, a small component of tracer (approximately 1-2%) was observed in SR06, a shallow monitor well screened at 18-23 feet below ground surface immediately adjacent and downgradient from the leach field. The commercial site leach field is set up with two pairs of leach lines. At the time of tracer introduction and subsequent monitoring, effluent was being diverted into the far pair of leach lines. The longer distance between the monitor well and the leach lines and the slightly deeper screened interval in the near-field monitor well at the commercial site relative to the residential may account for the longer travel time observed for the tracer. At this site, direct-push data indicate that deeper groundwater is slightly heavier in its stable

Esser, Moran, Leif and Singleton (2007)
4 California GAMA Special Study
isotopic composition than shallower groundwater at this site (Figure 9). The SR07 well, which appears to have a higher deuterium content than the shallow groundwater monitor wells, samples this deeper groundwater and does not appear to have an anomalous deuterium content indicative of a tracer
component when plotted on a D-18O plot.
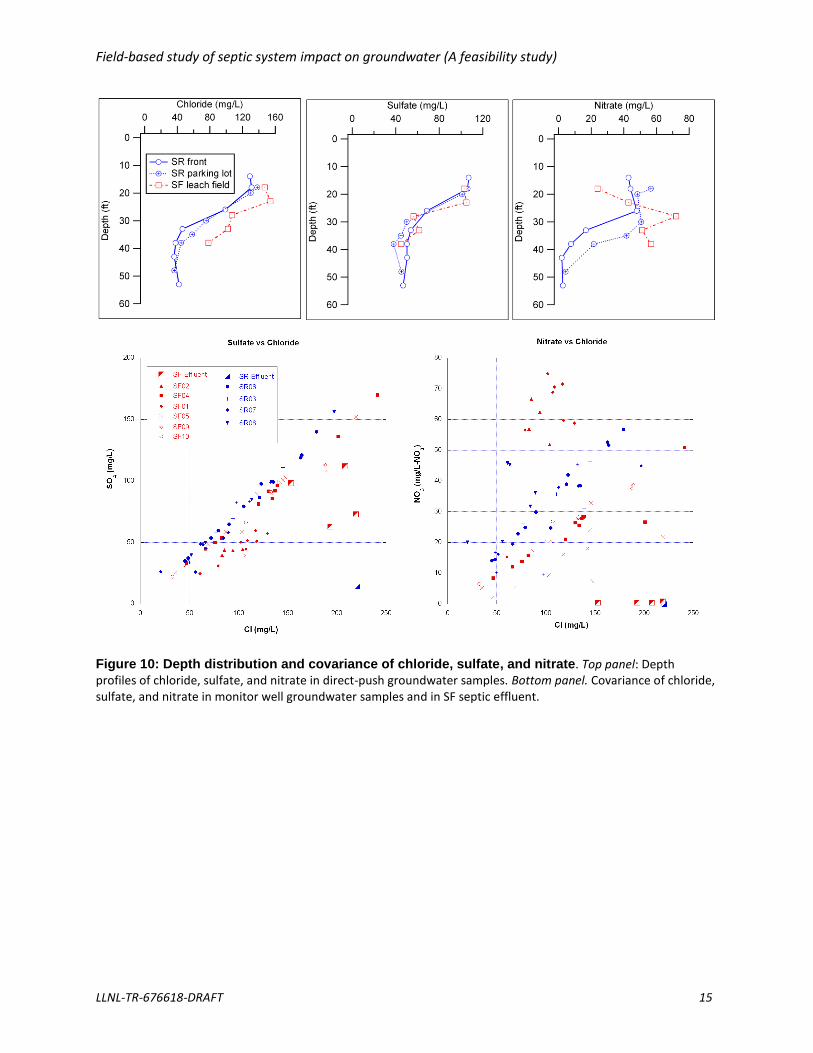
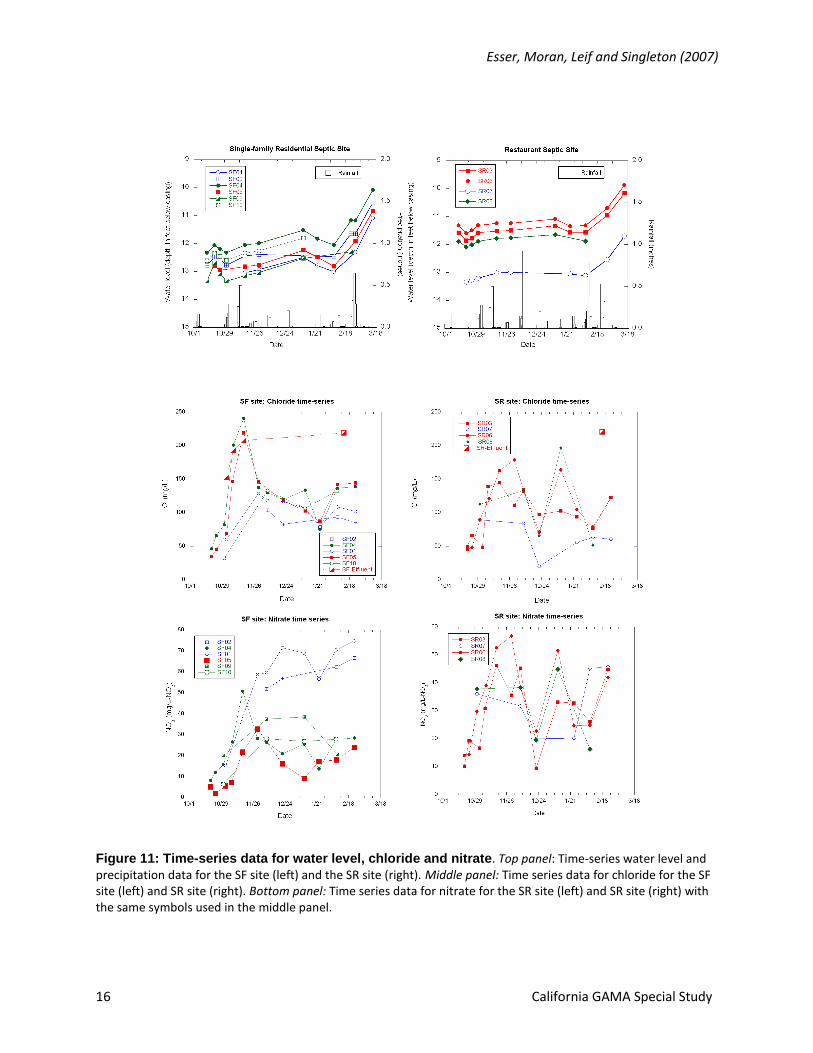
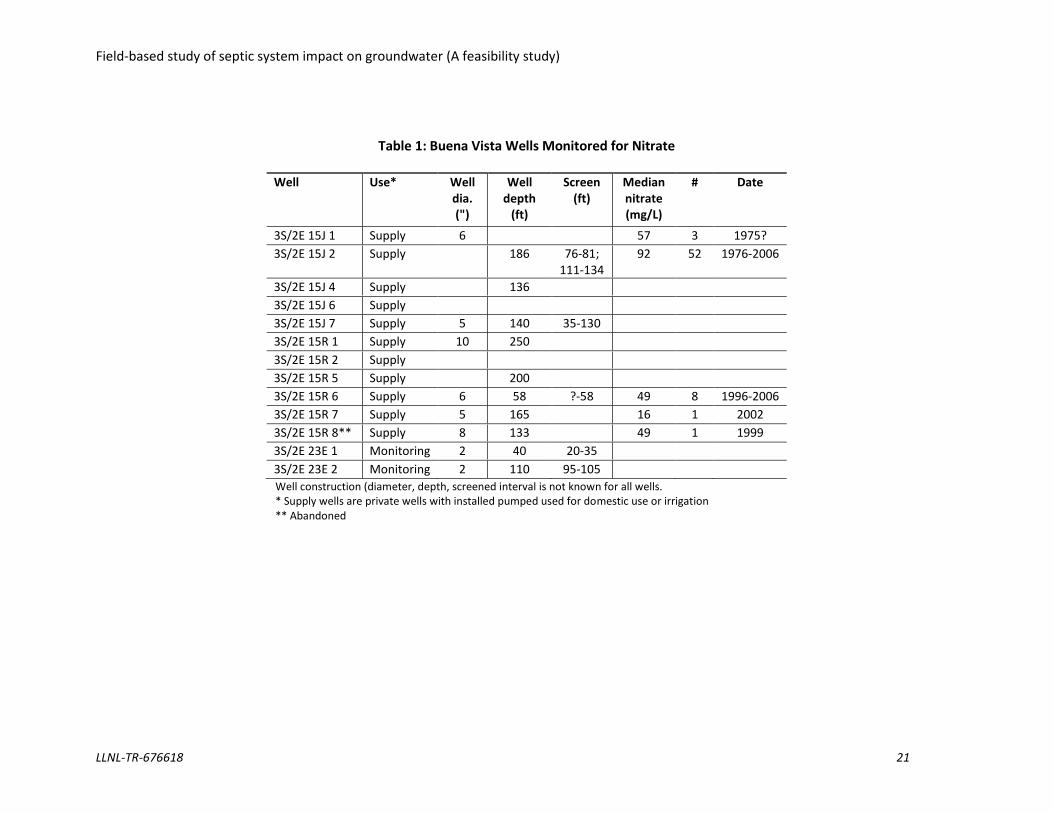
Spatial and temporal patterns in groundwater chemical composition and isotopic composition: A number of supply wells are active in the area (Table 1). Six wells were identified for sampling in the two areas (see figures 3 and 4). Note that well 15R8, which is on the property of the commercial septic system and which in 1999 had a nitrate concentration of 49 mg/L (as NO3), had been abandoned and was not accessible. Supply wells 15J7, 15R5, and a nested pair of Zone 7 Water Agency monitor wells (23E1 and 23E2) that are south of the commercial site within the recharge area for the Alluvial Boundary Flowpath were samples. Wells 15J6, 15R6, 15R2, and 15R1 were also sampled. Nitrate, chloride and sulfate: Chloride, sulfate and nitrate are vertically stratified in first-encounter groundwaters at both sites (Figure 10). Both chloride and sulfate strongly co-vary in direct-push depth profiles, with concentrations that drop sharply with depth, especially between 20 and 30 feet bgs. This strong correlation is also seen in chloride-sulfate plots of monitor-well samples. SF effluent samples have chloride concentration higher than the majority of shallow groundwater samples. Nitrate displays more complex behavior (Figure 10). At the SR site, nitrate is strongly correlated with both chloride and sulfate, and has a similar depth distribution (supporting a septic system leach field discharge as a proximal surface source for nitrate and chloride in first-encounter groundwater at this site). At the SF site in the saturated zone directly beneath the leach field, nitrate does not monotonically decrease with depth, but rather has a subsurface maximum. Shallow monitor wells screened between 18 and 23 feet bgs at the SR site all show a strong correlation between chloride and nitrate. Deeper SR monitor wells screened between 27 and 32 feet (an interval which captures the subsurface nitrate maximum) have distinctly higher nitrate concentrations than shallower groundwaters with similar chloride contents. These waters also show poor correlation with chloride. Ammonia was not detectable in the groundwater samples. The larger range in concentration for nitrate, sulfate and chloride observed in monitor well samples relative to DP samples is driven by temporal changes in groundwater concentrations over a two month period. The temporal variation in groundwater chemical composition is shown in Figure 11. Both chloride and in nitrate rise significantly following the first significant rainfall of the 2006-2007 water year. The rises are more pronounced in shallow wells (screened at 15-20 feet bgs) than in deeper wells (>30 feet bgs). The temporal patterns of nitrate and chloride are more similar at the SR site than at the SF site. These observations are consistent with a significant surface source for nitrate. Nitrate isotopic composition: The use of nitrate isotopic composition to constrain groundwater nitrate sources and chemistry is illustrated in Figures 12 and 13. Nitrate isotopics indicate that soil N or animal or human waste is the source of nitrate in shallow groundwater in the area. In groundwater less than 30 feet bgs, chemical or synthetic nitrate fertilizers do not appear to be a significant source of nitrate.
These groundwaters do not have enriched nitrate-18O signatures characteristic of chemical nitrate fertilizers.
Field-based study of septic system impact on groundwater (A feasibility study)
LLNL-TR-676618-DRAFT 5
The isotopic composition analysis also indicated that denitrification was active at both sites. Nitrate
isotopic compositions falls on a characteristic denitrification trend on a dual isotope plot of nitrate-18O
vs nitrate-15N, and nitrate-N becomes isotopically enriched with the heavier 15N isotope as nitrate concentration falls (another characteristic of denitrification). At the residential site, the lack of significant excess nitrogen in the dissolved gas data indicated that the locus of denitrification was not in the saturated zone.
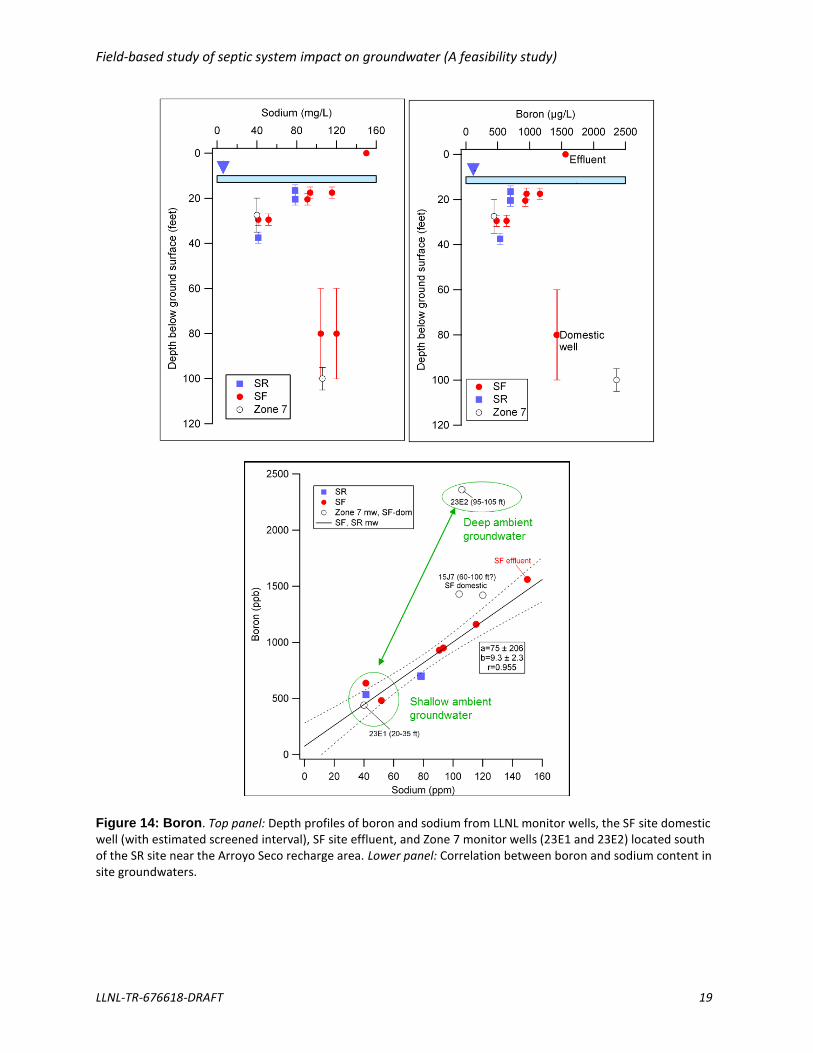
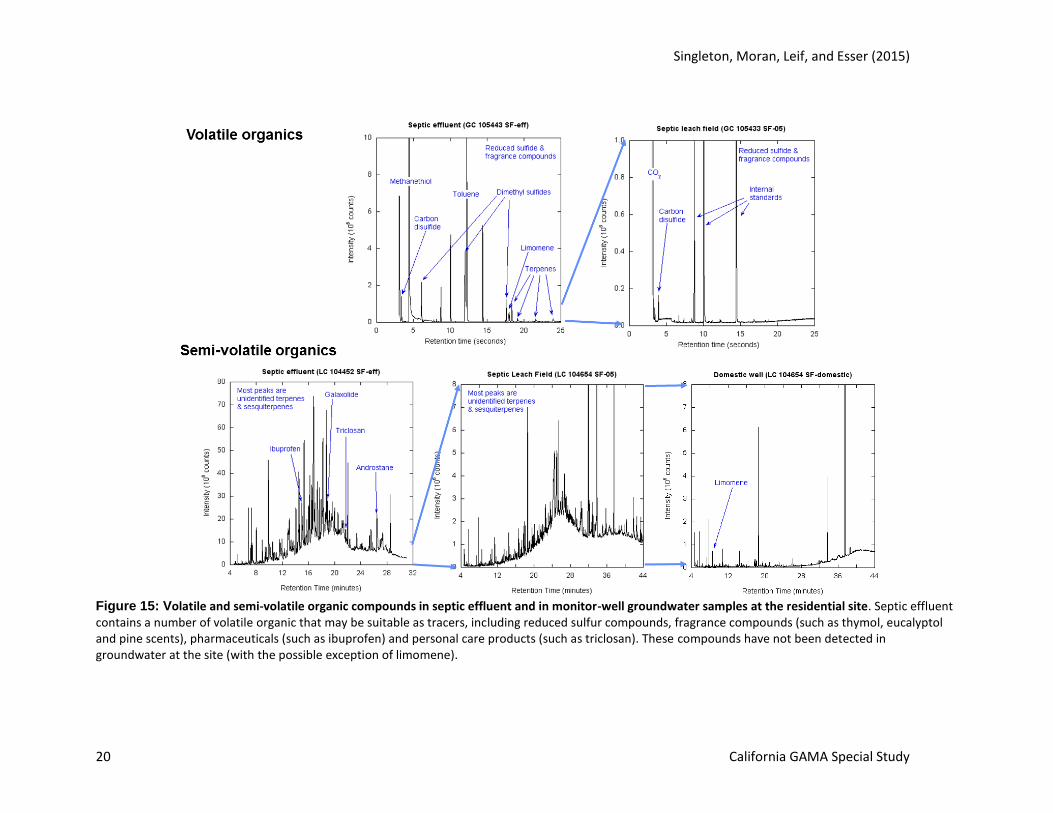
Boron: Boron and boron isotopic composition have also been used as a tracer for septic effluents, and a limited number of boron concentrations were determined in site septic effluent and groundwaters. Boron concentration data are plotted against sodium concentration in Figure 14. With the exception of the deeper Zone 7 monitor well, boron correlates well with sodium, and shallow site groundwaters fall on a mixing line between high-B septic effluent and a low-B endmember that occurs at mid-depth at both septic sites and at the Zone 7 monitor well site near Arroyo Seco. The low-B endmember may represent ambient shallow groundwater in the area. Organic compounds: A limited number of analyses were carried out for volatile and semi-volatile organic compounds in septic effluent and in monitor-well groundwater samples. Septic effluent contains a number of volatile organic that may be suitable as tracers, including reduced sulfur compounds, fragrance compounds (such as thymol, eucalyptol and pine scents), and disinfection byproducts (chloroform, dibromo-chloroform, and bromo-dichloroform). With the exception of the disinfection byproducts, none of these compounds have been detected in groundwater. Disinfection byproducts have been detected in groundwater at the commercial SR site. This site, however, uses treated water to irrigate the vineyard that overlies the septic leach field, and so the presence of DBPs does not distinguish between irrigation water and septic effluent. References Kendall C. (1998) Tracing nitrogen sources and cycling in catchments. In Isotope Tracers in Catchment
Hydrology (ed. C. Kendall and J. J. McDonnell), pp. 519-576. Elsevier. Moore K., Ekwurzel B. E., Esser B. K., Hudson G. B., and Moran J. E. (2006) Sources of groundwater
nitrate revealed using residence time and isotope methods. Applied Geochemistry 21(6), 1016-1029.
Esser, Moran, Leif and Singleton (2007)
6 California GAMA Special Study
Figure 1: Septic study sites in un-incorporated corridor of Alameda County, California, surrounded by the City of Livermore. Residences in this corridor use septic systems for wastewater disposal.
Field-based study of septic system impact on groundwater (A feasibility study)
LLNL-TR-676618-DRAFT 7
Figure 2: Groundwater nitrate concentration trends in domestic wells within the un-incorporated corridor shown in Figure 1. The MCL for nitrate is 45 mg/L as NO3
-.
0
50
100
150
1975 1980 1985 1990 1995 2000 2005 2010
Nitrate trends
15J 215R 6
Nitra
te (
mg
/L a
s N
O3)
Sample Date
Esser, Moran, Leif and Singleton (2007)
8 California GAMA Special Study
Figure 3: Residential septic system site (SF) for a family of four with a 1200-gallon septic tank, showing the location of monitor well installations (red) and CPT/DP sites (yellow) at the SF site. The septic tank at the SF site was accessible for sampling both influent and effluent. Also shown are accessible domestic wells (black triangles) and a recent monitor well cluster installed by the Zone 7 Water Agency (red). This cluster consists of an 8” bore drilled by ProSonic using sonic coring techniques into which two 2” PVC monitor wells were installed. Continuous core was collected during drilling at this site.
Field-based study of septic system impact on groundwater (A feasibility study)
LLNL-TR-676618-DRAFT 9
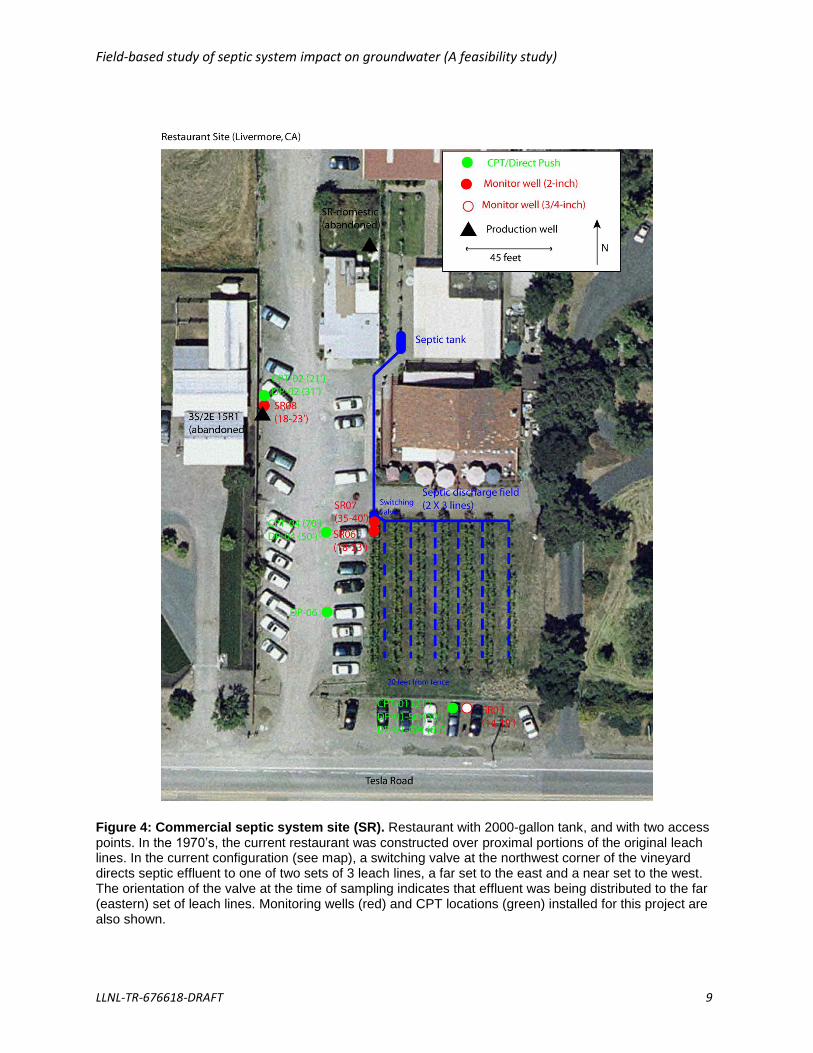
Figure 4: Commercial septic system site (SR). Restaurant with 2000-gallon tank, and with two access points. In the 1970’s, the current restaurant was constructed over proximal portions of the original leach lines. In the current configuration (see map), a switching valve at the northwest corner of the vineyard directs septic effluent to one of two sets of 3 leach lines, a far set to the east and a near set to the west. The orientation of the valve at the time of sampling indicates that effluent was being distributed to the far (eastern) set of leach lines. Monitoring wells (red) and CPT locations (green) installed for this project are also shown.
Esser, Moran, Leif and Singleton (2007)
10 California GAMA Special Study
Figure 5: Commercial septic tank sampling. Top panel: The thick scum layer on the second chamber of the SR site septic tank is shown. Bottom panel: The second chamber was sampled on February 8, 2007 in conjunction with pumping of the tank. Liquid beneath the scum layer and above the sludge layer was sampled with a peristaltic field pump and dedicated tubing (Teflon-lined Tygon and silicone).
Field-based study of septic system impact on groundwater (A feasibility study)
LLNL-TR-676618-DRAFT 11
Two-chamber septic tanks
Septic tank model
Figure 6: Deuterium tracer experiment at SF site - Conceptual model and tank data. Top panel: Schematics of two-chamber septic tanks. Lower panel: Simple model of tracer evolution in a two-chamber septic tank. The model parameters (chamber size, water flux, isotopic composition of the tracer and ambient groundwater) are estimated from site conditions. Output was generated in the program MATLAB (MATLAB and Statistics Toolbox Release 2012b, The MathWorks, Inc., Natick, MA, USA).
Esser, Moran, Leif and Singleton (2007)
12 California GAMA Special Study
Figure 7: Deuterium tracer experiment at SF site - Initial data. Top panel: Evolution of tracer signal at distribution box between septic tank and leach field, and the evolution of the tracer signal in shallow groundwater underlying the leach field (DP03, SF05, and SF04). Lower panel: Stable isotopic composition of local groundwaters, showing the appearance of tracer in the SF05 monitor well. Note that light isotopic composition of the Zone 7 monitor well (3S/2E 23E1), reflecting a component of recharge from imported water.
-80
-70
-60
-50
-40
-30
D
-H2O
(per
mil)
-10 -9 -8 -7 -6
18
O-H2O (per mil)
SF sitemean
SF sitemean
DP01-40
All samples
SF05
SF04
DP03
MWL
3S/2E 23E1
500
400
300
200
100
0
-100
D
-H2O
(per
mil)
09/22 10/06 10/20 11/03 11/17 12/01
Sample Date
-65
-60
-55
-50
-45
09/22 10/06 10/20 11/03 11/17 12/01
SF05
SF04
DP03
SF sitemean
SF effluent
SF site groundwater
Field-based study of septic system impact on groundwater (A feasibility study)
LLNL-TR-676618-DRAFT 13
Figure 8: Deuterium tracer experiment at SF site - All data. Top panel: Evolution of tracer signal at distribution box between septic tank and leach field, and (in the inset) the evolution of the tracer signal in groundwater underlying the leach field (DP03, SF05 and SF04), in groundwater downgradient from the leach field (SF01, SF02, SF10), and in groundwater upgradient of the leach field (SF09, DP08). Solid symbols indicate shallow samples (<30 feet); open symbols indicate deeper samples. DP indicates direct-push samples. Lower panel: Stable isotopic composition of local groundwaters, showing the appearance of tracer in the SF05 monitor well. In both plots, error bars are plotted for SF05 to illustrate the magnitude of the analytical uncertainty.
Esser, Moran, Leif and Singleton (2007)
14 California GAMA Special Study
Figure 9: Deuterium tracer experiment at SR site - Groundwater data. Top panel: Evolution of tracer signal in groundwater down or cross gradient from the leach field. Solid symbols indicate shallow samples (<30 feet); open symbols indicate deeper samples. DP indicates direct-push samples. Lower panel: Stable isotopic composition of local groundwaters, showing the appearance of tracer in the SR06 monitor well.
Field-based study of septic system impact on groundwater (A feasibility study)
LLNL-TR-676618-DRAFT 15
Figure 10: Depth distribution and covariance of chloride, sulfate, and nitrate. Top panel: Depth profiles of chloride, sulfate, and nitrate in direct-push groundwater samples. Bottom panel. Covariance of chloride, sulfate, and nitrate in monitor well groundwater samples and in SF septic effluent.
Esser, Moran, Leif and Singleton (2007)
16 California GAMA Special Study
Figure 11: Time-series data for water level, chloride and nitrate. Top panel: Time-series water level and precipitation data for the SF site (left) and the SR site (right). Middle panel: Time series data for chloride for the SF site (left) and SR site (right). Bottom panel: Time series data for nitrate for the SR site (left) and SR site (right) with the same symbols used in the middle panel.
Field-based study of septic system impact on groundwater (A feasibility study)
LLNL-TR-676618-DRAFT 17
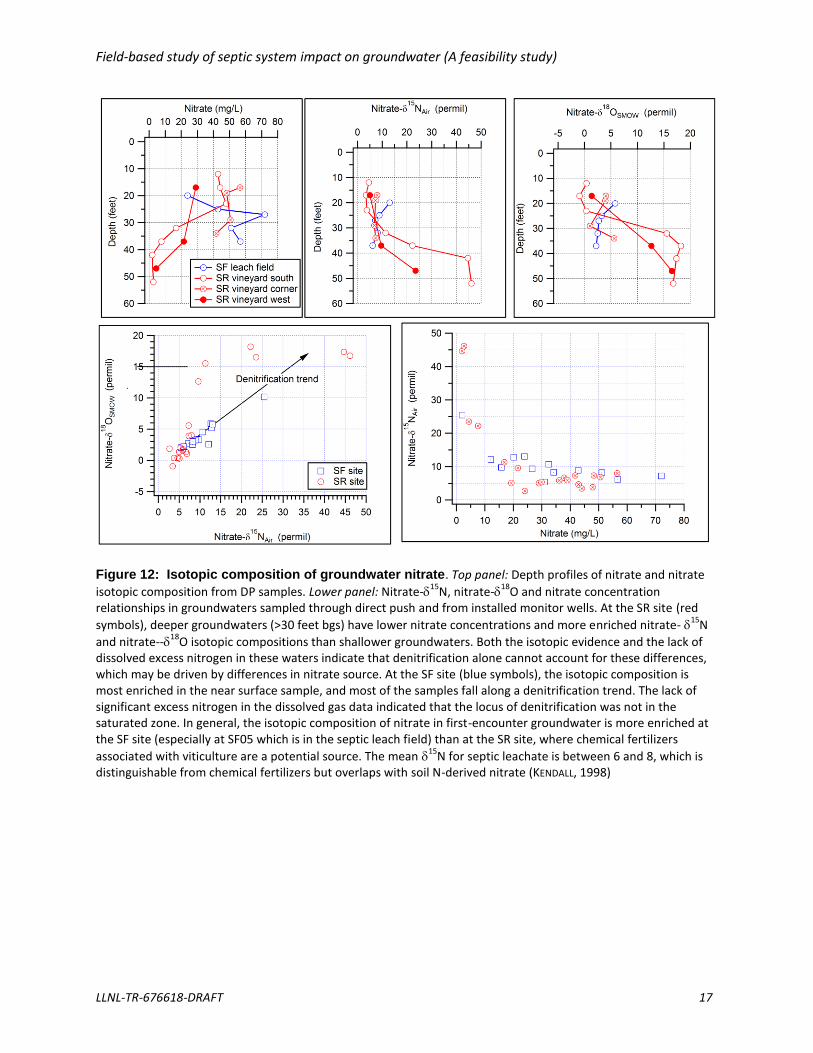
Figure 12: Isotopic composition of groundwater nitrate. Top panel: Depth profiles of nitrate and nitrate
isotopic composition from DP samples. Lower panel: Nitrate-15
N, nitrate-18
O and nitrate concentration relationships in groundwaters sampled through direct push and from installed monitor wells. At the SR site (red
symbols), deeper groundwaters (>30 feet bgs) have lower nitrate concentrations and more enriched nitrate-15
N
and nitrate--18
O isotopic compositions than shallower groundwaters. Both the isotopic evidence and the lack of dissolved excess nitrogen in these waters indicate that denitrification alone cannot account for these differences, which may be driven by differences in nitrate source. At the SF site (blue symbols), the isotopic composition is most enriched in the near surface sample, and most of the samples fall along a denitrification trend. The lack of significant excess nitrogen in the dissolved gas data indicated that the locus of denitrification was not in the saturated zone. In general, the isotopic composition of nitrate in first-encounter groundwater is more enriched at the SF site (especially at SF05 which is in the septic leach field) than at the SR site, where chemical fertilizers
associated with viticulture are a potential source. The mean 15
N for septic leachate is between 6 and 8, which is distinguishable from chemical fertilizers but overlaps with soil N-derived nitrate (KENDALL, 1998)
Esser, Moran, Leif and Singleton (2007)
18 California GAMA Special Study
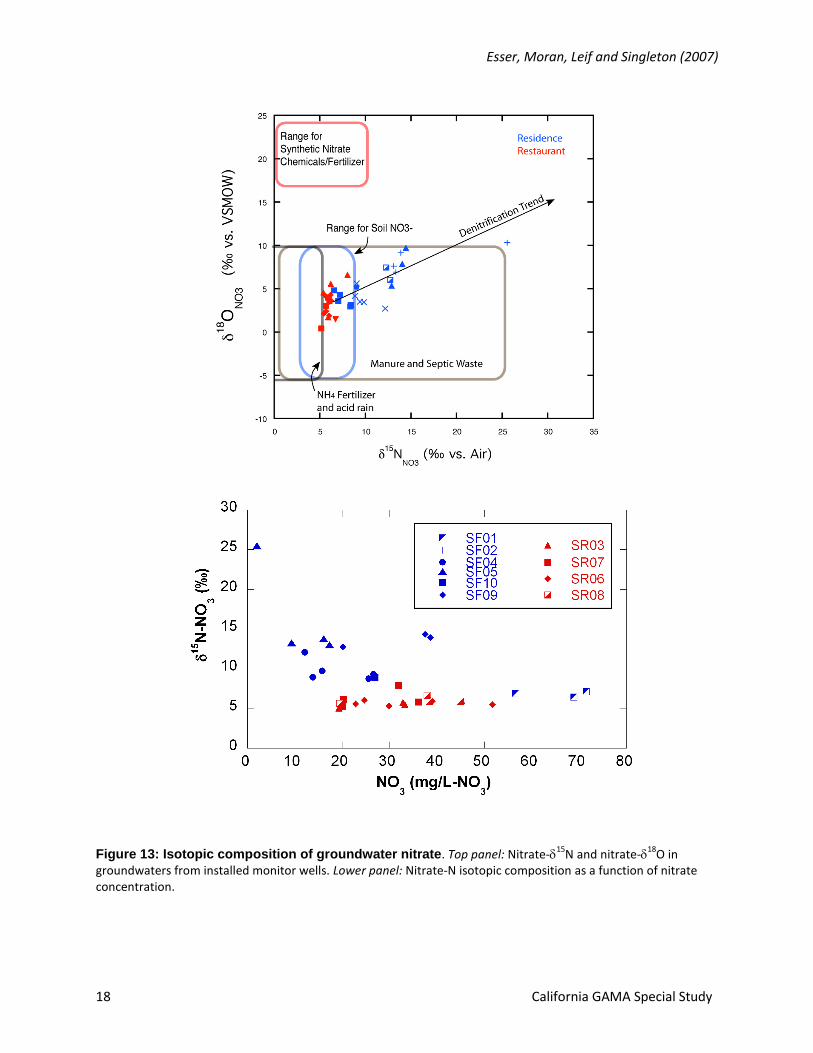
Figure 13: Isotopic composition of groundwater nitrate. Top panel: Nitrate-
15N and nitrate-
18O in
groundwaters from installed monitor wells. Lower panel: Nitrate-N isotopic composition as a function of nitrate concentration.
Field-based study of septic system impact on groundwater (A feasibility study)
LLNL-TR-676618-DRAFT 19
Figure 14: Boron. Top panel: Depth profiles of boron and sodium from LLNL monitor wells, the SF site domestic well (with estimated screened interval), SF site effluent, and Zone 7 monitor wells (23E1 and 23E2) located south of the SR site near the Arroyo Seco recharge area. Lower panel: Correlation between boron and sodium content in site groundwaters.
Singleton, Moran, Leif, and Esser (2015)
20 California GAMA Special Study
Figure 15: Volatile and semi-volatile organic compounds in septic effluent and in monitor-well groundwater samples at the residential site. Septic effluent contains a number of volatile organic that may be suitable as tracers, including reduced sulfur compounds, fragrance compounds (such as thymol, eucalyptol and pine scents), pharmaceuticals (such as ibuprofen) and personal care products (such as triclosan). These compounds have not been detected in groundwater at the site (with the possible exception of limomene).
Field-based study of septic system impact on groundwater (A feasibility study)
LLNL-TR-676618 21
Table 1: Buena Vista Wells Monitored for Nitrate
Well Use* Well
dia. (")
Well depth
(ft)
Screen (ft)
Median nitrate (mg/L)
# Date
3S/2E 15J 1 Supply 6 57 3 1975?
3S/2E 15J 2 Supply 186 76-81; 111-134
92 52 1976-2006
3S/2E 15J 4 Supply 136
3S/2E 15J 6 Supply
3S/2E 15J 7 Supply 5 140 35-130
3S/2E 15R 1 Supply 10 250
3S/2E 15R 2 Supply
3S/2E 15R 5 Supply 200
3S/2E 15R 6 Supply 6 58 ?-58 49 8 1996-2006
3S/2E 15R 7 Supply 5 165 16 1 2002
3S/2E 15R 8** Supply 8 133 49 1 1999
3S/2E 23E 1 Monitoring 2 40 20-35
3S/2E 23E 2 Monitoring 2 110 95-105
Well construction (diameter, depth, screened interval is not known for all wells. * Supply wells are private wells with installed pumped used for domestic use or irrigation ** Abandoned
Singleton, Moran, Leif, and Esser (2015)
22 California GAMA Special Study
Table 2: SWRCB/LLNL Buena Vista Septic Study Monitor Wells
Name - current
Installation date
(owner) Method*
Well casing
Total
Depth (ft)
Bottom screen
(ft)
Top screen
(ft) Sandpack Bentonite Wellbox Development Location
Latitude (deg N)
Longitude (deg W)
System
SF01 10/11/06 (LLNL)
Direct push 3/4" PVC 32 32 27 prepack 0.010"
prepack surface, in soil
No Trimble GPS
37.66870 121.73497 WGS 1984
SF02 10/12/06 (LLNL)
Hollow-stem auger
2" PVC 32 32 27 2/16 32-26' 26-24' surface, in concrete
Bailed dry 2006-10-16
Trimble GPS
37.66856 121.72510 WGS 1984
SF04 10/12/06 (LLNL)
Hollow-stem auger
2" PVC 20 20 15 2/16 20-14' 14-13' surface, in concrete
Surge & bail 2006-10-16
Trimble GPS
37.66856 121.73505 WGS 1984
SF05 10/12/06 (LLNL)
Direct push 3/4" PVC 20 20 15 prepack 0.010"
prepack surface, in soil
No Trimble GPS
37.66864 121.73493 WGS 1984
SF09 10/13/06 (LLNL)
Hollow-stem auger
2" PVC 23 23 18 2/16 23-17' 17-16' surface, in concrete
Surge & bail 2006-10-16
Trimble GPS
37.66876 121.73338 WGS 1984
SF10 10/13/06 (LLNL)
Hollow-stem auger
2" PVC 23 23 18 2/16 23-17' 17-16' surface, in concrete
Surge & bail 2006-10-16
Trimble GPS
37.66878 121.73585 WGS 1984
SR03 10/12/06 (LLNL)
Direct push 3/4" PVC 19 19 14 prepack 0.010"
prepack surface, in soil
No Trimble GPS
37.66525 121.73363 WGS 1984
SR06 10/12/06 (LLNL)
Hollow-stem auger
2" PVC 23 23 18 2/16 22-17' 17-16' surface, in concrete
Surge & bail 2006-10-16
Trimble GPS
37.66552 121.73377 WGS 1984
SR07 10/13/06 (LLNL)
Hollow-stem auger
2" PVC 40 40 35 2/16 40-34' 34-33' surface, in concrete
Bailed dry 2006-10-16
WGS 1984
37.66550 121.73379 WGS 1984
SR08 10/13/06 (LLNL)
Hollow-stem auger
2" PVC 23 23 18 2/16 23-17' 17-16' surface, in concrete
Surge & bail 2006-10-16
WGS 1984
37.66572 121.73395 WGS 1984
3S/2E-15R17
12/12/2006 (Zone 7)
Sonic* 2" PVC 58 38 surface, in concrete*
Ongoing WGS 1984
37.6676 121.7353 WGS 1984
3S/2E-15R18
12/12/2006 (Zone 7)
Sonic* 2" PVC 133 113 Surface, in concrete*
Ongoing WGS 1984
37.6676 121.7353 WGS 1984
* Monitor wells 3S/2E-15R17 and -15R18 were installed as a nested pair of wells in a single 8" borehole using sonic techniques by the Zone 7 Water Agency after consultation with LLNL on the best location of the nest with respect to the LLNL septic study sites. Continuous core was recovered.
Field-based study of septic system impact on groundwater (A feasibility study)
LLNL-TR-676618 23
Table 3: SWRCB/LLNL Buena Vista Septic Study CPT Logs and DP Samples
CPT log Site Location Date Depth GW samples (feet, NR=no recovery) Soil samples (feet, NR=no recovery)
CPT-01 SR South of vineyard/septic leach field 2006-10-09 41 DP01: 16, 20, 28, 30NR, 35, 40, 45, 55, 65
DP01: 7, 11, 16, 21, 25, 31, 36, 41, 46, 51
CPT-02 SR West side of parking lot 2006-10-10 30 DP02: 20, 25NR, 30NR DP02: 8, 10.5, 15.5, 21
CPT-04 SR Northwest corner of vineyard/septic leach field
2006-10-11 70 DP04: 22, 27NR, 32, 37 DP04: 7.5, 10.4, 15.5, 20.5
CPT-03 SF In septic leach field 2006-10-10 68 DP03: 20NR, 25NR, 27NR, 30, 35, 40, 50NR. MW01: 20, 25, 32
DP03: 7.5, 10.5, 15.5, 20.5
CPT-06 SF In driveway just beyond end of leach field
2006-10-13 61 DP08: 20, 25NR, 30, 40, 57.5 None
None SF In neighbor’s driveway, across street from septic leach field
2006-10-13 50 DP06: 20, 40, 50 None