Embed Size (px)
Citation preview
CALIFORNIA FARMLAND CONVERSION REPORT 2006-2008
January 2011 Documenting changes in agricultural land use since 1984.
Edmund G. Brown, Jr., Governor
John Laird, Secretary, Natural Resources Agency
Derek Chernow, Acting Director, Department of Conservation
California Department of Conservation Division of Land Resource Protection (DLRP)
Our Mission: The Department of Conservation balances today's needs with tomorrow's challenges and fosters intelligent, sustainable, and efficient use of California's energy, land, and mineral resources. DLRP’s goal is to lead the change in the value proposition for the conservation of agricultural and open space land in California.
Farmland Mapping and Monitoring Program (FMMP)
The Program:
The Farmland Mapping and Monitoring Program provides consistent, timely and accurate land use data for assessing present status, reviewing trends, and planning for the future of California’s agricultural land resources.
For further information, please contact:
California Department of Conservation Division of Land Resource Protection Farmland Mapping and Monitoring Program 801 K Street, MS 18-01 Sacramento, CA 95814-3528 (916) 324-0859 FAX (916) 327-3430 TDD (916) 324-2555
email: [email protected] www.conservation.ca.gov/dlrp/fmmp
Cover Graphics
Front: Tomatoes drying in the field contrast with adjacent agricultural land, Stanislaus County. Imagery from the National Agricultural Imagery Program, 2010.
Back: Cattle brands used at California missions. The 21 missions from San Diego to Sonoma brought livestock husbandry to the state, along with many crops important in California today. For more on the California Mission Trail, see: www.parks.ca.gov/?page_id=22722
For a directory of cattle brands currently used in California, see: www.cdfa.ca.gov/ahfss/Livestock_ID/2007_Brand_Book.html
© 2011, California Department of Conservation
All rights reserved. Fair use of this report for a non-commercial, educational, research or scientific purpose is not a violation of copyright. However, no part of the contents of this report may be reproduced, transmitted, or distributed in any form or by any means, electronic or mechanical, for any purpose without the express written permission of the Department of Conservation, Division of Land Resource Protection.
California Farmland Conversion Report 2006 – 2008
CALIFORNIA DEPARTMENT OF CONSERVATION
DIVISION OF LAND RESOURCE PROTECTION
FARMLAND MAPPING AND MONITORING PROGRAM
JANUARY 2011
Acknowledgements
MANY INDIVIDUALS AND ORGANIZATIONS HAVE CONTRIBUTED TO THIS REPORT AND THE GIS DATA FROM WHICH IT WAS DERIVED.
Farmland Mapping and Monitoring Program Staff
Molly Penberth, Manager Troy Dick Karen FitzGerald Patrick Hennessy Kerri Kisko Michael Kisko Amy Klug Judith Santillan
Thanks also to all past FMMP staff members for their cumulative contributions.
Division of Land Resource Protection
Brian Leahy, Assistant Director David Thesell, Deputy Chief Monica Cea, Administrative Liaison
Principal Data Sources include digital soil survey data, produced by the U.S. Department of Agriculture-Natural Resources Conservation Service; with aerial imagery from the National Agricultural Imagery Program (NAIP) and Digital Globe, Inc. Additional imagery for rural areas included Landsat 7 satellite data and aerial imagery acquired by Aerials Express and U.S. Geological Survey.
Cultural base information for the Important Farmland Maps was derived from public domain data sets, based upon design of the U.S. Geological Survey, with updates generated by digitizing over current imagery.
Additional data on land management and land use conversion activity was made available from the U.S. Forest Service, California Department of Transportation, and the California Integrated Waste Management Board. GIS data posted at county and city websites proved valuable in many locations.
Map reviewer comments contribute substantially to improving the quality of the information. These reviewers include county and city planning offices, county agricultural commissioners, resource conservation districts, Natural Resources Conservation Service district conservationists, California Farm Bureau Federation, University of California Cooperative Extension, California Cattlemen's Association, local water and irrigation districts, public interest groups, and building industry representatives. Many of these groups also participated in development of the Farmland of Local Importance definitions for their respective counties.
NATURAL RESOURCES AGENCY EDMUND G. BROWN, JR., GOVERNOR
D E P A R T M E N T O F C O N S E R V A T I O N Managing California’s Working Lands
DIRECTOR’S OFFICE 801 K STREET MS 24-01 SACRAMENTO, CALIFORNIA 95814
PHONE 916 / 322-1080 FAX 916 / 445-0732 TDD 916 / 324-2555 WEB SITE conservation.ca.gov
The Department of Conservation’s mission is to balance today’s needs with tomorrow’s challenges and foster intelligent,
sustainable, and efficient use of California’s energy, land, and mineral resources.
March 2011 Dear Land Conservation Partner: On behalf of the Department of Conservation, I am pleased to present the California Farmland Conversion Report 2006-2008. This analysis of agricultural land use conversion trends, based on detailed geographic information system mapping, is the twelfth biennial report of the Farmland Mapping and Monitoring Program (FMMP). This report can be found on our Web site at www.conservation.ca.gov/dlrp/fmmp. The FMMP was established in 1982 to document the location and extent of California’s important farmlands, and to report on how they change over time. The Important Farmland Maps are used in the planning process to gauge the impact of planning decisions on agricultural land throughout the State. Population projections and today’s environmental challenges make this information more important than ever. Irrigated farmland in California decreased by more than 317 square miles (203,011 acres) between 2006 and 2008. The highest-quality agricultural soils, known as Prime Farmland, comprised 49 percent of the decrease (98,471 acres). Urban land increased by 72,548 acres, a 29 percent decrease relative to the 2004-2006 reporting period. This was the lowest urbanization rate since the late 1990’s, reflecting the onset of the recent economic recession. Long-term land idling was the largest factor contributing to irrigated land decreases, primarily in the San Joaquin Valley. The report contains county and regional summaries of the dynamics that occurred beyond the urban edge, providing context for larger planning issues. Identifying strategic farmland resources is an important first step in maintaining California’s agricultural vitality. The Department of Conservation thanks the agricultural organizations and local governments that work with us to produce these useful tools for conservation planning. Sincerely,
Derek Chernow Acting Director

This page left intentionally blank.
Executive Summary, 2006-2008 ............................................................................................................... 1 1 The Farmland Mapping and Monitoring Program ................................................... 3 Important Farmland Map Categories ............................................................................. 4 2 2006-2008 Improvements .............................................................................................. 7 3 Understanding the Data .................................................................................................. 9 4 Land Use Conversion, 2006-2008 ............................................................................. 11 Urbanization ..................................................................................................................... 12 Other Changes Affecting Agricultural Land ............................................................... 15 Counties with Rural Land Mapping Enhancements .................................................... 18 Net Irrigated Farmland Change ................................................................................... 19 1984-2008 Net Land Use Change .............................................................................. 19 APPENDIX A 2006-2008 County Conversion Tables ................................................................... 23 APPENDIX B 2006 and 2008 County Acreage Tallies .................................................................. 71 APPENDIX C County and Regional Conversion Summaries ...................................................... 75 APPENDIX D Rural Land Use Mapping Tables ............................................................................... 79 APPENDIX E Farmland of Local Importance Definitions .............................................................. 91 FIGURES Figure 1 Urbanization in the Brentwood Area, Contra Costa County, 1984-2008 .................................................................................. 3 Figure 2 2008 Important Farmland Survey Area ................................. 5 Figure 3 2008 Mapping Additions .......................................................... 7 Figure 4 Conversion Table Structure ....................................................... 9 Figure 5 Regions Used for FMMP Analysis ......................................... 10 Figure 6 Statewide Important Farmland Conversion Summary ...... 11 Figure 7 Sources of Urban Land 2006-2008 .................................... 15 Figure 8 Conversions to Irrigated Farmland 2006-2008 ................ 16 Figure 9 Conversions Out of Irrigated Categories 2006-2008 ..... 17 TABLES Table 1 2008 Important Farmland Survey Area Additions
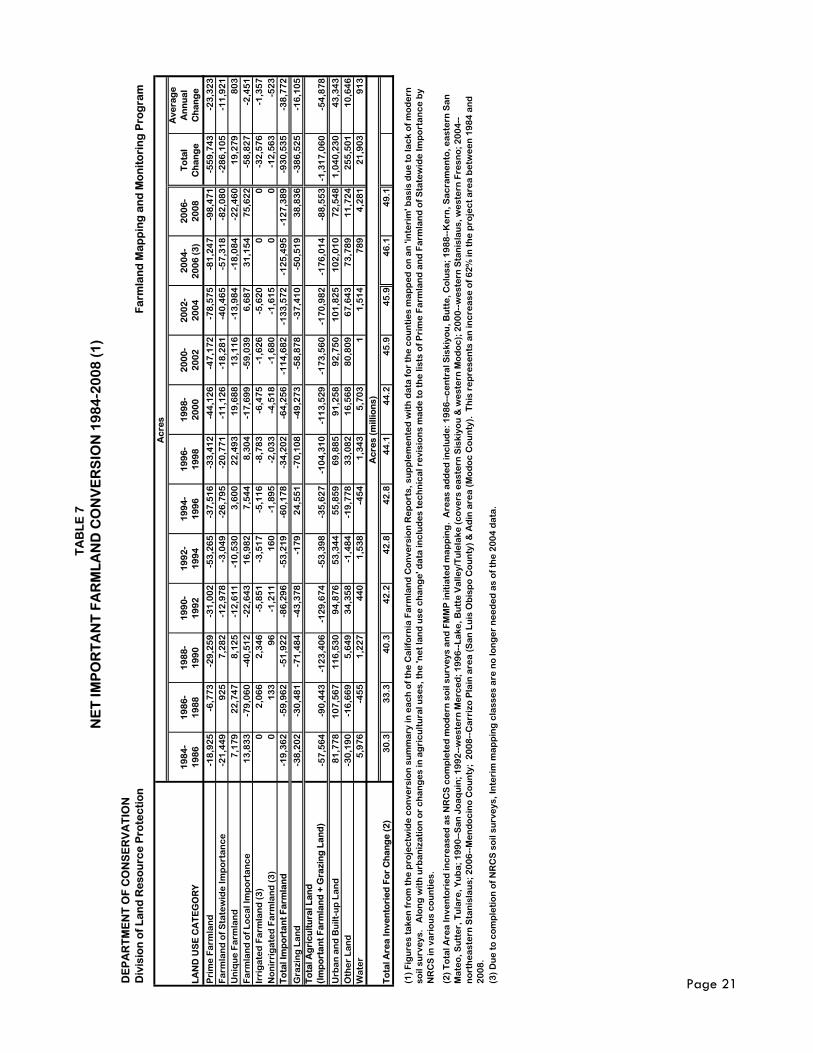
and County Boundary Adjustments .......................................... 8 Table 2 Urbanization from All Categories......................................... 12 Table 3 Regional Urbanization Ranking ............................................. 12 Table 4 California Farmland Conversion Summary 2006-2008 .. 13 Table 5 Irrigated Farmland to Urban Ranks .................................... 14 Table 6 Decreases of Irrigated Land .................................................. 19 Table 7 Net Important Farmland Conversion 1984-2008 ............. 21
California Farmland Conversion Report 2006 – 2008
Table of Contents
Appendix A: 2006-2008 County Conversion Tables Table A-1 Alameda .................................................................................... 24 Table A-2 Amador ...................................................................................... 25 Table A-3 Butte ............................................................................................ 26 Table A-4 Colusa ......................................................................................... 27 Table A-5 Contra Costa ............................................................................. 28 Table A-6 El Dorado................................................................................... 29 Table A-7 Fresno ......................................................................................... 30 Table A-8 Glenn .......................................................................................... 31 Table A-9 Imperial ...................................................................................... 32 Table A-10 Kern ............................................................................................ 33 Table A-11 Kings ........................................................................................... 34 Table A-12 Lake ............................................................................................ 35 Lassen (see Sierra Valley) ...................................................... 60 Table A-13 Los Angeles ............................................................................... 36 Table A-14 Madera ...................................................................................... 37 Table A-15 Marin .......................................................................................... 38 Table A-16 Mariposa ................................................................................... 39 Table A-17 Mendocino ................................................................................. 40 Table A-18 Merced ....................................................................................... 41 Table A-19 Modoc ........................................................................................ 42 Table A-20 Monterey ................................................................................... 43 Table A-21 Napa .......................................................................................... 44 Table A-22 Nevada ...................................................................................... 45 Table A-23 Orange ...................................................................................... 46 Table A-24 Placer ......................................................................................... 47 Plumas (see Sierra Valley) ..................................................... 60 Table A-25 Riverside .................................................................................... 48 Table A-26 Sacramento .............................................................................. 49 Table A-27 San Benito.................................................................................. 50 Table A-28 San Bernardino ......................................................................... 51 Table A-29 San Diego .................................................................................. 52 Table A-30 San Joaquin............................................................................... 53 Table A-31 San Luis Obispo ........................................................................ 54 Table A-32 San Mateo ................................................................................. 55 Table A-33 Santa Barbara ......................................................................... 56 Table A-34 Santa Clara............................................................................... 57 Table A-35 Santa Cruz ................................................................................. 58 Table A-36 Shasta ......................................................................................... 59 Table A-37 Sierra Valley (Lassen/Plumas/Sierra) ................................. 60 Table A-38 Siskiyou ...................................................................................... 61 Table A-39 Solano ........................................................................................ 62 Table A-40 Sonoma ...................................................................................... 63 Table A-41 Stanislaus ................................................................................... 64 Table A-42 Sutter .......................................................................................... 65 Table A-43 Tehama ...................................................................................... 66 Table A-44 Tulare ......................................................................................... 67 Table A-45 Ventura ...................................................................................... 68 Table A-46 Yolo ............................................................................................. 69 Table A-47 Yuba ........................................................................................... 70
Appendix B: 2006 and 2008 County Acreage Tallies Table B-1 Important Farmland Acreage Summary 2006 .................. 72 Table B-2 Important Farmland Acreage Summary 2008 ................... 73
Table B-3 Important Farmland Acreage Summary, By Region, 2008 ...................................................................... 74
Appendix C: County and Regional Conversion Summaries
Table C-1 Sources of Urban Land 2006-2008 and Land Committed to Nonagricultural Use ............................. 76
Table C-2 Irrigated Farmland Changes 2006-2008 .......................... 77 Table C-3 Net Change in Irrigated Land 2006-2008 ........................ 78 Appendix D: Rural Land Use Mapping Tables
Table D-1 Rural Land Use Conversion Summary ................................... 80 Table D-2 Rural Land Mapping Changes 2006-2008 ........................ 81 Table D-3 Fresno ......................................................................................... 82 Table D-4 Kern ............................................................................................ 83 Table D-5 Kings ........................................................................................... 84 Table D-6 Madera ...................................................................................... 85
Table D-7 Mendocino ................................................................................. 86 Table D-8 Merced ....................................................................................... 87 Table D-9 San Joaquin ............................................................................... 88 Table D-10 Stanislaus ................................................................................... 89 Table D-11 Tulare ......................................................................................... 90

This page left intentionally blank.
California Farmland Conversion Report 2006-2008
Page 1
Executive Summary, 2006-2008
WHILE URBANIZATION RATES DECREASED SIGNIFICANTLY, IRRIGATED FARMLAND LOSSES ACCELERATED COMPARED WITH THE 2004-2006 PERIOD. LAND IDLING, FOCUSED IN THE SOUTHERN SAN JOAQUIN VALLEY, HAD THE GREATEST IMPACT.
Irrigated farmland in California decreased by 317 square miles (203,011 acres) between 2006 and 2008 as documented by the Farmland Mapping and Monitoring Program (FMMP). The highest-quality agricultural soils, known as Prime Farmland, comprised 49% of the loss (98,471 acres). Urban development, which totaled 72,548 acres, decreased by 29% relative to the 2004-06 period. The 2008 urbanization rate was the lowest rate recorded since the late 1990’s.
The FMMP biennial mapping survey covers approximately 98% of the privately owned land in the state (49.1 million acres) in 49 counties. Land use information is gathered using aerial imagery and land management data, which is combined with soil quality data in a geographic information system (GIS) to produce maps and statistics. The earliest data for most counties is from 1984.
Urban Development
Of the 113 square miles of new Urban and Built-up land in the state, 50% occurred in Southern California (36,043 acres). Five out of the top ten urbanizing counties were in Southern California; Riverside County accounted for 21% of the state total (15,139 acres). The San Joaquin Valley ranked second at 27% of the total (19,346 acres). Kern County was by far the most active in the region; its nearly 9,400 acre urban increase was exceeded only by that of Riverside County. For the first time since the 2000-02 report, the San Francisco Bay region’s urbanization edged out that of the Sacramento Valley (5,807 and 5,493 acres, respectively).
Statewide, irrigated farmland was the source of 20,381 acres or 28% of all new urban land. Prime Farmland was impacted at twice the rate of lesser quality soils (13,178 and 6,663 acres, respectively). Another 35% of new urban land came from dryland farming and grazing uses; some of which may have been idled in anticipation of development. The remaining 37% was derived from native vegetation or vacant lands. Keeping with historic precedent, the San Joaquin Valley region had the largest proportion of direct irrigated land to urban land conversion (53%). Kern County led in farmland urbanization, totaling more than 3,600 acres. The City of Bakersfield alone accounted for more than 1,250 of these acres. The Sacramento Valley region ranked second for direct irrigated farmland to urban conversions (33%).
Housing developments were the most frequent and widespread new urban uses; developments ranged up to 425 acres in size. The inland desert was also active, including more than 1,000 acres of new residential land around Victorville (San Bernardino County) and two new Sun City developments--near Apple Valley and Indio (San Bernardino and Riverside counties, respectively). Community infrastructure was also common; active counties typically hosted one or more new golf courses (190 to 300 acres each) and 300 to 500 acres of new schools and parks. Some new uses stood out: a single industrial complex covering 240 acres in Redlands (San Bernardino County), more than 3,000 acres of groundwater recharge basins in Kern County, and a number of small scale energy production facilities (solar or ethanol) in the San Joaquin Valley.
Agricultural Trends
While urbanization is an important component of agricultural land conversion, economic and resource availability factors also lead to more intensive farming or removal from irrigated uses. Conversion from
California Department of Conservation
Page 2
grasslands to orchards, specifically almonds and pistachios, was the most widespread form of intensification. New orchards were common along the western foothills of the Sierra Nevada and eastern flank of the coast range. Land in the Antelope Valley of Kern and Los Angeles counties continued to be brought back into production for high value crops such as carrots. Vineyard expansion has been minimal during the 2006 and 2008 map updates. Seventy percent of the land brought into irrigated uses in 2008 did not meet Prime Farmland criteria.
Land was removed from irrigated categories--to uses aside from urban--at a rate 26% higher than the prior update (207,227 acres in 2004-06 and 260,412 acres in 2006-08). Land idling was the largest factor, particularly in the southern San Joaquin Valley. Five of the region’s eight counties had 10,000 or more acres of this conversion type, with Fresno County’s more than 56,000 acre decrease being particularly notable. These conversions are associated with salinity and drought related land retirement on the west side of the Valley. The cessation of irrigation resulted in most of the land being reclassified to Grazing Land or Farmland of Local Importance; these conversions could be reversed if environmental factors change.
Conversion data from 24 years of Important Farmland mapping indicates that for every five acres leaving agricultural use, four convert to Urban Land and one converts to Other Land. This update cycle, conversions to Other Land declined by 23% relative to the 2006 period (from 51,611 acres to 39,959 acres). San Joaquin and Sacramento Valley counties accounted for 44% and 27% of the total, respectively. The most active counties were Fresno, San Joaquin, Stanislaus, and Yolo; at between 3,100 and 3,800 acres each. Low density rural residential expansion, vacant land resulting from stalled subdivisions, mining, and ecological restoration projects accounted for a large proportion of the Other Land conversions. New dairies and poultry facilities also contributed in some counties.
Program Additions and Improvements
The availability of new USDA soil surveys led to additions of just over 900,000 acres to the FMMP mapping area in 2008. The largest included the Carrizo Plain (San Luis Obispo County) and along the Pit River Valley (Modoc County). As part of FMMP’s continuous improvement goals, a new statewide county boundary file was adopted. This file reflects recent legal boundary changes and technical improvements. The largest example was a 2008 jurisdictional change that shifted nearly 4,200 acres from Fresno County to Merced County.
Net Change
Irrigated farmland losses have accelerated through recent Important Farmland map updates. The 203,011 acre net loss in irrigated land in 2008 was 30% higher than the 2006 total. Prime Farmland’s decrease of 1 was a record, breaking the 81,247 acre record set during the 2004-06 reporting period. Land idling exceeded the affect of urbanization for the first time in FMMP history during the 2008 update.
During the 12 biennial reporting cycles since FMMP was established, more than 1.3 million acres of agricultural land in California were converted to nonagricultural purposes. This represents an area larger in size than Merced County; or a rate of about one square mile every four days. The largest losses from agricultural land categories were from Prime Farmland and Grazing Land (559,743 and 386,525 acres, respectively). Unique Farmland has shown a small net increase over the 24 year period (19,279 acres) due to expansion of high value crops—mostly orchards and vineyards—on hilly terrain.
As 2010 mapping proceeds, economic and environmental challenges face California, and the nation as a whole. Agricultural lands will continue to reflect how these complex systems interact on the landscape. FMMP will support informed planning decisions with timely and accurate data capturing these trends as they evolve.
California Farmland Conversion Report 2006-2008
Page 3
Chapter 1: The Farmland Mapping and Monitoring Program
DOCUMENTING CHANGES IN AGRICULTURAL LAND USE SINCE 1984. The goal of the Farmland Mapping and Monitoring Program (FMMP) is to provide
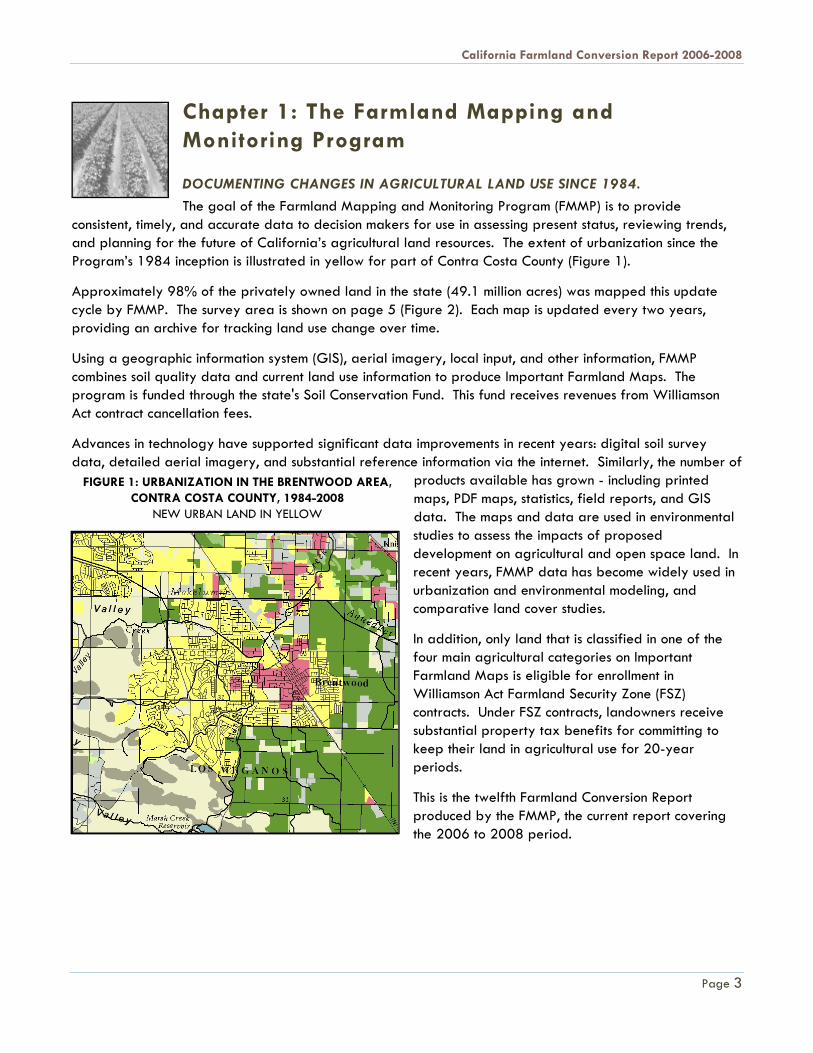
consistent, timely, and accurate data to decision makers for use in assessing present status, reviewing trends, and planning for the future of California’s agricultural land resources. The extent of urbanization since the Program’s 1984 inception is illustrated in yellow for part of Contra Costa County (Figure 1).
Approximately 98% of the privately owned land in the state (49.1 million acres) was mapped this update cycle by FMMP. The survey area is shown on page 5 (Figure 2). Each map is updated every two years, providing an archive for tracking land use change over time.
Using a geographic information system (GIS), aerial imagery, local input, and other information, FMMP combines soil quality data and current land use information to produce Important Farmland Maps. The program is funded through the state's Soil Conservation Fund. This fund receives revenues from Williamson Act contract cancellation fees.
Advances in technology have supported significant data improvements in recent years: digital soil survey data, detailed aerial imagery, and substantial reference information via the internet. Similarly, the number of
products available has grown - including printed maps, PDF maps, statistics, field reports, and GIS data. The maps and data are used in environmental studies to assess the impacts of proposed development on agricultural and open space land. In recent years, FMMP data has become widely used in urbanization and environmental modeling, and comparative land cover studies.
In addition, only land that is classified in one of the four main agricultural categories on Important Farmland Maps is eligible for enrollment in Williamson Act Farmland Security Zone (FSZ) contracts. Under FSZ contracts, landowners receive substantial property tax benefits for committing to keep their land in agricultural use for 20-year periods.
This is the twelfth Farmland Conversion Report produced by the FMMP, the current report covering the 2006 to 2008 period.
FIGURE 1: URBANIZATION IN THE BRENTWOOD AREA, CONTRA COSTA COUNTY, 1984-2008
NEW URBAN LAND IN YELLOW
California Department of Conservation
Page 4
Important Farmland Map Categories
FMMP's study area coincides with boundaries of U.S. Department of Agriculture (USDA) modern soil surveys. Technical soil ratings and current land use information are combined to determine the appropriate map category. The minimum land use mapping unit for all categories is 10 acres unless otherwise noted; soil units as small as one acre are maintained to most accurately represent the original USDA data.
Prime Farmland has the best combination of physical and chemical features able to sustain long-term agricultural production. This land has the soil quality, growing season, and moisture supply needed to produce sustained high yields. Land must have been used for irrigated agricultural production at some time during the four years prior to the mapping date.
Farmland of Statewide Importance is similar to Prime Farmland but with minor shortcomings, such as greater slopes or less ability to store soil moisture. Land must have been used for irrigated agricultural production at some time during the four years prior to the mapping date.
Unique Farmland consists of lesser quality soils used for the production of the state's leading agricultural crops. This land is usually irrigated, but may include nonirrigated orchards or vineyards as found in some climatic zones in California. Land must have been cropped at some time during the four years prior to the mapping date.
Farmland of Local Importance is land of importance to the local agricultural economy as determined by each county's board of supervisors and a local advisory committee. The definitions for this category are detailed in Appendix E of this report.
Grazing Land is land on which the existing vegetation is suited to the grazing of livestock. This category was developed in cooperation with the California Cattlemen's Association, University of California Cooperative Extension, and other groups interested in the extent of grazing activities.
Urban and Built-up Land is occupied by structures with a building density of at least 1 unit to 1.5 acres, or approximately 6 structures to a 10-acre parcel. Common examples include residential, industrial, commercial, institutional facilities, cemeteries, airports, golf courses, sanitary landfills, sewage treatment, and water control structures.
Water is defined as perennial water bodies with an extent of at least 40 acres.
Other Land is land not included in any other mapping category. Common examples include low density rural developments, vegetative and riparian areas not suitable for livestock grazing, confined animal agriculture facilities, strip mines, borrow pits, and water bodies smaller than 40 acres. Vacant and nonagricultural land surrounded on all sides by urban development and greater than 40 acres is mapped as Other Land. More detailed data on these uses is available in counties containing the Rural Land Use Mapping categories.
Rural Land Use Mapping Categories
The Rural Land Mapping project provides more map and statistical detail than standard Important Farmland Map products by delineating Other Land into five subcategories, as described on page 5. This data is only available in the eight San Joaquin Valley counties and Mendocino County at this time; please see page 18 and the Appendix D tables.
California Farmland Conversion Report 2006-2008
Page 5
Rural Residential Land includes residential areas of one to five structures per ten acres.
Semi-Agricultural and Rural Commercial includes farmsteads, small packing sheds, unpaved parking areas, composting facilities, firewood lots, and campgrounds.
Vacant or Disturbed Land consists of open field areas that do not qualify for an agricultural category, mineral and oil extraction areas, and rural freeway interchanges.
Confined Animal Agriculture includes aquaculture, dairies, feedlots, and poultry facilities.
Nonagricultural and Natural Vegetation covers heavily wooded, rocky or barren areas, riparian and wetland areas, grassland areas which do not qualify for Grazing Land due to their size or land management restrictions, small water bodies, and recreational water ski lakes. Constructed wetlands are also included in this category. The Rural Land classes are not designed for interpretation as habitat. Geographic data on the extent of habitat for various species may be available from other state and federal entities.
Optional Designation
Land Committed to Nonagricultural Use is defined as existing farmland, grazing land, and vacant areas that have a permanent commitment for development. This optional designation allows local governments to provide detail on the nature of changes expected to occur in the future. It is available both statistically and as an overlay to the Important Farmland Map.
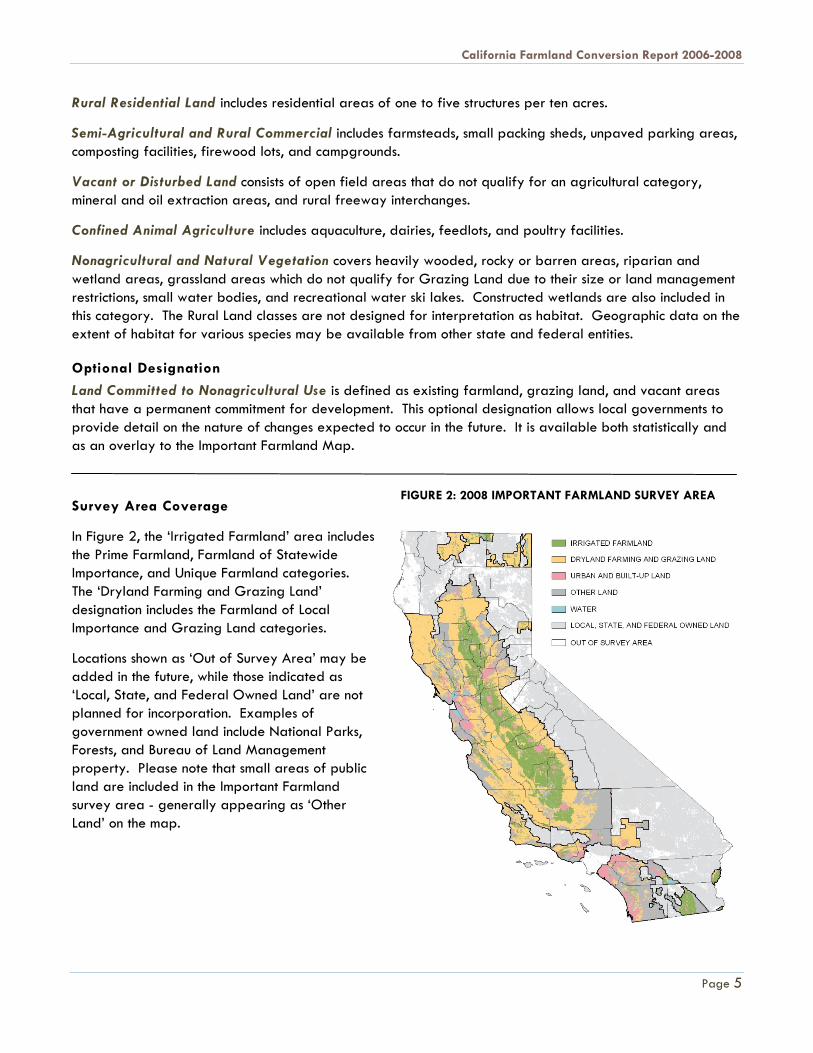
Survey Area Coverage
In Figure 2, the ‘Irrigated Farmland’ area includes the Prime Farmland, Farmland of Statewide Importance, and Unique Farmland categories. The ‘Dryland Farming and Grazing Land’ designation includes the Farmland of Local Importance and Grazing Land categories.
Locations shown as ‘Out of Survey Area’ may be added in the future, while those indicated as ‘Local, State, and Federal Owned Land’ are not planned for incorporation. Examples of government owned land include National Parks, Forests, and Bureau of Land Management property. Please note that small areas of public land are included in the Important Farmland survey area - generally appearing as ‘Other Land’ on the map.
FIGURE 2: 2008 IMPORTANT FARMLAND SURVEY AREA
California Department of Conservation
Page 6
Th i s page intent ional ly lef t blank .
California Farmland Conversion Report 2006-2008
Page 7
Chapter 2: 2006-2008 Improvements
SURVEY AREA ADDITIONS AND IMPROVED COUNTY BOUNDARY DATA HIGHLIGHT FMMP’S CONTINUOUS IMPROVEMENT. Each update cycle provides the opportunity to make improvements to the Important
Farmland data, in order to achieve increased accuracy, process efficiency, or better reporting capabilities. During the 2006-08 update, improvements included survey area additions in four counties, totaling more than 919,000 acres, and the incorporation of a new county boundary file into the 2008 data. These improvements were funded with a temporary augmentation FMMP received from the 2000 Safe Drinking Water, Clean Water, Watershed Protection, and Flood Protection Act (Proposition 13).
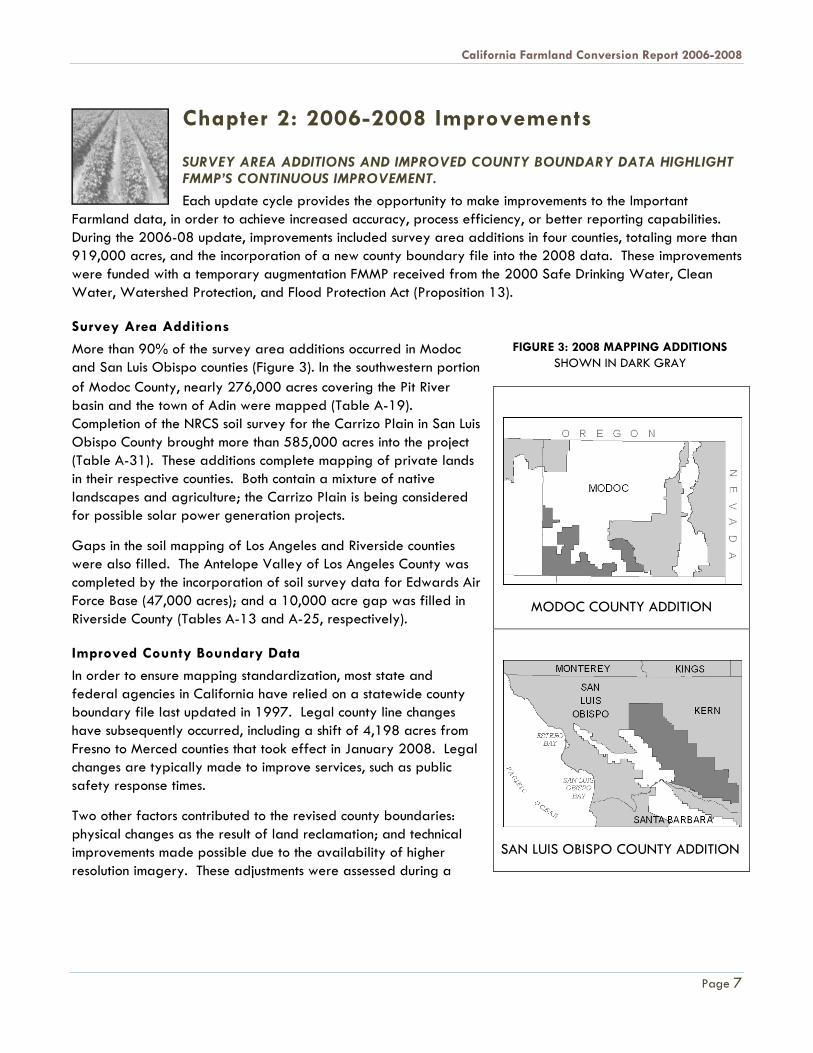
Survey Area Additions
More than 90% of the survey area additions occurred in Modoc and San Luis Obispo counties (Figure 3). In the southwestern portion of Modoc County, nearly 276,000 acres covering the Pit River basin and the town of Adin were mapped (Table A-19). Completion of the NRCS soil survey for the Carrizo Plain in San Luis Obispo County brought more than 585,000 acres into the project (Table A-31). These additions complete mapping of private lands in their respective counties. Both contain a mixture of native landscapes and agriculture; the Carrizo Plain is being considered for possible solar power generation projects.
Gaps in the soil mapping of Los Angeles and Riverside counties were also filled. The Antelope Valley of Los Angeles County was completed by the incorporation of soil survey data for Edwards Air Force Base (47,000 acres); and a 10,000 acre gap was filled in Riverside County (Tables A-13 and A-25, respectively).
Improved County Boundary Data
In order to ensure mapping standardization, most state and federal agencies in California have relied on a statewide county boundary file last updated in 1997. Legal county line changes have subsequently occurred, including a shift of 4,198 acres from Fresno to Merced counties that took effect in January 2008. Legal changes are typically made to improve services, such as public safety response times.
Two other factors contributed to the revised county boundaries: physical changes as the result of land reclamation; and technical improvements made possible due to the availability of higher resolution imagery. These adjustments were assessed during a
MODOC COUNTY ADDITION
SAN LUIS OBISPO COUNTY ADDITION
FIGURE 3: 2008 MAPPING ADDITIONS
SHOWN IN DARK GRAY
California Department of Conservation
Page 8
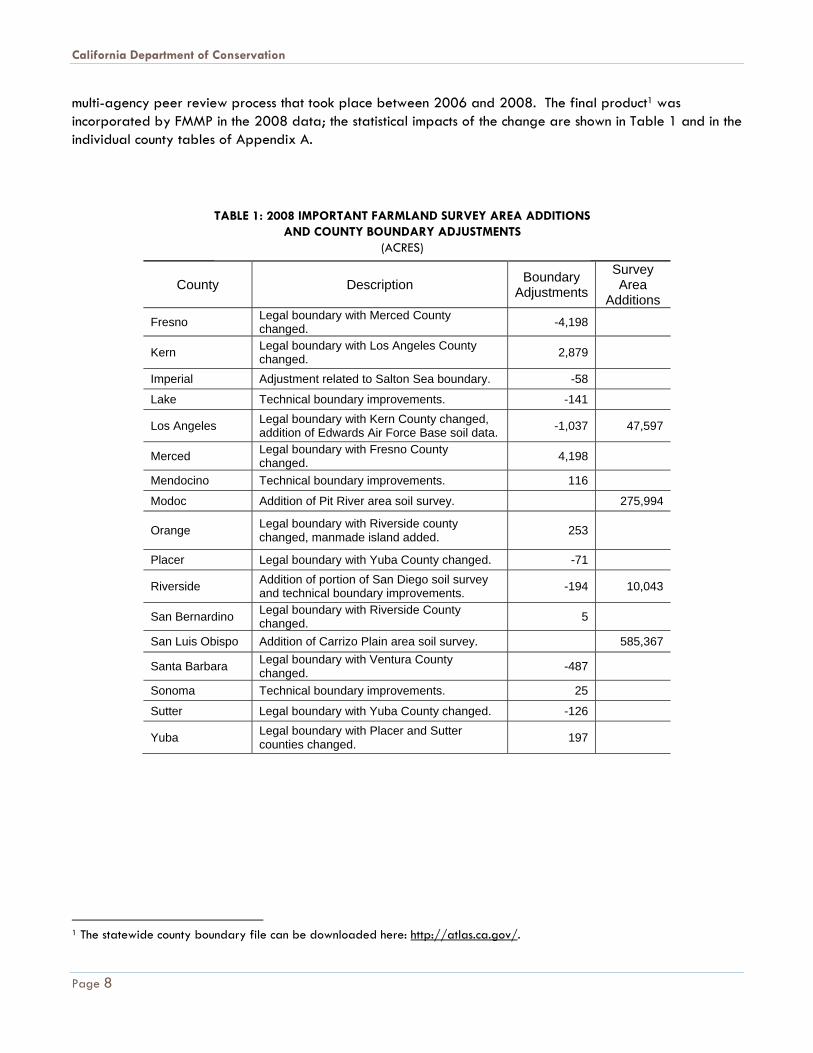
multi-agency peer review process that took place between 2006 and 2008. The final product1 was incorporated by FMMP in the 2008 data; the statistical impacts of the change are shown in Table 1 and in the individual county tables of Appendix A.
County Description Boundary Adjustments
Survey Area
Additions Fresno Legal boundary with Merced County
changed. -4,198
Kern Legal boundary with Los Angeles County changed. 2,879
Imperial Adjustment related to Salton Sea boundary. -58
Lake Technical boundary improvements. -141
Los Angeles Legal boundary with Kern County changed, addition of Edwards Air Force Base soil data. -1,037 47,597
Merced Legal boundary with Fresno County changed. 4,198
Mendocino Technical boundary improvements. 116
Modoc Addition of Pit River area soil survey. 275,994
Orange Legal boundary with Riverside county changed, manmade island added. 253
Placer Legal boundary with Yuba County changed. -71
Riverside Addition of portion of San Diego soil survey and technical boundary improvements. -194 10,043
San Bernardino Legal boundary with Riverside County changed. 5
San Luis Obispo Addition of Carrizo Plain area soil survey. 585,367
Santa Barbara Legal boundary with Ventura County changed. -487
Sonoma Technical boundary improvements. 25
Sutter Legal boundary with Yuba County changed. -126
Yuba Legal boundary with Placer and Sutter counties changed. 197
1 The statewide county boundary file can be downloaded here: http://atlas.ca.gov/.
TABLE 1: 2008 IMPORTANT FARMLAND SURVEY AREA ADDITIONS AND COUNTY BOUNDARY ADJUSTMENTS
(ACRES)
California Farmland Conversion Report 2006-2008
Page 9
Chapter 3: Understanding the Data
LOCATING AND INTERPRETING THE CALIFORNIA FARMLAND CONVERSION REPORT’S TABULAR DATA AND GRAPHICS. Important Farmland information is developed on an individual county basis, taking two
years to map the 49.1 million acre survey area. This report begins with each county’s information, compiling it in various ways to produce the summary and analysis in Chapter 4.
Source Data: County Conversion Tables - Appendix A
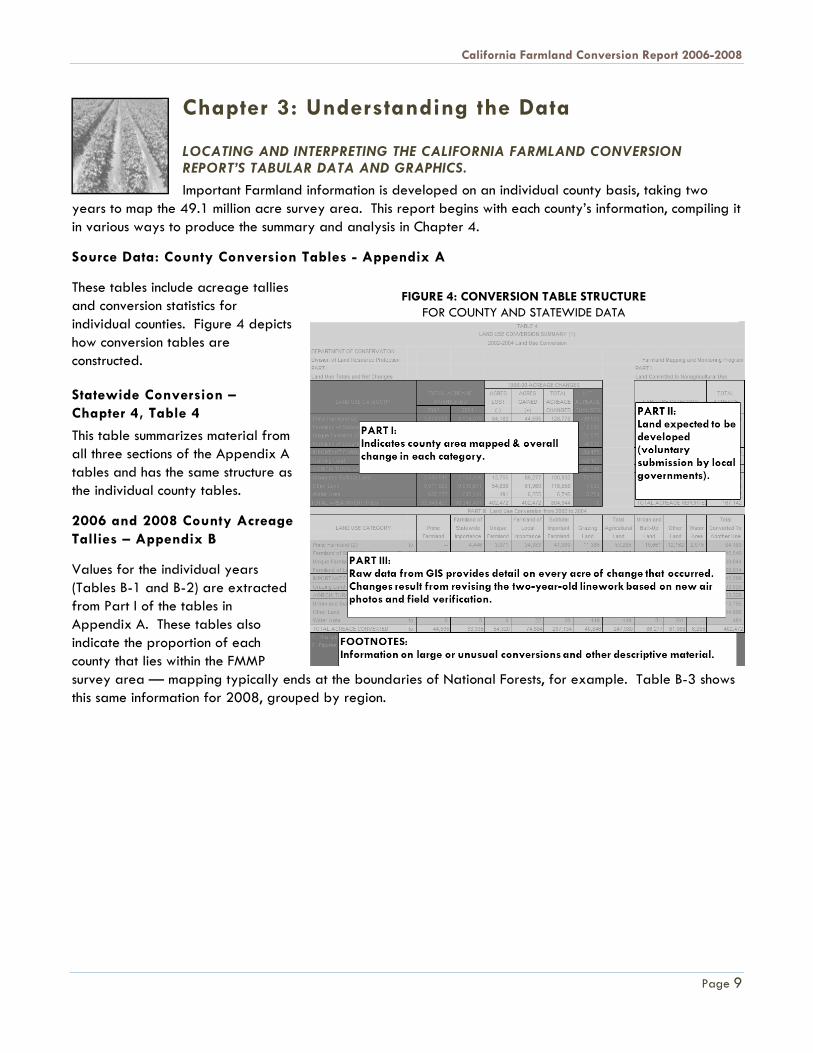
These tables include acreage tallies and conversion statistics for individual counties. Figure 4 depicts how conversion tables are constructed.
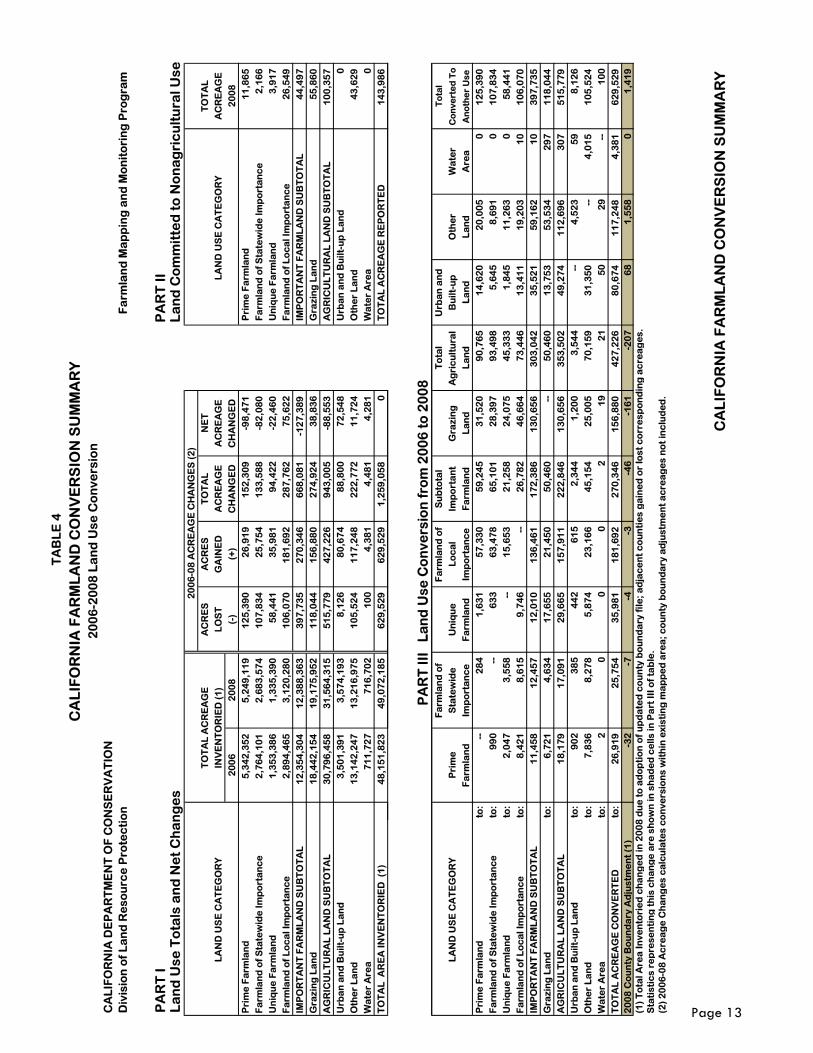
Statewide Conversion – Chapter 4, Table 4
This table summarizes material from all three sections of the Appendix A tables and has the same structure as the individual county tables.
2006 and 2008 County Acreage Tallies – Appendix B
Values for the individual years (Tables B-1 and B-2) are extracted from Part I of the tables in Appendix A. These tables also indicate the proportion of each county that lies within the FMMP survey area — mapping typically ends at the boundaries of National Forests, for example. Table B-3 shows this same information for 2008, grouped by region.
FIGURE 4: CONVERSION TABLE STRUCTURE FOR COUNTY AND STATEWIDE DATA
California Department of Conservation
Page 10
County and Regional Conversion Summaries – Appendix C
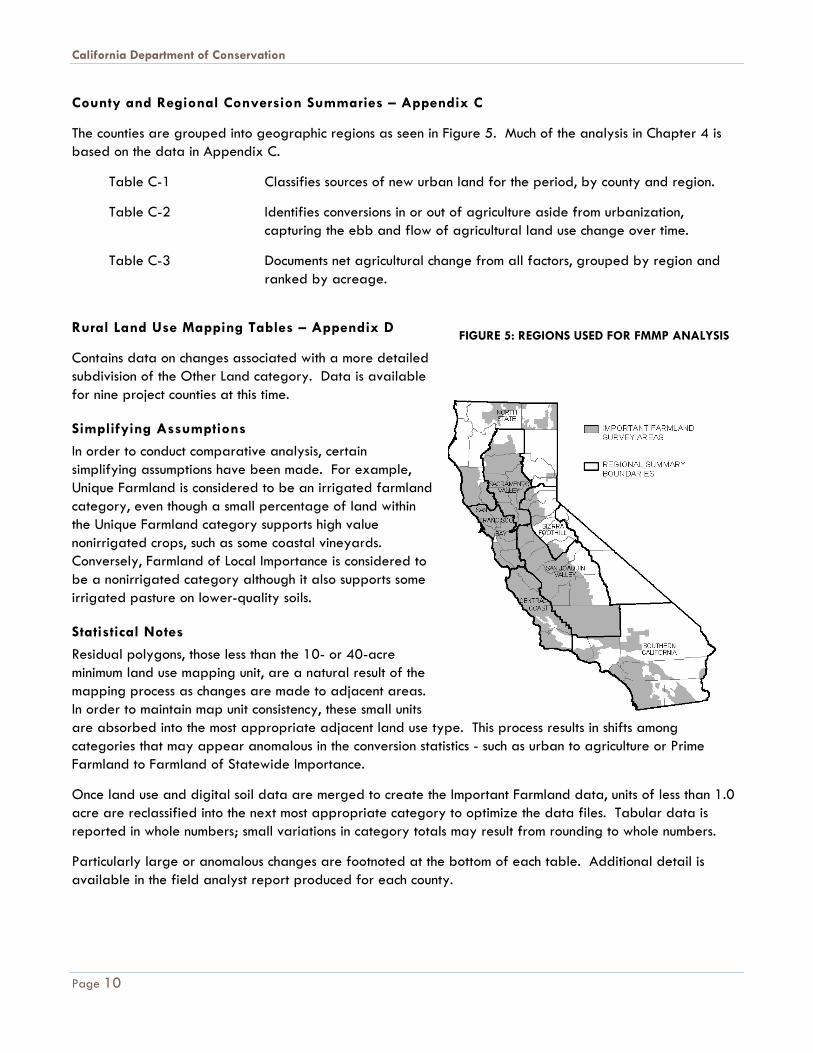
The counties are grouped into geographic regions as seen in Figure 5. Much of the analysis in Chapter 4 is based on the data in Appendix C.
Table C-1 Classifies sources of new urban land for the period, by county and region.
Table C-2 Identifies conversions in or out of agriculture aside from urbanization, capturing the ebb and flow of agricultural land use change over time.
Table C-3 Documents net agricultural change from all factors, grouped by region and ranked by acreage.
Rural Land Use Mapping Tables – Appendix D
Contains data on changes associated with a more detailed subdivision of the Other Land category. Data is available for nine project counties at this time.
Simplifying Assumptions
In order to conduct comparative analysis, certain simplifying assumptions have been made. For example, Unique Farmland is considered to be an irrigated farmland category, even though a small percentage of land within the Unique Farmland category supports high value nonirrigated crops, such as some coastal vineyards. Conversely, Farmland of Local Importance is considered to be a nonirrigated category although it also supports some irrigated pasture on lower-quality soils.
Statistical Notes
Residual polygons, those less than the 10- or 40-acre minimum land use mapping unit, are a natural result of the mapping process as changes are made to adjacent areas. In order to maintain map unit consistency, these small units are absorbed into the most appropriate adjacent land use type. This process results in shifts among categories that may appear anomalous in the conversion statistics - such as urban to agriculture or Prime Farmland to Farmland of Statewide Importance.
Once land use and digital soil data are merged to create the Important Farmland data, units of less than 1.0 acre are reclassified into the next most appropriate category to optimize the data files. Tabular data is reported in whole numbers; small variations in category totals may result from rounding to whole numbers.
Particularly large or anomalous changes are footnoted at the bottom of each table. Additional detail is available in the field analyst report produced for each county.
FIGURE 5: REGIONS USED FOR FMMP ANALYSIS
California Farmland Conversion Report 2006-2008
Page 11
FIGURE 6: STATEWIDE IMPORTANT FARMLAND CONVERSION SUMMARY (ACRES)
Chapter 4: Land Use Conversion, 2006-2008
URBANIZATION RATES DECREASED SHARPLY, WHILE IRRIGATED FARMLAND LOSSES ACCELERATED COMPARED WITH THE 2004-2006 PERIOD. LAND IDLING IN THE CENTRAL VALLEY WAS THE LARGEST CONTRIBUTOR TO FARMLAND LOSS. California’s agricultural landscape continues to evolve with economic and resource-related
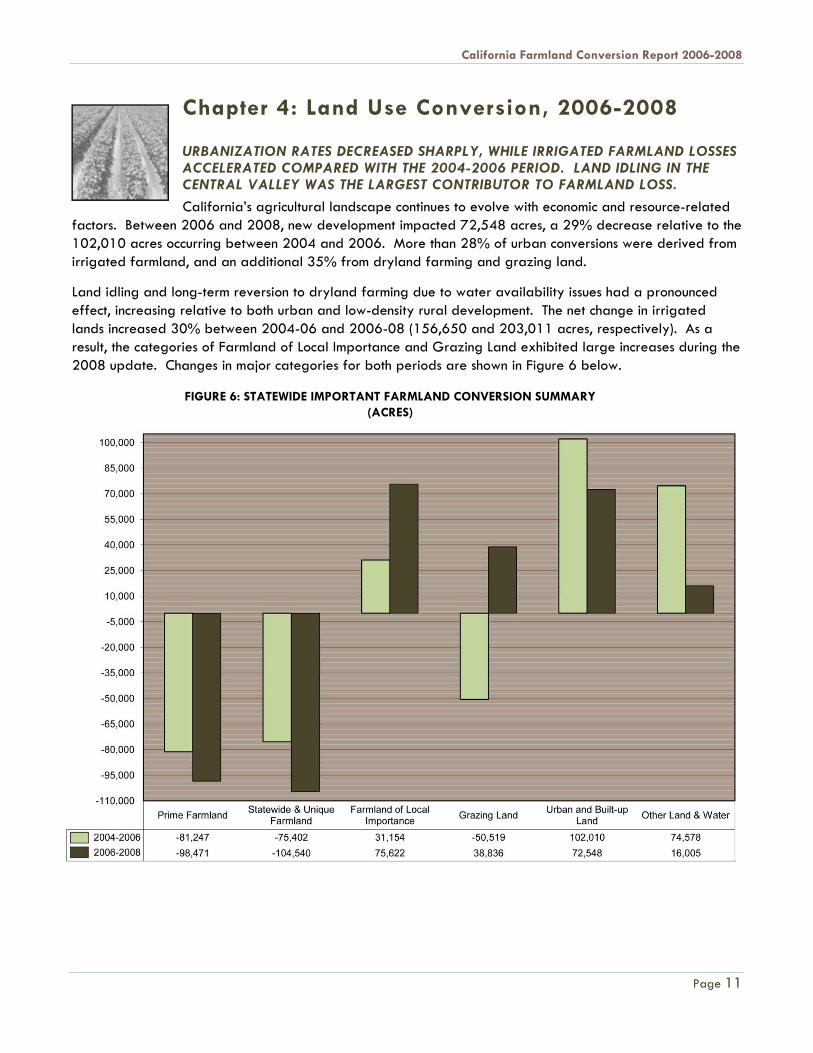
factors. Between 2006 and 2008, new development impacted 72,548 acres, a 29% decrease relative to the 102,010 acres occurring between 2004 and 2006. More than 28% of urban conversions were derived from irrigated farmland, and an additional 35% from dryland farming and grazing land.
Land idling and long-term reversion to dryland farming due to water availability issues had a pronounced effect, increasing relative to both urban and low-density rural development. The net change in irrigated lands increased 30% between 2004-06 and 2006-08 (156,650 and 203,011 acres, respectively). As a result, the categories of Farmland of Local Importance and Grazing Land exhibited large increases during the 2008 update. Changes in major categories for both periods are shown in Figure 6 below.
California Department of Conservation
Page 12
Urbanization
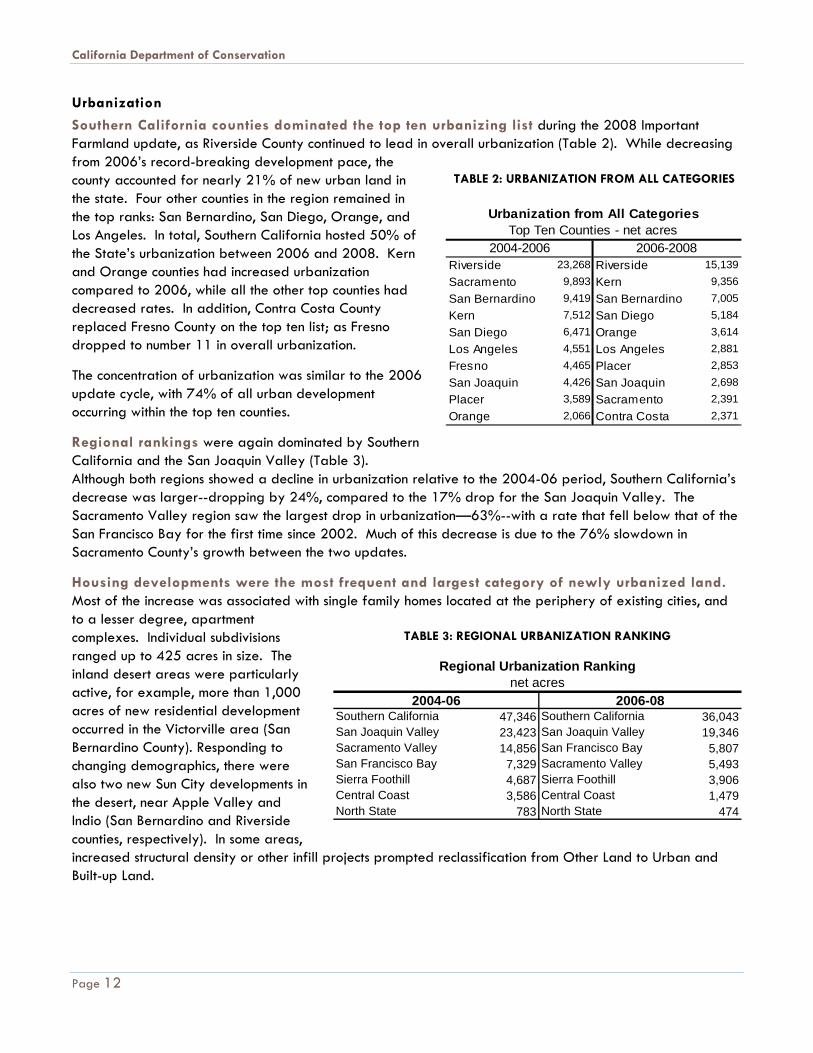
Southern California counties dominated the top ten urbanizing list during the 2008 Important Farmland update, as Riverside County continued to lead in overall urbanization (Table 2). While decreasing from 2006’s record-breaking development pace, the county accounted for nearly 21% of new urban land in the state. Four other counties in the region remained in the top ranks: San Bernardino, San Diego, Orange, and Los Angeles. In total, Southern California hosted 50% of the State’s urbanization between 2006 and 2008. Kern and Orange counties had increased urbanization compared to 2006, while all the other top counties had decreased rates. In addition, Contra Costa County replaced Fresno County on the top ten list; as Fresno dropped to number 11 in overall urbanization.
The concentration of urbanization was similar to the 2006 update cycle, with 74% of all urban development occurring within the top ten counties.
Regional rankings were again dominated by Southern California and the San Joaquin Valley (Table 3). Although both regions showed a decline in urbanization relative to the 2004-06 period, Southern California’s decrease was larger--dropping by 24%, compared to the 17% drop for the San Joaquin Valley. The Sacramento Valley region saw the largest drop in urbanization—63%--with a rate that fell below that of the San Francisco Bay for the first time since 2002. Much of this decrease is due to the 76% slowdown in Sacramento County’s growth between the two updates.
Housing developments were the most frequent and largest category of newly urbanized land. Most of the increase was associated with single family homes located at the periphery of existing cities, and to a lesser degree, apartment complexes. Individual subdivisions ranged up to 425 acres in size. The inland desert areas were particularly active, for example, more than 1,000 acres of new residential development occurred in the Victorville area (San Bernardino County). Responding to changing demographics, there were also two new Sun City developments in the desert, near Apple Valley and Indio (San Bernardino and Riverside counties, respectively). In some areas, increased structural density or other infill projects prompted reclassification from Other Land to Urban and Built-up Land.
TABLE 2: URBANIZATION FROM ALL CATEGORIES
TABLE 3: REGIONAL URBANIZATION RANKING
Southern California 47,346 Southern California 36,043San Joaquin Valley 23,423 San Joaquin Valley 19,346Sacramento Valley 14,856 San Francisco Bay 5,807San Francisco Bay 7,329 Sacramento Valley 5,493Sierra Foothill 4,687 Sierra Foothill 3,906Central Coast 3,586 Central Coast 1,479North State 783 North State 474
Regional Urbanization Ranking net acres
2004-06 2006-08
Riverside 23,268 Riverside 15,139Sacramento 9,893 Kern 9,356San Bernardino 9,419 San Bernardino 7,005Kern 7,512 San Diego 5,184San Diego 6,471 Orange 3,614Los Angeles 4,551 Los Angeles 2,881Fresno 4,465 Placer 2,853San Joaquin 4,426 San Joaquin 2,698Placer 3,589 Sacramento 2,391Orange 2,066 Contra Costa 2,371
2004-2006
Urbanization from All CategoriesTop Ten Counties - net acres
2006-2008
TA
BL
E 4
CA
LIF
OR
NIA
FA
RM
LA
ND
CO
NV
ER
SIO
N S
UM
MA
RY
20
06
-20
08
La
nd
Use
Co
nve
rsio
nC
AL
IFO
RN
IA D
EP
AR
TM
EN
T O
F C
ON
SE
RV
AT
ION
Div
isio
n o
f L
an
d R
eso
urc
e P
rote
cti
on
Fa
rmla
nd
Ma
pp
ing
an
d M
on
ito
rin
g P
rog
ram
PA
RT
I
PA
RT
IIL
an
d U
se T
ota
ls a
nd
Ne
t C
ha
ng
es
La
nd
Co
mm
itte
d t
o N
on
ag
ric
ult
ura
l Use
2
00
6-0
8 A
CR
EA
GE
CH
AN
GE
S (
2)
T
OT
AL
AC
RE
AG
EA
CR
ES
AC
RE
ST
OT
AL
NE
T
TO
TA
LL
AN
D U
SE
CA
TE
GO
RY
INV
EN
TO
RIE
D (
1)
LO
ST
GA
INE
DA
CR
EA
GE
AC
RE
AG
EL
AN
D U
SE
CA
TE
GO
RY
AC
RE
AG
E2
00
62
00
8(-
)(+
)C
HA
NG
ED
CH
AN
GE
D2
00
8P
rim
e F
arm
lan
d5
,34
2,3
52
5
,24
9,1
19
1
25
,39
0
26
,91
9
15
2,3
09
-9
8,4
71
P
rim
e F
arm
lan
d1
1,8
65
F
arm
lan
d o
f S
tate
wid
e Im
po
rta
nc
e2
,76
4,1
01
2
,68
3,5
74
1
07
,83
4
25
,75
4
13
3,5
88
-8
2,0
80
F
arm
lan
d o
f S
tate
wid
e Im
po
rta
nc
e2
,16
6
Un
iqu
e F
arm
lan
d1
,35
3,3
86
1
,33
5,3
90
5
8,4
41
3
5,9
81
9
4,4
22
-2
2,4
60
U
niq
ue
Fa
rmla
nd
3,9
17
F
arm
lan
d o
f L
oc
al I
mp
ort
an
ce
2,8
94
,46
5
3,1
20
,28
0
10
6,0
70
1
81
,69
2
28
7,7
62
7
5,6
22
F
arm
lan
d o
f L
oc
al I
mp
ort
an
ce
26
,54
9
IMP
OR
TA
NT
FA
RM
LA
ND
SU
BT
OT
AL
12
,35
4,3
04
1
2,3
88
,36
3
39
7,7
35
2
70
,34
6
66
8,0
81
-1
27
,38
9
IMP
OR
TA
NT
FA
RM
LA
ND
SU
BT
OT
AL
44
,49
7
Gra
zin
g L
an
d
18
,44
2,1
54
1
9,1
75
,95
2
11
8,0
44
1
56
,88
0
27
4,9
24
3
8,8
36
G
razi
ng
La
nd
5
5,8
60
A
GR
ICU
LT
UR
AL
LA
ND
SU
BT
OT
AL
30
,79
6,4
58
3
1,5
64
,31
5
51
5,7
79
4
27
,22
6
94
3,0
05
-8
8,5
53
A
GR
ICU
LT
UR
AL
LA
ND
SU
BT
OT
AL
10
0,3
57
U
rba
n a
nd
Bu
ilt-u
p L
an
d3
,50
1,3
91
3
,57
4,1
93
8
,12
6
80
,67
4
88
,80
0
72
,54
8
Urb
an
an
d B
uilt
-up
La
nd
0
Oth
er
La
nd
13
,14
2,2
47
1
3,2
16
,97
5
10
5,5
24
1
17
,24
8
22
2,7
72
1
1,7
24
O
the
r L
an
d4
3,6
29
W
ate
r A
rea
71
1,7
27
7
16
,70
2
10
0
4,3
81
4
,48
1
4,2
81
W
ate
r A
rea
0
TO
TA
L A
RE
A IN
VE
NT
OR
IED
(1
)4
8,1
51
,82
3
49
,07
2,1
85
6
29
,52
9
62
9,5
29
1
,25
9,0
58
0
T
OT
AL
AC
RE
AG
E R
EP
OR
TE
D1
43
,98
6
PA
RT
III
La
nd
Use
Co
nve
rsio
n f
rom
20
06
to
20
08
PA
RT
III
La
nd
Use
Co
nve
rsio
n f
rom
20
06
to
20
08
Fa
rmla
nd
of
Fa
rmla
nd
of
Su
bto
tal
To
tal
Urb
an
an
dT
ota
l
LA
ND
US
E C
AT
EG
OR
YP
rim
eS
tate
wid
eU
niq
ue
Lo
ca
lIm
po
rta
nt
Gra
zin
gA
gri
cu
ltu
ral
Bu
ilt-u
pO
the
rW
ate
rC
on
vert
ed
To
Fa
rmla
nd
Imp
ort
an
ce
Fa
rmla
nd
Imp
ort
an
ce
Fa
rmla
nd
La
nd
La
nd
La
nd
La
nd
Are
aA
no
the
r U
se
Pri
me
Fa
rmla
nd
to:
--
28
4
1,6
31
5
7,3
30
5
9,2
45
3
1,5
20
9
0,7
65
1
4,6
20
2
0,0
05
0
1
25
,39
0
Fa
rmla
nd
of
Sta
tew
ide
Imp
ort
an
ce
to:
99
0
--
63
3
63
,47
8
65
,10
1
28
,39
7
93
,49
8
5,6
45
8
,69
1
0
10
7,8
34
U
niq
ue
Fa
rmla
nd
to:
2,0
47
3
,55
8
--
15
,65
3
21
,25
8
24
,07
5
45
,33
3
1,8
45
1
1,2
63
0
5
8,4
41
F
arm
lan
d o
f L
oc
al I
mp
ort
an
ce
to:
8,4
21
8
,61
5
9,7
46
-
- 2
6,7
82
4
6,6
64
7
3,4
46
1
3,4
11
1
9,2
03
1
0
10
6,0
70
IM
PO
RT
AN
T F
AR
ML
AN
D S
UB
TO
TA
L1
1,4
58
1
2,4
57
1
2,0
10
1
36
,46
1
17
2,3
86
1
30
,65
6
30
3,0
42
3
5,5
21
5
9,1
62
1
0
39
7,7
35
G
razi
ng
La
nd
to
:6
,72
1
4,6
34
1
7,6
55
2
1,4
50
5
0,4
60
-
- 5
0,4
60
1
3,7
53
5
3,5
34
2
97
1
18
,04
4
AG
RIC
UL
TU
RA
L L
AN
D S
UB
TO
TA
L1
8,1
79
1
7,0
91
2
9,6
65
1
57
,91
1
22
2,8
46
1
30
,65
6
35
3,5
02
4
9,2
74
1
12
,69
6
30
7
51
5,7
79
U
rba
n a
nd
Bu
ilt-u
p L
an
dto
:9
02
3
85
4
42
6
15
2
,34
4
1,2
00
3
,54
4
--
4,5
23
5
9
8,1
26
O
the
r L
an
dto
:7
,83
6
8,2
78
5
,87
4
23
,16
6
45
,15
4
25
,00
5
70
,15
9
31
,35
0
--
4,0
15
1
05
,52
4
Wa
ter
Are
ato
:2
0
0
0
2
1
9
21
5
0
29
-
- 1
00
T
OT
AL
AC
RE
AG
E C
ON
VE
RT
ED
to
:2
6,9
19
2
5,7
54
3
5,9
81
1
81
,69
2
27
0,3
46
1
56
,88
0
42
7,2
26
8
0,6
74
1
17
,24
8
4,3
81
6
29
,52
9
20
08
Co
un
ty B
ou
nd
ary
Ad
just
me
nt
(1)
-32
-7
-4
-3
-4
6
-16
1
-20
7
68
1
,55
8
0
1,4
19
(1
) T
ota
l Are
a In
ven
tori
ed
ch
an
ge
d in
20
08
du
e t
o a
do
pti
on
of
up
da
ted
co
un
ty b
ou
nd
ary
file
; ad
jac
en
t c
ou
nti
es
ga
ine
d o
r lo
st c
orr
esp
on
din
g a
cre
ag
es.
Sta
tist
ics
rep
rese
nti
ng
th
is c
ha
ng
e a
re s
ho
wn
in s
ha
de
d c
ells
in P
art
III o
f ta
ble
. (2
) 2
00
6-0
8 A
cre
ag
e C
ha
ng
es
ca
lcu
late
s c
on
vers
ion
s w
ith
in e
xist
ing
ma
pp
ed
are
a; c
ou
nty
bo
un
da
ry a
dju
stm
en
t a
cre
ag
es
no
t in
clu
de
d.
C
AL
IFO
RN
IA F
AR
ML
AN
D C
ON
VE
RS
ION
SU
MM
AR
Y
Page 13
California Department of Conservation
Page 14
Community infrastructure and commercial development were also common. Counties high on the urbanization list typically hosted one or more new golf courses (190 to 300 acres each) and 300 to 500 acres of new schools and parks. Regional differences were also noted: while large warehouse facilities were common in Riverside and San Bernardino counties (a single complex in Redlands totaled 240 acres); water infrastructure took precedence in Kern County, where more than one third of newly developed land was devoted to groundwater recharge basins or water treatment facilities. The impact of the economic recession was also seen, as a partially built 80 acre shopping mall was added in Sacramento County—all structural elements were in place to qualify the land for the Urban and Built-up category. Other notable changes included a new runway at the NASA Dryden Space Center (Kern County, 75 acres), and some of the first new energy-related uses such as a solar facility in Kern County (10 acres) and an ethanol station in San Joaquin County (20 acres).
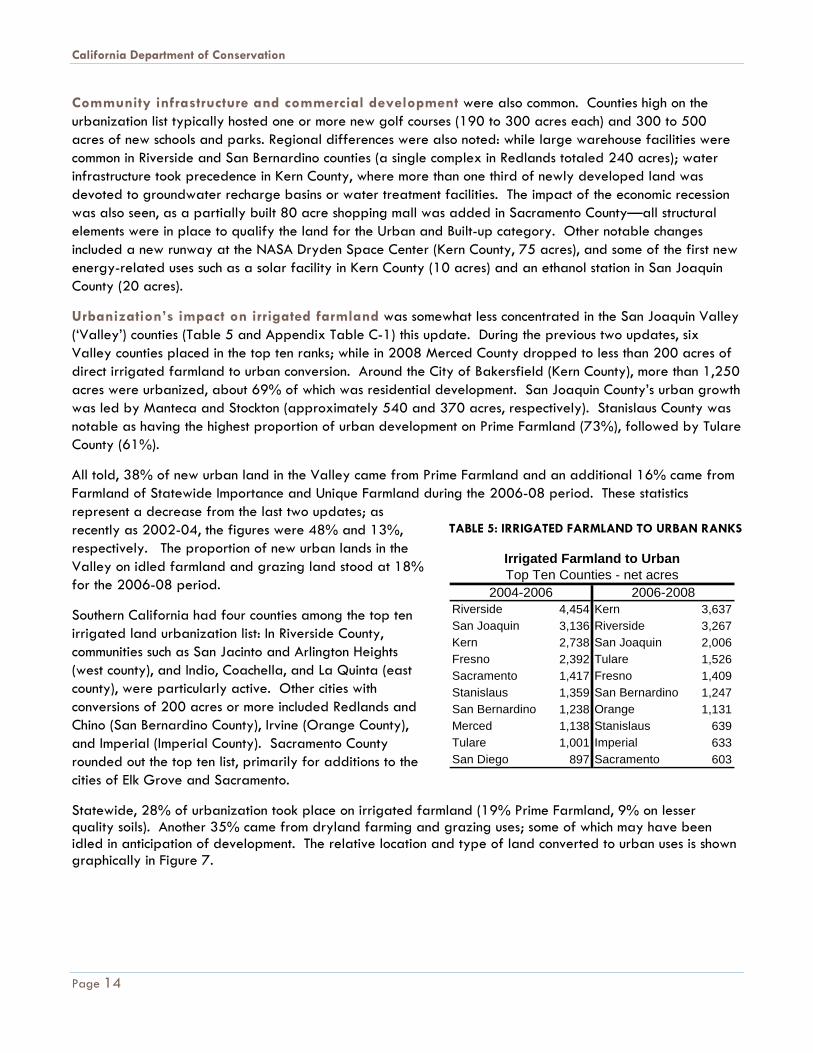
Urbanization’s impact on irrigated farmland was somewhat less concentrated in the San Joaquin Valley (‘Valley’) counties (Table 5 and Appendix Table C-1) this update. During the previous two updates, six Valley counties placed in the top ten ranks; while in 2008 Merced County dropped to less than 200 acres of direct irrigated farmland to urban conversion. Around the City of Bakersfield (Kern County), more than 1,250 acres were urbanized, about 69% of which was residential development. San Joaquin County’s urban growth was led by Manteca and Stockton (approximately 540 and 370 acres, respectively). Stanislaus County was notable as having the highest proportion of urban development on Prime Farmland (73%), followed by Tulare County (61%).
All told, 38% of new urban land in the Valley came from Prime Farmland and an additional 16% came from Farmland of Statewide Importance and Unique Farmland during the 2006-08 period. These statistics represent a decrease from the last two updates; as recently as 2002-04, the figures were 48% and 13%, respectively. The proportion of new urban lands in the Valley on idled farmland and grazing land stood at 18% for the 2006-08 period.
Southern California had four counties among the top ten irrigated land urbanization list: In Riverside County, communities such as San Jacinto and Arlington Heights (west county), and Indio, Coachella, and La Quinta (east county), were particularly active. Other cities with conversions of 200 acres or more included Redlands and Chino (San Bernardino County), Irvine (Orange County), and Imperial (Imperial County). Sacramento County rounded out the top ten list, primarily for additions to the cities of Elk Grove and Sacramento.
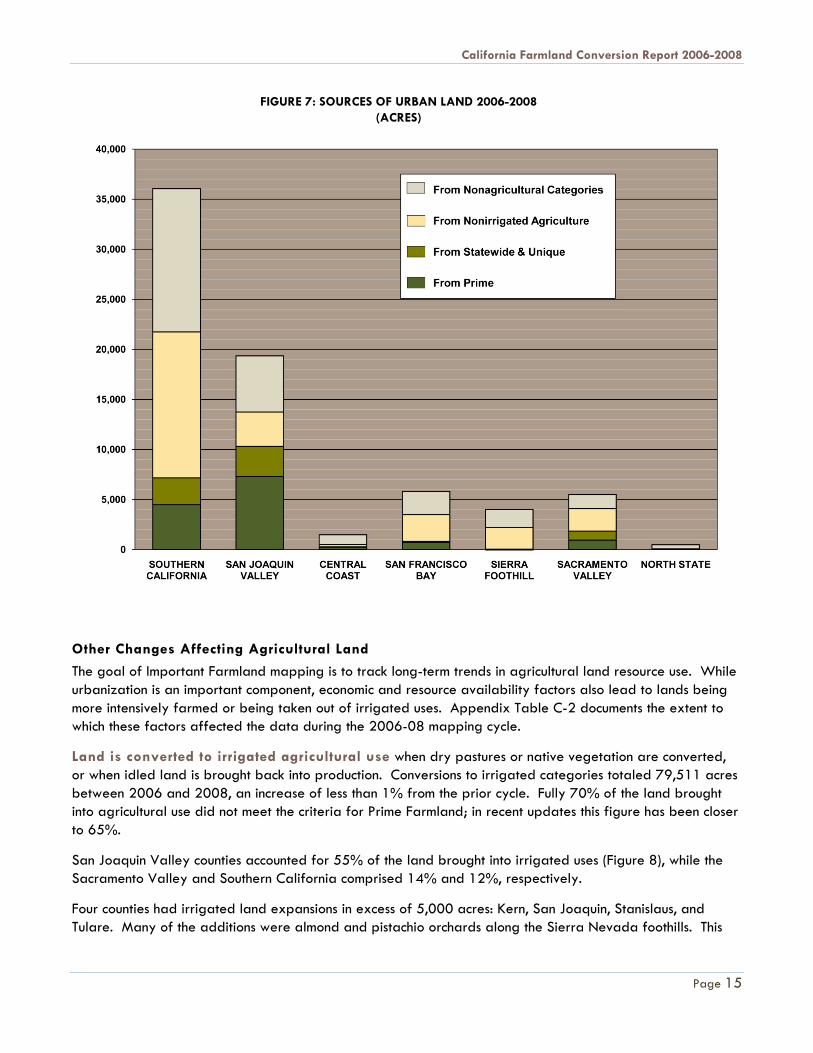
Statewide, 28% of urbanization took place on irrigated farmland (19% Prime Farmland, 9% on lesser quality soils). Another 35% came from dryland farming and grazing uses; some of which may have been idled in anticipation of development. The relative location and type of land converted to urban uses is shown graphically in Figure 7.
TABLE 5: IRRIGATED FARMLAND TO URBAN RANKS
Riverside 4,454 Kern 3,637San Joaquin 3,136 Riverside 3,267Kern 2,738 San Joaquin 2,006Fresno 2,392 Tulare 1,526Sacramento 1,417 Fresno 1,409Stanislaus 1,359 San Bernardino 1,247San Bernardino 1,238 Orange 1,131Merced 1,138 Stanislaus 639Tulare 1,001 Imperial 633San Diego 897 Sacramento 603
2004-2006 2006-2008
Irrigated Farmland to UrbanTop Ten Counties - net acres
California Farmland Conversion Report 2006-2008
Page 15
FIGURE 7: SOURCES OF URBAN LAND 2006-2008 (ACRES)
Other Changes Affecting Agricultural Land
The goal of Important Farmland mapping is to track long-term trends in agricultural land resource use. While urbanization is an important component, economic and resource availability factors also lead to lands being more intensively farmed or being taken out of irrigated uses. Appendix Table C-2 documents the extent to which these factors affected the data during the 2006-08 mapping cycle.
Land is converted to irrigated agricultural use when dry pastures or native vegetation are converted, or when idled land is brought back into production. Conversions to irrigated categories totaled 79,511 acres between 2006 and 2008, an increase of less than 1% from the prior cycle. Fully 70% of the land brought into agricultural use did not meet the criteria for Prime Farmland; in recent updates this figure has been closer to 65%.
San Joaquin Valley counties accounted for 55% of the land brought into irrigated uses (Figure 8), while the Sacramento Valley and Southern California comprised 14% and 12%, respectively.
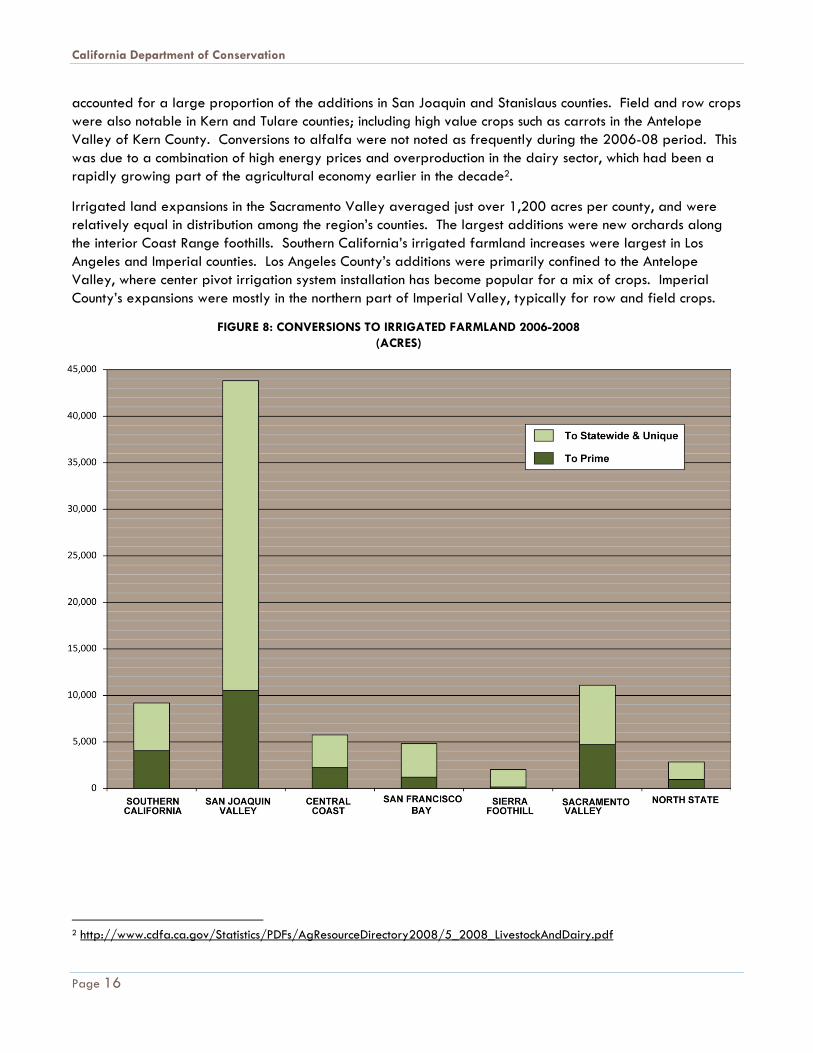
Four counties had irrigated land expansions in excess of 5,000 acres: Kern, San Joaquin, Stanislaus, and Tulare. Many of the additions were almond and pistachio orchards along the Sierra Nevada foothills. This
California Department of Conservation
Page 16
accounted for a large proportion of the additions in San Joaquin and Stanislaus counties. Field and row crops were also notable in Kern and Tulare counties; including high value crops such as carrots in the Antelope Valley of Kern County. Conversions to alfalfa were not noted as frequently during the 2006-08 period. This was due to a combination of high energy prices and overproduction in the dairy sector, which had been a rapidly growing part of the agricultural economy earlier in the decade2.
Irrigated land expansions in the Sacramento Valley averaged just over 1,200 acres per county, and were relatively equal in distribution among the region’s counties. The largest additions were new orchards along the interior Coast Range foothills. Southern California’s irrigated farmland increases were largest in Los Angeles and Imperial counties. Los Angeles County’s additions were primarily confined to the Antelope Valley, where center pivot irrigation system installation has become popular for a mix of crops. Imperial County’s expansions were mostly in the northern part of Imperial Valley, typically for row and field crops.
FIGURE 8: CONVERSIONS TO IRRIGATED FARMLAND 2006-2008 (ACRES)
2 http://www.cdfa.ca.gov/Statistics/PDFs/AgResourceDirectory2008/5_2008_LivestockAndDairy.pdf
California Farmland Conversion Report 2006-2008
Page 17
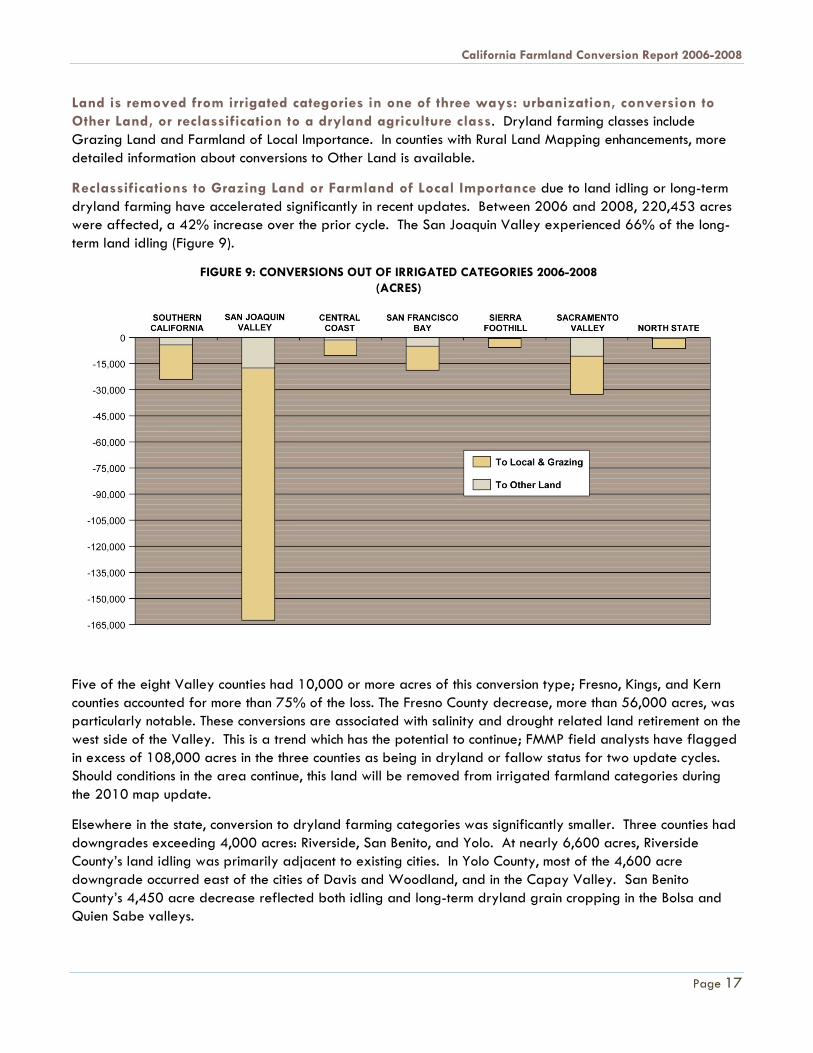
Land is removed from irrigated categories in one of three ways: urbanization, conversion to Other Land, or reclassification to a dryland agriculture class. Dryland farming classes include Grazing Land and Farmland of Local Importance. In counties with Rural Land Mapping enhancements, more detailed information about conversions to Other Land is available.
Reclassifications to Grazing Land or Farmland of Local Importance due to land idling or long-term dryland farming have accelerated significantly in recent updates. Between 2006 and 2008, 220,453 acres were affected, a 42% increase over the prior cycle. The San Joaquin Valley experienced 66% of the long-term land idling (Figure 9).
FIGURE 9: CONVERSIONS OUT OF IRRIGATED CATEGORIES 2006-2008 (ACRES)
Five of the eight Valley counties had 10,000 or more acres of this conversion type; Fresno, Kings, and Kern counties accounted for more than 75% of the loss. The Fresno County decrease, more than 56,000 acres, was particularly notable. These conversions are associated with salinity and drought related land retirement on the west side of the Valley. This is a trend which has the potential to continue; FMMP field analysts have flagged in excess of 108,000 acres in the three counties as being in dryland or fallow status for two update cycles. Should conditions in the area continue, this land will be removed from irrigated farmland categories during the 2010 map update.
Elsewhere in the state, conversion to dryland farming categories was significantly smaller. Three counties had downgrades exceeding 4,000 acres: Riverside, San Benito, and Yolo. At nearly 6,600 acres, Riverside County’s land idling was primarily adjacent to existing cities. In Yolo County, most of the 4,600 acre downgrade occurred east of the cities of Davis and Woodland, and in the Capay Valley. San Benito County’s 4,450 acre decrease reflected both idling and long-term dryland grain cropping in the Bolsa and Quien Sabe valleys.
California Department of Conservation
Page 18
Reclassification to Other Land is less frequent but is typically more permanent in nature than land idling. This is because many of the new uses involve low density residential development, mining, ecological restoration, or similar changes.
Between 2006 and 2008, 39,959 acres statewide were reclassified from irrigated agriculture to Other Land. This was a 23% decrease from the prior update cycle. San Joaquin and Sacramento Valley counties accounted for 44% and 27% of the total, respectively. The most active counties for conversion to Other Land were Fresno, San Joaquin, Stanislaus, and Yolo; at between 3,100 and 3,800 acres each. While rural residential development has been most frequently cited in recent updates; vacant or disturbed land gained more prominence in 2008. This included subdivisions where development began but was abandoned before urban infrastructure was complete (Fresno and San Joaquin counties), and mining areas (San Joaquin County). The Teal Ridge and Roosevelt Ranch ecological restoration projects accounted for a large proportion of the Other Land conversions in Yolo County. Stanislaus County had a combination of the above factors as well as dairy and poultry facility expansion.
Counties with Rural Land Mapping Enhancements
Nearly 27% of the Important Farmland survey area is classified as Other Land. While urbanization has historically been the driving force in agricultural land loss, FMMP’s statistics indicate that for every five acres exiting crop or grazing uses, four convert to Urban Land and one converts to Other Land. Because the Other Land category encompasses a disparate group of land uses, and conversions to Other Land are most often geographically separated from urban centers; users requested more specific information about this conversion type. A four county San Joaquin Valley pilot project, which created the subcategories of Rural Residential and Commercial, Confined Animal Agriculture, Vacant or Disturbed Land, and Nonagricultural Vegetation, began in 2002. The effort has expanded on a funds-available basis to include all eight San Joaquin Valley counties and Mendocino County, which had its initial Important Farmland Map compiled in 2006. Also in 2006, the Rural Residential uses and Rural Commercial uses were placed in separate categories, to better differentiate agricultural support infrastructure from low-density rural residences. Definitions for all five Rural Land Mapping categories are shown on page 5. County level data and summaries discussed here are located in Appendix D.
Between 2006 and 2008, expansion of Rural Land Mapping categories totaled 20,108 acres (Appendix Tables D-1 and D-2). This is numerically larger than the last update (18,410 acres), however, the number of counties available for comparison increased from four to nine.
Growth in the Rural Residential category had the largest acreage increase (13,481 acres or 8.1%); with more than 5,000 acres of the conversion occurring in Kern County. San Joaquin, Tulare, and Madera counties each had in excess of 2,000 acres of low-density residential development during the update cycle. Notably, larger proportions of Rural Residential Land were carved from grazing or dry farmed land than irrigated land in Kern, Madera, and Tulare counties; while in San Joaquin County more than half of the rural subdivision lands affected irrigated farmland. Stanislaus County had the highest percentage of new rural residences derived from irrigated farmland (1,229 out of 1,447 acres, or 85%).
Expansions of the Semi-agricultural and Rural Commercial category led on a percentage basis (8.4%), but owing to the smaller footprint of agricultural support uses, the increase totaled less than 3,100 acres. More than 1,000 acres of the increase in this category occurred in Kern County; farmsteads and compost facilities were examples of the expanded agriculture support infrastructure.
California Farmland Conversion Report 2006-2008
Page 19
Vacant or Disturbed Land increases were significantly larger in 2006-08 compared to 2004-06 (4,620 and 901 acres, respectively). These conversions were distributed primarily in Fresno, Kern, and Merced counties. To a large degree these were formerly farmed lands which were disturbed in preparation for residential subdivisions; but infrastructure was not completed due to the downturn in the real estate market.
Confined Animal Agriculture facilities grew by 2,398 acres, mostly due to dairy expansions in Kings and Tulare counties. The acreage was slightly smaller than the 2,579 acres converted during the prior update. The only Rural Land category to show a decrease was Nongricultural Vegetation (by 3,454 acres or -0.1%). Small increases in Nonagricultural Vegetation in most counties were offset by changes in Kern County, as more than 3,000 acres were brought into irrigated production in the Antelope Valley and remote parts of the San Joaquin Valley.
Net Irrigated Farmland Change
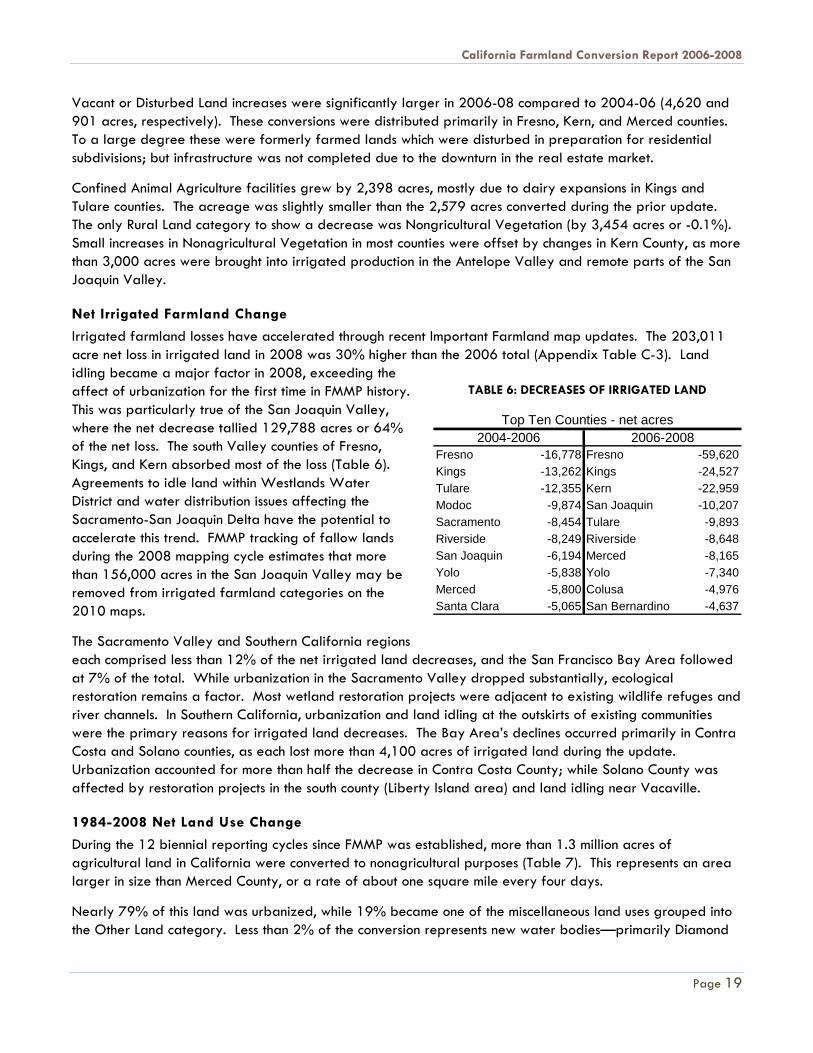
Irrigated farmland losses have accelerated through recent Important Farmland map updates. The 203,011 acre net loss in irrigated land in 2008 was 30% higher than the 2006 total (Appendix Table C-3). Land idling became a major factor in 2008, exceeding the affect of urbanization for the first time in FMMP history. This was particularly true of the San Joaquin Valley, where the net decrease tallied 129,788 acres or 64% of the net loss. The south Valley counties of Fresno, Kings, and Kern absorbed most of the loss (Table 6). Agreements to idle land within Westlands Water District and water distribution issues affecting the Sacramento-San Joaquin Delta have the potential to accelerate this trend. FMMP tracking of fallow lands during the 2008 mapping cycle estimates that more than 156,000 acres in the San Joaquin Valley may be removed from irrigated farmland categories on the 2010 maps.
The Sacramento Valley and Southern California regions each comprised less than 12% of the net irrigated land decreases, and the San Francisco Bay Area followed at 7% of the total. While urbanization in the Sacramento Valley dropped substantially, ecological restoration remains a factor. Most wetland restoration projects were adjacent to existing wildlife refuges and river channels. In Southern California, urbanization and land idling at the outskirts of existing communities were the primary reasons for irrigated land decreases. The Bay Area’s declines occurred primarily in Contra Costa and Solano counties, as each lost more than 4,100 acres of irrigated land during the update. Urbanization accounted for more than half the decrease in Contra Costa County; while Solano County was affected by restoration projects in the south county (Liberty Island area) and land idling near Vacaville.
1984-2008 Net Land Use Change
During the 12 biennial reporting cycles since FMMP was established, more than 1.3 million acres of agricultural land in California were converted to nonagricultural purposes (Table 7). This represents an area larger in size than Merced County, or a rate of about one square mile every four days.
Nearly 79% of this land was urbanized, while 19% became one of the miscellaneous land uses grouped into the Other Land category. Less than 2% of the conversion represents new water bodies—primarily Diamond
TABLE 6: DECREASES OF IRRIGATED LAND
Fresno -16,778 Fresno -59,620Kings -13,262 Kings -24,527Tulare -12,355 Kern -22,959Modoc -9,874 San Joaquin -10,207Sacramento -8,454 Tulare -9,893Riverside -8,249 Riverside -8,648San Joaquin -6,194 Merced -8,165Yolo -5,838 Yolo -7,340Merced -5,800 Colusa -4,976Santa Clara -5,065 San Bernardino -4,637
2004-2006 2006-2008Top Ten Counties - net acres
California Department of Conservation
Page 20
Valley Lake, Lake Sonoma, and Los Vaqueros Reservoir (in Riverside, Sonoma, and Contra Costa counties, respectively) or flooding of San Joaquin Delta islands for habitat (Contra Costa and Solano counties).
The largest losses from agricultural land categories have been from Prime Farmland and Grazing Land (559,743 and 386,525 acres, respectively). Urbanization at the periphery of California cities, many of which are located in agricultural valleys and coastal zones, is the primary reason these categories are most affected. Unique Farmland showed a small net increase over the 24 year period (19,279 acres) due to expansion of high value crops—mostly orchards and vineyards—on hilly terrain. Totals and annual averages for changes in all the categories are listed in Table 7.
As 2010 mapping proceeds, economic and environmental challenges face California, and the nation as a whole. Agricultural lands will continue to reflect how these complex systems interact on the landscape. FMMP will support informed planning decisions with timely and accurate data, capturing these trends as they evolve.
DE
PA
RT
ME
NT
OF
CO
NS
ER
VA
TIO
ND
ivis
ion
of
La
nd
Re
sou
rce
Pro
tec
tio
nF
arm
lan
d M
ap
pin
g a
nd
Mo
nit
ori
ng
Pro
gra
m
LA
ND
US
E C
AT
EG
OR
Y1
98
4-
19
86
19
86
-1
98
81
98
8-
19
90
19
90
-1
99
21
99
2-
19
94
19
94
-1
99
61
99
6-
19
98
19
98
-2
00
02
00
0-
20
02
20
02
-2
00
42
00
4-
20
06
(3
)2
00
6-
20
08
To
tal
Ch
an
ge
Ave
rag
e
An
nu
al
Ch
an
ge
Pri
me
Fa
rmla
nd
-18
,92
5-6
,77
3-2
9,2
59
-31
,00
2-5
3,2
65
-37
,51
6-3
3,4
12
-44
,12
6-4
7,1
72
-78
,57
5-8
1,2
47
-98
,47
1-5
59
,74
3-2
3,3
23
Fa
rmla
nd
of
Sta
tew
ide
Imp
ort
an
ce
-21
,44
99
25
7,2
82
-12
,97
8-3
,04
9-2
6,7
95
-20
,77
1-1
1,1
26
-18
,28
1-4
0,4
65
-57
,31
8-8
2,0
80
-28
6,1
05
-11
,92
1U
niq
ue
Fa
rmla
nd
7,1
79
22
,74
78
,12
5-1
2,6
11
-10
,53
03
,60
02
2,4
93
19
,68
81
3,1
16
-13
,98
4-1
8,0
84
-22
,46
01
9,2
79
80
3F
arm
lan
d o
f L
oc
al I
mp
ort
an
ce
13
,83
3-7
9,0
60
-40
,51
2-2
2,6
43
16
,98
27
,54
48
,30
4-1
7,6
99
-59
,03
96
,68
73
1,1
54
75
,62
2-5
8,8
27
-2,4
51
Irri
ga
ted
Fa
rmla
nd
(3
)0
2,0
66
2,3
46
-5,8
51
-3,5
17
-5,1
16
-8,7
83
-6,4
75
-1,6
26
-5,6
20
00
-32
,57
6-1
,35
7N
on
irri
ga
ted
Fa
rmla
nd
(3
)0
13
39
6-1
,21
11
60
-1,8
95
-2,0
33
-4,5
18
-1,6
80
-1,6
15
00
-12
,56
3-5
23
To
tal I
mp
ort
an
t F
arm
lan
d-1
9,3
62
-59
,96
2-5
1,9
22
-86
,29
6-5
3,2
19
-60
,17
8-3
4,2
02
-64
,25
6-1
14
,68
2-1
33
,57
2-1
25
,49
5-1
27
,38
9-9
30
,53
5-3
8,7
72
Gra
zin
g L
an
d-3
8,2
02
-30
,48
1-7
1,4
84
-43
,37
8-1
79
24
,55
1-7
0,1
08
-49
,27
3-5
8,8
78
-37
,41
0-5
0,5
19
38
,83
6-3
86
,52
5-1
6,1
05
To
tal A
gri
cu
ltu
ral L
an
d
(Im
po
rta
nt
Fa
rmla
nd
+ G
razi
ng
La
nd
)-5
7,5
64
-90
,44
3-1
23
,40
6-1
29
,67
4-5
3,3
98
-35
,62
7-1
04
,31
0-1
13
,52
9-1
73
,56
0-1
70
,98
2-1
76
,01
4-8
8,5
53
-1,3
17
,06
0-5
4,8
78
Urb
an
an
d B
uilt
-up
La
nd
81
,77
81
07
,56
71
16
,53
09
4,8
76
53
,34
45
5,8
59
69
,88
59
1,2
58
92
,75
01
01
,82
51
02
,01
07
2,5
48
1,0
40
,23
04
3,3
43
Oth
er
La
nd
-30
,19
0-1
6,6
69
5,6
49
34
,35
8-1
,48
4-1
9,7
78
33
,08
21
6,5
68
80
,80
96
7,6
43
73
,78
91
1,7
24
25
5,5
01
10
,64
6W
ate
r5
,97
6-4
55
1,2
27
44
01
,53
8-4
54
1,3
43
5,7
03
11
,51
47
89
4,2
81
21
,90
39
13
To
tal A
rea
Inve
nto
rie
d F
or
Ch
an
ge
(2
)3
0.3
33
.34
0.3
42
.24
2.8
42
.84
4.1
44
.24
5.9
45
.94
6.1
49
.1
(3)
Du
e t
o c
om
ple
tio
n o
f N
RC
S s
oil
surv
eys
, In
teri
m m
ap
pin
g c
lass
es
are
no
lon
ge
r n
ee
de
d a
s o
f th
e 2
00
4 d
ata
.
(2)
To
tal A
rea
Inve
nto
rie
d in
cre
ase
d a
s N
RC
S c
om
ple
ted
mo
de
rn s
oil
surv
eys
an
d F
MM
P in
itia
ted
ma
pp
ing
. A
rea
s a
dd
ed
inc
lud
e: 1
98
6--
ce
ntr
al S
iski
you
, Bu
tte
, Co
lusa
; 19
88
--K
ern
, Sa
cra
me
nto
, ea
ste
rn S
an
M
ate
o, S
utt
er,
Tu
lare
, Yu
ba
; 19
90
--S
an
Jo
aq
uin
; 19
92
--w
est
ern
Me
rce
d; 1
99
6--
La
ke, B
utt
e V
alle
y/T
ule
lake
(c
ove
rs e
ast
ern
Sis
kiyo
u &
we
ste
rn M
od
oc
); 2
00
0--
we
ste
rn S
tan
isla
us,
we
ste
rn F
resn
o; 2
00
4--
no
rth
ea
ste
rn S
tan
isla
us;
20
06
--M
en
do
cin
o C
ou
nty
; 2
00
8--
Ca
rriz
o P
lain
are
a (
Sa
n L
uis
Ob
isp
o C
ou
nty
) &
Ad
in a
rea
(M
od
oc
Co
un
ty).
Th
is r
ep
rese
nts
an
inc
rea
se o
f 6
2%
in t
he
pro
jec
t a
rea
be
twe
en
19
84
an
d
20
08
.
(1)
Fig
ure
s ta
ken
fro
m t
he
pro
jec
twid
e c
on
vers
ion
su
mm
ary
in e
ac
h o
f th
e C
alif
orn
ia F
arm
lan
d C
on
vers
ion
Re
po
rts,
su
pp
lem
en
ted
wit
h d
ata
fo
r th
e c
ou
nti
es
ma
pp
ed
on
an
'in
teri
m' b
asi
s d
ue
to
lac
k o
f m
od
ern
so
il su
rve
ys.
Alo
ng
wit
h u
rba
niz
ati
on
or
ch
an
ge
s in
ag
ric
ult
ura
l use
s, t
he
'ne
t la
nd
use
ch
an
ge
' da
ta in
clu
de
s te
ch
nic
al r
evi
sio
ns
ma
de
to
th
e li
sts
of
Pri
me
Fa
rmla
nd
an
d F
arm
lan
d o
f S
tate
wid
e Im
po
rta
nc
e b
y N
RC
S in
va
rio
us
co
un
tie
s.
TA
BL
E 7
NE
T IM
PO
RT
AN
T F
AR
ML
AN
D C
ON
VE
RS
ION
19
84
-20
08
(1
)
Ac
res
Ac
res
(mill
ion
s)
Page 21
Page 23
Appendix A
2006 – 2008 County Conversion Tables
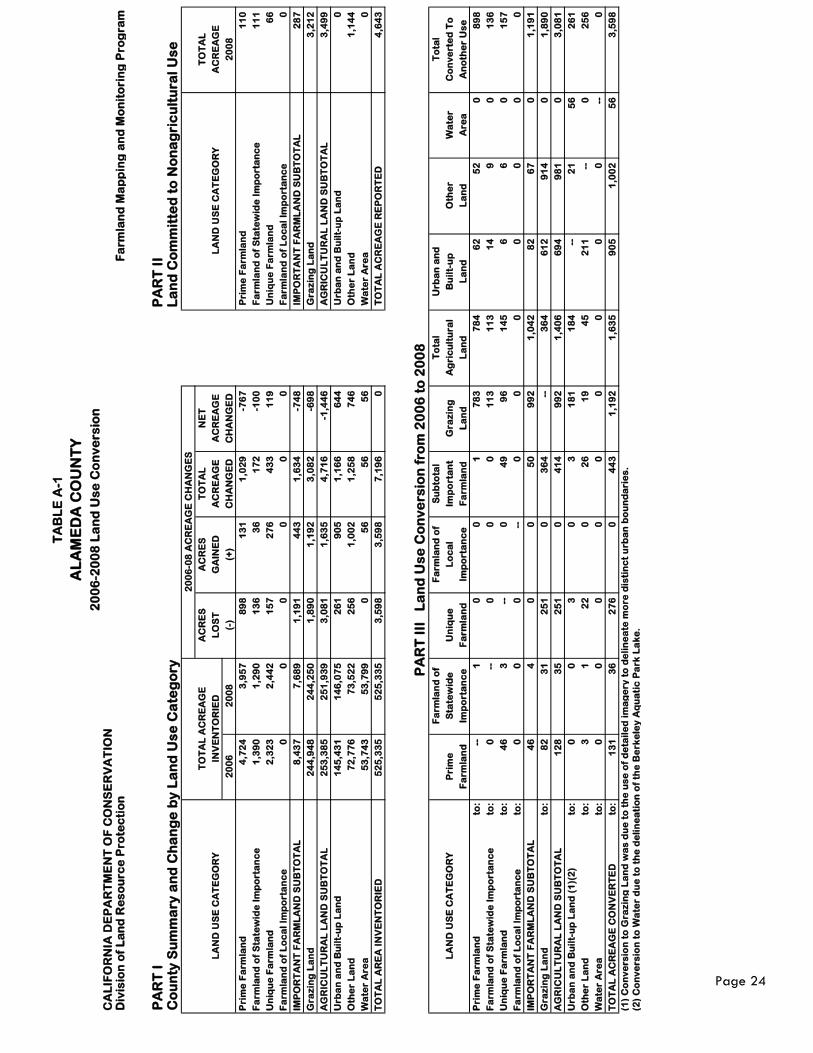
TA
BL
E A
-1
AL
AM
ED
A C
OU
NT
Y
20
06
-20
08
La
nd
Us
e C
on
ve
rsio
nC
AL
IFO
RN
IA D
EP
AR
TM
EN
T O
F C
ON
SE
RV
AT
ION
Div
isio
n o
f L
an
d R
es
ou
rce
Pro
tec
tio
nF
arm
lan
d M
ap
pin
g a
nd
Mo
nit
ori
ng
Pro
gra
m
PA
RT
I
PA
RT
II
Co
un
ty S
um
ma
ry a
nd
Ch
an
ge
by
La
nd
Us
e C
ate
go
ryL
an
d C
om
mit
ted
to
No
na
gri
cu
ltu
ral
Us
e
20
06
-08
AC
RE
AG
E C
HA
NG
ES
T
OT
AL
AC
RE
AG
EA
CR
ES
AC
RE
ST
OT
AL
NE
T
TO
TA
L
LA
ND
US
E C
AT
EG
OR
YIN
VE
NT
OR
IED
LO
ST
GA
INE
DA
CR
EA
GE
AC
RE
AG
EL
AN
D U
SE
CA
TE
GO
RY
AC
RE
AG
E
20
06
20
08
(-)
(+)
CH
AN
GE
DC
HA
NG
ED
20
08
Pri
me
Fa
rmla
nd
4,7
24
3
,95
7
89
8
13
1
1,0
29
-7
67
P
rim
e F
arm
lan
d1
10
Fa
rmla
nd
of
Sta
tew
ide
Im
po
rta
nc
e1
,39
0
1,2
90
1
36
3
6
17
2
-10
0
Fa
rmla
nd
of
Sta
tew
ide
Im
po
rta
nc
e1
11
Un
iqu
e F
arm
lan
d2
,32
3
2,4
42
1
57
2
76
4
33
1
19
U
niq
ue
Fa
rmla
nd
66
Fa
rmla
nd
of
Lo
ca
l Im
po
rta
nc
e0
0
0
0
0
0
F
arm
lan
d o
f L
oc
al
Imp
ort
an
ce
0
IMP
OR
TA
NT
FA
RM
LA
ND
SU
BT
OT
AL
8,4
37
7
,68
9
1,1
91
4
43
1
,63
4
-74
8
IM
PO
RT
AN
T F
AR
ML
AN
D S
UB
TO
TA
L2
87
Gra
zin
g L
an
d
24
4,9
48
2
44
,25
0
1,8
90
1
,19
2
3,0
82
-6
98
G
raz
ing
La
nd
3
,21
2
AG
RIC
UL
TU
RA
L L
AN
D S
UB
TO
TA
L2
53
,38
5
25
1,9
39
3
,08
1
1,6
35
4
,71
6
-1,4
46
A
GR
ICU
LT
UR
AL
LA
ND
SU
BT
OT
AL
3,4
99
Urb
an
an
d B
uil
t-u
p L
an
d1
45
,43
1
14
6,0
75
2
61
9
05
1
,16
6
64
4
Urb
an
an
d B
uil
t-u
p L
an
d0
Oth
er
La
nd
72
,77
6
73
,52
2
25
6
1,0
02
1
,25
8
74
6
Oth
er
La
nd
1,1
44
Wa
ter
Are
a5
3,7
43
5
3,7
99
0
5
6
56
5
6
Wa
ter
Are
a0
TO
TA
L A
RE
A I
NV
EN
TO
RIE
D
52
5,3
35
5
25
,33
5
3,5
98
3
,59
8
7,1
96
0
T
OT
AL
AC
RE
AG
E R
EP
OR
TE
D4
,64
3
PA
RT
III
L
an
d U
se
Co
nv
ers
ion
fro
m 2
00
6 t
o 2
00
8F
arm
lan
d o
fF
arm
lan
d o
fS
ub
tota
lT
ota
lU
rba
n a
nd
To
tal
LA
ND
US
E C
AT
EG
OR
YP
rim
eS
tate
wid
eU
niq
ue
Lo
ca
lIm
po
rta
nt
Gra
zin
gA
gri
cu
ltu
ral
Bu
ilt-
up
Oth
er
Wa
ter
Co
nv
ert
ed
To
Fa
rmla
nd
Imp
ort
an
ce
Fa
rmla
nd
Imp
ort
an
ce
Fa
rmla
nd
La
nd
La
nd
La
nd
La
nd
Are
aA
no
the
r U
se
Pri
me
Fa
rmla
nd
to:
--
1
0
0
1
78
3
78
4
62
5
2
0
89
8
Fa
rmla
nd
of
Sta
tew
ide
Im
po
rta
nc
eto
:0
-
- 0
0
0
1
13
1
13
1
4
9
0
13
6
Un
iqu
e F
arm
lan
dto
:4
6
3
--
0
49
9
6
14
5
6
6
0
15
7
Fa
rmla
nd
of
Lo
ca
l Im
po
rta
nc
eto
:0
0
0
-
- 0
0
0
0
0
0
0
IMP
OR
TA
NT
FA
RM
LA
ND
SU
BT
OT
AL
46
4
0
0
5
0
99
2
1,0
42
8
2
67
0
1
,19
1
Gra
zin
g L
an
d
to:
82
3
1
25
1
0
36
4
--
36
4
61
2
91
4
0
1,8
90
AG
RIC
UL
TU
RA
L L
AN
D S
UB
TO
TA
L1
28
3
5
25
1
0
41
4
99
2
1,4
06
6
94
9
81
0
3
,08
1
Urb
an
an
d B
uil
t-u
p L
an
d (
1)(
2)
to:
0
0
3
0
3
18
1
18
4
--
21
5
6
26
1
Oth
er
La
nd
to:
3
1
22
0
2
6
19
4
5
21
1
--
0
25
6
Wa
ter
Are
ato
:0
0
0
0
0
0
0
0
0
-
- 0
TO
TA
L A
CR
EA
GE
CO
NV
ER
TE
D
to:
13
1
36
2
76
0
4
43
1
,19
2
1,6
35
9
05
1
,00
2
56
3
,59
8
(1)
Co
nv
ers
ion
to
Gra
zin
g L
an
d w
as
du
e t
o t
he
us
e o
f d
eta
ile
d i
ma
ge
ry t
o d
eli
ne
ate
mo
re d
isti
nc
t u
rba
n b
ou
nd
ari
es
.
(2)
Co
nv
ers
ion
to
Wa
ter
du
e t
o t
he
de
lin
ea
tio
n o
f th
e B
erk
ele
y A
qu
ati
c P
ark
La
ke
.
Page 24
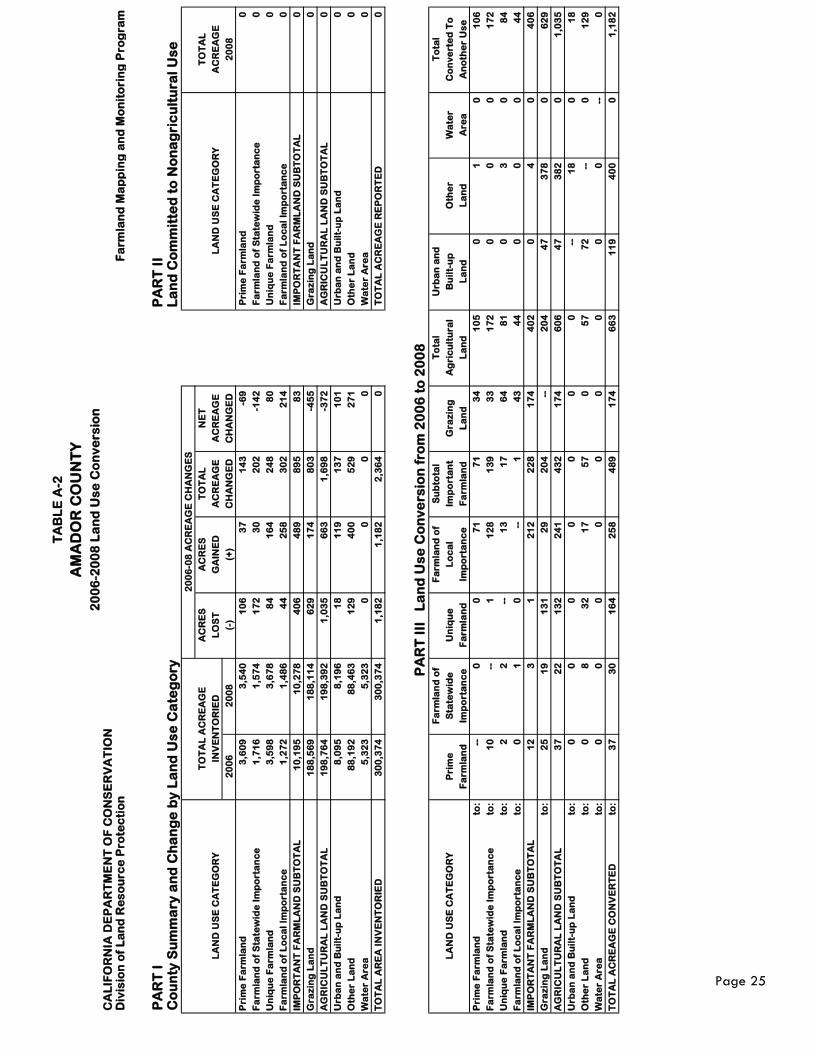
TA
BL
E A
-2
AM
AD
OR
CO
UN
TY
20
06
-20
08
La
nd
Us
e C
on
ve
rsio
nC
AL
IFO
RN
IA D
EP
AR
TM
EN
T O
F C
ON
SE
RV
AT
ION
Div
isio
n o
f L
an
d R
es
ou
rce
Pro
tec
tio
nF
arm
lan
d M
ap
pin
g a
nd
Mo
nit
ori
ng
Pro
gra
m
PA
RT
I
PA
RT
II
Co
un
ty S
um
ma
ry a
nd
Ch
an
ge
by
La
nd
Us
e C
ate
go
ryL
an
d C
om
mit
ted
to
No
na
gri
cu
ltu
ral
Us
e
20
06
-08
AC
RE
AG
E C
HA
NG
ES
T
OT
AL
AC
RE
AG
EA
CR
ES
AC
RE
ST
OT
AL
NE
T
TO
TA
L
LA
ND
US
E C
AT
EG
OR
YIN
VE
NT
OR
IED
LO
ST
GA
INE
DA
CR
EA
GE
AC
RE
AG
EL
AN
D U
SE
CA
TE
GO
RY
AC
RE
AG
E
20
06
20
08
(-)
(+)
CH
AN
GE
DC
HA
NG
ED
20
08
Pri
me
Fa
rmla
nd
3,6
09
3
,54
0
10
6
37
1
43
-6
9
Pri
me
Fa
rmla
nd
0
Fa
rmla
nd
of
Sta
tew
ide
Im
po
rta
nc
e1
,71
6
1,5
74
1
72
3
0
20
2
-14
2
Fa
rmla
nd
of
Sta
tew
ide
Im
po
rta
nc
e0
Un
iqu
e F
arm
lan
d3
,59
8
3,6
78
8
4
16
4
24
8
80
U
niq
ue
Fa
rmla
nd
0
Fa
rmla
nd
of
Lo
ca
l Im
po
rta
nc
e1
,27
2
1,4
86
4
4
25
8
30
2
21
4
Fa
rmla
nd
of
Lo
ca
l Im
po
rta
nc
e0
IMP
OR
TA
NT
FA
RM
LA
ND
SU
BT
OT
AL
10
,19
5
10
,27
8
40
6
48
9
89
5
83
I
MP
OR
TA
NT
FA
RM
LA
ND
SU
BT
OT
AL
0
Gra
zin
g L
an
d
18
8,5
69
1
88
,11
4
62
9
17
4
80
3
-45
5
Gra
zin
g L
an
d
0
AG
RIC
UL
TU
RA
L L
AN
D S
UB
TO
TA
L1
98
,76
4
19
8,3
92
1
,03
5
66
3
1,6
98
-3
72
A
GR
ICU
LT
UR
AL
LA
ND
SU
BT
OT
AL
0
Urb
an
an
d B
uil
t-u
p L
an
d8
,09
5
8,1
96
1
8
11
9
13
7
10
1
Urb
an
an
d B
uil
t-u
p L
an
d0
Oth
er
La
nd
88
,19
2
88
,46
3
12
9
40
0
52
9
27
1
Oth
er
La
nd
0
Wa
ter
Are
a5
,32
3
5,3
23
0
0
0
0
W
ate
r A
rea
0
TO
TA
L A
RE
A I
NV
EN
TO
RIE
D
30
0,3
74
3
00
,37
4
1,1
82
1
,18
2
2,3
64
0
T
OT
AL
AC
RE
AG
E R
EP
OR
TE
D0
PA
RT
III
L
an
d U
se
Co
nv
ers
ion
fro
m 2
00
6 t
o 2
00
8F
arm
lan
d o
fF
arm
lan
d o
fS
ub
tota
lT
ota
lU
rba
n a
nd
To
tal
LA
ND
US
E C
AT
EG
OR
YP
rim
eS
tate
wid
eU
niq
ue
Lo
ca
lIm
po
rta
nt
Gra
zin
gA
gri
cu
ltu
ral
Bu
ilt-
up
Oth
er
Wa
ter
Co
nv
ert
ed
To
Fa
rmla
nd
Imp
ort
an
ce
Fa
rmla
nd
Imp
ort
an
ce
Fa
rmla
nd
La
nd
La
nd
La
nd
La
nd
Are
aA
no
the
r U
se
Pri
me
Fa
rmla
nd
to:
--
0
0
71
7
1
34
1
05
0
1
0
1
06
Fa
rmla
nd
of
Sta
tew
ide
Im
po
rta
nc
eto
:1
0
--
1
12
8
13
9
33
1
72
0
0
0
1
72
Un
iqu
e F
arm
lan
dto
:2
2
-
- 1
3
17
6
4
81
0
3
0
8
4
Fa
rmla
nd
of
Lo
ca
l Im
po
rta
nc
eto
:0
1
0
-
- 1
4
3
44
0
0
0
4
4
IMP
OR
TA
NT
FA
RM
LA
ND
SU
BT
OT
AL
12
3
1
2
12
2
28
1
74
4
02
0
4
0
4
06
Gra
zin
g L
an
d
to:
25
1
9
13
1
29
2
04
-
- 2
04
4
7
37
8
0
62
9
AG
RIC
UL
TU
RA
L L
AN
D S
UB
TO
TA
L3
7
22
1
32
2
41
4
32
1
74
6
06
4
7
38
2
0
1,0
35
Urb
an
an
d B
uil
t-u
p L
an
dto
:0
0
0
0
0
0
0
-
- 1
8
0
18
Oth
er
La
nd
to:
0
8
32
1
7
57
0
5
7
72
-
- 0
1
29
Wa
ter
Are
ato
:0
0
0
0
0
0
0
0
0
-
- 0
TO
TA
L A
CR
EA
GE
CO
NV
ER
TE
D
to:
37
3
0
16
4
25
8
48
9
17
4
66
3
11
9
40
0
0
1,1
82
Page 25
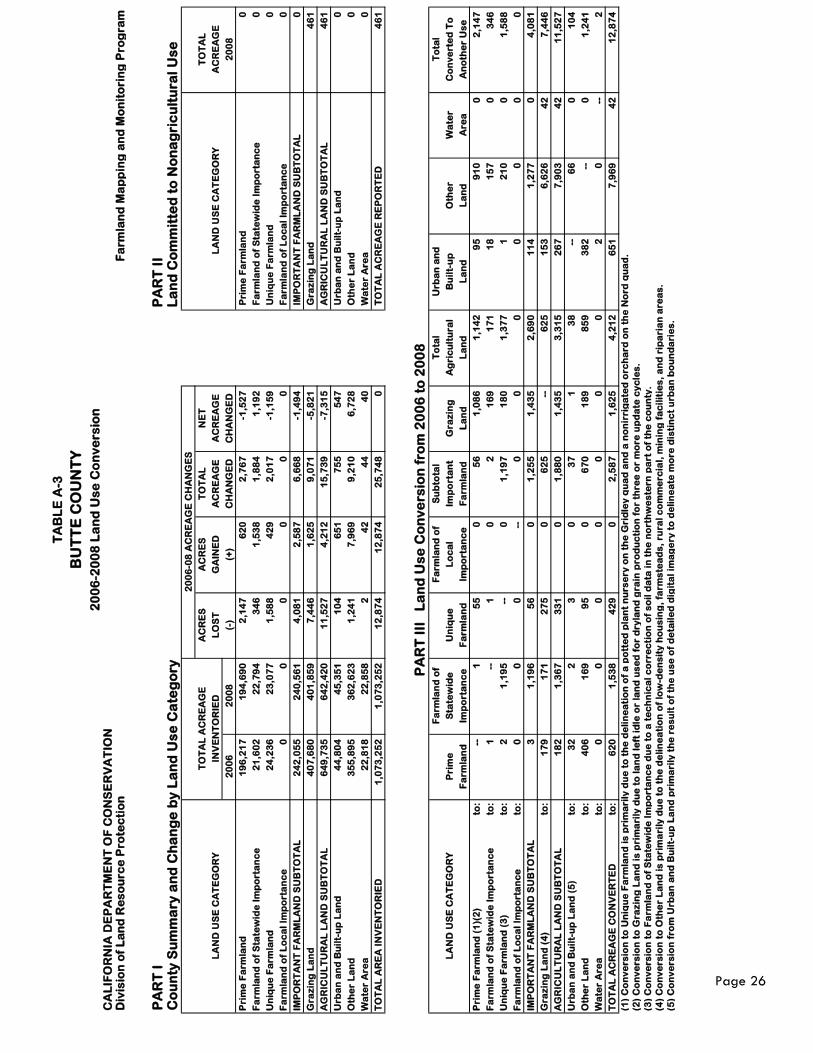
TA
BL
E A
-3
BU
TT
E C
OU
NT
Y
20
06
-20
08
La
nd
Us
e C
on
ve
rsio
nC
AL
IFO
RN
IA D
EP
AR
TM
EN
T O
F C
ON
SE
RV
AT
ION
Div
isio
n o
f L
an
d R
es
ou
rce
Pro
tec
tio
nF
arm
lan
d M
ap
pin
g a
nd
Mo
nit
ori
ng
Pro
gra
m
PA
RT
I
PA
RT
II
Co
un
ty S
um
ma
ry a
nd
Ch
an
ge
by
La
nd
Us
e C
ate
go
ryL
an
d C
om
mit
ted
to
No
na
gri
cu
ltu
ral
Us
e
20
06
-08
AC
RE
AG
E C
HA
NG
ES
T
OT
AL
AC
RE
AG
EA
CR
ES
AC
RE
ST
OT
AL
NE
T
TO
TA
L
LA
ND
US
E C
AT
EG
OR
YIN
VE
NT
OR
IED
LO
ST
GA
INE
DA
CR
EA
GE
AC
RE
AG
EL
AN
D U
SE
CA
TE
GO
RY
AC
RE
AG
E
20
06
20
08
(-)
(+)
CH
AN
GE
DC
HA
NG
ED
20
08
Pri
me
Fa
rmla
nd
19
6,2
17
1
94
,69
0
2,1
47
6
20
2
,76
7
-1,5
27
P
rim
e F
arm
lan
d0
Fa
rmla
nd
of
Sta
tew
ide
Im
po
rta
nc
e2
1,6
02
2
2,7
94
3
46
1
,53
8
1,8
84
1
,19
2
Fa
rmla
nd
of
Sta
tew
ide
Im
po
rta
nc
e0
Un
iqu
e F
arm
lan
d2
4,2
36
2
3,0
77
1
,58
8
42
9
2,0
17
-1
,15
9
Un
iqu
e F
arm
lan
d0
Fa
rmla
nd
of
Lo
ca
l Im
po
rta
nc
e0
0
0
0
0
0
F
arm
lan
d o
f L
oc
al
Imp
ort
an
ce
0
IMP
OR
TA
NT
FA
RM
LA
ND
SU
BT
OT
AL
24
2,0
55
2
40
,56
1
4,0
81
2
,58
7
6,6
68
-1
,49
4
IM
PO
RT
AN
T F
AR
ML
AN
D S
UB
TO
TA
L0
Gra
zin
g L
an
d
40
7,6
80
4
01
,85
9
7,4
46
1
,62
5
9,0
71
-5
,82
1
Gra
zin
g L
an
d
46
1
AG
RIC
UL
TU
RA
L L
AN
D S
UB
TO
TA
L6
49
,73
5
64
2,4
20
1
1,5
27
4
,21
2
15
,73
9
-7,3
15
A
GR
ICU
LT
UR
AL
LA
ND
SU
BT
OT
AL
46
1
Urb
an
an
d B
uil
t-u
p L
an
d4
4,8
04
4
5,3
51
1
04
6
51
7
55
5
47
U
rba
n a
nd
Bu
ilt-
up
La
nd
0
Oth
er
La
nd
35
5,8
95
3
62
,62
3
1,2
41
7
,96
9
9,2
10
6
,72
8
Oth
er
La
nd
0
Wa
ter
Are
a2
2,8
18
2
2,8
58
2
4
2
44
4
0
Wa
ter
Are
a0
TO
TA
L A
RE
A I
NV
EN
TO
RIE
D
1,0
73
,25
2
1,0
73
,25
2
12
,87
4
12
,87
4
25
,74
8
0
TO
TA
L A
CR
EA
GE
RE
PO
RT
ED
46
1
PA
RT
III
L
an
d U
se
Co
nv
ers
ion
fro
m 2
00
6 t
o 2
00
8F
arm
lan
d o
fF
arm
lan
d o
fS
ub
tota
lT
ota
lU
rba
n a
nd
To
tal
LA
ND
US
E C
AT
EG
OR
YP
rim
eS
tate
wid
eU
niq
ue
Lo
ca
lIm
po
rta
nt
Gra
zin
gA
gri
cu
ltu
ral
Bu
ilt-
up
Oth
er
Wa
ter
Co
nv
ert
ed
To
Fa
rmla
nd
Imp
ort
an
ce
Fa
rmla
nd
Imp
ort
an
ce
Fa
rmla
nd
La
nd
La
nd
La
nd
La
nd
Are
aA
no
the
r U
se
Pri
me
Fa
rmla
nd
(1
)(2
)to
: -
- 1
5
5
0
56
1
,08
6
1,1
42
9
5
91
0
0
2,1
47
Fa
rmla
nd
of
Sta
tew
ide
Im
po
rta
nc
eto
:1
-
- 1
0
2
1
69
1
71
1
8
15
7
0
34
6
Un
iqu
e F
arm
lan
d (
3)
to:
2
1,1
95
-
- 0
1
,19
7
18
0
1,3
77
1
2
10
0
1
,58
8
Fa
rmla
nd
of
Lo
ca
l Im
po
rta
nc
eto
:0
0
0
-
- 0
0
0
0
0
0
0
IMP
OR
TA
NT
FA
RM
LA
ND
SU
BT
OT
AL
3
1,1
96
5
6
0
1,2
55
1
,43
5
2,6
90
1
14
1
,27
7
0
4,0
81
Gra
zin
g L
an
d (
4)
to:
17
9
17
1
27
5
0
62
5
--
62
5
15
3
6,6
26
4
2
7,4
46
AG
RIC
UL
TU
RA
L L
AN
D S
UB
TO
TA
L1
82
1
,36
7
33
1
0
1,8
80
1
,43
5
3,3
15
2
67
7
,90
3
42
1
1,5
27
Urb
an
an
d B
uil
t-u
p L
an
d (
5)
to:
32
2
3
0
3
7
1
38
-
- 6
6
0
10
4
Oth
er
La
nd
to:
40
6
16
9
95
0
6
70
1
89
8
59
3
82
-
- 0
1
,24
1
Wa
ter
Are
ato
:0
0
0
0
0
0
0
2
0
-
- 2
TO
TA
L A
CR
EA
GE
CO
NV
ER
TE
D
to:
62
0
1,5
38
4
29
0
2
,58
7
1,6
25
4
,21
2
65
1
7,9
69
4
2
12
,87
4
(1)
Co
nv
ers
ion
to
Un
iqu
e F
arm
lan
d i
s p
rim
ari
ly d
ue
to
th
e d
eli
ne
ati
on
of
a p
ott
ed
pla
nt
nu
rse
ry o
n t
he
Gri
dle
y q
ua
d a
nd
a n
on
irri
ga
ted
orc
ha
rd o
n t
he
No
rd q
ua
d.
(2)
Co
nv
ers
ion
to
Gra
zin
g L
an
d i
s p
rim
ari
ly d
ue
to
la
nd
le
ft i
dle
or
lan
d u
se
d f
or
dry
lan
d g
rain
pro
du
cti
on
fo
r th
ree
or
mo
re u
pd
ate
cy
cle
s.
(3)
Co
nv
ers
ion
to
Fa
rmla
nd
of
Sta
tew
ide
Im
po
rta
nc
e d
ue
to
a t
ec
hn
ica
l c
orr
ec
tio
n o
f s
oil
da
ta i
n t
he
no
rth
we
ste
rn p
art
of
the
co
un
ty.
(4)
Co
nv
ers
ion
to
Oth
er
La
nd
is
pri
ma
rily
du
e t
o t
he
de
lin
ea
tio
n o
f lo
w-d
en
sit
y h
ou
sin
g,
farm
ste
ad
s,
rura
l c
om
me
rcia
l, m
inin
g f
ac
ilit
ies
, a
nd
rip
ari
an
are
as
.
(5)
Co
nv
ers
ion
fro
m U
rba
n a
nd
Bu
ilt-
up
La
nd
pri
ma
rily
th
e r
es
ult
of
the
us
e o
f d
eta
ile
d d
igit
al
ima
ge
ry t
o d
eli
ne
ate
mo
re d
isti
nc
t u
rba
n b
ou
nd
ari
es
.
Page 26
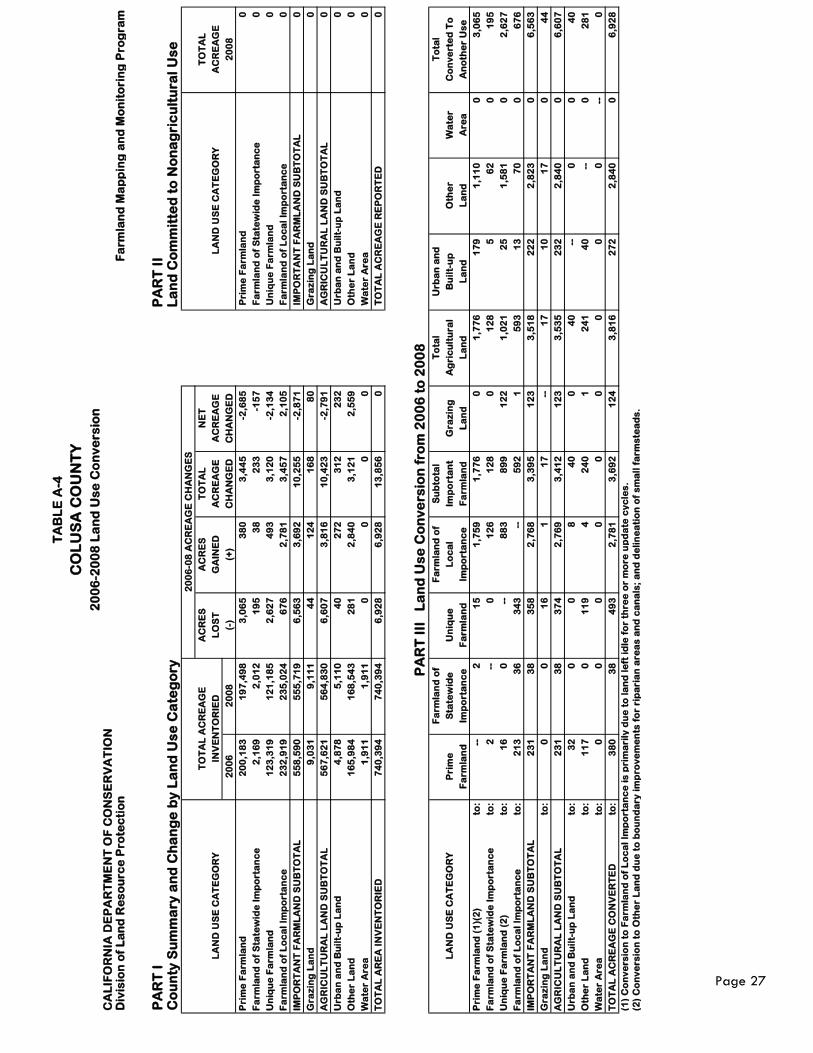
TA
BL
E A
-4
CO
LU
SA
CO
UN
TY
20
06
-20
08
La
nd
Us
e C
on
ve
rsio
nC
AL
IFO
RN
IA D
EP
AR
TM
EN
T O
F C
ON
SE
RV
AT
ION
Div
isio
n o
f L
an
d R
es
ou
rce
Pro
tec
tio
nF
arm
lan
d M
ap
pin
g a
nd
Mo
nit
ori
ng
Pro
gra
m
PA
RT
I
PA
RT
II
Co
un
ty S
um
ma
ry a
nd
Ch
an
ge
by
La
nd
Us
e C
ate
go
ryL
an
d C
om
mit
ted
to
No
na
gri
cu
ltu
ral
Us
e
20
06
-08
AC
RE
AG
E C
HA
NG
ES
T
OT
AL
AC
RE
AG
EA
CR
ES
AC
RE
ST
OT
AL
NE
T
TO
TA
L
LA
ND
US
E C
AT
EG
OR
YIN
VE
NT
OR
IED
LO
ST
GA
INE
DA
CR
EA
GE
AC
RE
AG
EL
AN
D U
SE
CA
TE
GO
RY
AC
RE
AG
E
20
06
20
08
(-)
(+)
CH
AN
GE
DC
HA
NG
ED
20
08
Pri
me
Fa
rmla
nd
20
0,1
83
1
97
,49
8
3,0
65
3
80
3
,44
5
-2,6
85
P
rim
e F
arm
lan
d0
Fa
rmla
nd
of
Sta
tew
ide
Im
po
rta
nc
e2
,16
9
2,0
12
1
95
3
8
23
3
-15
7
Fa
rmla
nd
of
Sta
tew
ide
Im
po
rta
nc
e0
Un
iqu
e F
arm
lan
d1
23
,31
9
12
1,1
85
2
,62
7
49
3
3,1
20
-2
,13
4
Un
iqu
e F
arm
lan
d0
Fa
rmla
nd
of
Lo
ca
l Im
po
rta
nc
e2
32
,91
9
23
5,0
24
6
76
2
,78
1
3,4
57
2
,10
5
Fa
rmla
nd
of
Lo
ca
l Im
po
rta
nc
e0
IMP
OR
TA
NT
FA
RM
LA
ND
SU
BT
OT
AL
55
8,5
90
5
55
,71
9
6,5
63
3
,69
2
10
,25
5
-2,8
71
I
MP
OR
TA
NT
FA
RM
LA
ND
SU
BT
OT
AL
0
Gra
zin
g L
an
d
9,0
31
9
,11
1
44
1
24
1
68
8
0
Gra
zin
g L
an
d
0
AG
RIC
UL
TU
RA
L L
AN
D S
UB
TO
TA
L5
67
,62
1
56
4,8
30
6
,60
7
3,8
16
1
0,4
23
-2
,79
1
AG
RIC
UL
TU
RA
L L
AN
D S
UB
TO
TA
L0
Urb
an
an
d B
uil
t-u
p L
an
d4
,87
8
5,1
10
4
0
27
2
31
2
23
2
Urb
an
an
d B
uil
t-u
p L
an
d0
Oth
er
La
nd
16
5,9
84
1
68
,54
3
28
1
2,8
40
3
,12
1
2,5
59
O
the
r L
an
d0
Wa
ter
Are
a1
,91
1
1,9
11
0
0
0
0
W
ate
r A
rea
0
TO
TA
L A
RE
A I
NV
EN
TO
RIE
D
74
0,3
94
7
40
,39
4
6,9
28
6
,92
8
13
,85
6
0
TO
TA
L A
CR
EA
GE
RE
PO
RT
ED
0
PA
RT
III
L
an
d U
se
Co
nv
ers
ion
fro
m 2
00
6 t
o 2
00
8F
arm
lan
d o
fF
arm
lan
d o
fS
ub
tota
lT
ota
lU
rba
n a
nd
To
tal
LA
ND
US
E C
AT
EG
OR
YP
rim
eS
tate
wid
eU
niq
ue
Lo
ca
lIm
po
rta
nt
Gra
zin
gA
gri
cu
ltu
ral
Bu
ilt-
up
Oth
er
Wa
ter
Co
nv
ert
ed
To
Fa
rmla
nd
Imp
ort
an
ce
Fa
rmla
nd
Imp
ort
an
ce
Fa
rmla
nd
La
nd
La
nd
La
nd
La
nd
Are
aA
no
the
r U
se
Pri
me
Fa
rmla
nd
(1
)(2
)to
: -
- 2
1
5
1,7
59
1
,77
6
0
1,7
76
1
79
1
,11
0
0
3,0
65
Fa
rmla
nd
of
Sta
tew
ide
Im
po
rta
nc
eto
:2
-
- 0
1
26
1
28
0
1
28
5
6
2
0
19
5
Un
iqu
e F
arm
lan
d (
2)
to:
16
0
-
- 8
83
8
99
1
22
1
,02
1
25
1
,58
1
0
2,6
27
Fa
rmla
nd
of
Lo
ca
l Im
po
rta
nc
eto
:2
13
3
6
34
3
--
59
2
1
59
3
13
7
0
0
67
6
IMP
OR
TA
NT
FA
RM
LA
ND
SU
BT
OT
AL
23
1
38
3
58
2
,76
8
3,3
95
1
23
3
,51
8
22
2
2,8
23
0
6
,56
3
Gra
zin
g L
an
d
to:
0
0
16
1
1
7
--
17
1
0
17
0
4
4
AG
RIC
UL
TU
RA
L L
AN
D S
UB
TO
TA
L2
31
3
8
37
4
2,7
69
3
,41
2
12
3
3,5
35
2
32
2
,84
0
0
6,6
07
Urb
an
an
d B
uil
t-u
p L
an
dto
:3
2
0
0
8
40
0
4
0
--
0
0
40
Oth
er
La
nd
to:
11
7
0
11
9
4
24
0
1
24
1
40
-
- 0
2
81
Wa
ter
Are
ato
:0
0
0
0
0
0
0
0
0
-
- 0
TO
TA
L A
CR
EA
GE
CO
NV
ER
TE
D
to:
38
0
38
4
93
2
,78
1
3,6
92
1
24
3
,81
6
27
2
2,8
40
0
6
,92
8
(1)
Co
nv
ers
ion
to
Fa
rmla
nd
of
Lo
ca
l Im
po
rta
nc
e i
s p
rim
ari
ly d
ue
to
la
nd
le
ft i
dle
fo
r th
ree
or
mo
re u
pd
ate
cy
cle
s.
(2)
Co
nv
ers
ion
to
Oth
er
La
nd
du
e t
o b
ou
nd
ary
im
pro
ve
me
nts
fo
r ri
pa
ria
n a
rea
s a
nd
ca
na
ls;
an
d d
eli
ne
ati
on
of
sm
all
fa
rms
tea
ds
.
Page 27

TA
BL
E A
-5
CO
NT
RA
CO
ST
A C
OU
NT
Y
20
06
-20
08
La
nd
Us
e C
on
ve
rsio
nC
AL
IFO
RN
IA D
EP
AR
TM
EN
T O
F C
ON
SE
RV
AT
ION
Div
isio
n o
f L
an
d R
es
ou
rce
Pro
tec
tio
nF
arm
lan
d M
ap
pin
g a
nd
Mo
nit
ori
ng
Pro
gra
m
PA
RT
I
PA
RT
II
Co
un
ty S
um
ma
ry a
nd
Ch
an
ge
by
La
nd
Us
e C
ate
go
ryL
an
d C
om
mit
ted
to
No
na
gri
cu
ltu
ral
Us
e
20
06
-08
AC
RE
AG
E C
HA
NG
ES
T
OT
AL
AC
RE
AG
EA
CR
ES
AC
RE
ST
OT
AL
NE
T
TO
TA
L
LA
ND
US
E C
AT
EG
OR
YIN
VE
NT
OR
IED
LO
ST
GA
INE
DA
CR
EA
GE
AC
RE
AG
EL
AN
D U
SE
CA
TE
GO
RY
AC
RE
AG
E
20
06
20
08
(-)
(+)
CH
AN
GE
DC
HA
NG
ED
20
08
Pri
me
Fa
rmla
nd
29
,93
7
26
,78
8
3,2
34
8
5
3,3
19
-3
,14
9
Pri
me
Fa
rmla
nd
41
Fa
rmla
nd
of
Sta
tew
ide
Im
po
rta
nc
e8
,09
2
7,5
55
6
33
9
6
72
9
-53
7
Fa
rmla
nd
of
Sta
tew
ide
Im
po
rta
nc
e2
2
Un
iqu
e F
arm
lan
d3
,58
8
3,1
23
5
66
1
01
6
67
-4
65
U
niq
ue
Fa
rmla
nd
0
Fa
rmla
nd
of
Lo
ca
l Im
po
rta
nc
e5
2,0
70
5
3,4
49
1
,82
5
3,2
04
5
,02
9
1,3
79
F
arm
lan
d o
f L
oc
al
Imp
ort
an
ce
84
4
IMP
OR
TA
NT
FA
RM
LA
ND
SU
BT
OT
AL
93
,68
7
90
,91
5
6,2
58
3
,48
6
9,7
44
-2
,77
2
IM
PO
RT
AN
T F
AR
ML
AN
D S
UB
TO
TA
L9
07
Gra
zin
g L
an
d
16
8,6
61
1
68
,90
5
89
8
1,1
42
2
,04
0
24
4
Gra
zin
g L
an
d
55
2
AG
RIC
UL
TU
RA
L L
AN
D S
UB
TO
TA
L2
62
,34
8
25
9,8
20
7
,15
6
4,6
28
1
1,7
84
-2
,52
8
AG
RIC
UL
TU
RA
L L
AN
D S
UB
TO
TA
L1
,45
9
Urb
an
an
d B
uil
t-u
p L
an
d1
48
,96
5
15
1,3
36
1
76
2
,54
7
2,7
23
2
,37
1
Urb
an
an
d B
uil
t-u
p L
an
d0
Oth
er
La
nd
49
,46
3
49
,09
6
1,3
37
9
70
2
,30
7
-36
7
Oth
er
La
nd
79
9
Wa
ter
Are
a5
3,2
39
5
3,7
63
0
5
24
5
24
5
24
W
ate
r A
rea
0
TO
TA
L A
RE
A I
NV
EN
TO
RIE
D
51
4,0
15
5
14
,01
5
8,6
69
8
,66
9
17
,33
8
0
TO
TA
L A
CR
EA
GE
RE
PO
RT
ED
2,2
58
PA
RT
III
L
an
d U
se
Co
nv
ers
ion
fro
m 2
00
6 t
o 2
00
8F
arm
lan
d o
fF
arm
lan
d o
fS
ub
tota
lT
ota
lU
rba
n a
nd
To
tal
LA
ND
US
E C
AT
EG
OR
YP
rim
eS
tate
wid
eU
niq
ue
Lo
ca
lIm
po
rta
nt
Gra
zin
gA
gri
cu
ltu
ral
Bu
ilt-
up
Oth
er
Wa
ter
Co
nv
ert
ed
To
Fa
rmla
nd
Imp
ort
an
ce
Fa
rmla
nd
Imp
ort
an
ce
Fa
rmla
nd
La
nd
La
nd
La
nd
La
nd
Are
aA
no
the
r U
se
Pri
me
Fa
rmla
nd
(1
)to
: -
- 1
5
2
,48
0
2,4
86
7
2
2,5
58
3
51
3
25
0
3
,23
4
Fa
rmla
nd
of
Sta
tew
ide
Im
po
rta
nc
eto
:5
-
- 0
4
56
4
61
0
4
61
1
14
5
8
0
63
3
Un
iqu
e F
arm
lan
dto
:0
1
7
--
21
2
22
9
22
4
45
3
41
7
2
0
56
6
Fa
rmla
nd
of
Lo
ca
l Im
po
rta
nc
eto
:6
3
30
4
9
--
14
2
75
2
89
4
69
3
22
9
9
1,8
25
IMP
OR
TA
NT
FA
RM
LA
ND
SU
BT
OT
AL
68
4
8
54
3
,14
8
3,3
18
1
,04
8
4,3
66
1
,19
9
68
4
9
6,2
58
Gra
zin
g L
an
d (
2)
to:
1
0
20
8
2
9
--
29
4
65
2
48
1
56
8
98
AG
RIC
UL
TU
RA
L L
AN
D S
UB
TO
TA
L6
9
48
7
4
3,1
56
3
,34
7
1,0
48
4
,39
5
1,6
64
9
32
1
65
7
,15
6
Urb
an
an
d B
uil
t-u
p L
an
d (
3)
to:
6
29
1
0
28
7
3
65
1
38
-
- 3
8
0
17
6
Oth
er
La
nd
(2
)to
:1
0
19
1
7
20
6
6
29
9
5
88
3
--
35
9
1,3
37
Wa
ter
Are
ato
:0
0
0
0
0
0
0
0
0
-
- 0
TO
TA
L A
CR
EA
GE
CO
NV
ER
TE
D
to:
85
9
6
10
1
3,2
04
3
,48
6
1,1
42
4
,62
8
2,5
47
9
70
5
24
8
,66
9
(1)
Co
nv
ers
ion
to
Fa
rmla
nd
of
Lo
ca
l Im
po
rta
nc
e i
s p
rim
ari
ly d
ue
to
la
nd
le
ft i
dle
fo
r th
ree
or
mo
re u
pd
ate
cy
cle
s.
(2)
Co
nv
ers
ion
to
Wa
ter
du
e t
o t
he
de
lin
ea
tio
n o
f F
ran
ks
Tra
ct
Re
cre
ati
on
Are
a W
etl
an
ds
Ha
bit
at
Re
sto
rati
on
, a
nd
im
pro
vin
g t
he
bo
un
da
rie
s o
f B
rio
ne
s a
nd
Lo
s V
aq
ue
ros
Re
se
rvo
irs
.
(3)
Co
nv
ers
ion
fro
m U
rba
n a
nd
Bu
ilt-
up
La
nd
pri
ma
rily
th
e r
es
ult
of
the
us
e o
f d
eta
ile
d d
igit
al
ima
ge
ry t
o d
eli
ne
ate
mo
re d
isti
nc
t u
rba
n b
ou
nd
ari
es
.
Page 28
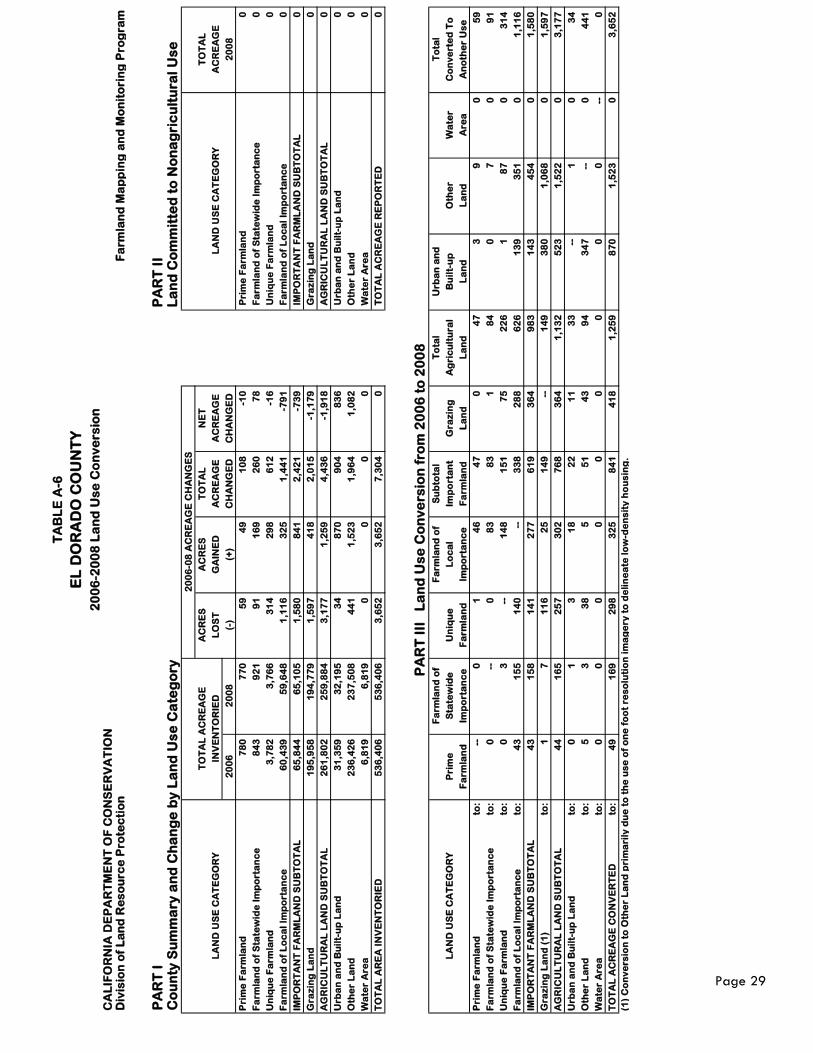
TA
BL
E A
-6
EL
DO
RA
DO
CO
UN
TY
20
06
-20
08
La
nd
Us
e C
on
ve
rsio
nC
AL
IFO
RN
IA D
EP
AR
TM
EN
T O
F C
ON
SE
RV
AT
ION
Div
isio
n o
f L
an
d R
es
ou
rce
Pro
tec
tio
nF
arm
lan
d M
ap
pin
g a
nd
Mo
nit
ori
ng
Pro
gra
m
PA
RT
I
PA
RT
II
Co
un
ty S
um
ma
ry a
nd
Ch
an
ge
by
La
nd
Us
e C
ate
go
ryL
an
d C
om
mit
ted
to
No
na
gri
cu
ltu
ral
Us
e
20
06
-08
AC
RE
AG
E C
HA
NG
ES
T
OT
AL
AC
RE
AG
EA
CR
ES
AC
RE
ST
OT
AL
NE
T
TO
TA
L
LA
ND
US
E C
AT
EG
OR
YIN
VE
NT
OR
IED
LO
ST
GA
INE
DA
CR
EA
GE
AC
RE
AG
EL
AN
D U
SE
CA
TE
GO
RY
AC
RE
AG
E
20
06
20
08
(-)
(+)
CH
AN
GE
DC
HA
NG
ED
20
08
Pri
me
Fa
rmla
nd
78
0
77
0
59
4
9
10
8
-10
P
rim
e F
arm
lan
d0
Fa
rmla
nd
of
Sta
tew
ide
Im
po
rta
nc
e8
43
9
21
9
1
16
9
26
0
78
F
arm
lan
d o
f S
tate
wid
e I
mp
ort
an
ce
0
Un
iqu
e F
arm
lan
d3
,78
2
3,7
66
3
14
2
98
6
12
-1
6
Un
iqu
e F
arm
lan
d0
Fa
rmla
nd
of
Lo
ca
l Im
po
rta
nc
e6
0,4
39
5
9,6
48
1
,11
6
32
5
1,4
41
-7
91
F
arm
lan
d o
f L
oc
al
Imp
ort
an
ce
0
IMP
OR
TA
NT
FA
RM
LA
ND
SU
BT
OT
AL
65
,84
4
65
,10
5
1,5
80
8
41
2
,42
1
-73
9
IM
PO
RT
AN
T F
AR
ML
AN
D S
UB
TO
TA
L0
Gra
zin
g L
an
d
19
5,9
58
1
94
,77
9
1,5
97
4
18
2
,01
5
-1,1
79
G
raz
ing
La
nd
0
AG
RIC
UL
TU
RA
L L
AN
D S
UB
TO
TA
L2
61
,80
2
25
9,8
84
3
,17
7
1,2
59
4
,43
6
-1,9
18
A
GR
ICU
LT
UR
AL
LA
ND
SU
BT
OT
AL
0
Urb
an
an
d B
uil
t-u
p L
an
d3
1,3
59
3
2,1
95
3
4
87
0
90
4
83
6
Urb
an
an
d B
uil
t-u
p L
an
d0
Oth
er
La
nd
23
6,4
26
2
37
,50
8
44
1
1,5
23
1
,96
4
1,0
82
O
the
r L
an
d0
Wa
ter
Are
a6
,81
9
6,8
19
0
0
0
0
W
ate
r A
rea
0
TO
TA
L A
RE
A I
NV
EN
TO
RIE
D
53
6,4
06
5
36
,40
6
3,6
52
3
,65
2
7,3
04
0
T
OT
AL
AC
RE
AG
E R
EP
OR
TE
D0
PA
RT
III
L
an
d U
se
Co
nv
ers
ion
fro
m 2
00
6 t
o 2
00
8F
arm
lan
d o
fF
arm
lan
d o
fS
ub
tota
lT
ota
lU
rba
n a
nd
To
tal
LA
ND
US
E C
AT
EG
OR
YP
rim
eS
tate
wid
eU
niq
ue
Lo
ca
lIm
po
rta
nt
Gra
zin
gA
gri
cu
ltu
ral
Bu
ilt-
up
Oth
er
Wa
ter
Co
nv
ert
ed
To
Fa
rmla
nd
Imp
ort
an
ce
Fa
rmla
nd
Imp
ort
an
ce
Fa
rmla
nd
La
nd
La
nd
La
nd
La
nd
Are
aA
no
the
r U
se
Pri
me
Fa
rmla
nd
to:
--
0
1
46
4
7
0
47
3
9
0
5
9
Fa
rmla
nd
of
Sta
tew
ide
Im
po
rta
nc
eto
:0
-
- 0
8
3
83
1
8
4
0
7
0
91
Un
iqu
e F
arm
lan
dto
:0
3
-
- 1
48
1
51
7
5
22
6
1
87
0
3
14
Fa
rmla
nd
of
Lo
ca
l Im
po
rta
nc
eto
:4
3
15
5
14
0
--
33
8
28
8
62
6
13
9
35
1
0
1,1
16
IMP
OR
TA
NT
FA
RM
LA
ND
SU
BT
OT
AL
43
1
58
1
41
2
77
6
19
3
64
9
83
1
43
4
54
0
1
,58
0
Gra
zin
g L
an
d (
1)
to:
1
7
11
6
25
1
49
-
- 1
49
3
80
1
,06
8
0
1,5
97
AG
RIC
UL
TU
RA
L L
AN
D S
UB
TO
TA
L4
4
16
5
25
7
30
2
76
8
36
4
1,1
32
5
23
1
,52
2
0
3,1
77
Urb
an
an
d B
uil
t-u
p L
an
dto
:0
1
3
1
8
22
1
1
33
-
- 1
0
3
4
Oth
er
La
nd
to:
5
3
38
5
5
1
43
9
4
34
7
--
0
44
1
Wa
ter
Are
ato
:0
0
0
0
0
0
0
0
0
-
- 0
TO
TA
L A
CR
EA
GE
CO
NV
ER
TE
D
to:
49
1
69
2
98
3
25
8
41
4
18
1
,25
9
87
0
1,5
23
0
3
,65
2
(1)
Co
nv
ers
ion
to
Oth
er
La
nd
pri
ma
rily
du
e t
o t
he
us
e o
f o
ne
fo
ot
res
olu
tio
n i
ma
ge
ry t
o d
eli
ne
ate
lo
w-d
en
sit
y h
ou
sin
g.
Page 29
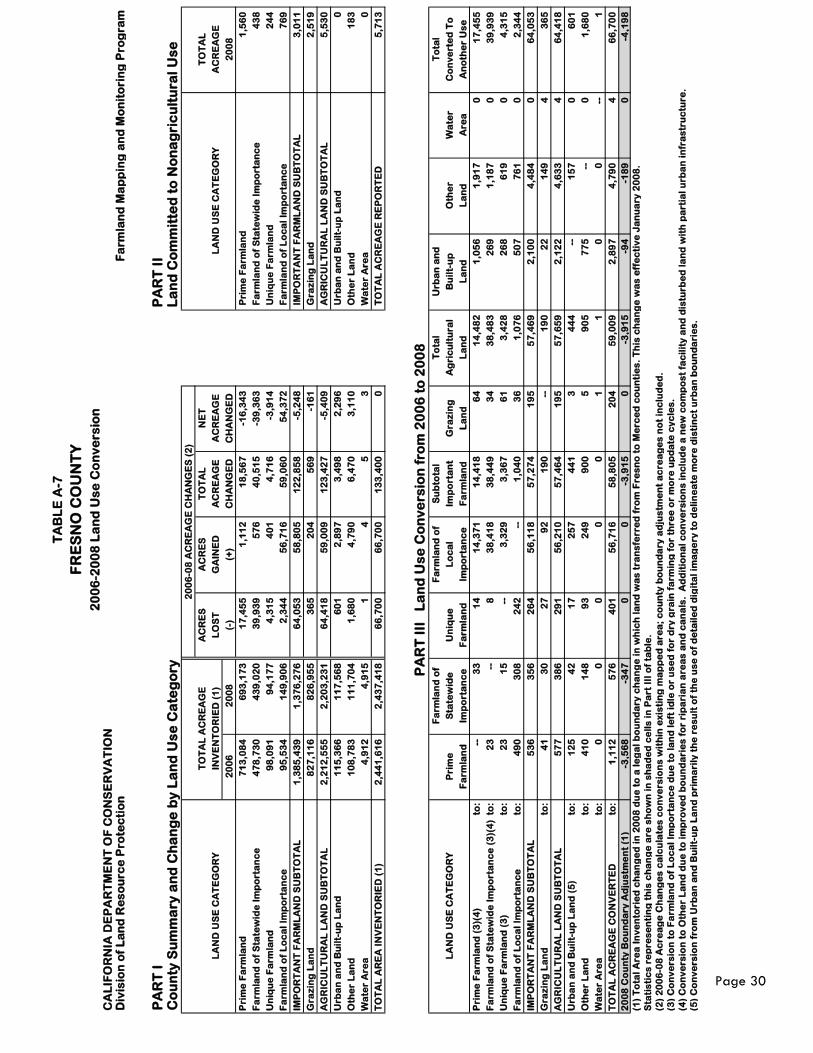
TA
BL
E A
-7
FR
ES
NO
CO
UN
TY
20
06
-20
08
La
nd
Us
e C
on
ve
rsio
nC
AL
IFO
RN
IA D
EP
AR
TM
EN
T O
F C
ON
SE
RV
AT
ION
Div
isio
n o
f L
an
d R
es
ou
rce
Pro
tec
tio
nF
arm
lan
d M
ap
pin
g a
nd
Mo
nit
ori
ng
Pro
gra
m
PA
RT
I
PA
RT
II
Co
un
ty S
um
ma
ry a
nd
Ch
an
ge
by
La
nd
Us
e C
ate
go
ryL
an
d C
om
mit
ted
to
No
na
gri
cu
ltu
ral
Us
e
20
06
-08
AC
RE
AG
E C
HA
NG
ES
(2
)
T
OT
AL
AC
RE
AG
EA
CR
ES
AC
RE
ST
OT
AL
NE
T
TO
TA
L
LA
ND
US
E C
AT
EG
OR
YIN
VE
NT
OR
IED
(1
)L
OS
TG
AIN
ED
AC
RE
AG
EA
CR
EA
GE
LA
ND
US
E C
AT
EG
OR
YA
CR
EA
GE
20
06
20
08
(-)
(+)
CH
AN
GE
DC
HA
NG
ED
20
08
Pri
me
Fa
rmla
nd
71
3,0
84
6
93
,17
3
17
,45
5
1,1
12
1
8,5
67
-1
6,3
43
P
rim
e F
arm
lan
d1
,56
0
Fa
rmla
nd
of
Sta
tew
ide
Im
po
rta
nc
e4
78
,73
0
43
9,0
20
3
9,9
39
5
76
4
0,5
15
-3
9,3
63
F
arm
lan
d o
f S
tate
wid
e I
mp
ort
an
ce
43
8
Un
iqu
e F
arm
lan
d9
8,0
91
9
4,1
77
4
,31
5
40
1
4,7
16
-3
,91
4
Un
iqu
e F
arm
lan
d2
44
Fa
rmla
nd
of
Lo
ca
l Im
po
rta
nc
e9
5,5
34
1
49
,90
6
2,3
44
5
6,7
16
5
9,0
60
5
4,3
72
F
arm
lan
d o
f L
oc
al
Imp
ort
an
ce
76
9
IMP
OR
TA
NT
FA
RM
LA
ND
SU
BT
OT
AL
1,3
85
,43
9
1,3
76
,27
6
64
,05
3
58
,80
5
12
2,8
58
-5
,24
8
IM
PO
RT
AN
T F
AR
ML
AN
D S
UB
TO
TA
L3
,01
1
Gra
zin
g L
an
d
82
7,1
16
8
26
,95
5
36
5
20
4
56
9
-16
1
Gra
zin
g L
an
d
2,5
19
AG
RIC
UL
TU
RA
L L
AN
D S
UB
TO
TA
L2
,21
2,5
55
2
,20
3,2
31
6
4,4
18
5
9,0
09
1
23
,42
7
-5,4
09
A
GR
ICU
LT
UR
AL
LA
ND
SU
BT
OT
AL
5,5
30
Urb
an
an
d B
uil
t-u
p L
an
d1
15
,36
6
11
7,5
68
6
01
2
,89
7
3,4
98
2
,29
6
Urb
an
an
d B
uil
t-u
p L
an
d0
Oth
er
La
nd
10
8,7
83
1
11
,70
4
1,6
80
4
,79
0
6,4
70
3
,11
0
Oth
er
La
nd
18
3
Wa
ter
Are
a4
,91
2
4,9
15
1
4
5
3
W
ate
r A
rea
0
TO
TA
L A
RE
A I
NV
EN
TO
RIE
D (
1)
2,4
41
,61
6
2,4
37
,41
8
66
,70
0
66
,70
0
13
3,4
00
0
T
OT
AL
AC
RE
AG
E R
EP
OR
TE
D5
,71
3
PA
RT
III
L
an
d U
se
Co
nv
ers
ion
fro
m 2
00
6 t
o 2
00
8F
arm
lan
d o
fF
arm
lan
d o
fS
ub
tota
lT
ota
lU
rba
n a
nd
To
tal
LA
ND
US
E C
AT
EG
OR
YP
rim
eS
tate
wid
eU
niq
ue
Lo
ca
lIm
po
rta
nt
Gra
zin
gA
gri
cu
ltu
ral
Bu
ilt-
up
Oth
er
Wa
ter
Co
nv
ert
ed
To
Fa
rmla
nd
Imp
ort
an
ce
Fa
rmla
nd
Imp
ort
an
ce
Fa
rmla
nd
La
nd
La
nd
La
nd
La
nd
Are
aA
no
the
r U
se
Pri
me
Fa
rmla
nd
(3
)(4
)to
: -
- 3
3
14
1
4,3
71
1
4,4
18
6
4
14
,48
2
1,0
56
1
,91
7
0
17
,45
5
Fa
rmla
nd
of
Sta
tew
ide
Im
po
rta
nc
e (
3)(
4)
to:
23
-
- 8
3
8,4
18
3
8,4
49
3
4
38
,48
3
26
9
1,1
87
0
3
9,9
39
Un
iqu
e F
arm
lan
d (
3)
to:
23
1
5
--
3,3
29
3
,36
7
61
3
,42
8
26
8
61
9
0
4,3
15
Fa
rmla
nd
of
Lo
ca
l Im
po
rta
nc
eto
:4
90
3
08
2
42
-
- 1
,04
0
36
1
,07
6
50
7
76
1
0
2,3
44
IMP
OR
TA
NT
FA
RM
LA
ND
SU
BT
OT
AL
53
6
35
6
26
4
56
,11
8
57
,27
4
19
5
57
,46
9
2,1
00
4
,48
4
0
64
,05
3
Gra
zin
g L
an
d
to:
41
3
0
27
9
2
19
0
--
19
0
22
1
49
4
3
65
AG
RIC
UL
TU
RA
L L
AN
D S
UB
TO
TA
L5
77
3
86
2
91
5
6,2
10
5
7,4
64
1
95
5
7,6
59
2
,12
2
4,6
33
4
6
4,4
18
Urb
an
an
d B
uil
t-u
p L
an
d (
5)
to:
12
5
42
1
7
25
7
44
1
3
44
4
--
15
7
0
60
1
Oth
er
La
nd
to:
41
0
14
8
93
2
49
9
00
5
9
05
7
75
-
- 0
1
,68
0
Wa
ter
Are
ato
:0
0
0
0
0
1
1
0
0
-
- 1
TO
TA
L A
CR
EA
GE
CO
NV
ER
TE
D
to:
1,1
12
5
76
4
01
5
6,7
16
5
8,8
05
2
04
5
9,0
09
2
,89
7
4,7
90
4
6
6,7
00
20
08
Co
un
ty B
ou
nd
ary
Ad
jus
tme
nt
(1)
-3,5
68
-3
47
0
0
-3
,91
5
0
-3,9
15
-9
4
-18
9
0
-4,1
98
(1)
To
tal
Are
a I
nv
en
tori
ed
ch
an
ge
d i
n 2
00
8 d
ue
to
a l
eg
al
bo
un
da
ry c
ha
ng
e i
n w
hic
h l
an
d w
as
tra
ns
ferr
ed
fro
m F
res
no
to
Me
rce
d c
ou
nti
es
. T
his
ch
an
ge
wa
s e
ffe
cti
ve
Ja
nu
ary
20
08
.
Sta
tis
tic
s r
ep
res
en
tin
g t
his
ch
an
ge
are
sh
ow
n i
n s
ha
de
d c
ell
s i
n P
art
III
of
tab
le.
(2)
20
06
-08
Ac
rea
ge
Ch
an
ge
s c
alc
ula
tes
co
nv
ers
ion
s w
ith
in e
xis
tin
g m
ap
pe
d a
rea
; c
ou
nty
bo
un
da
ry a
dju
stm
en
t a
cre
ag
es
no
t in
clu
de
d.
(3)
Co
nv
ers
ion
to
Fa
rmla
nd
of
Lo
ca
l Im
po
rta
nc
e d
ue
to
la
nd
le
ft i
dle
or
us
ed
fo
r d
ry g
rain
fa
rmin
g f
or
thre
e o
r m
ore
up
da
te c
yc
les
.
(4)
Co
nv
ers
ion
to
Oth
er
La
nd
du
e t
o i
mp
rov
ed
bo
un
da
rie
s f
or
rip
ari
an
are
as
an
d c
an
als
. A
dd
itio
na
l c
on
ve
rsio
ns
in
clu
de
a n
ew
co
mp
os
t fa
cil
ity
an
d d
istu
rbe
d l
an
d w
ith
pa
rtia
l u
rba
n i
nfr
as
tru
ctu
re.
(5)
Co
nv
ers
ion
fro
m U
rba
n a
nd
Bu
ilt-
up
La
nd
pri
ma
rily
th
e r
es
ult
of
the
us
e o
f d
eta
ile
d d
igit
al
ima
ge
ry t
o d
eli
ne
ate
mo
re d
isti
nc
t u
rba
n b
ou
nd
ari
es
.
Page 30

TA
BL
E A
-8
GL
EN
N C
OU
NT
Y
20
06
-20
08
La
nd
Us
e C
on
ve
rsio
nC
AL
IFO
RN
IA D
EP
AR
TM
EN
T O
F C
ON
SE
RV
AT
ION
Div
isio
n o
f L
an
d R
es
ou
rce
Pro
tec
tio
nF
arm
lan
d M
ap
pin
g a
nd
Mo
nit
ori
ng
Pro
gra
m
PA
RT
I
PA
RT
II
Co
un
ty S
um
ma
ry a
nd
Ch
an
ge
by
La
nd
Us
e C
ate
go
ryL
an
d C
om
mit
ted
to
No
na
gri
cu
ltu
ral
Us
e
20
06
-08
AC
RE
AG
E C
HA
NG
ES
T
OT
AL
AC
RE
AG
EA
CR
ES
AC
RE
ST
OT
AL
NE
T
TO
TA
L
LA
ND
US
E C
AT
EG
OR
YIN
VE
NT
OR
IED
LO
ST
GA
INE
DA
CR
EA
GE
AC
RE
AG
EL
AN
D U
SE
CA
TE
GO
RY
AC
RE
AG
E
20
06
20
08
(-)
(+)
CH
AN
GE
DC
HA
NG
ED
20
08
Pri
me
Fa
rmla
nd
16
1,6
83
1
59
,81
2
2,4
93
6
22
3
,11
5
-1,8
71
P
rim
e F
arm
lan
d7
29
Fa
rmla
nd
of
Sta
tew
ide
Im
po
rta
nc
e8
7,8
68
8
7,4
99
9
21
5
52
1
,47
3
-36
9
Fa
rmla
nd
of
Sta
tew
ide
Im
po
rta
nc
e2
28
Un
iqu
e F
arm
lan
d1
7,4
70
1
7,3
06
6
59
4
95
1
,15
4
-16
4
Un
iqu
e F
arm
lan
d1
37
Fa
rmla
nd
of
Lo
ca
l Im
po
rta
nc
e8
0,2
90
8
3,5
41
1
,73
6
4,9
87
6
,72
3
3,2
51
F
arm
lan
d o
f L
oc
al
Imp
ort
an
ce
1,0
07
IMP
OR
TA
NT
FA
RM
LA
ND
SU
BT
OT
AL
34
7,3
11
3
48
,15
8
5,8
09
6
,65
6
12
,46
5
84
7
IM
PO
RT
AN
T F
AR
ML
AN
D S
UB
TO
TA
L2
,10
1
Gra
zin
g L
an
d
22
9,1
91
2
27
,39
0
1,9
73
1
72
2
,14
5
-1,8
01
G
raz
ing
La
nd
2
AG
RIC
UL
TU
RA
L L
AN
D S
UB
TO
TA
L5
76
,50
2
57
5,5
48
7
,78
2
6,8
28
1
4,6
10
-9
54
A
GR
ICU
LT
UR
AL
LA
ND
SU
BT
OT
AL
2,1
03
Urb
an
an
d B
uil
t-u
p L
an
d6
,31
3
6,3
72
1
6
0
61
5
9
Urb
an
an
d B
uil
t-u
p L
an
d0
Oth
er
La
nd
26
0,3
64
2
61
,25
9
14
8
1,0
43
1
,19
1
89
5
Oth
er
La
nd
61
2
Wa
ter
Are
a5
,95
0
5,9
50
0
0
0
0
W
ate
r A
rea
0
TO
TA
L A
RE
A I
NV
EN
TO
RIE
D
84
9,1
29
8
49
,12
9
7,9
31
7
,93
1
15
,86
2
0
TO
TA
L A
CR
EA
GE
RE
PO
RT
ED
2,7
15
PA
RT
III
L
an
d U
se
Co
nv
ers
ion
fro
m 2
00
6 t
o 2
00
8F
arm
lan
d o
fF
arm
lan
d o
fS
ub
tota
lT
ota
lU
rba
n a
nd
To
tal
LA
ND
US
E C
AT
EG
OR
YP
rim
eS
tate
wid
eU
niq
ue
Lo
ca
lIm
po
rta
nt
Gra
zin
gA
gri
cu
ltu
ral
Bu
ilt-
up
Oth
er
Wa
ter
Co
nv
ert
ed
To
Fa
rmla
nd
Imp
ort
an
ce
Fa
rmla
nd
Imp
ort
an
ce
Fa
rmla
nd
La
nd
La
nd
La
nd
La
nd
Are
aA
no
the
r U
se
Pri
me
Fa
rmla
nd
(1
)to
: -
- 6
4
3
2,1
44
2
,19
3
0
2,1
93
2
0
28
0
0
2,4
93
Fa
rmla
nd
of
Sta
tew
ide
Im
po
rta
nc
e (
2)
to:
6
--
63
7
53
8
22
0
8
22
6
9
3
0
92
1
Un
iqu
e F
arm
lan
dto
:5
2
-
- 3
00
3
07
6
8
37
5
6
27
8
0
65
9
Fa
rmla
nd
of
Lo
ca
l Im
po
rta
nc
eto
:5
80
5
38
3
07
-
- 1
,42
5
81
1
,50
6
26
2
04
0
1
,73
6
IMP
OR
TA
NT
FA
RM
LA
ND
SU
BT
OT
AL
59
1
54
6
41
3
3,1
97
4
,74
7
14
9
4,8
96
5
8
85
5
0
5,8
09
Gra
zin
g L
an
d (
3)
to:
1
0
74
1
,70
9
1,7
84
-
- 1
,78
4
1
18
8
0
1,9
73
AG
RIC
UL
TU
RA
L L
AN
D S
UB
TO
TA
L5
92
5
46
4
87
4
,90
6
6,5
31
1
49
6
,68
0
59
1
,04
3
0
7,7
82
Urb
an
an
d B
uil
t-u
p L
an
dto
:1
0
0
0
1
0
1
-
- 0
0
1
Oth
er
La
nd
to:
29
6
8
8
1
12
4
23
1
47
1
-
- 0
1
48
Wa
ter
Are
ato
:0
0
0
0
0
0
0
0
0
-
- 0
TO
TA
L A
CR
EA
GE
CO
NV
ER
TE
D
to:
62
2
55
2
49
5
4,9
87
6
,65
6
17
2
6,8
28
6
0
1,0
43
0
7
,93
1
(1)
Co
nv
ers
ion
to
Fa
rmla
nd
of
Lo
ca
l Im
po
rta
nc
e d
ue
to
la
nd
le
ft i
dle
fo
r th
ree
or
mo
re u
pd
ate
cy
cle
s.
(2)
Co
nv
ers
ion
to
Un
iqu
e F
arm
lan
d i
s p
rim
ari
ly d
ue
to
de
lin
ea
tio
n o
f n
on
irri
ga
ted
orc
ha
rds
in
th
e E
lk C
ree
k a
rea
.
(3)
Co
nv
ers
ion
to
Fa
rmla
nd
of
Lo
ca
l Im
po
rta
nc
e t
he
re
su
lt o
f d
ry g
rain
fa
rmin
g a
nd
th
e u
se
of
up
da
ted
wa
ter
dis
tric
t b
ou
nd
ari
es
to
de
lin
ea
te F
arm
lan
d o
f L
oc
al
Imp
ort
an
ce
.
Page 31
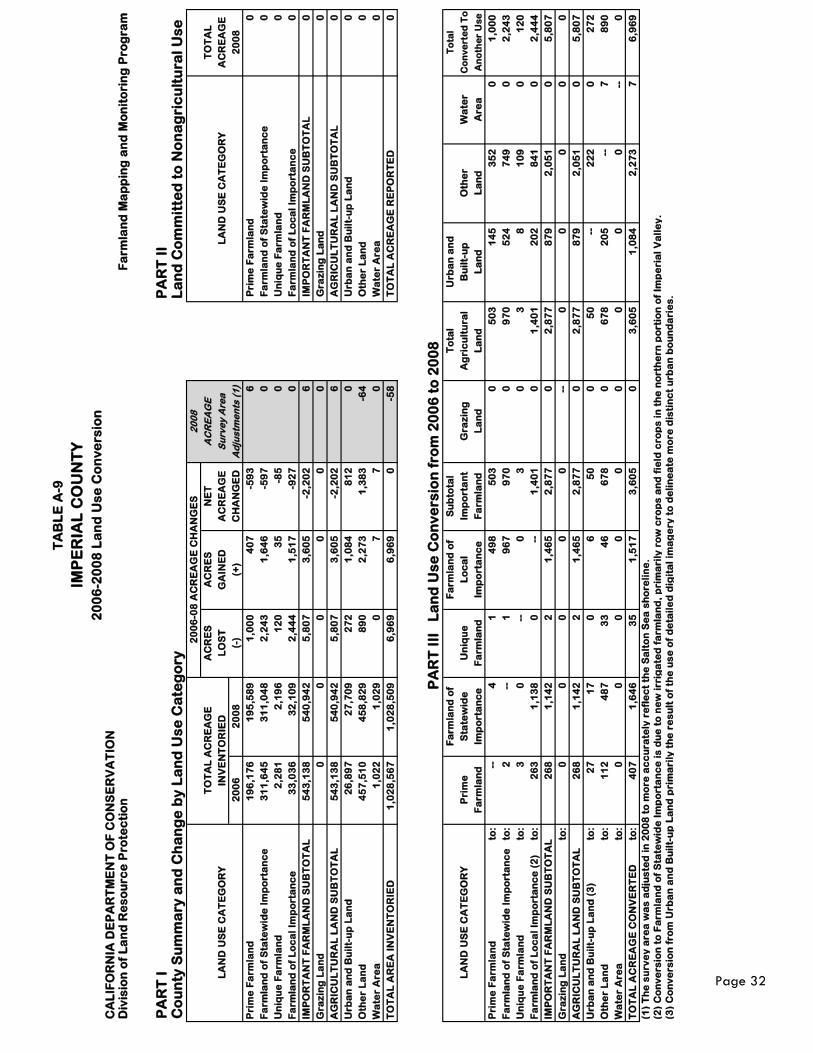
TA
BL
E A
-9
IMP
ER
IAL
CO
UN
TY
20
06
-20
08
La
nd
Us
e C
on
ve
rsio
nC
AL
IFO
RN
IA D
EP
AR
TM
EN
T O
F C
ON
SE
RV
AT
ION
Div
isio
n o
f L
an
d R
es
ou
rce
Pro
tec
tio
nF
arm
lan
d M
ap
pin
g a
nd
Mo
nit
ori
ng
Pro
gra
m
PA
RT
I
PA
RT
II
Co
un
ty S
um
ma
ry a
nd
Ch
an
ge
by
La
nd
Us
e C
ate
go
ryL
an
d C
om
mit
ted
to
No
na
gri
cu
ltu
ral
Us
e
20
06
-08
AC
RE
AG
E C
HA
NG
ES
20
08
T
OT
AL
AC
RE
AG
EA
CR
ES
AC
RE
SN
ET
AC
RE
AG
E
TO
TA
L
LA
ND
US
E C
AT
EG
OR
YIN
VE
NT
OR
IED
LO
ST
GA
INE
DA
CR
EA
GE
Su
rve
y A
rea
LA
ND
US
E C
AT
EG
OR
YA
CR
EA
GE
20
06
20
08
(-)
(+)
CH
AN
GE
DA
dju
stm
en
ts (
1)
20
08
Pri
me
Fa
rmla
nd
19
6,1
76
1
95
,58
9
1,0
00
4
07
-5
93
6
P
rim
e F
arm
lan
d0
Fa
rmla
nd
of
Sta
tew
ide
Im
po
rta
nc
e3
11
,64
5
31
1,0
48
2
,24
3
1,6
46
-5
97
0
F
arm
lan
d o
f S
tate
wid
e I
mp
ort
an
ce
0
Un
iqu
e F
arm
lan
d2
,28
1
2,1
96
1
20
3
5
-85
0
U
niq
ue
Fa
rmla
nd
0
Fa
rmla
nd
of
Lo
ca
l Im
po
rta
nc
e3
3,0
36
3
2,1
09
2
,44
4
1,5
17
-9
27
0
F
arm
lan
d o
f L
oc
al
Imp
ort
an
ce
0
IMP
OR
TA
NT
FA
RM
LA
ND
SU
BT
OT
AL
54
3,1
38
5
40
,94
2
5,8
07
3
,60
5
-2,2
02
6
I
MP
OR
TA
NT
FA
RM
LA
ND
SU
BT
OT
AL
0
Gra
zin
g L
an
d
0
0
0
0
0
0
Gra
zin
g L
an
d
0
AG
RIC
UL
TU
RA
L L
AN
D S
UB
TO
TA
L5
43
,13
8
54
0,9
42
5
,80
7
3,6
05
-2
,20
2
6
AG
RIC
UL
TU
RA
L L
AN
D S
UB
TO
TA
L0
Urb
an
an
d B
uil
t-u
p L
an
d2
6,8
97
2
7,7
09
2
72
1
,08
4
81
2
0
Urb
an
an
d B
uil
t-u
p L
an
d0
Oth
er
La
nd
45
7,5
10
4
58
,82
9
89
0
2,2
73
1
,38
3
-64
O
the
r L
an
d0
Wa
ter
Are
a1
,02
2
1,0
29
0
7
7
0
W
ate
r A
rea
0
TO
TA
L A
RE
A I
NV
EN
TO
RIE
D
1,0
28
,56
7
1,0
28
,50
9
6,9
69
6
,96
9
0
-58
T
OT
AL
AC
RE
AG
E R
EP
OR
TE
D0
PA
RT
III
L
an
d U
se
Co
nv
ers
ion
fro
m 2
00
6 t
o 2
00
8F
arm
lan
d o
fF
arm
lan
d o
fS
ub
tota
lT
ota
lU
rba
n a
nd
To
tal
LA
ND
US
E C
AT
EG
OR
YP
rim
eS
tate
wid
eU
niq
ue
Lo
ca
lIm
po
rta
nt
Gra
zin
gA
gri
cu
ltu
ral
Bu
ilt-
up
Oth
er
Wa
ter
Co
nv
ert
ed
To
Fa
rmla
nd
Imp
ort
an
ce
Fa
rmla
nd
Imp
ort
an
ce
Fa
rmla
nd
La
nd
La
nd
La
nd
La
nd
Are
aA
no
the
r U
se
Pri
me
Fa
rmla
nd
to:
--
4
1
49
8
50
3
0
50
3
14
5
35
2
0
1,0
00
Fa
rmla
nd
of
Sta
tew
ide
Im
po
rta
nc
eto
:2
-
- 1
9
67
9
70
0
9
70
5
24
7
49
0
2
,24
3
Un
iqu
e F
arm
lan
dto
:3
0
-
- 0
3
0
3
8
1
09
0
1
20
Fa
rmla
nd
of
Lo
ca
l Im
po
rta
nc
e (
2)
to:
26
3
1,1
38
0
-
- 1
,40
1
0
1,4
01
2
02
8
41
0
2
,44
4
IMP
OR
TA
NT
FA
RM
LA
ND
SU
BT
OT
AL
26
8
1,1
42
2
1
,46
5
2,8
77
0
2
,87
7
87
9
2,0
51
0
5
,80
7
Gra
zin
g L
an
d
to:
0
0
0
0
0
--
0
0
0
0
0
AG
RIC
UL
TU
RA
L L
AN
D S
UB
TO
TA
L2
68
1
,14
2
2
1,4
65
2
,87
7
0
2,8
77
8
79
2
,05
1
0
5,8
07
Urb
an
an
d B
uil
t-u
p L
an
d (
3)
to:
27
1
7
0
6
50
0
5
0
--
22
2
0
27
2
Oth
er
La
nd
to:
11
2
48
7
33
4
6
67
8
0
67
8
20
5
--
7
89
0
Wa
ter
Are
ato
:0
0
0
0
0
0
0
0
0
-
- 0
TO
TA
L A
CR
EA
GE
CO
NV
ER
TE
D
to:
40
7
1,6
46
3
5
1,5
17
3
,60
5
0
3,6
05
1
,08
4
2,2
73
7
6
,96
9
(1)
Th
e s
urv
ey
are
a w
as
ad
jus
ted
in
20
08
to
mo
re a
cc
ura
tely
re
fle
ct
the
Sa
lto
n S
ea
sh
ore
lin
e.
(2)
Co
nv
ers
ion
to
Fa
rmla
nd
of
Sta
tew
ide
Im
po
rta
nc
e i
s d
ue
to
ne
w i
rrig
ate
d f
arm
lan
d,
pri
ma
rily
ro
w c
rop
s a
nd
fie
ld c
rop
s i
n t
he
no
rth
ern
po
rtio
n o
f Im
pe
ria
l V
all
ey
.
(3)
Co
nv
ers
ion
fro
m U
rba
n a
nd
Bu
ilt-
up
La
nd
pri
ma
rily
th
e r
es
ult
of
the
us
e o
f d
eta
ile
d d
igit
al
ima
ge
ry t
o d
eli
ne
ate
mo
re d
isti
nc
t u
rba
n b
ou
nd
ari
es
.
Page 32
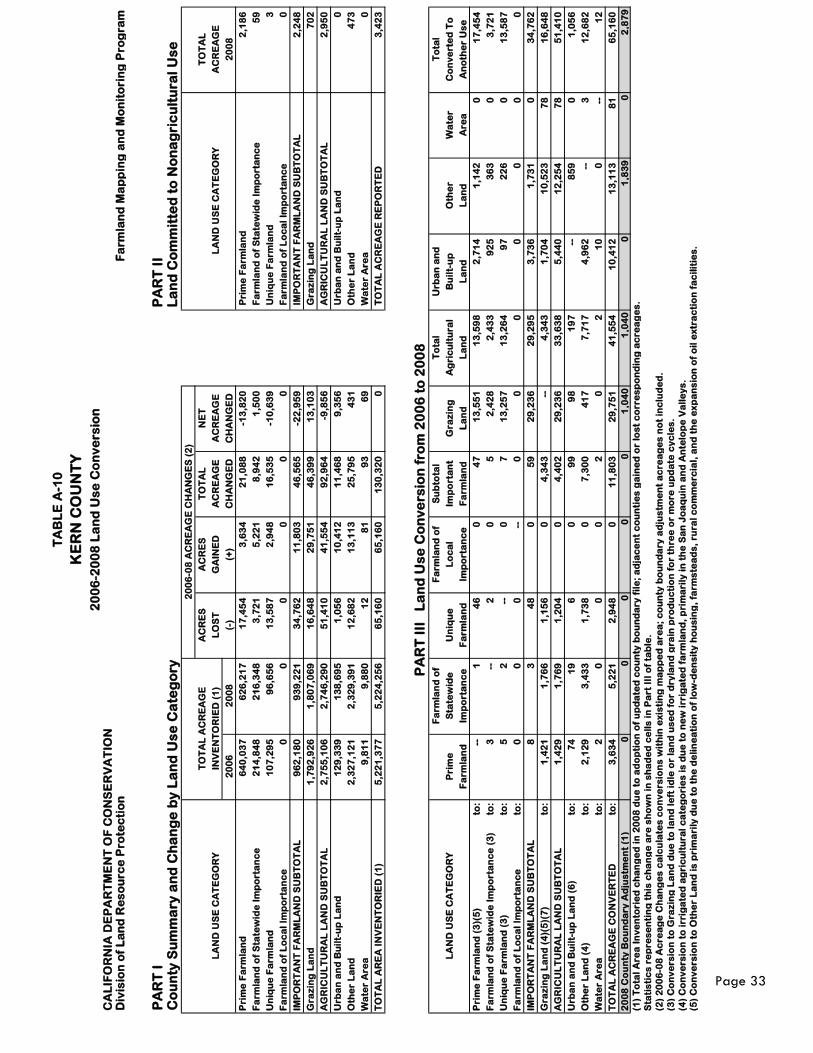
TA
BL
E A
-10
KE
RN
CO
UN
TY
20
06
-20
08
La
nd
Us
e C
on
ve
rsio
nC
AL
IFO
RN
IA D
EP
AR
TM
EN
T O
F C
ON
SE
RV
AT
ION
Div
isio
n o
f L
an
d R
es
ou
rce
Pro
tec
tio
nF
arm
lan
d M
ap
pin
g a
nd
Mo
nit
ori
ng
Pro
gra
m
PA
RT
I
PA
RT
II
Co
un
ty S
um
ma
ry a
nd
Ch
an
ge
by
La
nd
Us
e C
ate
go
ryL
an
d C
om
mit
ted
to
No
na
gri
cu
ltu
ral
Us
e
20
06
-08
AC
RE
AG
E C
HA
NG
ES
(2
)
T
OT
AL
AC
RE
AG
EA
CR
ES
AC
RE
ST
OT
AL
NE
T
TO
TA
L
LA
ND
US
E C
AT
EG
OR
YIN
VE
NT
OR
IED
(1
)L
OS
TG
AIN
ED
AC
RE
AG
EA
CR
EA
GE
LA
ND
US
E C
AT
EG
OR
YA
CR
EA
GE
20
06
20
08
(-)
(+)
CH
AN
GE
DC
HA
NG
ED
20
08
Pri
me
Fa
rmla
nd
64
0,0
37
6
26
,21
7
17
,45
4
3,6
34
2
1,0
88
-1
3,8
20
P
rim
e F
arm
lan
d2
,18
6
Fa
rmla
nd
of
Sta
tew
ide
Im
po
rta
nc
e2
14
,84
8
21
6,3
48
3
,72
1
5,2
21
8
,94
2
1,5
00
F
arm
lan
d o
f S
tate
wid
e I
mp
ort
an
ce
59
Un
iqu
e F
arm
lan
d1
07
,29
5
96
,65
6
13
,58
7
2,9
48
1
6,5
35
-1
0,6
39
U
niq
ue
Fa
rmla
nd
3
Fa
rmla
nd
of
Lo
ca
l Im
po
rta
nc
e0
0
0
0
0
0
F
arm
lan
d o
f L
oc
al
Imp
ort
an
ce
0
IMP
OR
TA
NT
FA
RM
LA
ND
SU
BT
OT
AL
96
2,1
80
9
39
,22
1
34
,76
2
11
,80
3
46
,56
5
-22
,95
9
IM
PO
RT
AN
T F
AR
ML
AN
D S
UB
TO
TA
L2
,24
8
Gra
zin
g L
an
d
1,7
92
,92
6
1,8
07
,06
9
16
,64
8
29
,75
1
46
,39
9
13
,10
3
Gra
zin
g L
an
d
70
2
AG
RIC
UL
TU
RA
L L
AN
D S
UB
TO
TA
L2
,75
5,1
06
2
,74
6,2
90
5
1,4
10
4
1,5
54
9
2,9
64
-9
,85
6
AG
RIC
UL
TU
RA
L L
AN
D S
UB
TO
TA
L2
,95
0
Urb
an
an
d B
uil
t-u
p L
an
d1
29
,33
9
13
8,6
95
1
,05
6
10
,41
2
11
,46
8
9,3
56
U
rba
n a
nd
Bu
ilt-
up
La
nd
0
Oth
er
La
nd
2,3
27
,12
1
2,3
29
,39
1
12
,68
2
13
,11
3
25
,79
5
43
1
Oth
er
La
nd
47
3
Wa
ter
Are
a9
,81
1
9,8
80
1
2
81
9
3
69
W
ate
r A
rea
0
TO
TA
L A
RE
A I
NV
EN
TO
RIE
D (
1)
5,2
21
,37
7
5,2
24
,25
6
65
,16
0
65
,16
0
13
0,3
20
0
T
OT
AL
AC
RE
AG
E R
EP
OR
TE
D3
,42
3
PA
RT
III
L
an
d U
se
Co
nv
ers
ion
fro
m 2
00
6 t
o 2
00
8F
arm
lan
d o
fF
arm
lan
d o
fS
ub
tota
lT
ota
lU
rba
n a
nd
To
tal
LA
ND
US
E C
AT
EG
OR
YP
rim
eS
tate
wid
eU
niq
ue
Lo
ca
lIm
po
rta
nt
Gra
zin
gA
gri
cu
ltu
ral
Bu
ilt-
up
Oth
er
Wa
ter
Co
nv
ert
ed
To
Fa
rmla
nd
Imp
ort
an
ce
Fa
rmla
nd
Imp
ort
an
ce
Fa
rmla
nd
La
nd
La
nd
La
nd
La
nd
Are
aA
no
the
r U
se
Pri
me
Fa
rmla
nd
(3
)(5
)to
: -
- 1
4
6
0
47
1
3,5
51
1
3,5
98
2
,71
4
1,1
42
0
1
7,4
54
Fa
rmla
nd
of
Sta
tew
ide
Im
po
rta
nc
e (
3)
to:
3
--
2
0
5
2,4
28
2
,43
3
92
5
36
3
0
3,7
21
Un
iqu
e F
arm
lan
d (
3)
to:
5
2
--
0
7
13
,25
7
13
,26
4
97
2
26
0
1
3,5
87
Fa
rmla
nd
of
Lo
ca
l Im
po
rta
nc
eto
:0
0
0
-
- 0
0
0
0
0
0
0
IMP
OR
TA
NT
FA
RM
LA
ND
SU
BT
OT
AL
8
3
48
0
5
9
29
,23
6
29
,29
5
3,7
36
1
,73
1
0
34
,76
2
Gra
zin
g L
an
d (
4)(
5)(
7)
to:
1,4
21
1
,76
6
1,1
56
0
4
,34
3
--
4,3
43
1
,70
4
10
,52
3
78
1
6,6
48
AG
RIC
UL
TU
RA
L L
AN
D S
UB
TO
TA
L1
,42
9
1,7
69
1
,20
4
0
4,4
02
2
9,2
36
3
3,6
38
5
,44
0
12
,25
4
78
5
1,4
10
Urb
an
an
d B
uil
t-u
p L
an
d (
6)
to:
74
1
9
6
0
99
9
8
19
7
--
85
9
0
1,0
56
Oth
er
La
nd
(4
)to
:2
,12
9
3,4
33
1
,73
8
0
7,3
00
4
17
7
,71
7
4,9
62
-
- 3
1
2,6
82
Wa
ter
Are
ato
:2
0
0
0
2
0
2
1
0
0
--
12
TO
TA
L A
CR
EA
GE
CO
NV
ER
TE
D
to:
3,6
34
5
,22
1
2,9
48
0
1
1,8
03
2
9,7
51
4
1,5
54
1
0,4
12
1
3,1
13
8
1
65
,16
0
20
08
Co
un
ty B
ou
nd
ary
Ad
jus
tme
nt
(1)
00
00
01
,04
01
,04
00
1,8
39
02
,87
9
(1)
To
tal
Are
a I
nv
en
tori
ed
ch
an
ge
d i
n 2
00
8 d
ue
to
ad
op
tio
n o
f u
pd
ate
d c
ou
nty
bo
un
da
ry f
ile
; a
dja
ce
nt
co
un
tie
s g
ain
ed
or
los
t c
orr
es
po
nd
ing
ac
rea
ge
s.
Sta
tis
tic
s r
ep
res
en
tin
g t
his
ch
an
ge
are
sh
ow
n i
n s
ha
de
d c
ell
s i
n P
art
III
of
tab
le.
(2)
20
06
-08
Ac
rea
ge
Ch
an
ge
s c
alc
ula
tes
co
nv
ers
ion
s w
ith
in e
xis
tin
g m
ap
pe
d a
rea
; c
ou
nty
bo
un
da
ry a
dju
stm
en
t a
cre
ag
es
no
t in
clu
de
d.
(3)
Co
nv
ers
ion
to
Gra
zin
g L
an
d d
ue
to
la
nd
le
ft i
dle
or
lan
d u
se
d f
or
dry
lan
d g
rain
pro
du
cti
on
fo
r th
ree
or
mo
re u
pd
ate
cy
cle
s.
(4)
Co
nv
ers
ion
to
irr
iga
ted
ag
ric
ult
ura
l c
ate
go
rie
s i
s d
ue
to
ne
w i
rrig
ate
d f
arm
lan
d,
pri
ma
rily
in
th
e S
an
Jo
aq
uin
an
d A
nte
lop
e V
all
ey
s.
(5)
Co
nv
ers
ion
to
Oth
er
La
nd
is
pri
ma
rily
du
e t
o t
he
de
lin
ea
tio
n o
f lo
w-d
en
sit
y h
ou
sin
g,
farm
ste
ad
s,
rura
l c
om
me
rcia
l, a
nd
th
e e
xp
an
sio
n o
f o
il e
xtr
ac
tio
n f
ac
ilit
ies
.
Page 33
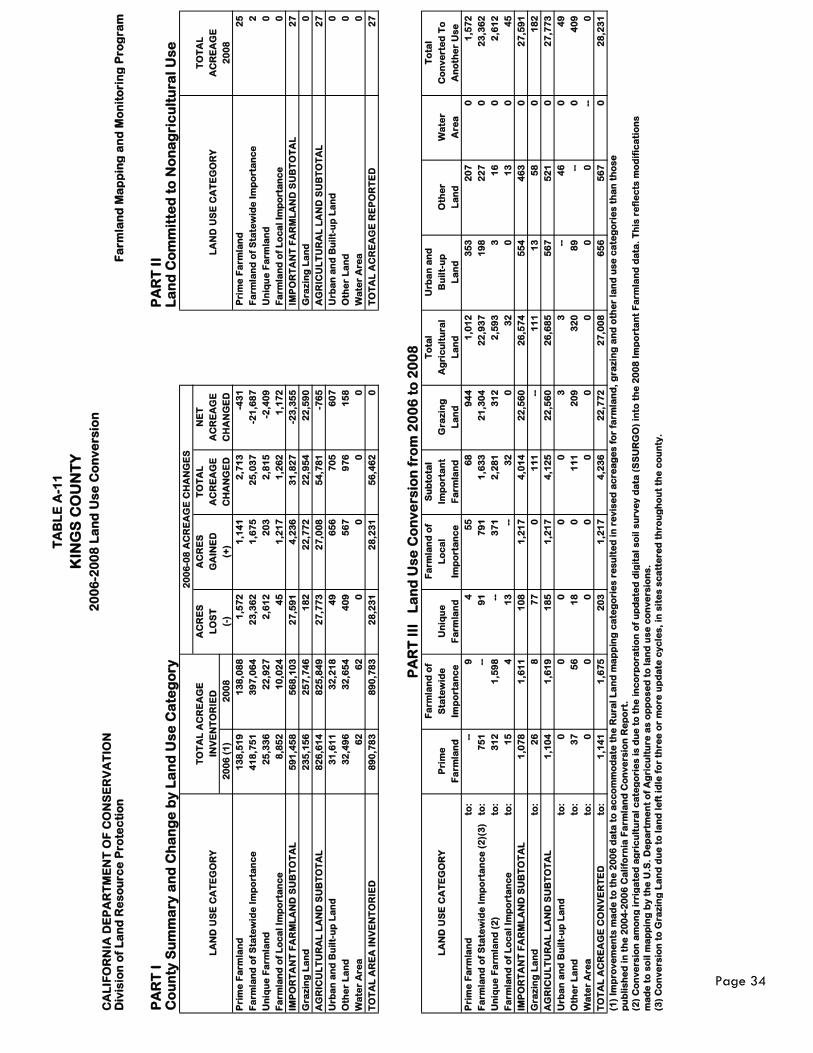
TA
BL
E A
-11
KIN
GS
CO
UN
TY
20
06
-20
08
La
nd
Us
e C
on
ve
rsio
nC
AL
IFO
RN
IA D
EP
AR
TM
EN
T O
F C
ON
SE
RV
AT
ION
Div
isio
n o
f L
an
d R
es
ou
rce
Pro
tec
tio
nF
arm
lan
d M
ap
pin
g a
nd
Mo
nit
ori
ng
Pro
gra
m
PA
RT
I
PA
RT
II
Co
un
ty S
um
ma
ry a
nd
Ch
an
ge
by
La
nd
Us
e C
ate
go
ryL
an
d C
om
mit
ted
to
No
na
gri
cu
ltu
ral
Us
e
20
06
-08
AC
RE
AG
E C
HA
NG
ES
T
OT
AL
AC
RE
AG
EA
CR
ES
AC
RE
ST
OT
AL
NE
T
TO
TA
L
LA
ND
US
E C
AT
EG
OR
YIN
VE
NT
OR
IED
LO
ST
GA
INE
DA
CR
EA
GE
AC
RE
AG
EL
AN
D U
SE
CA
TE
GO
RY
AC
RE
AG
E
20
06
(1
)2
00
8(-
)(+
)C
HA
NG
ED
CH
AN
GE
D2
00
8
Pri
me
Fa
rmla
nd
13
8,5
19
1
38
,08
8
1,5
72
1
,14
1
2,7
13
-4
31
P
rim
e F
arm
lan
d2
5
Fa
rmla
nd
of
Sta
tew
ide
Im
po
rta
nc
e4
18
,75
1
39
7,0
64
2
3,3
62
1
,67
5
25
,03
7
-21
,68
7
Fa
rmla
nd
of
Sta
tew
ide
Im
po
rta
nc
e2
Un
iqu
e F
arm
lan
d2
5,3
36
2
2,9
27
2
,61
2
20
3
2,8
15
-2
,40
9
Un
iqu
e F
arm
lan
d0
Fa
rmla
nd
of
Lo
ca
l Im
po
rta
nc
e8
,85
2
10
,02
4
45
1
,21
7
1,2
62
1
,17
2
Fa
rmla
nd
of
Lo
ca
l Im
po
rta
nc
e0
IMP
OR
TA
NT
FA
RM
LA
ND
SU
BT
OT
AL
59
1,4
58
5
68
,10
3
27
,59
1
4,2
36
3
1,8
27
-2
3,3
55
I
MP
OR
TA
NT
FA
RM
LA
ND
SU
BT
OT
AL
27
Gra
zin
g L
an
d
23
5,1
56
2
57
,74
6
18
2
22
,77
2
22
,95
4
22
,59
0
Gra
zin
g L
an
d
0
AG
RIC
UL
TU
RA
L L
AN
D S
UB
TO
TA
L8
26
,61
4
82
5,8
49
2
7,7
73
2
7,0
08
5
4,7
81
-7
65
A
GR
ICU
LT
UR
AL
LA
ND
SU
BT
OT
AL
27
Urb
an
an
d B
uil
t-u
p L
an
d3
1,6
11
3
2,2
18
4
9
65
6
70
5
60
7
Urb
an
an
d B
uil
t-u
p L
an
d0
Oth
er
La
nd
32
,49
6
32
,65
4
40
9
56
7
97
6
15
8
Oth
er
La
nd
0
Wa
ter
Are
a6
2
62
0
0
0
0
W
ate
r A
rea
0
TO
TA
L A
RE
A I
NV
EN
TO
RIE
D
89
0,7
83
8
90
,78
3
28
,23
1
28
,23
1
56
,46
2
0
TO
TA
L A
CR
EA
GE
RE
PO
RT
ED
27
PA
RT
III
L
an
d U
se
Co
nv
ers
ion
fro
m 2
00
6 t
o 2
00
8F
arm
lan
d o
fF
arm
lan
d o
fS
ub
tota
lT
ota
lU
rba
n a
nd
To
tal
LA
ND
US
E C
AT
EG
OR
YP
rim
eS
tate
wid
eU
niq
ue
Lo
ca
lIm
po
rta
nt
Gra
zin
gA
gri
cu
ltu
ral
Bu
ilt-
up
Oth
er
Wa
ter
Co
nv
ert
ed
To
Fa
rmla
nd
Imp
ort
an
ce
Fa
rmla
nd
Imp
ort
an
ce
Fa
rmla
nd
La
nd
La
nd
La
nd
La
nd
Are
aA
no
the
r U
se
Pri
me
Fa
rmla
nd
to:
--
9
4
55
6
8
94
4
1,0
12
3
53
2
07
0
1
,57
2
Fa
rmla
nd
of
Sta
tew
ide
Im
po
rta
nc
e (
2)(
3)
to:
75
1
--
91
7
91
1
,63
3
21
,30
4
22
,93
7
19
8
22
7
0
23
,36
2
Un
iqu
e F
arm
lan
d (
2)
to:
31
2
1,5
98
-
- 3
71
2
,28
1
31
2
2,5
93
3
1
6
0
2,6
12
Fa
rmla
nd
of
Lo
ca
l Im
po
rta
nc
eto
:1
5
4
13
-
- 3
2
0
32
0
1
3
0
45
IMP
OR
TA
NT
FA
RM
LA
ND
SU
BT
OT
AL
1,0
78
1
,61
1
10
8
1,2
17
4
,01
4
22
,56
0
26
,57
4
55
4
46
3
0
27
,59
1
Gra
zin
g L
an
d
to:
26
8
7
7
0
11
1
--
11
1
13
5
8
0
18
2
AG
RIC
UL
TU
RA
L L
AN
D S
UB
TO
TA
L1
,10
4
1,6
19
1
85
1
,21
7
4,1
25
2
2,5
60
2
6,6
85
5
67
5
21
0
2
7,7
73
Urb
an
an
d B
uil
t-u
p L
an
dto
:0
0
0
0
0
3
3
-
- 4
6
0
49
Oth
er
La
nd
to:
37
5
6
18
0
1
11
2
09
3
20
8
9
--
0
40
9
Wa
ter
Are
ato
:0
0
0
0
0
0
0
0
0
-
- 0
TO
TA
L A
CR
EA
GE
CO
NV
ER
TE
D
to:
1,1
41
1
,67
5
20
3
1,2
17
4
,23
6
22
,77
2
27
,00
8
65
6
56
7
0
28
,23
1
(1)
Imp
rov
em
en
ts m
ad
e t
o t
he
20
06
da
ta t
o a
cc
om
mo
da
te t
he
Ru
ral
La
nd
ma
pp
ing
ca
teg
ori
es
re
su
lte
d i
n r
ev
ise
d a
cre
ag
es
fo
r fa
rmla
nd
, g
raz
ing
an
d o
the
r la
nd
us
e c
ate
go
rie
s t
ha
n t
ho
se
pu
bli
sh
ed
in
th
e 2
00
4-2
00
6 C
ali
forn
ia F
arm
lan
d C
on
ve
rsio
n R
ep
ort
.
(2)
Co
nv
ers
ion
am
on
g i
rrig
ate
d a
gri
cu
ltu
ral
ca
teg
ori
es
is
du
e t
o t
he
in
co
rpo
rati
on
of
up
da
ted
dig
ita
l s
oil
su
rve
y d
ata
(S
SU
RG
O)
into
th
e 2
00
8 I
mp
ort
an
t F
arm
lan
d d
ata
. T
his
re
fle
cts
mo
dif
ica
tio
ns
ma
de
to
so
il m
ap
pin
g b
y t
he
U.S
. D
ep
art
me
nt
of
Ag
ric
ult
ure
as
op
po
se
d t
o l
an
d u
se
co
nv
ers
ion
s.
(3)
Co
nv
ers
ion
to
Gra
zin
g L
an
d d
ue
to
la
nd
le
ft i
dle
fo
r th
ree
or
mo
re u
pd
ate
cy
cle
s,
in s
ite
s s
ca
tte
red
th
rou
gh
ou
t th
e c
ou
nty
.
Page 34
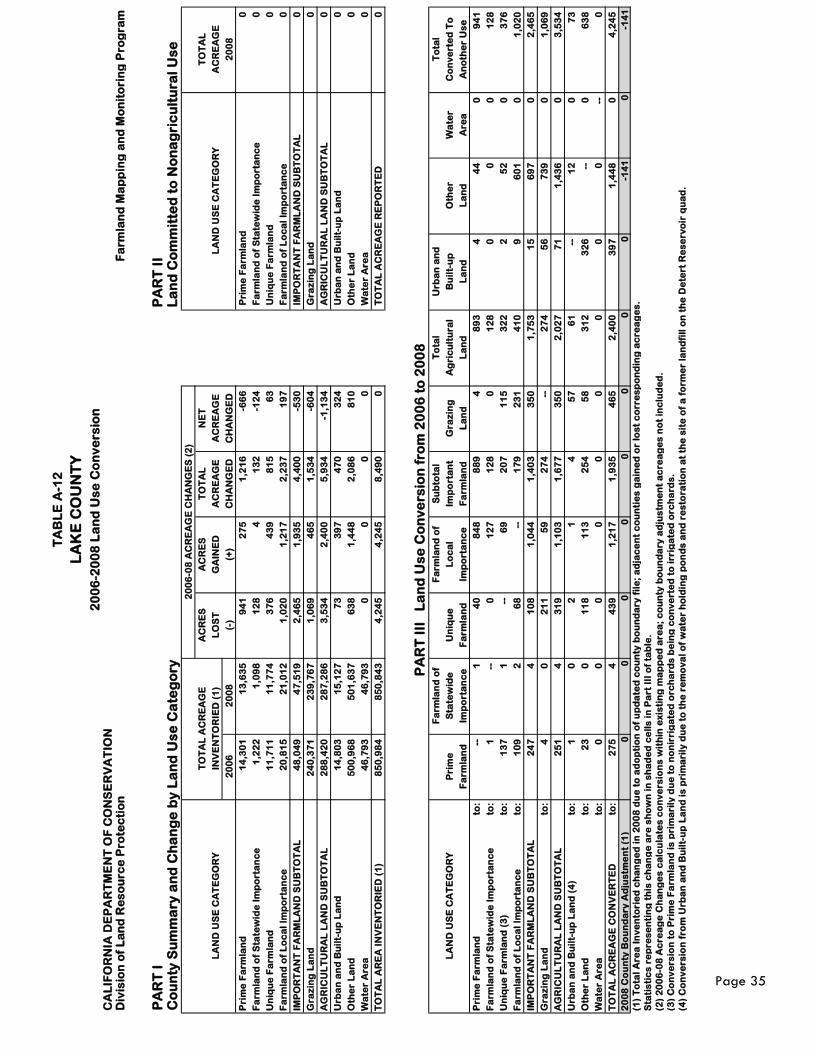
TA
BL
E A
-12
LA
KE
CO
UN
TY
20
06
-20
08
La
nd
Us
e C
on
ve
rsio
nC
AL
IFO
RN
IA D
EP
AR
TM
EN
T O
F C
ON
SE
RV
AT
ION
Div
isio
n o
f L
an
d R
es
ou
rce
Pro
tec
tio
nF
arm
lan
d M
ap
pin
g a
nd
Mo
nit
ori
ng
Pro
gra
m
PA
RT
I
PA
RT
II
Co
un
ty S
um
ma
ry a
nd
Ch
an
ge
by
La
nd
Us
e C
ate
go
ryL
an
d C
om
mit
ted
to
No
na
gri
cu
ltu
ral
Us
e
20
06
-08
AC
RE
AG
E C
HA
NG
ES
(2
)
T
OT
AL
AC
RE
AG
EA
CR
ES
AC
RE
ST
OT
AL
NE
T
TO
TA
L
LA
ND
US
E C
AT
EG
OR
YIN
VE
NT
OR
IED
(1
)L
OS
TG
AIN
ED
AC
RE
AG
EA
CR
EA
GE
LA
ND
US
E C
AT
EG
OR
YA
CR
EA
GE
20
06
20
08
(-)
(+)
CH
AN
GE
DC
HA
NG
ED
20
08
Pri
me
Fa
rmla
nd
14
,30
1
13
,63
5
94
1
27
5
1,2
16
-6
66
P
rim
e F
arm
lan
d0
Fa
rmla
nd
of
Sta
tew
ide
Im
po
rta
nc
e1
,22
2
1,0
98
1
28
4
1
32
-1
24
F
arm
lan
d o
f S
tate
wid
e I
mp
ort
an
ce
0
Un
iqu
e F
arm
lan
d1
1,7
11
1
1,7
74
3
76
4
39
8
15
6
3
Un
iqu
e F
arm
lan
d0
Fa
rmla
nd
of
Lo
ca
l Im
po
rta
nc
e2
0,8
15
2
1,0
12
1
,02
0
1,2
17
2
,23
7
19
7
Fa
rmla
nd
of
Lo
ca
l Im
po
rta
nc
e0
IMP
OR
TA
NT
FA
RM
LA
ND
SU
BT
OT
AL
48
,04
9
47
,51
9
2,4
65
1
,93
5
4,4
00
-5
30
I
MP
OR
TA
NT
FA
RM
LA
ND
SU
BT
OT
AL
0
Gra
zin
g L
an
d
24
0,3
71
2
39
,76
7
1,0
69
4
65
1
,53
4
-60
4
Gra
zin
g L
an
d
0
AG
RIC
UL
TU
RA
L L
AN
D S
UB
TO
TA
L2
88
,42
0
28
7,2
86
3
,53
4
2,4
00
5
,93
4
-1,1
34
A
GR
ICU
LT
UR
AL
LA
ND
SU
BT
OT
AL
0
Urb
an
an
d B
uil
t-u
p L
an
d1
4,8
03
1
5,1
27
7
3
39
7
47
0
32
4
Urb
an
an
d B
uil
t-u
p L
an
d0
Oth
er
La
nd
50
0,9
68
5
01
,63
7
63
8
1,4
48
2
,08
6
81
0
Oth
er
La
nd
0
Wa
ter
Are
a4
6,7
93
4
6,7
93
0
0
0
0
W
ate
r A
rea
0
TO
TA
L A
RE
A I
NV
EN
TO
RIE
D (
1)
85
0,9
84
8
50
,84
3
4,2
45
4
,24
5
8,4
90
0
T
OT
AL
AC
RE
AG
E R
EP
OR
TE
D0
PA
RT
III
L
an
d U
se
Co
nv
ers
ion
fro
m 2
00
6 t
o 2
00
8F
arm
lan
d o
fF
arm
lan
d o
fS
ub
tota
lT
ota
lU
rba
n a
nd
To
tal
LA
ND
US
E C
AT
EG
OR
YP
rim
eS
tate
wid
eU
niq
ue
Lo
ca
lIm
po
rta
nt
Gra
zin
gA
gri
cu
ltu
ral
Bu
ilt-
up
Oth
er
Wa
ter
Co
nv
ert
ed
To
Fa
rmla
nd
Imp
ort
an
ce
Fa
rmla
nd
Imp
ort
an
ce
Fa
rmla
nd
La
nd
La
nd
La
nd
La
nd
Are
aA
no
the
r U
se
Pri
me
Fa
rmla
nd
to:
--
1
40
8
48
8
89
4
8
93
4
4
4
0
94
1
Fa
rmla
nd
of
Sta
tew
ide
Im
po
rta
nc
eto
:1
-
- 0
1
27
1
28
0
1
28
0
0
0
1
28
Un
iqu
e F
arm
lan
d (
3)
to:
13
7
1
--
69
2
07
1
15
3
22
2
5
2
0
37
6
Fa
rmla
nd
of
Lo
ca
l Im
po
rta
nc
eto
:1
09
2
6
8
--
17
9
23
1
41
0
9
60
1
0
1,0
20
IMP
OR
TA
NT
FA
RM
LA
ND
SU
BT
OT
AL
24
7
4
10
8
1,0
44
1
,40
3
35
0
1,7
53
1
5
69
7
0
2,4
65
Gra
zin
g L
an
d
to:
4
0
21
1
59
2
74
-
- 2
74
5
6
73
9
0
1,0
69
AG
RIC
UL
TU
RA
L L
AN
D S
UB
TO
TA
L2
51
4
3
19
1
,10
3
1,6
77
3
50
2
,02
7
71
1
,43
6
0
3,5
34
Urb
an
an
d B
uil
t-u
p L
an
d (
4)
to:
1
0
2
1
4
57
6
1
--
12
0
7
3
Oth
er
La
nd
to:
23
0
1
18
1
13
2
54
5
8
31
2
32
6
--
0
63
8
Wa
ter
Are
ato
:0
0
0
0
0
0
0
0
0
-
- 0
TO
TA
L A
CR
EA
GE
CO
NV
ER
TE
D
to:
27
5
4
43
9
1,2
17
1
,93
5
46
5
2,4
00
3
97
1
,44
8
0
4,2
45
20
08
Co
un
ty B
ou
nd
ary
Ad
jus
tme
nt
(1)
00
00
00
00
-14
10
-14
1
(1)
To
tal
Are
a I
nv
en
tori
ed
ch
an
ge
d i
n 2
00
8 d
ue
to
ad
op
tio
n o
f u
pd
ate
d c
ou
nty
bo
un
da
ry f
ile
; a
dja
ce
nt
co
un
tie
s g
ain
ed
or
los
t c
orr
es
po
nd
ing
ac
rea
ge
s.
Sta
tis
tic
s r
ep
res
en
tin
g t
his
ch
an
ge
are
sh
ow
n i
n s
ha
de
d c
ell
s i
n P
art
III
of
tab
le.
(2)
20
06
-08
Ac
rea
ge
Ch
an
ge
s c
alc
ula
tes
co
nv
ers
ion
s w
ith
in e
xis
tin
g m
ap
pe
d a
rea
; c
ou
nty
bo
un
da
ry a
dju
stm
en
t a
cre
ag
es
no
t in
clu
de
d.
(3)
Co
nv
ers
ion
to
Pri
me
Fa
rmla
nd
is
pri
ma
rily
du
e t
o n
on
irri
ga
ted
orc
ha
rds
be
ing
co
nv
ert
ed
to
irr
iga
ted
orc
ha
rds
.
(4)
Co
nv
ers
ion
fro
m U
rba
n a
nd
Bu
ilt-
up
La
nd
is
pri
ma
rily
du
e t
o t
he
re
mo
va
l o
f w
ate
r h
old
ing
po
nd
s a
nd
re
sto
rati
on
at
the
sit
e o
f a
fo
rme
r la
nd
fill
on
th
e D
ete
rt R
es
erv
oir
qu
ad
.
Page 35
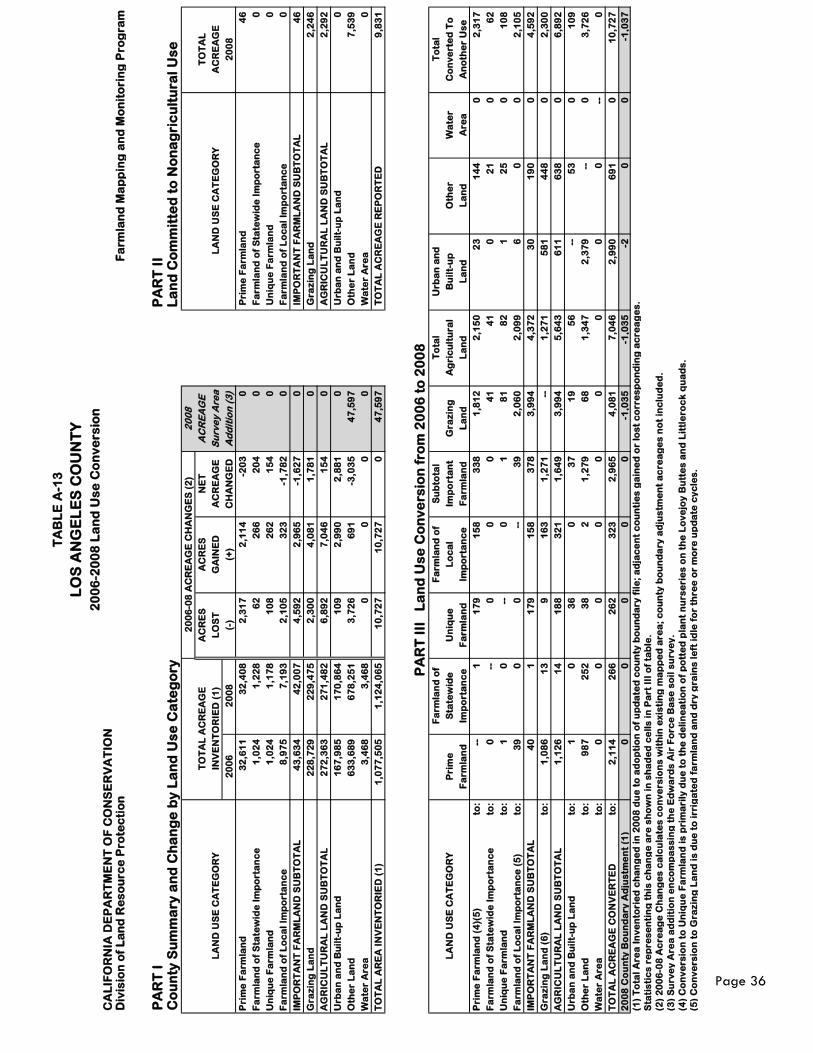
TA
BL
E A
-13
LO
S A
NG
EL
ES
CO
UN
TY
20
06
-20
08
La
nd
Us
e C
on
ve
rsio
nC
AL
IFO
RN
IA D
EP
AR
TM
EN
T O
F C
ON
SE
RV
AT
ION
Div
isio
n o
f L
an
d R
es
ou
rce
Pro
tec
tio
nF
arm
lan
d M
ap
pin
g a
nd
Mo
nit
ori
ng
Pro
gra
m
PA
RT
I
PA
RT
II
Co
un
ty S
um
ma
ry a
nd
Ch
an
ge
by
La
nd
Us
e C
ate
go
ryL
an
d C
om
mit
ted
to
No
na
gri
cu
ltu
ral
Us
e
2
00
8
T
OT
AL
AC
RE
AG
EA
CR
ES
AC
RE
SN
ET
AC
RE
AG
E
TO
TA
L
LA
ND
US
E C
AT
EG
OR
YIN
VE
NT
OR
IED
(1
)L
OS
TG
AIN
ED
AC
RE
AG
ES
urv
ey
Are
aL
AN
D U
SE
CA
TE
GO
RY
AC
RE
AG
E
20
06
20
08
(-)
(+)
CH
AN
GE
DA
dd
itio
n (
3)
20
08
Pri
me
Fa
rmla
nd
32
,61
1
32
,40
8
2,3
17
2
,11
4
-20
3
0
Pri
me
Fa
rmla
nd
46
Fa
rmla
nd
of
Sta
tew
ide
Im
po
rta
nc
e1
,02
4
1,2
28
6
2
26
6
20
4
0
Fa
rmla
nd
of
Sta
tew
ide
Im
po
rta
nc
e0
Un
iqu
e F
arm
lan
d1
,02
4
1,1
78
1
08
2
62
1
54
0
U
niq
ue
Fa
rmla
nd
0
Fa
rmla
nd
of
Lo
ca
l Im
po
rta
nc
e8
,97
5
7,1
93
2
,10
5
32
3
-1,7
82
0
F
arm
lan
d o
f L
oc
al
Imp
ort
an
ce
0
IMP
OR
TA
NT
FA
RM
LA
ND
SU
BT
OT
AL
43
,63
4
42
,00
7
4,5
92
2
,96
5
-1,6
27
0
I
MP
OR
TA
NT
FA
RM
LA
ND
SU
BT
OT
AL
46
Gra
zin
g L
an
d
22
8,7
29
2
29
,47
5
2,3
00
4
,08
1
1,7
81
0
G
raz
ing
La
nd
2
,24
6
AG
RIC
UL
TU
RA
L L
AN
D S
UB
TO
TA
L2
72
,36
3
27
1,4
82
6
,89
2
7,0
46
1
54
0
A
GR
ICU
LT
UR
AL
LA
ND
SU
BT
OT
AL
2,2
92
Urb
an
an
d B
uil
t-u
p L
an
d1
67
,98
5
17
0,8
64
1
09
2
,99
0
2,8
81
0
U
rba
n a
nd
Bu
ilt-
up
La
nd
0
Oth
er
La
nd
63
3,6
89
6
78
,25
1
3,7
26
6
91
-3
,03
5
47
,59
7
Oth
er
La
nd
7,5
39
Wa
ter
Are
a3
,46
8
3,4
68
0
0
0
0
W
ate
r A
rea
0
TO
TA
L A
RE
A I
NV
EN
TO
RIE
D (
1)
1,0
77
,50
5
1,1
24
,06
5
10
,72
7
10
,72
7
0
47
,59
7
TO
TA
L A
CR
EA
GE
RE
PO
RT
ED
9,8
31
PA
RT
III
L
an
d U
se
Co
nv
ers
ion
fro
m 2
00
6 t
o 2
00
8F
arm
lan
d o
fF
arm
lan
d o
fS
ub
tota
lT
ota
lU
rba
n a
nd
To
tal
LA
ND
US
E C
AT
EG
OR
YP
rim
eS
tate
wid
eU
niq
ue
Lo
ca
lIm
po
rta
nt
Gra
zin
gA
gri
cu
ltu
ral
Bu
ilt-
up
Oth
er
Wa
ter
Co
nv
ert
ed
To
Fa
rmla
nd
Imp
ort
an
ce
Fa
rmla
nd
Imp
ort
an
ce
Fa
rmla
nd
La
nd
La
nd
La
nd
La
nd
Are
aA
no
the
r U
se
Pri
me
Fa
rmla
nd
(4
)(5
)to
: -
- 1
1
79
1
58
3
38
1
,81
2
2,1
50
2
3
14
4
0
2,3
17
Fa
rmla
nd
of
Sta
tew
ide
Im
po
rta
nc
eto
:0
-
- 0
0
0
4
1
41
0
2
1
0
62
Un
iqu
e F
arm
lan
dto
:1
0
-
- 0
1
8
1
82
1
2
5
0
10
8
Fa
rmla
nd
of
Lo
ca
l Im
po
rta
nc
e (
5)
to:
39
0
0
-
- 3
9
2,0
60
2
,09
9
6
0
0
2,1
05
IMP
OR
TA
NT
FA
RM
LA
ND
SU
BT
OT
AL
40
1
1
79
1
58
3
78
3
,99
4
4,3
72
3
0
19
0
0
4,5
92
Gra
zin
g L
an
d (
6)
to:
1,0
86
1
3
9
16
3
1,2
71
-
- 1
,27
1
58
1
44
8
0
2,3
00
AG
RIC
UL
TU
RA
L L
AN
D S
UB
TO
TA
L1
,12
6
14
1
88
3
21
1
,64
9
3,9
94
5
,64
3
61
1
63
8
0
6,8
92
Urb
an
an
d B
uil
t-u
p L
an
d
to:
1
0
36
0
3
7
19
5
6
--
53
0
1
09
Oth
er
La
nd
to:
98
7
25
2
38
2
1
,27
9
68
1
,34
7
2,3
79
-
- 0
3
,72
6
Wa
ter
Are
ato
:0
0
0
0
0
0
0
0
0
-
- 0
TO
TA
L A
CR
EA
GE
CO
NV
ER
TE
D
to:
2,1
14
2
66
2
62
3
23
2
,96
5
4,0
81
7
,04
6
2,9
90
6
91
0
1
0,7
27
20
08
Co
un
ty B
ou
nd
ary
Ad
jus
tme
nt
(1)
0
0
0
0
0
-1,0
35
-1
,03
5
-2
0
0
-1,0
37
(1)
To
tal
Are
a I
nv
en
tori
ed
ch
an
ge
d i
n 2
00
8 d
ue
to
ad
op
tio
n o
f u
pd
ate
d c
ou
nty
bo
un
da
ry f
ile
; a
dja
ce
nt
co
un
tie
s g
ain
ed
or
los
t c
orr
es
po
nd
ing
ac
rea
ge
s.
Sta
tis
tic
s r
ep
res
en
tin
g t
his
ch
an
ge
are
sh
ow
n i
n s
ha
de
d c
ell
s i
n P
art
III
of
tab
le.
(2)
20
06
-08
Ac
rea
ge
Ch
an
ge
s c
alc
ula
tes
co
nv
ers
ion
s w
ith
in e
xis
tin
g m
ap
pe
d a
rea
; c
ou
nty
bo
un
da
ry a
dju
stm
en
t a
cre
ag
es
no
t in
clu
de
d.
(3)
Su
rve
y A
rea
ad
dit
ion
en
co
mp
as
sin
g t
he
Ed
wa
rds
Air
Fo
rce
Ba
se
so
il s
urv
ey
.
(4)
Co
nv
ers
ion
to
Un
iqu
e F
arm
lan
d i
s p
rim
ari
ly d
ue
to
th
e d
eli
ne
ati
on
of
po
tte
d p
lan
t n
urs
eri
es
on
th
e L
ov
ejo
y B
utt
es
an
d L
ittl
ero
ck
qu
ad
s.
(5)
Co
nv
ers
ion
to
Gra
zin
g L
an
d i
s d
ue
to
irr
iga
ted
fa
rmla
nd
an
d d
ry g
rain
s l
eft
id
le f
or
thre
e o
r m
ore
up
da
te c
yc
les
.
20
06
-08
AC
RE
AG
E C
HA
NG
ES
(2
)
Page 36
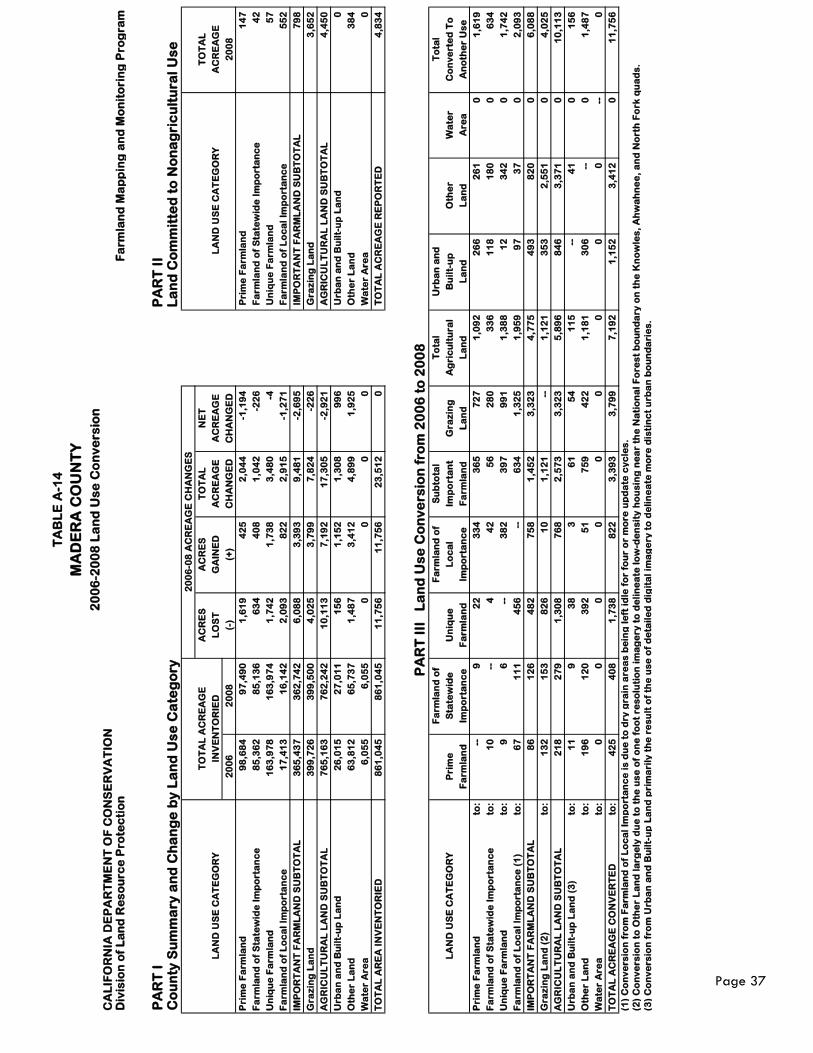
TA
BL
E A
-14
MA
DE
RA
CO
UN
TY
20
06
-20
08
La
nd
Us
e C
on
ve
rsio
nC
AL
IFO
RN
IA D
EP
AR
TM
EN
T O
F C
ON
SE
RV
AT
ION
Div
isio
n o
f L
an
d R
es
ou
rce
Pro
tec
tio
nF
arm
lan
d M
ap
pin
g a
nd
Mo
nit
ori
ng
Pro
gra
m
PA
RT
I
PA
RT
II
Co
un
ty S
um
ma
ry a
nd
Ch
an
ge
by
La
nd
Us
e C
ate
go
ryL
an
d C
om
mit
ted
to
No
na
gri
cu
ltu
ral
Us
e
20
06
-08
AC
RE
AG
E C
HA
NG
ES
T
OT
AL
AC
RE
AG
EA
CR
ES
AC
RE
ST
OT
AL
NE
T
TO
TA
L
LA
ND
US
E C
AT
EG
OR
YIN
VE
NT
OR
IED
LO
ST
GA
INE
DA
CR
EA
GE
AC
RE
AG
EL
AN
D U
SE
CA
TE
GO
RY
AC
RE
AG
E
20
06
20
08
(-)
(+)
CH
AN
GE
DC
HA
NG
ED
20
08
Pri
me
Fa
rmla
nd
98
,68
4
97
,49
0
1,6
19
4
25
2
,04
4
-1,1
94
P
rim
e F
arm
lan
d1
47
Fa
rmla
nd
of
Sta
tew
ide
Im
po
rta
nc
e8
5,3
62
8
5,1
36
6
34
4
08
1
,04
2
-22
6
Fa
rmla
nd
of
Sta
tew
ide
Im
po
rta
nc
e4
2
Un
iqu
e F
arm
lan
d1
63
,97
8
16
3,9
74
1
,74
2
1,7
38
3
,48
0
-4
Un
iqu
e F
arm
lan
d5
7
Fa
rmla
nd
of
Lo
ca
l Im
po
rta
nc
e1
7,4
13
1
6,1
42
2
,09
3
82
2
2,9
15
-1
,27
1
Fa
rmla
nd
of
Lo
ca
l Im
po
rta
nc
e5
52
IMP
OR
TA
NT
FA
RM
LA
ND
SU
BT
OT
AL
36
5,4
37
3
62
,74
2
6,0
88
3
,39
3
9,4
81
-2
,69
5
IM
PO
RT
AN
T F
AR
ML
AN
D S
UB
TO
TA
L7
98
Gra
zin
g L
an
d
39
9,7
26
3
99
,50
0
4,0
25
3
,79
9
7,8
24
-2
26
G
raz
ing
La
nd
3
,65
2
AG
RIC
UL
TU
RA
L L
AN
D S
UB
TO
TA
L7
65
,16
3
76
2,2
42
1
0,1
13
7
,19
2
17
,30
5
-2,9
21
A
GR
ICU
LT
UR
AL
LA
ND
SU
BT
OT
AL
4,4
50
Urb
an
an
d B
uil
t-u
p L
an
d2
6,0
15
2
7,0
11
1
56
1
,15
2
1,3
08
9
96
U
rba
n a
nd
Bu
ilt-
up
La
nd
0
Oth
er
La
nd
63
,81
2
65
,73
7
1,4
87
3
,41
2
4,8
99
1
,92
5
Oth
er
La
nd
38
4
Wa
ter
Are
a6
,05
5
6,0
55
0
0
0
0
W
ate
r A
rea
0
TO
TA
L A
RE
A I
NV
EN
TO
RIE
D
86
1,0
45
8
61
,04
5
11
,75
6
11
,75
6
23
,51
2
0
TO
TA
L A
CR
EA
GE
RE
PO
RT
ED
4,8
34
PA
RT
III
L
an
d U
se
Co
nv
ers
ion
fro
m 2
00
6 t
o 2
00
8F
arm
lan
d o
fF
arm
lan
d o
fS
ub
tota
lT
ota
lU
rba
n a
nd
To
tal
LA
ND
US
E C
AT
EG
OR
YP
rim
eS
tate
wid
eU
niq
ue
Lo
ca
lIm
po
rta
nt
Gra
zin
gA
gri
cu
ltu
ral
Bu
ilt-
up
Oth
er
Wa
ter
Co
nv
ert
ed
To
Fa
rmla
nd
Imp
ort
an
ce
Fa
rmla
nd
Imp
ort
an
ce
Fa
rmla
nd
La
nd
La
nd
La
nd
La
nd
Are
aA
no
the
r U
se
Pri
me
Fa
rmla
nd
to:
--
9
22
3
34
3
65
7
27
1
,09
2
26
6
26
1
0
1,6
19
Fa
rmla
nd
of
Sta
tew
ide
Im
po
rta
nc
eto
:1
0
--
4
42
5
6
28
0
33
6
11
8
18
0
0
63
4
Un
iqu
e F
arm
lan
dto
:9
6
-
- 3
82
3
97
9
91
1
,38
8
12
3
42
0
1
,74
2
Fa
rmla
nd
of
Lo
ca
l Im
po
rta
nc
e (
1)
to:
67
1
11
4
56
-
- 6
34
1
,32
5
1,9
59
9
7
37
0
2
,09
3
IMP
OR
TA
NT
FA
RM
LA
ND
SU
BT
OT
AL
86
1
26
4
82
7
58
1
,45
2
3,3
23
4
,77
5
49
3
82
0
0
6,0
88
Gra
zin
g L
an
d (
2)
to:
13
2
15
3
82
6
10
1
,12
1
--
1,1
21
3
53
2
,55
1
0
4,0
25
AG
RIC
UL
TU
RA
L L
AN
D S
UB
TO
TA
L2
18
2
79
1
,30
8
76
8
2,5
73
3
,32
3
5,8
96
8
46
3
,37
1
0
10
,11
3
Urb
an
an
d B
uil
t-u
p L
an
d (
3)
to:
11
9
3
8
3
61
5
4
11
5
--
41
0
1
56
Oth
er
La
nd
to:
19
6
12
0
39
2
51
7
59
4
22
1
,18
1
30
6
--
0
1,4
87
Wa
ter
Are
ato
:0
0
0
0
0
0
0
0
0
-
- 0
TO
TA
L A
CR
EA
GE
CO
NV
ER
TE
D
to:
42
5
40
8
1,7
38
8
22
3
,39
3
3,7
99
7
,19
2
1,1
52
3
,41
2
0
11
,75
6
(1)
Co
nv
ers
ion
fro
m F
arm
lan
d o
f L
oc
al
Imp
ort
an
ce
is
du
e t
o d
ry g
rain
are
as
be
ing
le
ft i
dle
fo
r fo
ur
or
mo
re u
pd
ate
cy
cle
s.
(2)
Co
nv
ers
ion
to
Oth
er
La
nd
la
rge
ly d
ue
to
th
e u
se
of
on
e f
oo
t re
so
luti
on
im
ag
ery
to
de
lin
ea
te l
ow
-de
ns
ity
ho
us
ing
ne
ar
the
Na
tio
na
l F
ore
st
bo
un
da
ry o
n t
he
Kn
ow
les
, A
hw
ah
ne
e,
an
d N
ort
h F
ork
qu
ad
s.
(3)
Co
nv
ers
ion
fro
m U
rba
n a
nd
Bu
ilt-
up
La
nd
pri
ma
rily
th
e r
es
ult
of
the
us
e o
f d
eta
ile
d d
igit
al
ima
ge
ry t
o d
eli
ne
ate
mo
re d
isti
nc
t u
rba
n b
ou
nd
ari
es
.
Page 37
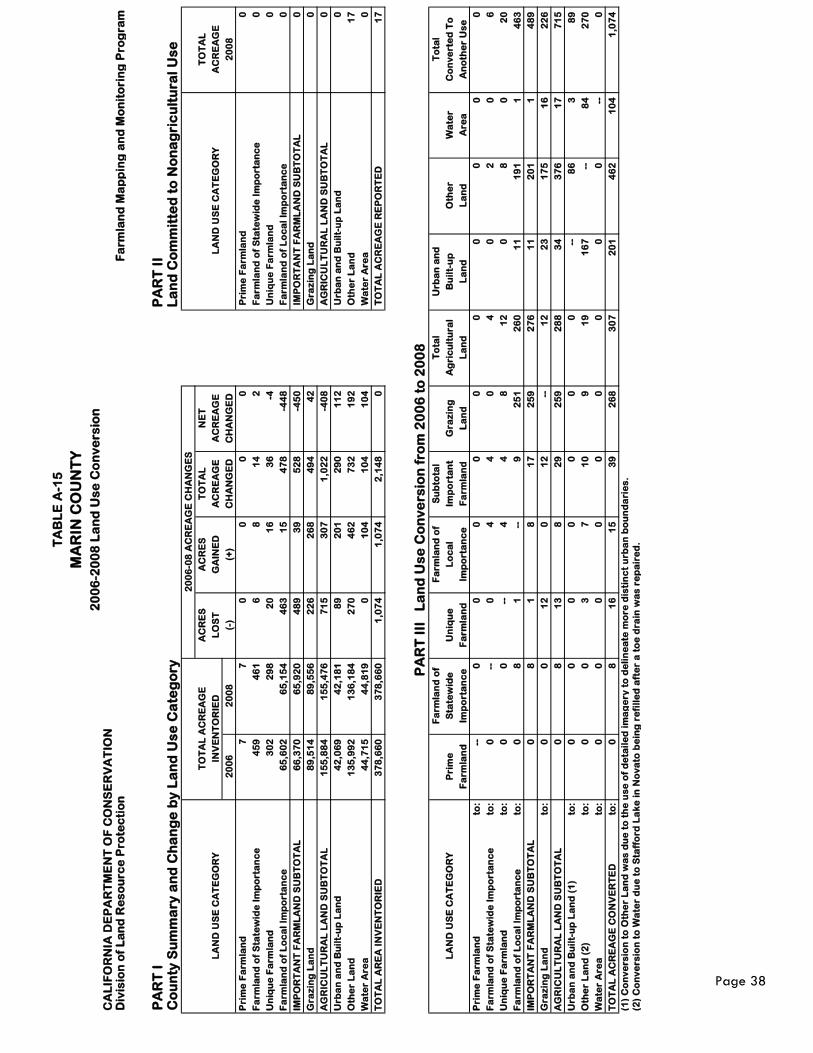
TA
BL
E A
-15
MA
RIN
CO
UN
TY
20
06
-20
08
La
nd
Us
e C
on
ve
rsio
nC
AL
IFO
RN
IA D
EP
AR
TM
EN
T O
F C
ON
SE
RV
AT
ION
Div
isio
n o
f L
an
d R
es
ou
rce
Pro
tec
tio
nF
arm
lan
d M
ap
pin
g a
nd
Mo
nit
ori
ng
Pro
gra
m
PA
RT
I
PA
RT
II
Co
un
ty S
um
ma
ry a
nd
Ch
an
ge
by
La
nd
Us
e C
ate
go
ryL
an
d C
om
mit
ted
to
No
na
gri
cu
ltu
ral
Us
e
20
06
-08
AC
RE
AG
E C
HA
NG
ES
T
OT
AL
AC
RE
AG
EA
CR
ES
AC
RE
ST
OT
AL
NE
T
TO
TA
L
LA
ND
US
E C
AT
EG
OR
YIN
VE
NT
OR
IED
LO
ST
GA
INE
DA
CR
EA
GE
AC
RE
AG
EL
AN
D U
SE
CA
TE
GO
RY
AC
RE
AG
E
20
06
20
08
(-)
(+)
CH
AN
GE
DC
HA
NG
ED
20
08
Pri
me
Fa
rmla
nd
7
7
0
0
0
0
Pri
me
Fa
rmla
nd
0
Fa
rmla
nd
of
Sta
tew
ide
Im
po
rta
nc
e4
59
4
61
6
8
1
4
2
Fa
rmla
nd
of
Sta
tew
ide
Im
po
rta
nc
e0
Un
iqu
e F
arm
lan
d3
02
2
98
2
0
16
3
6
-4
Un
iqu
e F
arm
lan
d0
Fa
rmla
nd
of
Lo
ca
l Im
po
rta
nc
e6
5,6
02
6
5,1
54
4
63
1
5
47
8
-44
8
Fa
rmla
nd
of
Lo
ca
l Im
po
rta
nc
e0
IMP
OR
TA
NT
FA
RM
LA
ND
SU
BT
OT
AL
66
,37
0
65
,92
0
48
9
39
5
28
-4
50
I
MP
OR
TA
NT
FA
RM
LA
ND
SU
BT
OT
AL
0
Gra
zin
g L
an
d
89
,51
4
89
,55
6
22
6
26
8
49
4
42
G
raz
ing
La
nd
0
AG
RIC
UL
TU
RA
L L
AN
D S
UB
TO
TA
L1
55
,88
4
15
5,4
76
7
15
3
07
1
,02
2
-40
8
AG
RIC
UL
TU
RA
L L
AN
D S
UB
TO
TA
L0
Urb
an
an
d B
uil
t-u
p L
an
d4
2,0
69
4
2,1
81
8
9
20
1
29
0
11
2
Urb
an
an
d B
uil
t-u
p L
an
d0
Oth
er
La
nd
13
5,9
92
1
36
,18
4
27
0
46
2
73
2
19
2
Oth
er
La
nd
17
Wa
ter
Are
a4
4,7
15
4
4,8
19
0
1
04
1
04
1
04
W
ate
r A
rea
0
TO
TA
L A
RE
A I
NV
EN
TO
RIE
D
37
8,6
60
3
78
,66
0
1,0
74
1
,07
4
2,1
48
0
T
OT
AL
AC
RE
AG
E R
EP
OR
TE
D1
7
PA
RT
III
L
an
d U
se
Co
nv
ers
ion
fro
m 2
00
6 t
o 2
00
8F
arm
lan
d o
fF
arm
lan
d o
fS
ub
tota
lT
ota
lU
rba
n a
nd
To
tal
LA
ND
US
E C
AT
EG
OR
YP
rim
eS
tate
wid
eU
niq
ue
Lo
ca
lIm
po
rta
nt
Gra
zin
gA
gri
cu
ltu
ral
Bu
ilt-
up
Oth
er
Wa
ter
Co
nv
ert
ed
To
Fa
rmla
nd
Imp
ort
an
ce
Fa
rmla
nd
Imp
ort
an
ce
Fa
rmla
nd
La
nd
La
nd
La
nd
La
nd
Are
aA
no
the
r U
se
Pri
me
Fa
rmla
nd
to:
--
0
0
0
0
0
0
0
0
0
0
Fa
rmla
nd
of
Sta
tew
ide
Im
po
rta
nc
eto
:0
-
- 0
4
4
0
4
0
2
0
6
Un
iqu
e F
arm
lan
dto
:0
0
-
- 4
4
8
1
2
0
8
0
20
Fa
rmla
nd
of
Lo
ca
l Im
po
rta
nc
eto
:0
8
1
-
- 9
2
51
2
60
1
1
19
1
1
46
3
IMP
OR
TA
NT
FA
RM
LA
ND
SU
BT
OT
AL
0
8
1
8
17
2
59
2
76
1
1
20
1
1
48
9
Gra
zin
g L
an
d
to:
0
0
12
0
1
2
--
12
2
3
17
5
16
2
26
AG
RIC
UL
TU
RA
L L
AN
D S
UB
TO
TA
L0
8
1
3
8
29
2
59
2
88
3
4
37
6
17
7
15
Urb
an
an
d B
uil
t-u
p L
an
d (
1)
to:
0
0
0
0
0
0
0
--
86
3
8
9
Oth
er
La
nd
(2
)to
:0
0
3
7
1
0
9
19
1
67
-
- 8
4
27
0
Wa
ter
Are
ato
:0
0
0
0
0
0
0
0
0
-
- 0
TO
TA
L A
CR
EA
GE
CO
NV
ER
TE
D
to:
0
8
16
1
5
39
2
68
3
07
2
01
4
62
1
04
1
,07
4
(1)
Co
nv
ers
ion
to
Oth
er
La
nd
wa
s d
ue
to
th
e u
se
of
de
tail
ed
im
ag
ery
to
de
lin
ea
te m
ore
dis
tin
ct
urb
an
bo
un
da
rie
s.
(2)
Co
nv
ers
ion
to
Wa
ter
du
e t
o S
taff
ord
La
ke
in
No
va
to b
ein
g r
efi
lle
d a
fte
r a
to
e d
rain
wa
s r
ep
air
ed
.
Page 38
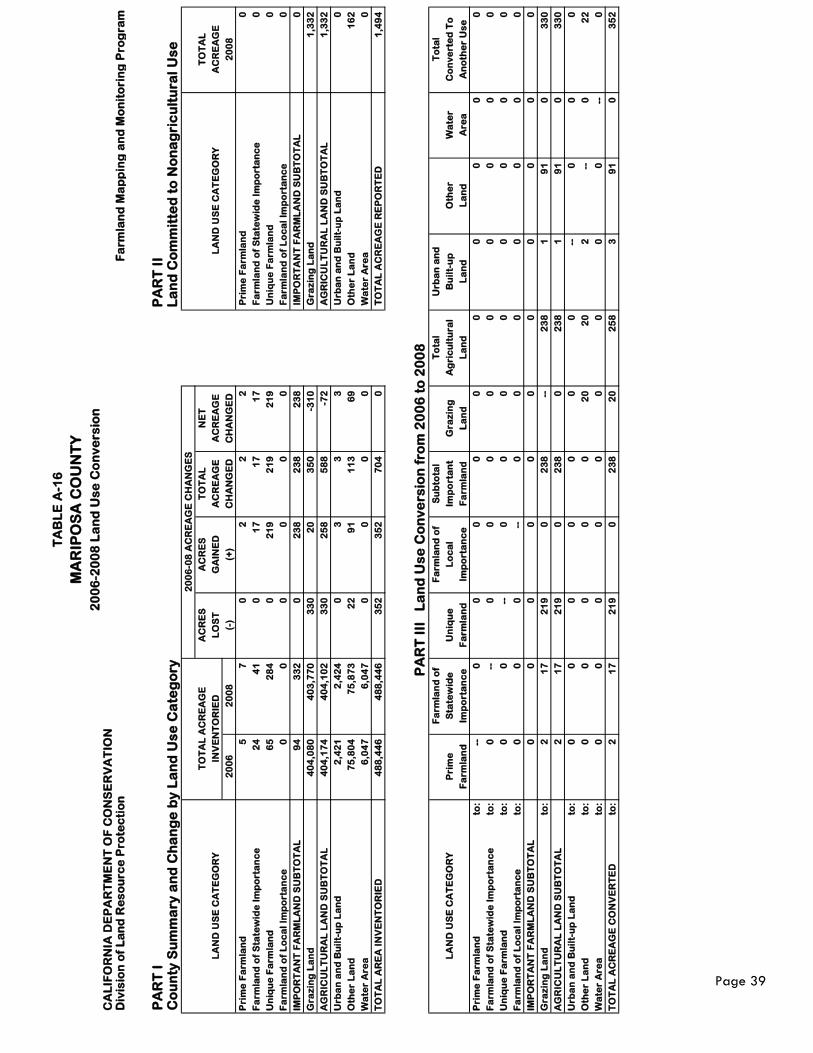
TA
BL
E A
-16
MA
RIP
OS
A C
OU
NT
Y
20
06
-20
08
La
nd
Us
e C
on
ve
rsio
nC
AL
IFO
RN
IA D
EP
AR
TM
EN
T O
F C
ON
SE
RV
AT
ION
Div
isio
n o
f L
an
d R
es
ou
rce
Pro
tec
tio
nF
arm
lan
d M
ap
pin
g a
nd
Mo
nit
ori
ng
Pro
gra
m
PA
RT
I
PA
RT
II
Co
un
ty S
um
ma
ry a
nd
Ch
an
ge
by
La
nd
Us
e C
ate
go
ryL
an
d C
om
mit
ted
to
No
na
gri
cu
ltu
ral
Us
e
20
06
-08
AC
RE
AG
E C
HA
NG
ES
T
OT
AL
AC
RE
AG
EA
CR
ES
AC
RE
ST
OT
AL
NE
T
TO
TA
L
LA
ND
US
E C
AT
EG
OR
YIN
VE
NT
OR
IED
LO
ST
GA
INE
DA
CR
EA
GE
AC
RE
AG
EL
AN
D U
SE
CA
TE
GO
RY
AC
RE
AG
E
20
06
20
08
(-)
(+)
CH
AN
GE
DC
HA
NG
ED
20
08
Pri
me
Fa
rmla
nd
5
7
0
2
2
2
Pri
me
Fa
rmla
nd
0
Fa
rmla
nd
of
Sta
tew
ide
Im
po
rta
nc
e2
4
41
0
1
7
17
1
7
Fa
rmla
nd
of
Sta
tew
ide
Im
po
rta
nc
e0
Un
iqu
e F
arm
lan
d6
5
28
4
0
21
9
21
9
21
9
Un
iqu
e F
arm
lan
d0
Fa
rmla
nd
of
Lo
ca
l Im
po
rta
nc
e0
0
0
0
0
0
F
arm
lan
d o
f L
oc
al
Imp
ort
an
ce
0
IMP
OR
TA
NT
FA
RM
LA
ND
SU
BT
OT
AL
94
3
32
0
2
38
2
38
2
38
I
MP
OR
TA
NT
FA
RM
LA
ND
SU
BT
OT
AL
0
Gra
zin
g L
an
d
40
4,0
80
4
03
,77
0
33
0
20
3
50
-3
10
G
raz
ing
La
nd
1
,33
2
AG
RIC
UL
TU
RA
L L
AN
D S
UB
TO
TA
L4
04
,17
4
40
4,1
02
3
30
2
58
5
88
-7
2
AG
RIC
UL
TU
RA
L L
AN
D S
UB
TO
TA
L1
,33
2
Urb
an
an
d B
uil
t-u
p L
an
d2
,42
1
2,4
24
0
3
3
3
U
rba
n a
nd
Bu
ilt-
up
La
nd
0
Oth
er
La
nd
75
,80
4
75
,87
3
22
9
1
11
3
69
O
the
r L
an
d1
62
Wa
ter
Are
a6
,04
7
6,0
47
0
0
0
0
W
ate
r A
rea
0
TO
TA
L A
RE
A I
NV
EN
TO
RIE
D
48
8,4
46
4
88
,44
6
35
2
35
2
70
4
0
TO
TA
L A
CR
EA
GE
RE
PO
RT
ED
1,4
94
PA
RT
III
L
an
d U
se
Co
nv
ers
ion
fro
m 2
00
6 t
o 2
00
8F
arm
lan
d o
fF
arm
lan
d o
fS
ub
tota
lT
ota
lU
rba
n a
nd
To
tal
LA
ND
US
E C
AT
EG
OR
YP
rim
eS
tate
wid
eU
niq
ue
Lo
ca
lIm
po
rta
nt
Gra
zin
gA
gri
cu
ltu
ral
Bu
ilt-
up
Oth
er
Wa
ter
Co
nv
ert
ed
To
Fa
rmla
nd
Imp
ort
an
ce
Fa
rmla
nd
Imp
ort
an
ce
Fa
rmla
nd
La
nd
La
nd
La
nd
La
nd
Are
aA
no
the
r U
se
Pri
me
Fa
rmla
nd
to:
--
0
0
0
0
0
0
0
0
0
0
Fa
rmla
nd
of
Sta
tew
ide
Im
po
rta
nc
eto
:0
-
- 0
0
0
0
0
0
0
0
0
Un
iqu
e F
arm
lan
dto
:0
0
-
- 0
0
0
0
0
0
0
0
Fa
rmla
nd
of
Lo
ca
l Im
po
rta
nc
eto
:0
0
0
-
- 0
0
0
0
0
0
0
IMP
OR
TA
NT
FA
RM
LA
ND
SU
BT
OT
AL
0
0
0
0
0
0
0
0
0
0
0
Gra
zin
g L
an
d
to:
2
17
2
19
0
2
38
-
- 2
38
1
9
1
0
33
0
AG
RIC
UL
TU
RA
L L
AN
D S
UB
TO
TA
L2
1
7
21
9
0
23
8
0
23
8
1
91
0
3
30
Urb
an
an
d B
uil
t-u
p L
an
dto
:0
0
0
0
0
0
0
-
- 0
0
0
Oth
er
La
nd
to:
0
0
0
0
0
20
2
0
2
--
0
22
Wa
ter
Are
ato
:0
0
0
0
0
0
0
0
0
-
- 0
TO
TA
L A
CR
EA
GE
CO
NV
ER
TE
D
to:
2
17
2
19
0
2
38
2
0
25
8
3
91
0
3
52
Page 39
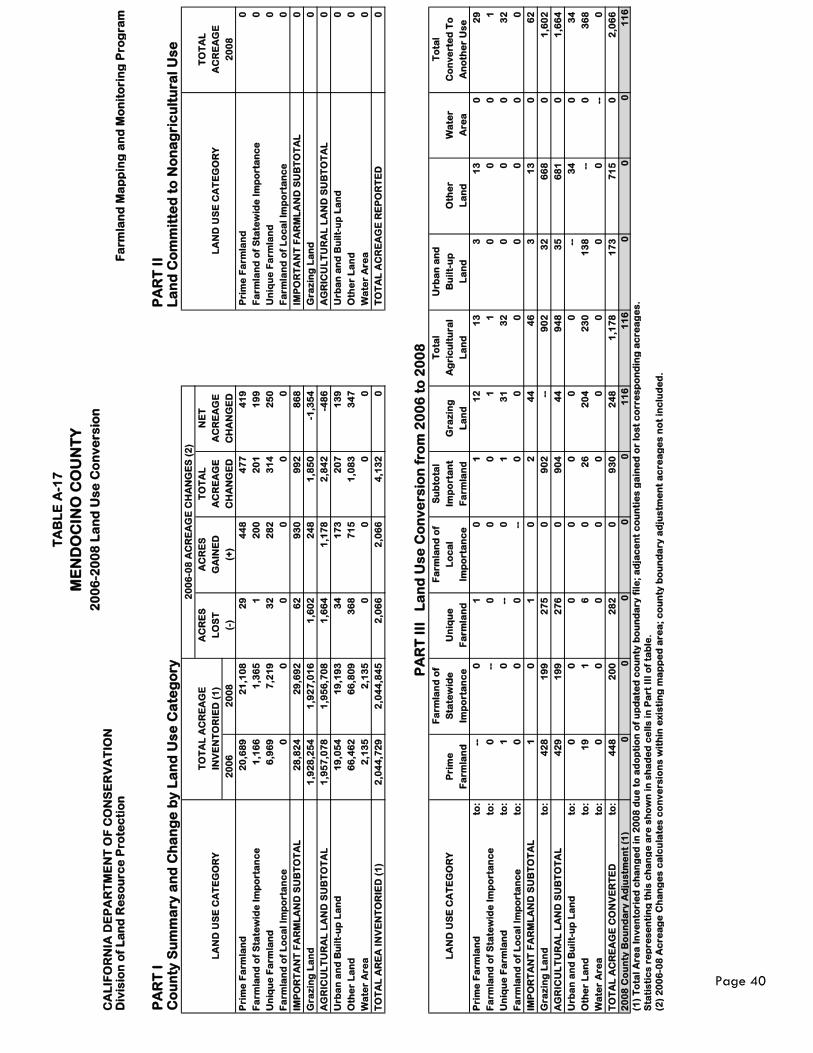
TA
BL
E A
-17
ME
ND
OC
INO
CO
UN
TY
20
06
-20
08
La
nd
Us
e C
on
ve
rsio
nC
AL
IFO
RN
IA D
EP
AR
TM
EN
T O
F C
ON
SE
RV
AT
ION
Div
isio
n o
f L
an
d R
es
ou
rce
Pro
tec
tio
nF
arm
lan
d M
ap
pin
g a
nd
Mo
nit
ori
ng
Pro
gra
m
PA
RT
I
PA
RT
II
Co
un
ty S
um
ma
ry a
nd
Ch
an
ge
by
La
nd
Us
e C
ate
go
ryL
an
d C
om
mit
ted
to
No
na
gri
cu
ltu
ral
Us
e
20
06
-08
AC
RE
AG
E C
HA
NG
ES
(2
)
T
OT
AL
AC
RE
AG
EA
CR
ES
AC
RE
ST
OT
AL
NE
T
TO
TA
L
LA
ND
US
E C
AT
EG
OR
YIN
VE
NT
OR
IED
(1
)L
OS
TG
AIN
ED
AC
RE
AG
EA
CR
EA
GE
LA
ND
US
E C
AT
EG
OR
YA
CR
EA
GE
20
06
20
08
(-)
(+)
CH
AN
GE
DC
HA
NG
ED
20
08
Pri
me
Fa
rmla
nd
20
,68
9
21
,10
8
29
4
48
4
77
4
19
P
rim
e F
arm
lan
d0
Fa
rmla
nd
of
Sta
tew
ide
Im
po
rta
nc
e1
,16
6
1,3
65
1
2
00
2
01
1
99
F
arm
lan
d o
f S
tate
wid
e I
mp
ort
an
ce
0
Un
iqu
e F
arm
lan
d6
,96
9
7,2
19
3
2
28
2
31
4
25
0
Un
iqu
e F
arm
lan
d0
Fa
rmla
nd
of
Lo
ca
l Im
po
rta
nc
e0
0
0
0
0
0
F
arm
lan
d o
f L
oc
al
Imp
ort
an
ce
0
IMP
OR
TA
NT
FA
RM
LA
ND
SU
BT
OT
AL
28
,82
4
29
,69
2
62
9
30
9
92
8
68
I
MP
OR
TA
NT
FA
RM
LA
ND
SU
BT
OT
AL
0
Gra
zin
g L
an
d
1,9
28
,25
4
1,9
27
,01
6
1,6
02
2
48
1
,85
0
-1,3
54
G
raz
ing
La
nd
0
AG
RIC
UL
TU
RA
L L
AN
D S
UB
TO
TA
L1
,95
7,0
78
1
,95
6,7
08
1
,66
4
1,1
78
2
,84
2
-48
6
AG
RIC
UL
TU
RA
L L
AN
D S
UB
TO
TA
L0
Urb
an
an
d B
uil
t-u
p L
an
d1
9,0
54
1
9,1
93
3
4
17
3
20
7
13
9
Urb
an
an
d B
uil
t-u
p L
an
d0
Oth
er
La
nd
66
,46
2
66
,80
9
36
8
71
5
1,0
83
3
47
O
the
r L
an
d0
Wa
ter
Are
a2
,13
5
2,1
35
0
0
0
0
W
ate
r A
rea
0
TO
TA
L A
RE
A I
NV
EN
TO
RIE
D (
1)
2,0
44
,72
9
2,0
44
,84
5
2,0
66
2
,06
6
4,1
32
0
T
OT
AL
AC
RE
AG
E R
EP
OR
TE
D0
PA
RT
III
L
an
d U
se
Co
nv
ers
ion
fro
m 2
00
6 t
o 2
00
8F
arm
lan
d o
fF
arm
lan
d o
fS
ub
tota
lT
ota
lU
rba
n a
nd
To
tal
LA
ND
US
E C
AT
EG
OR
YP
rim
eS
tate
wid
eU
niq
ue
Lo
ca
lIm
po
rta
nt
Gra
zin
gA
gri
cu
ltu
ral
Bu
ilt-
up
Oth
er
Wa
ter
Co
nv
ert
ed
To
Fa
rmla
nd
Imp
ort
an
ce
Fa
rmla
nd
Imp
ort
an
ce
Fa
rmla
nd
La
nd
La
nd
La
nd
La
nd
Are
aA
no
the
r U
se
Pri
me
Fa
rmla
nd
to:
--
0
1
0
1
12
1
3
3
13
0
2
9
Fa
rmla
nd
of
Sta
tew
ide
Im
po
rta
nc
eto
:0
-
- 0
0
0
1
1
0
0
0
1
Un
iqu
e F
arm
lan
dto
:1
0
-
- 0
1
3
1
32
0
0
0
3
2
Fa
rmla
nd
of
Lo
ca
l Im
po
rta
nc
eto
:0
0
0
-
- 0
0
0
0
0
0
0
IMP
OR
TA
NT
FA
RM
LA
ND
SU
BT
OT
AL
1
0
1
0
2
44
4
6
3
13
0
6
2
Gra
zin
g L
an
d
to:
42
8
19
9
27
5
0
90
2
--
90
2
32
6
68
0
1
,60
2
AG
RIC
UL
TU
RA
L L
AN
D S
UB
TO
TA
L4
29
1
99
2
76
0
9
04
4
4
94
8
35
6
81
0
1
,66
4
Urb
an
an
d B
uil
t-u
p L
an
dto
:0
0
0
0
0
0
0
-
- 3
4
0
34
Oth
er
La
nd
to:
19
1
6
0
2
6
20
4
23
0
13
8
--
0
36
8
Wa
ter
Are
ato
:0
0
0
0
0
0
0
0
0
-
- 0
TO
TA
L A
CR
EA
GE
CO
NV
ER
TE
D
to:
44
8
20
0
28
2
0
93
0
24
8
1,1
78
1
73
7
15
0
2
,06
6
20
08
Co
un
ty B
ou
nd
ary
Ad
jus
tme
nt
(1)
00
00
01
16
11
60
00
11
6
(1)
To
tal
Are
a I
nv
en
tori
ed
ch
an
ge
d i
n 2
00
8 d
ue
to
ad
op
tio
n o
f u
pd
ate
d c
ou
nty
bo
un
da
ry f
ile
; a
dja
ce
nt
co
un
tie
s g
ain
ed
or
los
t c
orr
es
po
nd
ing
ac
rea
ge
s.
Sta
tis
tic
s r
ep
res
en
tin
g t
his
ch
an
ge
are
sh
ow
n i
n s
ha
de
d c
ell
s i
n P
art
III
of
tab
le.
(2)
20
06
-08
Ac
rea
ge
Ch
an
ge
s c
alc
ula
tes
co
nv
ers
ion
s w
ith
in e
xis
tin
g m
ap
pe
d a
rea
; c
ou
nty
bo
un
da
ry a
dju
stm
en
t a
cre
ag
es
no
t in
clu
de
d.
Page 40
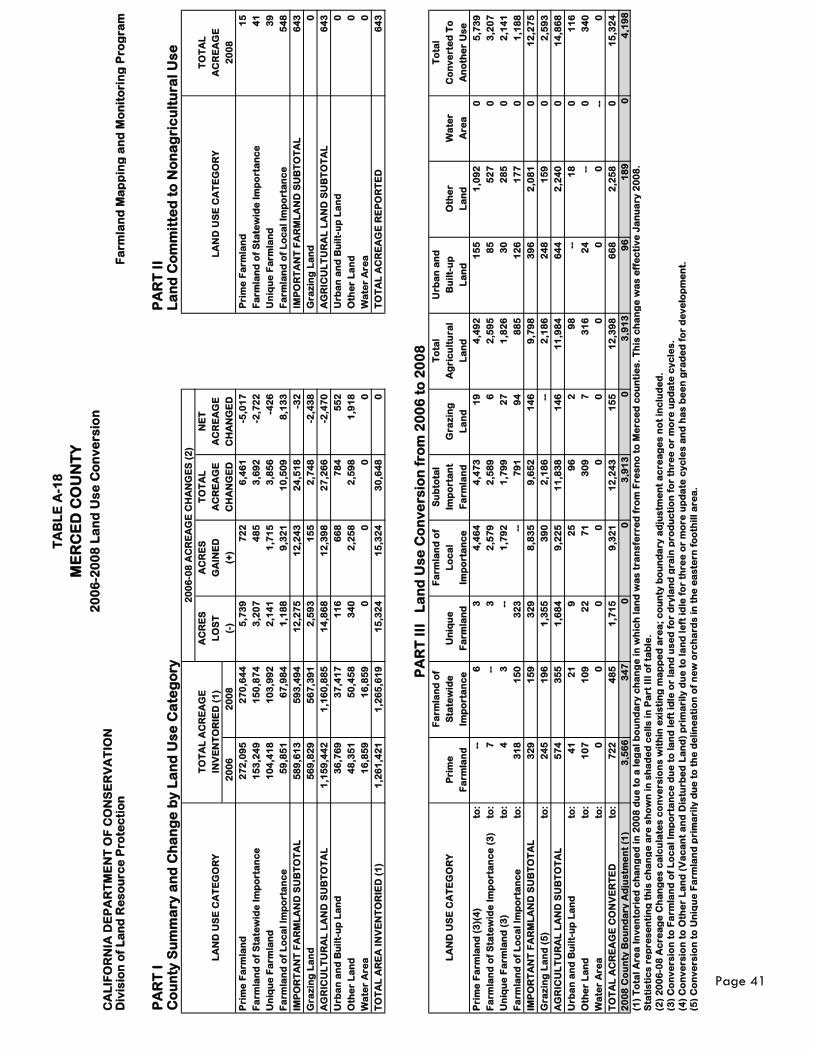
TA
BL
E A
-18
ME
RC
ED
CO
UN
TY
20
06
-20
08
La
nd
Us
e C
on
ve
rsio
nC
AL
IFO
RN
IA D
EP
AR
TM
EN
T O
F C
ON
SE
RV
AT
ION
Div
isio
n o
f L
an
d R
es
ou
rce
Pro
tec
tio
nF
arm
lan
d M
ap
pin
g a
nd
Mo
nit
ori
ng
Pro
gra
m
PA
RT
I
PA
RT
II
Co
un
ty S
um
ma
ry a
nd
Ch
an
ge
by
La
nd
Us
e C
ate
go
ryL
an
d C
om
mit
ted
to
No
na
gri
cu
ltu
ral
Us
e
20
06
-08
AC
RE
AG
E C
HA
NG
ES
(2
)
T
OT
AL
AC
RE
AG
EA
CR
ES
AC
RE
ST
OT
AL
NE
T
TO
TA
L
LA
ND
US
E C
AT
EG
OR
YIN
VE
NT
OR
IED
(1
)L
OS
TG
AIN
ED
AC
RE
AG
EA
CR
EA
GE
LA
ND
US
E C
AT
EG
OR
YA
CR
EA
GE
20
06
20
08
(-)
(+)
CH
AN
GE
DC
HA
NG
ED
20
08
Pri
me
Fa
rmla
nd
27
2,0
95
2
70
,64
4
5,7
39
7
22
6
,46
1
-5,0
17
P
rim
e F
arm
lan
d1
5
Fa
rmla
nd
of
Sta
tew
ide
Im
po
rta
nc
e1
53
,24
9
15
0,8
74
3
,20
7
48
5
3,6
92
-2
,72
2
Fa
rmla
nd
of
Sta
tew
ide
Im
po
rta
nc
e4
1
Un
iqu
e F
arm
lan
d1
04
,41
8
10
3,9
92
2
,14
1
1,7
15
3
,85
6
-42
6
Un
iqu
e F
arm
lan
d3
9
Fa
rmla
nd
of
Lo
ca
l Im
po
rta
nc
e5
9,8
51
6
7,9
84
1
,18
8
9,3
21
1
0,5
09
8
,13
3
Fa
rmla
nd
of
Lo
ca
l Im
po
rta
nc
e5
48
IMP
OR
TA
NT
FA
RM
LA
ND
SU
BT
OT
AL
58
9,6
13
5
93
,49
4
12
,27
5
12
,24
3
24
,51
8
-32
I
MP
OR
TA
NT
FA
RM
LA
ND
SU
BT
OT
AL
64
3
Gra
zin
g L
an
d
56
9,8
29
5
67
,39
1
2,5
93
1
55
2
,74
8
-2,4
38
G
raz
ing
La
nd
0
AG
RIC
UL
TU
RA
L L
AN
D S
UB
TO
TA
L1
,15
9,4
42
1
,16
0,8
85
1
4,8
68
1
2,3
98
2
7,2
66
-2
,47
0
AG
RIC
UL
TU
RA
L L
AN
D S
UB
TO
TA
L6
43
Urb
an
an
d B
uil
t-u
p L
an
d3
6,7
69
3
7,4
17
1
16
6
68
7
84
5
52
U
rba
n a
nd
Bu
ilt-
up
La
nd
0
Oth
er
La
nd
48
,35
1
50
,45
8
34
0
2,2
58
2
,59
8
1,9
18
O
the
r L
an
d0
Wa
ter
Are
a1
6,8
59
1
6,8
59
0
0
0
0
W
ate
r A
rea
0
TO
TA
L A
RE
A I
NV
EN
TO
RIE
D (
1)
1,2
61
,42
1
1,2
65
,61
9
15
,32
4
15
,32
4
30
,64
8
0
TO
TA
L A
CR
EA
GE
RE
PO
RT
ED
64
3
PA
RT
III
L
an
d U
se
Co
nv
ers
ion
fro
m 2
00
6 t
o 2
00
8F
arm
lan
d o
fF
arm
lan
d o
fS
ub
tota
lT
ota
lU
rba
n a
nd
To
tal
LA
ND
US
E C
AT
EG
OR
YP
rim
eS
tate
wid
eU
niq
ue
Lo
ca
lIm
po
rta
nt
Gra
zin
gA
gri
cu
ltu
ral
Bu
ilt-
up
Oth
er
Wa
ter
Co
nv
ert
ed
To
Fa
rmla
nd
Imp
ort
an
ce
Fa
rmla
nd
Imp
ort
an
ce
Fa
rmla
nd
La
nd
La
nd
La
nd
La
nd
Are
aA
no
the
r U
se
Pri
me
Fa
rmla
nd
(3
)(4
)to
: -
- 6
3
4
,46
4
4,4
73
1
9
4,4
92
1
55
1
,09
2
0
5,7
39
Fa
rmla
nd
of
Sta
tew
ide
Im
po
rta
nc
e (
3)
to:
7
--
3
2,5
79
2
,58
9
6
2,5
95
8
5
52
7
0
3,2
07
Un
iqu
e F
arm
lan
d (
3)
to:
4
3
--
1,7
92
1
,79
9
27
1
,82
6
30
2
85
0
2
,14
1
Fa
rmla
nd
of
Lo
ca
l Im
po
rta
nc
eto
:3
18
1
50
3
23
-
- 7
91
9
4
88
5
12
6
17
7
0
1,1
88
IMP
OR
TA
NT
FA
RM
LA
ND
SU
BT
OT
AL
32
9
15
9
32
9
8,8
35
9
,65
2
14
6
9,7
98
3
96
2
,08
1
0
12
,27
5
Gra
zin
g L
an
d (
5)
to:
24
5
19
6
1,3
55
3
90
2
,18
6
--
2,1
86
2
48
1
59
0
2
,59
3
AG
RIC
UL
TU
RA
L L
AN
D S
UB
TO
TA
L5
74
3
55
1
,68
4
9,2
25
1
1,8
38
1
46
1
1,9
84
6
44
2
,24
0
0
14
,86
8
Urb
an
an
d B
uil
t-u
p L
an
dto
:4
1
21
9
2
5
96
2
9
8
--
18
0
1
16
Oth
er
La
nd
to:
10
7
10
9
22
7
1
30
9
7
31
6
24
-
- 0
3
40
Wa
ter
Are
ato
:0
0
0
0
0
0
0
0
0
-
- 0
TO
TA
L A
CR
EA
GE
CO
NV
ER
TE
D
to:
72
2
48
5
1,7
15
9
,32
1
12
,24
3
15
5
12
,39
8
66
8
2,2
58
0
1
5,3
24
20
08
Co
un
ty B
ou
nd
ary
Ad
jus
tme
nt
(1)
3,5
66
34
70
03
,91
30
3,9
13
96
18
90
4,1
98
(1)
To
tal
Are
a I
nv
en
tori
ed
ch
an
ge
d i
n 2
00
8 d
ue
to
a l
eg
al
bo
un
da
ry c
ha
ng
e i
n w
hic
h l
an
d w
as
tra
ns
ferr
ed
fro
m F
res
no
to
Me
rce
d c
ou
nti
es
. T
his
ch
an
ge
wa
s e
ffe
cti
ve
Ja
nu
ary
20
08
.
Sta
tis
tic
s r
ep
res
en
tin
g t
his
ch
an
ge
are
sh
ow
n i
n s
ha
de
d c
ell
s i
n P
art
III
of
tab
le.
(2)
20
06
-08
Ac
rea
ge
Ch
an
ge
s c
alc
ula
tes
co
nv
ers
ion
s w
ith
in e
xis
tin
g m
ap
pe
d a
rea
; c
ou
nty
bo
un
da
ry a
dju
stm
en
t a
cre
ag
es
no
t in
clu
de
d.
(3)
Co
nv
ers
ion
to
Fa
rmla
nd
of
Lo
ca
l Im
po
rta
nc
e d
ue
to
la
nd
le
ft i
dle
or
lan
d u
se
d f
or
dry
lan
d g
rain
pro
du
cti
on
fo
r th
ree
or
mo
re u
pd
ate
cy
cle
s.
(4)
Co
nv
ers
ion
to
Oth
er
La
nd
(V
ac
an
t a
nd
Dis
turb
ed
La
nd
) p
rim
ari
ly d
ue
to
la
nd
le
ft i
dle
fo
r th
ree
or
mo
re u
pd
ate
cy
cle
s a
nd
ha
s b
ee
n g
rad
ed
fo
r d
ev
elo
pm
en
t.
(5)
Co
nv
ers
ion
to
Un
iqu
e F
arm
lan
d p
rim
ari
ly d
ue
to
th
e d
eli
ne
ati
on
of
ne
w o
rch
ard
s i
n t
he
ea
ste
rn f
oo
thil
l a
rea
.
Page 41
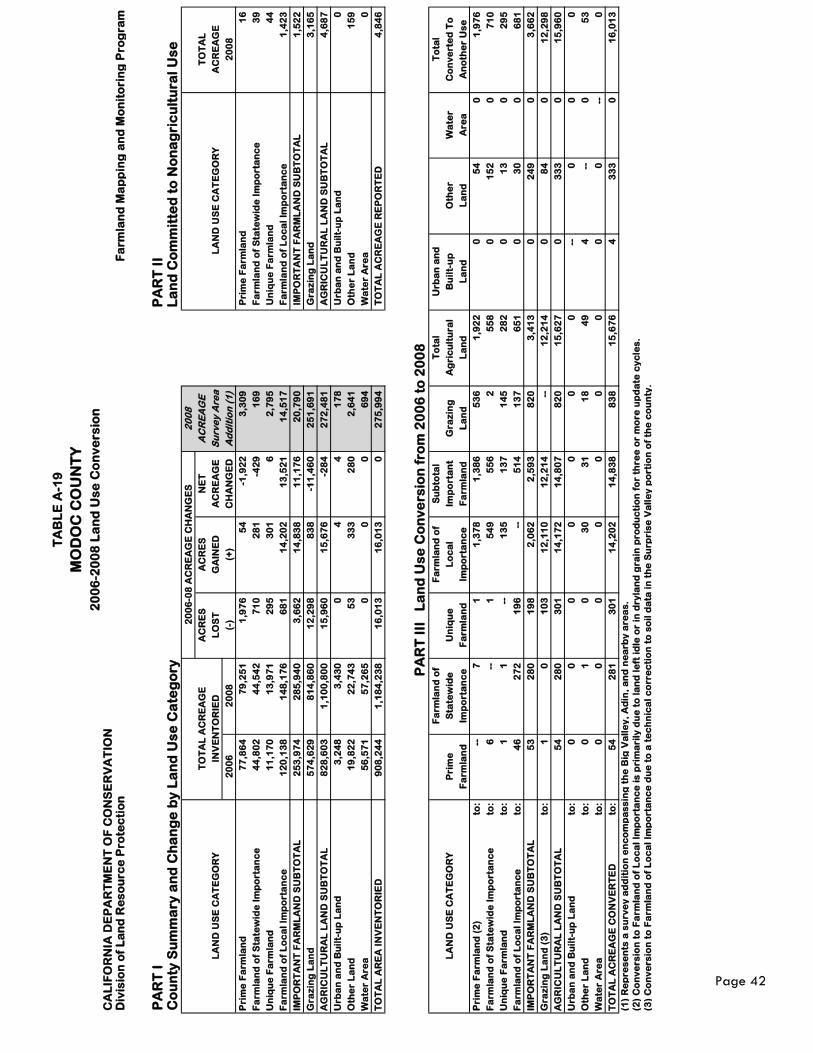
TA
BL
E A
-19
MO
DO
C C
OU
NT
Y
20
06
-20
08
La
nd
Us
e C
on
ve
rsio
nC
AL
IFO
RN
IA D
EP
AR
TM
EN
T O
F C
ON
SE
RV
AT
ION
Div
isio
n o
f L
an
d R
es
ou
rce
Pro
tec
tio
nF
arm
lan
d M
ap
pin
g a
nd
Mo
nit
ori
ng
Pro
gra
m
PA
RT
I
PA
RT
II
Co
un
ty S
um
ma
ry a
nd
Ch
an
ge
by
La
nd
Us
e C
ate
go
ryL
an
d C
om
mit
ted
to
No
na
gri
cu
ltu
ral
Us
e
20
06
-08
AC
RE
AG
E C
HA
NG
ES
20
08
T
OT
AL
AC
RE
AG
EA
CR
ES
AC
RE
SN
ET
AC
RE
AG
E
TO
TA
L
LA
ND
US
E C
AT
EG
OR
YIN
VE
NT
OR
IED
LO
ST
GA
INE
DA
CR
EA
GE
Su
rve
y A
rea
LA
ND
US
E C
AT
EG
OR
YA
CR
EA
GE
20
06
20
08
(-)
(+)
CH
AN
GE
DA
dd
itio
n (
1)
20
08
Pri
me
Fa
rmla
nd
77
,86
4
79
,25
1
1,9
76
5
4
-1,9
22
3
,30
9
Pri
me
Fa
rmla
nd
16
Fa
rmla
nd
of
Sta
tew
ide
Im
po
rta
nc
e4
4,8
02
4
4,5
42
7
10
2
81
-4
29
1
69
F
arm
lan
d o
f S
tate
wid
e I
mp
ort
an
ce
39
Un
iqu
e F
arm
lan
d1
1,1
70
1
3,9
71
2
95
3
01
6
2
,79
5
Un
iqu
e F
arm
lan
d4
4
Fa
rmla
nd
of
Lo
ca
l Im
po
rta
nc
e1
20
,13
8
14
8,1
76
6
81
1
4,2
02
1
3,5
21
1
4,5
17
F
arm
lan
d o
f L
oc
al
Imp
ort
an
ce
1,4
23
IMP
OR
TA
NT
FA
RM
LA
ND
SU
BT
OT
AL
25
3,9
74
2
85
,94
0
3,6
62
1
4,8
38
1
1,1
76
2
0,7
90
I
MP
OR
TA
NT
FA
RM
LA
ND
SU
BT
OT
AL
1,5
22
Gra
zin
g L
an
d
57
4,6
29
8
14
,86
0
12
,29
8
83
8
-11
,46
0
25
1,6
91
G
raz
ing
La
nd
3
,16
5
AG
RIC
UL
TU
RA
L L
AN
D S
UB
TO
TA
L8
28
,60
3
1,1
00
,80
0
15
,96
0
15
,67
6
-28
4
27
2,4
81
A
GR
ICU
LT
UR
AL
LA
ND
SU
BT
OT
AL
4,6
87
Urb
an
an
d B
uil
t-u
p L
an
d3
,24
8
3,4
30
0
4
4
1
78
U
rba
n a
nd
Bu
ilt-
up
La
nd
0
Oth
er
La
nd
19
,82
2
22
,74
3
53
3
33
2
80
2
,64
1
Oth
er
La
nd
15
9
Wa
ter
Are
a5
6,5
71
5
7,2
65
0
0
0
6
94
W
ate
r A
rea
0
TO
TA
L A
RE
A I
NV
EN
TO
RIE
D
90
8,2
44
1
,18
4,2
38
1
6,0
13
1
6,0
13
0
2
75
,99
4
TO
TA
L A
CR
EA
GE
RE
PO
RT
ED
4,8
46
PA
RT
III
L
an
d U
se
Co
nv
ers
ion
fro
m 2
00
6 t
o 2
00
8F
arm
lan
d o
fF
arm
lan
d o
fS
ub
tota
lT
ota
lU
rba
n a
nd
To
tal
LA
ND
US
E C
AT
EG
OR
YP
rim
eS
tate
wid
eU
niq
ue
Lo
ca
lIm
po
rta
nt
Gra
zin
gA
gri
cu
ltu
ral
Bu
ilt-
up
Oth
er
Wa
ter
Co
nv
ert
ed
To
Fa
rmla
nd
Imp
ort
an
ce
Fa
rmla
nd
Imp
ort
an
ce
Fa
rmla
nd
La
nd
La
nd
La
nd
La
nd
Are
aA
no
the
r U
se
Pri
me
Fa
rmla
nd
(2
)to
: -
- 7
1
1
,37
8
1,3
86
5
36
1
,92
2
0
54
0
1
,97
6
Fa
rmla
nd
of
Sta
tew
ide
Im
po
rta
nc
eto
:6
-
- 1
5
49
5
56
2
5
58
0
1
52
0
7
10
Un
iqu
e F
arm
lan
dto
:1
1
-
- 1
35
1
37
1
45
2
82
0
1
3
0
29
5
Fa
rmla
nd
of
Lo
ca
l Im
po
rta
nc
eto
:4
6
27
2
19
6
--
51
4
13
7
65
1
0
30
0
6
81
IMP
OR
TA
NT
FA
RM
LA
ND
SU
BT
OT
AL
53
2
80
1
98
2
,06
2
2,5
93
8
20
3
,41
3
0
24
9
0
3,6
62
Gra
zin
g L
an
d (
3)
to:
1
0
10
3
12
,11
0
12
,21
4
--
12
,21
4
0
84
0
1
2,2
98
AG
RIC
UL
TU
RA
L L
AN
D S
UB
TO
TA
L5
4
28
0
30
1
14
,17
2
14
,80
7
82
0
15
,62
7
0
33
3
0
15
,96
0
Urb
an
an
d B
uil
t-u
p L
an
dto
:0
0
0
0
0
0
0
-
- 0
0
0
Oth
er
La
nd
to:
0
1
0
30
3
1
18
4
9
4
--
0
53
Wa
ter
Are
ato
:0
0
0
0
0
0
0
0
0
-
- 0
TO
TA
L A
CR
EA
GE
CO
NV
ER
TE
D
to:
54
2
81
3
01
1
4,2
02
1
4,8
38
8
38
1
5,6
76
4
3
33
0
1
6,0
13
(1)
Re
pre
se
nts
a s
urv
ey
ad
dit
ion
en
co
mp
as
sin
g t
he
Big
Va
lle
y,
Ad
in,
an
d n
ea
rby
are
as
.
(2)
Co
nv
ers
ion
to
Fa
rmla
nd
of
Lo
ca
l Im
po
rta
nc
e i
s p
rim
ari
ly d
ue
to
la
nd
le
ft i
dle
or
in d
ryla
nd
gra
in p
rod
uc
tio
n f
or
thre
e o
r m
ore
up
da
te c
yc
les
.
(3)
Co
nv
ers
ion
to
Fa
rmla
nd
of
Lo
ca
l Im
po
rta
nc
e d
ue
to
a t
ec
hn
ica
l c
orr
ec
tio
n t
o s
oil
da
ta i
n t
he
Su
rpri
se
Va
lle
y p
ort
ion
of
the
co
un
ty.
Page 42

TA
BL
E A
-20
MO
NT
ER
EY
CO
UN
TY
20
06
-20
08
La
nd
Us
e C
on
ve
rsio
nC
AL
IFO
RN
IA D
EP
AR
TM
EN
T O
F C
ON
SE
RV
AT
ION
Div
isio
n o
f L
an
d R
es
ou
rce
Pro
tec
tio
nF
arm
lan
d M
ap
pin
g a
nd
Mo
nit
ori
ng
Pro
gra
m
PA
RT
I
PA
RT
II
Co
un
ty S
um
ma
ry a
nd
Ch
an
ge
by
La
nd
Us
e C
ate
go
ryL
an
d C
om
mit
ted
to
No
na
gri
cu
ltu
ral
Us
e
20
06
-08
AC
RE
AG
E C
HA
NG
ES
T
OT
AL
AC
RE
AG
EA
CR
ES
AC
RE
ST
OT
AL
NE
T
TO
TA
L
LA
ND
US
E C
AT
EG
OR
YIN
VE
NT
OR
IED
LO
ST
GA
INE
DA
CR
EA
GE
AC
RE
AG
EL
AN
D U
SE
CA
TE
GO
RY
AC
RE
AG
E
20
06
20
08
(-)
(+)
CH
AN
GE
DC
HA
NG
ED
20
08
Pri
me
Fa
rmla
nd
16
7,6
38
1
66
,81
3
1,3
55
5
30
1
,88
5
-82
5
Pri
me
Fa
rmla
nd
45
3
Fa
rmla
nd
of
Sta
tew
ide
Im
po
rta
nc
e4
3,4
01
4
3,0
89
5
87
2
75
8
62
-3
12
F
arm
lan
d o
f S
tate
wid
e I
mp
ort
an
ce
0
Un
iqu
e F
arm
lan
d2
5,1
04
2
4,7
67
5
72
2
35
8
07
-3
37
U
niq
ue
Fa
rmla
nd
32
Fa
rmla
nd
of
Lo
ca
l Im
po
rta
nc
e0
0
0
0
0
0
F
arm
lan
d o
f L
oc
al
Imp
ort
an
ce
0
IMP
OR
TA
NT
FA
RM
LA
ND
SU
BT
OT
AL
23
6,1
43
2
34
,66
9
2,5
14
1
,04
0
3,5
54
-1
,47
4
IM
PO
RT
AN
T F
AR
ML
AN
D S
UB
TO
TA
L4
85
Gra
zin
g L
an
d
1,0
65
,57
5
1,0
66
,49
4
78
4
1,7
03
2
,48
7
91
9
Gra
zin
g L
an
d
7
AG
RIC
UL
TU
RA
L L
AN
D S
UB
TO
TA
L1
,30
1,7
18
1
,30
1,1
63
3
,29
8
2,7
43
6
,04
1
-55
5
AG
RIC
UL
TU
RA
L L
AN
D S
UB
TO
TA
L4
92
Urb
an
an
d B
uil
t-u
p L
an
d5
5,9
50
5
6,5
34
2
0
60
4
62
4
58
4
Urb
an
an
d B
uil
t-u
p L
an
d0
Oth
er
La
nd
75
7,2
09
7
57
,18
0
64
7
61
8
1,2
65
-2
9
Oth
er
La
nd
37
7
Wa
ter
Are
a6
,24
6
6,2
46
0
0
0
0
W
ate
r A
rea
0
TO
TA
L A
RE
A I
NV
EN
TO
RIE
D
2,1
21
,12
3
2,1
21
,12
3
3,9
65
3
,96
5
7,9
30
0
T
OT
AL
AC
RE
AG
E R
EP
OR
TE
D8
69
PA
RT
III
L
an
d U
se
Co
nv
ers
ion
fro
m 2
00
6 t
o 2
00
8F
arm
lan
d o
fF
arm
lan
d o
fS
ub
tota
lT
ota
lU
rba
n a
nd
To
tal
LA
ND
US
E C
AT
EG
OR
YP
rim
eS
tate
wid
eU
niq
ue
Lo
ca
lIm
po
rta
nt
Gra
zin
gA
gri
cu
ltu
ral
Bu
ilt-
up
Oth
er
Wa
ter
Co
nv
ert
ed
To
Fa
rmla
nd
Imp
ort
an
ce
Fa
rmla
nd
Imp
ort
an
ce
Fa
rmla
nd
La
nd
La
nd
La
nd
La
nd
Are
aA
no
the
r U
se
Pri
me
Fa
rmla
nd
to:
--
1
18
0
1
9
90
3
92
2
20
3
23
0
0
1,3
55
Fa
rmla
nd
of
Sta
tew
ide
Im
po
rta
nc
eto
:3
-
- 3
8
0
41
4
59
5
00
2
0
67
0
5
87
Un
iqu
e F
arm
lan
d (
1)
to:
20
8
5
--
0
10
5
24
0
34
5
14
2
13
0
5
72
Fa
rmla
nd
of
Lo
ca
l Im
po
rta
nc
eto
:0
0
0
-
- 0
0
0
0
0
0
0
IMP
OR
TA
NT
FA
RM
LA
ND
SU
BT
OT
AL
23
8
6
56
0
1
65
1
,60
2
1,7
67
2
37
5
10
0
2
,51
4
Gra
zin
g L
an
d
to:
37
6
17
1
12
7
0
67
4
--
67
4
10
1
00
0
7
84
AG
RIC
UL
TU
RA
L L
AN
D S
UB
TO
TA
L3
99
2
57
1
83
0
8
39
1
,60
2
2,4
41
2
47
6
10
0
3
,29
8
Urb
an
an
d B
uil
t-u
p L
an
dto
:9
2
1
0
1
2
0
12
-
- 8
0
2
0
Oth
er
La
nd
to:
12
2
16
5
1
0
18
9
10
1
29
0
35
7
--
0
64
7
Wa
ter
Are
ato
:0
0
0
0
0
0
0
0
0
-
- 0
TO
TA
L A
CR
EA
GE
CO
NV
ER
TE
D
to:
53
0
27
5
23
5
0
1,0
40
1
,70
3
2,7
43
6
04
6
18
0
3
,96
5
(1)
Co
nv
ers
ion
to
Fa
rmla
nd
of
Sta
tew
ide
Im
po
rta
nc
e i
s d
ue
to
th
e d
eli
ne
ati
on
of
irri
ga
ted
ag
ric
ult
ure
th
at
ha
d p
rev
iou
sly
be
en
ma
pp
ed
as
po
tte
d p
lan
t n
urs
eri
es
.
Page 43
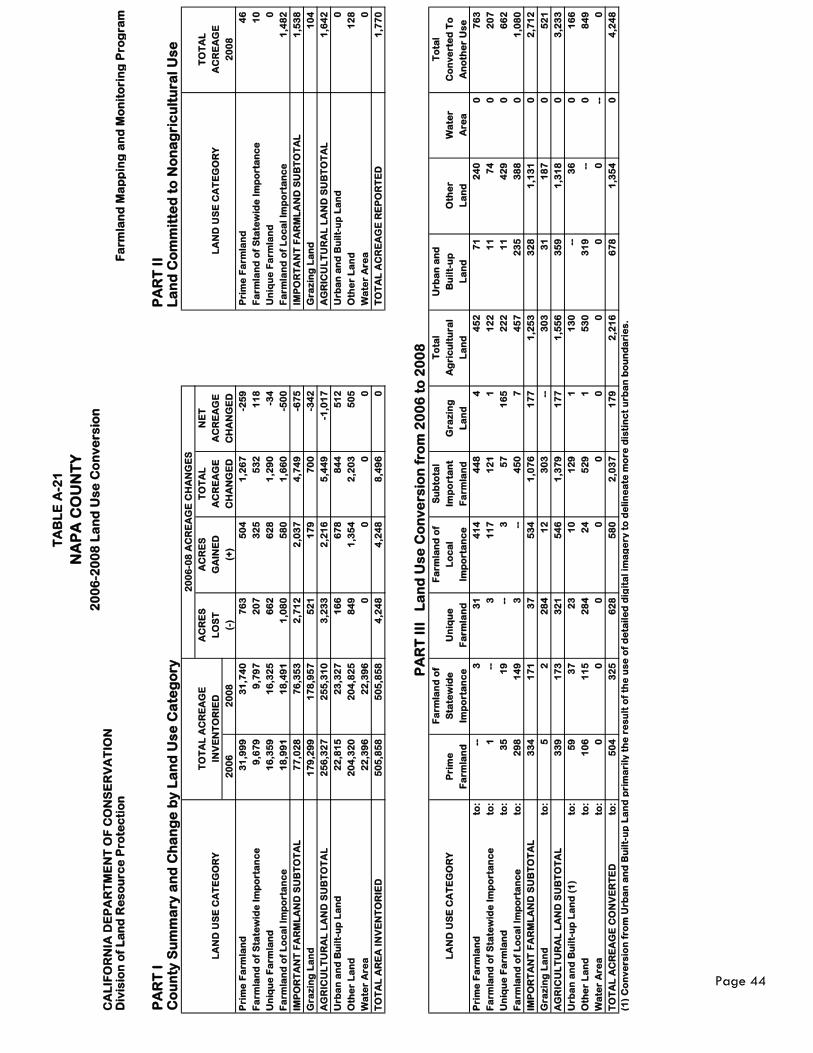
TA
BL
E A
-21
NA
PA
CO
UN
TY
20
06
-20
08
La
nd
Us
e C
on
ve
rsio
nC
AL
IFO
RN
IA D
EP
AR
TM
EN
T O
F C
ON
SE
RV
AT
ION
Div
isio
n o
f L
an
d R
es
ou
rce
Pro
tec
tio
nF
arm
lan
d M
ap
pin
g a
nd
Mo
nit
ori
ng
Pro
gra
m
PA
RT
I
PA
RT
II
Co
un
ty S
um
ma
ry a
nd
Ch
an
ge
by
La
nd
Us
e C
ate
go
ryL
an
d C
om
mit
ted
to
No
na
gri
cu
ltu
ral
Us
e
20
06
-08
AC
RE
AG
E C
HA
NG
ES
T
OT
AL
AC
RE
AG
EA
CR
ES
AC
RE
ST
OT
AL
NE
T
TO
TA
L
LA
ND
US
E C
AT
EG
OR
YIN
VE
NT
OR
IED
LO
ST
GA
INE
DA
CR
EA
GE
AC
RE
AG
EL
AN
D U
SE
CA
TE
GO
RY
AC
RE
AG
E
20
06
20
08
(-)
(+)
CH
AN
GE
DC
HA
NG
ED
20
08
Pri
me
Fa
rmla
nd
31
,99
9
31
,74
0
76
3
50
4
1,2
67
-2
59
P
rim
e F
arm
lan
d4
6
Fa
rmla
nd
of
Sta
tew
ide
Im
po
rta
nc
e9
,67
9
9,7
97
2
07
3
25
5
32
1
18
F
arm
lan
d o
f S
tate
wid
e I
mp
ort
an
ce
10
Un
iqu
e F
arm
lan
d1
6,3
59
1
6,3
25
6
62
6
28
1
,29
0
-34
U
niq
ue
Fa
rmla
nd
0
Fa
rmla
nd
of
Lo
ca
l Im
po
rta
nc
e1
8,9
91
1
8,4
91
1
,08
0
58
0
1,6
60
-5
00
F
arm
lan
d o
f L
oc
al
Imp
ort
an
ce
1,4
82
IMP
OR
TA
NT
FA
RM
LA
ND
SU
BT
OT
AL
77
,02
8
76
,35
3
2,7
12
2
,03
7
4,7
49
-6
75
I
MP
OR
TA
NT
FA
RM
LA
ND
SU
BT
OT
AL
1,5
38
Gra
zin
g L
an
d
17
9,2
99
1
78
,95
7
52
1
17
9
70
0
-34
2
Gra
zin
g L
an
d
10
4
AG
RIC
UL
TU
RA
L L
AN
D S
UB
TO
TA
L2
56
,32
7
25
5,3
10
3
,23
3
2,2
16
5
,44
9
-1,0
17
A
GR
ICU
LT
UR
AL
LA
ND
SU
BT
OT
AL
1,6
42
Urb
an
an
d B
uil
t-u
p L
an
d2
2,8
15
2
3,3
27
1
66
6
78
8
44
5
12
U
rba
n a
nd
Bu
ilt-
up
La
nd
0
Oth
er
La
nd
20
4,3
20
2
04
,82
5
84
9
1,3
54
2
,20
3
50
5
Oth
er
La
nd
12
8
Wa
ter
Are
a2
2,3
96
2
2,3
96
0
0
0
0
W
ate
r A
rea
0
TO
TA
L A
RE
A I
NV
EN
TO
RIE
D
50
5,8
58
5
05
,85
8
4,2
48
4
,24
8
8,4
96
0
T
OT
AL
AC
RE
AG
E R
EP
OR
TE
D1
,77
0
PA
RT
III
L
an
d U
se
Co
nv
ers
ion
fro
m 2
00
6 t
o 2
00
8F
arm
lan
d o
fF
arm
lan
d o
fS
ub
tota
lT
ota
lU
rba
n a
nd
To
tal
LA
ND
US
E C
AT
EG
OR
YP
rim
eS
tate
wid
eU
niq
ue
Lo
ca
lIm
po
rta
nt
Gra
zin
gA
gri
cu
ltu
ral
Bu
ilt-
up
Oth
er
Wa
ter
Co
nv
ert
ed
To
Fa
rmla
nd
Imp
ort
an
ce
Fa
rmla
nd
Imp
ort
an
ce
Fa
rmla
nd
La
nd
La
nd
La
nd
La
nd
Are
aA
no
the
r U
se
Pri
me
Fa
rmla
nd
to:
--
3
31
4
14
4
48
4
4
52
7
1
24
0
0
76
3
Fa
rmla
nd
of
Sta
tew
ide
Im
po
rta
nc
eto
:1
-
- 3
1
17
1
21
1
1
22
1
1
74
0
2
07
Un
iqu
e F
arm
lan
dto
:3
5
19
-
- 3
5
7
16
5
22
2
11
4
29
0
6
62
Fa
rmla
nd
of
Lo
ca
l Im
po
rta
nc
eto
:2
98
1
49
3
-
- 4
50
7
4
57
2
35
3
88
0
1
,08
0
IMP
OR
TA
NT
FA
RM
LA
ND
SU
BT
OT
AL
33
4
17
1
37
5
34
1
,07
6
17
7
1,2
53
3
28
1
,13
1
0
2,7
12
Gra
zin
g L
an
d
to:
5
2
28
4
12
3
03
-
- 3
03
3
1
18
7
0
52
1
AG
RIC
UL
TU
RA
L L
AN
D S
UB
TO
TA
L3
39
1
73
3
21
5
46
1
,37
9
17
7
1,5
56
3
59
1
,31
8
0
3,2
33
Urb
an
an
d B
uil
t-u
p L
an
d (
1)
to:
59
3
7
23
1
0
12
9
1
13
0
--
36
0
1
66
Oth
er
La
nd
to:
10
6
11
5
28
4
24
5
29
1
5
30
3
19
-
- 0
8
49
Wa
ter
Are
ato
:0
0
0
0
0
0
0
0
0
-
- 0
TO
TA
L A
CR
EA
GE
CO
NV
ER
TE
D
to:
50
4
32
5
62
8
58
0
2,0
37
1
79
2
,21
6
67
8
1,3
54
0
4
,24
8
(1)
Co
nv
ers
ion
fro
m U
rba
n a
nd
Bu
ilt-
up
La
nd
pri
ma
rily
th
e r
es
ult
of
the
us
e o
f d
eta
ile
d d
igit
al
ima
ge
ry t
o d
eli
ne
ate
mo
re d
isti
nc
t u
rba
n b
ou
nd
ari
es
.
Page 44
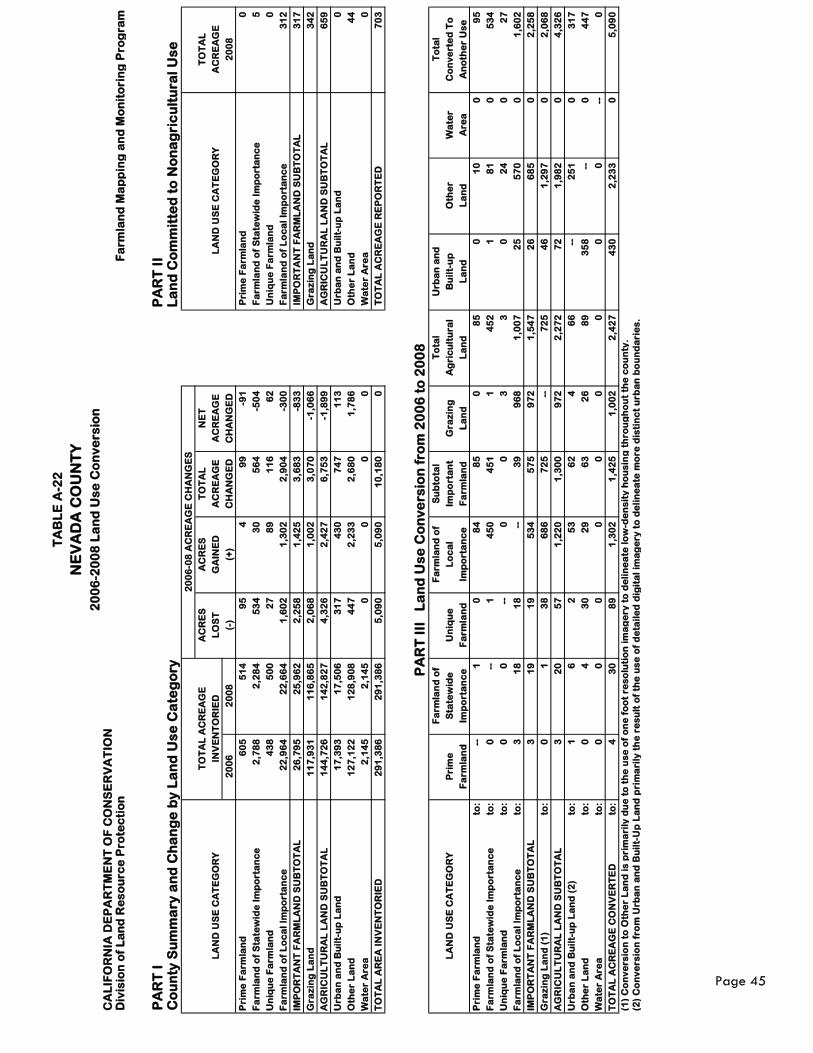
TA
BL
E A
-22
NE
VA
DA
CO
UN
TY
20
06
-20
08
La
nd
Us
e C
on
ve
rsio
nC
AL
IFO
RN
IA D
EP
AR
TM
EN
T O
F C
ON
SE
RV
AT
ION
Div
isio
n o
f L
an
d R
es
ou
rce
Pro
tec
tio
nF
arm
lan
d M
ap
pin
g a
nd
Mo
nit
ori
ng
Pro
gra
m
PA
RT
I
PA
RT
II
Co
un
ty S
um
ma
ry a
nd
Ch
an
ge
by
La
nd
Us
e C
ate
go
ryL
an
d C
om
mit
ted
to
No
na
gri
cu
ltu
ral
Us
e
20
06
-08
AC
RE
AG
E C
HA
NG
ES
T
OT
AL
AC
RE
AG
EA
CR
ES
AC
RE
ST
OT
AL
NE
T
TO
TA
L
LA
ND
US
E C
AT
EG
OR
YIN
VE
NT
OR
IED
LO
ST
GA
INE
DA
CR
EA
GE
AC
RE
AG
EL
AN
D U
SE
CA
TE
GO
RY
AC
RE
AG
E
20
06
20
08
(-)
(+)
CH
AN
GE
DC
HA
NG
ED
20
08
Pri
me
Fa
rmla
nd
60
5
51
4
95
4
9
9
-91
P
rim
e F
arm
lan
d0
Fa
rmla
nd
of
Sta
tew
ide
Im
po
rta
nc
e2
,78
8
2,2
84
5
34
3
0
56
4
-50
4
Fa
rmla
nd
of
Sta
tew
ide
Im
po
rta
nc
e5
Un
iqu
e F
arm
lan
d4
38
5
00
2
7
89
1
16
6
2
Un
iqu
e F
arm
lan
d0
Fa
rmla
nd
of
Lo
ca
l Im
po
rta
nc
e2
2,9
64
2
2,6
64
1
,60
2
1,3
02
2
,90
4
-30
0
Fa
rmla
nd
of
Lo
ca
l Im
po
rta
nc
e3
12
IMP
OR
TA
NT
FA
RM
LA
ND
SU
BT
OT
AL
26
,79
5
25
,96
2
2,2
58
1
,42
5
3,6
83
-8
33
I
MP
OR
TA
NT
FA
RM
LA
ND
SU
BT
OT
AL
31
7
Gra
zin
g L
an
d
11
7,9
31
1
16
,86
5
2,0
68
1
,00
2
3,0
70
-1
,06
6
Gra
zin
g L
an
d
34
2
AG
RIC
UL
TU
RA
L L
AN
D S
UB
TO
TA
L1
44
,72
6
14
2,8
27
4
,32
6
2,4
27
6
,75
3
-1,8
99
A
GR
ICU
LT
UR
AL
LA
ND
SU
BT
OT
AL
65
9
Urb
an
an
d B
uil
t-u
p L
an
d1
7,3
93
1
7,5
06
3
17
4
30
7
47
1
13
U
rba
n a
nd
Bu
ilt-
up
La
nd
0
Oth
er
La
nd
12
7,1
22
1
28
,90
8
44
7
2,2
33
2
,68
0
1,7
86
O
the
r L
an
d4
4
Wa
ter
Are
a2
,14
5
2,1
45
0
0
0
0
W
ate
r A
rea
0
TO
TA
L A
RE
A I
NV
EN
TO
RIE
D
29
1,3
86
2
91
,38
6
5,0
90
5
,09
0
10
,18
0
0
TO
TA
L A
CR
EA
GE
RE
PO
RT
ED
70
3
PA
RT
III
L
an
d U
se
Co
nv
ers
ion
fro
m 2
00
6 t
o 2
00
8F
arm
lan
d o
fF
arm
lan
d o
fS
ub
tota
lT
ota
lU
rba
n a
nd
To
tal
LA
ND
US
E C
AT
EG
OR
YP
rim
eS
tate
wid
eU
niq
ue
Lo
ca
lIm
po
rta
nt
Gra
zin
gA
gri
cu
ltu
ral
Bu
ilt-
up
Oth
er
Wa
ter
Co
nv
ert
ed
To
Fa
rmla
nd
Imp
ort
an
ce
Fa
rmla
nd
Imp
ort
an
ce
Fa
rmla
nd
La
nd
La
nd
La
nd
La
nd
Are
aA
no
the
r U
se
Pri
me
Fa
rmla
nd
to:
--
1
0
84
8
5
0
85
0
1
0
0
95
Fa
rmla
nd
of
Sta
tew
ide
Im
po
rta
nc
eto
:0
-
- 1
4
50
4
51
1
4
52
1
8
1
0
53
4
Un
iqu
e F
arm
lan
dto
:0
0
-
- 0
0
3
3
0
2
4
0
27
Fa
rmla
nd
of
Lo
ca
l Im
po
rta
nc
eto
:3
1
8
18
-
- 3
9
96
8
1,0
07
2
5
57
0
0
1,6
02
IMP
OR
TA
NT
FA
RM
LA
ND
SU
BT
OT
AL
3
19
1
9
53
4
57
5
97
2
1,5
47
2
6
68
5
0
2,2
58
Gra
zin
g L
an
d (
1)
to:
0
1
38
6
86
7
25
-
- 7
25
4
6
1,2
97
0
2
,06
8
AG
RIC
UL
TU
RA
L L
AN
D S
UB
TO
TA
L3
2
0
57
1
,22
0
1,3
00
9
72
2
,27
2
72
1
,98
2
0
4,3
26
Urb
an
an
d B
uil
t-u
p L
an
d (
2)
to:
1
6
2
53
6
2
4
66
-
- 2
51
0
3
17
Oth
er
La
nd
to:
0
4
30
2
9
63
2
6
89
3
58
-
- 0
4
47
Wa
ter
Are
ato
:0
0
0
0
0
0
0
0
0
-
- 0
TO
TA
L A
CR
EA
GE
CO
NV
ER
TE
D
to:
4
30
8
9
1,3
02
1
,42
5
1,0
02
2
,42
7
43
0
2,2
33
0
5
,09
0
(1)
Co
nv
ers
ion
to
Oth
er
La
nd
is
pri
ma
rily
du
e t
o t
he
us
e o
f o
ne
fo
ot
res
olu
tio
n i
ma
ge
ry t
o d
eli
ne
ate
lo
w-d
en
sit
y h
ou
sin
g t
hro
ug
ho
ut
the
co
un
ty.
(2)
Co
nv
ers
ion
fro
m U
rba
n a
nd
Bu
ilt-
Up
La
nd
pri
ma
rily
th
e r
es
ult
of
the
us
e o
f d
eta
ile
d d
igit
al
ima
ge
ry t
o d
eli
ne
ate
mo
re d
isti
nc
t u
rba
n b
ou
nd
ari
es
.
Page 45
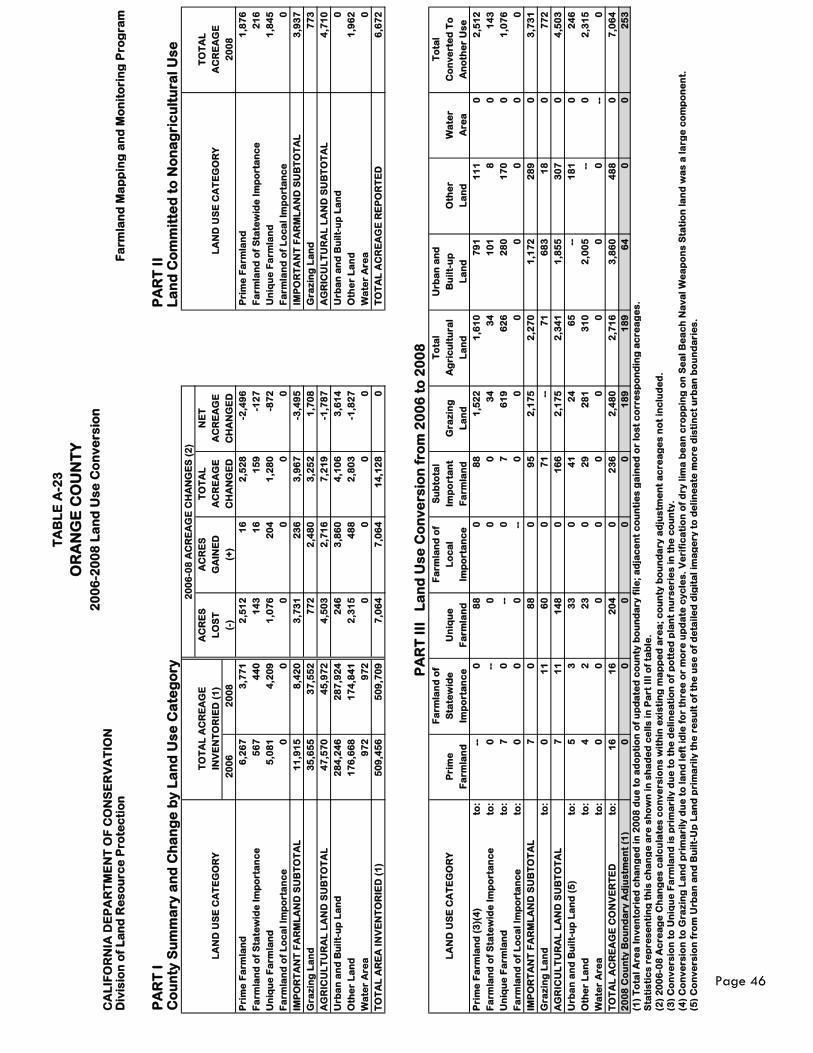
TA
BL
E A
-23
OR
AN
GE
CO
UN
TY
20
06
-20
08
La
nd
Us
e C
on
ve
rsio
nC
AL
IFO
RN
IA D
EP
AR
TM
EN
T O
F C
ON
SE
RV
AT
ION
Div
isio
n o
f L
an
d R
es
ou
rce
Pro
tec
tio
nF
arm
lan
d M
ap
pin
g a
nd
Mo
nit
ori
ng
Pro
gra
m
PA
RT
I
PA
RT
II
Co
un
ty S
um
ma
ry a
nd
Ch
an
ge
by
La
nd
Us
e C
ate
go
ryL
an
d C
om
mit
ted
to
No
na
gri
cu
ltu
ral
Us
e
20
06
-08
AC
RE
AG
E C
HA
NG
ES
(2
)
T
OT
AL
AC
RE
AG
EA
CR
ES
AC
RE
ST
OT
AL
NE
T
TO
TA
L
LA
ND
US
E C
AT
EG
OR
YIN
VE
NT
OR
IED
(1
)L
OS
TG
AIN
ED
AC
RE
AG
EA
CR
EA
GE
LA
ND
US
E C
AT
EG
OR
YA
CR
EA
GE
20
06
20
08
(-)
(+)
CH
AN
GE
DC
HA
NG
ED
20
08
Pri
me
Fa
rmla
nd
6,2
67
3
,77
1
2,5
12
1
6
2,5
28
-2
,49
6
Pri
me
Fa
rmla
nd
1,8
76
Fa
rmla
nd
of
Sta
tew
ide
Im
po
rta
nc
e5
67
4
40
1
43
1
6
15
9
-12
7
Fa
rmla
nd
of
Sta
tew
ide
Im
po
rta
nc
e2
16
Un
iqu
e F
arm
lan
d5
,08
1
4,2
09
1
,07
6
20
4
1,2
80
-8
72
U
niq
ue
Fa
rmla
nd
1,8
45
Fa
rmla
nd
of
Lo
ca
l Im
po
rta
nc
e0
0
0
0
0
0
F
arm
lan
d o
f L
oc
al
Imp
ort
an
ce
0
IMP
OR
TA
NT
FA
RM
LA
ND
SU
BT
OT
AL
11
,91
5
8,4
20
3
,73
1
23
6
3,9
67
-3
,49
5
IM
PO
RT
AN
T F
AR
ML
AN
D S
UB
TO
TA
L3
,93
7
Gra
zin
g L
an
d
35
,65
5
37
,55
2
77
2
2,4
80
3
,25
2
1,7
08
G
raz
ing
La
nd
7
73
AG
RIC
UL
TU
RA
L L
AN
D S
UB
TO
TA
L4
7,5
70
4
5,9
72
4
,50
3
2,7
16
7
,21
9
-1,7
87
A
GR
ICU
LT
UR
AL
LA
ND
SU
BT
OT
AL
4,7
10
Urb
an
an
d B
uil
t-u
p L
an
d2
84
,24
6
28
7,9
24
2
46
3
,86
0
4,1
06
3
,61
4
Urb
an
an
d B
uil
t-u
p L
an
d0
Oth
er
La
nd
17
6,6
68
1
74
,84
1
2,3
15
4
88
2
,80
3
-1,8
27
O
the
r L
an
d1
,96
2
Wa
ter
Are
a9
72
9
72
0
0
0
0
W
ate
r A
rea
0
TO
TA
L A
RE
A I
NV
EN
TO
RIE
D (
1)
50
9,4
56
5
09
,70
9
7,0
64
7
,06
4
14
,12
8
0
TO
TA
L A
CR
EA
GE
RE
PO
RT
ED
6,6
72
PA
RT
III
L
an
d U
se
Co
nv
ers
ion
fro
m 2
00
6 t
o 2
00
8F
arm
lan
d o
fF
arm
lan
d o
fS
ub
tota
lT
ota
lU
rba
n a
nd
To
tal
LA
ND
US
E C
AT
EG
OR
YP
rim
eS
tate
wid
eU
niq
ue
Lo
ca
lIm
po
rta
nt
Gra
zin
gA
gri
cu
ltu
ral
Bu
ilt-
up
Oth
er
Wa
ter
Co
nv
ert
ed
To
Fa
rmla
nd
Imp
ort
an
ce
Fa
rmla
nd
Imp
ort
an
ce
Fa
rmla
nd
La
nd
La
nd
La
nd
La
nd
Are
aA
no
the
r U
se
Pri
me
Fa
rmla
nd
(3
)(4
)to
: -
- 0
8
8
0
88
1
,52
2
1,6
10
7
91
1
11
0
2
,51
2
Fa
rmla
nd
of
Sta
tew
ide
Im
po
rta
nc
eto
:0
-
- 0
0
0
3
4
34
1
01
8
0
1
43
Un
iqu
e F
arm
lan
dto
:7
0
-
- 0
7
6
19
6
26
2
80
1
70
0
1
,07
6
Fa
rmla
nd
of
Lo
ca
l Im
po
rta
nc
eto
:0
0
0
-
- 0
0
0
0
0
0
0
IMP
OR
TA
NT
FA
RM
LA
ND
SU
BT
OT
AL
7
0
88
0
9
5
2,1
75
2
,27
0
1,1
72
2
89
0
3
,73
1
Gra
zin
g L
an
d
to:
0
11
6
0
0
71
-
- 7
1
68
3
18
0
7
72
AG
RIC
UL
TU
RA
L L
AN
D S
UB
TO
TA
L7
1
1
14
8
0
16
6
2,1
75
2
,34
1
1,8
55
3
07
0
4
,50
3
Urb
an
an
d B
uil
t-u
p L
an
d (
5)
to:
5
3
33
0
4
1
24
6
5
--
18
1
0
24
6
Oth
er
La
nd
to:
4
2
23
0
2
9
28
1
31
0
2,0
05
-
- 0
2
,31
5
Wa
ter
Are
ato
:0
0
0
0
0
0
0
0
0
-
- 0
TO
TA
L A
CR
EA
GE
CO
NV
ER
TE
D
to:
16
1
6
20
4
0
23
6
2,4
80
2
,71
6
3,8
60
4
88
0
7
,06
4
20
08
Co
un
ty B
ou
nd
ary
Ad
jus
tme
nt
(1)
0
0
0
0
0
18
9
18
9
64
0
0
2
53
(1)
To
tal
Are
a I
nv
en
tori
ed
ch
an
ge
d i
n 2
00
8 d
ue
to
ad
op
tio
n o
f u
pd
ate
d c
ou
nty
bo
un
da
ry f
ile
; a
dja
ce
nt
co
un
tie
s g
ain
ed
or
los
t c
orr
es
po
nd
ing
ac
rea
ge
s.
Sta
tis
tic
s r
ep
res
en
tin
g t
his
ch
an
ge
are
sh
ow
n i
n s
ha
de
d c
ell
s i
n P
art
III
of
tab
le.
(2)
20
06
-08
Ac
rea
ge
Ch
an
ge
s c
alc
ula
tes
co
nv
ers
ion
s w
ith
in e
xis
tin
g m
ap
pe
d a
rea
; c
ou
nty
bo
un
da
ry a
dju
stm
en
t a
cre
ag
es
no
t in
clu
de
d.
(3)
Co
nv
ers
ion
to
Un
iqu
e F
arm
lan
d i
s p
rim
ari
ly d
ue
to
th
e d
eli
ne
ati
on
of
po
tte
d p
lan
t n
urs
eri
es
in
th
e c
ou
nty
.
(4)
Co
nv
ers
ion
to
Gra
zin
g L
an
d p
rim
ari
ly d
ue
to
la
nd
le
ft i
dle
fo
r th
ree
or
mo
re u
pd
ate
cy
cle
s.
Ve
rifi
ca
tio
n o
f d
ry l
ima
be
an
cro
pp
ing
on
Se
al
Be
ac
h N
av
al
We
ap
on
s S
tati
on
la
nd
wa
s a
la
rge
co
mp
on
en
t.
(5)
Co
nv
ers
ion
fro
m U
rba
n a
nd
Bu
ilt-
Up
La
nd
pri
ma
rily
th
e r
es
ult
of
the
us
e o
f d
eta
ile
d d
igit
al
ima
ge
ry t
o d
eli
ne
ate
mo
re d
isti
nc
t u
rba
n b
ou
nd
ari
es
.
Page 46
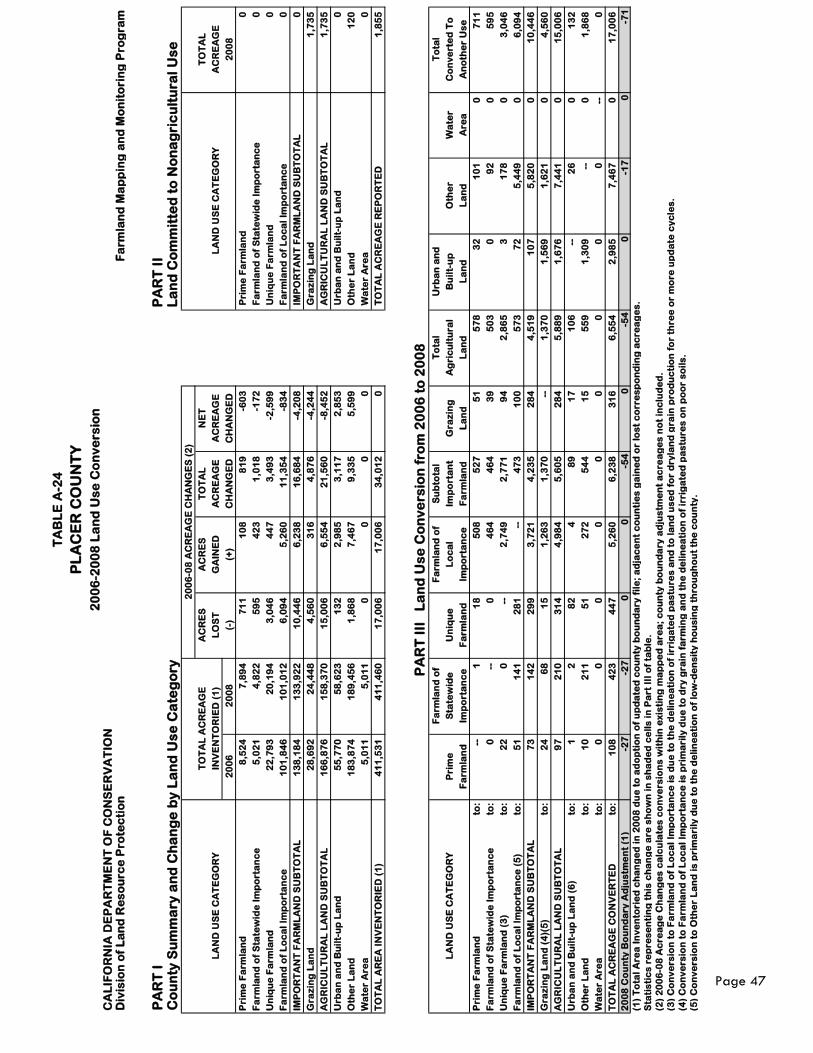
TA
BL
E A
-24
PL
AC
ER
CO
UN
TY
20
06
-20
08
La
nd
Us
e C
on
ve
rsio
nC
AL
IFO
RN
IA D
EP
AR
TM
EN
T O
F C
ON
SE
RV
AT
ION
Div
isio
n o
f L
an
d R
es
ou
rce
Pro
tec
tio
nF
arm
lan
d M
ap
pin
g a
nd
Mo
nit
ori
ng
Pro
gra
m
PA
RT
I
PA
RT
II
Co
un
ty S
um
ma
ry a
nd
Ch
an
ge
by
La
nd
Us
e C
ate
go
ryL
an
d C
om
mit
ted
to
No
na
gri
cu
ltu
ral
Us
e
20
06
-08
AC
RE
AG
E C
HA
NG
ES
(2
)
T
OT
AL
AC
RE
AG
EA
CR
ES
AC
RE
ST
OT
AL
NE
T
TO
TA
L
LA
ND
US
E C
AT
EG
OR
YIN
VE
NT
OR
IED
(1
)L
OS
TG
AIN
ED
AC
RE
AG
EA
CR
EA
GE
LA
ND
US
E C
AT
EG
OR
YA
CR
EA
GE
20
06
20
08
(-)
(+)
CH
AN
GE
DC
HA
NG
ED
20
08
Pri
me
Fa
rmla
nd
8,5
24
7
,89
4
71
1
10
8
81
9
-60
3
Pri
me
Fa
rmla
nd
0
Fa
rmla
nd
of
Sta
tew
ide
Im
po
rta
nc
e5
,02
1
4,8
22
5
95
4
23
1
,01
8
-17
2
Fa
rmla
nd
of
Sta
tew
ide
Im
po
rta
nc
e0
Un
iqu
e F
arm
lan
d2
2,7
93
2
0,1
94
3
,04
6
44
7
3,4
93
-2
,59
9
Un
iqu
e F
arm
lan
d0
Fa
rmla
nd
of
Lo
ca
l Im
po
rta
nc
e1
01
,84
6
10
1,0
12
6
,09
4
5,2
60
1
1,3
54
-8
34
F
arm
lan
d o
f L
oc
al
Imp
ort
an
ce
0
IMP
OR
TA
NT
FA
RM
LA
ND
SU
BT
OT
AL
13
8,1
84
1
33
,92
2
10
,44
6
6,2
38
1
6,6
84
-4
,20
8
IM
PO
RT
AN
T F
AR
ML
AN
D S
UB
TO
TA
L0
Gra
zin
g L
an
d
28
,69
2
24
,44
8
4,5
60
3
16
4
,87
6
-4,2
44
G
raz
ing
La
nd
1
,73
5
AG
RIC
UL
TU
RA
L L
AN
D S
UB
TO
TA
L1
66
,87
6
15
8,3
70
1
5,0
06
6
,55
4
21
,56
0
-8,4
52
A
GR
ICU
LT
UR
AL
LA
ND
SU
BT
OT
AL
1,7
35
Urb
an
an
d B
uil
t-u
p L
an
d5
5,7
70
5
8,6
23
1
32
2
,98
5
3,1
17
2
,85
3
Urb
an
an
d B
uil
t-u
p L
an
d0
Oth
er
La
nd
18
3,8
74
1
89
,45
6
1,8
68
7
,46
7
9,3
35
5
,59
9
Oth
er
La
nd
12
0
Wa
ter
Are
a5
,01
1
5,0
11
0
0
0
0
W
ate
r A
rea
0
TO
TA
L A
RE
A I
NV
EN
TO
RIE
D (
1)
41
1,5
31
4
11
,46
0
17
,00
6
17
,00
6
34
,01
2
0
TO
TA
L A
CR
EA
GE
RE
PO
RT
ED
1,8
55
PA
RT
III
L
an
d U
se
Co
nv
ers
ion
fro
m 2
00
6 t
o 2
00
8F
arm
lan
d o
fF
arm
lan
d o
fS
ub
tota
lT
ota
lU
rba
n a
nd
To
tal
LA
ND
US
E C
AT
EG
OR
YP
rim
eS
tate
wid
eU
niq
ue
Lo
ca
lIm
po
rta
nt
Gra
zin
gA
gri
cu
ltu
ral
Bu
ilt-
up
Oth
er
Wa
ter
Co
nv
ert
ed
To
Fa
rmla
nd
Imp
ort
an
ce
Fa
rmla
nd
Imp
ort
an
ce
Fa
rmla
nd
La
nd
La
nd
La
nd
La
nd
Are
aA
no
the
r U
se
Pri
me
Fa
rmla
nd
to:
--
1
18
5
08
5
27
5
1
57
8
32
1
01
0
7
11
Fa
rmla
nd
of
Sta
tew
ide
Im
po
rta
nc
eto
:0
-
- 0
4
64
4
64
3
9
50
3
0
92
0
5
95
Un
iqu
e F
arm
lan
d (
3)
to:
22
0
-
- 2
,74
9
2,7
71
9
4
2,8
65
3
1
78
0
3
,04
6
Fa
rmla
nd
of
Lo
ca
l Im
po
rta
nc
e (
5)
to:
51
1
41
2
81
-
- 4
73
1
00
5
73
7
2
5,4
49
0
6
,09
4
IMP
OR
TA
NT
FA
RM
LA
ND
SU
BT
OT
AL
73
1
42
2
99
3
,72
1
4,2
35
2
84
4
,51
9
10
7
5,8
20
0
1
0,4
46
Gra
zin
g L
an
d (
4)(
5)
to:
24
6
8
15
1
,26
3
1,3
70
-
- 1
,37
0
1,5
69
1
,62
1
0
4,5
60
AG
RIC
UL
TU
RA
L L
AN
D S
UB
TO
TA
L9
7
21
0
31
4
4,9
84
5
,60
5
28
4
5,8
89
1
,67
6
7,4
41
0
1
5,0
06
Urb
an
an
d B
uil
t-u
p L
an
d (
6)
to:
1
2
82
4
8
9
17
1
06
-
- 2
6
0
13
2
Oth
er
La
nd
to:
10
2
11
5
1
27
2
54
4
15
5
59
1
,30
9
--
0
1,8
68
Wa
ter
Are
ato
:0
0
0
0
0
0
0
0
0
-
- 0
TO
TA
L A
CR
EA
GE
CO
NV
ER
TE
D
to:
10
8
42
3
44
7
5,2
60
6
,23
8
31
6
6,5
54
2
,98
5
7,4
67
0
1
7,0
06
20
08
Co
un
ty B
ou
nd
ary
Ad
jus
tme
nt
(1)
-27
-27
00
-54
0-5
40
-17
0-7
1
(1)
To
tal
Are
a I
nv
en
tori
ed
ch
an
ge
d i
n 2
00
8 d
ue
to
ad
op
tio
n o
f u
pd
ate
d c
ou
nty
bo
un
da
ry f
ile
; a
dja
ce
nt
co
un
tie
s g
ain
ed
or
los
t c
orr
es
po
nd
ing
ac
rea
ge
s.
Sta
tis
tic
s r
ep
res
en
tin
g t
his
ch
an
ge
are
sh
ow
n i
n s
ha
de
d c
ell
s i
n P
art
III
of
tab
le.
(2)
20
06
-08
Ac
rea
ge
Ch
an
ge
s c
alc
ula
tes
co
nv
ers
ion
s w
ith
in e
xis
tin
g m
ap
pe
d a
rea
; c
ou
nty
bo
un
da
ry a
dju
stm
en
t a
cre
ag
es
no
t in
clu
de
d.
(3)
Co
nv
ers
ion
to
Fa
rmla
nd
of
Lo
ca
l Im
po
rta
nc
e i
s d
ue
to
th
e d
eli
ne
ati
on
of
irri
ga
ted
pa
stu
res
an
d t
o l
an
d u
se
d f
or
dry
lan
d g
rain
pro
du
cti
on
fo
r th
ree
or
mo
re u
pd
ate
cy
cle
s.
(4)
Co
nv
ers
ion
to
Fa
rmla
nd
of
Lo
ca
l Im
po
rta
nc
e i
s p
rim
ari
ly d
ue
to
dry
gra
in f
arm
ing
an
d t
he
de
lin
ea
tio
n o
f ir
rig
ate
d p
as
ture
s o
n p
oo
r s
oil
s.
(5)
Co
nv
ers
ion
to
Oth
er
La
nd
is
pri
ma
rily
du
e t
o t
he
de
lin
ea
tio
n o
f lo
w-d
en
sit
y h
ou
sin
g t
hro
ug
ho
ut
the
co
un
ty.
Page 47
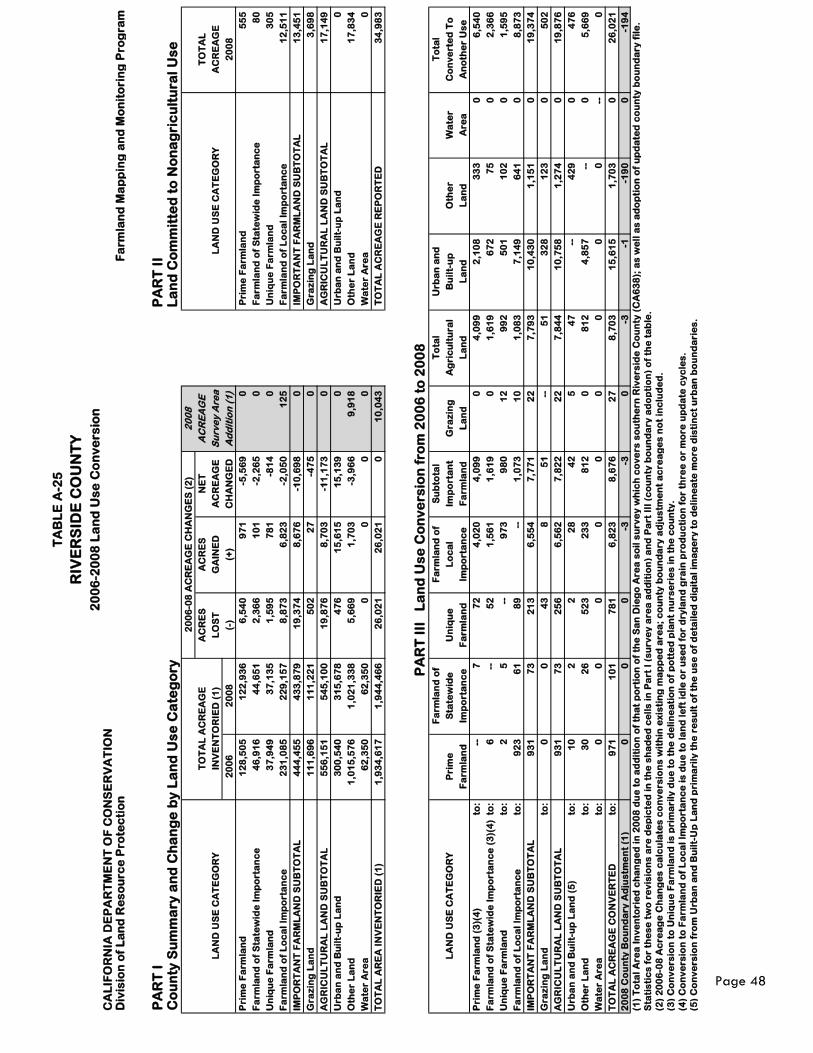
TA
BL
E A
-25
RIV
ER
SID
E C
OU
NT
Y
20
06
-20
08
La
nd
Us
e C
on
ve
rsio
nC
AL
IFO
RN
IA D
EP
AR
TM
EN
T O
F C
ON
SE
RV
AT
ION
Div
isio
n o
f L
an
d R
es
ou
rce
Pro
tec
tio
nF
arm
lan
d M
ap
pin
g a
nd
Mo
nit
ori
ng
Pro
gra
m
PA
RT
I
PA
RT
II
Co
un
ty S
um
ma
ry a
nd
Ch
an
ge
by
La
nd
Us
e C
ate
go
ryL
an
d C
om
mit
ted
to
No
na
gri
cu
ltu
ral
Us
e
2
00
8
A
CR
ES
AC
RE
SN
ET
AC
RE
AG
E
TO
TA
L
LA
ND
US
E C
AT
EG
OR
YL
OS
TG
AIN
ED
AC
RE
AG
ES
urv
ey
Are
aL
AN
D U
SE
CA
TE
GO
RY
AC
RE
AG
E
20
06
20
08
(-)
(+)
CH
AN
GE
DA
dd
itio
n (
1)
20
08
Pri
me
Fa
rmla
nd
12
8,5
05
1
22
,93
6
6,5
40
9
71
-5
,56
9
0
Pri
me
Fa
rmla
nd
55
5
Fa
rmla
nd
of
Sta
tew
ide
Im
po
rta
nc
e4
6,9
16
4
4,6
51
2
,36
6
10
1
-2,2
65
0
F
arm
lan
d o
f S
tate
wid
e I
mp
ort
an
ce
80
Un
iqu
e F
arm
lan
d3
7,9
49
3
7,1
35
1
,59
5
78
1
-81
4
0
Un
iqu
e F
arm
lan
d3
05
Fa
rmla
nd
of
Lo
ca
l Im
po
rta
nc
e2
31
,08
5
22
9,1
57
8
,87
3
6,8
23
-2
,05
0
12
5
Fa
rmla
nd
of
Lo
ca
l Im
po
rta
nc
e1
2,5
11
IMP
OR
TA
NT
FA
RM
LA
ND
SU
BT
OT
AL
44
4,4
55
4
33
,87
9
19
,37
4
8,6
76
-1
0,6
98
0
I
MP
OR
TA
NT
FA
RM
LA
ND
SU
BT
OT
AL
13
,45
1
Gra
zin
g L
an
d
11
1,6
96
1
11
,22
1
50
2
27
-4
75
0
G
raz
ing
La
nd
3
,69
8
AG
RIC
UL
TU
RA
L L
AN
D S
UB
TO
TA
L5
56
,15
1
54
5,1
00
1
9,8
76
8
,70
3
-11
,17
3
0
AG
RIC
UL
TU
RA
L L
AN
D S
UB
TO
TA
L1
7,1
49
Urb
an
an
d B
uil
t-u
p L
an
d3
00
,54
0
31
5,6
78
4
76
1
5,6
15
1
5,1
39
0
U
rba
n a
nd
Bu
ilt-
up
La
nd
0
Oth
er
La
nd
1,0
15
,57
6
1,0
21
,33
8
5,6
69
1
,70
3
-3,9
66
9
,91
8
Oth
er
La
nd
17
,83
4
Wa
ter
Are
a6
2,3
50
6
2,3
50
0
0
0
0
W
ate
r A
rea
0
TO
TA
L A
RE
A I
NV
EN
TO
RIE
D (
1)
1,9
34
,61
7
1,9
44
,46
6
26
,02
1
26
,02
1
0
10
,04
3
TO
TA
L A
CR
EA
GE
RE
PO
RT
ED
34
,98
3
PA
RT
III
L
an
d U
se
Co
nv
ers
ion
fro
m 2
00
6 t
o 2
00
8F
arm
lan
d o
fF
arm
lan
d o
fS
ub
tota
lT
ota
lU
rba
n a
nd
To
tal
LA
ND
US
E C
AT
EG
OR
YP
rim
eS
tate
wid
eU
niq
ue
Lo
ca
lIm
po
rta
nt
Gra
zin
gA
gri
cu
ltu
ral
Bu
ilt-
up
Oth
er
Wa
ter
Co
nv
ert
ed
To
Fa
rmla
nd
Imp
ort
an
ce
Fa
rmla
nd
Imp
ort
an
ce
Fa
rmla
nd
La
nd
La
nd
La
nd
La
nd
Are
aA
no
the
r U
se
Pri
me
Fa
rmla
nd
(3
)(4
)to
: -
- 7
7
2
4,0
20
4
,09
9
0
4,0
99
2
,10
8
33
3
0
6,5
40
Fa
rmla
nd
of
Sta
tew
ide
Im
po
rta
nc
e (
3)(
4)
to:
6
--
52
1
,56
1
1,6
19
0
1
,61
9
67
2
75
0
2
,36
6
Un
iqu
e F
arm
lan
dto
:2
5
-
- 9
73
9
80
1
2
99
2
50
1
10
2
0
1,5
95
Fa
rmla
nd
of
Lo
ca
l Im
po
rta
nc
eto
:9
23
6
1
89
-
- 1
,07
3
10
1
,08
3
7,1
49
6
41
0
8
,87
3
IMP
OR
TA
NT
FA
RM
LA
ND
SU
BT
OT
AL
93
1
73
2
13
6
,55
4
7,7
71
2
2
7,7
93
1
0,4
30
1
,15
1
0
19
,37
4
Gra
zin
g L
an
d
to:
0
0
43
8
5
1
--
51
3
28
1
23
0
5
02
AG
RIC
UL
TU
RA
L L
AN
D S
UB
TO
TA
L9
31
7
3
25
6
6,5
62
7
,82
2
22
7
,84
4
10
,75
8
1,2
74
0
1
9,8
76
Urb
an
an
d B
uil
t-u
p L
an
d (
5)
to:
10
2
2
2
8
42
5
4
7
--
42
9
0
47
6
Oth
er
La
nd
to:
30
2
6
52
3
23
3
81
2
0
81
2
4,8
57
-
- 0
5
,66
9
Wa
ter
Are
ato
:0
0
0
0
0
0
0
0
0
-
- 0
TO
TA
L A
CR
EA
GE
CO
NV
ER
TE
D
to:
97
1
10
1
78
1
6,8
23
8
,67
6
27
8
,70
3
15
,61
5
1,7
03
0
2
6,0
21
20
08
Co
un
ty B
ou
nd
ary
Ad
jus
tme
nt
(1)
0
0
0
-3
-3
0
-3
-1
-19
0
0
-19
4
(1)
To
tal
Are
a I
nv
en
tori
ed
ch
an
ge
d i
n 2
00
8 d
ue
to
ad
dit
ion
of
tha
t p
ort
ion
of
the
Sa
n D
ieg
o A
rea
so
il s
urv
ey
wh
ich
co
ve
rs s
ou
the
rn R
ive
rsid
e C
ou
nty
(C
A6
38
); a
s w
ell
as
ad
op
tio
n o
f u
pd
ate
d c
ou
nty
bo
un
da
ry f
ile
.
Sta
tis
tic
s f
or
the
se
tw
o r
ev
isio
ns
are
de
pic
ted
in
th
e s
ha
de
d c
ell
s i
n P
art
I (
su
rve
y a
rea
ad
dit
ion
) a
nd
Pa
rt I
II (
co
un
ty b
ou
nd
ary
ad
op
tio
n)
of
the
ta
ble
.
(2)
20
06
-08
Ac
rea
ge
Ch
an
ge
s c
alc
ula
tes
co
nv
ers
ion
s w
ith
in e
xis
tin
g m
ap
pe
d a
rea
; c
ou
nty
bo
un
da
ry a
dju
stm
en
t a
cre
ag
es
no
t in
clu
de
d.
(3)
Co
nv
ers
ion
to
Un
iqu
e F
arm
lan
d i
s p
rim
ari
ly d
ue
to
th
e d
eli
ne
ati
on
of
po
tte
d p
lan
t n
urs
eri
es
in
th
e c
ou
nty
.
(4)
Co
nv
ers
ion
to
Fa
rmla
nd
of
Lo
ca
l Im
po
rta
nc
e i
s d
ue
to
la
nd
le
ft i
dle
or
us
ed
fo
r d
ryla
nd
gra
in p
rod
uc
tio
n f
or
thre
e o
r m
ore
up
da
te c
yc
les
.
(5)
Co
nv
ers
ion
fro
m U
rba
n a
nd
Bu
ilt-
Up
La
nd
pri
ma
rily
th
e r
es
ult
of
the
us
e o
f d
eta
ile
d d
igit
al
ima
ge
ry t
o d
eli
ne
ate
mo
re d
isti
nc
t u
rba
n b
ou
nd
ari
es
.
20
06
-08
AC
RE
AG
E C
HA
NG
ES
(2
)
TO
TA
L A
CR
EA
GE
INV
EN
TO
RIE
D (
1)
Page 48
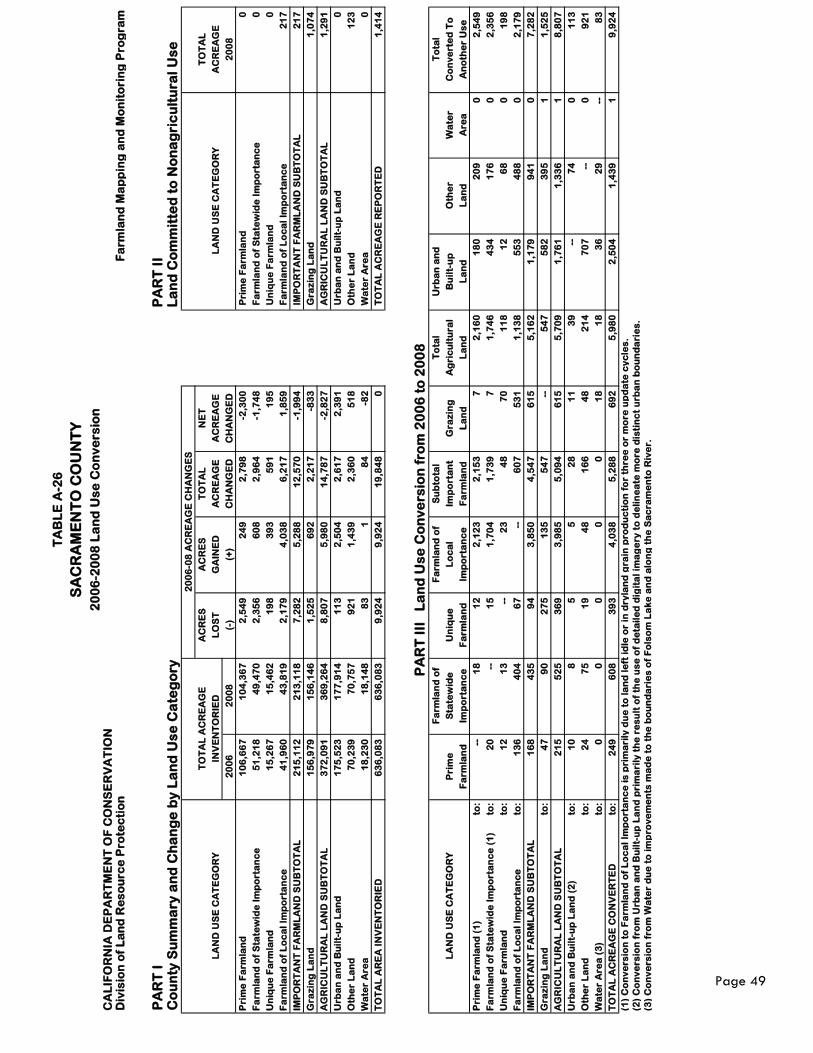
TA
BL
E A
-26
SA
CR
AM
EN
TO
CO
UN
TY
20
06
-20
08
La
nd
Us
e C
on
ve
rsio
nC
AL
IFO
RN
IA D
EP
AR
TM
EN
T O
F C
ON
SE
RV
AT
ION
Div
isio
n o
f L
an
d R
es
ou
rce
Pro
tec
tio
nF
arm
lan
d M
ap
pin
g a
nd
Mo
nit
ori
ng
Pro
gra
m
PA
RT
I
PA
RT
II
Co
un
ty S
um
ma
ry a
nd
Ch
an
ge
by
La
nd
Us
e C
ate
go
ryL
an
d C
om
mit
ted
to
No
na
gri
cu
ltu
ral
Us
e
20
06
-08
AC
RE
AG
E C
HA
NG
ES
T
OT
AL
AC
RE
AG
EA
CR
ES
AC
RE
ST
OT
AL
NE
T
TO
TA
L
LA
ND
US
E C
AT
EG
OR
YIN
VE
NT
OR
IED
LO
ST
GA
INE
DA
CR
EA
GE
AC
RE
AG
EL
AN
D U
SE
CA
TE
GO
RY
AC
RE
AG
E
20
06
20
08
(-)
(+)
CH
AN
GE
DC
HA
NG
ED
20
08
Pri
me
Fa
rmla
nd
10
6,6
67
1
04
,36
7
2,5
49
2
49
2
,79
8
-2,3
00
P
rim
e F
arm
lan
d0
Fa
rmla
nd
of
Sta
tew
ide
Im
po
rta
nc
e5
1,2
18
4
9,4
70
2
,35
6
60
8
2,9
64
-1
,74
8
Fa
rmla
nd
of
Sta
tew
ide
Im
po
rta
nc
e0
Un
iqu
e F
arm
lan
d1
5,2
67
1
5,4
62
1
98
3
93
5
91
1
95
U
niq
ue
Fa
rmla
nd
0
Fa
rmla
nd
of
Lo
ca
l Im
po
rta
nc
e4
1,9
60
4
3,8
19
2
,17
9
4,0
38
6
,21
7
1,8
59
F
arm
lan
d o
f L
oc
al
Imp
ort
an
ce
21
7
IMP
OR
TA
NT
FA
RM
LA
ND
SU
BT
OT
AL
21
5,1
12
2
13
,11
8
7,2
82
5
,28
8
12
,57
0
-1,9
94
I
MP
OR
TA
NT
FA
RM
LA
ND
SU
BT
OT
AL
21
7
Gra
zin
g L
an
d
15
6,9
79
1
56
,14
6
1,5
25
6
92
2
,21
7
-83
3
Gra
zin
g L
an
d
1,0
74
AG
RIC
UL
TU
RA
L L
AN
D S
UB
TO
TA
L3
72
,09
1
36
9,2
64
8
,80
7
5,9
80
1
4,7
87
-2
,82
7
AG
RIC
UL
TU
RA
L L
AN
D S
UB
TO
TA
L1
,29
1
Urb
an
an
d B
uil
t-u
p L
an
d1
75
,52
3
17
7,9
14
1
13
2
,50
4
2,6
17
2
,39
1
Urb
an
an
d B
uil
t-u
p L
an
d0
Oth
er
La
nd
70
,23
9
70
,75
7
92
1
1,4
39
2
,36
0
51
8
Oth
er
La
nd
12
3
Wa
ter
Are
a1
8,2
30
1
8,1
48
8
3
1
84
-8
2
Wa
ter
Are
a0
TO
TA
L A
RE
A I
NV
EN
TO
RIE
D
63
6,0
83
6
36
,08
3
9,9
24
9
,92
4
19
,84
8
0
TO
TA
L A
CR
EA
GE
RE
PO
RT
ED
1,4
14
PA
RT
III
L
an
d U
se
Co
nv
ers
ion
fro
m 2
00
6 t
o 2
00
8F
arm
lan
d o
fF
arm
lan
d o
fS
ub
tota
lT
ota
lU
rba
n a
nd
To
tal
LA
ND
US
E C
AT
EG
OR
YP
rim
eS
tate
wid
eU
niq
ue
Lo
ca
lIm
po
rta
nt
Gra
zin
gA
gri
cu
ltu
ral
Bu
ilt-
up
Oth
er
Wa
ter
Co
nv
ert
ed
To
Fa
rmla
nd
Imp
ort
an
ce
Fa
rmla
nd
Imp
ort
an
ce
Fa
rmla
nd
La
nd
La
nd
La
nd
La
nd
Are
aA
no
the
r U
se
Pri
me
Fa
rmla
nd
(1
)to
: -
- 1
8
12
2
,12
3
2,1
53
7
2
,16
0
18
0
20
9
0
2,5
49
Fa
rmla
nd
of
Sta
tew
ide
Im
po
rta
nc
e (
1)
to:
20
-
- 1
5
1,7
04
1
,73
9
7
1,7
46
4
34
1
76
0
2
,35
6
Un
iqu
e F
arm
lan
dto
:1
2
13
-
- 2
3
48
7
0
11
8
12
6
8
0
19
8
Fa
rmla
nd
of
Lo
ca
l Im
po
rta
nc
eto
:1
36
4
04
6
7
--
60
7
53
1
1,1
38
5
53
4
88
0
2
,17
9
IMP
OR
TA
NT
FA
RM
LA
ND
SU
BT
OT
AL
16
8
43
5
94
3
,85
0
4,5
47
6
15
5
,16
2
1,1
79
9
41
0
7
,28
2
Gra
zin
g L
an
d
to:
47
9
0
27
5
13
5
54
7
--
54
7
58
2
39
5
1
1,5
25
AG
RIC
UL
TU
RA
L L
AN
D S
UB
TO
TA
L2
15
5
25
3
69
3
,98
5
5,0
94
6
15
5
,70
9
1,7
61
1
,33
6
1
8,8
07
Urb
an
an
d B
uil
t-u
p L
an
d (
2)
to:
10
8
5
5
2
8
11
3
9
--
74
0
1
13
Oth
er
La
nd
to:
24
7
5
19
4
8
16
6
48
2
14
7
07
-
- 0
9
21
Wa
ter
Are
a (
3)
to:
0
0
0
0
0
18
1
8
36
2
9
--
83
TO
TA
L A
CR
EA
GE
CO
NV
ER
TE
D
to:
24
9
60
8
39
3
4,0
38
5
,28
8
69
2
5,9
80
2
,50
4
1,4
39
1
9
,92
4
(1)
Co
nv
ers
ion
to
Fa
rmla
nd
of
Lo
ca
l Im
po
rta
nc
e i
s p
rim
ari
ly d
ue
to
la
nd
le
ft i
dle
or
in d
ryla
nd
gra
in p
rod
uc
tio
n f
or
thre
e o
r m
ore
up
da
te c
yc
les
.
(2)
Co
nv
ers
ion
fro
m U
rba
n a
nd
Bu
ilt-
up
La
nd
pri
ma
rily
th
e r
es
ult
of
the
us
e o
f d
eta
ile
d d
igit
al
ima
ge
ry t
o d
eli
ne
ate
mo
re d
isti
nc
t u
rba
n b
ou
nd
ari
es
.
(3)
Co
nv
ers
ion
fro
m W
ate
r d
ue
to
im
pro
ve
me
nts
ma
de
to
th
e b
ou
nd
ari
es
of
Fo
lso
m L
ak
e a
nd
alo
ng
th
e S
ac
ram
en
to R
ive
r.
Page 49
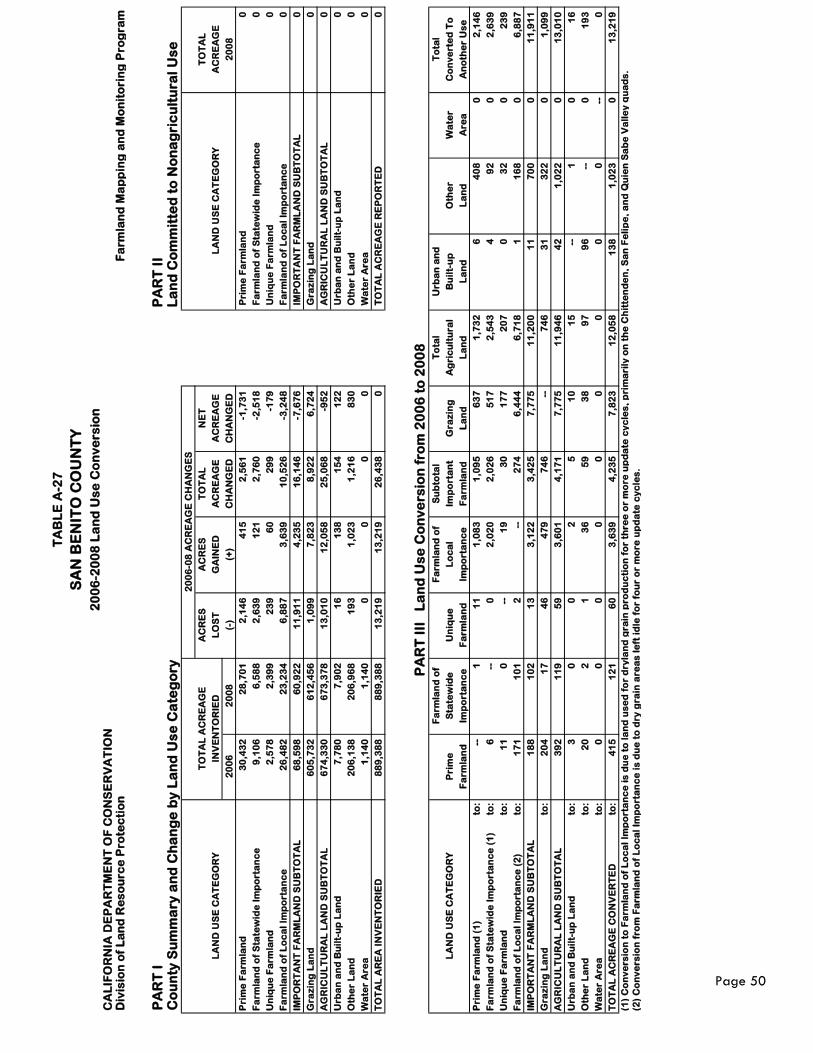
TA
BL
E A
-27
SA
N B
EN
ITO
CO
UN
TY
20
06
-20
08
La
nd
Us
e C
on
ve
rsio
nC
AL
IFO
RN
IA D
EP
AR
TM
EN
T O
F C
ON
SE
RV
AT
ION
Div
isio
n o
f L
an
d R
es
ou
rce
Pro
tec
tio
nF
arm
lan
d M
ap
pin
g a
nd
Mo
nit
ori
ng
Pro
gra
m
PA
RT
I
PA
RT
II
Co
un
ty S
um
ma
ry a
nd
Ch
an
ge
by
La
nd
Us
e C
ate
go
ryL
an
d C
om
mit
ted
to
No
na
gri
cu
ltu
ral
Us
e
20
06
-08
AC
RE
AG
E C
HA
NG
ES
T
OT
AL
AC
RE
AG
EA
CR
ES
AC
RE
ST
OT
AL
NE
T
TO
TA
L
LA
ND
US
E C
AT
EG
OR
YIN
VE
NT
OR
IED
LO
ST
GA
INE
DA
CR
EA
GE
AC
RE
AG
EL
AN
D U
SE
CA
TE
GO
RY
AC
RE
AG
E
20
06
20
08
(-)
(+)
CH
AN
GE
DC
HA
NG
ED
20
08
Pri
me
Fa
rmla
nd
30
,43
2
28
,70
1
2,1
46
4
15
2
,56
1
-1,7
31
P
rim
e F
arm
lan
d0
Fa
rmla
nd
of
Sta
tew
ide
Im
po
rta
nc
e9
,10
6
6,5
88
2
,63
9
12
1
2,7
60
-2
,51
8
Fa
rmla
nd
of
Sta
tew
ide
Im
po
rta
nc
e0
Un
iqu
e F
arm
lan
d2
,57
8
2,3
99
2
39
6
0
29
9
-17
9
Un
iqu
e F
arm
lan
d0
Fa
rmla
nd
of
Lo
ca
l Im
po
rta
nc
e2
6,4
82
2
3,2
34
6
,88
7
3,6
39
1
0,5
26
-3
,24
8
Fa
rmla
nd
of
Lo
ca
l Im
po
rta
nc
e0
IMP
OR
TA
NT
FA
RM
LA
ND
SU
BT
OT
AL
68
,59
8
60
,92
2
11
,91
1
4,2
35
1
6,1
46
-7
,67
6
IM
PO
RT
AN
T F
AR
ML
AN
D S
UB
TO
TA
L0
Gra
zin
g L
an
d
60
5,7
32
6
12
,45
6
1,0
99
7
,82
3
8,9
22
6
,72
4
Gra
zin
g L
an
d
0
AG
RIC
UL
TU
RA
L L
AN
D S
UB
TO
TA
L6
74
,33
0
67
3,3
78
1
3,0
10
1
2,0
58
2
5,0
68
-9
52
A
GR
ICU
LT
UR
AL
LA
ND
SU
BT
OT
AL
0
Urb
an
an
d B
uil
t-u
p L
an
d7
,78
0
7,9
02
1
6
13
8
15
4
12
2
Urb
an
an
d B
uil
t-u
p L
an
d0
Oth
er
La
nd
20
6,1
38
2
06
,96
8
19
3
1,0
23
1
,21
6
83
0
Oth
er
La
nd
0
Wa
ter
Are
a1
,14
0
1,1
40
0
0
0
0
W
ate
r A
rea
0
TO
TA
L A
RE
A I
NV
EN
TO
RIE
D
88
9,3
88
8
89
,38
8
13
,21
9
13
,21
9
26
,43
8
0
TO
TA
L A
CR
EA
GE
RE
PO
RT
ED
0
PA
RT
III
L
an
d U
se
Co
nv
ers
ion
fro
m 2
00
6 t
o 2
00
8F
arm
lan
d o
fF
arm
lan
d o
fS
ub
tota
lT
ota
lU
rba
n a
nd
To
tal
LA
ND
US
E C
AT
EG
OR
YP
rim
eS
tate
wid
eU
niq
ue
Lo
ca
lIm
po
rta
nt
Gra
zin
gA
gri
cu
ltu
ral
Bu
ilt-
up
Oth
er
Wa
ter
Co
nv
ert
ed
To
Fa
rmla
nd
Imp
ort
an
ce
Fa
rmla
nd
Imp
ort
an
ce
Fa
rmla
nd
La
nd
La
nd
La
nd
La
nd
Are
aA
no
the
r U
se
Pri
me
Fa
rmla
nd
(1
)to
: -
- 1
1
1
1,0
83
1
,09
5
63
7
1,7
32
6
4
08
0
2
,14
6
Fa
rmla
nd
of
Sta
tew
ide
Im
po
rta
nc
e (
1)
to:
6
--
0
2,0
20
2
,02
6
51
7
2,5
43
4
9
2
0
2,6
39
Un
iqu
e F
arm
lan
dto
:1
1
0
--
19
3
0
17
7
20
7
0
32
0
2
39
Fa
rmla
nd
of
Lo
ca
l Im
po
rta
nc
e (
2)
to:
17
1
10
1
2
--
27
4
6,4
44
6
,71
8
1
16
8
0
6,8
87
IMP
OR
TA
NT
FA
RM
LA
ND
SU
BT
OT
AL
18
8
10
2
13
3
,12
2
3,4
25
7
,77
5
11
,20
0
11
7
00
0
1
1,9
11
Gra
zin
g L
an
d
to:
20
4
17
4
6
47
9
74
6
--
74
6
31
3
22
0
1
,09
9
AG
RIC
UL
TU
RA
L L
AN
D S
UB
TO
TA
L3
92
1
19
5
9
3,6
01
4
,17
1
7,7
75
1
1,9
46
4
2
1,0
22
0
1
3,0
10
Urb
an
an
d B
uil
t-u
p L
an
dto
:3
0
0
2
5
1
0
15
-
- 1
0
1
6
Oth
er
La
nd
to:
20
2
1
3
6
59
3
8
97
9
6
--
0
19
3
Wa
ter
Are
ato
:0
0
0
0
0
0
0
0
0
-
- 0
TO
TA
L A
CR
EA
GE
CO
NV
ER
TE
D
to:
41
5
12
1
60
3
,63
9
4,2
35
7
,82
3
12
,05
8
13
8
1,0
23
0
1
3,2
19
(1)
Co
nv
ers
ion
to
Fa
rmla
nd
of
Lo
ca
l Im
po
rta
nc
e i
s d
ue
to
la
nd
us
ed
fo
r d
ryla
nd
gra
in p
rod
uc
tio
n f
or
thre
e o
r m
ore
up
da
te c
yc
les
, p
rim
ari
ly o
n t
he
Ch
itte
nd
en
, S
an
Fe
lip
e,
an
d Q
uie
n S
ab
e V
all
ey
qu
ad
s.
(2)
Co
nv
ers
ion
fro
m F
arm
lan
d o
f L
oc
al
Imp
ort
an
ce
is
du
e t
o d
ry g
rain
are
as
le
ft i
dle
fo
r fo
ur
or
mo
re u
pd
ate
cy
cle
s.
Page 50
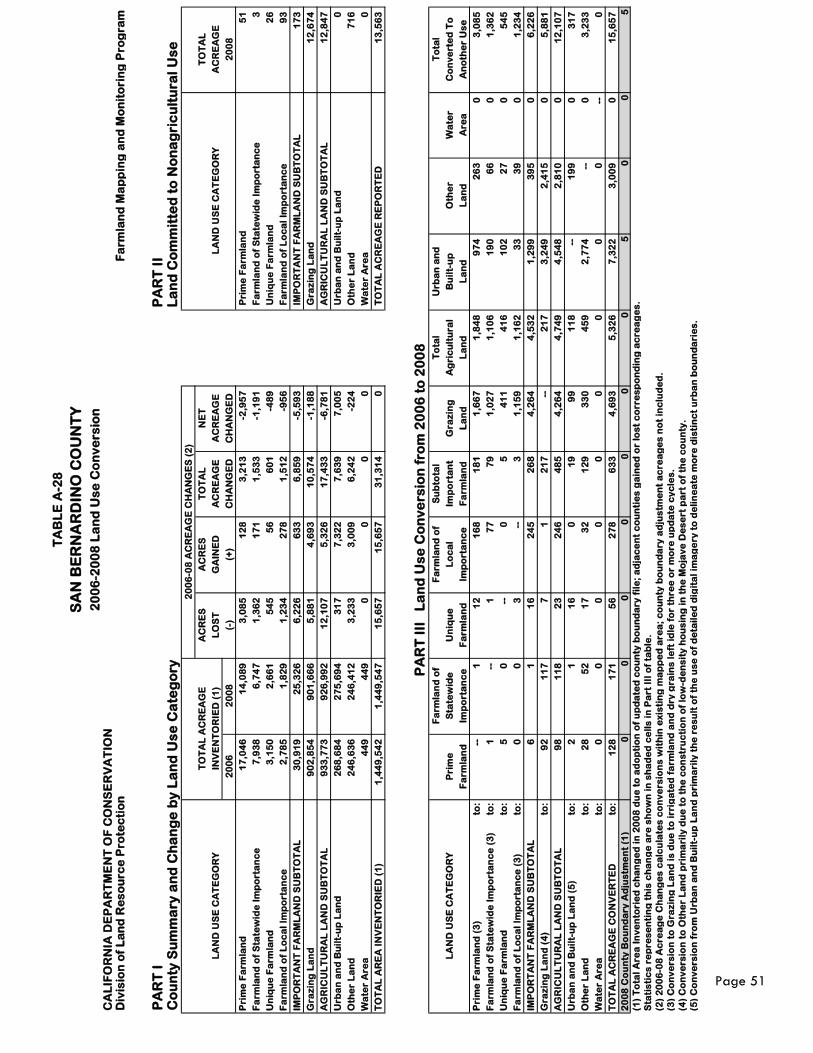
TA
BL
E A
-28
SA
N B
ER
NA
RD
INO
CO
UN
TY
20
06
-20
08
La
nd
Us
e C
on
ve
rsio
nC
AL
IFO
RN
IA D
EP
AR
TM
EN
T O
F C
ON
SE
RV
AT
ION
Div
isio
n o
f L
an
d R
es
ou
rce
Pro
tec
tio
nF
arm
lan
d M
ap
pin
g a
nd
Mo
nit
ori
ng
Pro
gra
m
PA
RT
I
PA
RT
II
Co
un
ty S
um
ma
ry a
nd
Ch
an
ge
by
La
nd
Us
e C
ate
go
ryL
an
d C
om
mit
ted
to
No
na
gri
cu
ltu
ral
Us
e
20
06
-08
AC
RE
AG
E C
HA
NG
ES
(2
)
T
OT
AL
AC
RE
AG
EA
CR
ES
AC
RE
ST
OT
AL
NE
T
TO
TA
L
LA
ND
US
E C
AT
EG
OR
YIN
VE
NT
OR
IED
(1
)L
OS
TG
AIN
ED
AC
RE
AG
EA
CR
EA
GE
LA
ND
US
E C
AT
EG
OR
YA
CR
EA
GE
20
06
20
08
(-)
(+)
CH
AN
GE
DC
HA
NG
ED
20
08
Pri
me
Fa
rmla
nd
17
,04
6
14
,08
9
3,0
85
1
28
3
,21
3
-2,9
57
P
rim
e F
arm
lan
d5
1
Fa
rmla
nd
of
Sta
tew
ide
Im
po
rta
nc
e7
,93
8
6,7
47
1
,36
2
17
1
1,5
33
-1
,19
1
Fa
rmla
nd
of
Sta
tew
ide
Im
po
rta
nc
e3
Un
iqu
e F
arm
lan
d3
,15
0
2,6
61
5
45
5
6
60
1
-48
9
Un
iqu
e F
arm
lan
d2
6
Fa
rmla
nd
of
Lo
ca
l Im
po
rta
nc
e2
,78
5
1,8
29
1
,23
4
27
8
1,5
12
-9
56
F
arm
lan
d o
f L
oc
al
Imp
ort
an
ce
93
IMP
OR
TA
NT
FA
RM
LA
ND
SU
BT
OT
AL
30
,91
9
25
,32
6
6,2
26
6
33
6
,85
9
-5,5
93
I
MP
OR
TA
NT
FA
RM
LA
ND
SU
BT
OT
AL
17
3
Gra
zin
g L
an
d
90
2,8
54
9
01
,66
6
5,8
81
4
,69
3
10
,57
4
-1,1
88
G
raz
ing
La
nd
1
2,6
74
AG
RIC
UL
TU
RA
L L
AN
D S
UB
TO
TA
L9
33
,77
3
92
6,9
92
1
2,1
07
5
,32
6
17
,43
3
-6,7
81
A
GR
ICU
LT
UR
AL
LA
ND
SU
BT
OT
AL
12
,84
7
Urb
an
an
d B
uil
t-u
p L
an
d2
68
,68
4
27
5,6
94
3
17
7
,32
2
7,6
39
7
,00
5
Urb
an
an
d B
uil
t-u
p L
an
d0
Oth
er
La
nd
24
6,6
36
2
46
,41
2
3,2
33
3
,00
9
6,2
42
-2
24
O
the
r L
an
d7
16
Wa
ter
Are
a4
49
4
49
0
0
0
0
W
ate
r A
rea
0
TO
TA
L A
RE
A I
NV
EN
TO
RIE
D (
1)
1,4
49
,54
2
1,4
49
,54
7
15
,65
7
15
,65
7
31
,31
4
0
TO
TA
L A
CR
EA
GE
RE
PO
RT
ED
13
,56
3
PA
RT
III
L
an
d U
se
Co
nv
ers
ion
fro
m 2
00
6 t
o 2
00
8F
arm
lan
d o
fF
arm
lan
d o
fS
ub
tota
lT
ota
lU
rba
n a
nd
To
tal
LA
ND
US
E C
AT
EG
OR
YP
rim
eS
tate
wid
eU
niq
ue
Lo
ca
lIm
po
rta
nt
Gra
zin
gA
gri
cu
ltu
ral
Bu
ilt-
up
Oth
er
Wa
ter
Co
nv
ert
ed
To
Fa
rmla
nd
Imp
ort
an
ce
Fa
rmla
nd
Imp
ort
an
ce
Fa
rmla
nd
La
nd
La
nd
La
nd
La
nd
Are
aA
no
the
r U
se
Pri
me
Fa
rmla
nd
(3
)to
: -
- 1
1
2
16
8
18
1
1,6
67
1
,84
8
97
4
26
3
0
3,0
85
Fa
rmla
nd
of
Sta
tew
ide
Im
po
rta
nc
e (
3)
to:
1
--
1
77
7
9
1,0
27
1
,10
6
19
0
66
0
1
,36
2
Un
iqu
e F
arm
lan
dto
:5
0
-
- 0
5
4
11
4
16
1
02
2
7
0
54
5
Fa
rmla
nd
of
Lo
ca
l Im
po
rta
nc
e (
3)
to:
0
0
3
--
3
1,1
59
1
,16
2
33
3
9
0
1,2
34
IMP
OR
TA
NT
FA
RM
LA
ND
SU
BT
OT
AL
6
1
16
2
45
2
68
4
,26
4
4,5
32
1
,29
9
39
5
0
6,2
26
Gra
zin
g L
an
d (
4)
to:
92
1
17
7
1
2
17
-
- 2
17
3
,24
9
2,4
15
0
5
,88
1
AG
RIC
UL
TU
RA
L L
AN
D S
UB
TO
TA
L9
8
11
8
23
2
46
4
85
4
,26
4
4,7
49
4
,54
8
2,8
10
0
1
2,1
07
Urb
an
an
d B
uil
t-u
p L
an
d (
5)
to:
2
1
16
0
1
9
99
1
18
-
- 1
99
0
3
17
Oth
er
La
nd
to:
28
5
2
17
3
2
12
9
33
0
45
9
2,7
74
-
- 0
3
,23
3
Wa
ter
Are
ato
:0
0
0
0
0
0
0
0
0
-
- 0
TO
TA
L A
CR
EA
GE
CO
NV
ER
TE
D
to:
12
8
17
1
56
2
78
6
33
4
,69
3
5,3
26
7
,32
2
3,0
09
0
1
5,6
57
20
08
Co
un
ty B
ou
nd
ary
Ad
jus
tme
nt
(1)
00
00
00
05
00
5
(1)
To
tal
Are
a I
nv
en
tori
ed
ch
an
ge
d i
n 2
00
8 d
ue
to
ad
op
tio
n o
f u
pd
ate
d c
ou
nty
bo
un
da
ry f
ile
; a
dja
ce
nt
co
un
tie
s g
ain
ed
or
los
t c
orr
es
po
nd
ing
ac
rea
ge
s.
Sta
tis
tic
s r
ep
res
en
tin
g t
his
ch
an
ge
are
sh
ow
n i
n s
ha
de
d c
ell
s i
n P
art
III
of
tab
le.
(2)
20
06
-08
Ac
rea
ge
Ch
an
ge
s c
alc
ula
tes
co
nv
ers
ion
s w
ith
in e
xis
tin
g m
ap
pe
d a
rea
; c
ou
nty
bo
un
da
ry a
dju
stm
en
t a
cre
ag
es
no
t in
clu
de
d.
(3)
Co
nv
ers
ion
to
Gra
zin
g L
an
d i
s d
ue
to
irr
iga
ted
fa
rmla
nd
an
d d
ry g
rain
s l
eft
id
le f
or
thre
e o
r m
ore
up
da
te c
yc
les
.
(4)
Co
nv
ers
ion
to
Oth
er
La
nd
pri
ma
rily
du
e t
o t
he
co
ns
tru
cti
on
of
low
-de
ns
ity
ho
us
ing
in
th
e M
oja
ve
De
se
rt p
art
of
the
co
un
ty.
(5)
Co
nv
ers
ion
fro
m U
rba
n a
nd
Bu
ilt-
up
La
nd
pri
ma
rily
th
e r
es
ult
of
the
us
e o
f d
eta
ile
d d
igit
al
ima
ge
ry t
o d
eli
ne
ate
mo
re d
isti
nc
t u
rba
n b
ou
nd
ari
es
.
Page 51

TA
BL
E A
-29
SA
N D
IEG
O C
OU
NT
Y
20
06
-20
08
La
nd
Us
e C
on
ve
rsio
nC
AL
IFO
RN
IA D
EP
AR
TM
EN
T O
F C
ON
SE
RV
AT
ION
Div
isio
n o
f L
an
d R
es
ou
rce
Pro
tec
tio
nF
arm
lan
d M
ap
pin
g a
nd
Mo
nit
ori
ng
Pro
gra
m
PA
RT
I
PA
RT
II
Co
un
ty S
um
ma
ry a
nd
Ch
an
ge
by
La
nd
Us
e C
ate
go
ryL
an
d C
om
mit
ted
to
No
na
gri
cu
ltu
ral
Us
e
20
06
-08
AC
RE
AG
E C
HA
NG
ES
T
OT
AL
AC
RE
AG
EA
CR
ES
AC
RE
ST
OT
AL
NE
T
TO
TA
L
LA
ND
US
E C
AT
EG
OR
YIN
VE
NT
OR
IED
LO
ST
GA
INE
DA
CR
EA
GE
AC
RE
AG
EL
AN
D U
SE
CA
TE
GO
RY
AC
RE
AG
E
20
06
20
08
(-)
(+)
CH
AN
GE
DC
HA
NG
ED
20
08
Pri
me
Fa
rmla
nd
8,2
51
7
,75
3
78
1
28
3
1,0
64
-4
98
P
rim
e F
arm
lan
d9
3
Fa
rmla
nd
of
Sta
tew
ide
Im
po
rta
nc
e1
0,9
60
1
0,4
11
8
42
2
93
1
,13
5
-54
9
Fa
rmla
nd
of
Sta
tew
ide
Im
po
rta
nc
e9
Un
iqu
e F
arm
lan
d5
3,2
51
5
1,9
75
2
,47
2
1,1
96
3
,66
8
-1,2
76
U
niq
ue
Fa
rmla
nd
13
4
Fa
rmla
nd
of
Lo
ca
l Im
po
rta
nc
e1
34
,89
2
15
3,1
87
4
,60
0
22
,89
5
27
,49
5
18
,29
5
Fa
rmla
nd
of
Lo
ca
l Im
po
rta
nc
e2
,10
6
IMP
OR
TA
NT
FA
RM
LA
ND
SU
BT
OT
AL
20
7,3
54
2
23
,32
6
8,6
95
2
4,6
67
3
3,3
62
1
5,9
72
I
MP
OR
TA
NT
FA
RM
LA
ND
SU
BT
OT
AL
2,3
42
Gra
zin
g L
an
d
10
6,6
79
1
26
,87
0
61
3
20
,80
4
21
,41
7
20
,19
1
Gra
zin
g L
an
d
1,9
43
AG
RIC
UL
TU
RA
L L
AN
D S
UB
TO
TA
L3
14
,03
3
35
0,1
96
9
,30
8
45
,47
1
54
,77
9
36
,16
3
AG
RIC
UL
TU
RA
L L
AN
D S
UB
TO
TA
L4
,28
5
Urb
an
an
d B
uil
t-u
p L
an
d3
45
,31
5
35
0,4
99
6
55
5
,83
9
6,4
94
5
,18
4
Urb
an
an
d B
uil
t-u
p L
an
d0
Oth
er
La
nd
1,4
94
,04
6
1,4
52
,69
9
45
,33
9
3,9
92
4
9,3
31
-4
1,3
47
O
the
r L
an
d3
,44
4
Wa
ter
Are
a1
3,2
98
1
3,2
98
0
0
0
0
W
ate
r A
rea
0
TO
TA
L A
RE
A I
NV
EN
TO
RIE
D
2,1
66
,69
2
2,1
66
,69
2
55
,30
2
55
,30
2
11
0,6
04
0
T
OT
AL
AC
RE
AG
E R
EP
OR
TE
D7
,72
9
PA
RT
III
L
an
d U
se
Co
nv
ers
ion
fro
m 2
00
6 t
o 2
00
8F
arm
lan
d o
fF
arm
lan
d o
fS
ub
tota
lT
ota
lU
rba
n a
nd
To
tal
LA
ND
US
E C
AT
EG
OR
YP
rim
eS
tate
wid
eU
niq
ue
Lo
ca
lIm
po
rta
nt
Gra
zin
gA
gri
cu
ltu
ral
Bu
ilt-
up
Oth
er
Wa
ter
Co
nv
ert
ed
To
Fa
rmla
nd
Imp
ort
an
ce
Fa
rmla
nd
Imp
ort
an
ce
Fa
rmla
nd
La
nd
La
nd
La
nd
La
nd
Are
aA
no
the
r U
se
Pri
me
Fa
rmla
nd
to:
--
1
15
4
92
5
08
0
5
08
1
39
1
34
0
7
81
Fa
rmla
nd
of
Sta
tew
ide
Im
po
rta
nc
eto
:3
-
- 4
5
52
3
57
1
1
57
2
93
1
77
0
8
42
Un
iqu
e F
arm
lan
d (
1)(
2)
to:
13
7
4
--
1,3
01
1
,38
8
4
1,3
92
1
09
9
71
0
2
,47
2
Fa
rmla
nd
of
Lo
ca
l Im
po
rta
nc
e (
3)
to:
33
1
15
6
66
-
- 8
14
2
1
83
5
1,7
91
1
,97
4
0
4,6
00
IMP
OR
TA
NT
FA
RM
LA
ND
SU
BT
OT
AL
49
1
90
7
26
2
,31
6
3,2
81
2
6
3,3
07
2
,13
2
3,2
56
0
8
,69
5
Gra
zin
g L
an
d
to:
0
0
9
42
5
1
--
51
3
62
2
00
0
6
13
AG
RIC
UL
TU
RA
L L
AN
D S
UB
TO
TA
L4
9
19
0
73
5
2,3
58
3
,33
2
26
3
,35
8
2,4
94
3
,45
6
0
9,3
08
Urb
an
an
d B
uil
t-u
p L
an
d (
4)
to:
9
0
8
55
7
2
47
1
19
-
- 5
36
0
6
55
Oth
er
La
nd
(5
)to
:2
25
1
03
4
53
2
0,4
82
2
1,2
63
2
0,7
31
4
1,9
94
3
,34
5
--
0
45
,33
9
Wa
ter
Are
ato
:0
0
0
0
0
0
0
0
0
-
- 0
TO
TA
L A
CR
EA
GE
CO
NV
ER
TE
D
to:
28
3
29
3
1,1
96
2
2,8
95
2
4,6
67
2
0,8
04
4
5,4
71
5
,83
9
3,9
92
0
5
5,3
02
(1)
Co
nv
ers
ion
to
Fa
rmla
nd
of
Sta
tew
ide
Im
po
rta
nc
e i
s d
ue
to
th
e d
eli
ne
ati
on
of
irri
ga
ted
ag
ric
ult
ure
th
at
ha
d p
rev
iou
sly
be
en
ma
pp
ed
as
po
tte
d p
lan
t n
urs
eri
es
.
(2)
Co
nv
ers
ion
to
Fa
rmla
nd
of
Lo
ca
l Im
po
rta
nc
e i
s p
rim
ari
ly d
ue
to
la
nd
le
ft i
dle
fo
r th
ree
or
mo
re u
pd
ate
cy
cle
s.
(3)
Co
nv
ers
ion
to
Oth
er
La
nd
is
pri
ma
rily
du
e t
o t
he
de
lin
ea
tio
n o
f lo
w-d
en
sit
y h
ou
sin
g t
hro
ug
ho
ut
the
co
un
ty.
(4)
Co
nv
ers
ion
fro
m U
rba
n a
nd
Bu
ilt-
Up
La
nd
pri
ma
rily
th
e r
es
ult
of
the
us
e o
f d
eta
ile
d d
igit
al
ima
ge
ry t
o d
eli
ne
ate
mo
re d
isti
nc
t u
rba
n b
ou
nd
ari
es
.
(5)
Du
e t
o a
co
mm
en
t fr
om
th
e S
an
Die
go
–Im
pe
ria
l C
att
lem
an
’s A
ss
oc
iati
on
, c
urr
en
t im
ag
ery
an
d S
an
GIS
ve
ge
tati
on
da
ta w
as
us
ed
as
a g
uid
e t
o m
ore
ac
cu
rate
ly d
ep
ict
the
ex
ten
t o
f G
raz
ing
La
nd
. T
his
re
su
lte
d i
n c
on
ve
rsio
ns
to
Gra
zin
g L
an
d a
nd
Fa
rmla
nd
of
Lo
ca
l Im
po
rta
nc
e,
de
pe
nd
ing
on
so
il t
yp
e.
Page 52

TA
BL
E A
-30
SA
N J
OA
QU
IN C
OU
NT
Y
20
06
-20
08
La
nd
Us
e C
on
ve
rsio
nC
AL
IFO
RN
IA D
EP
AR
TM
EN
T O
F C
ON
SE
RV
AT
ION
Div
isio
n o
f L
an
d R
es
ou
rce
Pro
tec
tio
nF
arm
lan
d M
ap
pin
g a
nd
Mo
nit
ori
ng
Pro
gra
m
PA
RT
I
PA
RT
II
Co
un
ty S
um
ma
ry a
nd
Ch
an
ge
by
La
nd
Us
e C
ate
go
ryL
an
d C
om
mit
ted
to
No
na
gri
cu
ltu
ral
Us
e
20
06
-08
AC
RE
AG
E C
HA
NG
ES
T
OT
AL
AC
RE
AG
EA
CR
ES
AC
RE
ST
OT
AL
NE
T
TO
TA
L
LA
ND
US
E C
AT
EG
OR
YIN
VE
NT
OR
IED
LO
ST
GA
INE
DA
CR
EA
GE
AC
RE
AG
EL
AN
D U
SE
CA
TE
GO
RY
AC
RE
AG
E
20
06
20
08
(-)
(+)
CH
AN
GE
DC
HA
NG
ED
20
08
Pri
me
Fa
rmla
nd
40
7,6
09
3
96
,98
5
11
,94
1
1,3
17
1
3,2
58
-1
0,6
24
P
rim
e F
arm
lan
d1
,66
8
Fa
rmla
nd
of
Sta
tew
ide
Im
po
rta
nc
e8
9,2
74
8
6,2
99
3
,51
7
54
2
4,0
59
-2
,97
5
Fa
rmla
nd
of
Sta
tew
ide
Im
po
rta
nc
e4
10
Un
iqu
e F
arm
lan
d6
3,2
32
6
6,6
24
1
,65
8
5,0
50
6
,70
8
3,3
92
U
niq
ue
Fa
rmla
nd
33
9
Fa
rmla
nd
of
Lo
ca
l Im
po
rta
nc
e5
9,9
65
6
5,7
88
5
,35
6
11
,17
9
16
,53
5
5,8
23
F
arm
lan
d o
f L
oc
al
Imp
ort
an
ce
1,4
06
IMP
OR
TA
NT
FA
RM
LA
ND
SU
BT
OT
AL
62
0,0
80
6
15
,69
6
22
,47
2
18
,08
8
40
,56
0
-4,3
84
I
MP
OR
TA
NT
FA
RM
LA
ND
SU
BT
OT
AL
3,8
23
Gra
zin
g L
an
d
14
4,9
33
1
42
,46
0
2,7
09
2
36
2
,94
5
-2,4
73
G
raz
ing
La
nd
0
AG
RIC
UL
TU
RA
L L
AN
D S
UB
TO
TA
L7
65
,01
3
75
8,1
56
2
5,1
81
1
8,3
24
4
3,5
05
-6
,85
7
AG
RIC
UL
TU
RA
L L
AN
D S
UB
TO
TA
L3
,82
3
Urb
an
an
d B
uil
t-u
p L
an
d8
7,8
32
9
0,5
30
3
27
3
,02
5
3,3
52
2
,69
8
Urb
an
an
d B
uil
t-u
p L
an
d0
Oth
er
La
nd
47
,98
2
52
,14
1
1,2
03
5
,36
2
6,5
65
4
,15
9
Oth
er
La
nd
56
9
Wa
ter
Are
a1
1,7
73
1
1,7
73
0
0
0
0
W
ate
r A
rea
0
TO
TA
L A
RE
A I
NV
EN
TO
RIE
D
91
2,6
00
9
12
,60
0
26
,71
1
26
,71
1
53
,42
2
0
TO
TA
L A
CR
EA
GE
RE
PO
RT
ED
4,3
92
PA
RT
III
L
an
d U
se
Co
nv
ers
ion
fro
m 2
00
6 t
o 2
00
8F
arm
lan
d o
fF
arm
lan
d o
fS
ub
tota
lT
ota
lU
rba
n a
nd
To
tal
LA
ND
US
E C
AT
EG
OR
YP
rim
eS
tate
wid
eU
niq
ue
Lo
ca
lIm
po
rta
nt
Gra
zin
gA
gri
cu
ltu
ral
Bu
ilt-
up
Oth
er
Wa
ter
Co
nv
ert
ed
To
Fa
rmla
nd
Imp
ort
an
ce
Fa
rmla
nd
Imp
ort
an
ce
Fa
rmla
nd
La
nd
La
nd
La
nd
La
nd
Are
aA
no
the
r U
se
Pri
me
Fa
rmla
nd
(1
)(2
)(3
)to
: -
- 1
1
62
8
,21
8
8,2
91
3
2
8,3
23
1
,32
0
2,2
98
0
1
1,9
41
Fa
rmla
nd
of
Sta
tew
ide
Im
po
rta
nc
e (
2)
to:
21
-
- 2
8
1,6
13
1
,66
2
8
1,6
70
9
13
9
34
0
3
,51
7
Un
iqu
e F
arm
lan
d (
2)
to:
27
3
-
- 1
,14
7
1,1
77
1
21
1
,29
8
30
3
30
0
1
,65
8
Fa
rmla
nd
of
Lo
ca
l Im
po
rta
nc
e (
3)(
4)
to:
53
0
33
1
2,7
03
-
- 3
,56
4
43
3
,60
7
45
6
1,2
93
0
5
,35
6
IMP
OR
TA
NT
FA
RM
LA
ND
SU
BT
OT
AL
57
8
34
5
2,7
93
1
0,9
78
1
4,6
94
2
04
1
4,8
98
2
,71
9
4,8
55
0
2
2,4
72
Gra
zin
g L
an
d (
4)
to:
96
1
2
,04
4
80
2
,22
1
--
2,2
21
1
4
47
4
0
2,7
09
AG
RIC
UL
TU
RA
L L
AN
D S
UB
TO
TA
L6
74
3
46
4
,83
7
11
,05
8
16
,91
5
20
4
17
,11
9
2,7
33
5
,32
9
0
25
,18
1
Urb
an
an
d B
uil
t-u
p L
an
d (
5)
to:
16
2
48
4
7
19
2
76
1
8
29
4
--
33
0
3
27
Oth
er
La
nd
to:
48
1
14
8
16
6
10
2
89
7
14
9
11
2
92
-
- 0
1
,20
3
Wa
ter
Are
ato
:0
0
0
0
0
0
0
0
0
-
- 0
TO
TA
L A
CR
EA
GE
CO
NV
ER
TE
D
to:
1,3
17
5
42
5
,05
0
11
,17
9
18
,08
8
23
6
18
,32
4
3,0
25
5
,36
2
0
26
,71
1
(1)
Co
nv
ers
ion
to
Un
iqu
e F
arm
lan
d i
s p
rim
ari
ly d
ue
to
th
e d
eli
ne
ati
on
of
po
tte
d p
lan
t n
urs
eri
es
.
(2)
Co
nv
ers
ion
to
Fa
rmla
nd
of
Lo
ca
l Im
po
rta
nc
e d
ue
to
la
nd
le
ft i
dle
or
lan
d u
se
d f
or
dry
lan
d g
rain
pro
du
cti
on
fo
r th
ree
or
mo
re u
pd
ate
cy
cle
s.
(3)
Co
nv
ers
ion
to
Oth
er
La
nd
du
e t
o d
eli
ne
ati
on
of
low
-de
ns
ity
ho
us
ing
, la
nd
le
ft i
dle
fo
r th
ree
or
mo
re u
pd
ate
cy
cle
s t
ha
t h
as
be
en
gra
de
d f
or
de
ve
lop
me
nt,
an
d m
inin
g e
xp
an
sio
ns
.
(4)
Co
nv
ers
ion
to
Un
iqu
e F
arm
lan
d i
s p
rim
ari
ly d
ue
to
th
e d
eli
ne
ati
on
of
ne
w i
rrig
ate
d c
rop
s,
orc
ha
rds
, a
nd
po
tte
d p
lan
t n
urs
eri
es
.
(5)
Co
nv
ers
ion
fro
m U
rba
n a
nd
Bu
ilt-
up
La
nd
pri
ma
rily
th
e r
es
ult
of
the
us
e o
f d
eta
ile
d d
igit
al
ima
ge
ry t
o d
eli
ne
ate
mo
re d
isti
nc
t u
rba
n b
ou
nd
ari
es
.
Page 53
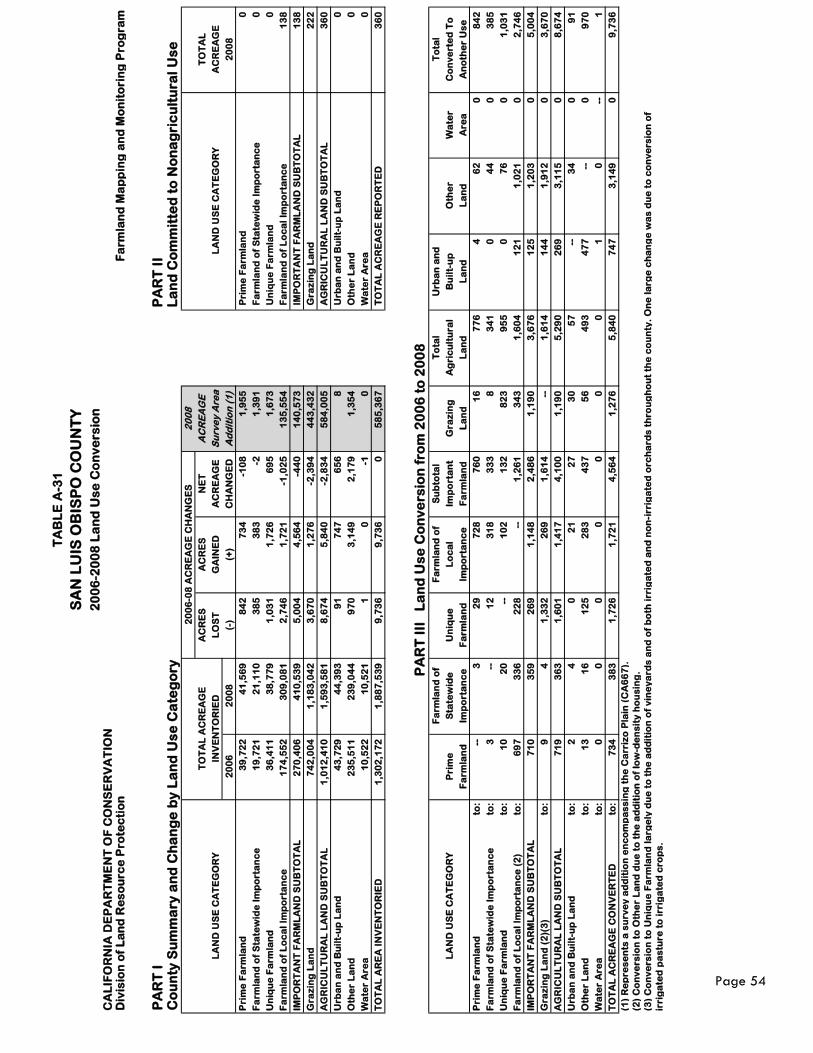
TA
BL
E A
-31
SA
N L
UIS
OB
ISP
O C
OU
NT
Y
20
06
-20
08
La
nd
Us
e C
on
ve
rsio
nC
AL
IFO
RN
IA D
EP
AR
TM
EN
T O
F C
ON
SE
RV
AT
ION
Div
isio
n o
f L
an
d R
es
ou
rce
Pro
tec
tio
nF
arm
lan
d M
ap
pin
g a
nd
Mo
nit
ori
ng
Pro
gra
m
PA
RT
I
PA
RT
II
Co
un
ty S
um
ma
ry a
nd
Ch
an
ge
by
La
nd
Us
e C
ate
go
ryL
an
d C
om
mit
ted
to
No
na
gri
cu
ltu
ral
Us
e
20
06
-08
AC
RE
AG
E C
HA
NG
ES
20
08
T
OT
AL
AC
RE
AG
EA
CR
ES
AC
RE
SN
ET
AC
RE
AG
E
TO
TA
L
LA
ND
US
E C
AT
EG
OR
YIN
VE
NT
OR
IED
LO
ST
GA
INE
DA
CR
EA
GE
Su
rve
y A
rea
LA
ND
US
E C
AT
EG
OR
YA
CR
EA
GE
20
06
20
08
(-)
(+)
CH
AN
GE
DA
dd
itio
n (
1)
20
08
Pri
me
Fa
rmla
nd
39
,72
2
41
,56
9
84
2
73
4
-10
8
1,9
55
P
rim
e F
arm
lan
d0
Fa
rmla
nd
of
Sta
tew
ide
Im
po
rta
nc
e1
9,7
21
2
1,1
10
3
85
3
83
-2
1
,39
1
Fa
rmla
nd
of
Sta
tew
ide
Im
po
rta
nc
e0
Un
iqu
e F
arm
lan
d3
6,4
11
3
8,7
79
1
,03
1
1,7
26
6
95
1
,67
3
Un
iqu
e F
arm
lan
d0
Fa
rmla
nd
of
Lo
ca
l Im
po
rta
nc
e1
74
,55
2
30
9,0
81
2
,74
6
1,7
21
-1
,02
5
13
5,5
54
F
arm
lan
d o
f L
oc
al
Imp
ort
an
ce
13
8
IMP
OR
TA
NT
FA
RM
LA
ND
SU
BT
OT
AL
27
0,4
06
4
10
,53
9
5,0
04
4
,56
4
-44
0
14
0,5
73
I
MP
OR
TA
NT
FA
RM
LA
ND
SU
BT
OT
AL
13
8
Gra
zin
g L
an
d
74
2,0
04
1
,18
3,0
42
3
,67
0
1,2
76
-2
,39
4
44
3,4
32
G
raz
ing
La
nd
2
22
AG
RIC
UL
TU
RA
L L
AN
D S
UB
TO
TA
L1
,01
2,4
10
1
,59
3,5
81
8
,67
4
5,8
40
-2
,83
4
58
4,0
05
A
GR
ICU
LT
UR
AL
LA
ND
SU
BT
OT
AL
36
0
Urb
an
an
d B
uil
t-u
p L
an
d4
3,7
29
4
4,3
93
9
1
74
7
65
6
8
Urb
an
an
d B
uil
t-u
p L
an
d0
Oth
er
La
nd
23
5,5
11
2
39
,04
4
97
0
3,1
49
2
,17
9
1,3
54
O
the
r L
an
d0
Wa
ter
Are
a1
0,5
22
1
0,5
21
1
0
-1
0
W
ate
r A
rea
0
TO
TA
L A
RE
A I
NV
EN
TO
RIE
D
1,3
02
,17
2
1,8
87
,53
9
9,7
36
9
,73
6
0
58
5,3
67
T
OT
AL
AC
RE
AG
E R
EP
OR
TE
D3
60
PA
RT
III
L
an
d U
se
Co
nv
ers
ion
fro
m 2
00
6 t
o 2
00
8F
arm
lan
d o
fF
arm
lan
d o
fS
ub
tota
lT
ota
lU
rba
n a
nd
To
tal
LA
ND
US
E C
AT
EG
OR
YP
rim
eS
tate
wid
eU
niq
ue
Lo
ca
lIm
po
rta
nt
Gra
zin
gA
gri
cu
ltu
ral
Bu
ilt-
up
Oth
er
Wa
ter
Co
nv
ert
ed
To
Fa
rmla
nd
Imp
ort
an
ce
Fa
rmla
nd
Imp
ort
an
ce
Fa
rmla
nd
La
nd
La
nd
La
nd
La
nd
Are
aA
no
the
r U
se
Pri
me
Fa
rmla
nd
to:
--
3
29
7
28
7
60
1
6
77
6
4
62
0
8
42
Fa
rmla
nd
of
Sta
tew
ide
Im
po
rta
nc
eto
:3
-
- 1
2
31
8
33
3
8
34
1
0
44
0
3
85
Un
iqu
e F
arm
lan
dto
:1
0
20
-
- 1
02
1
32
8
23
9
55
0
7
6
0
1,0
31
Fa
rmla
nd
of
Lo
ca
l Im
po
rta
nc
e (
2)
to:
69
7
33
6
22
8
--
1,2
61
3
43
1
,60
4
12
1
1,0
21
0
2
,74
6
IMP
OR
TA
NT
FA
RM
LA
ND
SU
BT
OT
AL
71
0
35
9
26
9
1,1
48
2
,48
6
1,1
90
3
,67
6
12
5
1,2
03
0
5
,00
4
Gra
zin
g L
an
d (
2)(
3)
to:
9
4
1,3
32
2
69
1
,61
4
--
1,6
14
1
44
1
,91
2
0
3,6
70
AG
RIC
UL
TU
RA
L L
AN
D S
UB
TO
TA
L7
19
3
63
1
,60
1
1,4
17
4
,10
0
1,1
90
5
,29
0
26
9
3,1
15
0
8
,67
4
Urb
an
an
d B
uil
t-u
p L
an
dto
:2
4
0
2
1
27
3
0
57
-
- 3
4
0
91
Oth
er
La
nd
to:
13
1
6
12
5
28
3
43
7
56
4
93
4
77
-
- 0
9
70
Wa
ter
Are
ato
:0
0
0
0
0
0
0
1
0
-
- 1
TO
TA
L A
CR
EA
GE
CO
NV
ER
TE
D
to:
73
4
38
3
1,7
26
1
,72
1
4,5
64
1
,27
6
5,8
40
7
47
3
,14
9
0
9,7
36
(1)
Re
pre
se
nts
a s
urv
ey
ad
dit
ion
en
co
mp
as
sin
g t
he
Ca
rriz
o P
lain
(C
A6
67
).
(2)
Co
nv
ers
ion
to
Oth
er
La
nd
du
e t
o t
he
ad
dit
ion
of
low
-de
ns
ity
ho
us
ing
.
(3)
Co
nv
ers
ion
to
Un
iqu
e F
arm
lan
d l
arg
ely
du
e t
o t
he
ad
dit
ion
of
vin
ey
ard
s a
nd
of
bo
th i
rrig
ate
d a
nd
no
n-i
rrig
ate
d o
rch
ard
s t
hro
ug
ho
ut
the
co
un
ty.
On
e l
arg
e c
ha
ng
e w
as
du
e t
o c
on
ve
rsio
n o
f
irri
ga
ted
pa
stu
re t
o i
rrig
ate
d c
rop
s.
Page 54

TA
BL
E A
-32
SA
N M
AT
EO
CO
UN
TY
20
06
-20
08
La
nd
Us
e C
on
ve
rsio
nC
AL
IFO
RN
IA D
EP
AR
TM
EN
T O
F C
ON
SE
RV
AT
ION
Div
isio
n o
f L
an
d R
es
ou
rce
Pro
tec
tio
nF
arm
lan
d M
ap
pin
g a
nd
Mo
nit
ori
ng
Pro
gra
m
PA
RT
I
PA
RT
II
Co
un
ty S
um
ma
ry a
nd
Ch
an
ge
by
La
nd
Us
e C
ate
go
ryL
an
d C
om
mit
ted
to
No
na
gri
cu
ltu
ral
Us
e
20
06
-08
AC
RE
AG
E C
HA
NG
ES
T
OT
AL
AC
RE
AG
EA
CR
ES
AC
RE
ST
OT
AL
NE
T
TO
TA
L
LA
ND
US
E C
AT
EG
OR
YIN
VE
NT
OR
IED
LO
ST
GA
INE
DA
CR
EA
GE
AC
RE
AG
EL
AN
D U
SE
CA
TE
GO
RY
AC
RE
AG
E
20
06
20
08
(-)
(+)
CH
AN
GE
DC
HA
NG
ED
20
08
Pri
me
Fa
rmla
nd
2,3
56
2
,22
2
18
1
47
2
28
-1
34
P
rim
e F
arm
lan
d0
Fa
rmla
nd
of
Sta
tew
ide
Im
po
rta
nc
e1
85
1
41
4
5
1
46
-4
4
Fa
rmla
nd
of
Sta
tew
ide
Im
po
rta
nc
e0
Un
iqu
e F
arm
lan
d2
,38
7
2,1
82
3
15
1
10
4
25
-2
05
U
niq
ue
Fa
rmla
nd
0
Fa
rmla
nd
of
Lo
ca
l Im
po
rta
nc
e3
,49
6
93
6
2,7
12
1
52
2
,86
4
-2,5
60
F
arm
lan
d o
f L
oc
al
Imp
ort
an
ce
0
IMP
OR
TA
NT
FA
RM
LA
ND
SU
BT
OT
AL
8,4
24
5
,48
1
3,2
53
3
10
3
,56
3
-2,9
43
I
MP
OR
TA
NT
FA
RM
LA
ND
SU
BT
OT
AL
0
Gra
zin
g L
an
d
46
,29
3
48
,95
8
21
3
2,8
78
3
,09
1
2,6
65
G
raz
ing
La
nd
2
49
AG
RIC
UL
TU
RA
L L
AN
D S
UB
TO
TA
L5
4,7
17
5
4,4
39
3
,46
6
3,1
88
6
,65
4
-27
8
AG
RIC
UL
TU
RA
L L
AN
D S
UB
TO
TA
L2
49
Urb
an
an
d B
uil
t-u
p L
an
d7
1,6
91
7
1,8
72
2
1
83
1
85
1
81
U
rba
n a
nd
Bu
ilt-
up
La
nd
0
Oth
er
La
nd
16
1,3
09
1
61
,40
6
25
7
35
4
61
1
97
O
the
r L
an
d3
10
Wa
ter
Are
a6
5,7
34
6
5,7
34
0
0
0
0
W
ate
r A
rea
0
TO
TA
L A
RE
A I
NV
EN
TO
RIE
D
35
3,4
51
3
53
,45
1
3,7
25
3
,72
5
7,4
50
0
T
OT
AL
AC
RE
AG
E R
EP
OR
TE
D5
59
PA
RT
III
L
an
d U
se
Co
nv
ers
ion
fro
m 2
00
6 t
o 2
00
8F
arm
lan
d o
fF
arm
lan
d o
fS
ub
tota
lT
ota
lU
rba
n a
nd
To
tal
LA
ND
US
E C
AT
EG
OR
YP
rim
eS
tate
wid
eU
niq
ue
Lo
ca
lIm
po
rta
nt
Gra
zin
gA
gri
cu
ltu
ral
Bu
ilt-
up
Oth
er
Wa
ter
Co
nv
ert
ed
To
Fa
rmla
nd
Imp
ort
an
ce
Fa
rmla
nd
Imp
ort
an
ce
Fa
rmla
nd
La
nd
La
nd
La
nd
La
nd
Are
aA
no
the
r U
se
Pri
me
Fa
rmla
nd
to:
--
0
4
0
4
74
7
8
5
98
0
1
81
Fa
rmla
nd
of
Sta
tew
ide
Im
po
rta
nc
eto
:0
-
- 0
0
0
3
9
39
0
6
0
4
5
Un
iqu
e F
arm
lan
dto
:1
0
1
--
0
11
1
47
1
58
9
1
48
0
3
15
Fa
rmla
nd
of
Lo
ca
l Im
po
rta
nc
e (
1)
to:
22
0
5
-
- 2
7
2,5
96
2
,62
3
3
86
0
2
,71
2
IMP
OR
TA
NT
FA
RM
LA
ND
SU
BT
OT
AL
32
1
9
0
4
2
2,8
56
2
,89
8
17
3
38
0
3
,25
3
Gra
zin
g L
an
d
to:
2
0
88
9
6
18
6
--
18
6
12
1
5
0
21
3
AG
RIC
UL
TU
RA
L L
AN
D S
UB
TO
TA
L3
4
1
97
9
6
22
8
2,8
56
3
,08
4
29
3
53
0
3
,46
6
Urb
an
an
d B
uil
t-u
p L
an
dto
:1
0
0
0
1
0
1
-
- 1
0
2
Oth
er
La
nd
to:
12
0
1
3
56
8
1
22
1
03
1
54
-
- 0
2
57
Wa
ter
Are
ato
:0
0
0
0
0
0
0
0
0
-
- 0
TO
TA
L A
CR
EA
GE
CO
NV
ER
TE
D
to:
47
1
1
10
1
52
3
10
2
,87
8
3,1
88
1
83
3
54
0
3
,72
5
(1)
Co
nv
ers
ion
fro
m F
arm
lan
d o
f L
oc
al
Imp
ort
an
ce
is
du
e t
o d
ry g
rain
are
as
le
ft i
dle
fo
r fo
ur
or
mo
re u
pd
ate
cy
cle
s.
Page 55
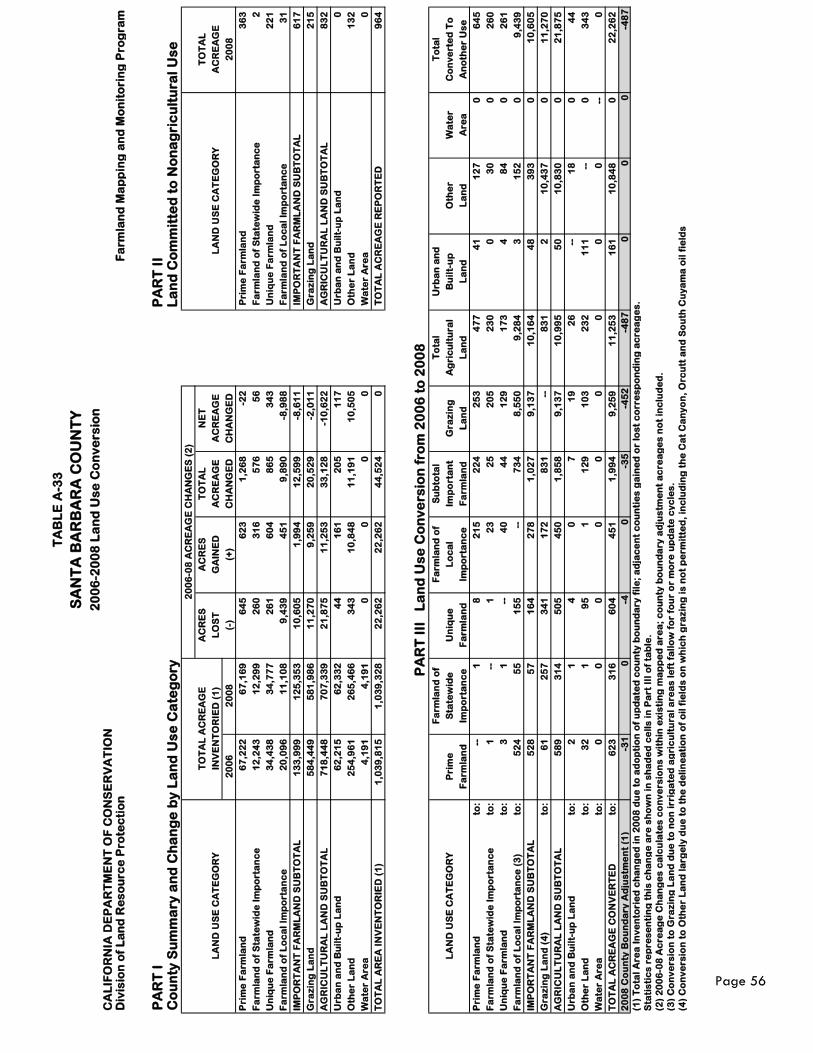
TA
BL
E A
-33
SA
NT
A B
AR
BA
RA
CO
UN
TY
20
06
-20
08
La
nd
Us
e C
on
ve
rsio
nC
AL
IFO
RN
IA D
EP
AR
TM
EN
T O
F C
ON
SE
RV
AT
ION
Div
isio
n o
f L
an
d R
es
ou
rce
Pro
tec
tio
nF
arm
lan
d M
ap
pin
g a
nd
Mo
nit
ori
ng
Pro
gra
m
PA
RT
I
PA
RT
II
Co
un
ty S
um
ma
ry a
nd
Ch
an
ge
by
La
nd
Us
e C
ate
go
ryL
an
d C
om
mit
ted
to
No
na
gri
cu
ltu
ral
Us
e
20
06
-08
AC
RE
AG
E C
HA
NG
ES
(2
)
T
OT
AL
AC
RE
AG
EA
CR
ES
AC
RE
ST
OT
AL
NE
T
TO
TA
L
LA
ND
US
E C
AT
EG
OR
YIN
VE
NT
OR
IED
(1
)L
OS
TG
AIN
ED
AC
RE
AG
EA
CR
EA
GE
LA
ND
US
E C
AT
EG
OR
YA
CR
EA
GE
20
06
20
08
(-)
(+)
CH
AN
GE
DC
HA
NG
ED
20
08
Pri
me
Fa
rmla
nd
67
,22
2
67
,16
9
64
5
62
3
1,2
68
-2
2
Pri
me
Fa
rmla
nd
36
3
Fa
rmla
nd
of
Sta
tew
ide
Im
po
rta
nc
e1
2,2
43
1
2,2
99
2
60
3
16
5
76
5
6
Fa
rmla
nd
of
Sta
tew
ide
Im
po
rta
nc
e2
Un
iqu
e F
arm
lan
d3
4,4
38
3
4,7
77
2
61
6
04
8
65
3
43
U
niq
ue
Fa
rmla
nd
22
1
Fa
rmla
nd
of
Lo
ca
l Im
po
rta
nc
e2
0,0
96
1
1,1
08
9
,43
9
45
1
9,8
90
-8
,98
8
Fa
rmla
nd
of
Lo
ca
l Im
po
rta
nc
e3
1
IMP
OR
TA
NT
FA
RM
LA
ND
SU
BT
OT
AL
13
3,9
99
1
25
,35
3
10
,60
5
1,9
94
1
2,5
99
-8
,61
1
IM
PO
RT
AN
T F
AR
ML
AN
D S
UB
TO
TA
L6
17
Gra
zin
g L
an
d
58
4,4
49
5
81
,98
6
11
,27
0
9,2
59
2
0,5
29
-2
,01
1
Gra
zin
g L
an
d
21
5
AG
RIC
UL
TU
RA
L L
AN
D S
UB
TO
TA
L7
18
,44
8
70
7,3
39
2
1,8
75
1
1,2
53
3
3,1
28
-1
0,6
22
A
GR
ICU
LT
UR
AL
LA
ND
SU
BT
OT
AL
83
2
Urb
an
an
d B
uil
t-u
p L
an
d6
2,2
15
6
2,3
32
4
4
16
1
20
5
11
7
Urb
an
an
d B
uil
t-u
p L
an
d0
Oth
er
La
nd
25
4,9
61
2
65
,46
6
34
3
10
,84
8
11
,19
1
10
,50
5
Oth
er
La
nd
13
2
Wa
ter
Are
a4
,19
1
4,1
91
0
0
0
0
W
ate
r A
rea
0
TO
TA
L A
RE
A I
NV
EN
TO
RIE
D (
1)
1,0
39
,81
5
1,0
39
,32
8
22
,26
2
22
,26
2
44
,52
4
0
TO
TA
L A
CR
EA
GE
RE
PO
RT
ED
96
4
PA
RT
III
L
an
d U
se
Co
nv
ers
ion
fro
m 2
00
6 t
o 2
00
8F
arm
lan
d o
fF
arm
lan
d o
fS
ub
tota
lT
ota
lU
rba
n a
nd
To
tal
LA
ND
US
E C
AT
EG
OR
YP
rim
eS
tate
wid
eU
niq
ue
Lo
ca
lIm
po
rta
nt
Gra
zin
gA
gri
cu
ltu
ral
Bu
ilt-
up
Oth
er
Wa
ter
Co
nv
ert
ed
To
Fa
rmla
nd
Imp
ort
an
ce
Fa
rmla
nd
Imp
ort
an
ce
Fa
rmla
nd
La
nd
La
nd
La
nd
La
nd
Are
aA
no
the
r U
se
Pri
me
Fa
rmla
nd
to:
--
1
8
21
5
22
4
25
3
47
7
41
1
27
0
6
45
Fa
rmla
nd
of
Sta
tew
ide
Im
po
rta
nc
eto
:1
-
- 1
2
3
25
2
05
2
30
0
3
0
0
26
0
Un
iqu
e F
arm
lan
dto
:3
1
-
- 4
0
44
1
29
1
73
4
8
4
0
26
1
Fa
rmla
nd
of
Lo
ca
l Im
po
rta
nc
e (
3)
to:
52
4
55
1
55
-
- 7
34
8
,55
0
9,2
84
3
1
52
0
9
,43
9
IMP
OR
TA
NT
FA
RM
LA
ND
SU
BT
OT
AL
52
8
57
1
64
2
78
1
,02
7
9,1
37
1
0,1
64
4
8
39
3
0
10
,60
5
Gra
zin
g L
an
d (
4)
to:
61
2
57
3
41
1
72
8
31
-
- 8
31
2
1
0,4
37
0
1
1,2
70
AG
RIC
UL
TU
RA
L L
AN
D S
UB
TO
TA
L5
89
3
14
5
05
4
50
1
,85
8
9,1
37
1
0,9
95
5
0
10
,83
0
0
21
,87
5
Urb
an
an
d B
uil
t-u
p L
an
dto
:2
1
4
0
7
1
9
26
-
- 1
8
0
44
Oth
er
La
nd
to:
32
1
9
5
1
12
9
10
3
23
2
11
1
--
0
34
3
Wa
ter
Are
ato
:0
0
0
0
0
0
0
0
0
-
- 0
TO
TA
L A
CR
EA
GE
CO
NV
ER
TE
D
to:
62
3
31
6
60
4
45
1
1,9
94
9
,25
9
11
,25
3
16
1
10
,84
8
0
22
,26
2
20
08
Co
un
ty B
ou
nd
ary
Ad
jus
tme
nt
(1)
-31
0-4
0-3
5-4
52
-48
70
00
-48
7
(1)
To
tal
Are
a I
nv
en
tori
ed
ch
an
ge
d i
n 2
00
8 d
ue
to
ad
op
tio
n o
f u
pd
ate
d c
ou
nty
bo
un
da
ry f
ile
; a
dja
ce
nt
co
un
tie
s g
ain
ed
or
los
t c
orr
es
po
nd
ing
ac
rea
ge
s.
Sta
tis
tic
s r
ep
res
en
tin
g t
his
ch
an
ge
are
sh
ow
n i
n s
ha
de
d c
ell
s i
n P
art
III
of
tab
le.
(2)
20
06
-08
Ac
rea
ge
Ch
an
ge
s c
alc
ula
tes
co
nv
ers
ion
s w
ith
in e
xis
tin
g m
ap
pe
d a
rea
; c
ou
nty
bo
un
da
ry a
dju
stm
en
t a
cre
ag
es
no
t in
clu
de
d.
(3)
Co
nv
ers
ion
to
Gra
zin
g L
an
d d
ue
to
no
n i
rrig
ate
d a
gri
cu
ltu
ral
are
as
le
ft f
all
ow
fo
r fo
ur
or
mo
re u
pd
ate
cy
cle
s.
(4)
Co
nv
ers
ion
to
Oth
er
La
nd
la
rge
ly d
ue
to
th
e d
eli
ne
ati
on
of
oil
fie
lds
on
wh
ich
gra
zin
g i
s n
ot
pe
rmit
ted
, in
clu
din
g t
he
Ca
t C
an
yo
n,
Orc
utt
an
d S
ou
th C
uy
am
a o
il f
ield
s
Page 56
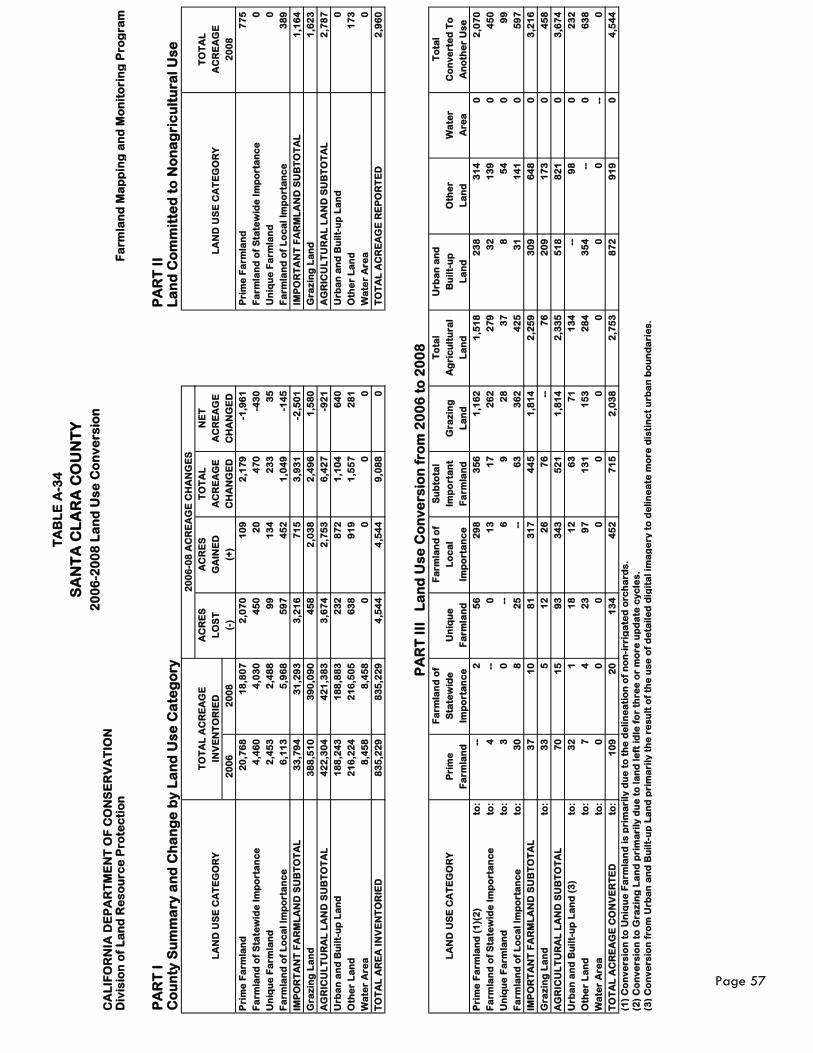
TA
BL
E A
-34
SA
NT
A C
LA
RA
CO
UN
TY
20
06
-20
08
La
nd
Us
e C
on
ve
rsio
nC
AL
IFO
RN
IA D
EP
AR
TM
EN
T O
F C
ON
SE
RV
AT
ION
Div
isio
n o
f L
an
d R
es
ou
rce
Pro
tec
tio
nF
arm
lan
d M
ap
pin
g a
nd
Mo
nit
ori
ng
Pro
gra
m
PA
RT
I
PA
RT
II
Co
un
ty S
um
ma
ry a
nd
Ch
an
ge
by
La
nd
Us
e C
ate
go
ryL
an
d C
om
mit
ted
to
No
na
gri
cu
ltu
ral
Us
e
20
06
-08
AC
RE
AG
E C
HA
NG
ES
T
OT
AL
AC
RE
AG
EA
CR
ES
AC
RE
ST
OT
AL
NE
T
TO
TA
L
LA
ND
US
E C
AT
EG
OR
YIN
VE
NT
OR
IED
LO
ST
GA
INE
DA
CR
EA
GE
AC
RE
AG
EL
AN
D U
SE
CA
TE
GO
RY
AC
RE
AG
E
20
06
20
08
(-)
(+)
CH
AN
GE
DC
HA
NG
ED
20
08
Pri
me
Fa
rmla
nd
20
,76
8
18
,80
7
2,0
70
1
09
2
,17
9
-1,9
61
P
rim
e F
arm
lan
d7
75
Fa
rmla
nd
of
Sta
tew
ide
Im
po
rta
nc
e4
,46
0
4,0
30
4
50
2
0
47
0
-43
0
Fa
rmla
nd
of
Sta
tew
ide
Im
po
rta
nc
e0
Un
iqu
e F
arm
lan
d2
,45
3
2,4
88
9
9
13
4
23
3
35
U
niq
ue
Fa
rmla
nd
0
Fa
rmla
nd
of
Lo
ca
l Im
po
rta
nc
e6
,11
3
5,9
68
5
97
4
52
1
,04
9
-14
5
Fa
rmla
nd
of
Lo
ca
l Im
po
rta
nc
e3
89
IMP
OR
TA
NT
FA
RM
LA
ND
SU
BT
OT
AL
33
,79
4
31
,29
3
3,2
16
7
15
3
,93
1
-2,5
01
I
MP
OR
TA
NT
FA
RM
LA
ND
SU
BT
OT
AL
1,1
64
Gra
zin
g L
an
d
38
8,5
10
3
90
,09
0
45
8
2,0
38
2
,49
6
1,5
80
G
raz
ing
La
nd
1
,62
3
AG
RIC
UL
TU
RA
L L
AN
D S
UB
TO
TA
L4
22
,30
4
42
1,3
83
3
,67
4
2,7
53
6
,42
7
-92
1
AG
RIC
UL
TU
RA
L L
AN
D S
UB
TO
TA
L2
,78
7
Urb
an
an
d B
uil
t-u
p L
an
d1
88
,24
3
18
8,8
83
2
32
8
72
1
,10
4
64
0
Urb
an
an
d B
uil
t-u
p L
an
d0
Oth
er
La
nd
21
6,2
24
2
16
,50
5
63
8
91
9
1,5
57
2
81
O
the
r L
an
d1
73
Wa
ter
Are
a8
,45
8
8,4
58
0
0
0
0
W
ate
r A
rea
0
TO
TA
L A
RE
A I
NV
EN
TO
RIE
D
83
5,2
29
8
35
,22
9
4,5
44
4
,54
4
9,0
88
0
T
OT
AL
AC
RE
AG
E R
EP
OR
TE
D2
,96
0
PA
RT
III
L
an
d U
se
Co
nv
ers
ion
fro
m 2
00
6 t
o 2
00
8F
arm
lan
d o
fF
arm
lan
d o
fS
ub
tota
lT
ota
lU
rba
n a
nd
To
tal
LA
ND
US
E C
AT
EG
OR
YP
rim
eS
tate
wid
eU
niq
ue
Lo
ca
lIm
po
rta
nt
Gra
zin
gA
gri
cu
ltu
ral
Bu
ilt-
up
Oth
er
Wa
ter
Co
nv
ert
ed
To
Fa
rmla
nd
Imp
ort
an
ce
Fa
rmla
nd
Imp
ort
an
ce
Fa
rmla
nd
La
nd
La
nd
La
nd
La
nd
Are
aA
no
the
r U
se
Pri
me
Fa
rmla
nd
(1
)(2
)to
: -
- 2
5
6
29
8
35
6
1,1
62
1
,51
8
23
8
31
4
0
2,0
70
Fa
rmla
nd
of
Sta
tew
ide
Im
po
rta
nc
eto
:4
-
- 0
1
3
17
2
62
2
79
3
2
13
9
0
45
0
Un
iqu
e F
arm
lan
dto
:3
0
-
- 6
9
2
8
37
8
5
4
0
99
Fa
rmla
nd
of
Lo
ca
l Im
po
rta
nc
eto
:3
0
8
25
-
- 6
3
36
2
42
5
31
1
41
0
5
97
IMP
OR
TA
NT
FA
RM
LA
ND
SU
BT
OT
AL
37
1
0
81
3
17
4
45
1
,81
4
2,2
59
3
09
6
48
0
3
,21
6
Gra
zin
g L
an
d
to:
33
5
1
2
26
7
6
--
76
2
09
1
73
0
4
58
AG
RIC
UL
TU
RA
L L
AN
D S
UB
TO
TA
L7
0
15
9
3
34
3
52
1
1,8
14
2
,33
5
51
8
82
1
0
3,6
74
Urb
an
an
d B
uil
t-u
p L
an
d (
3)
to:
32
1
1
8
12
6
3
71
1
34
-
- 9
8
0
23
2
Oth
er
La
nd
to:
7
4
23
9
7
13
1
15
3
28
4
35
4
--
0
63
8
Wa
ter
Are
ato
:0
0
0
0
0
0
0
0
0
-
- 0
TO
TA
L A
CR
EA
GE
CO
NV
ER
TE
D
to:
10
9
20
1
34
4
52
7
15
2
,03
8
2,7
53
8
72
9
19
0
4
,54
4
(1)
Co
nv
ers
ion
to
Un
iqu
e F
arm
lan
d i
s p
rim
ari
ly d
ue
to
th
e d
eli
ne
ati
on
of
no
n-i
rrig
ate
d o
rch
ard
s.
(2)
Co
nv
ers
ion
to
Gra
zin
g L
an
d p
rim
ari
ly d
ue
to
la
nd
le
ft i
dle
fo
r th
ree
or
mo
re u
pd
ate
cy
cle
s.
(3)
Co
nv
ers
ion
fro
m U
rba
n a
nd
Bu
ilt-
up
La
nd
pri
ma
rily
th
e r
es
ult
of
the
us
e o
f d
eta
ile
d d
igit
al
ima
ge
ry t
o d
eli
ne
ate
mo
re d
isti
nc
t u
rba
n b
ou
nd
ari
es
.
Page 57
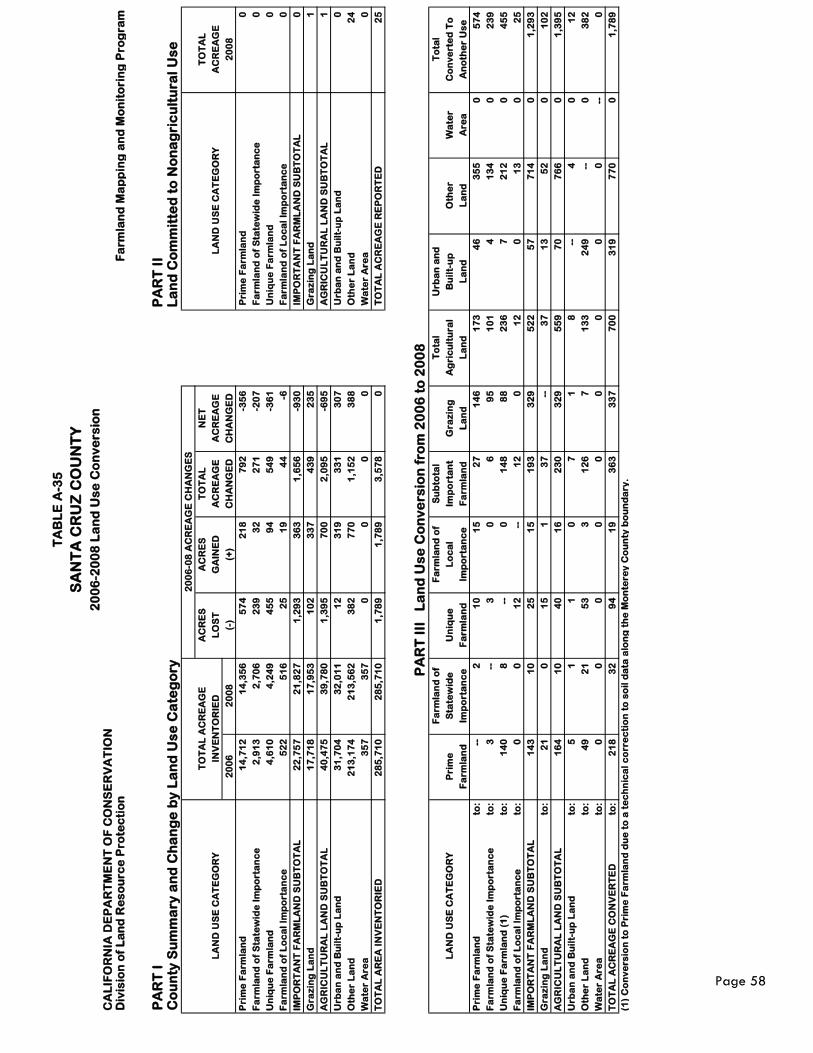
TA
BL
E A
-35
SA
NT
A C
RU
Z C
OU
NT
Y
20
06
-20
08
La
nd
Us
e C
on
ve
rsio
nC
AL
IFO
RN
IA D
EP
AR
TM
EN
T O
F C
ON
SE
RV
AT
ION
Div
isio
n o
f L
an
d R
es
ou
rce
Pro
tec
tio
nF
arm
lan
d M
ap
pin
g a
nd
Mo
nit
ori
ng
Pro
gra
m
PA
RT
I
PA
RT
II
Co
un
ty S
um
ma
ry a
nd
Ch
an
ge
by
La
nd
Us
e C
ate
go
ryL
an
d C
om
mit
ted
to
No
na
gri
cu
ltu
ral
Us
e
20
06
-08
AC
RE
AG
E C
HA
NG
ES
T
OT
AL
AC
RE
AG
EA
CR
ES
AC
RE
ST
OT
AL
NE
T
TO
TA
L
LA
ND
US
E C
AT
EG
OR
YIN
VE
NT
OR
IED
LO
ST
GA
INE
DA
CR
EA
GE
AC
RE
AG
EL
AN
D U
SE
CA
TE
GO
RY
AC
RE
AG
E
20
06
20
08
(-)
(+)
CH
AN
GE
DC
HA
NG
ED
20
08
Pri
me
Fa
rmla
nd
14
,71
2
14
,35
6
57
4
21
8
79
2
-35
6
Pri
me
Fa
rmla
nd
0
Fa
rmla
nd
of
Sta
tew
ide
Im
po
rta
nc
e2
,91
3
2,7
06
2
39
3
2
27
1
-20
7
Fa
rmla
nd
of
Sta
tew
ide
Im
po
rta
nc
e0
Un
iqu
e F
arm
lan
d4
,61
0
4,2
49
4
55
9
4
54
9
-36
1
Un
iqu
e F
arm
lan
d0
Fa
rmla
nd
of
Lo
ca
l Im
po
rta
nc
e5
22
5
16
2
5
19
4
4
-6
Fa
rmla
nd
of
Lo
ca
l Im
po
rta
nc
e0
IMP
OR
TA
NT
FA
RM
LA
ND
SU
BT
OT
AL
22
,75
7
21
,82
7
1,2
93
3
63
1
,65
6
-93
0
IM
PO
RT
AN
T F
AR
ML
AN
D S
UB
TO
TA
L0
Gra
zin
g L
an
d
17
,71
8
17
,95
3
10
2
33
7
43
9
23
5
Gra
zin
g L
an
d
1
AG
RIC
UL
TU
RA
L L
AN
D S
UB
TO
TA
L4
0,4
75
3
9,7
80
1
,39
5
70
0
2,0
95
-6
95
A
GR
ICU
LT
UR
AL
LA
ND
SU
BT
OT
AL
1
Urb
an
an
d B
uil
t-u
p L
an
d3
1,7
04
3
2,0
11
1
2
31
9
33
1
30
7
Urb
an
an
d B
uil
t-u
p L
an
d0
Oth
er
La
nd
21
3,1
74
2
13
,56
2
38
2
77
0
1,1
52
3
88
O
the
r L
an
d2
4
Wa
ter
Are
a3
57
3
57
0
0
0
0
W
ate
r A
rea
0
TO
TA
L A
RE
A I
NV
EN
TO
RIE
D
28
5,7
10
2
85
,71
0
1,7
89
1
,78
9
3,5
78
0
T
OT
AL
AC
RE
AG
E R
EP
OR
TE
D2
5
PA
RT
III
L
an
d U
se
Co
nv
ers
ion
fro
m 2
00
6 t
o 2
00
8F
arm
lan
d o
fF
arm
lan
d o
fS
ub
tota
lT
ota
lU
rba
n a
nd
To
tal
LA
ND
US
E C
AT
EG
OR
YP
rim
eS
tate
wid
eU
niq
ue
Lo
ca
lIm
po
rta
nt
Gra
zin
gA
gri
cu
ltu
ral
Bu
ilt-
up
Oth
er
Wa
ter
Co
nv
ert
ed
To
Fa
rmla
nd
Imp
ort
an
ce
Fa
rmla
nd
Imp
ort
an
ce
Fa
rmla
nd
La
nd
La
nd
La
nd
La
nd
Are
aA
no
the
r U
se
Pri
me
Fa
rmla
nd
to:
--
2
10
1
5
27
1
46
1
73
4
6
35
5
0
57
4
Fa
rmla
nd
of
Sta
tew
ide
Im
po
rta
nc
eto
:3
-
- 3
0
6
9
5
10
1
4
13
4
0
23
9
Un
iqu
e F
arm
lan
d (
1)
to:
14
0
8
--
0
14
8
88
2
36
7
2
12
0
4
55
Fa
rmla
nd
of
Lo
ca
l Im
po
rta
nc
eto
:0
0
1
2
--
12
0
1
2
0
13
0
2
5
IMP
OR
TA
NT
FA
RM
LA
ND
SU
BT
OT
AL
14
3
10
2
5
15
1
93
3
29
5
22
5
7
71
4
0
1,2
93
Gra
zin
g L
an
d
to:
21
0
1
5
1
37
-
- 3
7
13
5
2
0
10
2
AG
RIC
UL
TU
RA
L L
AN
D S
UB
TO
TA
L1
64
1
0
40
1
6
23
0
32
9
55
9
70
7
66
0
1
,39
5
Urb
an
an
d B
uil
t-u
p L
an
dto
:5
1
1
0
7
1
8
-
- 4
0
1
2
Oth
er
La
nd
to:
49
2
1
53
3
1
26
7
1
33
2
49
-
- 0
3
82
Wa
ter
Are
ato
:0
0
0
0
0
0
0
0
0
-
- 0
TO
TA
L A
CR
EA
GE
CO
NV
ER
TE
D
to:
21
8
32
9
4
19
3
63
3
37
7
00
3
19
7
70
0
1
,78
9
(1)
Co
nv
ers
ion
to
Pri
me
Fa
rmla
nd
du
e t
o a
te
ch
nic
al
co
rre
cti
on
to
so
il d
ata
alo
ng
th
e M
on
tere
y C
ou
nty
bo
un
da
ry.
Page 58
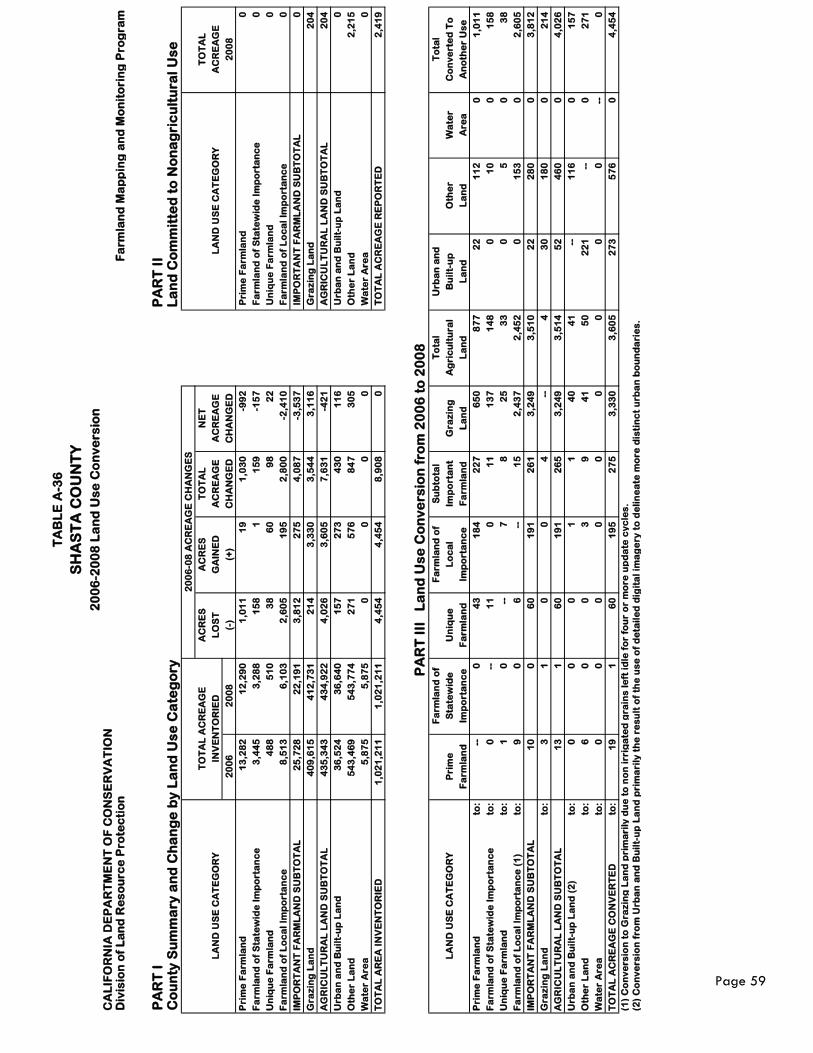
TA
BL
E A
-36
SH
AS
TA
CO
UN
TY
20
06
-20
08
La
nd
Us
e C
on
ve
rsio
nC
AL
IFO
RN
IA D
EP
AR
TM
EN
T O
F C
ON
SE
RV
AT
ION
Div
isio
n o
f L
an
d R
es
ou
rce
Pro
tec
tio
nF
arm
lan
d M
ap
pin
g a
nd
Mo
nit
ori
ng
Pro
gra
m
PA
RT
I
PA
RT
II
Co
un
ty S
um
ma
ry a
nd
Ch
an
ge
by
La
nd
Us
e C
ate
go
ryL
an
d C
om
mit
ted
to
No
na
gri
cu
ltu
ral
Us
e
20
06
-08
AC
RE
AG
E C
HA
NG
ES
T
OT
AL
AC
RE
AG
EA
CR
ES
AC
RE
ST
OT
AL
NE
T
TO
TA
L
LA
ND
US
E C
AT
EG
OR
YIN
VE
NT
OR
IED
LO
ST
GA
INE
DA
CR
EA
GE
AC
RE
AG
EL
AN
D U
SE
CA
TE
GO
RY
AC
RE
AG
E
20
06
20
08
(-)
(+)
CH
AN
GE
DC
HA
NG
ED
20
08
Pri
me
Fa
rmla
nd
13
,28
2
12
,29
0
1,0
11
1
9
1,0
30
-9
92
P
rim
e F
arm
lan
d0
Fa
rmla
nd
of
Sta
tew
ide
Im
po
rta
nc
e3
,44
5
3,2
88
1
58
1
1
59
-1
57
F
arm
lan
d o
f S
tate
wid
e I
mp
ort
an
ce
0
Un
iqu
e F
arm
lan
d4
88
5
10
3
8
60
9
8
22
U
niq
ue
Fa
rmla
nd
0
Fa
rmla
nd
of
Lo
ca
l Im
po
rta
nc
e8
,51
3
6,1
03
2
,60
5
19
5
2,8
00
-2
,41
0
Fa
rmla
nd
of
Lo
ca
l Im
po
rta
nc
e0
IMP
OR
TA
NT
FA
RM
LA
ND
SU
BT
OT
AL
25
,72
8
22
,19
1
3,8
12
2
75
4
,08
7
-3,5
37
I
MP
OR
TA
NT
FA
RM
LA
ND
SU
BT
OT
AL
0
Gra
zin
g L
an
d
40
9,6
15
4
12
,73
1
21
4
3,3
30
3
,54
4
3,1
16
G
raz
ing
La
nd
2
04
AG
RIC
UL
TU
RA
L L
AN
D S
UB
TO
TA
L4
35
,34
3
43
4,9
22
4
,02
6
3,6
05
7
,63
1
-42
1
AG
RIC
UL
TU
RA
L L
AN
D S
UB
TO
TA
L2
04
Urb
an
an
d B
uil
t-u
p L
an
d3
6,5
24
3
6,6
40
1
57
2
73
4
30
1
16
U
rba
n a
nd
Bu
ilt-
up
La
nd
0
Oth
er
La
nd
54
3,4
69
5
43
,77
4
27
1
57
6
84
7
30
5
Oth
er
La
nd
2,2
15
Wa
ter
Are
a5
,87
5
5,8
75
0
0
0
0
W
ate
r A
rea
0
TO
TA
L A
RE
A I
NV
EN
TO
RIE
D
1,0
21
,21
1
1,0
21
,21
1
4,4
54
4
,45
4
8,9
08
0
T
OT
AL
AC
RE
AG
E R
EP
OR
TE
D2
,41
9
PA
RT
III
L
an
d U
se
Co
nv
ers
ion
fro
m 2
00
6 t
o 2
00
8F
arm
lan
d o
fF
arm
lan
d o
fS
ub
tota
lT
ota
lU
rba
n a
nd
To
tal
LA
ND
US
E C
AT
EG
OR
YP
rim
eS
tate
wid
eU
niq
ue
Lo
ca
lIm
po
rta
nt
Gra
zin
gA
gri
cu
ltu
ral
Bu
ilt-
up
Oth
er
Wa
ter
Co
nv
ert
ed
To
Fa
rmla
nd
Imp
ort
an
ce
Fa
rmla
nd
Imp
ort
an
ce
Fa
rmla
nd
La
nd
La
nd
La
nd
La
nd
Are
aA
no
the
r U
se
Pri
me
Fa
rmla
nd
to:
--
0
43
1
84
2
27
6
50
8
77
2
2
11
2
0
1,0
11
Fa
rmla
nd
of
Sta
tew
ide
Im
po
rta
nc
eto
:0
-
- 1
1
0
11
1
37
1
48
0
1
0
0
15
8
Un
iqu
e F
arm
lan
dto
:1
0
-
- 7
8
2
5
33
0
5
0
3
8
Fa
rmla
nd
of
Lo
ca
l Im
po
rta
nc
e (
1)
to:
9
0
6
--
15
2
,43
7
2,4
52
0
1
53
0
2
,60
5
IMP
OR
TA
NT
FA
RM
LA
ND
SU
BT
OT
AL
10
0
6
0
19
1
26
1
3,2
49
3
,51
0
22
2
80
0
3
,81
2
Gra
zin
g L
an
d
to:
3
1
0
0
4
--
4
30
1
80
0
2
14
AG
RIC
UL
TU
RA
L L
AN
D S
UB
TO
TA
L1
3
1
60
1
91
2
65
3
,24
9
3,5
14
5
2
46
0
0
4,0
26
Urb
an
an
d B
uil
t-u
p L
an
d (
2)
to:
0
0
0
1
1
40
4
1
--
11
6
0
15
7
Oth
er
La
nd
to:
6
0
0
3
9
41
5
0
22
1
--
0
27
1
Wa
ter
Are
ato
:0
0
0
0
0
0
0
0
0
-
- 0
TO
TA
L A
CR
EA
GE
CO
NV
ER
TE
D
to:
19
1
6
0
19
5
27
5
3,3
30
3
,60
5
27
3
57
6
0
4,4
54
(1)
Co
nv
ers
ion
to
Gra
zin
g L
an
d p
rim
ari
ly d
ue
to
no
n i
rrig
ate
d g
rain
s l
eft
id
le f
or
fou
r o
r m
ore
up
da
te c
yc
les
.
(2)
Co
nv
ers
ion
fro
m U
rba
n a
nd
Bu
ilt-
up
La
nd
pri
ma
rily
th
e r
es
ult
of
the
us
e o
f d
eta
ile
d d
igit
al
ima
ge
ry t
o d
eli
ne
ate
mo
re d
isti
nc
t u
rba
n b
ou
nd
ari
es
.
Page 59
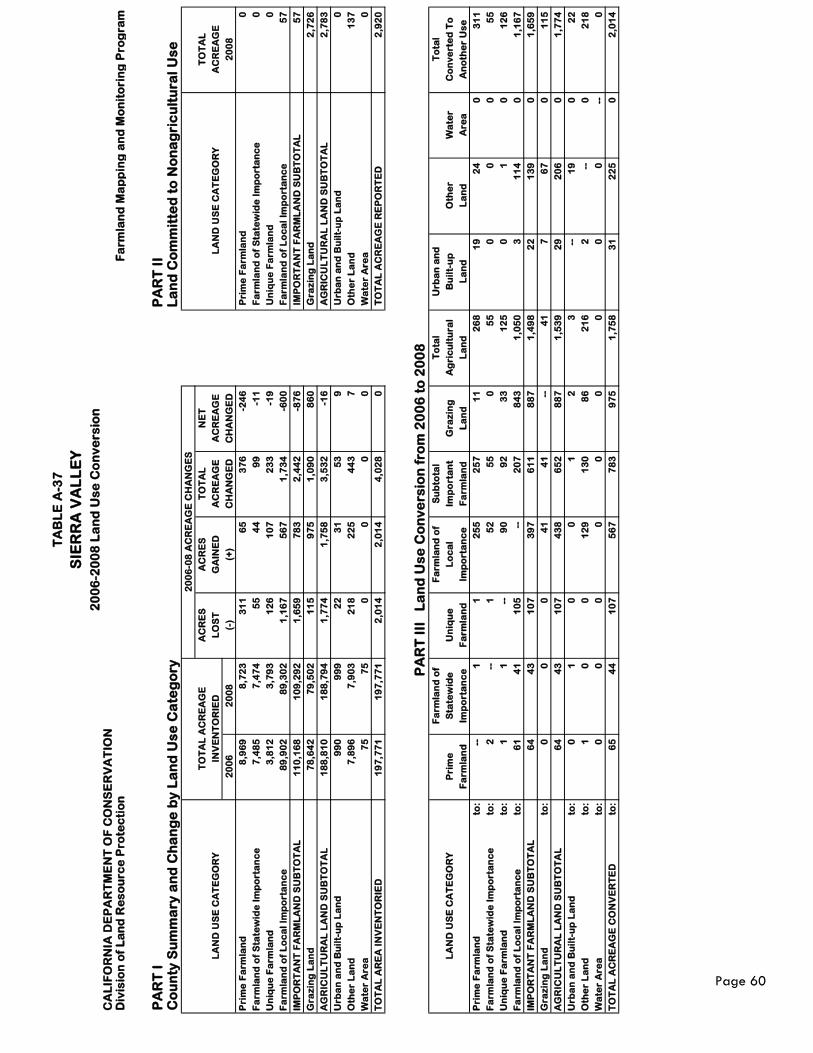
TA
BL
E A
-37
SIE
RR
A V
AL
LE
Y
20
06
-20
08
La
nd
Us
e C
on
ve
rsio
nC
AL
IFO
RN
IA D
EP
AR
TM
EN
T O
F C
ON
SE
RV
AT
ION
Div
isio
n o
f L
an
d R
es
ou
rce
Pro
tec
tio
nF
arm
lan
d M
ap
pin
g a
nd
Mo
nit
ori
ng
Pro
gra
m
PA
RT
I
PA
RT
II
Co
un
ty S
um
ma
ry a
nd
Ch
an
ge
by
La
nd
Us
e C
ate
go
ryL
an
d C
om
mit
ted
to
No
na
gri
cu
ltu
ral
Us
e
20
06
-08
AC
RE
AG
E C
HA
NG
ES
T
OT
AL
AC
RE
AG
EA
CR
ES
AC
RE
ST
OT
AL
NE
T
TO
TA
L
LA
ND
US
E C
AT
EG
OR
YIN
VE
NT
OR
IED
LO
ST
GA
INE
DA
CR
EA
GE
AC
RE
AG
EL
AN
D U
SE
CA
TE
GO
RY
AC
RE
AG
E
20
06
20
08
(-)
(+)
CH
AN
GE
DC
HA
NG
ED
20
08
Pri
me
Fa
rmla
nd
8,9
69
8
,72
3
31
1
65
3
76
-2
46
P
rim
e F
arm
lan
d0
Fa
rmla
nd
of
Sta
tew
ide
Im
po
rta
nc
e7
,48
5
7,4
74
5
5
44
9
9
-11
F
arm
lan
d o
f S
tate
wid
e I
mp
ort
an
ce
0
Un
iqu
e F
arm
lan
d3
,81
2
3,7
93
1
26
1
07
2
33
-1
9
Un
iqu
e F
arm
lan
d0
Fa
rmla
nd
of
Lo
ca
l Im
po
rta
nc
e8
9,9
02
8
9,3
02
1
,16
7
56
7
1,7
34
-6
00
F
arm
lan
d o
f L
oc
al
Imp
ort
an
ce
57
IMP
OR
TA
NT
FA
RM
LA
ND
SU
BT
OT
AL
11
0,1
68
1
09
,29
2
1,6
59
7
83
2
,44
2
-87
6
IM
PO
RT
AN
T F
AR
ML
AN
D S
UB
TO
TA
L5
7
Gra
zin
g L
an
d
78
,64
2
79
,50
2
11
5
97
5
1,0
90
8
60
G
raz
ing
La
nd
2
,72
6
AG
RIC
UL
TU
RA
L L
AN
D S
UB
TO
TA
L1
88
,81
0
18
8,7
94
1
,77
4
1,7
58
3
,53
2
-16
A
GR
ICU
LT
UR
AL
LA
ND
SU
BT
OT
AL
2,7
83
Urb
an
an
d B
uil
t-u
p L
an
d9
90
9
99
2
2
31
5
3
9
Urb
an
an
d B
uil
t-u
p L
an
d0
Oth
er
La
nd
7,8
96
7
,90
3
21
8
22
5
44
3
7
Oth
er
La
nd
13
7
Wa
ter
Are
a7
5
75
0
0
0
0
W
ate
r A
rea
0
TO
TA
L A
RE
A I
NV
EN
TO
RIE
D
19
7,7
71
1
97
,77
1
2,0
14
2
,01
4
4,0
28
0
T
OT
AL
AC
RE
AG
E R
EP
OR
TE
D2
,92
0
PA
RT
III
L
an
d U
se
Co
nv
ers
ion
fro
m 2
00
6 t
o 2
00
8F
arm
lan
d o
fF
arm
lan
d o
fS
ub
tota
lT
ota
lU
rba
n a
nd
To
tal
LA
ND
US
E C
AT
EG
OR
YP
rim
eS
tate
wid
eU
niq
ue
Lo
ca
lIm
po
rta
nt
Gra
zin
gA
gri
cu
ltu
ral
Bu
ilt-
up
Oth
er
Wa
ter
Co
nv
ert
ed
To
Fa
rmla
nd
Imp
ort
an
ce
Fa
rmla
nd
Imp
ort
an
ce
Fa
rmla
nd
La
nd
La
nd
La
nd
La
nd
Are
aA
no
the
r U
se
Pri
me
Fa
rmla
nd
to:
--
1
1
25
5
25
7
11
2
68
1
9
24
0
3
11
Fa
rmla
nd
of
Sta
tew
ide
Im
po
rta
nc
eto
:2
-
- 1
5
2
55
0
5
5
0
0
0
55
Un
iqu
e F
arm
lan
dto
:1
1
-
- 9
0
92
3
3
12
5
0
1
0
12
6
Fa
rmla
nd
of
Lo
ca
l Im
po
rta
nc
eto
:6
1
41
1
05
-
- 2
07
8
43
1
,05
0
3
11
4
0
1,1
67
IMP
OR
TA
NT
FA
RM
LA
ND
SU
BT
OT
AL
64
4
3
10
7
39
7
61
1
88
7
1,4
98
2
2
13
9
0
1,6
59
Gra
zin
g L
an
d
to:
0
0
0
41
4
1
--
41
7
6
7
0
11
5
AG
RIC
UL
TU
RA
L L
AN
D S
UB
TO
TA
L6
4
43
1
07
4
38
6
52
8
87
1
,53
9
29
2
06
0
1
,77
4
Urb
an
an
d B
uil
t-u
p L
an
dto
:0
1
0
0
1
2
3
-
- 1
9
0
22
Oth
er
La
nd
to:
1
0
0
12
9
13
0
86
2
16
2
-
- 0
2
18
Wa
ter
Are
ato
:0
0
0
0
0
0
0
0
0
-
- 0
TO
TA
L A
CR
EA
GE
CO
NV
ER
TE
D
to:
65
4
4
10
7
56
7
78
3
97
5
1,7
58
3
1
22
5
0
2,0
14
Page 60
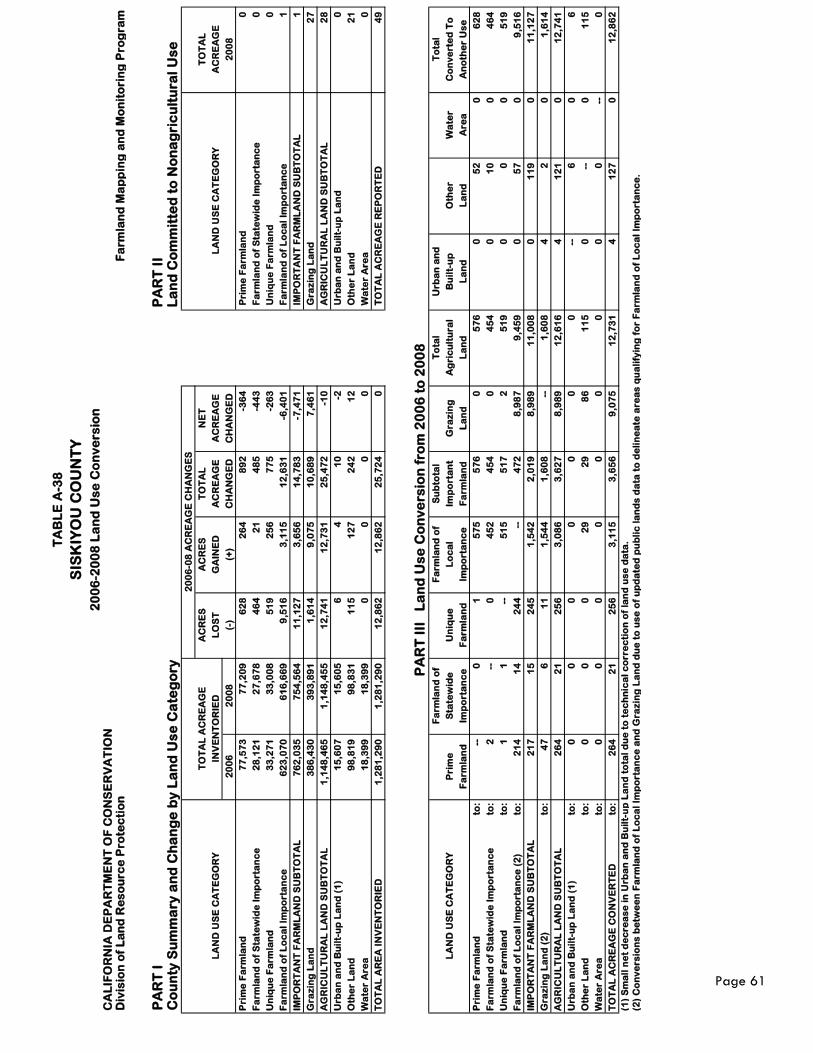
TA
BL
E A
-38
SIS
KIY
OU
CO
UN
TY
20
06
-20
08
La
nd
Us
e C
on
ve
rsio
nC
AL
IFO
RN
IA D
EP
AR
TM
EN
T O
F C
ON
SE
RV
AT
ION
Div
isio
n o
f L
an
d R
es
ou
rce
Pro
tec
tio
nF
arm
lan
d M
ap
pin
g a
nd
Mo
nit
ori
ng
Pro
gra
m
PA
RT
I
PA
RT
II
Co
un
ty S
um
ma
ry a
nd
Ch
an
ge
by
La
nd
Us
e C
ate
go
ryL
an
d C
om
mit
ted
to
No
na
gri
cu
ltu
ral
Us
e
20
06
-08
AC
RE
AG
E C
HA
NG
ES
T
OT
AL
AC
RE
AG
EA
CR
ES
AC
RE
ST
OT
AL
NE
T
TO
TA
L
LA
ND
US
E C
AT
EG
OR
YIN
VE
NT
OR
IED
LO
ST
GA
INE
DA
CR
EA
GE
AC
RE
AG
EL
AN
D U
SE
CA
TE
GO
RY
AC
RE
AG
E
20
06
20
08
(-)
(+)
CH
AN
GE
DC
HA
NG
ED
20
08
Pri
me
Fa
rmla
nd
77
,57
3
77
,20
9
62
8
26
4
89
2
-36
4
Pri
me
Fa
rmla
nd
0
Fa
rmla
nd
of
Sta
tew
ide
Im
po
rta
nc
e2
8,1
21
2
7,6
78
4
64
2
1
48
5
-44
3
Fa
rmla
nd
of
Sta
tew
ide
Im
po
rta
nc
e0
Un
iqu
e F
arm
lan
d3
3,2
71
3
3,0
08
5
19
2
56
7
75
-2
63
U
niq
ue
Fa
rmla
nd
0
Fa
rmla
nd
of
Lo
ca
l Im
po
rta
nc
e6
23
,07
0
61
6,6
69
9
,51
6
3,1
15
1
2,6
31
-6
,40
1
Fa
rmla
nd
of
Lo
ca
l Im
po
rta
nc
e1
IMP
OR
TA
NT
FA
RM
LA
ND
SU
BT
OT
AL
76
2,0
35
7
54
,56
4
11
,12
7
3,6
56
1
4,7
83
-7
,47
1
IM
PO
RT
AN
T F
AR
ML
AN
D S
UB
TO
TA
L1
Gra
zin
g L
an
d
38
6,4
30
3
93
,89
1
1,6
14
9
,07
5
10
,68
9
7,4
61
G
raz
ing
La
nd
2
7
AG
RIC
UL
TU
RA
L L
AN
D S
UB
TO
TA
L1
,14
8,4
65
1
,14
8,4
55
1
2,7
41
1
2,7
31
2
5,4
72
-1
0
AG
RIC
UL
TU
RA
L L
AN
D S
UB
TO
TA
L2
8
Urb
an
an
d B
uil
t-u
p L
an
d (
1)
15
,60
7
15
,60
5
6
4
10
-2
U
rba
n a
nd
Bu
ilt-
up
La
nd
0
Oth
er
La
nd
98
,81
9
98
,83
1
11
5
12
7
24
2
12
O
the
r L
an
d2
1
Wa
ter
Are
a1
8,3
99
1
8,3
99
0
0
0
0
W
ate
r A
rea
0
TO
TA
L A
RE
A I
NV
EN
TO
RIE
D
1,2
81
,29
0
1,2
81
,29
0
12
,86
2
12
,86
2
25
,72
4
0
TO
TA
L A
CR
EA
GE
RE
PO
RT
ED
49
PA
RT
III
L
an
d U
se
Co
nv
ers
ion
fro
m 2
00
6 t
o 2
00
8F
arm
lan
d o
fF
arm
lan
d o
fS
ub
tota
lT
ota
lU
rba
n a
nd
To
tal
LA
ND
US
E C
AT
EG
OR
YP
rim
eS
tate
wid
eU
niq
ue
Lo
ca
lIm
po
rta
nt
Gra
zin
gA
gri
cu
ltu
ral
Bu
ilt-
up
Oth
er
Wa
ter
Co
nv
ert
ed
To
Fa
rmla
nd
Imp
ort
an
ce
Fa
rmla
nd
Imp
ort
an
ce
Fa
rmla
nd
La
nd
La
nd
La
nd
La
nd
Are
aA
no
the
r U
se
Pri
me
Fa
rmla
nd
to:
--
0
1
57
5
57
6
0
57
6
0
52
0
6
28
Fa
rmla
nd
of
Sta
tew
ide
Im
po
rta
nc
eto
:2
-
- 0
4
52
4
54
0
4
54
0
1
0
0
46
4
Un
iqu
e F
arm
lan
dto
:1
1
-
- 5
15
5
17
2
5
19
0
0
0
5
19
Fa
rmla
nd
of
Lo
ca
l Im
po
rta
nc
e (
2)
to:
21
4
14
2
44
-
- 4
72
8
,98
7
9,4
59
0
5
7
0
9,5
16
IMP
OR
TA
NT
FA
RM
LA
ND
SU
BT
OT
AL
21
7
15
2
45
1
,54
2
2,0
19
8
,98
9
11
,00
8
0
11
9
0
11
,12
7
Gra
zin
g L
an
d (
2)
to:
47
6
1
1
1,5
44
1
,60
8
--
1,6
08
4
2
0
1
,61
4
AG
RIC
UL
TU
RA
L L
AN
D S
UB
TO
TA
L2
64
2
1
25
6
3,0
86
3
,62
7
8,9
89
1
2,6
16
4
1
21
0
1
2,7
41
Urb
an
an
d B
uil
t-u
p L
an
d (
1)
to:
0
0
0
0
0
0
0
--
6
0
6
Oth
er
La
nd
to:
0
0
0
29
2
9
86
1
15
0
-
- 0
1
15
Wa
ter
Are
ato
:0
0
0
0
0
0
0
0
0
-
- 0
TO
TA
L A
CR
EA
GE
CO
NV
ER
TE
D
to:
26
4
21
2
56
3
,11
5
3,6
56
9
,07
5
12
,73
1
4
12
7
0
12
,86
2
(1)
Sm
all
ne
t d
ec
rea
se
in
Urb
an
an
d B
uil
t-u
p L
an
d t
ota
l d
ue
to
te
ch
nic
al
co
rre
cti
on
of
lan
d u
se
da
ta.
(2)
Co
nv
ers
ion
s b
etw
ee
n F
arm
lan
d o
f L
oc
al
Imp
ort
an
ce
an
d G
raz
ing
La
nd
du
e t
o u
se
of
up
da
ted
pu
bli
c l
an
ds
da
ta t
o d
eli
ne
ate
are
as
qu
ali
fyin
g f
or
Fa
rmla
nd
of
Lo
ca
l Im
po
rta
nc
e.
Page 61
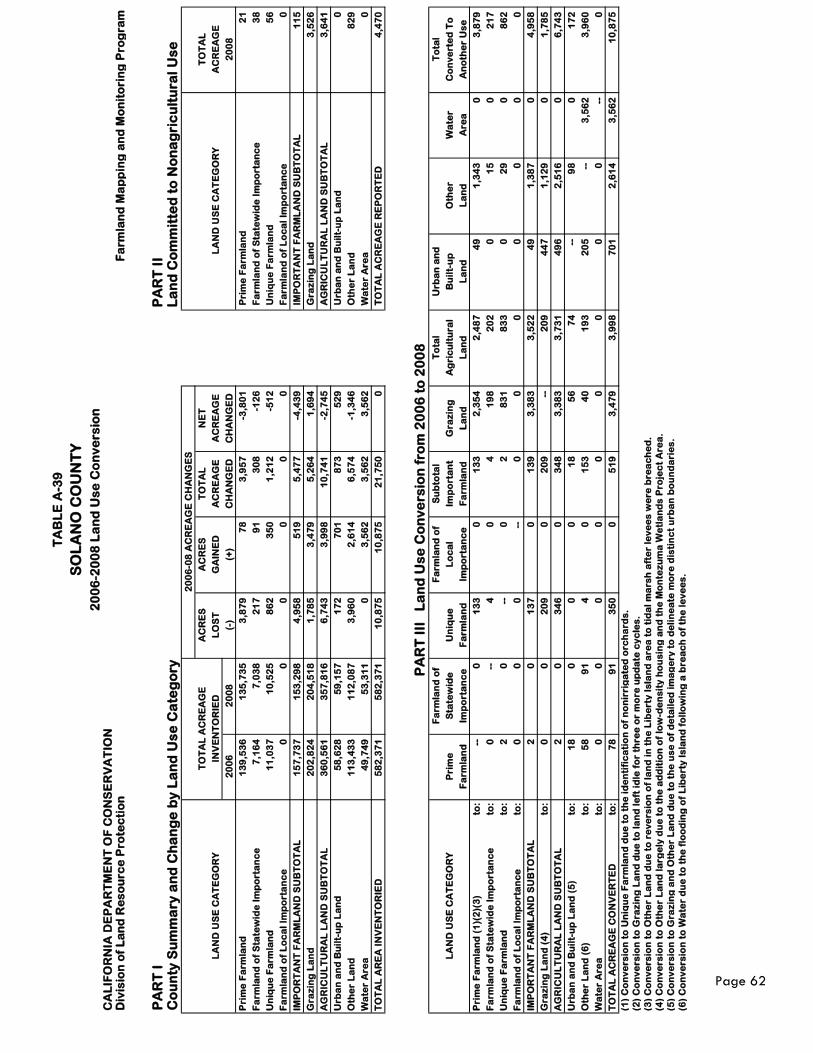
TA
BL
E A
-39
SO
LA
NO
CO
UN
TY
20
06
-20
08
La
nd
Us
e C
on
ve
rsio
nC
AL
IFO
RN
IA D
EP
AR
TM
EN
T O
F C
ON
SE
RV
AT
ION
Div
isio
n o
f L
an
d R
es
ou
rce
Pro
tec
tio
nF
arm
lan
d M
ap
pin
g a
nd
Mo
nit
ori
ng
Pro
gra
m
PA
RT
I
PA
RT
II
Co
un
ty S
um
ma
ry a
nd
Ch
an
ge
by
La
nd
Us
e C
ate
go
ryL
an
d C
om
mit
ted
to
No
na
gri
cu
ltu
ral
Us
e
20
06
-08
AC
RE
AG
E C
HA
NG
ES
T
OT
AL
AC
RE
AG
EA
CR
ES
AC
RE
ST
OT
AL
NE
T
TO
TA
L
LA
ND
US
E C
AT
EG
OR
YIN
VE
NT
OR
IED
LO
ST
GA
INE
DA
CR
EA
GE
AC
RE
AG
EL
AN
D U
SE
CA
TE
GO
RY
AC
RE
AG
E
20
06
20
08
(-)
(+)
CH
AN
GE
DC
HA
NG
ED
20
08
Pri
me
Fa
rmla
nd
13
9,5
36
1
35
,73
5
3,8
79
7
8
3,9
57
-3
,80
1
Pri
me
Fa
rmla
nd
21
Fa
rmla
nd
of
Sta
tew
ide
Im
po
rta
nc
e7
,16
4
7,0
38
2
17
9
1
30
8
-12
6
Fa
rmla
nd
of
Sta
tew
ide
Im
po
rta
nc
e3
8
Un
iqu
e F
arm
lan
d1
1,0
37
1
0,5
25
8
62
3
50
1
,21
2
-51
2
Un
iqu
e F
arm
lan
d5
6
Fa
rmla
nd
of
Lo
ca
l Im
po
rta
nc
e0
0
0
0
0
0
F
arm
lan
d o
f L
oc
al
Imp
ort
an
ce
0
IMP
OR
TA
NT
FA
RM
LA
ND
SU
BT
OT
AL
15
7,7
37
1
53
,29
8
4,9
58
5
19
5
,47
7
-4,4
39
I
MP
OR
TA
NT
FA
RM
LA
ND
SU
BT
OT
AL
11
5
Gra
zin
g L
an
d
20
2,8
24
2
04
,51
8
1,7
85
3
,47
9
5,2
64
1
,69
4
Gra
zin
g L
an
d
3,5
26
AG
RIC
UL
TU
RA
L L
AN
D S
UB
TO
TA
L3
60
,56
1
35
7,8
16
6
,74
3
3,9
98
1
0,7
41
-2
,74
5
AG
RIC
UL
TU
RA
L L
AN
D S
UB
TO
TA
L3
,64
1
Urb
an
an
d B
uil
t-u
p L
an
d5
8,6
28
5
9,1
57
1
72
7
01
8
73
5
29
U
rba
n a
nd
Bu
ilt-
up
La
nd
0
Oth
er
La
nd
11
3,4
33
1
12
,08
7
3,9
60
2
,61
4
6,5
74
-1
,34
6
Oth
er
La
nd
82
9
Wa
ter
Are
a4
9,7
49
5
3,3
11
0
3
,56
2
3,5
62
3
,56
2
Wa
ter
Are
a0
TO
TA
L A
RE
A I
NV
EN
TO
RIE
D
58
2,3
71
5
82
,37
1
10
,87
5
10
,87
5
21
,75
0
0
TO
TA
L A
CR
EA
GE
RE
PO
RT
ED
4,4
70
PA
RT
III
L
an
d U
se
Co
nv
ers
ion
fro
m 2
00
6 t
o 2
00
8F
arm
lan
d o
fF
arm
lan
d o
fS
ub
tota
lT
ota
lU
rba
n a
nd
To
tal
LA
ND
US
E C
AT
EG
OR
YP
rim
eS
tate
wid
eU
niq
ue
Lo
ca
lIm
po
rta
nt
Gra
zin
gA
gri
cu
ltu
ral
Bu
ilt-
up
Oth
er
Wa
ter
Co
nv
ert
ed
To
Fa
rmla
nd
Imp
ort
an
ce
Fa
rmla
nd
Imp
ort
an
ce
Fa
rmla
nd
La
nd
La
nd
La
nd
La
nd
Are
aA
no
the
r U
se
Pri
me
Fa
rmla
nd
(1
)(2
)(3
)to
: -
- 0
1
33
0
1
33
2
,35
4
2,4
87
4
9
1,3
43
0
3
,87
9
Fa
rmla
nd
of
Sta
tew
ide
Im
po
rta
nc
eto
:0
-
- 4
0
4
1
98
2
02
0
1
5
0
21
7
Un
iqu
e F
arm
lan
dto
:2
0
-
- 0
2
8
31
8
33
0
2
9
0
86
2
Fa
rmla
nd
of
Lo
ca
l Im
po
rta
nc
eto
:0
0
0
-
- 0
0
0
0
0
0
0
IMP
OR
TA
NT
FA
RM
LA
ND
SU
BT
OT
AL
2
0
13
7
0
13
9
3,3
83
3
,52
2
49
1
,38
7
0
4,9
58
Gra
zin
g L
an
d (
4)
to:
0
0
20
9
0
20
9
--
20
9
44
7
1,1
29
0
1
,78
5
AG
RIC
UL
TU
RA
L L
AN
D S
UB
TO
TA
L2
0
3
46
0
3
48
3
,38
3
3,7
31
4
96
2
,51
6
0
6,7
43
Urb
an
an
d B
uil
t-u
p L
an
d (
5)
to:
18
0
0
0
1
8
56
7
4
--
98
0
1
72
Oth
er
La
nd
(6
)to
:5
8
91
4
0
1
53
4
0
19
3
20
5
--
3,5
62
3
,96
0
Wa
ter
Are
ato
:0
0
0
0
0
0
0
0
0
-
- 0
TO
TA
L A
CR
EA
GE
CO
NV
ER
TE
D
to:
78
9
1
35
0
0
51
9
3,4
79
3
,99
8
70
1
2,6
14
3
,56
2
10
,87
5
(1)
Co
nv
ers
ion
to
Un
iqu
e F
arm
lan
d d
ue
to
th
e i
de
nti
fic
ati
on
of
no
nir
rig
ate
d o
rch
ard
s.
(2)
Co
nv
ers
ion
to
Gra
zin
g L
an
d d
ue
to
la
nd
le
ft i
dle
fo
r th
ree
or
mo
re u
pd
ate
cy
cle
s.
(3)
Co
nv
ers
ion
to
Oth
er
La
nd
du
e t
o r
ev
ers
ion
of
lan
d i
n t
he
Lib
ert
y I
sla
nd
are
a t
o t
ida
l m
ars
h a
fte
r le
ve
es
we
re b
rea
ch
ed
.
(4)
Co
nv
ers
ion
to
Oth
er
La
nd
la
rge
ly d
ue
to
th
e a
dd
itio
n o
f lo
w-d
en
sit
y h
ou
sin
g a
nd
th
e M
on
tez
um
a W
etl
an
ds
Pro
jec
t A
rea
.
(5)
Co
nv
ers
ion
to
Gra
zin
g a
nd
Oth
er
La
nd
du
e t
o t
he
us
e o
f d
eta
ile
d i
ma
ge
ry t
o d
eli
ne
ate
mo
re d
isti
nc
t u
rba
n b
ou
nd
ari
es
.
(6)
Co
nv
ers
ion
to
Wa
ter
du
e t
o t
he
flo
od
ing
of
Lib
ert
y I
sla
nd
fo
llo
win
g a
bre
ac
h o
f th
e l
ev
ee
s.
Page 62

TA
BL
E A
-40
SO
NO
MA
CO
UN
TY
20
06
-20
08
La
nd
Us
e C
on
ve
rsio
nC
AL
IFO
RN
IA D
EP
AR
TM
EN
T O
F C
ON
SE
RV
AT
ION
Div
isio
n o
f L
an
d R
es
ou
rce
Pro
tec
tio
nF
arm
lan
d M
ap
pin
g a
nd
Mo
nit
ori
ng
Pro
gra
m
PA
RT
I
PA
RT
II
Co
un
ty S
um
ma
ry a
nd
Ch
an
ge
by
La
nd
Us
e C
ate
go
ryL
an
d C
om
mit
ted
to
No
na
gri
cu
ltu
ral
Us
e
20
06
-08
AC
RE
AG
E C
HA
NG
ES
(2
)
T
OT
AL
AC
RE
AG
EA
CR
ES
AC
RE
ST
OT
AL
NE
T
TO
TA
L
LA
ND
US
E C
AT
EG
OR
YIN
VE
NT
OR
IED
(1
)L
OS
TG
AIN
ED
AC
RE
AG
EA
CR
EA
GE
LA
ND
US
E C
AT
EG
OR
YA
CR
EA
GE
20
06
20
08
(-)
(+)
CH
AN
GE
DC
HA
NG
ED
20
08
Pri
me
Fa
rmla
nd
32
,25
8
30
,81
5
1,7
55
3
12
2
,06
7
-1,4
43
P
rim
e F
arm
lan
d0
Fa
rmla
nd
of
Sta
tew
ide
Im
po
rta
nc
e1
7,7
35
1
7,2
51
8
87
4
03
1
,29
0
-48
4
Fa
rmla
nd
of
Sta
tew
ide
Im
po
rta
nc
e0
Un
iqu
e F
arm
lan
d3
2,1
80
3
2,1
07
1
,26
9
1,1
96
2
,46
5
-73
U
niq
ue
Fa
rmla
nd
9
Fa
rmla
nd
of
Lo
ca
l Im
po
rta
nc
e7
8,1
69
8
0,0
45
1
,24
7
3,1
23
4
,37
0
1,8
76
F
arm
lan
d o
f L
oc
al
Imp
ort
an
ce
25
1
IMP
OR
TA
NT
FA
RM
LA
ND
SU
BT
OT
AL
16
0,3
42
1
60
,21
8
5,1
58
5
,03
4
10
,19
2
-12
4
IM
PO
RT
AN
T F
AR
ML
AN
D S
UB
TO
TA
L2
60
Gra
zin
g L
an
d
42
0,0
22
4
19
,00
3
1,5
04
4
90
1
,99
4
-1,0
14
G
raz
ing
La
nd
9
02
AG
RIC
UL
TU
RA
L L
AN
D S
UB
TO
TA
L5
80
,36
4
57
9,2
21
6
,66
2
5,5
24
1
2,1
86
-1
,13
8
AG
RIC
UL
TU
RA
L L
AN
D S
UB
TO
TA
L1
,16
2
Urb
an
an
d B
uil
t-u
p L
an
d7
4,2
31
7
4,7
42
2
56
7
67
1
,02
3
51
1
Urb
an
an
d B
uil
t-u
p L
an
d0
Oth
er
La
nd
35
3,9
31
3
54
,58
8
82
7
1,4
54
2
,28
1
62
7
Oth
er
La
nd
42
4
Wa
ter
Are
a1
7,5
33
1
7,5
33
0
0
0
0
W
ate
r A
rea
0
TO
TA
L A
RE
A I
NV
EN
TO
RIE
D (
1)
1,0
26
,05
9
1,0
26
,08
4
7,7
45
7
,74
5
15
,49
0
0
TO
TA
L A
CR
EA
GE
RE
PO
RT
ED
1,5
86
PA
RT
III
L
an
d U
se
Co
nv
ers
ion
fro
m 2
00
6 t
o 2
00
8F
arm
lan
d o
fF
arm
lan
d o
fS
ub
tota
lT
ota
lU
rba
n a
nd
To
tal
LA
ND
US
E C
AT
EG
OR
YP
rim
eS
tate
wid
eU
niq
ue
Lo
ca
lIm
po
rta
nt
Gra
zin
gA
gri
cu
ltu
ral
Bu
ilt-
up
Oth
er
Wa
ter
Co
nv
ert
ed
To
Fa
rmla
nd
Imp
ort
an
ce
Fa
rmla
nd
Imp
ort
an
ce
Fa
rmla
nd
La
nd
La
nd
La
nd
La
nd
Are
aA
no
the
r U
se
Pri
me
Fa
rmla
nd
(3
)to
: -
- 3
6
1
,42
8
1,4
37
4
4
1,4
81
5
1
22
3
0
1,7
55
Fa
rmla
nd
of
Sta
tew
ide
Im
po
rta
nc
eto
:2
-
- 6
6
64
6
72
5
1
72
3
15
1
49
0
8
87
Un
iqu
e F
arm
lan
dto
:1
3
5
--
43
5
45
3
29
9
75
2
14
5
03
0
1
,26
9
Fa
rmla
nd
of
Lo
ca
l Im
po
rta
nc
eto
:1
61
2
75
2
10
-
- 6
46
5
8
70
4
24
8
29
5
0
1,2
47
IMP
OR
TA
NT
FA
RM
LA
ND
SU
BT
OT
AL
17
6
28
3
22
2
2,5
27
3
,20
8
45
2
3,6
60
3
28
1
,17
0
0
5,1
58
Gra
zin
g L
an
d
to:
43
5
1
68
2
48
1
1,2
57
-
- 1
,25
7
92
1
55
0
1
,50
4
AG
RIC
UL
TU
RA
L L
AN
D S
UB
TO
TA
L2
19
3
34
9
04
3
,00
8
4,4
65
4
52
4
,91
7
42
0
1,3
25
0
6
,66
2
Urb
an
an
d B
uil
t-u
p L
an
d (
4)
to:
39
1
5
24
2
1
99
2
8
12
7
--
12
9
0
25
6
Oth
er
La
nd
to:
54
5
4
26
8
94
4
70
1
0
48
0
34
7
--
0
82
7
Wa
ter
Are
ato
:0
0
0
0
0
0
0
0
0
-
- 0
TO
TA
L A
CR
EA
GE
CO
NV
ER
TE
D
to:
31
2
40
3
1,1
96
3
,12
3
5,0
34
4
90
5
,52
4
76
7
1,4
54
0
7
,74
5
20
08
Co
un
ty B
ou
nd
ary
Ad
jus
tme
nt
(1)
0
0
0
0
0
-5
-5
0
30
0
2
5
(1)
To
tal
Are
a I
nv
en
tori
ed
ch
an
ge
d i
n 2
00
8 d
ue
to
ad
op
tio
n o
f u
pd
ate
d c
ou
nty
bo
un
da
ry f
ile
; a
dja
ce
nt
co
un
tie
s g
ain
ed
or
los
t c
orr
es
po
nd
ing
ac
rea
ge
s.
Sta
tis
tic
s r
ep
res
en
tin
g t
his
ch
an
ge
are
sh
ow
n i
n s
ha
de
d c
ell
s i
n P
art
III
of
tab
le.
(2)
20
06
-08
Ac
rea
ge
Ch
an
ge
s c
alc
ula
tes
co
nv
ers
ion
s w
ith
in e
xis
tin
g m
ap
pe
d a
rea
; c
ou
nty
bo
un
da
ry a
dju
stm
en
t a
cre
ag
es
no
t in
clu
de
d.
(3)
Co
nv
ers
ion
to
Fa
rmla
nd
of
Lo
ca
l Im
po
rta
nc
e d
ue
to
la
nd
le
ft i
dle
fo
r th
ree
or
mo
re u
pd
ate
cy
cle
s.
(4)
Co
nv
ers
ion
fro
m U
rba
n a
nd
Bu
ilt-
up
La
nd
pri
ma
rily
th
e r
es
ult
of
the
us
e o
f d
eta
ile
d d
igit
al
ima
ge
ry t
o d
eli
ne
ate
mo
re d
isti
nc
t u
rba
n b
ou
nd
ari
es
.
Page 63

TA
BL
E A
-41
ST
AN
ISL
AU
S C
OU
NT
Y
20
06
-20
08
La
nd
Us
e C
on
ve
rsio
nC
AL
IFO
RN
IA D
EP
AR
TM
EN
T O
F C
ON
SE
RV
AT
ION
Div
isio
n o
f L
an
d R
es
ou
rce
Pro
tec
tio
nF
arm
lan
d M
ap
pin
g a
nd
Mo
nit
ori
ng
Pro
gra
m
PA
RT
I
PA
RT
II
Co
un
ty S
um
ma
ry a
nd
Ch
an
ge
by
La
nd
Us
e C
ate
go
ryL
an
d C
om
mit
ted
to
No
na
gri
cu
ltu
ral
Us
e
20
06
-08
AC
RE
AG
E C
HA
NG
ES
T
OT
AL
AC
RE
AG
EA
CR
ES
AC
RE
ST
OT
AL
NE
T
TO
TA
L
LA
ND
US
E C
AT
EG
OR
YIN
VE
NT
OR
IED
LO
ST
GA
INE
DA
CR
EA
GE
AC
RE
AG
EL
AN
D U
SE
CA
TE
GO
RY
AC
RE
AG
E
20
06
20
08
(-)
(+)
CH
AN
GE
DC
HA
NG
ED
20
08
Pri
me
Fa
rmla
nd
25
6,6
05
2
56
,16
5
3,6
63
3
,22
3
6,8
86
-4
40
P
rim
e F
arm
lan
d1
39
Fa
rmla
nd
of
Sta
tew
ide
Im
po
rta
nc
e2
9,9
25
3
1,4
48
5
46
2
,06
9
2,6
15
1
,52
3
Fa
rmla
nd
of
Sta
tew
ide
Im
po
rta
nc
e3
3
Un
iqu
e F
arm
lan
d7
5,4
44
8
1,3
68
2
,42
6
8,3
50
1
0,7
76
5
,92
4
Un
iqu
e F
arm
lan
d2
15
Fa
rmla
nd
of
Lo
ca
l Im
po
rta
nc
e3
3,7
06
3
1,1
59
3
,75
6
1,2
09
4
,96
5
-2,5
47
F
arm
lan
d o
f L
oc
al
Imp
ort
an
ce
49
IMP
OR
TA
NT
FA
RM
LA
ND
SU
BT
OT
AL
39
5,6
80
4
00
,14
0
10
,39
1
14
,85
1
25
,24
2
4,4
60
I
MP
OR
TA
NT
FA
RM
LA
ND
SU
BT
OT
AL
43
6
Gra
zin
g L
an
d
44
1,4
36
4
34
,13
6
8,6
84
1
,38
4
10
,06
8
-7,3
00
G
raz
ing
La
nd
1
32
AG
RIC
UL
TU
RA
L L
AN
D S
UB
TO
TA
L8
37
,11
6
83
4,2
76
1
9,0
75
1
6,2
35
3
5,3
10
-2
,84
0
AG
RIC
UL
TU
RA
L L
AN
D S
UB
TO
TA
L5
68
Urb
an
an
d B
uil
t-u
p L
an
d6
3,1
92
6
3,9
71
4
48
1
,22
7
1,6
75
7
79
U
rba
n a
nd
Bu
ilt-
up
La
nd
0
Oth
er
La
nd
62
,39
4
64
,45
5
1,9
30
3
,99
1
5,9
21
2
,06
1
Oth
er
La
nd
0
Wa
ter
Are
a7
,46
7
7,4
67
0
0
0
0
W
ate
r A
rea
0
TO
TA
L A
RE
A I
NV
EN
TO
RIE
D
97
0,1
69
9
70
,16
9
21
,45
3
21
,45
3
42
,90
6
0
TO
TA
L A
CR
EA
GE
RE
PO
RT
ED
56
8
PA
RT
III
L
an
d U
se
Co
nv
ers
ion
fro
m 2
00
6 t
o 2
00
8F
arm
lan
d o
fF
arm
lan
d o
fS
ub
tota
lT
ota
lU
rba
n a
nd
To
tal
LA
ND
US
E C
AT
EG
OR
YP
rim
eS
tate
wid
eU
niq
ue
Lo
ca
lIm
po
rta
nt
Gra
zin
gA
gri
cu
ltu
ral
Bu
ilt-
up
Oth
er
Wa
ter
Co
nv
ert
ed
To
Fa
rmla
nd
Imp
ort
an
ce
Fa
rmla
nd
Imp
ort
an
ce
Fa
rmla
nd
La
nd
La
nd
La
nd
La
nd
Are
aA
no
the
r U
se
Pri
me
Fa
rmla
nd
(1
)(2
)to
: -
- 2
1
14
2
1
18
6
14
7
32
6
27
2
,30
4
0
3,6
63
Fa
rmla
nd
of
Sta
tew
ide
Im
po
rta
nc
eto
:2
-
- 5
0
7
1
20
1
27
2
3
39
6
0
54
6
Un
iqu
e F
arm
lan
d (
3)
to:
93
4
36
6
--
50
0
1,8
00
1
61
1
,96
1
76
3
89
0
2
,42
6
Fa
rmla
nd
of
Lo
ca
l Im
po
rta
nc
e (
4)
to:
12
6
48
6
2,5
04
-
- 3
,11
6
15
9
3,2
75
8
9
39
2
0
3,7
56
IMP
OR
TA
NT
FA
RM
LA
ND
SU
BT
OT
AL
1,0
62
8
54
2
,62
3
50
2
5,0
41
1
,05
4
6,0
95
8
15
3
,48
1
0
10
,39
1
Gra
zin
g L
an
d (
5)
to:
1,3
33
1
,02
4
5,4
01
5
51
8
,30
9
--
8,3
09
1
09
2
66
0
8
,68
4
AG
RIC
UL
TU
RA
L L
AN
D S
UB
TO
TA
L2
,39
5
1,8
78
8
,02
4
1,0
53
1
3,3
50
1
,05
4
14
,40
4
92
4
3,7
47
0
1
9,0
75
Urb
an
an
d B
uil
t-u
p L
an
d (
6)
to:
59
1
3
15
2
8
9
11
5
20
4
--
24
4
0
44
8
Oth
er
La
nd
to:
76
9
17
8
31
1
15
4
1,4
12
2
15
1
,62
7
30
3
--
0
1,9
30
Wa
ter
Are
ato
:0
0
0
0
0
0
0
0
0
-
- 0
TO
TA
L A
CR
EA
GE
CO
NV
ER
TE
D
to:
3,2
23
2
,06
9
8,3
50
1
,20
9
14
,85
1
1,3
84
1
6,2
35
1
,22
7
3,9
91
0
2
1,4
53
(1)
Co
nv
ers
ion
to
Un
iqu
e F
arm
lan
d i
s p
rim
ari
ly d
ue
to
th
e d
eli
ne
ati
on
of
po
tte
d p
lan
t n
urs
eri
es
in
th
e c
ou
nty
.
(2)
Co
nv
ers
ion
to
Oth
er
La
nd
is
du
e t
o t
he
us
e o
f d
eta
ile
d d
igit
al
ima
ge
ry t
o d
eli
ne
ate
lo
w-d
en
sit
y h
ou
sin
g,
farm
ste
ad
s,
da
irie
s,
an
d e
co
log
ica
l re
sto
rati
on
are
as
th
rou
gh
ou
t th
e c
ou
nty
.
(3)
Co
nv
ers
ion
to
Pri
me
Fa
rmla
nd
an
d F
arm
lan
d o
f S
tate
wid
e I
mp
ort
an
ce
du
e t
o a
te
ch
nic
al
co
rre
cti
on
to
so
il d
ata
in
th
e c
ou
nty
.
(4)
Co
nv
ers
ion
to
Un
iqu
e F
arm
lan
d p
rim
ari
ly d
ue
to
th
e d
eli
ne
ati
on
of
irri
ga
ted
cro
ps
on
la
nd
fo
rme
rly
ma
pp
ed
as
irr
iga
ted
pa
stu
re.
(5)
Co
nv
ers
ion
to
irr
iga
ted
ag
ric
ult
ura
l c
ate
go
rie
s i
s d
ue
to
ne
w i
rrig
ate
d f
arm
lan
d,
pri
ma
rily
alm
on
d o
rch
ard
s,
in t
he
no
rth
ern
an
d e
as
tern
po
rtio
ns
of
the
co
un
ty.
(6)
Co
nv
ers
ion
fro
m U
rba
n a
nd
Bu
ilt-
up
La
nd
pri
ma
rily
th
e r
es
ult
of
the
us
e o
f d
eta
ile
d d
igit
al
ima
ge
ry t
o d
eli
ne
ate
mo
re d
isti
nc
t u
rba
n b
ou
nd
ari
es
.
Page 64
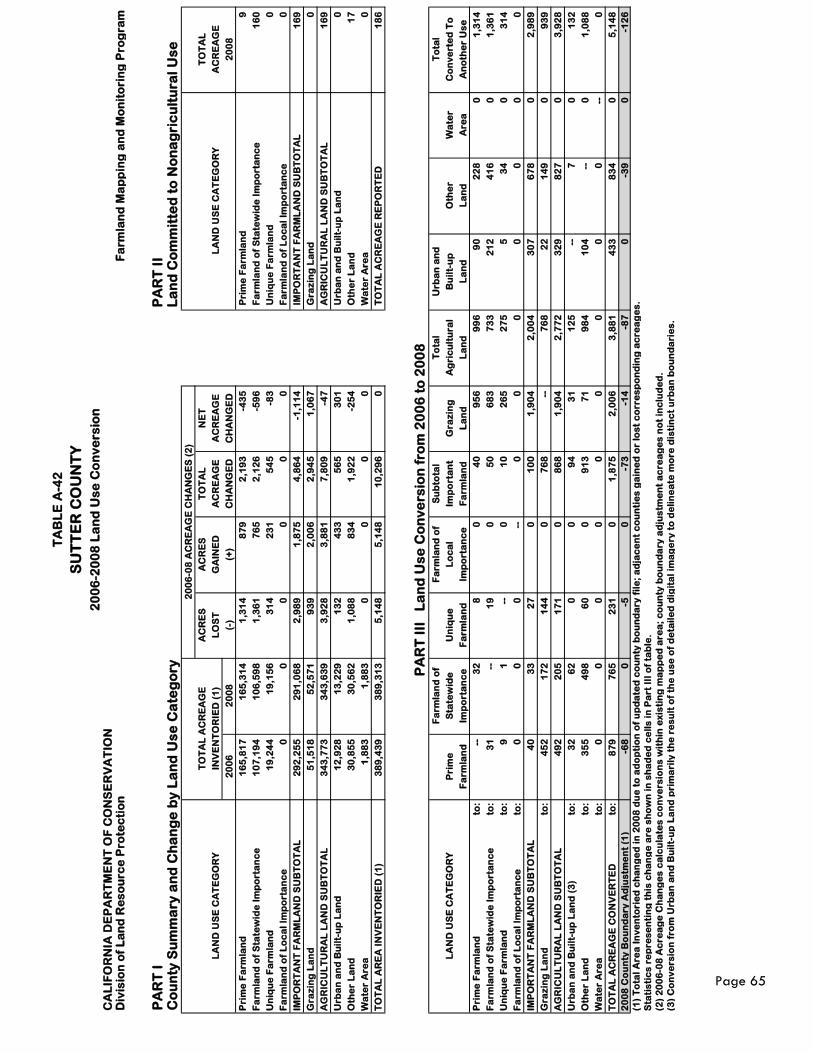
TA
BL
E A
-42
SU
TT
ER
CO
UN
TY
20
06
-20
08
La
nd
Us
e C
on
ve
rsio
nC
AL
IFO
RN
IA D
EP
AR
TM
EN
T O
F C
ON
SE
RV
AT
ION
Div
isio
n o
f L
an
d R
es
ou
rce
Pro
tec
tio
nF
arm
lan
d M
ap
pin
g a
nd
Mo
nit
ori
ng
Pro
gra
m
PA
RT
I
PA
RT
II
Co
un
ty S
um
ma
ry a
nd
Ch
an
ge
by
La
nd
Us
e C
ate
go
ryL
an
d C
om
mit
ted
to
No
na
gri
cu
ltu
ral
Us
e
20
06
-08
AC
RE
AG
E C
HA
NG
ES
(2
)
T
OT
AL
AC
RE
AG
EA
CR
ES
AC
RE
ST
OT
AL
NE
T
TO
TA
L
LA
ND
US
E C
AT
EG
OR
YIN
VE
NT
OR
IED
(1
)L
OS
TG
AIN
ED
AC
RE
AG
EA
CR
EA
GE
LA
ND
US
E C
AT
EG
OR
YA
CR
EA
GE
20
06
20
08
(-)
(+)
CH
AN
GE
DC
HA
NG
ED
20
08
Pri
me
Fa
rmla
nd
16
5,8
17
1
65
,31
4
1,3
14
8
79
2
,19
3
-43
5
Pri
me
Fa
rmla
nd
9
Fa
rmla
nd
of
Sta
tew
ide
Im
po
rta
nc
e1
07
,19
4
10
6,5
98
1
,36
1
76
5
2,1
26
-5
96
F
arm
lan
d o
f S
tate
wid
e I
mp
ort
an
ce
16
0
Un
iqu
e F
arm
lan
d1
9,2
44
1
9,1
56
3
14
2
31
5
45
-8
3
Un
iqu
e F
arm
lan
d0
Fa
rmla
nd
of
Lo
ca
l Im
po
rta
nc
e0
0
0
0
0
0
F
arm
lan
d o
f L
oc
al
Imp
ort
an
ce
0
IMP
OR
TA
NT
FA
RM
LA
ND
SU
BT
OT
AL
29
2,2
55
2
91
,06
8
2,9
89
1
,87
5
4,8
64
-1
,11
4
IM
PO
RT
AN
T F
AR
ML
AN
D S
UB
TO
TA
L1
69
Gra
zin
g L
an
d
51
,51
8
52
,57
1
93
9
2,0
06
2
,94
5
1,0
67
G
raz
ing
La
nd
0
AG
RIC
UL
TU
RA
L L
AN
D S
UB
TO
TA
L3
43
,77
3
34
3,6
39
3
,92
8
3,8
81
7
,80
9
-47
A
GR
ICU
LT
UR
AL
LA
ND
SU
BT
OT
AL
16
9
Urb
an
an
d B
uil
t-u
p L
an
d1
2,9
28
1
3,2
29
1
32
4
33
5
65
3
01
U
rba
n a
nd
Bu
ilt-
up
La
nd
0
Oth
er
La
nd
30
,85
5
30
,56
2
1,0
88
8
34
1
,92
2
-25
4
Oth
er
La
nd
17
Wa
ter
Are
a1
,88
3
1,8
83
0
0
0
0
W
ate
r A
rea
0
TO
TA
L A
RE
A I
NV
EN
TO
RIE
D (
1)
38
9,4
39
3
89
,31
3
5,1
48
5
,14
8
10
,29
6
0
TO
TA
L A
CR
EA
GE
RE
PO
RT
ED
18
6
PA
RT
III
L
an
d U
se
Co
nv
ers
ion
fro
m 2
00
6 t
o 2
00
8F
arm
lan
d o
fF
arm
lan
d o
fS
ub
tota
lT
ota
lU
rba
n a
nd
To
tal
LA
ND
US
E C
AT
EG
OR
YP
rim
eS
tate
wid
eU
niq
ue
Lo
ca
lIm
po
rta
nt
Gra
zin
gA
gri
cu
ltu
ral
Bu
ilt-
up
Oth
er
Wa
ter
Co
nv
ert
ed
To
Fa
rmla
nd
Imp
ort
an
ce
Fa
rmla
nd
Imp
ort
an
ce
Fa
rmla
nd
La
nd
La
nd
La
nd
La
nd
Are
aA
no
the
r U
se
Pri
me
Fa
rmla
nd
to:
--
32
8
0
4
0
95
6
99
6
90
2
28
0
1
,31
4
Fa
rmla
nd
of
Sta
tew
ide
Im
po
rta
nc
eto
:3
1
--
19
0
5
0
68
3
73
3
21
2
41
6
0
1,3
61
Un
iqu
e F
arm
lan
dto
:9
1
-
- 0
1
0
26
5
27
5
5
34
0
3
14
Fa
rmla
nd
of
Lo
ca
l Im
po
rta
nc
eto
:0
0
0
-
- 0
0
0
0
0
0
0
IMP
OR
TA
NT
FA
RM
LA
ND
SU
BT
OT
AL
40
3
3
27
0
1
00
1
,90
4
2,0
04
3
07
6
78
0
2
,98
9
Gra
zin
g L
an
d
to:
45
2
17
2
14
4
0
76
8
--
76
8
22
1
49
0
9
39
AG
RIC
UL
TU
RA
L L
AN
D S
UB
TO
TA
L4
92
2
05
1
71
0
8
68
1
,90
4
2,7
72
3
29
8
27
0
3
,92
8
Urb
an
an
d B
uil
t-u
p L
an
d (
3)
to:
32
6
2
0
0
94
3
1
12
5
--
7
0
13
2
Oth
er
La
nd
to:
35
5
49
8
60
0
9
13
7
1
98
4
10
4
--
0
1,0
88
Wa
ter
Are
ato
:0
0
0
0
0
0
0
0
0
-
- 0
TO
TA
L A
CR
EA
GE
CO
NV
ER
TE
D
to:
87
9
76
5
23
1
0
1,8
75
2
,00
6
3,8
81
4
33
8
34
0
5
,14
8
20
08
Co
un
ty B
ou
nd
ary
Ad
jus
tme
nt
(1)
-68
0
-5
0
-7
3
-14
-8
7
0
-39
0
-1
26
(1)
To
tal
Are
a I
nv
en
tori
ed
ch
an
ge
d i
n 2
00
8 d
ue
to
ad
op
tio
n o
f u
pd
ate
d c
ou
nty
bo
un
da
ry f
ile
; a
dja
ce
nt
co
un
tie
s g
ain
ed
or
los
t c
orr
es
po
nd
ing
ac
rea
ge
s.
Sta
tis
tic
s r
ep
res
en
tin
g t
his
ch
an
ge
are
sh
ow
n i
n s
ha
de
d c
ell
s i
n P
art
III
of
tab
le.
(2)
20
06
-08
Ac
rea
ge
Ch
an
ge
s c
alc
ula
tes
co
nv
ers
ion
s w
ith
in e
xis
tin
g m
ap
pe
d a
rea
; c
ou
nty
bo
un
da
ry a
dju
stm
en
t a
cre
ag
es
no
t in
clu
de
d.
(3)
Co
nv
ers
ion
fro
m U
rba
n a
nd
Bu
ilt-
up
La
nd
pri
ma
rily
th
e r
es
ult
of
the
us
e o
f d
eta
ile
d d
igit
al
ima
ge
ry t
o d
eli
ne
ate
mo
re d
isti
nc
t u
rba
n b
ou
nd
ari
es
.
Page 65
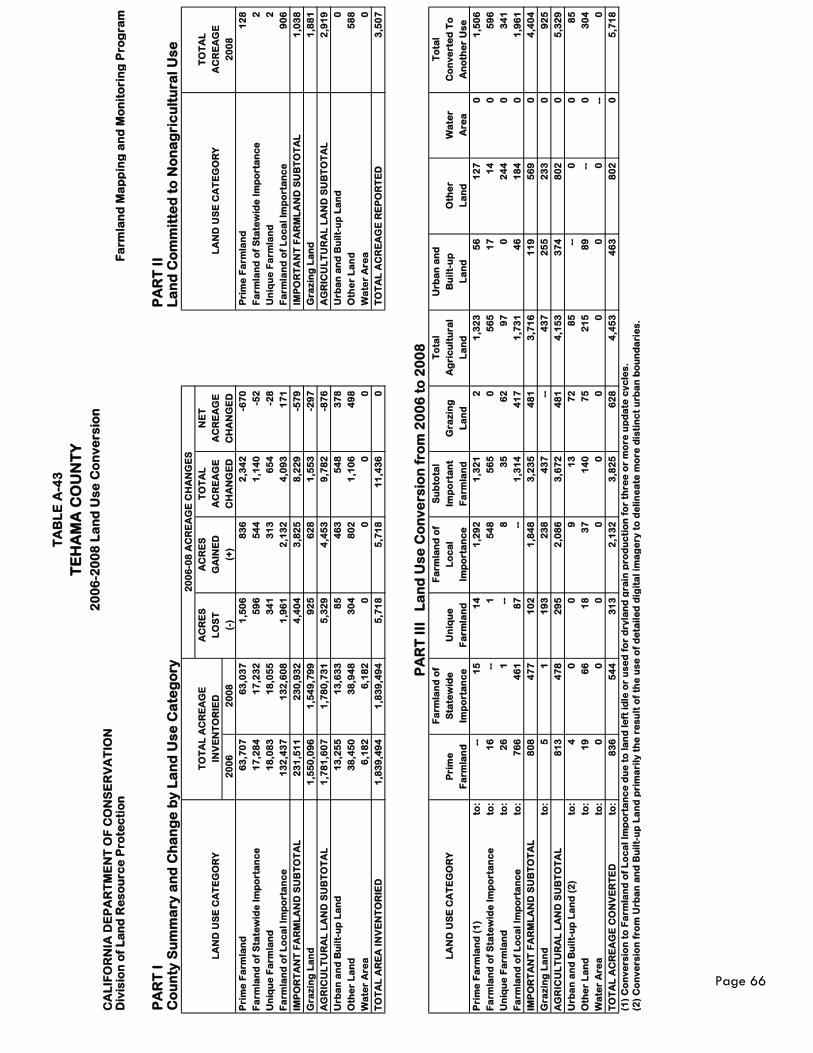
TA
BL
E A
-43
TE
HA
MA
CO
UN
TY
20
06
-20
08
La
nd
Us
e C
on
ve
rsio
nC
AL
IFO
RN
IA D
EP
AR
TM
EN
T O
F C
ON
SE
RV
AT
ION
Div
isio
n o
f L
an
d R
es
ou
rce
Pro
tec
tio
nF
arm
lan
d M
ap
pin
g a
nd
Mo
nit
ori
ng
Pro
gra
m
PA
RT
I
PA
RT
II
Co
un
ty S
um
ma
ry a
nd
Ch
an
ge
by
La
nd
Us
e C
ate
go
ryL
an
d C
om
mit
ted
to
No
na
gri
cu
ltu
ral
Us
e
20
06
-08
AC
RE
AG
E C
HA
NG
ES
T
OT
AL
AC
RE
AG
EA
CR
ES
AC
RE
ST
OT
AL
NE
T
TO
TA
L
LA
ND
US
E C
AT
EG
OR
YIN
VE
NT
OR
IED
LO
ST
GA
INE
DA
CR
EA
GE
AC
RE
AG
EL
AN
D U
SE
CA
TE
GO
RY
AC
RE
AG
E
20
06
20
08
(-)
(+)
CH
AN
GE
DC
HA
NG
ED
20
08
Pri
me
Fa
rmla
nd
63
,70
7
63
,03
7
1,5
06
8
36
2
,34
2
-67
0
Pri
me
Fa
rmla
nd
12
8
Fa
rmla
nd
of
Sta
tew
ide
Im
po
rta
nc
e1
7,2
84
1
7,2
32
5
96
5
44
1
,14
0
-52
F
arm
lan
d o
f S
tate
wid
e I
mp
ort
an
ce
2
Un
iqu
e F
arm
lan
d1
8,0
83
1
8,0
55
3
41
3
13
6
54
-2
8
Un
iqu
e F
arm
lan
d2
Fa
rmla
nd
of
Lo
ca
l Im
po
rta
nc
e1
32
,43
7
13
2,6
08
1
,96
1
2,1
32
4
,09
3
17
1
Fa
rmla
nd
of
Lo
ca
l Im
po
rta
nc
e9
06
IMP
OR
TA
NT
FA
RM
LA
ND
SU
BT
OT
AL
23
1,5
11
2
30
,93
2
4,4
04
3
,82
5
8,2
29
-5
79
I
MP
OR
TA
NT
FA
RM
LA
ND
SU
BT
OT
AL
1,0
38
Gra
zin
g L
an
d
1,5
50
,09
6
1,5
49
,79
9
92
5
62
8
1,5
53
-2
97
G
raz
ing
La
nd
1
,88
1
AG
RIC
UL
TU
RA
L L
AN
D S
UB
TO
TA
L1
,78
1,6
07
1
,78
0,7
31
5
,32
9
4,4
53
9
,78
2
-87
6
AG
RIC
UL
TU
RA
L L
AN
D S
UB
TO
TA
L2
,91
9
Urb
an
an
d B
uil
t-u
p L
an
d1
3,2
55
1
3,6
33
8
5
46
3
54
8
37
8
Urb
an
an
d B
uil
t-u
p L
an
d0
Oth
er
La
nd
38
,45
0
38
,94
8
30
4
80
2
1,1
06
4
98
O
the
r L
an
d5
88
Wa
ter
Are
a6
,18
2
6,1
82
0
0
0
0
W
ate
r A
rea
0
TO
TA
L A
RE
A I
NV
EN
TO
RIE
D
1,8
39
,49
4
1,8
39
,49
4
5,7
18
5
,71
8
11
,43
6
0
TO
TA
L A
CR
EA
GE
RE
PO
RT
ED
3,5
07
PA
RT
III
L
an
d U
se
Co
nv
ers
ion
fro
m 2
00
6 t
o 2
00
8F
arm
lan
d o
fF
arm
lan
d o
fS
ub
tota
lT
ota
lU
rba
n a
nd
To
tal
LA
ND
US
E C
AT
EG
OR
YP
rim
eS
tate
wid
eU
niq
ue
Lo
ca
lIm
po
rta
nt
Gra
zin
gA
gri
cu
ltu
ral
Bu
ilt-
up
Oth
er
Wa
ter
Co
nv
ert
ed
To
Fa
rmla
nd
Imp
ort
an
ce
Fa
rmla
nd
Imp
ort
an
ce
Fa
rmla
nd
La
nd
La
nd
La
nd
La
nd
Are
aA
no
the
r U
se
Pri
me
Fa
rmla
nd
(1
)to
: -
- 1
5
14
1
,29
2
1,3
21
2
1
,32
3
56
1
27
0
1
,50
6
Fa
rmla
nd
of
Sta
tew
ide
Im
po
rta
nc
eto
:1
6
--
1
54
8
56
5
0
56
5
17
1
4
0
59
6
Un
iqu
e F
arm
lan
dto
:2
6
1
--
8
35
6
2
97
0
2
44
0
3
41
Fa
rmla
nd
of
Lo
ca
l Im
po
rta
nc
eto
:7
66
4
61
8
7
--
1,3
14
4
17
1
,73
1
46
1
84
0
1
,96
1
IMP
OR
TA
NT
FA
RM
LA
ND
SU
BT
OT
AL
80
8
47
7
10
2
1,8
48
3
,23
5
48
1
3,7
16
1
19
5
69
0
4
,40
4
Gra
zin
g L
an
d
to:
5
1
19
3
23
8
43
7
--
43
7
25
5
23
3
0
92
5
AG
RIC
UL
TU
RA
L L
AN
D S
UB
TO
TA
L8
13
4
78
2
95
2
,08
6
3,6
72
4
81
4
,15
3
37
4
80
2
0
5,3
29
Urb
an
an
d B
uil
t-u
p L
an
d (
2)
to:
4
0
0
9
13
7
2
85
-
- 0
0
8
5
Oth
er
La
nd
to:
19
6
6
18
3
7
14
0
75
2
15
8
9
--
0
30
4
Wa
ter
Are
ato
:0
0
0
0
0
0
0
0
0
-
- 0
TO
TA
L A
CR
EA
GE
CO
NV
ER
TE
D
to:
83
6
54
4
31
3
2,1
32
3
,82
5
62
8
4,4
53
4
63
8
02
0
5
,71
8
(1)
Co
nv
ers
ion
to
Fa
rmla
nd
of
Lo
ca
l Im
po
rta
nc
e d
ue
to
la
nd
le
ft i
dle
or
us
ed
fo
r d
ryla
nd
gra
in p
rod
uc
tio
n f
or
thre
e o
r m
ore
up
da
te c
yc
les
.
(2)
Co
nv
ers
ion
fro
m U
rba
n a
nd
Bu
ilt-
up
La
nd
pri
ma
rily
th
e r
es
ult
of
the
us
e o
f d
eta
ile
d d
igit
al
ima
ge
ry t
o d
eli
ne
ate
mo
re d
isti
nc
t u
rba
n b
ou
nd
ari
es
.
Page 66
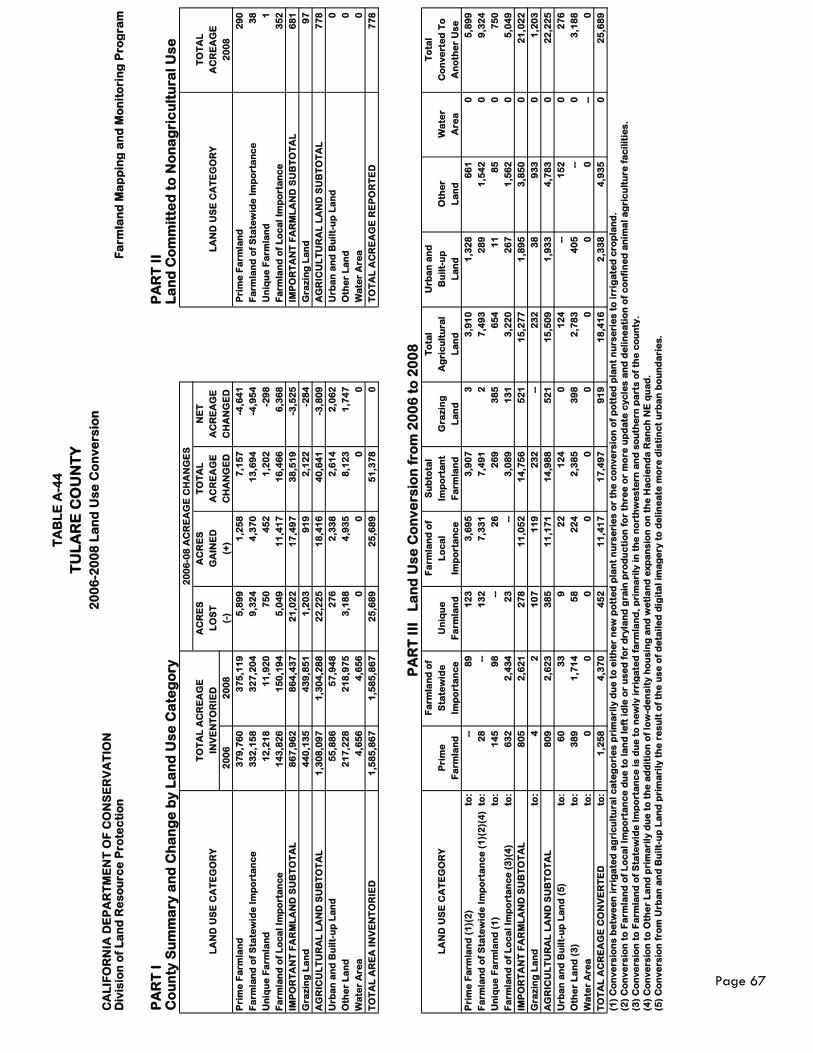
TA
BL
E A
-44
TU
LA
RE
CO
UN
TY
20
06
-20
08
La
nd
Us
e C
on
ve
rsio
nC
AL
IFO
RN
IA D
EP
AR
TM
EN
T O
F C
ON
SE
RV
AT
ION
Div
isio
n o
f L
an
d R
es
ou
rce
Pro
tec
tio
nF
arm
lan
d M
ap
pin
g a
nd
Mo
nit
ori
ng
Pro
gra
m
PA
RT
I
PA
RT
II
Co
un
ty S
um
ma
ry a
nd
Ch
an
ge
by
La
nd
Us
e C
ate
go
ryL
an
d C
om
mit
ted
to
No
na
gri
cu
ltu
ral
Us
e
20
06
-08
AC
RE
AG
E C
HA
NG
ES
T
OT
AL
AC
RE
AG
EA
CR
ES
AC
RE
ST
OT
AL
NE
T
TO
TA
L
LA
ND
US
E C
AT
EG
OR
YIN
VE
NT
OR
IED
LO
ST
GA
INE
DA
CR
EA
GE
AC
RE
AG
EL
AN
D U
SE
CA
TE
GO
RY
AC
RE
AG
E
20
06
20
08
(-)
(+)
CH
AN
GE
DC
HA
NG
ED
20
08
Pri
me
Fa
rmla
nd
37
9,7
60
3
75
,11
9
5,8
99
1
,25
8
7,1
57
-4
,64
1
Pri
me
Fa
rmla
nd
29
0
Fa
rmla
nd
of
Sta
tew
ide
Im
po
rta
nc
e3
32
,15
8
32
7,2
04
9
,32
4
4,3
70
1
3,6
94
-4
,95
4
Fa
rmla
nd
of
Sta
tew
ide
Im
po
rta
nc
e3
8
Un
iqu
e F
arm
lan
d1
2,2
18
1
1,9
20
7
50
4
52
1
,20
2
-29
8
Un
iqu
e F
arm
lan
d1
Fa
rmla
nd
of
Lo
ca
l Im
po
rta
nc
e1
43
,82
6
15
0,1
94
5
,04
9
11
,41
7
16
,46
6
6,3
68
F
arm
lan
d o
f L
oc
al
Imp
ort
an
ce
35
2
IMP
OR
TA
NT
FA
RM
LA
ND
SU
BT
OT
AL
86
7,9
62
8
64
,43
7
21
,02
2
17
,49
7
38
,51
9
-3,5
25
I
MP
OR
TA
NT
FA
RM
LA
ND
SU
BT
OT
AL
68
1
Gra
zin
g L
an
d
44
0,1
35
4
39
,85
1
1,2
03
9
19
2
,12
2
-28
4
Gra
zin
g L
an
d
97
AG
RIC
UL
TU
RA
L L
AN
D S
UB
TO
TA
L1
,30
8,0
97
1
,30
4,2
88
2
2,2
25
1
8,4
16
4
0,6
41
-3
,80
9
AG
RIC
UL
TU
RA
L L
AN
D S
UB
TO
TA
L7
78
Urb
an
an
d B
uil
t-u
p L
an
d5
5,8
86
5
7,9
48
2
76
2
,33
8
2,6
14
2
,06
2
Urb
an
an
d B
uil
t-u
p L
an
d0
Oth
er
La
nd
21
7,2
28
2
18
,97
5
3,1
88
4
,93
5
8,1
23
1
,74
7
Oth
er
La
nd
0
Wa
ter
Are
a4
,65
6
4,6
56
0
0
0
0
W
ate
r A
rea
0
TO
TA
L A
RE
A I
NV
EN
TO
RIE
D
1,5
85
,86
7
1,5
85
,86
7
25
,68
9
25
,68
9
51
,37
8
0
TO
TA
L A
CR
EA
GE
RE
PO
RT
ED
77
8
PA
RT
III
L
an
d U
se
Co
nv
ers
ion
fro
m 2
00
6 t
o 2
00
8F
arm
lan
d o
fF
arm
lan
d o
fS
ub
tota
lT
ota
lU
rba
n a
nd
To
tal
LA
ND
US
E C
AT
EG
OR
YP
rim
eS
tate
wid
eU
niq
ue
Lo
ca
lIm
po
rta
nt
Gra
zin
gA
gri
cu
ltu
ral
Bu
ilt-
up
Oth
er
Wa
ter
Co
nv
ert
ed
To
Fa
rmla
nd
Imp
ort
an
ce
Fa
rmla
nd
Imp
ort
an
ce
Fa
rmla
nd
La
nd
La
nd
La
nd
La
nd
Are
aA
no
the
r U
se
Pri
me
Fa
rmla
nd
(1
)(2
)to
: -
- 8
9
12
3
3,6
95
3
,90
7
3
3,9
10
1
,32
8
66
1
0
5,8
99
Fa
rmla
nd
of
Sta
tew
ide
Im
po
rta
nc
e (
1)(
2)(
4)
to:
28
-
- 1
32
7
,33
1
7,4
91
2
7
,49
3
28
9
1,5
42
0
9
,32
4
Un
iqu
e F
arm
lan
d (
1)
to:
14
5
98
-
- 2
6
26
9
38
5
65
4
11
8
5
0
75
0
Fa
rmla
nd
of
Lo
ca
l Im
po
rta
nc
e (
3)(
4)
to:
63
2
2,4
34
2
3
--
3,0
89
1
31
3
,22
0
26
7
1,5
62
0
5
,04
9
IMP
OR
TA
NT
FA
RM
LA
ND
SU
BT
OT
AL
80
5
2,6
21
2
78
1
1,0
52
1
4,7
56
5
21
1
5,2
77
1
,89
5
3,8
50
0
2
1,0
22
Gra
zin
g L
an
d
to:
4
2
10
7
11
9
23
2
--
23
2
38
9
33
0
1
,20
3
AG
RIC
UL
TU
RA
L L
AN
D S
UB
TO
TA
L8
09
2
,62
3
38
5
11
,17
1
14
,98
8
52
1
15
,50
9
1,9
33
4
,78
3
0
22
,22
5
Urb
an
an
d B
uil
t-u
p L
an
d (
5)
to:
60
3
3
9
22
1
24
0
1
24
-
- 1
52
0
2
76
Oth
er
La
nd
(3
)to
:3
89
1
,71
4
58
2
24
2
,38
5
39
8
2,7
83
4
05
-
- 0
3
,18
8
Wa
ter
Are
ato
:0
0
0
0
0
0
0
0
0
-
- 0
TO
TA
L A
CR
EA
GE
CO
NV
ER
TE
D
to:
1,2
58
4
,37
0
45
2
11
,41
7
17
,49
7
91
9
18
,41
6
2,3
38
4
,93
5
0
25
,68
9
(1)
Co
nv
ers
ion
s b
etw
ee
n i
rrig
ate
d a
gri
cu
ltu
ral
ca
teg
ori
es
pri
ma
rily
du
e t
o e
ith
er
ne
w p
ott
ed
pla
nt
nu
rse
rie
s o
r th
e c
on
ve
rsio
n o
f p
ott
ed
pla
nt
nu
rse
rie
s t
o i
rrig
ate
d c
rop
lan
d.
(2)
Co
nv
ers
ion
to
Fa
rmla
nd
of
Lo
ca
l Im
po
rta
nc
e d
ue
to
la
nd
le
ft i
dle
or
us
ed
fo
r d
ryla
nd
gra
in p
rod
uc
tio
n f
or
thre
e o
r m
ore
up
da
te c
yc
les
an
d d
eli
ne
ati
on
of
co
nfi
ne
d a
nim
al
ag
ric
ult
ure
fa
cil
itie
s.
(3)
Co
nv
ers
ion
to
Fa
rmla
nd
of
Sta
tew
ide
Im
po
rta
nc
e i
s d
ue
to
ne
wly
irr
iga
ted
fa
rmla
nd
, p
rim
ari
ly i
n t
he
no
rth
we
ste
rn a
nd
so
uth
ern
pa
rts
of
the
co
un
ty.
(4)
Co
nv
ers
ion
to
Oth
er
La
nd
pri
ma
rily
du
e t
o t
he
ad
dit
ion
of
low
-de
ns
ity
ho
us
ing
an
d w
etl
an
d e
xp
an
sio
n o
n t
he
Ha
cie
nd
a R
an
ch
NE
qu
ad
.
(5)
Co
nv
ers
ion
fro
m U
rba
n a
nd
Bu
ilt-
up
La
nd
pri
ma
rily
th
e r
es
ult
of
the
us
e o
f d
eta
ile
d d
igit
al
ima
ge
ry t
o d
eli
ne
ate
mo
re d
isti
nc
t u
rba
n b
ou
nd
ari
es
.
Page 67

TA
BL
E A
-45
VE
NT
UR
A C
OU
NT
Y
20
06
-20
08
La
nd
Us
e C
on
ve
rsio
nC
AL
IFO
RN
IA D
EP
AR
TM
EN
T O
F C
ON
SE
RV
AT
ION
Div
isio
n o
f L
an
d R
es
ou
rce
Pro
tec
tio
nF
arm
lan
d M
ap
pin
g a
nd
Mo
nit
ori
ng
Pro
gra
m
PA
RT
I
PA
RT
II
Co
un
ty S
um
ma
ry a
nd
Ch
an
ge
by
La
nd
Us
e C
ate
go
ryL
an
d C
om
mit
ted
to
No
na
gri
cu
ltu
ral
Us
e
20
06
-08
AC
RE
AG
E C
HA
NG
ES
T
OT
AL
AC
RE
AG
EA
CR
ES
AC
RE
ST
OT
AL
NE
T
TO
TA
L
LA
ND
US
E C
AT
EG
OR
YIN
VE
NT
OR
IED
LO
ST
GA
INE
DA
CR
EA
GE
AC
RE
AG
EL
AN
D U
SE
CA
TE
GO
RY
AC
RE
AG
E
20
06
20
08
(-)
(+)
CH
AN
GE
DC
HA
NG
ED
20
08
Pri
me
Fa
rmla
nd
45
,43
1
43
,79
0
1,8
42
2
01
2
,04
3
-1,6
41
P
rim
e F
arm
lan
d2
91
Fa
rmla
nd
of
Sta
tew
ide
Im
po
rta
nc
e3
4,2
30
3
3,8
41
4
55
6
6
52
1
-38
9
Fa
rmla
nd
of
Sta
tew
ide
Im
po
rta
nc
e1
78
Un
iqu
e F
arm
lan
d2
8,5
83
2
8,6
43
8
90
9
50
1
,84
0
60
U
niq
ue
Fa
rmla
nd
12
1
Fa
rmla
nd
of
Lo
ca
l Im
po
rta
nc
e1
6,7
16
1
6,2
18
1
,70
2
1,2
04
2
,90
6
-49
8
Fa
rmla
nd
of
Lo
ca
l Im
po
rta
nc
e7
82
IMP
OR
TA
NT
FA
RM
LA
ND
SU
BT
OT
AL
12
4,9
60
1
22
,49
2
4,8
89
2
,42
1
7,3
10
-2
,46
8
IM
PO
RT
AN
T F
AR
ML
AN
D S
UB
TO
TA
L1
,37
2
Gra
zin
g L
an
d
19
9,0
02
1
95
,67
4
5,0
70
1
,74
2
6,8
12
-3
,32
8
Gra
zin
g L
an
d
3,7
52
AG
RIC
UL
TU
RA
L L
AN
D S
UB
TO
TA
L3
23
,96
2
31
8,1
66
9
,95
9
4,1
63
1
4,1
22
-5
,79
6
AG
RIC
UL
TU
RA
L L
AN
D S
UB
TO
TA
L5
,12
4
Urb
an
an
d B
uil
t-u
p L
an
d1
02
,87
4
10
4,2
82
7
9
1,4
87
1
,56
6
1,4
08
U
rba
n a
nd
Bu
ilt-
up
La
nd
0
Oth
er
La
nd
12
5,1
74
1
29
,56
2
83
4
5,2
22
6
,05
6
4,3
88
O
the
r L
an
d1
,32
1
Wa
ter
Are
a3
,93
9
3,9
39
0
0
0
0
W
ate
r A
rea
0
TO
TA
L A
RE
A I
NV
EN
TO
RIE
D
55
5,9
49
5
55
,94
9
10
,87
2
10
,87
2
21
,74
4
0
TO
TA
L A
CR
EA
GE
RE
PO
RT
ED
6,4
45
PA
RT
III
L
an
d U
se
Co
nv
ers
ion
fro
m 2
00
6 t
o 2
00
8F
arm
lan
d o
fF
arm
lan
d o
fS
ub
tota
lT
ota
lU
rba
n a
nd
To
tal
LA
ND
US
E C
AT
EG
OR
YP
rim
eS
tate
wid
eU
niq
ue
Lo
ca
lIm
po
rta
nt
Gra
zin
gA
gri
cu
ltu
ral
Bu
ilt-
up
Oth
er
Wa
ter
Co
nv
ert
ed
To
Fa
rmla
nd
Imp
ort
an
ce
Fa
rmla
nd
Imp
ort
an
ce
Fa
rmla
nd
La
nd
La
nd
La
nd
La
nd
Are
aA
no
the
r U
se
Pri
me
Fa
rmla
nd
(1
)to
: -
- 2
2
80
9
99
1
,28
1
4
1,2
85
3
63
1
94
0
1
,84
2
Fa
rmla
nd
of
Sta
tew
ide
Im
po
rta
nc
e (
1)
to:
3
--
76
1
15
1
94
4
1
98
2
25
3
2
0
45
5
Un
iqu
e F
arm
lan
dto
:1
2
4
--
64
8
0
61
7
69
7
11
1
82
0
8
90
Fa
rmla
nd
of
Lo
ca
l Im
po
rta
nc
eto
:1
31
3
6
36
-
- 2
03
9
83
1
,18
6
13
1
38
5
0
1,7
02
IMP
OR
TA
NT
FA
RM
LA
ND
SU
BT
OT
AL
14
6
42
3
92
1
,17
8
1,7
58
1
,60
8
3,3
66
7
30
7
93
0
4
,88
9
Gra
zin
g L
an
d (
2)
to:
7
5
31
1
15
3
38
-
- 3
38
3
46
4
,38
6
0
5,0
70
AG
RIC
UL
TU
RA
L L
AN
D S
UB
TO
TA
L1
53
4
7
70
3
1,1
93
2
,09
6
1,6
08
3
,70
4
1,0
76
5
,17
9
0
9,9
59
Urb
an
an
d B
uil
t-u
p L
an
dto
:7
1
1
8
5
31
5
3
6
--
43
0
7
9
Oth
er
La
nd
to:
41
1
8
22
9
6
29
4
12
9
42
3
41
1
--
0
83
4
Wa
ter
Are
ato
:0
0
0
0
0
0
0
0
0
-
- 0
TO
TA
L A
CR
EA
GE
CO
NV
ER
TE
D
to:
20
1
66
9
50
1
,20
4
2,4
21
1
,74
2
4,1
63
1
,48
7
5,2
22
0
1
0,8
72
(1)
Co
nv
ers
ion
to
Un
iqu
e F
arm
lan
d d
ue
to
de
lin
ea
tio
n o
f p
ott
ed
pla
nt
nu
rse
rie
s a
nd
no
nir
rig
ate
d o
rch
ard
s.
(2)
Co
nv
ers
ion
to
Oth
er
La
nd
la
rge
ly d
ue
to
th
e d
eli
ne
ati
on
of
oil
fie
lds
on
wh
ich
gra
zin
g i
s n
ot
pe
rmit
ted
, in
clu
din
g t
he
Sa
n M
igu
eli
to,
Sh
iell
s C
an
yo
n,
an
d T
orr
ey
Ca
ny
on
fie
lds
.
Page 68
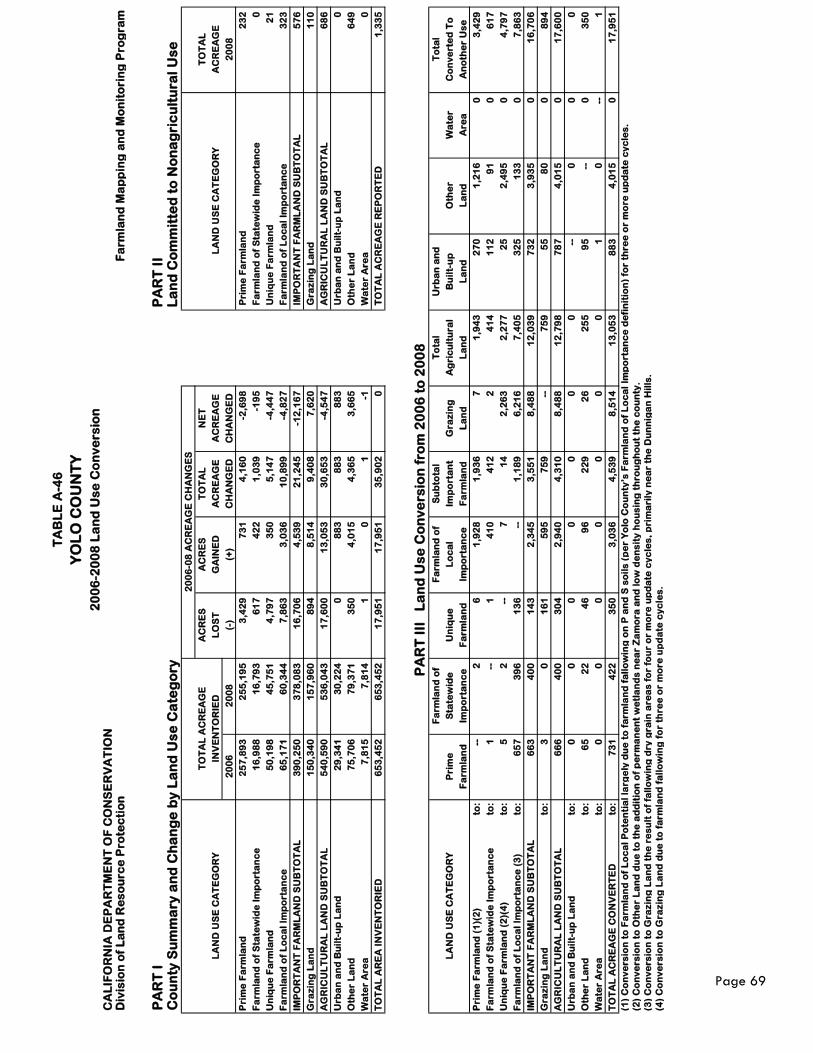
TA
BL
E A
-46
YO
LO
CO
UN
TY
20
06
-20
08
La
nd
Us
e C
on
ve
rsio
nC
AL
IFO
RN
IA D
EP
AR
TM
EN
T O
F C
ON
SE
RV
AT
ION
Div
isio
n o
f L
an
d R
es
ou
rce
Pro
tec
tio
nF
arm
lan
d M
ap
pin
g a
nd
Mo
nit
ori
ng
Pro
gra
m
PA
RT
I
PA
RT
II
Co
un
ty S
um
ma
ry a
nd
Ch
an
ge
by
La
nd
Us
e C
ate
go
ryL
an
d C
om
mit
ted
to
No
na
gri
cu
ltu
ral
Us
e
20
06
-08
AC
RE
AG
E C
HA
NG
ES
T
OT
AL
AC
RE
AG
EA
CR
ES
AC
RE
ST
OT
AL
NE
T
TO
TA
L
LA
ND
US
E C
AT
EG
OR
YIN
VE
NT
OR
IED
LO
ST
GA
INE
DA
CR
EA
GE
AC
RE
AG
EL
AN
D U
SE
CA
TE
GO
RY
AC
RE
AG
E
20
06
20
08
(-)
(+)
CH
AN
GE
DC
HA
NG
ED
20
08
Pri
me
Fa
rmla
nd
25
7,8
93
2
55
,19
5
3,4
29
7
31
4
,16
0
-2,6
98
P
rim
e F
arm
lan
d2
32
Fa
rmla
nd
of
Sta
tew
ide
Im
po
rta
nc
e1
6,9
88
1
6,7
93
6
17
4
22
1
,03
9
-19
5
Fa
rmla
nd
of
Sta
tew
ide
Im
po
rta
nc
e0
Un
iqu
e F
arm
lan
d5
0,1
98
4
5,7
51
4
,79
7
35
0
5,1
47
-4
,44
7
Un
iqu
e F
arm
lan
d2
1
Fa
rmla
nd
of
Lo
ca
l Im
po
rta
nc
e6
5,1
71
6
0,3
44
7
,86
3
3,0
36
1
0,8
99
-4
,82
7
Fa
rmla
nd
of
Lo
ca
l Im
po
rta
nc
e3
23
IMP
OR
TA
NT
FA
RM
LA
ND
SU
BT
OT
AL
39
0,2
50
3
78
,08
3
16
,70
6
4,5
39
2
1,2
45
-1
2,1
67
I
MP
OR
TA
NT
FA
RM
LA
ND
SU
BT
OT
AL
57
6
Gra
zin
g L
an
d
15
0,3
40
1
57
,96
0
89
4
8,5
14
9
,40
8
7,6
20
G
raz
ing
La
nd
1
10
AG
RIC
UL
TU
RA
L L
AN
D S
UB
TO
TA
L5
40
,59
0
53
6,0
43
1
7,6
00
1
3,0
53
3
0,6
53
-4
,54
7
AG
RIC
UL
TU
RA
L L
AN
D S
UB
TO
TA
L6
86
Urb
an
an
d B
uil
t-u
p L
an
d2
9,3
41
3
0,2
24
0
8
83
8
83
8
83
U
rba
n a
nd
Bu
ilt-
up
La
nd
0
Oth
er
La
nd
75
,70
6
79
,37
1
35
0
4,0
15
4
,36
5
3,6
65
O
the
r L
an
d6
49
Wa
ter
Are
a7
,81
5
7,8
14
1
0
1
-1
W
ate
r A
rea
0
TO
TA
L A
RE
A I
NV
EN
TO
RIE
D
65
3,4
52
6
53
,45
2
17
,95
1
17
,95
1
35
,90
2
0
TO
TA
L A
CR
EA
GE
RE
PO
RT
ED
1,3
35
PA
RT
III
L
an
d U
se
Co
nv
ers
ion
fro
m 2
00
6 t
o 2
00
8F
arm
lan
d o
fF
arm
lan
d o
fS
ub
tota
lT
ota
lU
rba
n a
nd
To
tal
LA
ND
US
E C
AT
EG
OR
YP
rim
eS
tate
wid
eU
niq
ue
Lo
ca
lIm
po
rta
nt
Gra
zin
gA
gri
cu
ltu
ral
Bu
ilt-
up
Oth
er
Wa
ter
Co
nv
ert
ed
To
Fa
rmla
nd
Imp
ort
an
ce
Fa
rmla
nd
Imp
ort
an
ce
Fa
rmla
nd
La
nd
La
nd
La
nd
La
nd
Are
aA
no
the
r U
se
Pri
me
Fa
rmla
nd
(1
)(2
)to
: -
- 2
6
1
,92
8
1,9
36
7
1
,94
3
27
0
1,2
16
0
3
,42
9
Fa
rmla
nd
of
Sta
tew
ide
Im
po
rta
nc
eto
:1
-
- 1
4
10
4
12
2
4
14
1
12
9
1
0
61
7
Un
iqu
e F
arm
lan
d (
2)(
4)
to:
5
2
--
7
14
2
,26
3
2,2
77
2
5
2,4
95
0
4
,79
7
Fa
rmla
nd
of
Lo
ca
l Im
po
rta
nc
e (
3)
to:
65
7
39
6
13
6
--
1,1
89
6
,21
6
7,4
05
3
25
1
33
0
7
,86
3
IMP
OR
TA
NT
FA
RM
LA
ND
SU
BT
OT
AL
66
3
40
0
14
3
2,3
45
3
,55
1
8,4
88
1
2,0
39
7
32
3
,93
5
0
16
,70
6
Gra
zin
g L
an
d
to:
3
0
16
1
59
5
75
9
--
75
9
55
8
0
0
89
4
AG
RIC
UL
TU
RA
L L
AN
D S
UB
TO
TA
L6
66
4
00
3
04
2
,94
0
4,3
10
8
,48
8
12
,79
8
78
7
4,0
15
0
1
7,6
00
Urb
an
an
d B
uil
t-u
p L
an
dto
:0
0
0
0
0
0
0
-
- 0
0
0
Oth
er
La
nd
to:
65
2
2
46
9
6
22
9
26
2
55
9
5
--
0
35
0
Wa
ter
Are
ato
:0
0
0
0
0
0
0
1
0
-
- 1
TO
TA
L A
CR
EA
GE
CO
NV
ER
TE
D
to:
73
1
42
2
35
0
3,0
36
4
,53
9
8,5
14
1
3,0
53
8
83
4
,01
5
0
17
,95
1
(1)
Co
nv
ers
ion
to
Fa
rmla
nd
of
Lo
ca
l P
ote
nti
al
larg
ely
du
e t
o f
arm
lan
d f
all
ow
ing
on
P a
nd
S s
oil
s (
pe
r Y
olo
Co
un
ty’s
Fa
rmla
nd
of
Lo
ca
l Im
po
rta
nc
e d
efi
nit
ion
) fo
r th
ree
or
mo
re u
pd
ate
cy
cle
s.
(2)
Co
nv
ers
ion
to
Oth
er
La
nd
du
e t
o t
he
ad
dit
ion
of
pe
rma
ne
nt
we
tla
nd
s n
ea
r Z
am
ora
an
d l
ow
de
ns
ity
ho
us
ing
th
rou
gh
ou
t th
e c
ou
nty
.
(3)
Co
nv
ers
ion
to
Gra
zin
g L
an
d t
he
re
su
lt o
f fa
llo
win
g d
ry g
rain
are
as
fo
r fo
ur
or
mo
re u
pd
ate
cy
cle
s,
pri
ma
rily
ne
ar
the
Du
nn
iga
n H
ills
.
(4)
Co
nv
ers
ion
to
Gra
zin
g L
an
d d
ue
to
fa
rmla
nd
fa
llo
win
g f
or
thre
e o
r m
ore
up
da
te c
yc
les
.
Page 69
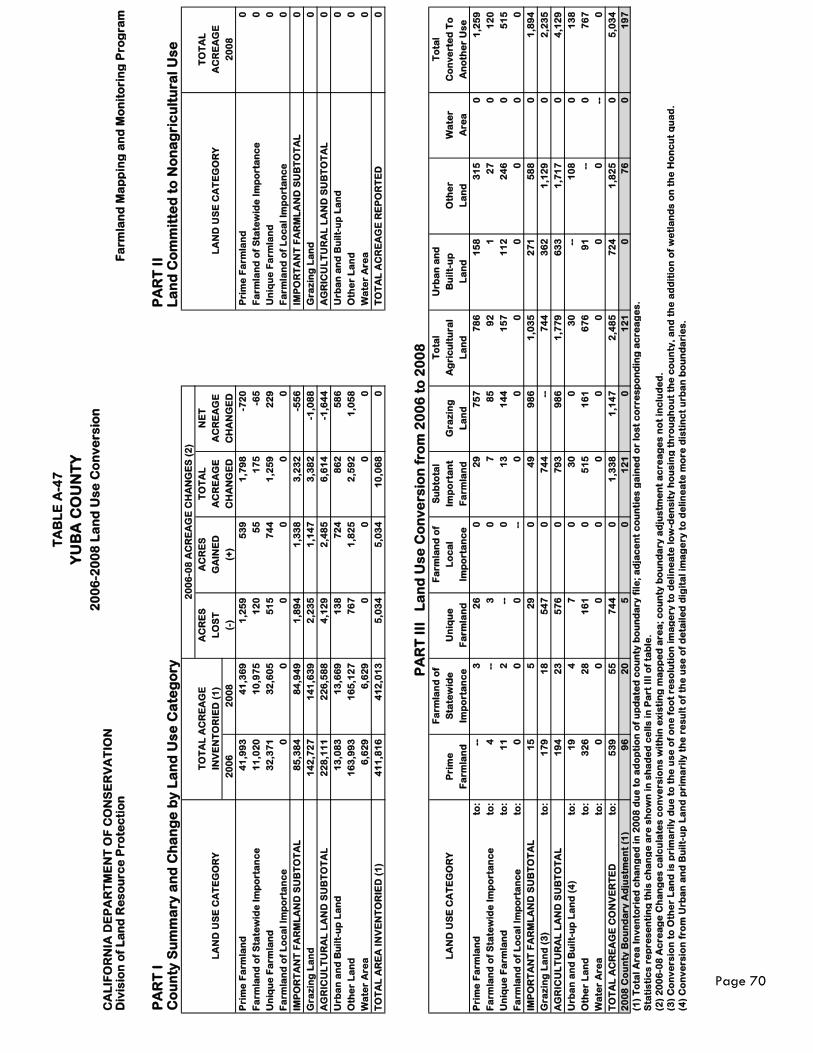
TA
BL
E A
-47
YU
BA
CO
UN
TY
20
06
-20
08
La
nd
Us
e C
on
ve
rsio
nC
AL
IFO
RN
IA D
EP
AR
TM
EN
T O
F C
ON
SE
RV
AT
ION
Div
isio
n o
f L
an
d R
es
ou
rce
Pro
tec
tio
nF
arm
lan
d M
ap
pin
g a
nd
Mo
nit
ori
ng
Pro
gra
m
PA
RT
I
PA
RT
II
Co
un
ty S
um
ma
ry a
nd
Ch
an
ge
by
La
nd
Us
e C
ate
go
ryL
an
d C
om
mit
ted
to
No
na
gri
cu
ltu
ral
Us
e
20
06
-08
AC
RE
AG
E C
HA
NG
ES
(2
)
T
OT
AL
AC
RE
AG
EA
CR
ES
AC
RE
ST
OT
AL
NE
T
TO
TA
L
LA
ND
US
E C
AT
EG
OR
YIN
VE
NT
OR
IED
(1
)L
OS
TG
AIN
ED
AC
RE
AG
EA
CR
EA
GE
LA
ND
US
E C
AT
EG
OR
YA
CR
EA
GE
20
06
20
08
(-)
(+)
CH
AN
GE
DC
HA
NG
ED
20
08
Pri
me
Fa
rmla
nd
41
,99
3
41
,36
9
1,2
59
5
39
1
,79
8
-72
0
Pri
me
Fa
rmla
nd
0
Fa
rmla
nd
of
Sta
tew
ide
Im
po
rta
nc
e1
1,0
20
1
0,9
75
1
20
5
5
17
5
-65
F
arm
lan
d o
f S
tate
wid
e I
mp
ort
an
ce
0
Un
iqu
e F
arm
lan
d3
2,3
71
3
2,6
05
5
15
7
44
1
,25
9
22
9
Un
iqu
e F
arm
lan
d0
Fa
rmla
nd
of
Lo
ca
l Im
po
rta
nc
e0
0
0
0
0
0
F
arm
lan
d o
f L
oc
al
Imp
ort
an
ce
0
IMP
OR
TA
NT
FA
RM
LA
ND
SU
BT
OT
AL
85
,38
4
84
,94
9
1,8
94
1
,33
8
3,2
32
-5
56
I
MP
OR
TA
NT
FA
RM
LA
ND
SU
BT
OT
AL
0
Gra
zin
g L
an
d
14
2,7
27
1
41
,63
9
2,2
35
1
,14
7
3,3
82
-1
,08
8
Gra
zin
g L
an
d
0
AG
RIC
UL
TU
RA
L L
AN
D S
UB
TO
TA
L2
28
,11
1
22
6,5
88
4
,12
9
2,4
85
6
,61
4
-1,6
44
A
GR
ICU
LT
UR
AL
LA
ND
SU
BT
OT
AL
0
Urb
an
an
d B
uil
t-u
p L
an
d1
3,0
83
1
3,6
69
1
38
7
24
8
62
5
86
U
rba
n a
nd
Bu
ilt-
up
La
nd
0
Oth
er
La
nd
16
3,9
93
1
65
,12
7
76
7
1,8
25
2
,59
2
1,0
58
O
the
r L
an
d0
Wa
ter
Are
a6
,62
9
6,6
29
0
0
0
0
W
ate
r A
rea
0
TO
TA
L A
RE
A I
NV
EN
TO
RIE
D (
1)
41
1,8
16
4
12
,01
3
5,0
34
5
,03
4
10
,06
8
0
TO
TA
L A
CR
EA
GE
RE
PO
RT
ED
0
PA
RT
III
L
an
d U
se
Co
nv
ers
ion
fro
m 2
00
6 t
o 2
00
8F
arm
lan
d o
fF
arm
lan
d o
fS
ub
tota
lT
ota
lU
rba
n a
nd
To
tal
LA
ND
US
E C
AT
EG
OR
YP
rim
eS
tate
wid
eU
niq
ue
Lo
ca
lIm
po
rta
nt
Gra
zin
gA
gri
cu
ltu
ral
Bu
ilt-
up
Oth
er
Wa
ter
Co
nv
ert
ed
To
Fa
rmla
nd
Imp
ort
an
ce
Fa
rmla
nd
Imp
ort
an
ce
Fa
rmla
nd
La
nd
La
nd
La
nd
La
nd
Are
aA
no
the
r U
se
Pri
me
Fa
rmla
nd
to:
--
3
26
0
2
9
75
7
78
6
15
8
31
5
0
1,2
59
Fa
rmla
nd
of
Sta
tew
ide
Im
po
rta
nc
eto
:4
-
- 3
0
7
8
5
92
1
2
7
0
12
0
Un
iqu
e F
arm
lan
dto
:1
1
2
--
0
13
1
44
1
57
1
12
2
46
0
5
15
Fa
rmla
nd
of
Lo
ca
l Im
po
rta
nc
eto
:0
0
0
-
- 0
0
0
0
0
0
0
IMP
OR
TA
NT
FA
RM
LA
ND
SU
BT
OT
AL
15
5
2
9
0
49
9
86
1
,03
5
27
1
58
8
0
1,8
94
Gra
zin
g L
an
d (
3)
to:
17
9
18
5
47
0
7
44
-
- 7
44
3
62
1
,12
9
0
2,2
35
AG
RIC
UL
TU
RA
L L
AN
D S
UB
TO
TA
L1
94
2
3
57
6
0
79
3
98
6
1,7
79
6
33
1
,71
7
0
4,1
29
Urb
an
an
d B
uil
t-u
p L
an
d (
4)
to:
19
4
7
0
3
0
0
30
-
- 1
08
0
1
38
Oth
er
La
nd
to:
32
6
28
1
61
0
5
15
1
61
6
76
9
1
--
0
76
7
Wa
ter
Are
ato
:0
0
0
0
0
0
0
0
0
-
- 0
TO
TA
L A
CR
EA
GE
CO
NV
ER
TE
D
to:
53
9
55
7
44
0
1
,33
8
1,1
47
2
,48
5
72
4
1,8
25
0
5
,03
4
20
08
Co
un
ty B
ou
nd
ary
Ad
jus
tme
nt
(1)
96
2
0
5
0
12
1
0
12
1
0
76
0
1
97
(1)
To
tal
Are
a I
nv
en
tori
ed
ch
an
ge
d i
n 2
00
8 d
ue
to
ad
op
tio
n o
f u
pd
ate
d c
ou
nty
bo
un
da
ry f
ile
; a
dja
ce
nt
co
un
tie
s g
ain
ed
or
los
t c
orr
es
po
nd
ing
ac
rea
ge
s.
Sta
tis
tic
s r
ep
res
en
tin
g t
his
ch
an
ge
are
sh
ow
n i
n s
ha
de
d c
ell
s i
n P
art
III
of
tab
le.
(2)
20
06
-08
Ac
rea
ge
Ch
an
ge
s c
alc
ula
tes
co
nv
ers
ion
s w
ith
in e
xis
tin
g m
ap
pe
d a
rea
; c
ou
nty
bo
un
da
ry a
dju
stm
en
t a
cre
ag
es
no
t in
clu
de
d.
(3)
Co
nv
ers
ion
to
Oth
er
La
nd
is
pri
ma
rily
du
e t
o t
he
us
e o
f o
ne
fo
ot
res
olu
tio
n i
ma
ge
ry t
o d
eli
ne
ate
lo
w-d
en
sit
y h
ou
sin
g t
hro
ug
ho
ut
the
co
un
ty,
an
d t
he
ad
dit
ion
of
we
tla
nd
s o
n t
he
Ho
nc
ut
qu
ad
.
(4)
Co
nv
ers
ion
fro
m U
rba
n a
nd
Bu
ilt-
up
La
nd
pri
ma
rily
th
e r
es
ult
of
the
us
e o
f d
eta
ile
d d
igit
al
ima
ge
ry t
o d
eli
ne
ate
mo
re d
isti
nc
t u
rba
n b
ou
nd
ari
es
.
Page 70
Page 71
Appendix B 2006 and 2008
County Acreage Tallies
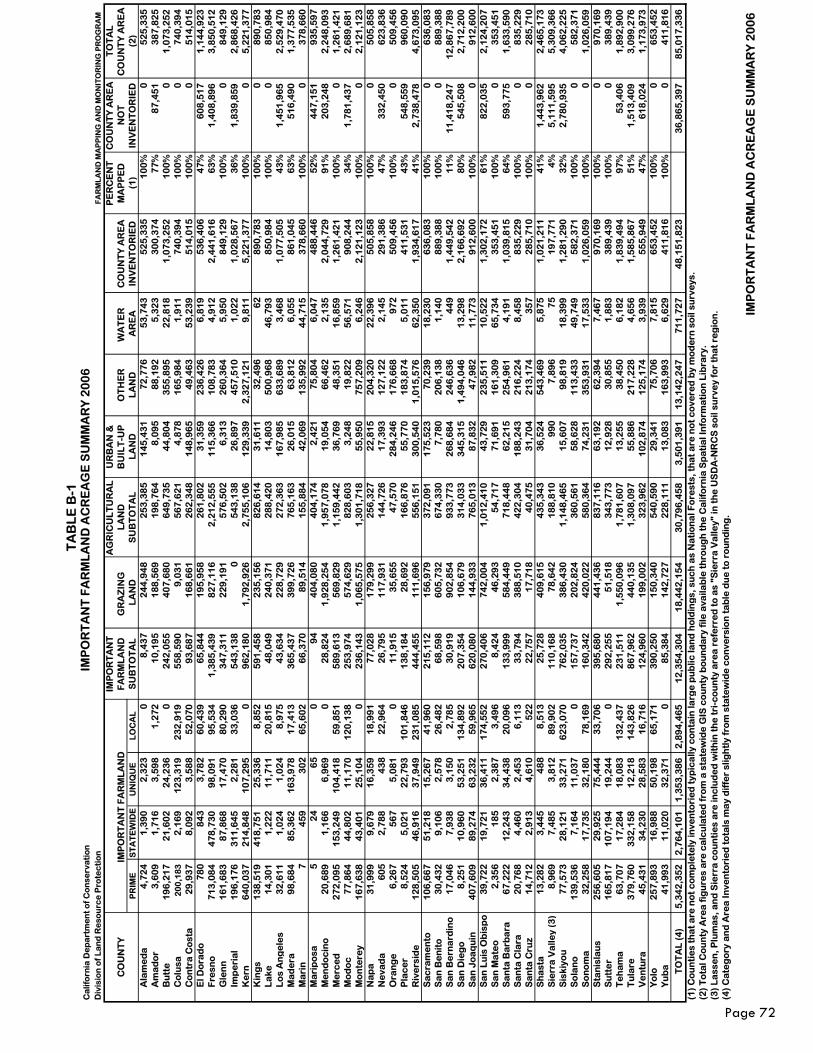
TA
BL
E B
-1C
alif
orn
ia D
ep
art
me
nt
of
Co
nse
rva
tio
nIM
PO
RT
AN
T F
AR
ML
AN
D A
CR
EA
GE
SU
MM
AR
Y 2
00
6D
ivis
ion
of
La
nd
Re
sou
rce
Pro
tec
tio
nF
AR
ML
AN
D M
AP
PIN
G A
ND
MO
NIT
OR
ING
PR
OG
RA
M
IMP
OR
TA
NT
AG
RIC
UL
TU
RA
LU
RB
AN
&P
ER
CE
NT
CO
UN
TY
AR
EA
TO
TA
LC
OU
NT
YIM
PO
RT
AN
T F
AR
ML
AN
DF
AR
ML
AN
DG
RA
ZIN
G
LA
ND
BU
ILT
-UP
OT
HE
RW
AT
ER
C
OU
NT
Y A
RE
AM
AP
PE
DN
OT
CO
UN
TY
AR
EA
PR
IME
ST
AT
EW
IDE
UN
IQU
EL
OC
AL
SU
BT
OT
AL
LA
ND
SU
BT
OT
AL
LA
ND
LA
ND
AR
EA
INV
EN
TO
RIE
D(1
)IN
VE
NT
OR
IED
(2)
Ala
me
da
4,7
24
1
,39
0
2,3
23
0
8
,43
7
24
4,9
48
2
53
,38
5
14
5,4
31
7
2,7
76
5
3,7
43
5
25
,33
5
10
0%
0
52
5,3
35
A
ma
do
r3
,60
9
1,7
16
3
,59
8
1,2
72
1
0,1
95
1
88
,56
9
19
8,7
64
8
,09
5
88
,19
2
5,3
23
3
00
,37
4
77
%8
7,4
51
3
87
,82
5
Bu
tte
19
6,2
17
2
1,6
02
2
4,2
36
0
2
42
,05
5
40
7,6
80
6
49
,73
5
44
,80
4
35
5,8
95
2
2,8
18
1
,07
3,2
52
1
00
%0
1
,07
3,2
52
C
olu
sa2
00
,18
3
2,1
69
1
23
,31
9
23
2,9
19
5
58
,59
0
9,0
31
5
67
,62
1
4,8
78
1
65
,98
4
1,9
11
7
40
,39
4
10
0%
0
74
0,3
94
C
on
tra
Co
sta
29
,93
7
8,0
92
3
,58
8
52
,07
0
93
,68
7
16
8,6
61
2
62
,34
8
14
8,9
65
4
9,4
63
5
3,2
39
5
14
,01
5
10
0%
0
51
4,0
15
E
l Do
rad
o7
80
8
43
3
,78
2
60
,43
9
65
,84
4
19
5,9
58
2
61
,80
2
31
,35
9
23
6,4
26
6
,81
9
53
6,4
06
4
7%
60
8,5
17
1
,14
4,9
23
F
resn
o7
13
,08
4
47
8,7
30
9
8,0
91
9
5,5
34
1
,38
5,4
39
8
27
,11
6
2,2
12
,55
5
11
5,3
66
1
08
,78
3
4,9
12
2
,44
1,6
16
6
3%
1,4
08
,89
6
3,8
50
,51
2
Gle
nn
16
1,6
83
8
7,8
68
1
7,4
70
8
0,2
90
3
47
,31
1
22
9,1
91
5
76
,50
2
6,3
13
2
60
,36
4
5,9
50
8
49
,12
9
10
0%
0
84
9,1
29
Im
pe
ria
l1
96
,17
6
31
1,6
45
2
,28
1
33
,03
6
54
3,1
38
0
5
43
,13
8
26
,89
7
45
7,5
10
1
,02
2
1,0
28
,56
7
36
%1
,83
9,8
59
2
,86
8,4
26
K
ern
64
0,0
37
2
14
,84
8
10
7,2
95
0
9
62
,18
0
1,7
92
,92
6
2,7
55
,10
6
12
9,3
39
2
,32
7,1
21
9
,81
1
5,2
21
,37
7
10
0%
0
5,2
21
,37
7
Kin
gs
13
8,5
19
4
18
,75
1
25
,33
6
8,8
52
5
91
,45
8
23
5,1
56
8
26
,61
4
31
,61
1
32
,49
6
62
8
90
,78
3
10
0%
0
89
0,7
83
L
ake
14
,30
1
1,2
22
1
1,7
11
2
0,8
15
4
8,0
49
2
40
,37
1
28
8,4
20
1
4,8
03
5
00
,96
8
46
,79
3
85
0,9
84
1
00
%0
8
50
,98
4
Lo
s A
ng
ele
s3
2,6
11
1
,02
4
1,0
24
8
,97
5
43
,63
4
22
8,7
29
2
72
,36
3
16
7,9
85
6
33
,68
9
3,4
68
1
,07
7,5
05
4
3%
1,4
51
,96
5
2,5
29
,47
0
Ma
de
ra9
8,6
84
8
5,3
62
1
63
,97
8
17
,41
3
36
5,4
37
3
99
,72
6
76
5,1
63
2
6,0
15
6
3,8
12
6
,05
5
86
1,0
45
6
3%
51
6,4
90
1
,37
7,5
35
M
ari
n7
4
59
3
02
6
5,6
02
6
6,3
70
8
9,5
14
1
55
,88
4
42
,06
9
13
5,9
92
4
4,7
15
3
78
,66
0
10
0%
0
37
8,6
60
M
ari
po
sa5
2
4
65
0
9
4
40
4,0
80
4
04
,17
4
2,4
21
7
5,8
04
6
,04
7
48
8,4
46
5
2%
44
7,1
51
9
35
,59
7
Me
nd
oc
ino
20
,68
9
1,1
66
6
,96
9
0
28
,82
4
1,9
28
,25
4
1,9
57
,07
8
19
,05
4
66
,46
2
2,1
35
2
,04
4,7
29
9
1%
20
3,2
48
2
,24
8,0
93
M
erc
ed
27
2,0
95
1
53
,24
9
10
4,4
18
5
9,8
51
5
89
,61
3
56
9,8
29
1
,15
9,4
42
3
6,7
69
4
8,3
51
1
6,8
59
1
,26
1,4
21
1
00
%0
1
,26
1,4
21
M
od
oc
77
,86
4
44
,80
2
11
,17
0
12
0,1
38
2
53
,97
4
57
4,6
29
8
28
,60
3
3,2
48
1
9,8
22
5
6,5
71
9
08
,24
4
34
%1
,78
1,4
37
2
,68
9,6
81
M
on
tere
y1
67
,63
8
43
,40
1
25
,10
4
0
23
6,1
43
1
,06
5,5
75
1
,30
1,7
18
5
5,9
50
7
57
,20
9
6,2
46
2
,12
1,1
23
1
00
%0
2
,12
1,1
23
N
ap
a3
1,9
99
9
,67
9
16
,35
9
18
,99
1
77
,02
8
17
9,2
99
2
56
,32
7
22
,81
5
20
4,3
20
2
2,3
96
5
05
,85
8
10
0%
0
50
5,8
58
N
eva
da
60
5
2,7
88
4
38
2
2,9
64
2
6,7
95
1
17
,93
1
14
4,7
26
1
7,3
93
1
27
,12
2
2,1
45
2
91
,38
6
47
%3
32
,45
0
62
3,8
36
O
ran
ge
6,2
67
5
67
5
,08
1
0
11
,91
5
35
,65
5
47
,57
0
28
4,2
46
1
76
,66
8
97
2
50
9,4
56
1
00
%0
5
09
,45
6
Pla
ce
r8
,52
4
5,0
21
2
2,7
93
1
01
,84
6
13
8,1
84
2
8,6
92
1
66
,87
6
55
,77
0
18
3,8
74
5
,01
1
41
1,5
31
4
3%
54
8,5
59
9
60
,09
0
Riv
ers
ide
12
8,5
05
4
6,9
16
3
7,9
49
2
31
,08
5
44
4,4
55
1
11
,69
6
55
6,1
51
3
00
,54
0
1,0
15
,57
6
62
,35
0
1,9
34
,61
7
41
%2
,73
8,4
78
4
,67
3,0
95
S
ac
ram
en
to1
06
,66
7
51
,21
8
15
,26
7
41
,96
0
21
5,1
12
1
56
,97
9
37
2,0
91
1
75
,52
3
70
,23
9
18
,23
0
63
6,0
83
1
00
%0
6
36
,08
3
Sa
n B
en
ito
30
,43
2
9,1
06
2
,57
8
26
,48
2
68
,59
8
60
5,7
32
6
74
,33
0
7,7
80
2
06
,13
8
1,1
40
8
89
,38
8
10
0%
0
88
9,3
88
S
an
Be
rna
rdin
o1
7,0
46
7
,93
8
3,1
50
2
,78
5
30
,91
9
90
2,8
54
9
33
,77
3
26
8,6
84
2
46
,63
6
44
9
1,4
49
,54
2
11
%1
1,4
18
,24
7
12
,86
7,7
89
S
an
Die
go
8,2
51
1
0,9
60
5
3,2
51
1
34
,89
2
20
7,3
54
1
06
,67
9
31
4,0
33
3
45
,31
5
1,4
94
,04
6
13
,29
8
2,1
66
,69
2
80
%5
45
,50
8
2,7
12
,20
0
Sa
n J
oa
qu
in4
07
,60
9
89
,27
4
63
,23
2
59
,96
5
62
0,0
80
1
44
,93
3
76
5,0
13
8
7,8
32
4
7,9
82
1
1,7
73
9
12
,60
0
10
0%
0
91
2,6
00
S
an
Lu
is O
bis
po
39
,72
2
19
,72
1
36
,41
1
17
4,5
52
2
70
,40
6
74
2,0
04
1
,01
2,4
10
4
3,7
29
2
35
,51
1
10
,52
2
1,3
02
,17
2
61
%8
22
,03
5
2,1
24
,20
7
Sa
n M
ate
o2
,35
6
18
5
2,3
87
3
,49
6
8,4
24
4
6,2
93
5
4,7
17
7
1,6
91
1
61
,30
9
65
,73
4
35
3,4
51
1
00
%0
3
53
,45
1
Sa
nta
Ba
rba
ra6
7,2
22
1
2,2
43
3
4,4
38
2
0,0
96
1
33
,99
9
58
4,4
49
7
18
,44
8
62
,21
5
25
4,9
61
4
,19
1
1,0
39
,81
5
64
%5
93
,77
5
1,6
33
,59
0
Sa
nta
Cla
ra2
0,7
68
4
,46
0
2,4
53
6
,11
3
33
,79
4
38
8,5
10
4
22
,30
4
18
8,2
43
2
16
,22
4
8,4
58
8
35
,22
9
10
0%
0
83
5,2
29
S
an
ta C
ruz
14
,71
2
2,9
13
4
,61
0
52
2
22
,75
7
17
,71
8
40
,47
5
31
,70
4
21
3,1
74
3
57
2
85
,71
0
10
0%
0
28
5,7
10
S
ha
sta
13
,28
2
3,4
45
4
88
8
,51
3
25
,72
8
40
9,6
15
4
35
,34
3
36
,52
4
54
3,4
69
5
,87
5
1,0
21
,21
1
41
%1
,44
3,9
62
2
,46
5,1
73
S
ierr
a V
alle
y (3
)8
,96
9
7,4
85
3
,81
2
89
,90
2
11
0,1
68
7
8,6
42
1
88
,81
0
99
0
7,8
96
7
5
19
7,7
71
4
%5
,11
1,5
95
5
,30
9,3
66
S
iski
you
7
7,5
73
2
8,1
21
3
3,2
71
6
23
,07
0
76
2,0
35
3
86
,43
0
1,1
48
,46
5
15
,60
7
98
,81
9
18
,39
9
1,2
81
,29
0
32
%2
,78
0,9
35
4
,06
2,2
25
S
ola
no
13
9,5
36
7
,16
4
11
,03
7
0
15
7,7
37
2
02
,82
4
36
0,5
61
5
8,6
28
1
13
,43
3
49
,74
9
58
2,3
71
1
00
%0
5
82
,37
1
So
no
ma
32
,25
8
17
,73
5
32
,18
0
78
,16
9
16
0,3
42
4
20
,02
2
58
0,3
64
7
4,2
31
3
53
,93
1
17
,53
3
1,0
26
,05
9
10
0%
0
1,0
26
,05
9
Sta
nis
lau
s2
56
,60
5
29
,92
5
75
,44
4
33
,70
6
39
5,6
80
4
41
,43
6
83
7,1
16
6
3,1
92
6
2,3
94
7
,46
7
97
0,1
69
1
00
%0
9
70
,16
9
Su
tte
r1
65
,81
7
10
7,1
94
1
9,2
44
0
2
92
,25
5
51
,51
8
34
3,7
73
1
2,9
28
3
0,8
55
1
,88
3
38
9,4
39
1
00
%0
3
89
,43
9
Te
ha
ma
63
,70
7
17
,28
4
18
,08
3
13
2,4
37
2
31
,51
1
1,5
50
,09
6
1,7
81
,60
7
13
,25
5
38
,45
0
6,1
82
1
,83
9,4
94
9
7%
53
,40
6
1,8
92
,90
0
Tu
lare
37
9,7
60
3
32
,15
8
12
,21
8
14
3,8
26
8
67
,96
2
44
0,1
35
1
,30
8,0
97
5
5,8
86
2
17
,22
8
4,6
56
1
,58
5,8
67
5
1%
1,5
13
,40
9
3,0
99
,27
6
Ve
ntu
ra4
5,4
31
3
4,2
30
2
8,5
83
1
6,7
16
1
24
,96
0
19
9,0
02
3
23
,96
2
10
2,8
74
1
25
,17
4
3,9
39
5
55
,94
9
47
%6
18
,02
4
1,1
73
,97
3
Yo
lo
25
7,8
93
1
6,9
88
5
0,1
98
6
5,1
71
3
90
,25
0
15
0,3
40
5
40
,59
0
29
,34
1
75
,70
6
7,8
15
6
53
,45
2
10
0%
0
65
3,4
52
Y
ub
a4
1,9
93
1
1,0
20
3
2,3
71
0
8
5,3
84
1
42
,72
7
22
8,1
11
1
3,0
83
1
63
,99
3
6,6
29
4
11
,81
6
10
0%
0
41
1,8
16
TO
TA
L (
4)
5,3
42
,35
2
2,7
64
,10
1
1,3
53
,38
6
2,8
94
,46
5
12
,35
4,3
04
1
8,4
42
,15
4
30
,79
6,4
58
3
,50
1,3
91
1
3,1
42
,24
7
71
1,7
27
4
8,1
51
,82
3
36
,86
5,3
97
8
5,0
17
,33
6
(1)
Co
un
tie
s th
at
are
no
t c
om
ple
tely
inve
nto
rie
d t
ypic
ally
co
nta
in la
rge
pu
blic
lan
d h
old
ing
s, s
uc
h a
s N
ati
on
al F
ore
sts,
th
at
are
no
t c
ove
red
by
mo
de
rn s
oil
surv
eys
. (2
) T
ota
l Co
un
ty A
rea
fig
ure
s a
re c
alc
ula
ted
fro
m a
sta
tew
ide
GIS
co
un
ty b
ou
nd
ary
file
ava
ilab
le t
hro
ug
h t
he
Ca
lifo
rnia
Sp
ati
al I
nfo
rma
tio
n L
ibra
ry.
(3)
La
sse
n, P
lum
as,
an
d S
ierr
a c
ou
nti
es
are
inc
lud
ed
wit
hin
th
e t
ri-c
ou
nty
are
a r
efe
rre
d t
o a
s "S
ierr
a V
alle
y" in
th
e U
SD
A-N
RC
S s
oil
surv
ey
for
tha
t re
gio
n.
(4)
Ca
teg
ory
an
d A
rea
Inve
nto
rie
d t
ota
ls m
ay
dif
fer
slig
htl
y fr
om
sta
tew
ide
co
nve
rsio
n t
ab
le d
ue
to
ro
un
din
g.
IMP
OR
TA
NT
FA
RM
LA
ND
AC
RE
AG
E S
UM
MA
RY
20
06
Page 72
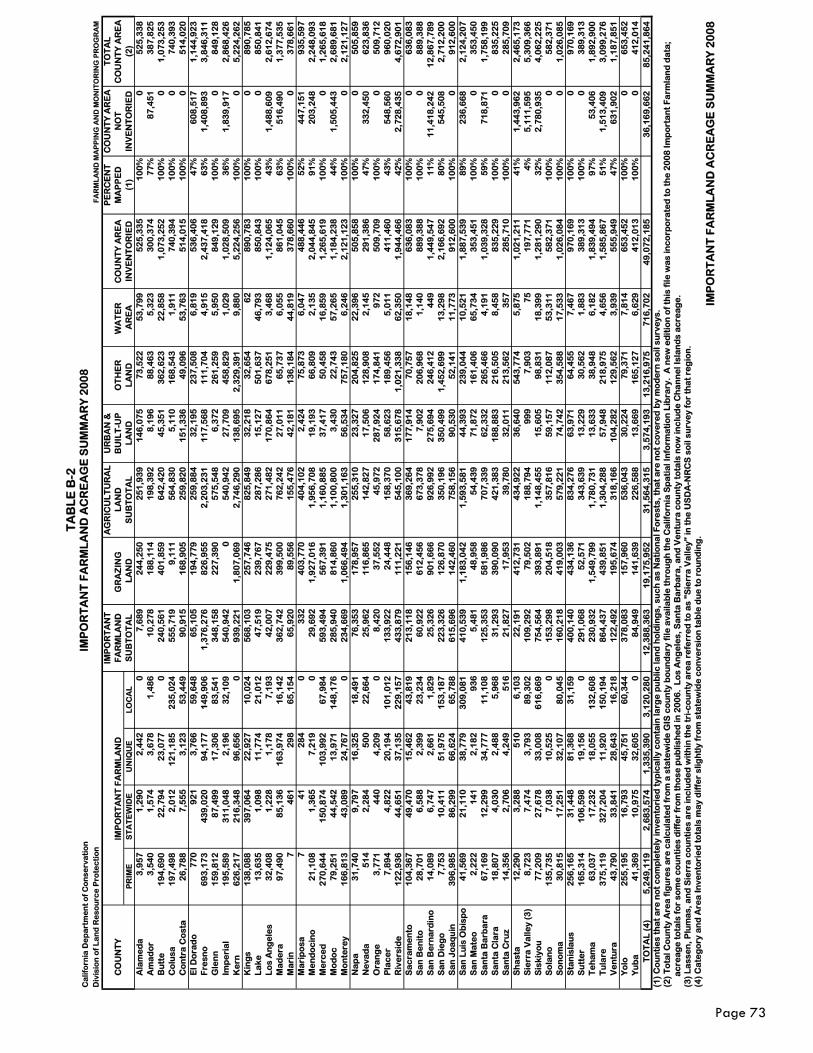
TA
BL
E B
-2C
alif
orn
ia D
ep
art
me
nt
of
Co
nse
rva
tio
nD
ivis
ion
of
La
nd
Re
sou
rce
Pro
tec
tio
nF
AR
ML
AN
D M
AP
PIN
G A
ND
MO
NIT
OR
ING
PR
OG
RA
M
IMP
OR
TA
NT
AG
RIC
UL
TU
RA
LU
RB
AN
&P
ER
CE
NT
CO
UN
TY
AR
EA
TO
TA
LC
OU
NT
YIM
PO
RT
AN
T F
AR
ML
AN
DF
AR
ML
AN
DG
RA
ZIN
G
LA
ND
BU
ILT
-UP
OT
HE
RW
AT
ER
C
OU
NT
Y A
RE
AM
AP
PE
DN
OT
CO
UN
TY
AR
EA
PR
IME
ST
AT
EW
IDE
UN
IQU
EL
OC
AL
SU
BT
OT
AL
LA
ND
SU
BT
OT
AL
LA
ND
LA
ND
AR
EA
INV
EN
TO
RIE
D(1
)IN
VE
NT
OR
IED
(2)
Ala
me
da
3,9
57
1
,29
0
2,4
42
0
7
,68
9
24
4,2
50
2
51
,93
9
14
6,0
75
7
3,5
22
5
3,7
99
5
25
,33
5
10
0%
0
52
5,3
38
A
ma
do
r3
,54
0
1,5
74
3
,67
8
1,4
86
1
0,2
78
1
88
,11
4
19
8,3
92
8
,19
6
88
,46
3
5,3
23
3
00
,37
4
77
%8
7,4
51
3
87
,82
5
Bu
tte
19
4,6
90
2
2,7
94
2
3,0
77
0
2
40
,56
1
40
1,8
59
6
42
,42
0
45
,35
1
36
2,6
23
2
2,8
58
1
,07
3,2
52
1
00
%0
1
,07
3,2
53
C
olu
sa1
97
,49
8
2,0
12
1
21
,18
5
23
5,0
24
5
55
,71
9
9,1
11
5
64
,83
0
5,1
10
1
68
,54
3
1,9
11
7
40
,39
4
10
0%
0
74
0,3
93
C
on
tra
Co
sta
26
,78
8
7,5
55
3
,12
3
53
,44
9
90
,91
5
16
8,9
05
2
59
,82
0
15
1,3
36
4
9,0
96
5
3,7
63
5
14
,01
5
10
0%
0
51
4,0
20
E
l Do
rad
o7
70
9
21
3
,76
6
59
,64
8
65
,10
5
19
4,7
79
2
59
,88
4
32
,19
5
23
7,5
08
6
,81
9
53
6,4
06
4
7%
60
8,5
17
1
,14
4,9
23
F
resn
o6
93
,17
3
43
9,0
20
9
4,1
77
1
49
,90
6
1,3
76
,27
6
82
6,9
55
2
,20
3,2
31
1
17
,56
8
11
1,7
04
4
,91
5
2,4
37
,41
8
63
%1
,40
8,8
93
3
,84
6,3
11
G
len
n1
59
,81
2
87
,49
9
17
,30
6
83
,54
1
34
8,1
58
2
27
,39
0
57
5,5
48
6
,37
2
26
1,2
59
5
,95
0
84
9,1
29
1
00
%0
8
49
,12
8
Imp
eri
al
19
5,5
89
3
11
,04
8
2,1
96
3
2,1
09
5
40
,94
2
0
54
0,9
42
2
7,7
09
4
58
,82
9
1,0
29
1
,02
8,5
09
3
6%
1,8
39
,91
7
2,8
68
,42
6
Ke
rn6
26
,21
7
21
6,3
48
9
6,6
56
0
9
39
,22
1
1,8
07
,06
9
2,7
46
,29
0
13
8,6
95
2
,32
9,3
91
9
,88
0
5,2
24
,25
6
10
0%
0
5,2
24
,26
2
Kin
gs
13
8,0
88
3
97
,06
4
22
,92
7
10
,02
4
56
8,1
03
2
57
,74
6
82
5,8
49
3
2,2
18
3
2,6
54
6
2
89
0,7
83
1
00
%0
8
90
,78
5
La
ke1
3,6
35
1
,09
8
11
,77
4
21
,01
2
47
,51
9
23
9,7
67
2
87
,28
6
15
,12
7
50
1,6
37
4
6,7
93
8
50
,84
3
10
0%
0
85
0,8
41
L
os
An
ge
les
32
,40
8
1,2
28
1
,17
8
7,1
93
4
2,0
07
2
29
,47
5
27
1,4
82
1
70
,86
4
67
8,2
51
3
,46
8
1,1
24
,06
5
43
%1
,48
8,6
09
2
,61
2,6
74
M
ad
era
97
,49
0
85
,13
6
16
3,9
74
1
6,1
42
3
62
,74
2
39
9,5
00
7
62
,24
2
27
,01
1
65
,73
7
6,0
55
8
61
,04
5
63
%5
16
,49
0
1,3
77
,53
5
Ma
rin
7
46
1
29
8
65
,15
4
65
,92
0
89
,55
6
15
5,4
76
4
2,1
81
1
36
,18
4
44
,81
9
37
8,6
60
1
00
%0
3
78
,66
1
Ma
rip
osa
7
41
2
84
0
3
32
4
03
,77
0
40
4,1
02
2
,42
4
75
,87
3
6,0
47
4
88
,44
6
52
%4
47
,15
1
93
5,5
97
M
en
do
cin
o2
1,1
08
1
,36
5
7,2
19
0
2
9,6
92
1
,92
7,0
16
1
,95
6,7
08
1
9,1
93
6
6,8
09
2
,13
5
2,0
44
,84
5
91
%2
03
,24
8
2,2
48
,09
3
Me
rce
d2
70
,64
4
15
0,8
74
1
03
,99
2
67
,98
4
59
3,4
94
5
67
,39
1
1,1
60
,88
5
37
,41
7
50
,45
8
16
,85
9
1,2
65
,61
9
10
0%
0
1,2
65
,61
8
Mo
do
c
79
,25
1
44
,54
2
13
,97
1
14
8,1
76
2
85
,94
0
81
4,8
60
1
,10
0,8
00
3
,43
0
22
,74
3
57
,26
5
1,1
84
,23
8
44
%1
,50
5,4
43
2
,68
9,6
81
M
on
tere
y1
66
,81
3
43
,08
9
24
,76
7
0
23
4,6
69
1
,06
6,4
94
1
,30
1,1
63
5
6,5
34
7
57
,18
0
6,2
46
2
,12
1,1
23
1
00
%0
2
,12
1,1
27
N
ap
a3
1,7
40
9
,79
7
16
,32
5
18
,49
1
76
,35
3
17
8,9
57
2
55
,31
0
23
,32
7
20
4,8
25
2
2,3
96
5
05
,85
8
10
0%
0
50
5,8
59
N
eva
da
51
4
2,2
84
5
00
2
2,6
64
2
5,9
62
1
16
,86
5
14
2,8
27
1
7,5
06
1
28
,90
8
2,1
45
2
91
,38
6
47
%3
32
,45
0
62
3,8
36
O
ran
ge
3,7
71
4
40
4
,20
9
0
8,4
20
3
7,5
52
4
5,9
72
2
87
,92
4
17
4,8
41
9
72
5
09
,70
9
10
0%
0
50
9,7
12
P
lac
er
7,8
94
4
,82
2
20
,19
4
10
1,0
12
1
33
,92
2
24
,44
8
15
8,3
70
5
8,6
23
1
89
,45
6
5,0
11
4
11
,46
0
43
%5
48
,56
0
96
0,0
20
R
ive
rsid
e1
22
,93
6
44
,65
1
37
,13
5
22
9,1
57
4
33
,87
9
11
1,2
21
5
45
,10
0
31
5,6
78
1
,02
1,3
38
6
2,3
50
1
,94
4,4
66
4
2%
2,7
28
,43
5
4,6
72
,90
1
Sa
cra
me
nto
10
4,3
67
4
9,4
70
1
5,4
62
4
3,8
19
2
13
,11
8
15
6,1
46
3
69
,26
4
17
7,9
14
7
0,7
57
1
8,1
48
6
36
,08
3
10
0%
0
63
6,0
83
S
an
Be
nit
o2
8,7
01
6
,58
8
2,3
99
2
3,2
34
6
0,9
22
6
12
,45
6
67
3,3
78
7
,90
2
20
6,9
68
1
,14
0
88
9,3
88
1
00
%0
8
89
,38
8
Sa
n B
ern
ard
ino
14
,08
9
6,7
47
2
,66
1
1,8
29
2
5,3
26
9
01
,66
6
92
6,9
92
2
75
,69
4
24
6,4
12
4
49
1
,44
9,5
47
1
1%
11
,41
8,2
42
1
2,8
67
,78
9
Sa
n D
ieg
o7
,75
3
10
,41
1
51
,97
5
15
3,1
87
2
23
,32
6
12
6,8
70
3
50
,19
6
35
0,4
99
1
,45
2,6
99
1
3,2
98
2
,16
6,6
92
8
0%
54
5,5
08
2
,71
2,2
00
S
an
Jo
aq
uin
39
6,9
85
8
6,2
99
6
6,6
24
6
5,7
88
6
15
,69
6
14
2,4
60
7
58
,15
6
90
,53
0
52
,14
1
11
,77
3
91
2,6
00
1
00
%0
9
12
,60
0
Sa
n L
uis
Ob
isp
o4
1,5
69
2
1,1
10
3
8,7
79
3
09
,08
1
41
0,5
39
1
,18
3,0
42
1
,59
3,5
81
4
4,3
93
2
39
,04
4
10
,52
1
1,8
87
,53
9
89
%2
36
,66
8
2,1
24
,20
7
Sa
n M
ate
o2
,22
2
14
1
2,1
82
9
36
5
,48
1
48
,95
8
54
,43
9
71
,87
2
16
1,4
06
6
5,7
34
3
53
,45
1
10
0%
0
35
3,4
50
S
an
ta B
arb
ara
67
,16
9
12
,29
9
34
,77
7
11
,10
8
12
5,3
53
5
81
,98
6
70
7,3
39
6
2,3
32
2
65
,46
6
4,1
91
1
,03
9,3
28
5
9%
71
8,8
71
1
,75
8,1
99
S
an
ta C
lara
18
,80
7
4,0
30
2
,48
8
5,9
68
3
1,2
93
3
90
,09
0
42
1,3
83
1
88
,88
3
21
6,5
05
8
,45
8
83
5,2
29
1
00
%0
8
35
,22
5
Sa
nta
Cru
z1
4,3
56
2
,70
6
4,2
49
5
16
2
1,8
27
1
7,9
53
3
9,7
80
3
2,0
11
2
13
,56
2
35
7
28
5,7
10
1
00
%0
2
85
,70
9
Sh
ast
a1
2,2
90
3
,28
8
51
0
6,1
03
2
2,1
91
4
12
,73
1
43
4,9
22
3
6,6
40
5
43
,77
4
5,8
75
1
,02
1,2
11
4
1%
1,4
43
,96
2
2,4
65
,17
3
Sie
rra
Va
lley
(3)
8,7
23
7
,47
4
3,7
93
8
9,3
02
1
09
,29
2
79
,50
2
18
8,7
94
9
99
7
,90
3
75
1
97
,77
1
4%
5,1
11
,59
5
5,3
09
,36
6
Sis
kiyo
u
77
,20
9
27
,67
8
33
,00
8
61
6,6
69
7
54
,56
4
39
3,8
91
1
,14
8,4
55
1
5,6
05
9
8,8
31
1
8,3
99
1
,28
1,2
90
3
2%
2,7
80
,93
5
4,0
62
,22
5
So
lan
o1
35
,73
5
7,0
38
1
0,5
25
0
1
53
,29
8
20
4,5
18
3
57
,81
6
59
,15
7
11
2,0
87
5
3,3
11
5
82
,37
1
10
0%
0
58
2,3
71
S
on
om
a3
0,8
15
1
7,2
51
3
2,1
07
8
0,0
45
1
60
,21
8
41
9,0
03
5
79
,22
1
74
,74
2
35
4,5
88
1
7,5
33
1
,02
6,0
84
1
00
%0
1
,02
6,0
85
S
tan
isla
us
25
6,1
65
3
1,4
48
8
1,3
68
3
1,1
59
4
00
,14
0
43
4,1
36
8
34
,27
6
63
,97
1
64
,45
5
7,4
67
9
70
,16
9
10
0%
0
97
0,1
69
S
utt
er
16
5,3
14
1
06
,59
8
19
,15
6
0
29
1,0
68
5
2,5
71
3
43
,63
9
13
,22
9
30
,56
2
1,8
83
3
89
,31
3
10
0%
0
38
9,3
13
T
eh
am
a6
3,0
37
1
7,2
32
1
8,0
55
1
32
,60
8
23
0,9
32
1
,54
9,7
99
1
,78
0,7
31
1
3,6
33
3
8,9
48
6
,18
2
1,8
39
,49
4
97
%5
3,4
06
1
,89
2,9
00
T
ula
re3
75
,11
9
32
7,2
04
1
1,9
20
1
50
,19
4
86
4,4
37
4
39
,85
1
1,3
04
,28
8
57
,94
8
21
8,9
75
4
,65
6
1,5
85
,86
7
51
%1
,51
3,4
09
3
,09
9,2
76
V
en
tura
43
,79
0
33
,84
1
28
,64
3
16
,21
8
12
2,4
92
1
95
,67
4
31
8,1
66
1
04
,28
2
12
9,5
62
3
,93
9
55
5,9
49
4
7%
63
1,9
02
1
,18
7,8
51
Y
olo
2
55
,19
5
16
,79
3
45
,75
1
60
,34
4
37
8,0
83
1
57
,96
0
53
6,0
43
3
0,2
24
7
9,3
71
7
,81
4
65
3,4
52
1
00
%0
6
53
,45
2
Yu
ba
41
,36
9
10
,97
5
32
,60
5
0
84
,94
9
14
1,6
39
2
26
,58
8
13
,66
9
16
5,1
27
6
,62
9
41
2,0
13
1
00
%0
4
12
,01
4
TO
TA
L (
4)
5,2
49
,11
9
2,6
83
,57
4
1,3
35
,39
0
3,1
20
,28
0
12
,38
8,3
63
1
9,1
75
,95
2
31
,56
4,3
15
3
,57
4,1
93
1
3,2
16
,97
5
71
6,7
02
4
9,0
72
,18
5
36
,16
9,6
62
8
5,2
41
,86
4
(1)
Co
un
tie
s th
at
are
no
t c
om
ple
tely
inve
nto
rie
d t
ypic
ally
co
nta
in la
rge
pu
blic
lan
d h
old
ing
s, s
uc
h a
s N
ati
on
al F
ore
sts,
th
at
are
no
t c
ove
red
by
mo
de
rn s
oil
surv
eys
.
(3)
La
sse
n, P
lum
as,
an
d S
ierr
a c
ou
nti
es
are
inc
lud
ed
wit
hin
th
e t
ri-c
ou
nty
are
a r
efe
rre
d t
o a
s "S
ierr
a V
alle
y" in
th
e U
SD
A-N
RC
S s
oil
surv
ey
for
tha
t re
gio
n.
(4)
Ca
teg
ory
an
d A
rea
Inve
nto
rie
d t
ota
ls m
ay
dif
fer
slig
htl
y fr
om
sta
tew
ide
co
nve
rsio
n t
ab
le d
ue
to
ro
un
din
g.
IMP
OR
TA
NT
FA
RM
LA
ND
AC
RE
AG
E S
UM
MA
RY
20
08
IMP
OR
TA
NT
FA
RM
LA
ND
AC
RE
AG
E S
UM
MA
RY
20
08
(2)
To
tal C
ou
nty
Are
a f
igu
res
are
ca
lcu
late
d f
rom
a s
tate
wid
e G
IS c
ou
nty
bo
un
da
ry f
ile a
vaila
ble
th
rou
gh
th
e C
alif
orn
ia S
pa
tia
l In
form
ati
on
Lib
rary
. A
ne
w e
dit
ion
of
this
file
wa
s in
co
rpo
rate
d t
o t
he
20
08
Imp
ort
an
t F
arm
lan
d d
ata
;
ac
rea
ge
to
tals
fo
r so
me
co
un
tie
s d
iffe
r fr
om
th
ose
pu
blis
he
d in
20
06
. L
os
An
ge
les,
Sa
nta
Ba
rba
ra, a
nd
Ve
ntu
ra c
ou
nty
to
tals
no
w in
clu
de
Ch
an
ne
l Isl
an
ds
ac
rea
ge
.
Page 73
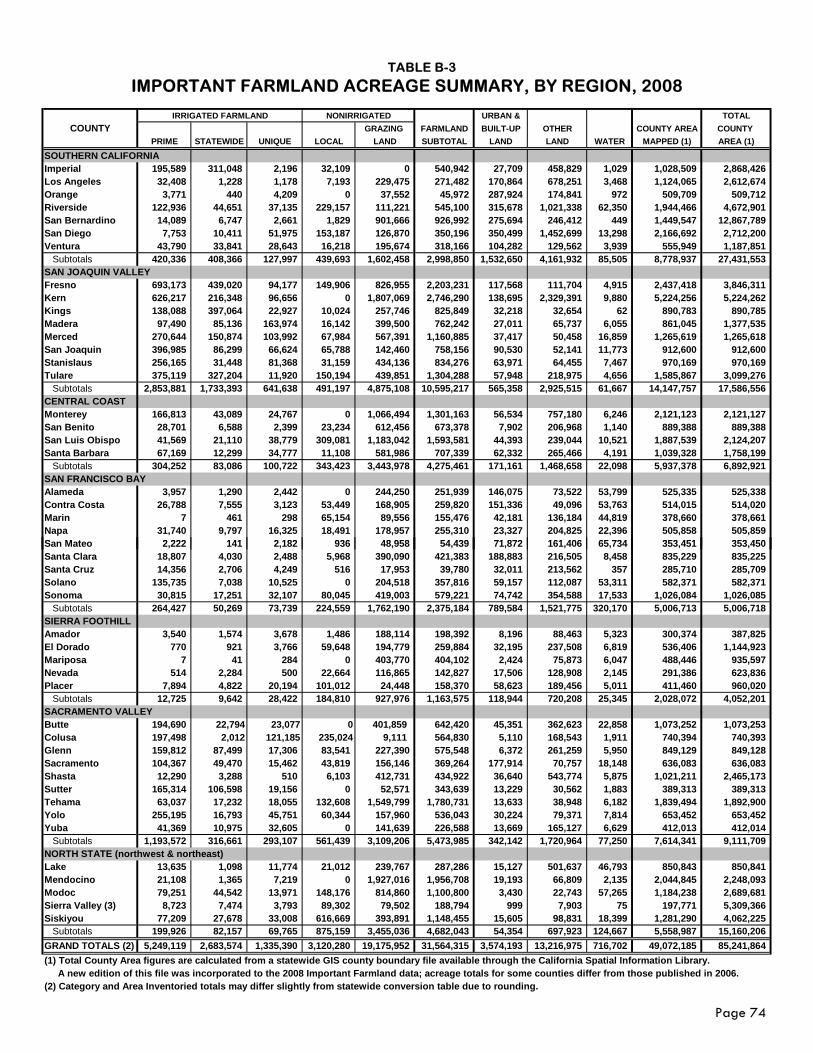
URBAN & TOTALCOUNTY GRAZING FARMLAND BUILT-UP OTHER COUNTY AREA COUNTY
PRIME STATEWIDE UNIQUE LOCAL LAND SUBTOTAL LAND LAND WATER MAPPED (1) AREA (1)
SOUTHERN CALIFORNIAImperial 195,589 311,048 2,196 32,109 0 540,942 27,709 458,829 1,029 1,028,509 2,868,426 Los Angeles 32,408 1,228 1,178 7,193 229,475 271,482 170,864 678,251 3,468 1,124,065 2,612,674 Orange 3,771 440 4,209 0 37,552 45,972 287,924 174,841 972 509,709 509,712 Riverside 122,936 44,651 37,135 229,157 111,221 545,100 315,678 1,021,338 62,350 1,944,466 4,672,901 San Bernardino 14,089 6,747 2,661 1,829 901,666 926,992 275,694 246,412 449 1,449,547 12,867,789 San Diego 7,753 10,411 51,975 153,187 126,870 350,196 350,499 1,452,699 13,298 2,166,692 2,712,200 Ventura 43,790 33,841 28,643 16,218 195,674 318,166 104,282 129,562 3,939 555,949 1,187,851 Subtotals 420,336 408,366 127,997 439,693 1,602,458 2,998,850 1,532,650 4,161,932 85,505 8,778,937 27,431,553 SAN JOAQUIN VALLEYFresno 693,173 439,020 94,177 149,906 826,955 2,203,231 117,568 111,704 4,915 2,437,418 3,846,311 Kern 626,217 216,348 96,656 0 1,807,069 2,746,290 138,695 2,329,391 9,880 5,224,256 5,224,262 Kings 138,088 397,064 22,927 10,024 257,746 825,849 32,218 32,654 62 890,783 890,785 Madera 97,490 85,136 163,974 16,142 399,500 762,242 27,011 65,737 6,055 861,045 1,377,535 Merced 270,644 150,874 103,992 67,984 567,391 1,160,885 37,417 50,458 16,859 1,265,619 1,265,618 San Joaquin 396,985 86,299 66,624 65,788 142,460 758,156 90,530 52,141 11,773 912,600 912,600 Stanislaus 256,165 31,448 81,368 31,159 434,136 834,276 63,971 64,455 7,467 970,169 970,169 Tulare 375,119 327,204 11,920 150,194 439,851 1,304,288 57,948 218,975 4,656 1,585,867 3,099,276 Subtotals 2,853,881 1,733,393 641,638 491,197 4,875,108 10,595,217 565,358 2,925,515 61,667 14,147,757 17,586,556 CENTRAL COASTMonterey 166,813 43,089 24,767 0 1,066,494 1,301,163 56,534 757,180 6,246 2,121,123 2,121,127 San Benito 28,701 6,588 2,399 23,234 612,456 673,378 7,902 206,968 1,140 889,388 889,388 San Luis Obispo 41,569 21,110 38,779 309,081 1,183,042 1,593,581 44,393 239,044 10,521 1,887,539 2,124,207 Santa Barbara 67,169 12,299 34,777 11,108 581,986 707,339 62,332 265,466 4,191 1,039,328 1,758,199 Subtotals 304,252 83,086 100,722 343,423 3,443,978 4,275,461 171,161 1,468,658 22,098 5,937,378 6,892,921 SAN FRANCISCO BAYAlameda 3,957 1,290 2,442 0 244,250 251,939 146,075 73,522 53,799 525,335 525,338 Contra Costa 26,788 7,555 3,123 53,449 168,905 259,820 151,336 49,096 53,763 514,015 514,020 Marin 7 461 298 65,154 89,556 155,476 42,181 136,184 44,819 378,660 378,661 Napa 31,740 9,797 16,325 18,491 178,957 255,310 23,327 204,825 22,396 505,858 505,859 S M t 2 222 141 2 182 936 48 958 54 439 71 872 161 406 65 734 353 451 353 450
TABLE B-3
IMPORTANT FARMLAND ACREAGE SUMMARY, BY REGION, 2008
IRRIGATED FARMLAND NONIRRIGATED
San Mateo 2,222 141 2,182 936 48,958 54,439 71,872 161,406 65,734 353,451 353,450 Santa Clara 18,807 4,030 2,488 5,968 390,090 421,383 188,883 216,505 8,458 835,229 835,225 Santa Cruz 14,356 2,706 4,249 516 17,953 39,780 32,011 213,562 357 285,710 285,709 Solano 135,735 7,038 10,525 0 204,518 357,816 59,157 112,087 53,311 582,371 582,371 Sonoma 30,815 17,251 32,107 80,045 419,003 579,221 74,742 354,588 17,533 1,026,084 1,026,085 Subtotals 264,427 50,269 73,739 224,559 1,762,190 2,375,184 789,584 1,521,775 320,170 5,006,713 5,006,718 SIERRA FOOTHILLAmador 3,540 1,574 3,678 1,486 188,114 198,392 8,196 88,463 5,323 300,374 387,825 El Dorado 770 921 3,766 59,648 194,779 259,884 32,195 237,508 6,819 536,406 1,144,923 Mariposa 7 41 284 0 403,770 404,102 2,424 75,873 6,047 488,446 935,597 Nevada 514 2,284 500 22,664 116,865 142,827 17,506 128,908 2,145 291,386 623,836 Placer 7,894 4,822 20,194 101,012 24,448 158,370 58,623 189,456 5,011 411,460 960,020 Subtotals 12,725 9,642 28,422 184,810 927,976 1,163,575 118,944 720,208 25,345 2,028,072 4,052,201 SACRAMENTO VALLEYButte 194,690 22,794 23,077 0 401,859 642,420 45,351 362,623 22,858 1,073,252 1,073,253 Colusa 197,498 2,012 121,185 235,024 9,111 564,830 5,110 168,543 1,911 740,394 740,393 Glenn 159,812 87,499 17,306 83,541 227,390 575,548 6,372 261,259 5,950 849,129 849,128 Sacramento 104,367 49,470 15,462 43,819 156,146 369,264 177,914 70,757 18,148 636,083 636,083 Shasta 12,290 3,288 510 6,103 412,731 434,922 36,640 543,774 5,875 1,021,211 2,465,173 Sutter 165,314 106,598 19,156 0 52,571 343,639 13,229 30,562 1,883 389,313 389,313 Tehama 63,037 17,232 18,055 132,608 1,549,799 1,780,731 13,633 38,948 6,182 1,839,494 1,892,900 Yolo 255,195 16,793 45,751 60,344 157,960 536,043 30,224 79,371 7,814 653,452 653,452 Yuba 41,369 10,975 32,605 0 141,639 226,588 13,669 165,127 6,629 412,013 412,014 Subtotals 1,193,572 316,661 293,107 561,439 3,109,206 5,473,985 342,142 1,720,964 77,250 7,614,341 9,111,709 NORTH STATE (northwest & northeast)Lake 13,635 1,098 11,774 21,012 239,767 287,286 15,127 501,637 46,793 850,843 850,841 Mendocino 21,108 1,365 7,219 0 1,927,016 1,956,708 19,193 66,809 2,135 2,044,845 2,248,093 Modoc 79,251 44,542 13,971 148,176 814,860 1,100,800 3,430 22,743 57,265 1,184,238 2,689,681 Sierra Valley (3) 8,723 7,474 3,793 89,302 79,502 188,794 999 7,903 75 197,771 5,309,366 Siskiyou 77,209 27,678 33,008 616,669 393,891 1,148,455 15,605 98,831 18,399 1,281,290 4,062,225 Subtotals 199,926 82,157 69,765 875,159 3,455,036 4,682,043 54,354 697,923 124,667 5,558,987 15,160,206 GRAND TOTALS (2) 5,249,119 2,683,574 1,335,390 3,120,280 19,175,952 31,564,315 3,574,193 13,216,975 716,702 49,072,185 85,241,864
(2) Category and Area Inventoried totals may differ slightly from statewide conversion table due to rounding. A new edition of this file was incorporated to the 2008 Important Farmland data; acreage totals for some counties differ from those published in 2006.(1) Total County Area figures are calculated from a statewide GIS county boundary file available through the California Spatial Information Library.
Page 74
Page 75
Appendix C County and Regional Conversion Summaries
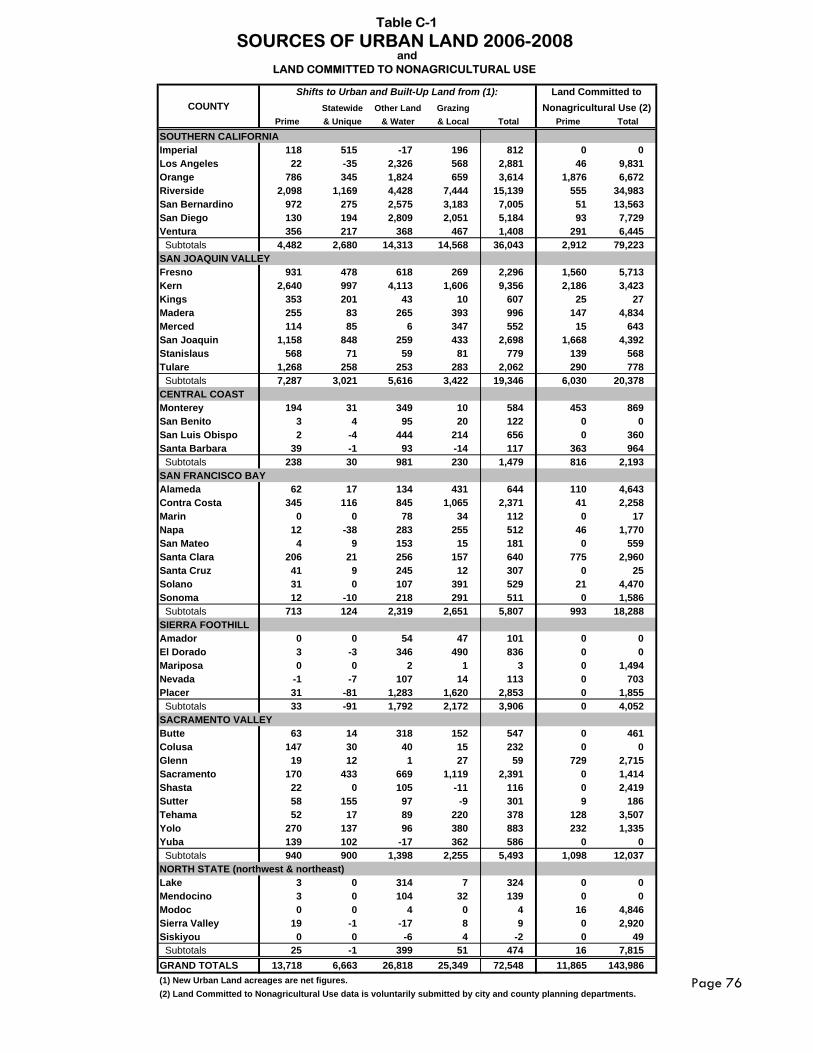
LAND COMMITTED TO NONAGRICULTURAL USE
Shifts to Urban and Built-Up Land from (1): Land Committed toCOUNTY Statewide Other Land Grazing Nonagricultural Use (2)
Prime & Unique & Water & Local Total Prime Total
SOUTHERN CALIFORNIAImperial 118 515 -17 196 812 0 0 Los Angeles 22 -35 2,326 568 2,881 46 9,831 Orange 786 345 1,824 659 3,614 1,876 6,672 Riverside 2,098 1,169 4,428 7,444 15,139 555 34,983 San Bernardino 972 275 2,575 3,183 7,005 51 13,563 San Diego 130 194 2,809 2,051 5,184 93 7,729 Ventura 356 217 368 467 1,408 291 6,445 Subtotals 4,482 2,680 14,313 14,568 36,043 2,912 79,223 SAN JOAQUIN VALLEYFresno 931 478 618 269 2,296 1,560 5,713 Kern 2,640 997 4,113 1,606 9,356 2,186 3,423 Kings 353 201 43 10 607 25 27 Madera 255 83 265 393 996 147 4,834 Merced 114 85 6 347 552 15 643 San Joaquin 1,158 848 259 433 2,698 1,668 4,392 Stanislaus 568 71 59 81 779 139 568 Tulare 1,268 258 253 283 2,062 290 778 Subtotals 7,287 3,021 5,616 3,422 19,346 6,030 20,378 CENTRAL COAST Monterey 194 31 349 10 584 453 869 San Benito 3 4 95 20 122 0 0 San Luis Obispo 2 -4 444 214 656 0 360 Santa Barbara 39 -1 93 -14 117 363 964 Subtotals 238 30 981 230 1,479 816 2,193 SAN FRANCISCO BAYAlameda 62 17 134 431 644 110 4,643 Contra Costa 345 116 845 1,065 2,371 41 2,258 Marin 0 0 78 34 112 0 17 Napa 12 -38 283 255 512 46 1,770 San Mateo 4 9 153 15 181 0 559 Santa Clara 206 21 256 157 640 775 2,960 Santa Cruz 41 9 245 12 307 0 25 Solano 31 0 107 391 529 21 4,470 Sonoma 12 -10 218 291 511 0 1,586 Subtotals 713 124 2,319 2,651 5,807 993 18,288 SIERRA FOOTHILLAmador 0 0 54 47 101 0 0 El Dorado 3 -3 346 490 836 0 0 Mariposa 0 0 2 1 3 0 1,494 Nevada -1 -7 107 14 113 0 703 Placer 31 -81 1,283 1,620 2,853 0 1,855 Subtotals 33 -91 1,792 2,172 3,906 0 4,052 SACRAMENTO VALLEYButte 63 14 318 152 547 0 461 Colusa 147 30 40 15 232 0 0 Glenn 19 12 1 27 59 729 2,715 Sacramento 170 433 669 1,119 2,391 0 1,414 Shasta 22 0 105 -11 116 0 2,419 Sutter 58 155 97 -9 301 9 186 Tehama 52 17 89 220 378 128 3,507 Yolo 270 137 96 380 883 232 1,335 Yuba 139 102 -17 362 586 0 0 Subtotals 940 900 1,398 2,255 5,493 1,098 12,037 NORTH STATE (northwest & northeast)Lake 3 0 314 7 324 0 0 Mendocino 3 0 104 32 139 0 0 Modoc 0 0 4 0 4 16 4,846 Sierra Valley 19 -1 -17 8 9 0 2,920 Siskiyou 0 0 -6 4 -2 0 49 Subtotals 25 -1 399 51 474 16 7,815 GRAND TOTALS 13,718 6,663 26,818 25,349 72,548 11,865 143,986 (1) New Urban Land acreages are net figures. (2) Land Committed to Nonagricultural Use data is voluntarily submitted by city and county planning departments.
Table C-1
SOURCES OF URBAN LAND 2006-2008and
Page 76
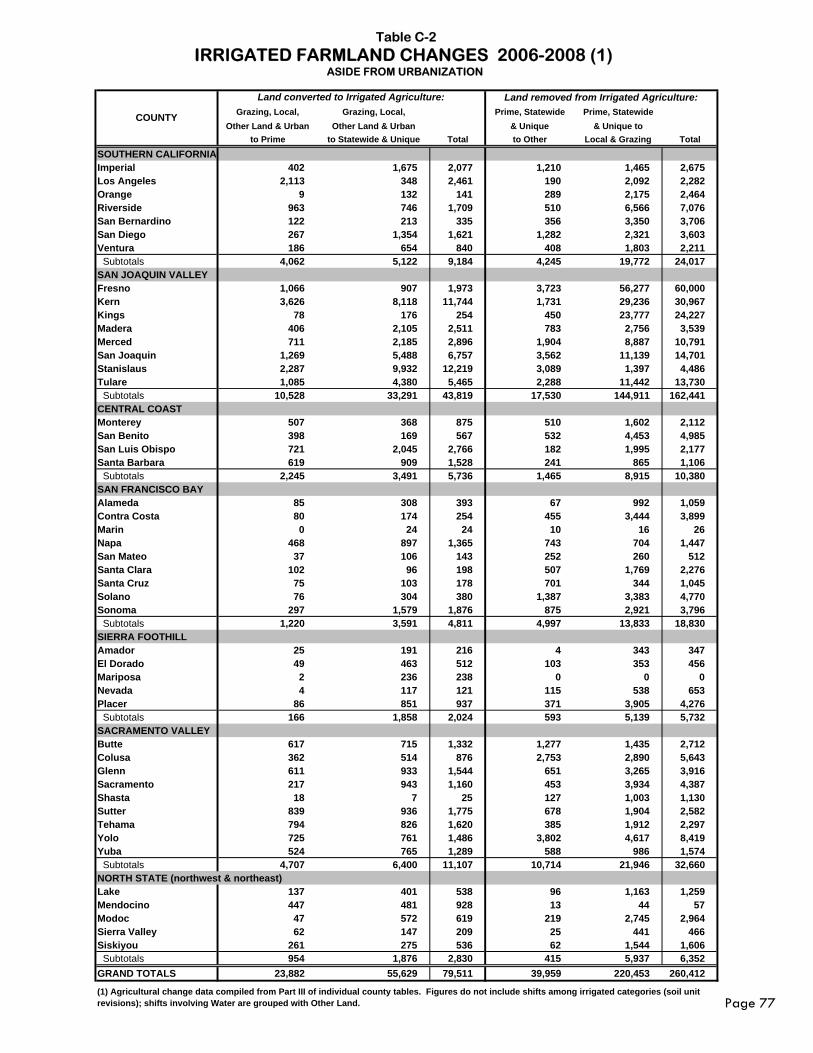
Land converted to Irrigated Agriculture: Land removed from Irrigated Agriculture:Grazing, Local, Grazing, Local, Prime, Statewide Prime, Statewide
Other Land & Urban Other Land & Urban & Unique & Unique toto Prime to Statewide & Unique Total to Other Local & Grazing Total
SOUTHERN CALIFORNIAImperial 402 1,675 2,077 1,210 1,465 2,675 Los Angeles 2,113 348 2,461 190 2,092 2,282 Orange 9 132 141 289 2,175 2,464 Riverside 963 746 1,709 510 6,566 7,076 San Bernardino 122 213 335 356 3,350 3,706 San Diego 267 1,354 1,621 1,282 2,321 3,603 Ventura 186 654 840 408 1,803 2,211 Subtotals 4,062 5,122 9,184 4,245 19,772 24,017 SAN JOAQUIN VALLEYFresno 1,066 907 1,973 3,723 56,277 60,000 Kern 3,626 8,118 11,744 1,731 29,236 30,967 Kings 78 176 254 450 23,777 24,227 Madera 406 2,105 2,511 783 2,756 3,539 Merced 711 2,185 2,896 1,904 8,887 10,791 San Joaquin 1,269 5,488 6,757 3,562 11,139 14,701 Stanislaus 2,287 9,932 12,219 3,089 1,397 4,486 Tulare 1,085 4,380 5,465 2,288 11,442 13,730 Subtotals 10,528 33,291 43,819 17,530 144,911 162,441 CENTRAL COAST Monterey 507 368 875 510 1,602 2,112 San Benito 398 169 567 532 4,453 4,985 San Luis Obispo 721 2,045 2,766 182 1,995 2,177 Santa Barbara 619 909 1,528 241 865 1,106 Subtotals 2,245 3,491 5,736 1,465 8,915 10,380 SAN FRANCISCO BAYAlameda 85 308 393 67 992 1,059 Contra Costa 80 174 254 455 3,444 3,899 Marin 0 24 24 10 16 26 Napa 468 897 1,365 743 704 1,447 San Mateo 37 106 143 252 260 512 Santa Clara 102 96 198 507 1,769 2,276 Santa Cruz 75 103 178 701 344 1,045 Solano 76 304 380 1,387 3,383 4,770 Sonoma 297 1,579 1,876 875 2,921 3,796 Subtotals 1,220 3,591 4,811 4,997 13,833 18,830 SIERRA FOOTHILLAmador 25 191 216 4 343 347 El Dorado 49 463 512 103 353 456 Mariposa 2 236 238 0 0 0 Nevada 4 117 121 115 538 653 Placer 86 851 937 371 3,905 4,276 Subtotals 166 1,858 2,024 593 5,139 5,732 SACRAMENTO VALLEYButte 617 715 1,332 1,277 1,435 2,712 Colusa 362 514 876 2,753 2,890 5,643 Glenn 611 933 1,544 651 3,265 3,916 Sacramento 217 943 1,160 453 3,934 4,387 Shasta 18 7 25 127 1,003 1,130 Sutter 839 936 1,775 678 1,904 2,582 Tehama 794 826 1,620 385 1,912 2,297 Yolo 725 761 1,486 3,802 4,617 8,419 Yuba 524 765 1,289 588 986 1,574 Subtotals 4,707 6,400 11,107 10,714 21,946 32,660 NORTH STATE (northwest & northeast)Lake 137 401 538 96 1,163 1,259 Mendocino 447 481 928 13 44 57 Modoc 47 572 619 219 2,745 2,964 Sierra Valley 62 147 209 25 441 466 Siskiyou 261 275 536 62 1,544 1,606 Subtotals 954 1,876 2,830 415 5,937 6,352 GRAND TOTALS 23,882 55,629 79,511 39,959 220,453 260,412
(1) Agricultural change data compiled from Part III of individual county tables. Figures do not include shifts among irrigated categories (soil unit revisions); shifts involving Water are grouped with Other Land.
Table C-2
IRRIGATED FARMLAND CHANGES 2006-2008 (1)ASIDE FROM URBANIZATION
COUNTY
Page 77
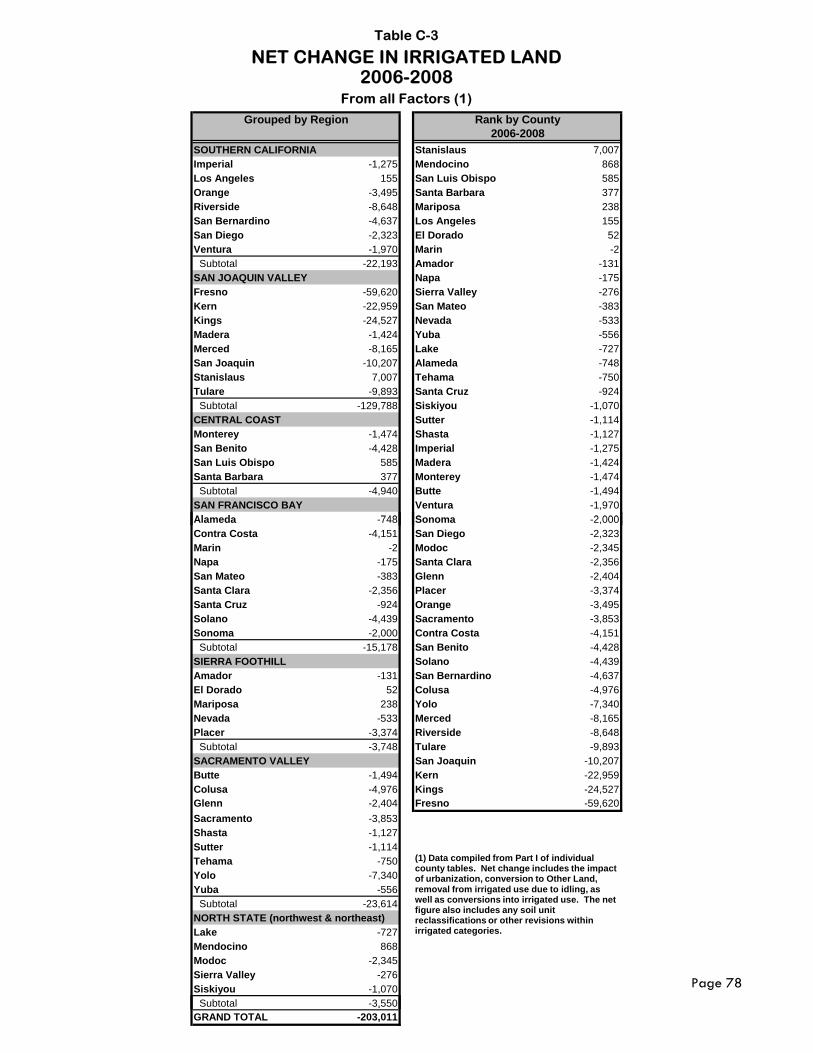
SOUTHERN CALIFORNIA Stanislaus 7,007Imperial -1,275 Mendocino 868Los Angeles 155 San Luis Obispo 585Orange -3,495 Santa Barbara 377Riverside -8,648 Mariposa 238San Bernardino -4,637 Los Angeles 155San Diego -2,323 El Dorado 52Ventura -1,970 Marin -2 Subtotal -22,193 Amador -131SAN JOAQUIN VALLEY Napa -175Fresno -59,620 Sierra Valley -276Kern -22,959 San Mateo -383Kings -24,527 Nevada -533Madera -1,424 Yuba -556Merced -8,165 Lake -727San Joaquin -10,207 Alameda -748Stanislaus 7,007 Tehama -750Tulare -9,893 Santa Cruz -924 Subtotal -129,788 Siskiyou -1,070CENTRAL COAST Sutter -1,114Monterey -1,474 Shasta -1,127San Benito -4,428 Imperial -1,275San Luis Obispo 585 Madera -1,424Santa Barbara 377 Monterey -1,474 Subtotal -4,940 Butte -1,494SAN FRANCISCO BAY Ventura -1,970Al d 748 S 2 000
Table C-3
NET CHANGE IN IRRIGATED LAND2006-2008
From all Factors (1)
2006-2008Rank by CountyGrouped by Region
Alameda -748 Sonoma -2,000Contra Costa -4,151 San Diego -2,323Marin -2 Modoc -2,345Napa -175 Santa Clara -2,356San Mateo -383 Glenn -2,404Santa Clara -2,356 Placer -3,374Santa Cruz -924 Orange -3,495Solano -4,439 Sacramento -3,853Sonoma -2,000 Contra Costa -4,151 Subtotal -15,178 San Benito -4,428SIERRA FOOTHILL Solano -4,439Amador -131 San Bernardino -4,637El Dorado 52 Colusa -4,976Mariposa 238 Yolo -7,340Nevada -533 Merced -8,165Placer -3,374 Riverside -8,648 Subtotal -3,748 Tulare -9,893SACRAMENTO VALLEY San Joaquin -10,207Butte -1,494 Kern -22,959Colusa -4,976 Kings -24,527Glenn -2,404 Fresno -59,620Sacramento -3,853Shasta -1,127Sutter -1,114Tehama -750Yolo -7,340Yuba -556 Subtotal -23,614NORTH STATE (northwest & northeast)Lake -727Mendocino 868Modoc -2,345Sierra Valley -276Siskiyou -1,070 Subtotal -3,550
(1) Data compiled from Part I of individual county tables. Net change includes the impact of urbanization, conversion to Other Land, removal from irrigated use due to idling, as well as conversions into irrigated use. The net figure also includes any soil unit reclassifications or other revisions within irrigated categories.
,GRAND TOTAL -203,011
(1) Data compiled from Part I of individual county tables. Net change includes the impact of urbanization, conversion to Other Land, removal from irrigated use due to idling, as well as conversions into irrigated use. The net figure also includes any soil unit reclassifications or other revisions within irrigated categories.
Page 78
Page 79
Appendix D Rural Land Use Mapping Tables
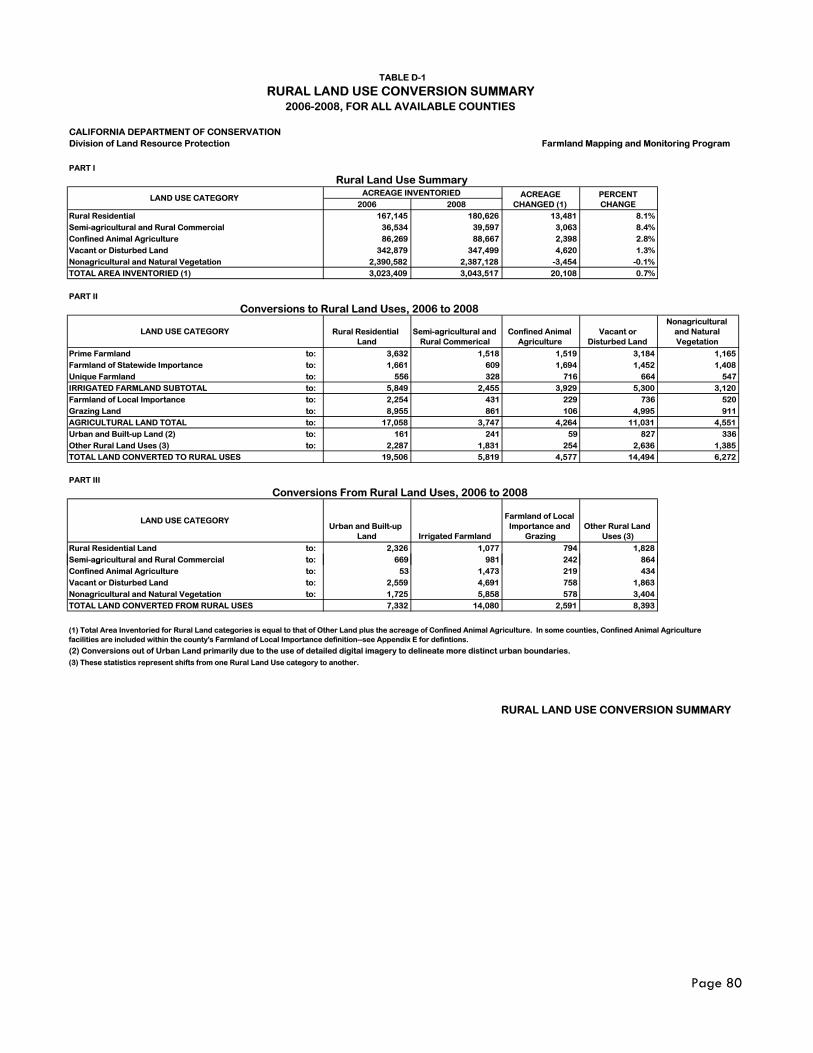
CALIFORNIA DEPARTMENT OF CONSERVATIONDivision of Land Resource Protection Farmland Mapping and Monitoring Program
PART I
2006 2008Rural Residential 167,145 180,626 13,481 8.1%Semi-agricultural and Rural Commercial 36,534 39,597 3,063 8.4%Confined Animal Agriculture 86,269 88,667 2,398 2.8%Vacant or Disturbed Land 342,879 347,499 4,620 1.3%Nonagricultural and Natural Vegetation 2,390,582 2,387,128 -3,454 -0.1%TOTAL AREA INVENTORIED (1) 3,023,409 3,043,517 20,108 0.7%
PART II
LAND USE CATEGORY Rural Residential Land
Semi-agricultural and Rural Commerical
Confined Animal Agriculture
Vacant or Disturbed Land
Nonagricultural and Natural Vegetation
Prime Farmland to: 3,632 1,518 1,519 3,184 1,165Farmland of Statewide Importance to: 1,661 609 1,694 1,452 1,408Unique Farmland to: 556 328 716 664 547IRRIGATED FARMLAND SUBTOTAL to: 5,849 2,455 3,929 5,300 3,120Farmland of Local Importance to: 2,254 431 229 736 520Grazing Land to: 8,955 861 106 4,995 911AGRICULTURAL LAND TOTAL to: 17,058 3,747 4,264 11,031 4,551Urban and Built-up Land (2) to: 161 241 59 827 336Other Rural Land Uses (3) to: 2,287 1,831 254 2,636 1,385TOTAL LAND CONVERTED TO RURAL USES 19,506 5,819 4,577 14,494 6,272
PART III
LAND USE CATEGORYUrban and Built-up
Land Irrigated Farmland
Farmland of Local Importance and
GrazingOther Rural Land
Uses (3)
Rural Residential Land to: 2,326 1,077 794 1,828Semi-agricultural and Rural Commercial to: 669 981 242 864
PERCENT CHANGE
Conversions to Rural Land Uses, 2006 to 2008
Conversions From Rural Land Uses, 2006 to 2008
TABLE D-1
RURAL LAND USE CONVERSION SUMMARY2006-2008, FOR ALL AVAILABLE COUNTIES
Rural Land Use Summary
LAND USE CATEGORYACREAGE INVENTORIED ACREAGE
CHANGED (1)
gConfined Animal Agriculture to: 53 1,473 219 434Vacant or Disturbed Land to: 2,559 4,691 758 1,863Nonagricultural and Natural Vegetation to: 1,725 5,858 578 3,404TOTAL LAND CONVERTED FROM RURAL USES 7,332 14,080 2,591 8,393
(2) Conversions out of Urban Land primarily due to the use of detailed digital imagery to delineate more distinct urban boundaries.(3) These statistics represent shifts from one Rural Land Use category to another.
RURAL LAND USE CONVERSION SUMMARY
(1) Total Area Inventoried for Rural Land categories is equal to that of Other Land plus the acreage of Confined Animal Agriculture. In some counties, Confined Animal Agriculture facilities are included within the county's Farmland of Local Importance definition--see Appendix E for defintions.
Page 80
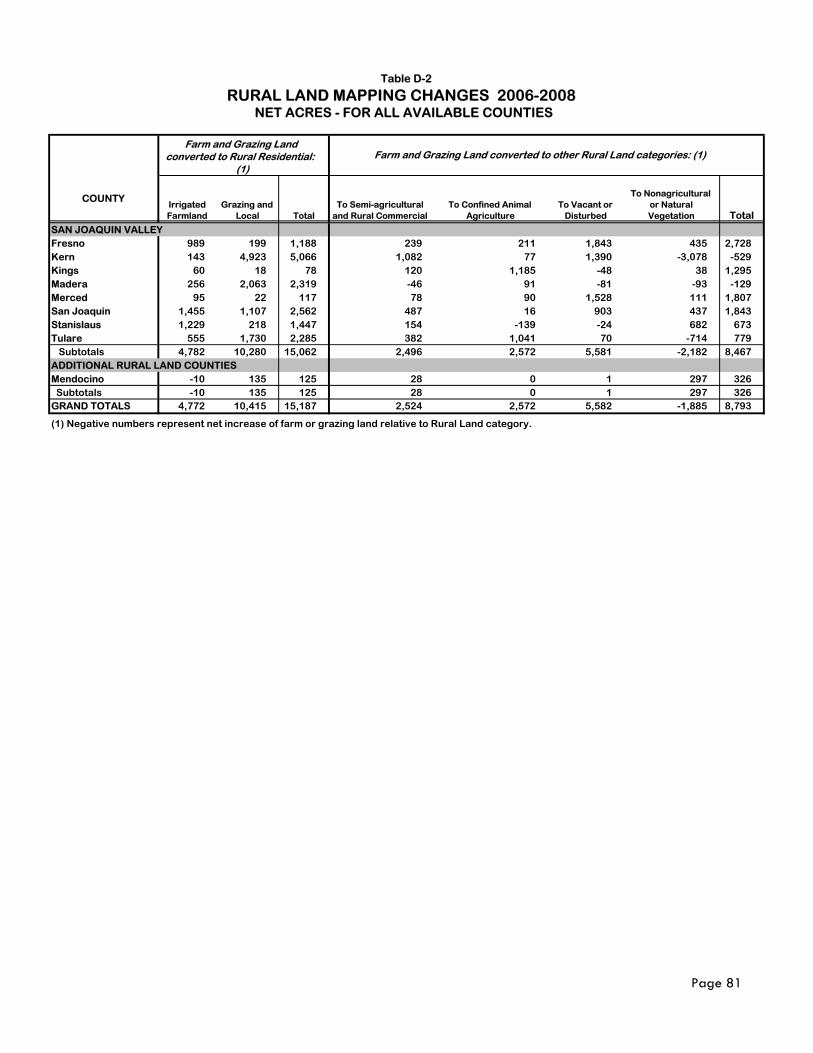
SAN JOAQUIN VALLEYFresno 989 199 1,188 239 211 1,843 435 2,728 Kern 143 4,923 5,066 1,082 77 1,390 -3,078 -529 Kings 60 18 78 120 1,185 -48 38 1,295 Madera 256 2,063 2,319 -46 91 -81 -93 -129 Merced 95 22 117 78 90 1,528 111 1,807 San Joaquin 1,455 1,107 2,562 487 16 903 437 1,843 Stanislaus 1,229 218 1,447 154 -139 -24 682 673 Tulare 555 1,730 2,285 382 1,041 70 -714 779 Subtotals 4,782 10,280 15,062 2,496 2,572 5,581 -2,182 8,467 ADDITIONAL RURAL LAND COUNTIESMendocino -10 135 125 28 0 1 297 326 Subtotals -10 135 125 28 0 1 297 326 GRAND TOTALS 4,772 10,415 15,187 2,524 2,572 5,582 -1,885 8,793
Table D-2
RURAL LAND MAPPING CHANGES 2006-2008 NET ACRES - FOR ALL AVAILABLE COUNTIES
COUNTY
(1) Negative numbers represent net increase of farm or grazing land relative to Rural Land category.
Farm and Grazing Land converted to Rural Residential:
(1)Farm and Grazing Land converted to other Rural Land categories: (1)
To Nonagricultural or Natural Vegetation
To Vacant or Disturbed
To Confined Animal Agriculture
To Semi-agricultural and Rural Commercial
Irrigated Farmland
Grazing and Local Total Total
Page 81
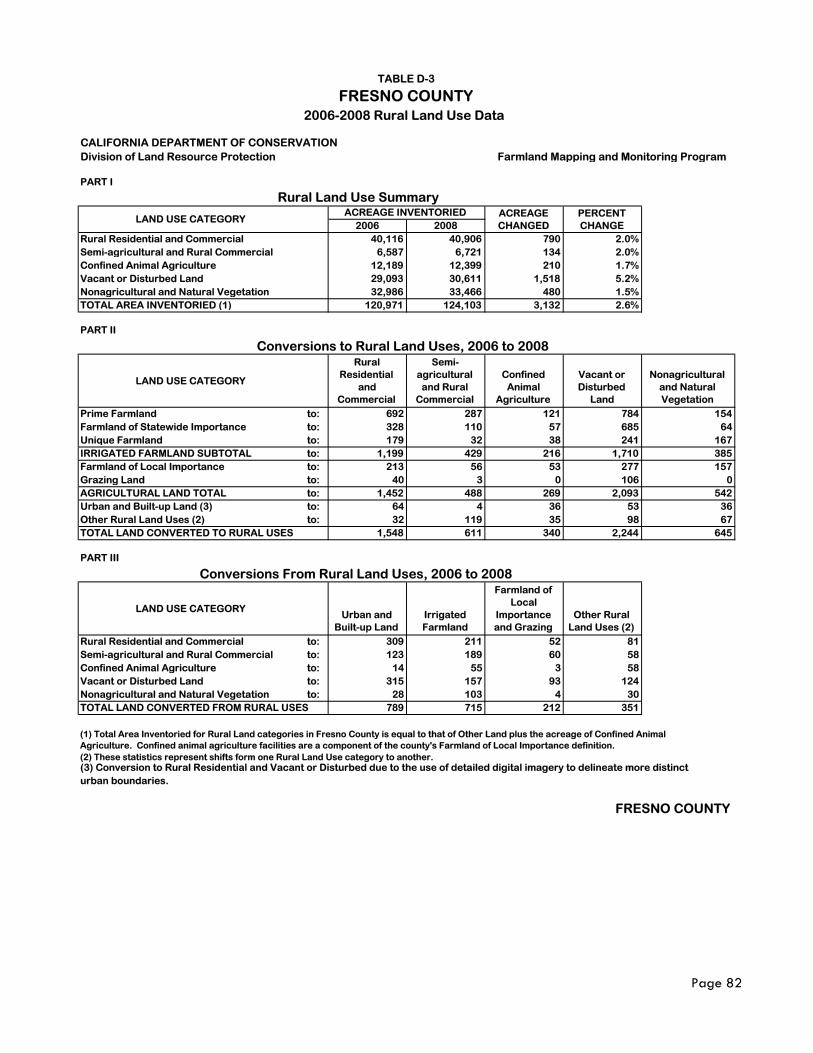
CALIFORNIA DEPARTMENT OF CONSERVATIONDivision of Land Resource Protection Farmland Mapping and Monitoring Program
PART I
2006 2008Rural Residential and Commercial 40,116 40,906 790 2.0%Semi-agricultural and Rural Commercial 6,587 6,721 134 2.0%Confined Animal Agriculture 12,189 12,399 210 1.7%Vacant or Disturbed Land 29,093 30,611 1,518 5.2%Nonagricultural and Natural Vegetation 32,986 33,466 480 1.5%TOTAL AREA INVENTORIED (1) 120,971 124,103 3,132 2.6%
PART II
LAND USE CATEGORY
Rural Residential
and Commercial
Semi-agricultural
and Rural Commercial
Confined Animal
Agriculture
Vacant or Disturbed
Land
Nonagricultural and Natural Vegetation
Prime Farmland to: 692 287 121 784 154Farmland of Statewide Importance to: 328 110 57 685 64Unique Farmland to: 179 32 38 241 167IRRIGATED FARMLAND SUBTOTAL to: 1,199 429 216 1,710 385Farmland of Local Importance to: 213 56 53 277 157Grazing Land to: 40 3 0 106 0AGRICULTURAL LAND TOTAL to: 1,452 488 269 2,093 542Urban and Built-up Land (3) to: 64 4 36 53 36Other Rural Land Uses (2) to: 32 119 35 98 67TOTAL LAND CONVERTED TO RURAL USES 1,548 611 340 2,244 645
PART III
LAND USE CATEGORYUrban and
Built-up LandIrrigated Farmland
Farmland of Local
Importance and Grazing
Other Rural Land Uses (2)
Rural Residential and Commercial to: 309 211 52 81Semi-agricultural and Rural Commercial to: 123 189 60 58Confined Animal Agriculture to: 14 55 3 58Vacant or Disturbed Land to: 315 157 93 124Nonagricultural and Natural Vegetation to: 28 103 4 30TOTAL LAND CONVERTED FROM RURAL USES 789 715 212 351
(2) These statistics represent shifts form one Rural Land Use category to another. (3) Conversion to Rural Residential and Vacant or Disturbed due to the use of detailed digital imagery to delineate more distinct urban boundaries.
FRESNO COUNTY
TABLE D-3
FRESNO COUNTY2006-2008 Rural Land Use Data
Rural Land Use Summary
LAND USE CATEGORYACREAGE INVENTORIED ACREAGE
CHANGEDPERCENT CHANGE
(1) Total Area Inventoried for Rural Land categories in Fresno County is equal to that of Other Land plus the acreage of Confined Animal Agriculture. Confined animal agriculture facilities are a component of the county's Farmland of Local Importance definition.
Conversions to Rural Land Uses, 2006 to 2008
Conversions From Rural Land Uses, 2006 to 2008
Page 82
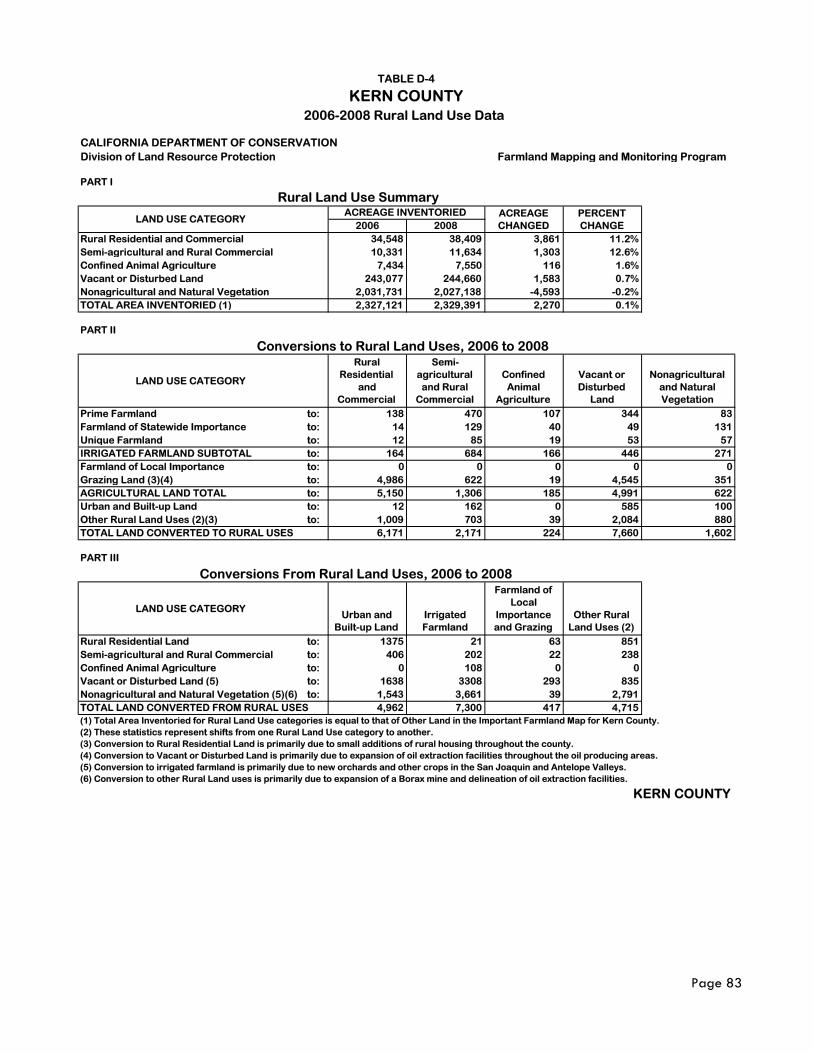
CALIFORNIA DEPARTMENT OF CONSERVATIONDivision of Land Resource Protection Farmland Mapping and Monitoring Program
PART I
2006 2008Rural Residential and Commercial 34,548 38,409 3,861 11.2%Semi-agricultural and Rural Commercial 10,331 11,634 1,303 12.6%Confined Animal Agriculture 7,434 7,550 116 1.6%Vacant or Disturbed Land 243,077 244,660 1,583 0.7%Nonagricultural and Natural Vegetation 2,031,731 2,027,138 -4,593 -0.2%TOTAL AREA INVENTORIED (1) 2,327,121 2,329,391 2,270 0.1%
PART II
LAND USE CATEGORY
Rural Residential
and Commercial
Semi-agricultural
and Rural Commercial
Confined Animal
Agriculture
Vacant or Disturbed
Land
Nonagricultural and Natural Vegetation
Prime Farmland to: 138 470 107 344 83Farmland of Statewide Importance to: 14 129 40 49 131Unique Farmland to: 12 85 19 53 57IRRIGATED FARMLAND SUBTOTAL to: 164 684 166 446 271Farmland of Local Importance to: 0 0 0 0 0Grazing Land (3)(4) to: 4,986 622 19 4,545 351AGRICULTURAL LAND TOTAL to: 5,150 1,306 185 4,991 622Urban and Built-up Land to: 12 162 0 585 100Other Rural Land Uses (2)(3) to: 1,009 703 39 2,084 880TOTAL LAND CONVERTED TO RURAL USES 6,171 2,171 224 7,660 1,602
PART III
LAND USE CATEGORYUrban and
Built-up LandIrrigated Farmland
Farmland of Local
Importance and Grazing
Other Rural Land Uses (2)
Rural Residential Land to: 1375 21 63 851Semi-agricultural and Rural Commercial to: 406 202 22 238Confined Animal Agriculture to: 0 108 0 0Vacant or Disturbed Land (5) to: 1638 3308 293 835Nonagricultural and Natural Vegetation (5)(6) to: 1,543 3,661 39 2,791TOTAL LAND CONVERTED FROM RURAL USES 4,962 7,300 417 4,715(1) Total Area Inventoried for Rural Land Use categories is equal to that of Other Land in the Important Farmland Map for Kern County.(2) These statistics represent shifts from one Rural Land Use category to another. (3) Conversion to Rural Residential Land is primarily due to small additions of rural housing throughout the county.(4) Conversion to Vacant or Disturbed Land is primarily due to expansion of oil extraction facilities throughout the oil producing areas.(5) Conversion to irrigated farmland is primarily due to new orchards and other crops in the San Joaquin and Antelope Valleys. (6) Conversion to other Rural Land uses is primarily due to expansion of a Borax mine and delineation of oil extraction facilities.
KERN COUNTY
Conversions to Rural Land Uses, 2006 to 2008
Conversions From Rural Land Uses, 2006 to 2008
TABLE D-4
KERN COUNTY2006-2008 Rural Land Use Data
Rural Land Use Summary
LAND USE CATEGORYACREAGE INVENTORIED ACREAGE
CHANGEDPERCENT CHANGE
Page 83
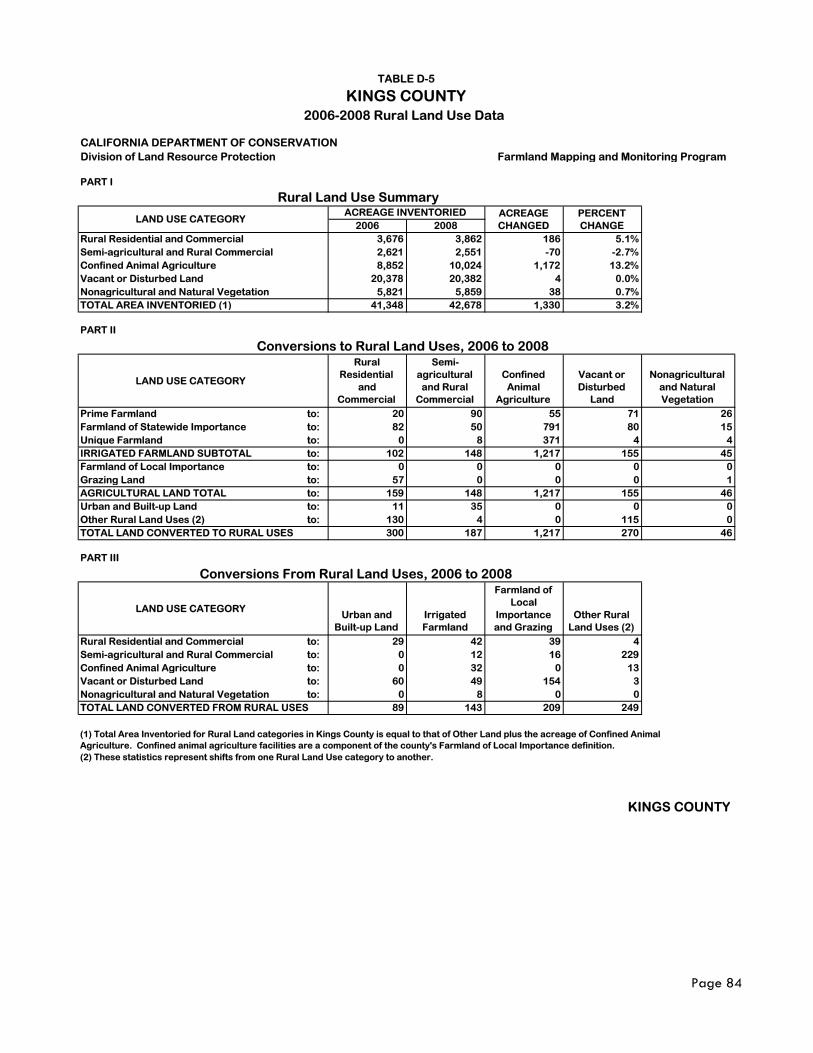
CALIFORNIA DEPARTMENT OF CONSERVATIONDivision of Land Resource Protection Farmland Mapping and Monitoring Program
PART I
2006 2008Rural Residential and Commercial 3,676 3,862 186 5.1%Semi-agricultural and Rural Commercial 2,621 2,551 -70 -2.7%Confined Animal Agriculture 8,852 10,024 1,172 13.2%Vacant or Disturbed Land 20,378 20,382 4 0.0%Nonagricultural and Natural Vegetation 5,821 5,859 38 0.7%TOTAL AREA INVENTORIED (1) 41,348 42,678 1,330 3.2%
PART II
LAND USE CATEGORY
Rural Residential
and Commercial
Semi-agricultural
and Rural Commercial
Confined Animal
Agriculture
Vacant or Disturbed
Land
Nonagricultural and Natural Vegetation
Prime Farmland to: 20 90 55 71 26Farmland of Statewide Importance to: 82 50 791 80 15Unique Farmland to: 0 8 371 4 4IRRIGATED FARMLAND SUBTOTAL to: 102 148 1,217 155 45Farmland of Local Importance to: 0 0 0 0 0Grazing Land to: 57 0 0 0 1AGRICULTURAL LAND TOTAL to: 159 148 1,217 155 46Urban and Built-up Land to: 11 35 0 0 0Other Rural Land Uses (2) to: 130 4 0 115 0TOTAL LAND CONVERTED TO RURAL USES 300 187 1,217 270 46
PART III
LAND USE CATEGORYUrban and
Built-up LandIrrigated Farmland
Farmland of Local
Importance and Grazing
Other Rural Land Uses (2)
Rural Residential and Commercial to: 29 42 39 4Semi-agricultural and Rural Commercial to: 0 12 16 229Confined Animal Agriculture to: 0 32 0 13Vacant or Disturbed Land to: 60 49 154 3Nonagricultural and Natural Vegetation to: 0 8 0 0TOTAL LAND CONVERTED FROM RURAL USES 89 143 209 249
KINGS COUNTY
TABLE D-5
KINGS COUNTY2006-2008 Rural Land Use Data
Rural Land Use Summary
LAND USE CATEGORYACREAGE INVENTORIED ACREAGE
CHANGEDPERCENT CHANGE
Conversions to Rural Land Uses, 2006 to 2008
Conversions From Rural Land Uses, 2006 to 2008
(1) Total Area Inventoried for Rural Land categories in Kings County is equal to that of Other Land plus the acreage of Confined Animal Agriculture. Confined animal agriculture facilities are a component of the county's Farmland of Local Importance definition. (2) These statistics represent shifts from one Rural Land Use category to another.
Page 84
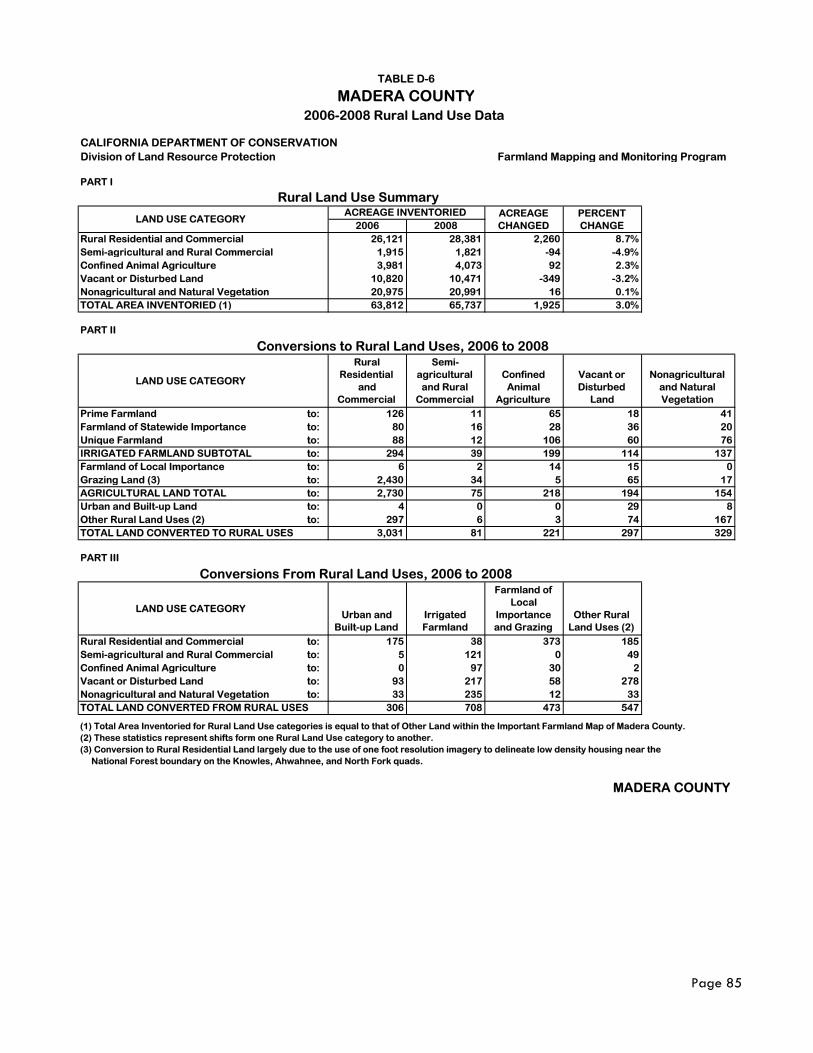
CALIFORNIA DEPARTMENT OF CONSERVATIONDivision of Land Resource Protection Farmland Mapping and Monitoring Program
PART I
2006 2008Rural Residential and Commercial 26,121 28,381 2,260 8.7%Semi-agricultural and Rural Commercial 1,915 1,821 -94 -4.9%Confined Animal Agriculture 3,981 4,073 92 2.3%Vacant or Disturbed Land 10,820 10,471 -349 -3.2%Nonagricultural and Natural Vegetation 20,975 20,991 16 0.1%TOTAL AREA INVENTORIED (1) 63,812 65,737 1,925 3.0%
PART II
LAND USE CATEGORY
Rural Residential
and Commercial
Semi-agricultural
and Rural Commercial
Confined Animal
Agriculture
Vacant or Disturbed
Land
Nonagricultural and Natural Vegetation
Prime Farmland to: 126 11 65 18 41Farmland of Statewide Importance to: 80 16 28 36 20Unique Farmland to: 88 12 106 60 76IRRIGATED FARMLAND SUBTOTAL to: 294 39 199 114 137Farmland of Local Importance to: 6 2 14 15 0Grazing Land (3) to: 2,430 34 5 65 17AGRICULTURAL LAND TOTAL to: 2,730 75 218 194 154Urban and Built-up Land to: 4 0 0 29 8Other Rural Land Uses (2) to: 297 6 3 74 167TOTAL LAND CONVERTED TO RURAL USES 3,031 81 221 297 329
PART III
LAND USE CATEGORYUrban and
Built-up LandIrrigated Farmland
Farmland of Local
Importance and Grazing
Other Rural Land Uses (2)
Rural Residential and Commercial to: 175 38 373 185Semi-agricultural and Rural Commercial to: 5 121 0 49Confined Animal Agriculture to: 0 97 30 2Vacant or Disturbed Land to: 93 217 58 278Nonagricultural and Natural Vegetation to: 33 235 12 33TOTAL LAND CONVERTED FROM RURAL USES 306 708 473 547
(1) Total Area Inventoried for Rural Land Use categories is equal to that of Other Land within the Important Farmland Map of Madera County. (2) These statistics represent shifts form one Rural Land Use category to another. (3) Conversion to Rural Residential Land largely due to the use of one foot resolution imagery to delineate low density housing near the National Forest boundary on the Knowles, Ahwahnee, and North Fork quads.
MADERA COUNTY
Conversions to Rural Land Uses, 2006 to 2008
Conversions From Rural Land Uses, 2006 to 2008
TABLE D-6
MADERA COUNTY2006-2008 Rural Land Use Data
Rural Land Use Summary
LAND USE CATEGORYACREAGE INVENTORIED ACREAGE
CHANGEDPERCENT CHANGE
Page 85

CALIFORNIA DEPARTMENT OF CONSERVATIONDivision of Land Resource Protection Farmland Mapping and Monitoring Program
PART I
2006 2008Rural Residential Land 20,496 19,986 -510 -2.5%Semi-agricultural and Rural Commercial 536 1,049 513 95.7%Confined Animal Agriculture 70 70 0 0.0%Vacant or Disturbed Land 965 978 13 1.3%Nonagricultural and Natural Vegetation 44,395 44,726 331 0.7%TOTAL AREA INVENTORIED (1) 66,462 66,809 347 0.5%
PART II
LAND USE CATEGORYRural
Residential Land
Semi-agricultural
and Rural Commerical
Confined Animal
AgricultureVacant or
Disturbed Land
Nonagricultural and Natural Vegetation
Prime Farmland to: 13 0 0 0 0Farmland of Statewide Importance to: 0 0 0 0 0Unique Farmland to: 0 0 0 0 0IRRIGATED FARMLAND SUBTOTAL to: 13 0 0 0 0Farmland of Local Importance to: 0 0 0 0 0Grazing Land to: 322 28 0 1 317AGRICULTURAL LAND TOTAL to: 335 28 0 1 317Urban and Built-up Land to: 18 16 0 0 0Other Rural Land Uses (2) to: 3 469 0 32 37TOTAL LAND CONVERTED TO RURAL USES 356 513 0 33 354
PART III
LAND USE CATEGORYUrban and
Built-up LandIrrigated Farmland
Farmland of Local
Importance and Grazing
Other Rural Land Uses (2)
Rural Residential Land to: 128 23 187 528Semi-agricultural and Rural Commercial to: 0 0 0 0Confined Animal Agriculture to: 0 0 0 0Vacant or Disturbed Land to: 10 0 0 10Nonagricultural and Natural Vegetation to: 0 3 17 3TOTAL LAND CONVERTED FROM RURAL USES 138 26 204 541(1) Total Area Inventoried for Rural Land Use categories is equal to that of Other Land in the Important Farmland Map for Mendocino County.
MENDOCINO COUNTY
TABLE D-7
MENDOCINO COUNTY2006-2008 Rural Land Use Data
Rural Land Use Summary
LAND USE CATEGORYACREAGE INVENTORIED ACREAGE
CHANGEDPERCENT CHANGE
Conversions to Rural Land Uses, 2006 to 2008
Conversions From Rural Land Uses, 2006 to 2008
(2) These statistics represent shifts from one Rural Land Use category to another.
Page 86
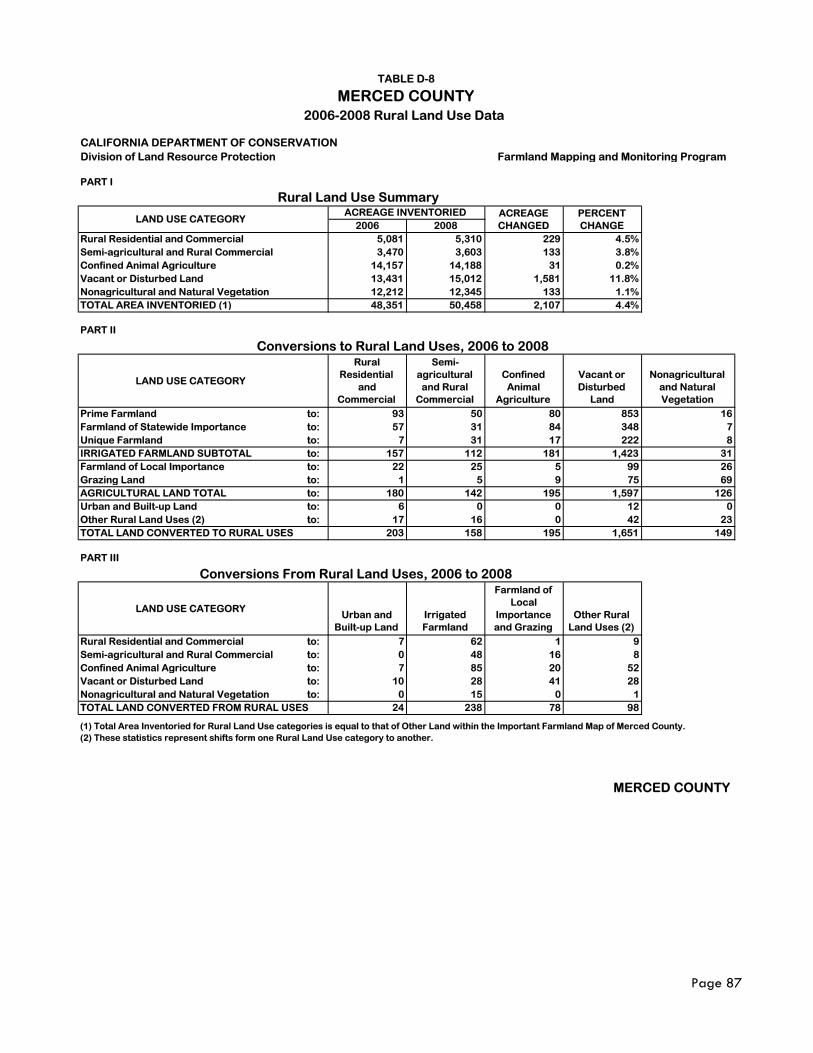
CALIFORNIA DEPARTMENT OF CONSERVATIONDivision of Land Resource Protection Farmland Mapping and Monitoring Program
PART I
2006 2008Rural Residential and Commercial 5,081 5,310 229 4.5%Semi-agricultural and Rural Commercial 3,470 3,603 133 3.8%Confined Animal Agriculture 14,157 14,188 31 0.2%Vacant or Disturbed Land 13,431 15,012 1,581 11.8%Nonagricultural and Natural Vegetation 12,212 12,345 133 1.1%TOTAL AREA INVENTORIED (1) 48,351 50,458 2,107 4.4%
PART II
LAND USE CATEGORY
Rural Residential
and Commercial
Semi-agricultural
and Rural Commercial
Confined Animal
Agriculture
Vacant or Disturbed
Land
Nonagricultural and Natural Vegetation
Prime Farmland to: 93 50 80 853 16Farmland of Statewide Importance to: 57 31 84 348 7Unique Farmland to: 7 31 17 222 8IRRIGATED FARMLAND SUBTOTAL to: 157 112 181 1,423 31Farmland of Local Importance to: 22 25 5 99 26Grazing Land to: 1 5 9 75 69AGRICULTURAL LAND TOTAL to: 180 142 195 1,597 126Urban and Built-up Land to: 6 0 0 12 0Other Rural Land Uses (2) to: 17 16 0 42 23TOTAL LAND CONVERTED TO RURAL USES 203 158 195 1,651 149
PART III
LAND USE CATEGORYUrban and
Built-up LandIrrigated Farmland
Farmland of Local
Importance and Grazing
Other Rural Land Uses (2)
Rural Residential and Commercial to: 7 62 1 9Semi-agricultural and Rural Commercial to: 0 48 16 8Confined Animal Agriculture to: 7 85 20 52Vacant or Disturbed Land to: 10 28 41 28Nonagricultural and Natural Vegetation to: 0 15 0 1TOTAL LAND CONVERTED FROM RURAL USES 24 238 78 98
(1) Total Area Inventoried for Rural Land Use categories is equal to that of Other Land within the Important Farmland Map of Merced County. (2) These statistics represent shifts form one Rural Land Use category to another.
MERCED COUNTY
Conversions to Rural Land Uses, 2006 to 2008
Conversions From Rural Land Uses, 2006 to 2008
TABLE D-8
MERCED COUNTY2006-2008 Rural Land Use Data
Rural Land Use Summary
LAND USE CATEGORYACREAGE INVENTORIED ACREAGE
CHANGEDPERCENT CHANGE
Page 87
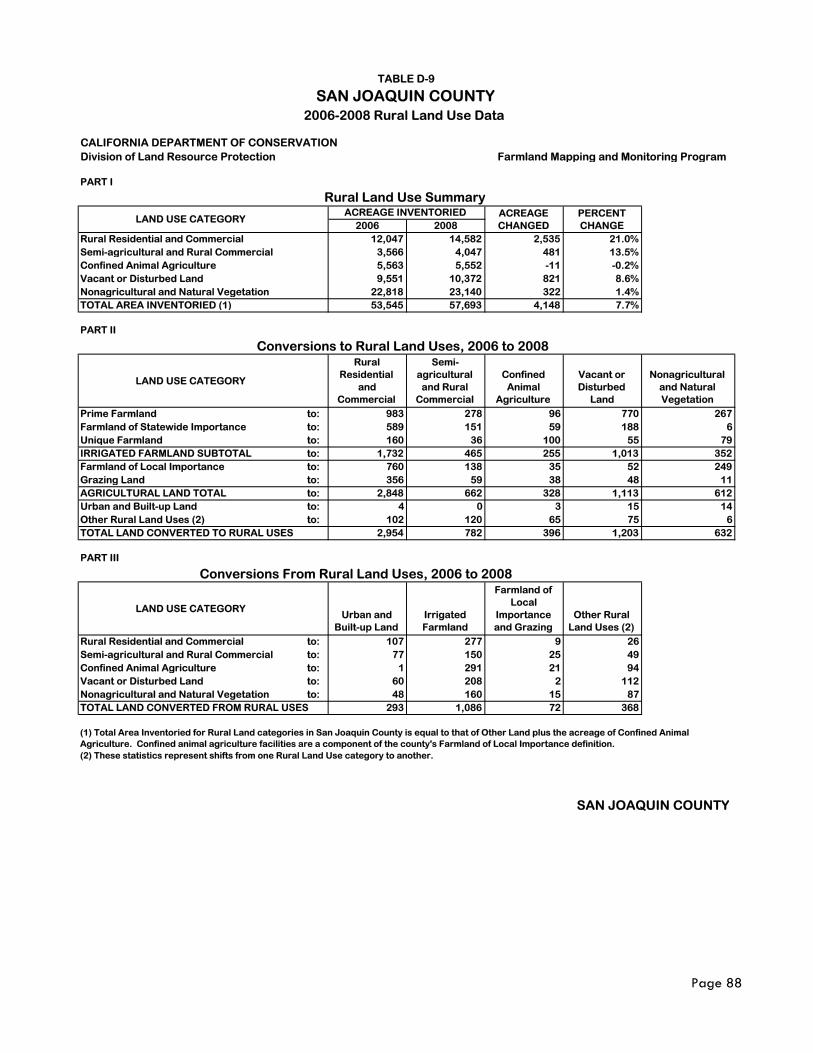
CALIFORNIA DEPARTMENT OF CONSERVATIONDivision of Land Resource Protection Farmland Mapping and Monitoring Program
PART I
2006 2008Rural Residential and Commercial 12,047 14,582 2,535 21.0%Semi-agricultural and Rural Commercial 3,566 4,047 481 13.5%Confined Animal Agriculture 5,563 5,552 -11 -0.2%Vacant or Disturbed Land 9,551 10,372 821 8.6%Nonagricultural and Natural Vegetation 22,818 23,140 322 1.4%TOTAL AREA INVENTORIED (1) 53,545 57,693 4,148 7.7%
PART II
LAND USE CATEGORY
Rural Residential
and Commercial
Semi-agricultural
and Rural Commercial
Confined Animal
Agriculture
Vacant or Disturbed
Land
Nonagricultural and Natural Vegetation
Prime Farmland to: 983 278 96 770 267Farmland of Statewide Importance to: 589 151 59 188 6Unique Farmland to: 160 36 100 55 79IRRIGATED FARMLAND SUBTOTAL to: 1,732 465 255 1,013 352Farmland of Local Importance to: 760 138 35 52 249Grazing Land to: 356 59 38 48 11AGRICULTURAL LAND TOTAL to: 2,848 662 328 1,113 612Urban and Built-up Land to: 4 0 3 15 14Other Rural Land Uses (2) to: 102 120 65 75 6TOTAL LAND CONVERTED TO RURAL USES 2,954 782 396 1,203 632
PART III
LAND USE CATEGORYUrban and
Built-up LandIrrigated Farmland
Farmland of Local
Importance and Grazing
Other Rural Land Uses (2)
Rural Residential and Commercial to: 107 277 9 26Semi-agricultural and Rural Commercial to: 77 150 25 49Confined Animal Agriculture to: 1 291 21 94Vacant or Disturbed Land to: 60 208 2 112Nonagricultural and Natural Vegetation to: 48 160 15 87TOTAL LAND CONVERTED FROM RURAL USES 293 1,086 72 368
SAN JOAQUIN COUNTY
Conversions to Rural Land Uses, 2006 to 2008
Conversions From Rural Land Uses, 2006 to 2008
Rural Land Use Summary
(1) Total Area Inventoried for Rural Land categories in San Joaquin County is equal to that of Other Land plus the acreage of Confined Animal Agriculture. Confined animal agriculture facilities are a component of the county's Farmland of Local Importance definition. (2) These statistics represent shifts from one Rural Land Use category to another.
TABLE D-9
SAN JOAQUIN COUNTY2006-2008 Rural Land Use Data
LAND USE CATEGORYACREAGE INVENTORIED ACREAGE
CHANGEDPERCENT CHANGE
Page 88

CALIFORNIA DEPARTMENT OF CONSERVATIONDivision of Land Resource Protection Farmland Mapping and Monitoring Program
PART I
2006 2008Rural Residential and Commercial 8,013 9,516 1,503 18.8%Semi-agricultural and Rural Commercial 2,414 2,569 155 6.4%Confined Animal Agriculture 11,847 11,593 -254 -2.1%Vacant or Disturbed Land 5,810 5,476 -334 -5.7%Nonagricultural and Natural Vegetation 34,310 35,301 991 2.9%TOTAL AREA INVENTORIED (1) 62,394 64,455 2,061 3.3%
PART II
LAND USE CATEGORY
Rural Residential
and Commercial
Semi-agricultural
and Rural Commercial
Confined Animal
Agriculture
Vacant or Disturbed
Land
Nonagricultural and Natural Vegetation
Prime Farmland (3) to: 1,122 193 144 290 555Farmland of Statewide Importance to: 242 30 74 28 22Unique Farmland to: 79 95 55 11 149IRRIGATED FARMLAND SUBTOTAL to: 1,443 318 273 329 726Farmland of Local Importance to: 206 29 47 54 56Grazing Land to: 50 27 26 27 136AGRICULTURAL LAND TOTAL to: 1,699 374 346 410 918Urban and Built-up Land to: 16 7 19 24 178Other Rural Land Uses (2) to: 190 131 26 49 195TOTAL LAND CONVERTED TO RURAL USES 1,905 512 391 483 1,291
PART III
LAND USE CATEGORYUrban and
Built-up LandIrrigated Farmland
Farmland of Local
Importance and Grazing
Other Rural Land Uses (2)
Rural Residential and Commercial to: 67 214 38 83Semi-agricultural and Rural Commercial to: 40 133 87 97Confined Animal Agriculture to: 8 351 134 152Vacant or Disturbed Land to: 183 335 99 200Nonagricultural and Natural Vegetation to: 5 225 11 59TOTAL LAND CONVERTED FROM RURAL USES 303 1,258 369 591
(1) Total Area Inventoried for Rural Land Use categories is equal to that of Other Land within the Important Farmland Map of Stanislaus County.(2) These statistics represent shifts form one Rural Land Use category to another. (3) Conversion to Rural Residential Land largely due to the use of one foot resolution imagery to delineate low density housing throughout the county.
STANISLAUS COUNTY
Conversions to Rural Land Uses, 2006 to 2008
Conversions From Rural Land Uses, 2006 to 2008
TABLE D-10
STANISLAUS COUNTY2006-2008 Rural Land Use Data
Rural Land Use Summary
LAND USE CATEGORYACREAGE INVENTORIED ACREAGE
CHANGEDPERCENT CHANGE
Page 89
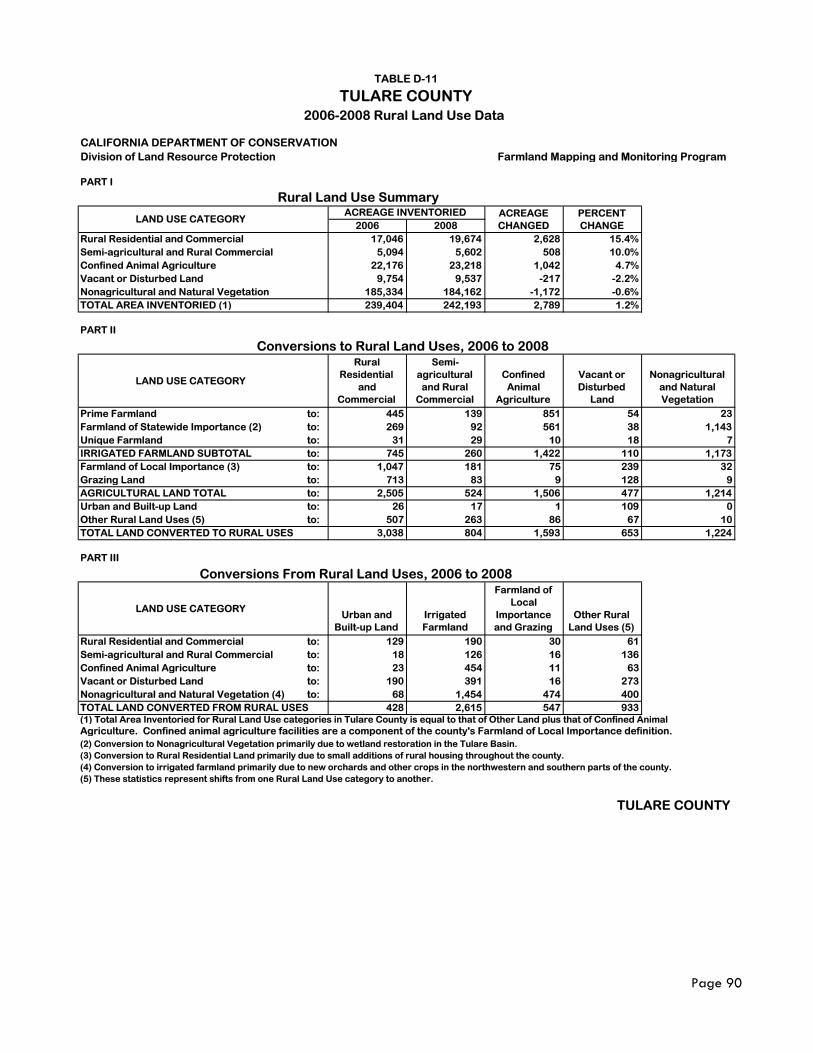
CALIFORNIA DEPARTMENT OF CONSERVATIONDivision of Land Resource Protection Farmland Mapping and Monitoring Program
PART I
2006 2008Rural Residential and Commercial 17,046 19,674 2,628 15.4%Semi-agricultural and Rural Commercial 5,094 5,602 508 10.0%Confined Animal Agriculture 22,176 23,218 1,042 4.7%Vacant or Disturbed Land 9,754 9,537 -217 -2.2%Nonagricultural and Natural Vegetation 185,334 184,162 -1,172 -0.6%TOTAL AREA INVENTORIED (1) 239,404 242,193 2,789 1.2%
PART II
LAND USE CATEGORY
Rural Residential
and Commercial
Semi-agricultural
and Rural Commercial
Confined Animal
Agriculture
Vacant or Disturbed
Land
Nonagricultural and Natural Vegetation
Prime Farmland to: 445 139 851 54 23Farmland of Statewide Importance (2) to: 269 92 561 38 1,143Unique Farmland to: 31 29 10 18 7IRRIGATED FARMLAND SUBTOTAL to: 745 260 1,422 110 1,173Farmland of Local Importance (3) to: 1,047 181 75 239 32Grazing Land to: 713 83 9 128 9AGRICULTURAL LAND TOTAL to: 2,505 524 1,506 477 1,214Urban and Built-up Land to: 26 17 1 109 0Other Rural Land Uses (5) to: 507 263 86 67 10TOTAL LAND CONVERTED TO RURAL USES 3,038 804 1,593 653 1,224
PART III
LAND USE CATEGORYUrban and
Built-up LandIrrigated Farmland
Farmland of Local
Importance and Grazing
Other Rural Land Uses (5)
Rural Residential and Commercial to: 129 190 30 61Semi-agricultural and Rural Commercial to: 18 126 16 136Confined Animal Agriculture to: 23 454 11 63Vacant or Disturbed Land to: 190 391 16 273Nonagricultural and Natural Vegetation (4) to: 68 1,454 474 400TOTAL LAND CONVERTED FROM RURAL USES 428 2,615 547 933(1) Total Area Inventoried for Rural Land Use categories in Tulare County is equal to that of Other Land plus that of Confined Animal Agriculture. Confined animal agriculture facilities are a component of the county's Farmland of Local Importance definition.(2) Conversion to Nonagricultural Vegetation primarily due to wetland restoration in the Tulare Basin. (3) Conversion to Rural Residential Land primarily due to small additions of rural housing throughout the county.(4) Conversion to irrigated farmland primarily due to new orchards and other crops in the northwestern and southern parts of the county.(5) These statistics represent shifts from one Rural Land Use category to another.
TULARE COUNTY
PERCENT CHANGE
Conversions to Rural Land Uses, 2006 to 2008
Conversions From Rural Land Uses, 2006 to 2008
TULARE COUNTYTABLE D-11
2006-2008 Rural Land Use Data
Rural Land Use Summary
LAND USE CATEGORYACREAGE INVENTORIED ACREAGE
CHANGED
Page 90
Page 91
Appendix E Farmland of Local Importance Definitions
California Farmland Conversion Report 2006-2008
Page 92
Farmland of Local Importance
Background
Farmland of Local Importance is land of importance to the local economy, as defined by each county's local advisory committee and adopted by its Board of Supervisors. Farmland of Local Importance is either currently producing, or has the capability of production, but does not meet the criteria of Prime Farmland, Farmland of Statewide Importance, or Unique Farmland. Authority to adopt or to recommend changes to the category of Farmland of Local Importance rests with the Board of Supervisors in each county.
ALAMEDA The Board of Supervisors determined that there will be no Farmland of Local Importance for Alameda County.
AMADOR Land that is currently in agricultural production and that is providing an economic return equal to that from the prime soil types.
BUTTE The Board of Supervisors determined that there will be no Farmland of Local Importance for Butte County.
COLUSA The following lands are to be included in the Farmland of Local Importance category: All farmable lands within Colusa County that do not meet the definitions of Prime, Statewide, or Unique, but are currently irrigated pasture or nonirrigated crops; or nonirrigated land with soils qualifying for Prime Farmland or Farmland of Statewide Importance; or lands that would have Prime or Statewide designation and have been improved for irrigation but are now idle; or lands with a General Plan Land Use designation for agricultural purposes; and lands that are legislated to be used only for agricultural (farmland) purposes.
CONTRA COSTA The lands within the Tassajara area, extending eastward to the county boundary and bordered on the north by the Black Hills, the Deer, Lone Tree and Briones Valleys, the Antioch area, and the Delta. These lands are typically used for livestock grazing. They are capable of producing dryland grain on a two year summer fallow or longer rotation with volunteer hay and pasture. The farmlands in this category are included in the U.S. Natural Resources Conservation Service's Land Capability Classes I, II, III, and IV, and lack some irrigation water.
EL DORADO Lands that do not qualify for the Prime, Statewide, or Unique designation but are considered Existing Agricultural Lands, or Potential Agricultural Lands, in the Agricultural Land Element of the County General Plan. Timberlands are excluded.
FRESNO All farmable lands within Fresno County that do not meet the definitions of Prime, Statewide, or Unique. This includes land that is or has been used for irrigated pasture, dryland farming, confined livestock and dairy, poultry facilities, aquaculture and grazing land.
California Farmland Conversion Report 2006-2008
Page 93
GLENN Local Importance (L): All lands not qualifying for Prime, Statewide, or Unique that are cropped on a continuing or cyclic basis (irrigation is not a consideration). All cropable land within Glenn County water district boundaries not qualifying for Prime, Statewide, or Unique.
Local Potential (LP): All lands having Prime and Statewide soil mapping units which are not irrigated, regardless of cropping history or irrigation water availability.
IMPERIAL Unirrigated and uncultivated lands with Prime and Statewide soils.
KERN The Board of Supervisors determined that there will be no Farmland of Local Importance for Kern County.
KINGS Land that supports the following commercial agricultural activities: dairies, confined livestock, and poultry operations.
LAKE Lands which do not qualify as Prime Farmland or Farmland of Statewide Importance or Unique Farmland, but are currently irrigated pasture or nonirrigated crops; and unirrigated land with soils qualifying for Prime Farmland or Farmland of Statewide Importance. Areas of unirrigated Prime and Statewide Importance soils overlying ground water basins may have more potential for agricultural use.
LOS ANGELES Producing lands that would meet the standard criteria for Prime or Statewide but are not irrigated.
MADERA Lands that are presently under cultivation for small grain crops, but are not irrigated. Also lands that are currently irrigated pasture, but have the potential to be cultivated for row/field crop use.
MARIN Land which is not irrigated, but is cultivated; or has the potential for cultivation.
MARIPOSA The Board of Supervisors determined that there will be no Farmland of Local Importance for Mariposa County.
MENDOCINO The Board of Supervisors determined that there will be no Farmland of Local Importance for Mendocino County.
MERCED Farmlands that have physical characteristics that would qualify for Prime or Statewide except for the lack of irrigation water. Also, farmlands that produce crops that are not listed under Unique but are important to the economy of the county or city.
California Farmland Conversion Report 2006-2008
Page 94
MODOC Irrigated and dry cropland classified as Class III and Class IV irrigated land if water is or becomes available.
MONTEREY The Board of Supervisors determined that there will be no Farmland of Local Importance for Monterey County.
NAPA These farmlands include areas of soils that meet all the characteristics of Prime Farmland or of additional Farmland of Statewide Importance with the exception of irrigation. These farmlands include dryland grains, haylands, and dryland pasture.
NEVADA Farmlands that have physical characteristics that would qualify for Prime or Statewide except for the lack of irrigation water. Farmlands that produce crops that are not listed under Unique Lands but are important to the economy of the county are: Christmas trees, Sudan grass, Meadow hay, chestnuts, poultry houses and feedlots, improved dryland pasture (not rangeland), and irrigated pasture (it is under Statewide or Prime if soils are listed as such, otherwise as Local).
Also, lands that are legislated to be used only for agricultural (farmland) purposes, such as Williamson Act land in western Nevada County.
ORANGE The Board of Supervisors determined that there will be no Farmland of Local Importance for Orange County.
PLACER Farmlands not covered by the categories of Prime, Statewide, or Unique. They include lands zoned for agriculture by County Ordinance and the California Land Conservation Act as well as dry farmed lands, irrigated pasture lands, and other agricultural lands of significant economic importance to the County and include lands that have a potential for irrigation from Placer County water supplies.
RIVERSIDE Soils that would be classified as Prime and Statewide but lack available irrigation water. Lands planted to dryland crops of barley, oats, and wheat.
Lands producing major crops for Riverside County but that are not listed as Unique crops. These crops are identified as returning one million or more dollars on the 1980 Riverside County Agriculture Crop Report. Crops identified are permanent pasture (irrigated), summer squash, okra, eggplant, radishes, and watermelons.
Dairylands, including corrals, pasture, milking facilities, hay and manure storage areas if accompanied with permanent pasture or hayland of 10 acres or more.
Lands identified by city or county ordinance as Agricultural Zones or Contracts, which includes Riverside City "Proposition R" lands. Lands planted to jojoba which are under cultivation and are of producing age.
SACRAMENTO Lands which do not qualify as Prime, Statewide, or Unique designation but are currently irrigated crops or
California Farmland Conversion Report 2006-2008
Page 95
pasture or nonirrigated crops; lands that would be Prime or Statewide designation and have been improved for irrigation but are now idle; and lands which currently support confined livestock, poultry operations, and aquaculture.
SAN BENITO Land cultivated as dry cropland. Usual crops are wheat, barley, oats, safflower, and grain hay. Also, orchards affected by boron within the area specified in County Resolution Number 84-3.
SAN BERNARDINO Farmlands which include areas of soils that meet all the characteristics of Prime, Statewide, or Unique and which are not irrigated.
Farmlands not covered by above categories but are of high economic importance to the community. These farmlands include dryland grains of wheat, barley, oats, and dryland pasture.
SAN DIEGO Land that meets all the characteristics of Prime and Statewide, with the exception of irrigation.
Farmlands not covered by the above categories but are of significant economic importance to the county. They have a history of good production for locally adapted crops. The soils are grouped in types that are suited for truck crops (such as tomatoes, strawberries, cucumbers, potatoes, celery, squash, romaine lettuce, and cauliflower) and soils suited for orchard crops (avocados and citrus).
SAN JOAQUIN All farmable land within San Joaquin County not meeting the definitions of "Prime Farmland," "Farmland of Statewide Importance," and "Unique Farmland." This includes land that is or has been used for irrigated pasture, dryland farming, confined livestock or dairy facilities, aquaculture, poultry facilities, and dry grazing. It also includes soils previously designated by soil characteristics as "Prime Farmland," "Farmland of Statewide Importance," and "Unique Farmland" that has since become idle.
SAN LUIS OBISPO Local Importance (L): areas of soils that meet all the characteristics of Prime or Statewide, with the exception of irrigation. Additional farmlands include dryland field crops of wheat, barley, oats, and safflower.
Local Potential (LP): lands having the potential for farmland, which have Prime or Statewide characteristics and are not cultivated.
SAN MATEO Lands other than Prime, Statewide, or Unique that produce the following crops: oats, Christmas trees, pumpkins, dryland pasture, other grains, and haylands. These lands are not irrigated.
SANTA BARBARA All dryland farming areas and permanent pasture (if the soils were not eligible for either Prime or Statewide). Dryland farming includes various cereal grains (predominantly wheat, barley, and oats), sudan, and many varieties of beans. (Although beans can be high value crops the production areas are usually rotated with grain, hence the decision to include them under Local rather than Unique. Also, bean crop yields are highly influenced by climate, so there can be a wide variance in cash value.)
California Farmland Conversion Report 2006-2008
Page 96
SANTA CLARA Small orchards and vineyards primarily in the foothill areas. Also land cultivated as dry cropland for grains and hay.
SANTA CRUZ Soils used for Christmas tree farms and nurseries, and that do not meet the definition for Prime, Statewide, or Unique.
SHASTA Dryland grain producing lands. Also included are farmlands that are presently irrigated but do not meet the soil characteristics of Prime or Statewide. The majority of these farmlands are located within the Anderson Cottonwood Irrigation District. These soils include Newton gravelly loam (8 to 15 percent slopes), Moda loam, seeped (0 to 3 percent slopes), Moda loam, shallow (0 to 5 percent slopes), and Hillgate loam.
SIERRA VALLEY Plumas County: Lands designated as "agricultural preserve" in the 1984 Plumas County General Plan and rangelands with a carrying capacity of 8 acres/animal month, as well as irrigable lands.
Lassen and Sierra counties: Farmlands that include areas of soils that meet all the characteristics of Prime or Statewide and which are not irrigated. Also, all dry land wheat, barley, oats, hayland, and pasture.
SISKIYOU Farmlands that include dryland or sub-irrigated hay and grain and improved pasture forage species; these dry farmed lands commonly have inclusions of uncultivated shallow, rocky, or steep soils; farmlands presently irrigated but which do not meet the soil characteristics of Prime Farmland or Farmland of Statewide Importance; areas currently shown as Prime Agricultural Land in the Siskiyou County General Plan; areas under contract as Agricultural Preserves in Siskiyou County (currently mapped only for the Scott-Shasta-Butte Valley and Tule Lake soil survey areas); other agricultural land of significant importance to the county (currently mapped only for the Scott-Shasta-Butte Valley and Tule Lake soil survey areas); areas previously designated by soil characteristics as Prime Farmland, Farmland of Statewide Importance, Unique Farmland, and Farmland of Local Importance that have since become idle; lands enrolled in the U.S. Department of Agriculture’s Conservation Reserve Program.
SOLANO The Board of Supervisors determined that there will be no Farmland of Local Importance for Solano County.
SONOMA The hayland producing areas of the Santa Rosa Plains, Petaluma Valley, and Tubbs Island Naval Reservation. Additional areas also include those lands which are classified as having the capability for producing locally important crops such as grapes, corn, etc., but may not be planted at the present time.
Examples of these areas include the coastal lands from Fort Ross to Stewarts Point, areas surrounding Bloomfield, Two Rock, Chileno Valley, and areas of Sonoma Valley in the vicinity of Big Bend, Vineburg, and Schellville.
STANISLAUS Farmlands growing dryland pasture, dryland small grains, and irrigated pasture.
California Farmland Conversion Report 2006-2008
Page 97
SUTTER The Board of Supervisors determined that there will be no Farmland of Local Importance for Sutter County.
TEHAMA All lands which are not included in Prime, Statewide, or Unique and are cropped continuously or on a cyclic basis (irrigation is not a factor). Also, all lands included in the L category which have soil mapping units listed for Prime or Statewide and which are not irrigated.
TULARE Lands that produce dryland grains (barley and wheat); lands that have physical characteristics that would qualify for "Prime" or "Statewide Important" farmlands except for the lack of irrigation water; and lands that currently support confined livestock, poultry, and/or aquaculture operations.
VENTURA Soils that are listed as Prime or Statewide that are not irrigated, and soils growing dryland crops--beans, grain, dryland walnuts, or dryland apricots.
YOLO Local Importance (L): cultivated farmland having soils which meet the criteria for Prime or Statewide, except that the land is not presently irrigated, and other nonirrigated farmland.
Local Potential (LP): Prime or Statewide soils which are presently not irrigated or cultivated.
YUBA The Board of Supervisors determined that there will be no Farmland of Local Importance for Yuba County.
The Department of Conservation makes no warranties as to the suitability of this product for any particular purpose.

Above: Symbols of California’s rural heritage; see inside front cover for details.