Embed Size (px)
Citation preview
CALIFORNIA DE PAR TME NT O F FISH A ND GAME M A R I N E R E S O U R C E S T E C H N I C A L R E P O R T S
Marine Resources Technical Reports a r e research documents by Department personnel that a r e of sufficient importance to be preserved, but which for some reason a r e not appropriate for primary scientific publication. No restriction i s placed on subject matter.
These Reports may be cited in publication, but care should be taken to indicate their manuscript status. The material in these Reports may eventually appear in the primary scientific literature.
Inquiries concerning the Reports should be directed to The Editor, Marine Resources Region, 350 Golden Shore, Long Beach, California 90802.
STRUCTUREl DISTRIBUTIONl AND SEASONAL DYNAMICS OF TEE BENTHIC COMMUNITY
I N THE UPPER NEWPORT BAY, CALIFORNIA
R o g e r R. Seapy D e p a r t m e n t of B i o l o g i c a l Science
C a l i f o r n i a S t a t e U n i v e r s i t y F u l l e r t o n , CA 92634
MARINE RESOURCES TECHNICAL REPORT NO. 46 C a l i f o r n i a D e p a r t m e n t of F i s h and G a m - 1981 -
ABSTRACT
The benthic community in the Upper Newport Bay was sampled at two intertidal and two subtidal depths at three stations during five assessment periods between October 1977 and January 1979. Heavy sediment deposition occurred during the 1977-1978 winter period, and the sedimentary environment was transformed from one characterized by fine sands (January 1978) to one dominated by silts (January 1979). Total density, species rich- ness, and species diversity were generally lowest at the upper- most station (Ski Zone) and highest at the lowermost station (Shellmaker Island). Immediately following the 1977-1978 winter rainy period, total faunal density was extremely low, particularly at the Ski Zone station. However, heavy recruitment after April 1978 resulted in maximal total density values at all stations in August 1978. Species richness was highest during October 1977 and lowest in April 1978 following the heavy rainfall period. The benthic community was dominated in October 1977 by three poly- chaetes, Fabricia limnicola, Streblospio benedicti, and Capitella capitata. By August 1978, F. limnicola had not recruited back into the community and threTadditiona1 polychaete species (Polydora ligni, Pseudopolydora paucibranchiata, and Scolelepis acuta) shared community dominance with C. capitata and S. benedicti. The crustaceans showed stroXg seasonal osciilations , being abundant in the October and August samples and occurring sparsely in the January and April samples.
TABLE OF CONTENTS
Page
. . . . . . . . . . . . . . . . . . . . . . . . . . . . . . . . . . . . . . . . . . . . . . . . . . . . . . ABSTRACT
.............................................. ACKNOWLDEGEMENTS
INTRODUCTION . a . . . . . . . . e . . w . . . o . . . . . . . . . * e . . . . . e . m . . . . . . . . . .
METHODS .. . . e . * . . . . . . . . . * . . . . . . . . . . . . w * . . . . . . . . . . . . e . e . . . . . .
RESULTS.. ............ ...................*..............*e.....
Hydrography . . . . . . . . . . . . . . . . . . . . . . . . . . . . . . . . .me . . . . . . . . . .m Sediments . . . . . . . . . . . . . . .s...... . . . . . . . . . . . . . . . . . . . . . . .m..
........................... Density and Diversity Patterns
Community Structure ...................................... Species Distributions and Abundances . . . . . . . . . . . . . . . . . . . . .
. . . . . . . . . . . . . . . . . . . . . . . . . . . . . . . . . . . . . . . . . . . . . . . . DISCUSSION*.*e SUMMARY . . . . . . . . . .r. . .*. . .m... . . . . . . . .e. . .u.. . . . . .m..e ...me..
. . . . . . . . . . . . . . . . . . . . . . . . . . . . . . . . . . . . . . . . . . . . . . REFERENCES CITED
APPENDIX I.... . . s . s . . * * . . . . . . ~ . . ~ . * . s . * e e ~ s . . . . . . . m . ~ . * . . . .
APPENDIX I1 ... . . . . . e . . . e . . . . . . . . e . . . . . . . * . . . . m . . . . . . . . . . . . . .
. . . . . . . . . . . . . . . . . . . . . . . . . . . . . . . . . . . . . . . . . . . . . . . . . . APPENDIX 111
..... APPENDIX I V .......................................*..... APPENDIX V ....................................................
ACKNOWLEDGEMENTS
The substantial data base for this study was the result of many
months of diligent, hard work by several people in particular, who are
most gratefully acknowledged here; Carl Zurcher and Phillip Ramsey
(for the polychaetes and oligochaetes), Paul Kinoshita (for the arthro-
pods and miscellaneous taxa), and Andrea Braly (for the sediment
analyses and computer-mediated cluster analyses). In addition to the
above people, several others assisted in the field work and in sorting
of samples in the laboratory, including John Markus, Dennis Hagner,
Gary Cronk, and Paul Martini. Field work was greatly aided by the
cooperation of Michael Wehner and the Orange County Health Department,
who allowed us to use their field lab facilities at the Marina Dunes.
The computer analyses were carried out at the Orange Coast College
Computer Center, and the assistance of its staff is appreciated. The
cluster analysis program was written and adapted to the Orange Coast
College computer by Dr. Robert Smith. The organic carbon analyses
were run in the laboratory of Dr. Peter Fischer at California State
University, Northridge, and the assistance of Lowell Morrison in pro-
cessing the samples is gratefully acknowledged.
INTRODUCTION
Biological investigations in the Upper Newport Bay (summarized
by Daugherty, 1978b) have been few. Even more restricted are the
number of studies concerned with the soft bottom benthic community.
The effects of fresh water inundation on the Upper Bay following a
severe storm in March of 1938 were reported by MacGinitie (1939).
Mass mortalities resulted from the storm, but many animals became
reestablished more abundantly than before March. MacGinitie con-
sidered the sediments deposited from the storm waters to have created
a favorable environment for benthic reestablishment. Only two quali-
tative studies (Barnard and Reish, 1959; Frey, et al., 1970), which
were primarily taxonomic, and one quantitative study (Daugherty,
1978a) have been conducted on the soft bottom benthos in the Upper
Bay. Of the 56 subtidal stations occupied by Barnard and Reish (1959)
throughout Newport Bay, 21 were located in the Upper Bay. Polychaetes
were identified and enumerated from 0.065 m2 Orange-Peel Grab samples
collected in January 1954. Gammaridean amphipods were analyzed from
these samples, as well as from intertidal samples and piling and float
scrapings taken between 1951 and 1953. From the subtidal samples
taken in the Upper Bay, a total of 43 species of polychaetes and 19
species of gammarids were recorded. From an intertidal site
immediately north of the Pacific Coast Highway Bridge (Fig. I), 13
species of gammarids were collected in December 1953. Eight of these
13 species were also recorded from the subtidal samples taken in
January 1954 from the Upper Bay.
A list of 216 invertebrate taxa was compiled by Frey et al.
(1970) for the Upper Bay, of which 155 were not restricted to hard
substrates such as pilings, floats, and boulders. Polychaetes were
best represented (53 taxa), followed by the bivalves (26 taxa) and
gastropods (23 taxa). The gammaridean amphipods were not identified
below this higher taxonomic level, nor were the copepods, ostracods,
cumaceans, leptostracans, turbellarians, nemerteans, or phoronids.
Taxa were not enumerated in this study, but were assigned abundance
levels of very common, common, and rare.
Results of a subtidal benthic study in 1975 and 1976 in the
Upper and Lower Bay were reported by Daugherty (1978a). Three
replicate samples were collected with an 0.05 m2 Ponar Grab at each
of 8 stations in mid September 1975 and late March to early April
1976. Two of these stations were located in the Upper Bay, close to
two of the stations established in the present study off Shellmaker
Island (off North Star Beach) and in the Ski Zone (Ffg. 1). The
latter station was also sampled in late February 1976. At the sta-
tion off Shellmaker Island, Daugherty reported a 37% decline in number
of taxa from September to March-April. At the Ski Zone station, on
the other hand, the number of taxa decreased by 75% between September
and February, but then increased by a factor of two in March-April.
This decline in number of taxa at the Ski Zone was accompanied by a
25-fold decrease in total density between September and February.
However, this decrease was followed by a 4-fold increase in March-
April. At the station off Shellmaker Island, by comparison, total
density decreased only slightly (a 30% reduction) between September
and March-April.
In summary, the objective of the Barnard and Reish (1959) study
was principally to characterize the taxonomic composition and distri-
bution of the subtidal benthic polychaetes and gammaridean amphipods
throughout Newport Bay. Daugherty (1978a) was concerned, in contrast,
with characterizing the taxonomic composition and abundance (density)
patterns of the entire subtidal benthic fauna at the end of summer
(September) and in late winter (March-April) at a restricted number
of stations (8) located in selected areas of the bay. In addition to
being restricted to the Upper Bay, the present study differs from
Daugherty's in that (1) an additional station was established in the
Upper Bay near Big Canyon (Fig. I), (2) each station was sampled five
times over a 161nonth period from October 1977 to January 1979 to
enable a temporal characterization of the dynamic nature of the
benthic community, and (3) each station was sampled during each
assessment period at subtidal depths (midchannel and -2.5 ft) and in
the intertidal zone (at Mean Lower Low Water and +2.5 ft). As in
Daugherty's study, density data represented means of replicated
samples.
MATERIALS AND METHODS
Sampling sites in the Upper Bay (Fig. 1) were established in
October 1977 at Shellmaker Island (Station I), at the mouth of Big
Canyon (Station 11), and in the Ski Zone region (Station 111).
Sites for the determination of temperature and salinity (using an
in situ Beckman Model RS5-3 Salinometer) were established at mid- -- channel depths in the vicinity of each station (Fig. 1). Five seasonal
assessments were made at the three stations; 24-28 October 1977, 19-23
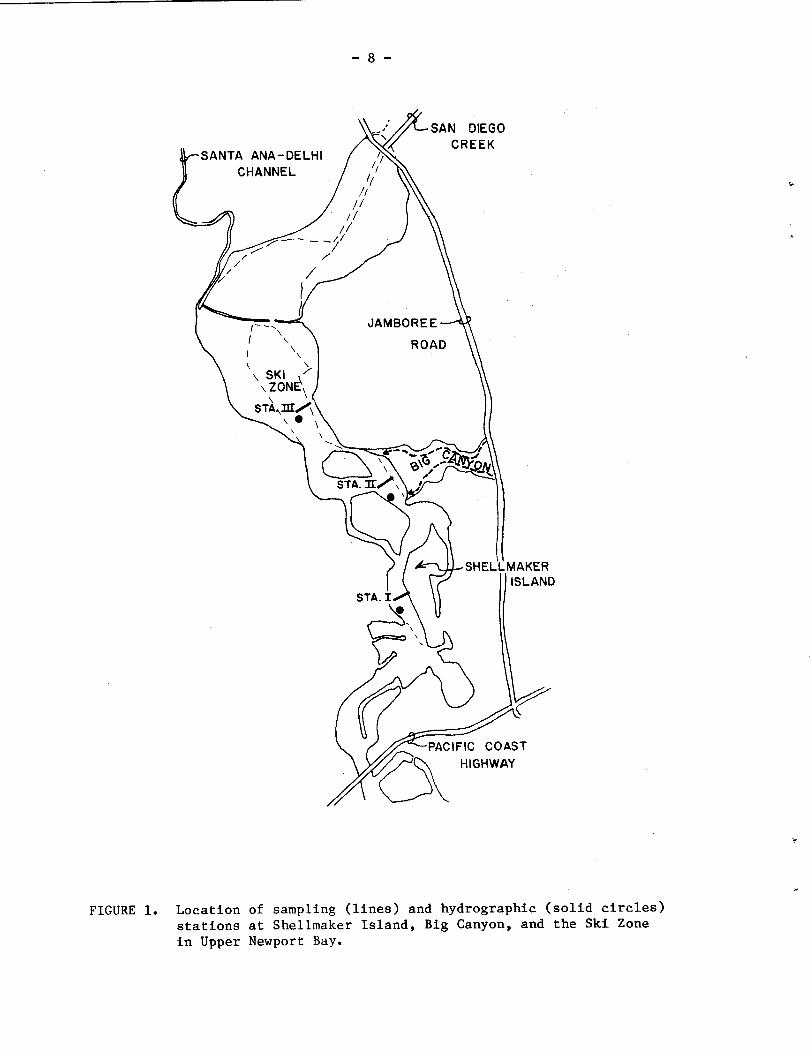
FIGURE 1. Location of sampling (lines) and hydrographic (solid circles) stations at Shellmaker Island, Big Canyon, and the Ski Zone in Upper Newport Bay.
January 1978, 1-7 April 1978, 2-5 August 1978, and 8-11 January 1979.
Duplicate benthic samples were collected at each station at
approximately +2.5 ft, 0.0 (Mean Lower Low Water), -2.5 ft, and at 6
midchannel. Sampling locations were mapped for each station during
- each visit with reference to fixed landmarks in order that subsequent
samples could be taken in immediately adjacent, but non-overlapping
locations. Midchannel and -2.5 ft sampling locations were determined
from a boat by traversing the channel at each station and taking
soundings to find the deepest area and the location corresponding to
~ the -2.5 ft level.
Grab samples were taken at all depths with an Ekman-Birge Dredge
2 (surface area = 0.04 m ). Grab contents were washed through a bucket
I sieve having a mesh size of 0.6 mm. At intertidal and -2.5 ft depths,
the grab was forced into the substrate by hand or foot, usually to a
depth of 12 cm. Adequate samples were obtained at midchannel depths
by the free fall of the grab, except at Station I where it had to be
forced into the substrate by a diver. At the -2.5 ft and midchannel
depths, the location of each grab sample was not predetermined, but
was established haphazardly by dropping the grab off the side of the
boat. Sampling locations at the 0.0 and +2.5 ft levels were posi-
tioned by running out a transect line perpendicular to the shoreline,
determining the 0.0 and +2.5 ft locations on the line by standard
1 surveying techniques, and then going to the right or left of the line
I by 1 or 2 m, using a coin flip to determine which of the two alter-
natives to follow. At the 0.0 and +2.5 ft depths, the deeper burrow-
ing organisms were sampled by pushing a large cylindrical coring
2 device with a surface area of.0.145 m (see Seapy and Kitting, 1978)
into the substrate to a depth of 40 cm. The sediments were removed
by hand and washed through a bucket sieve having a mesh size of 2.0
nun. Sediments and organisms retained in the bucket sieves were trans-
ferred to quart jars and preserved in 10% buffered seawater-formalin
solution. To assess the epifauna at the 0.0 and +2.5 ft levels, a 1.0
m2 quadrat made of 2.5 cm PVC tubing was laid on the substrate and
the contained area was carefully searched for invertebrates. The 1.0
m2 quadrat was employed principally as a method to census the inter-
tidal mudsnail Cerithidea californica. The 0.0 and +2.5 ft samples
2 were taken by initially placing the 1.0 m quadrat on the substrate
2 and collecting the epifauna. The 0.145 m corer was then positioned
2 2 in the center of the 1.0 m quadrat, followed by the 0.04 m grab.
2 The 0.04 m grab sample was removed from the middle of the core,
and then the core sample was removed. For those species enumerated
from the core samples, individuals recorded from the contained grab
samples were added to the core sample counts. All density data were
expressed in terms of numbers of individuals per square meter"
Sediment samples were collected from each tidal level at each
station using a hand-operated plexiglass coring tube, 5 cm in diameter
and 20 cm in length. Samples were prepared for grain size analysis in
the laboratory by treatment with a 30% solution of hydrogen peroxide
to eliminate organic matter. Analysis of the sand fraction of each
sample was made by the settling tube method of Emery (1938). Deter-
mination of the percent of the sample representing the silt-clay
fraction was made by wet-sieving a portion of each sample through a
0.0625 mm sieve (corresponding to the grain size of 4 0, which sepa-
rates the very fine sands from the coarse silts). The sand fraction
was set aside. An aliquot (usually about 10%) of the silt-clay
fraction was transferred to centrifuge tubes and spun down at 12,000
rev per min for 10 min in a Sorval RC2-B Centrifuge. The supernatent
was decanted off and the sediments washed into an aluminum weighing
dish. The sand and silt-clay samples were dried in an oven at 60°c.
Mean grain size was determined by plotting cumulative percent composi-
tion in phi ( O ) units on probability graph paper (after Inman, 1955).
When the silt-clay fraction represented greater than about 60% of
the sample, the mean grain size could not be accurately estimated
graphically. Because the grain size distribution of the silt-clay
fraction was not determined, the mean value was recorded as >4.5 0 .
During the November 1977 and January 1978 sampling periods, sedi-
ment samples were collected for analysis of organic carbon content.
These samples were frozen within 4 hrs of collection, and were kept
frozen until the time of analysis, at which time they were dried in an
oven at 60°c, and then pulverized in a Spex Grinder for 30 min.
Subsamples were taken to determine total carbon, using an automated
LECO Model WR-12 Carbon Analyzer, and inorganic carbon, by acid
digestion (after Kolpack and Bell, 1968). Organic carbon content was
subsequently computed as the difference between total carbon and in-
organic carbon content.
Two measures of species diversity were calculated: Shannon's
(Shannon and Weaver, 1962) index (H' = C pi log pi), and an index of
evenness (J' = H1/log s) after Pielou (1969). Comparisons of community
structure between the different tidal levels and stations and between
assessment periods were made by computer-mediated clustet analyses,
where the percent ecological distance (or dissimilarity) between the
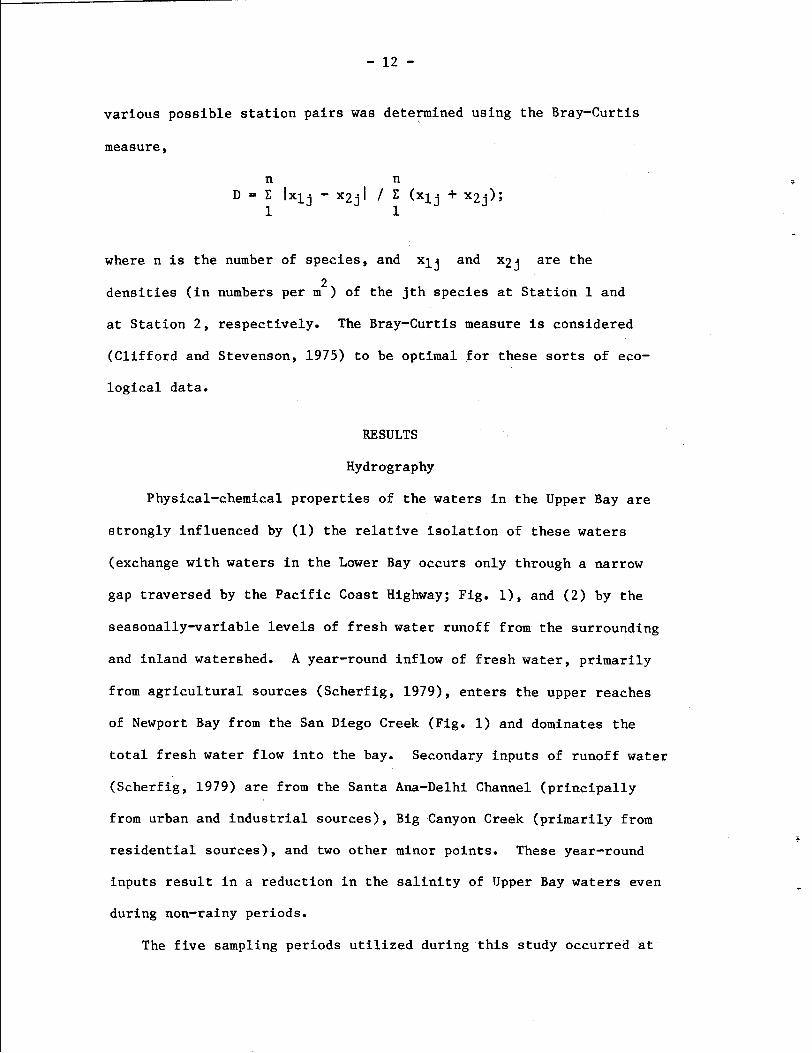
various possible station pairs was determined using the Bray-Curtis
measure,
where n is the number of species, and xlj and x2j are the
2 densities (in numbers per m ) of the jth species at Station 1 and
at Station 2, respectively. The Bray-Curtis measure is considered
(Clifford and Stevenson, 1975) to be optimal for these sorts of eco-
logical data.
RESULTS
Hydrography
Physical-chemical properties of the waters in the Upper Bay are
strongly influenced by (1) the relative isolation of these waters
(exchange with waters in the Lower Bay occurs only through a narrow
gap traversed by the Pacific Coast Highway; Fig. I), and (2) by the
seasonally-variable levels of fresh water runoff from the surrounding
and inland watershed. A year-round inflow of fresh water, primarily
from agricultural sources (Scherfig, 1979), enters the upper reaches
of Newport Bay from the San Diego Creek (Fig. 1) and dominates the
total fresh water flow into the bay. Secondary inputs of runoff water
(Scherfig, 1979) are from the Santa Ana-Delhi Channel (principally
from urban and industrial sources), Big Canyon Creek (primarily from
residential sources), and two other minor points. These year-round
inputs result in a reduction in the salinity of Upper Bay waters even
during non-rainy periods.
The five sampling periods utilized during this study occurred at
critical times relative to the unusually wet winter season of 1978
(Fig. 2), which contributed t'o a total annual rainfall that was
equivalent to 250% that for a normal year (NOAA, 1977, 1978, 1979).
The initial assessment made in October 1977 was preceded by a 6 month
period during which a total of 9.1 cm of rain had fallen in the Newport
Bay area (NOAA, 1978). The January 1978 visit was made late in an
usually rainy month, when a total of 20.1 cm of rainfall was recorded
(Fig. 2). High rainfall continued during February and March, with
monthly totals of 14.2 and 18.2 cm. In April the rainfall had de-
creased to 3.9 cm. Thus, the third sampling period in early April
came at the end of this unusually rainy winter season. During the
months of May, June, and July, there was no rainfall, and the sampling
period of early August took place at a time preceded by three dry
months. Because of the 5.3 cm and 10.6 cm of rain recorded in
September and January, respectively, the intervening period between
the August 1978 and January 1979 sampling dates can be characterized
as having a somewhat higher than normal total rainfall.
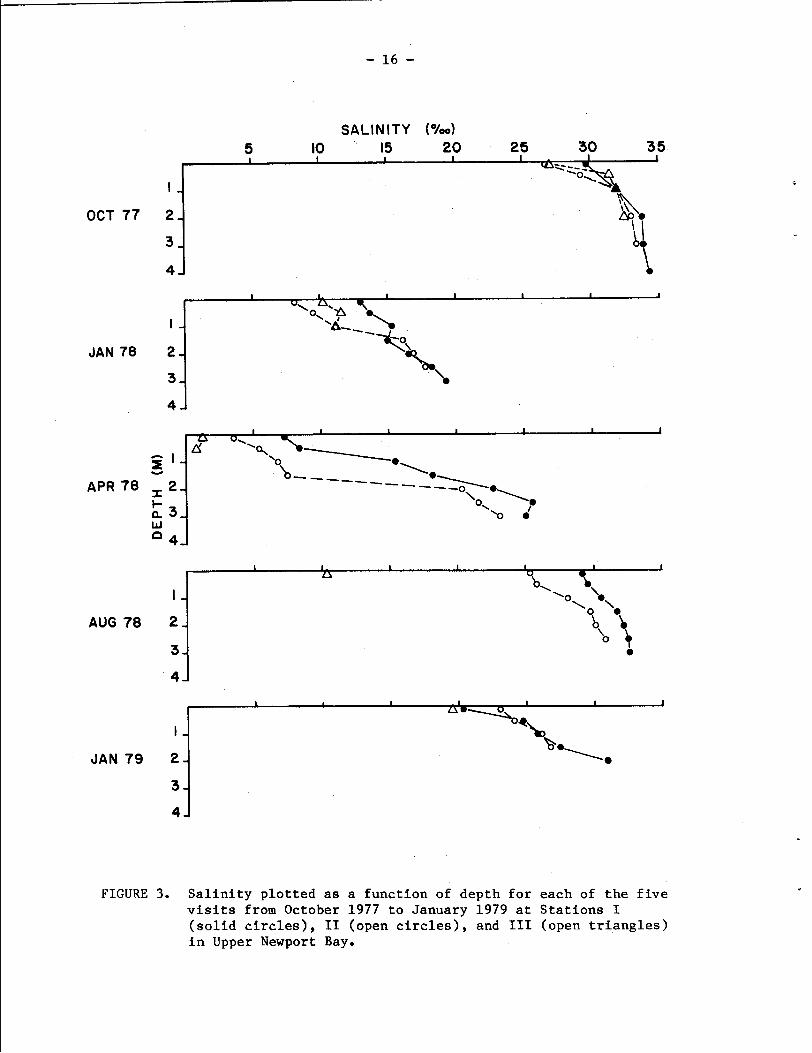
The pattern of seasonal input of freshwater into the Upper Bay is
reflected in the salinity data collected during each of the site visits
(Fig. 3). In October 1979, salinities at the three stations were high,
ranging from values of 26.7 to 29.8 O/oo at the surface to 34.3 O/oo
at a depth of 4 m at Station I. In January 1978, the Upper Bay waters
were appreciably diluted by fresh water inflow, resulting in surface
salinities ranging from 13.0 O/oo, (Station I) to 8.1 O/oo (Station
11). Bottom salinity at Station I11 was 11.2 O/oo,while bottom
salinities were 19.3 and 17.7 O/oo at Stations I and 11, respectively,
reflecting the mixing of these deeper waters with Lower Bay waters.
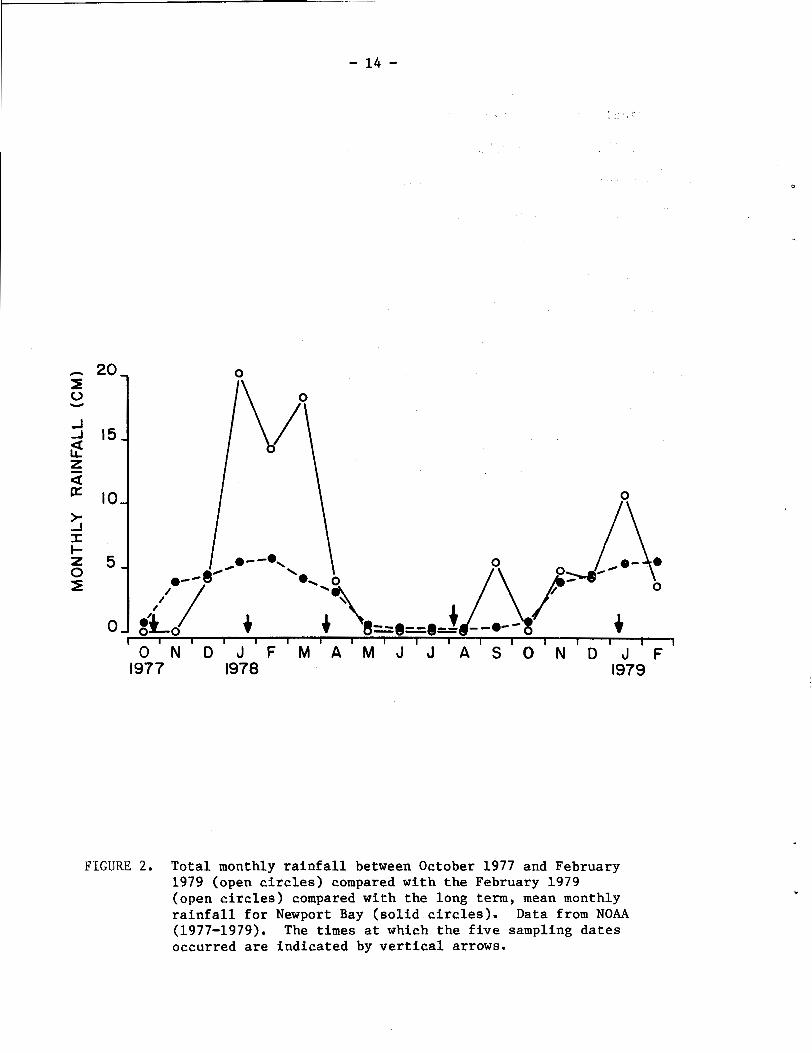
FIGURE 2. Total monthly rainfall between October 1977 and February 1979 (open circles) compared with the February 1979 (open circles) compared with the long term, mean monthly rainfall for Newport Bay (solid circles). Data from NOAA (1977-1979). The times at which the five sampling dates occurred are indicated by vertical arrows.
- 20, r 0 Y
15- a LL z - a P: 10-
3 I t-
5 , 0
5 0- $Lo 1.' .--bd / z\ + 0.. \ o ~ ~ a - 8 ~ j ,'iA --0-- 4 o I I 1 I I I I I I I I I I 1 I 1 1
O N D J F M A M J J A S O N D J F
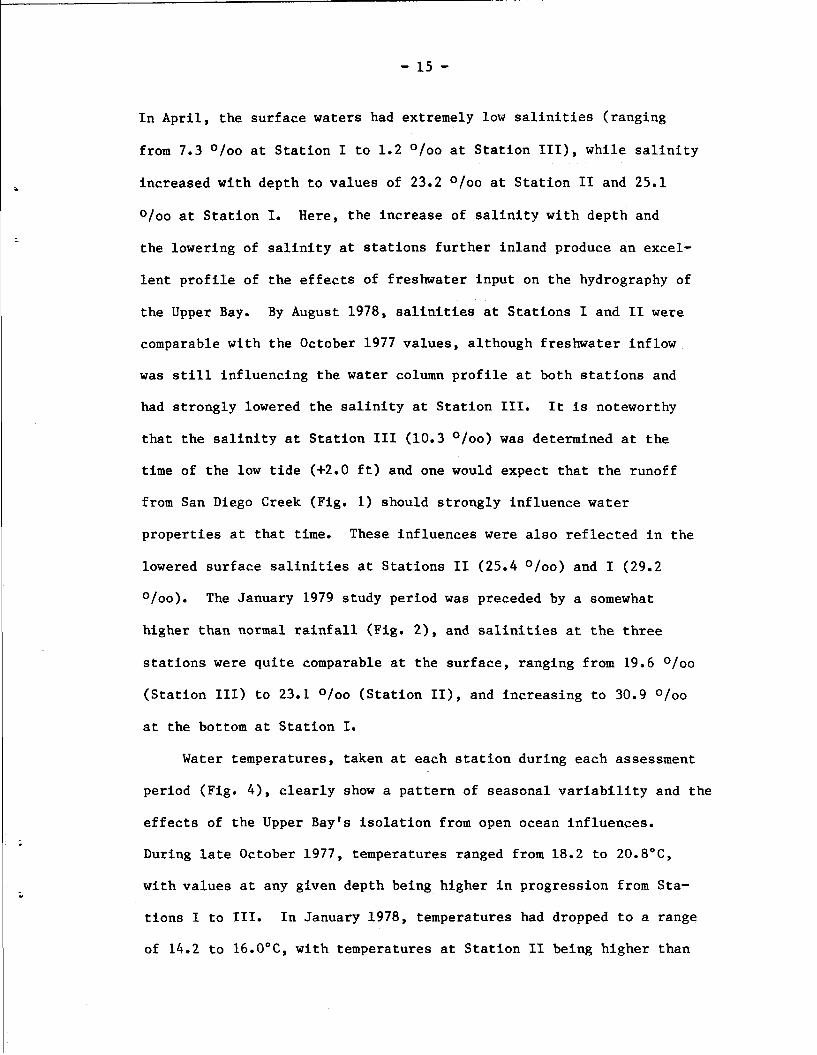
In April, the surface waters had extremely low salinities (ranging
from 7.3 0100 at Station I to 1.2 O/oo at Station III), while salinity
increased with depth to values of 23.2 O/oo at Station I1 and 25.1
o/oo at Station I. Here, the increase of salinity with depth and
the lowering of salinity at stations further inland produce an excel-
lent profile of the effects of freshwater input on the hydrography of
the Upper Bay. By August 1978, salinities at Stations I and TI were
comparable with the October 1977 values, although freshwater inflow
was still influencing the water column profile at both stations and
had strongly lowered the salinity at Station 111. It is noteworthy
that the salinity at Station I11 (10.3 O/oo) was determined at the
time of the low tide (+2.0 ft) and one would expect that the runoff
from San Diego Creek (Fig. 1) should strongly influence water
properties at that time. These influences were also reflected in the
lowered surface salinities at Stations I1 (25.4 O/oo) and I (29.2
/ o o ) The January 1979 study period was preceded by a somewhat
higher than normal rainfall (Fig. 2), and salinities at the three
stations were quite comparable at the surface, ranging from 19.6 0100
(Station 111) to 23.1 O/oo (Station II), and increasing to 30.9 O/oo
at the bottom at Station I.
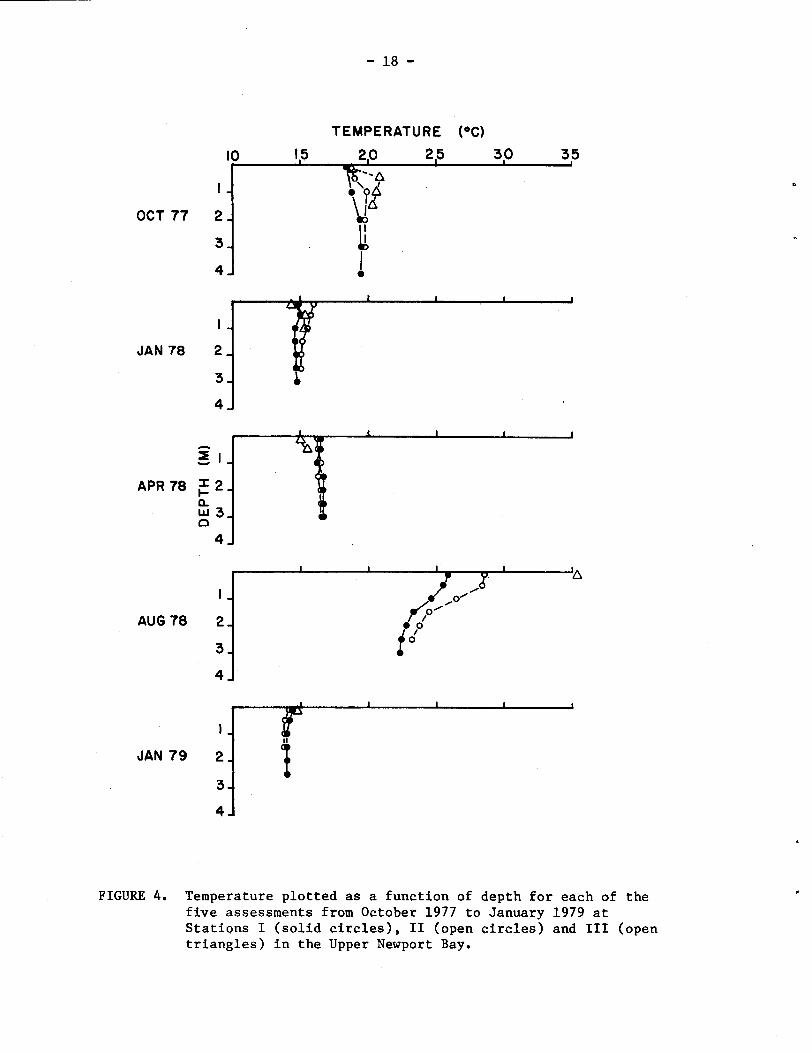
Water temperatures, taken at each station during each assessment
period (Fig. 4), clearly show a pattern of seasonal variability and the
effects of the Upper Bay's isolation from open ocean influences.
During late October 1977, temperatures ranged from 18.2 to 20.8OC,
with values at any given depth being higher in progression from Sta-
tions I to 111. In January 1978, temperatures had dropped to a range
of 14.2 to 16.0°C, with temperatures at Station I1 being higher than
SALINITY (O/w)
5 10 15 20 25 30 35 I I I 1 u-.- - -
I ,
OCT 77 2,
3,
4,
APR 78 , t- 0 W P
AUG 78
JAN 79
FIGURE 3. Salinity plotted as a function of depth for each of the five visits from October 1977 to January 1979 at Stations I (solid circles), I1 (open circles), and I11 (open triangles) in Upper Newport Bay.
those at Station I, and Station I11 being colder than Station 11;
probably as a result of mixing with inflowing colder fresh water.
Although the waters were somewhat warmer in April 1978, a similar
pattern was exhibited, with temperatures at Stations I and I1 (range
of 16.2 to 16.7OC) being nearly identical and Station I11 (15.0 to
15.5OC) being influenced by colder inflowing fresh water. By. August
1978, Upper Bay waters were very warm (22.3 to 35.4OC), with the
effects of isolation becoming more pronounced as one progresses from
Stations I to 111. Temperatures at all three stations were similar in
January 1979, and were about 1°C colder than those recorded in January
Sediments
The transport of sediments into the Upper Bay during the winter
rainy season of 1978 was considerable. No estimates of the quantities
transported into or deposited in the Upper Bay are made here, although
our measurements of bottom depths at midchannel locations for each
station give an indication of the magnitude of these deposits. Mid-
channel samples for October 1977 were taken at -9.8 ft at Station I,
-7.2 ft at Station 11, and -2.6 ft at Station 111. By August 1978,
the midchannel depths were noticeably shallower, being -7.5 ft at
Station I, -5.6 ft at Station 11, and +0.5 ft at Station 111. These
shallower depths were essentially established by April 1978, with the
January 1978 period presenting intermediate depths, e.g., the depth at
Station 111 was -1.6 ft in January.
The grain size distribution of the sediments changed noticeably
over the course of the study (Table l), with the mean particle size
TEMPERATURE (OC)
OCT 77
AUG 78
FIGURE 4. Temperature plotted as a function of depth for each of the five assessments from October 1977 to January 1979 at Stations I (solid circles), I1 (open circles) and I11 (open triangles) in the Upper Newport Bay.
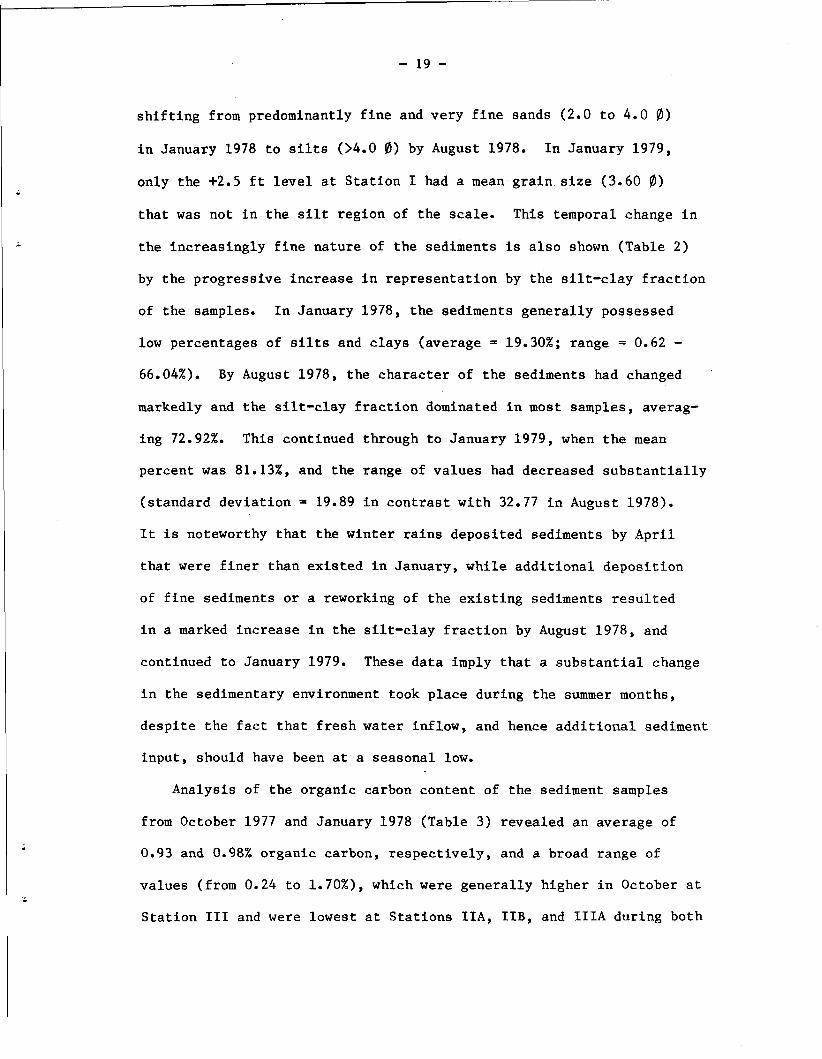
shifting from predominantly fine and very fine sands (2.0 to 4.0 0)
in January 1978 to silts 04.0 0) by August 1978. In January 1979,
only the +2.5 ft level at Station I had a mean grain size (3.60 fl)
that was not in the silt region of the scale. This temporal change in
the increasingly fine nature of the sediments is also shown (Table 2)
by the progressive increase in representation by the silt-clay fraction
of the samples. In January 1978, the sediments generally possessed
low percentages of silts and clays (average = 19.30%; range = 0.62 - 66.04%). By August 1978, the character of the sediments had changed
markedly and the silt-clay fraction dominated in most samples, averag-
ing 72.92%. This continued through to January 1979, when the mean
percent was 81.132, and the range of values had decreased substantially
(standard deviation = 19.89 in contrast with 32.77 in August 1978).
It is noteworthy that the winter rains deposited sediments by April
that were finer than existed in January, while additional deposition
of fine sediments or a reworking of the existing sediments resulted
in a marked increase in the silt-clay fraction by August 1978, and
continued to January 1979. These data imply that a substantial change
in the sedimentary environment took place during the summer months,
despite the fact that fresh water inflow, and hence additional sediment
input, should have been at a seasonal low.
Analysis of the organic carbon content of the sediment samples
from October 1977 and January 1978 (Table 3) revealed an average of
0.93 and 0.98% organic carbon, respectively, and a broad range of
values (from 0.24 to 1.70%), which were generally higher in October at
Station TI1 and were lowest at Stations IIA, IIB, and IIIA during both
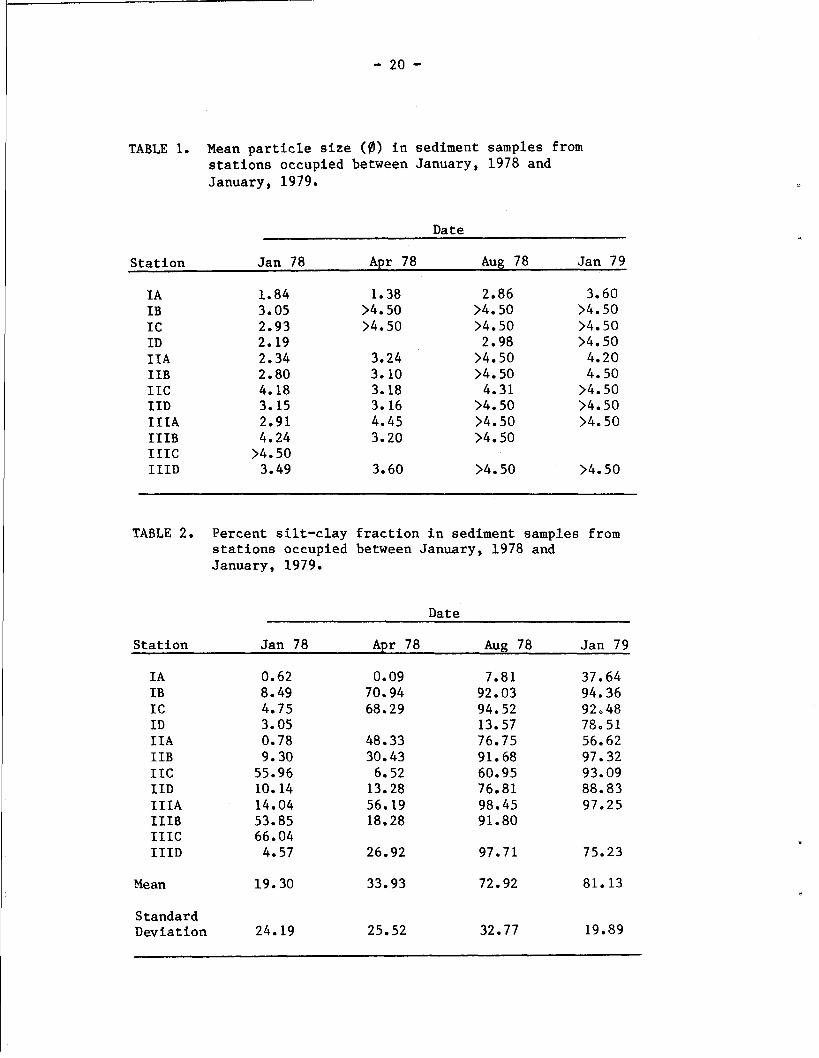
TABLE 1. Mean particle size (0) in sediment samples from stations occupied between January, 1978 and January, 1979.
Date
Station Jan 78 Apr 78 Aug 78 Jan 79
I A I B I C I D I I A I I B I I C I I D I I I A I I I B I I I C I I I D
TABLE 2. Percent silt-clay fraction in sediment samples from stations occupied between January, 1978 and January, 1979.
Station Jan 78 AD^ 78 AUB 78 Jan 79
I A I B I C ID I I A I I B I I C I ID I I I A I I I B I I I C I I I D
Mean 19.30 33.93 72.92 81.13
Standard Deviation 24.19 25.52 32.77 19.89
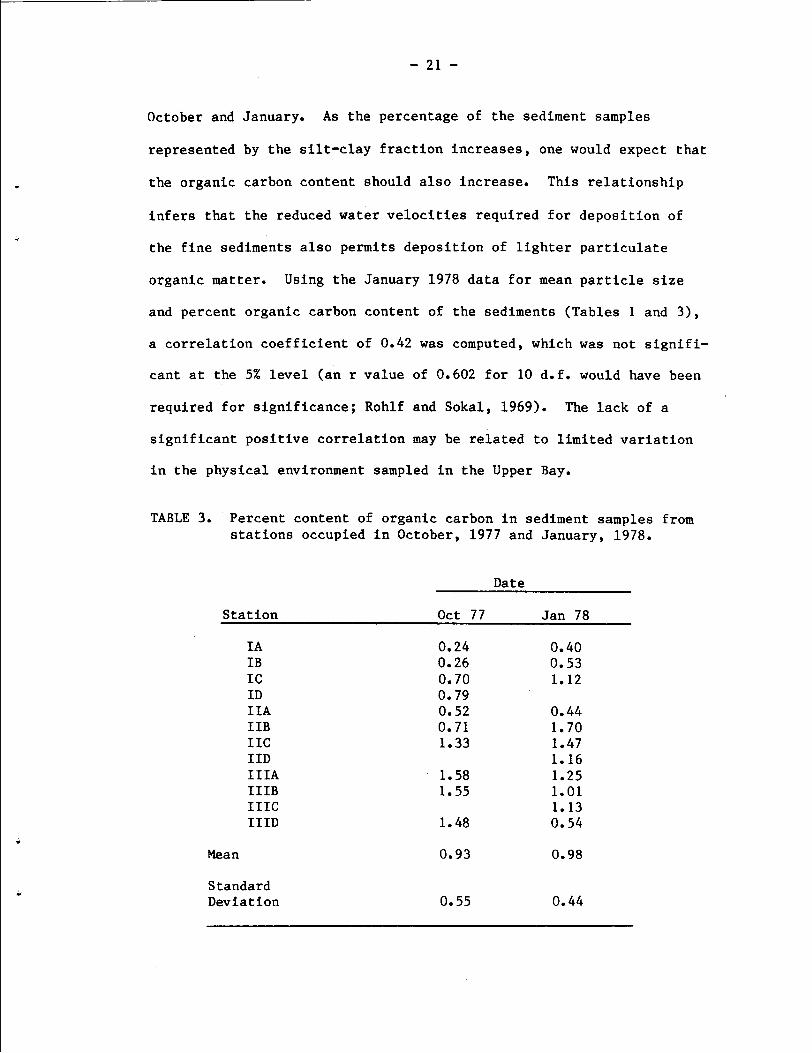
October and January. As the percentage of the sediment samples
represented by the silt-clay fraction increases, one would expect that
the organic carbon content should also increase. This relationship
infers that the reduced water velocities required for deposition of
the fine sediments also permits deposition of lighter particulate
organic matter. Using the January 1978 data for mean particle size
and percent organic carbon content of the sediments (Tables 1 and 3),
a correlation coefficient of 0.42 was computed, which was not signifi-
cant at the 5% level (an r value of 0.602 for 10 d.f. would have been
required for significance; Rohlf and Sokal, 1969). The lack of a
significant positive correlation may be related to limited variation
in the physical environment sampled in the Upper Bay.
TABLE 3. Percent content of organic carbon in sediment samples from stations occupied in October, 1977 and January, 1978.
Date
Station Oct 77 Jan 78
I A 0.24 0.40 IB 0.26 0.53 I C 0.70 1.12 ID 0.79 I IA 0.52 0.44 I IB 0.71 1.70 IIC 1.33 1.47 I ID 1.16 IIIA - 1.58 1.25 IIIB 1.55 1.01 IIIC 1.13 IIID 1.48 0.54
Mean 0.93 0.98
Standard Deviation
Density and Diversity Patterns
The total number of individuals per m2 at each tidal level was
averaged for each station during each seasonal assessment (Fig. 5).
During each assessment period, the total density was highest at Station
I and lowest at Station 111. Lowest densities at each station occurred
during the rainy season visits of January and April 1978. Interesting-
ly, the declines in density by nearly 15 fold at Stations I1 and 111
between October 1977 and January 1978 reflect the short-term impact of
the winter rains on the isolated upper portions of the bay. Station I,
which is less isolated than the other stations, experienced only a
3-fold decrease in density between October and January. However,
total density at Station I declined further in April, while numbers
actually increased by April at Stations I1 and 111. Recruitment to
the benthic community between the April and August censuses was heavy,
resulting in higher numbers than occurred during the Octobe- 1977
sampling period, and with density increases of nearly 10 fold (Stations
I and 11) and 15 fold (Station 111). The more "normal" wj-nter period
of 1978-1979 resulted in density decreases by January 1979 at each
station that were related to the degree of isolation of each station,
i.e., 9.4-, 5.5-, and 3.0-fold declines at Stations 111, IT, and I, - - respectively, between August 1978 and January 1979,
The total number of species present during each assessment
(Fig. 5) was highest at Station I and lowest at Station 111, except
during October 1977 for Stations I and 11. Species numbers decreased
sharply at each station during the rainy period, from 84 in October to
24 in April at Station I, from 60 in October to 13 in April at Station
1 1 . 1 1 ~ 1 1 1 1 1 1 1 1 , ~ ,
O N D J F M A M J J A S O N D J
FIGURE 5. T o t a l d e n s i t y , number of s p e c i e s , s p e c i e s d i v e r s i t y , and evenness f o r each of t h e f i v e assessments a t S t a t i o n s I ( s o l i d c i r c l e s ) , I1 (open c i r c l e s ) , and I11 (open t r i a n g l e s ) i n t h e Upper Newport Bay.
111, and with Station I1 showing the greatest decline, from 90 in
October to 14 in April. Species numbers increased by two to four fold
between April and August, but declined again by January 1979.
Comparison of species numbers for the October 1977 and August 1978
assessments (Fig. 5 ) suggests that while Station I had nearly recovered
(84 vs 78 species), neither Stations I1 or 111 (90 vs 55 species and
60 vs 26 species, respectively) had recovered appreciably following
the 1978 rainy season. Comparison of species numbers between January
1978 and January 1979 indicate that although fewer species were re-
corded at Station I11 in January 1979 (18 vs lo), higher numbers
occurred at Stations I and I1 (39 vs 50 and 22 vs 31, respectively).
These data are possibly explainable by the observation that midchannel
depths at the three stations did not appear to become shallower be-
tween October 1978 and January 1979. Thus, sediment deposition prior
to the January 1979 sampling would appear to have been negligible,
while sediment transport Into the Upper Bay preceding the January 1978
assessment appears to have been substantial, and could have had
smothering or burial effects on the fauna.
Using average species density data at each station, Shannon
diversity index (H') values were computed (Fig. IS), which indicate
paral le l trends for Stations 11 and 111, -- i.e., maximal diversity in
October 1977 (H' = 3.62 and 3.98, respectively) , followed by a decline
to lowr of 1.17 a d 1.12 i n April. After April, trends at the three
etationr were rimilar; increaeiag i n August, and then decreasing soare-
what In January 1979. Diversity changes at Station I between October
and April were peculiar, with lower values than either of the other
stations during October and January and a higher value in April.
Since species numbers were higher (except for October 1977) at Station
Y I, the depressed H1 values for October and January 1978 can be
attributed to low evenness among the species densities (Fig. 5), while
Stations I1 and 111, which had lower total densities and a higher
evenness component, had higher H1 values. Similarly, the reason H1
was not lower at Station I in April is partially attributable to the
fact that the evenness component at that station was higher than at
the other two stations. In August and January 1979, J1 values for the
three stations were similar (Fig. 5), and the differences in H' be-
tween the stations is clearly related to (and parallels) the richness
component, i.e., species numbers. - -
Community Structure
Cluster analyses were performed to determine station and tidal
level groupings for each visit. The dendrogram obtained from analysis
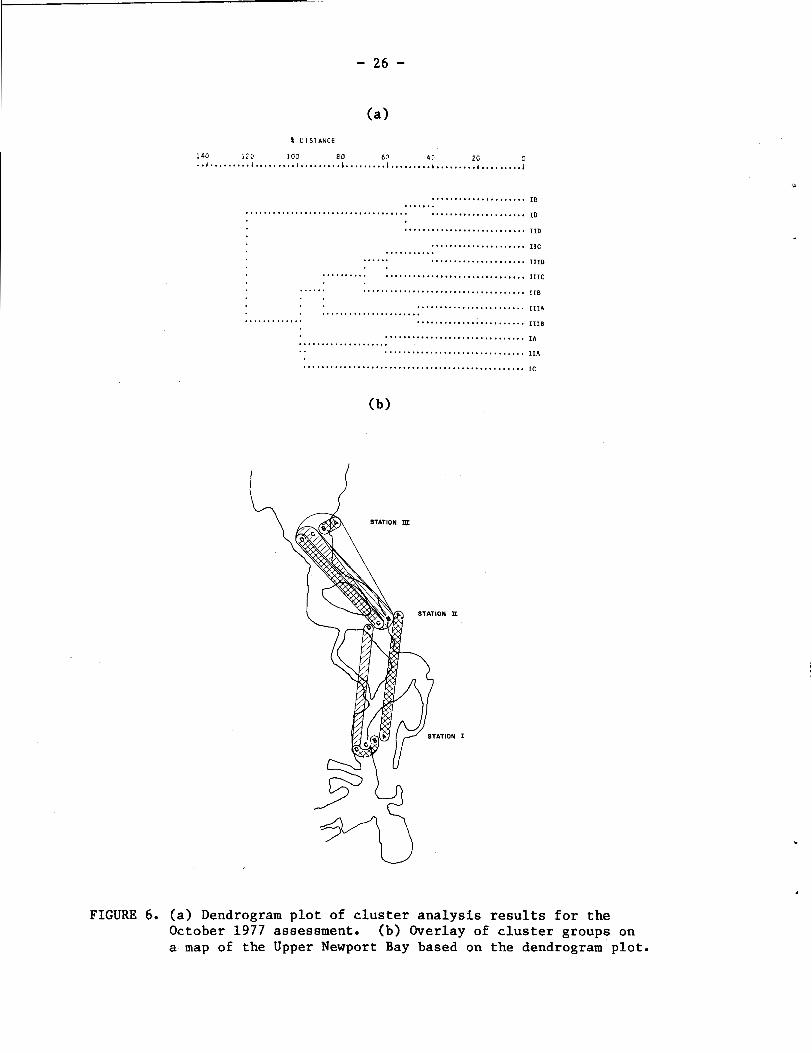
of the October 1977 visit (Fig. 6a) reveals the presence of two major
groupings, of which the second can be further subdivided at the 90%
distance level. Interpretation of these patterns is facilitated by
overlaying the cluster groups on a map of the study area (Fig. 6b).
The first cluster group is seen to include the midchannel samples at
Stations I and I1 and the MLLW sample at Station I. The +2.5 ft
samples at Stations I and I1 are also distinctive as a separate
cluster group. The remaining group is large and includes the 0.0 and
-2.5 ft samples at Station I1 and all of the Station 111 samples.
Within this grouping, the 0.0 and +2.5 levels at Station 111 are
distinctive from the remaining four sites shared between Station I1
% D I S T A N C E
FIGURE 6. (a) Dendrogram plot of cluster analysis results for the October 1977 assessment. (b) Overlay of cluster groups on a map of the Upper Newport Bay based on the dendrogram plot.
(0.0 and -2.5 ft) and Station I11 (-2.5 ft and midchannel). Thus, the
sites are grouped both horizontally and vertically; Stations I and I1
are linked at the midchannel and +2.5 ft levels, while Stations 11 and
111 are linked at 0.0 and -2.5 ft and at -2.5 ft and midchannel depths,
respectively. The grouping together of the Station 111 samples, with
their only linkage being to the -2.5 ft and 0.0 samples at Station 11,
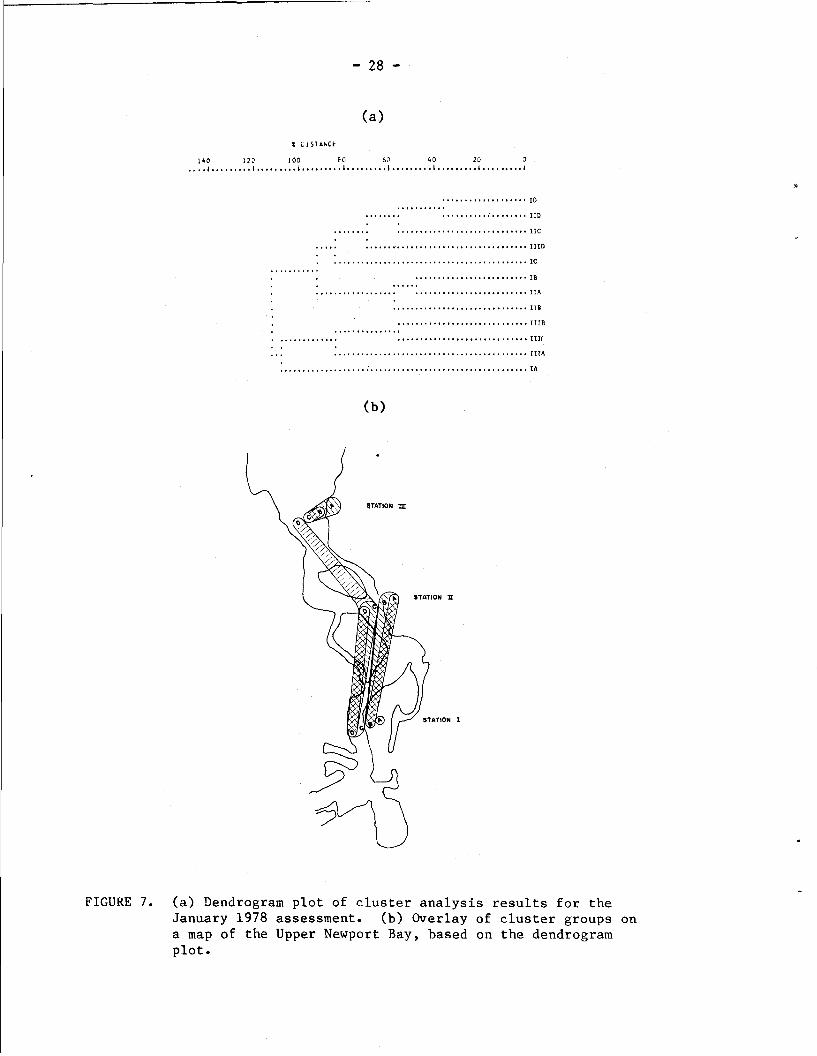
reflects the relative isolation of this station. This isolation is
more pronounced in January 1978 (Fig. 7 ) , with the +2.5 ft, 0.0, and
-2.5 ft samples at Station 111 forming a cluster group separate at the
100% distance level from the remaining large cluster group. The mid-
channel sample at Station 111 is grouped with the midchannel and -2.5
ft samples at Stations I and 11. This clustering pattern is possibly
a reflection of the fact that these deeper sites share an elevated
salinity, while the ahallower sites are differentially impacted by
fresh water runoff. This would certainly agree with the observed
isolation of the -2.5 ft, 0.0 ft, and +2.5 ft samples at Station III
and with the vertical separation of the midchannel and -2.5 ft samples
from the 0.0 and +2.5 ft samples that are linked horizontally at
Statione I and 11.
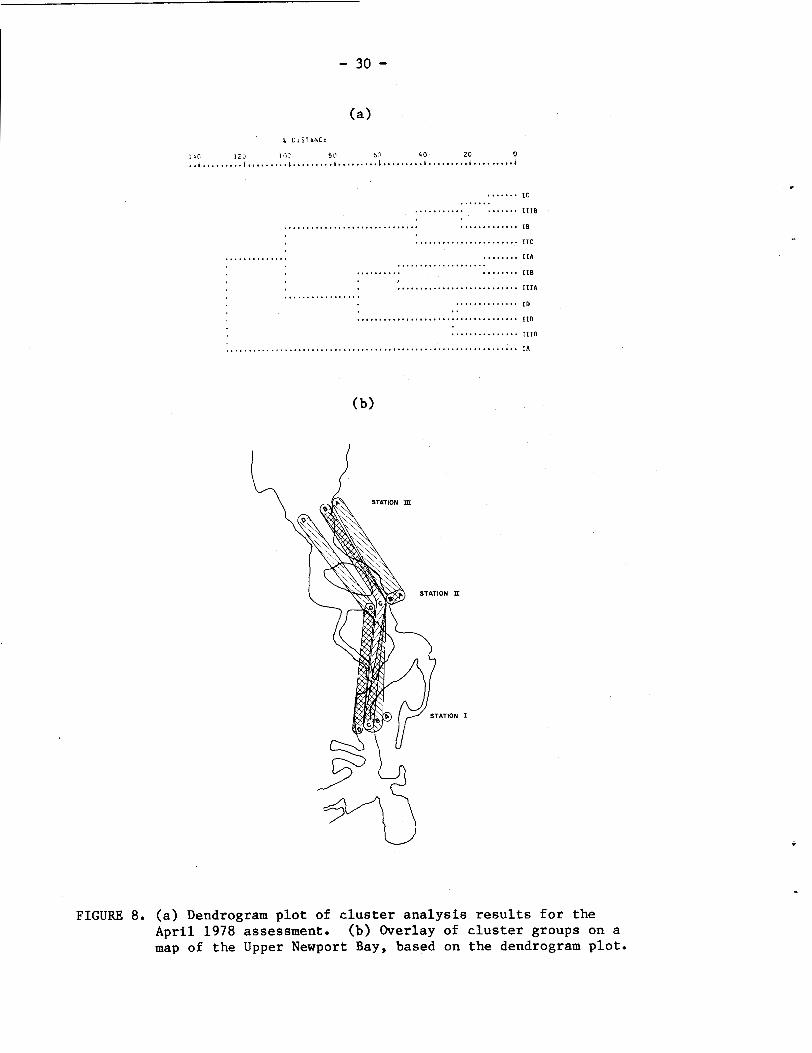
Resulte of the cluster analysis for April 1978 (Fig. 8) strongly
reflect the impact of fresh water runoff on community structure. The
marked drop in apeciee diversity and abundance8 discussed above for
the April aseesement resulted in higher similarities ( L e e , - - lower
ecological distances) between site groupings in the cluster analysis.
At the 60% distance level, three cluster groups are defined (Fig. 8b)
ae a midchannel group and as a -2.5 ft (Stations I and 11) and 0.0 ft
(Stations I and 111) group which are linked across all three stations.
.......... ......."ID ........... ................... . , . . . . s a IID
........ ............................. IIC
..,,. ......... . ~ ~ . ~ ~ ~ . . ~ . ~ ~ . ~ ~ - ~ ~ ~ ~ ~ . * ~ - ~ I I I D . . ............................................ IC ........... ......................... IB ......
........................................... IIA
........... *..................IIB ............................. IIIB ............... ............................. IIIC .............. . . ........................................... IIIA . . .
........................................................ IA
STATION Ill
STATION II
f--
FIGURE 7. (a) Dendrogram plot of cluster analysis results for the January 1978 assessment. (b ) Overlay of cluster groups on a map of the Upper Newport Ray, based on the dendrogram plot.
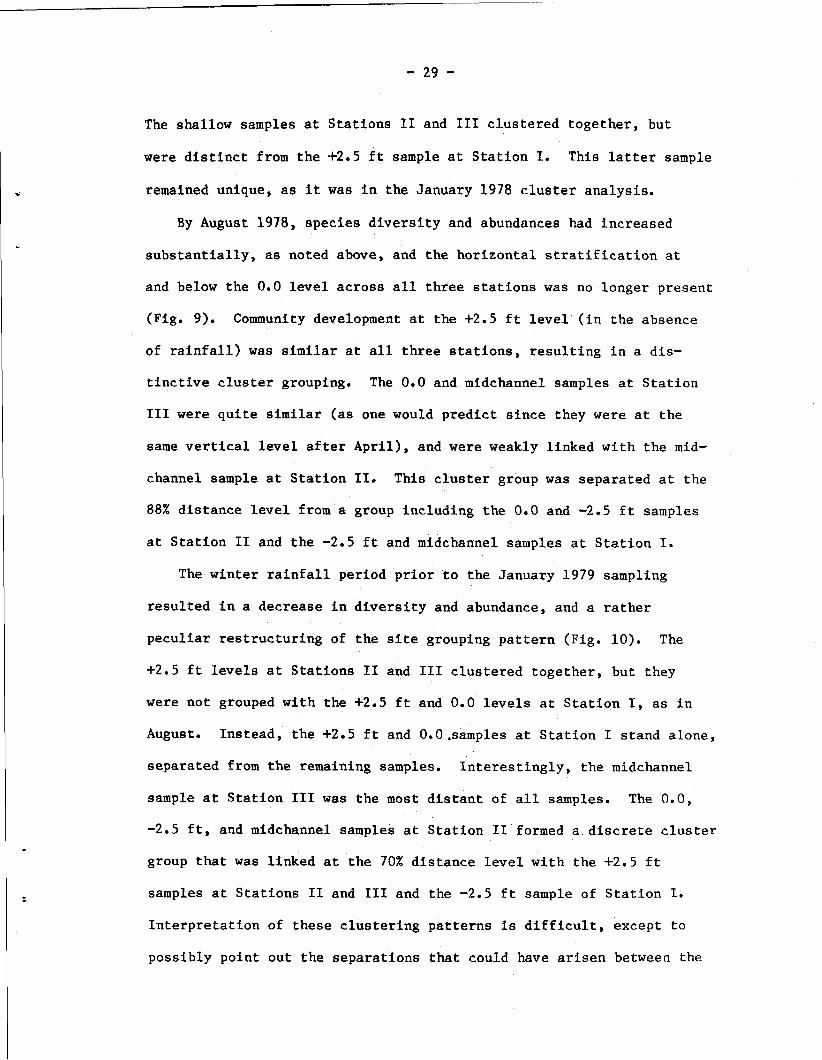
The shallow samples at Stations 11 and I11 clustered together, but
were distinct from the +2.5 ft sample at Station I. This latter sample
remained unique, as it was in the January 1978 cluster analysis.
By August 1978, species diversity and abundances had increased
substantially, as noted above, and the horizontal stratification at
and below the 0.0 level across all three stations was no longer present
(Fig. 9). Community development at the +2.5 ft level (in the absence
of rainfall) was similar at all three stations, resulting in a dis-
tinctive cluster grouping. The 0.0 and midchannel samples at Station
111 were quite similar (as one would predict since they were at the
same vertical level after April), and were weakly linked with the mid-
channel sample at Station 11. This cluster group was separated at the
88% distance level from a group including the 0.0 and -2.5 ft samples
at Station I1 and the -2.5 ft and midchannel samples at Station I.
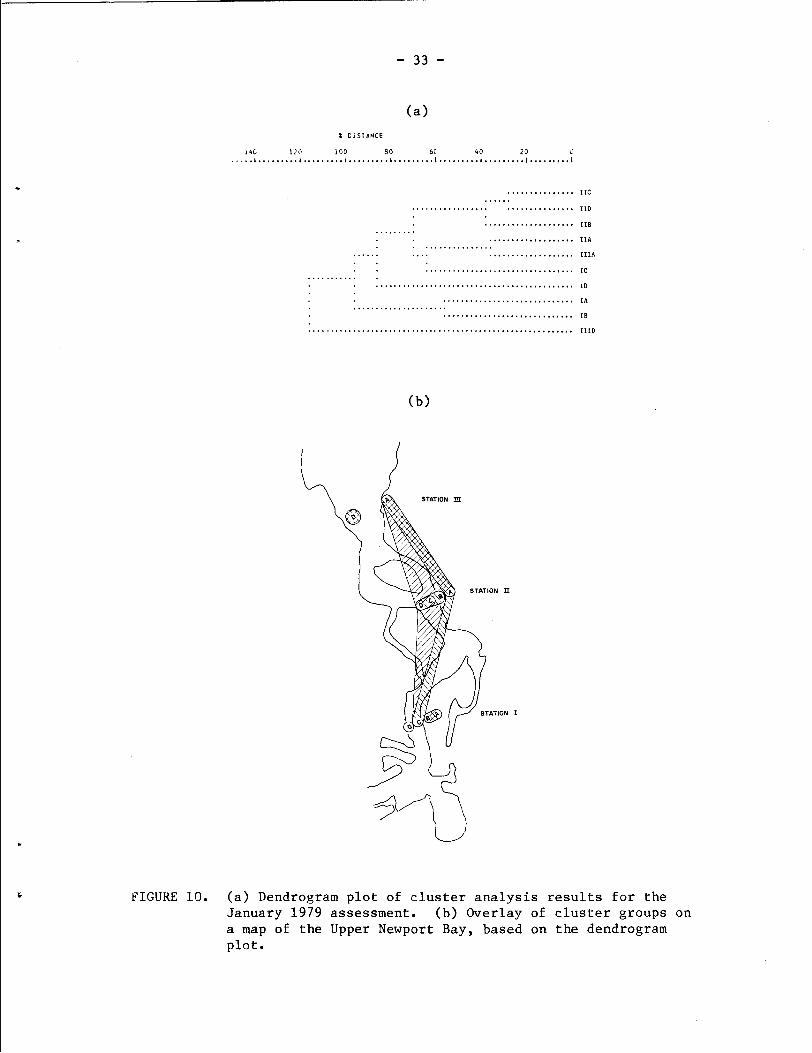
The winter rainfall period prior to the January 1979 sampling
resulted in a decrease in diversity and abundance, and a rather
peculiar restructuring of the site grouping pattern (Fig. 10). The
+2.5 ft levels at Stations I1 and 111 clustered together, but they
were not grouped with the +2.5 ft and 0.0 levels at Station I, as in
August. Instead, the +2.5 ft and 0.O.samples at Station I stand alone,
separated from the remaining samples. Interestingly, the midchannel
sample at Station 111 was the most distant of all samples. The 0.0,
-2.5 ft, and midchannel samples at Station I1 formed a discrete cluster
group that was linked at the 70% distance level with the +2.5 ft
samples at Stations I1 and I11 and the -2.5 ft sample of Station I.
Interpretation of these clustering patterns is difficult, except to
possibly point out the separations that could have arisen between the
$ 6 ' I : ., 0 ... 1'3: 8 0 f, 7 4 0 20 .. 1 ......... I . . . ...... )......... I . . . . . .... l . . . . . . . . . L . . . . . . . . . l . . . . . . . . . I
............. IB .............................. ....................... IIC
........ IIA .............. .................... ........ .......... IIB
........................... IIIA ................. .............. ID . . .................................... IID
FIGURE 8. (a) Dendrogram plot of cluster analysis results for the April 1978 assessment. (b) Overlay of cluster groups on a map of the Upper Newport Bay, based on the dendrogram plot.
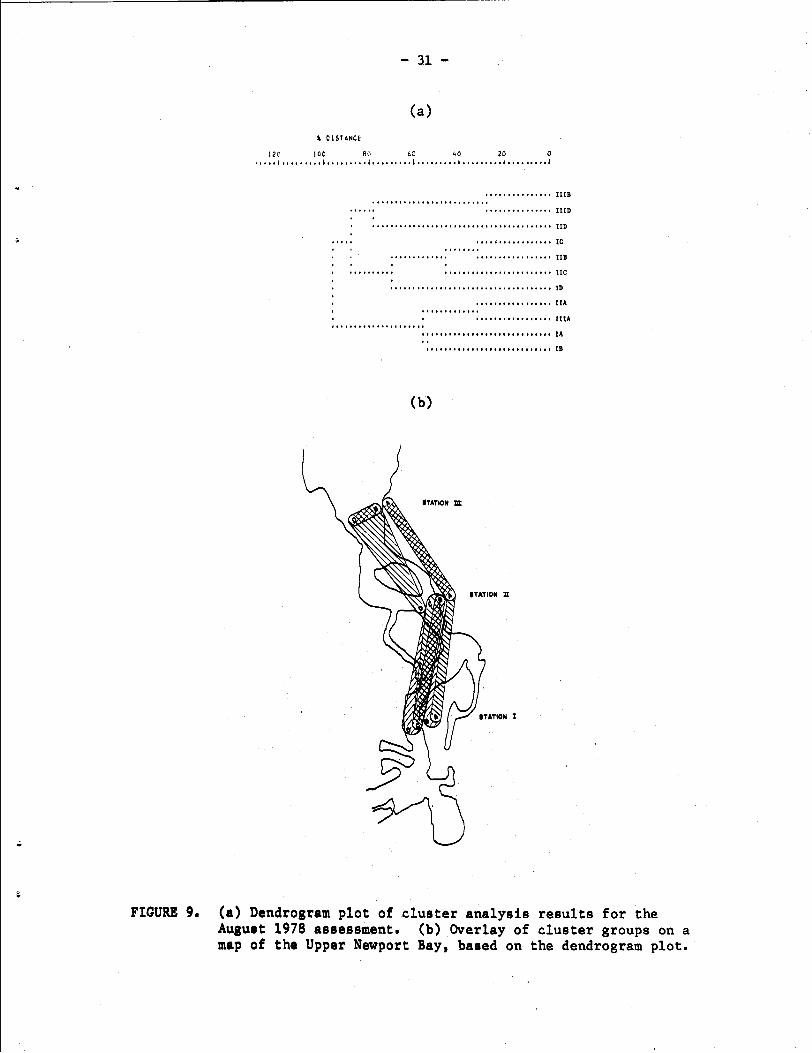
FIGURE 9. (a) Dendrogram plot of cluster analysis results for the August 1978 assessment. (b) Overlay of cluster groups on a map of the Upper Newport Bay, based on the dendrogram plot.
different stations as a result of differential fresh water impaction.
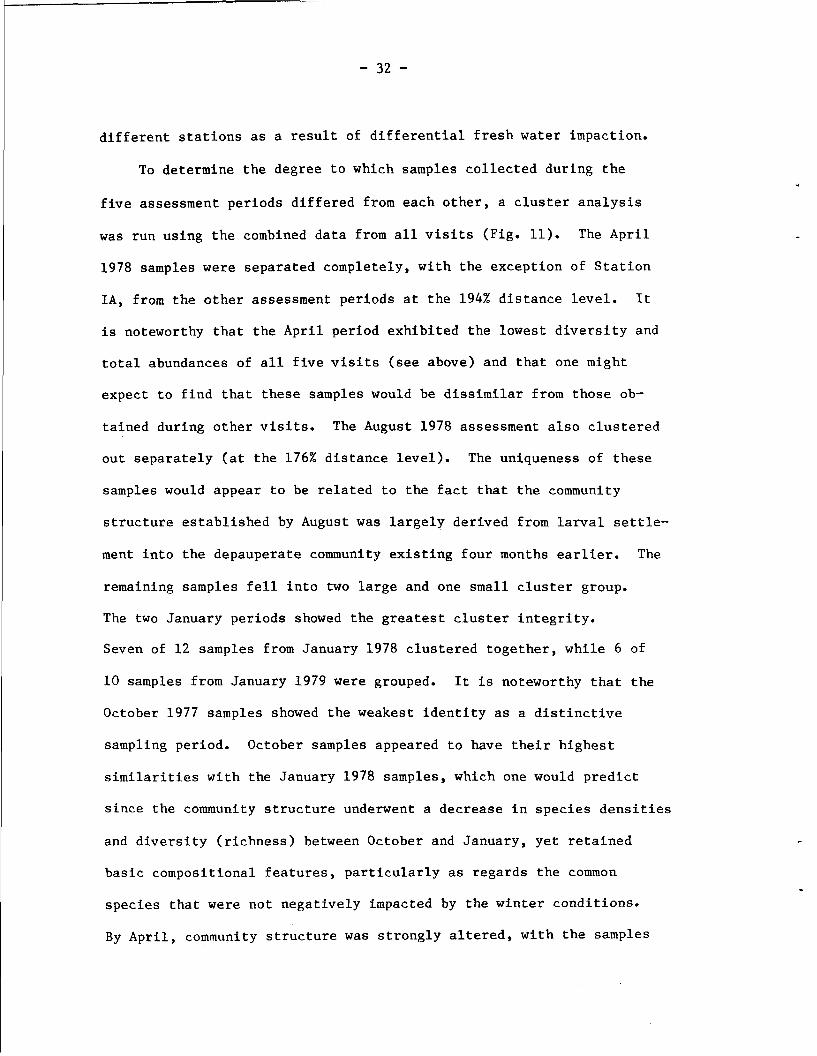
To determine the degree to which samples collected during the
five assessment periods differed from each other, a cluster analysis
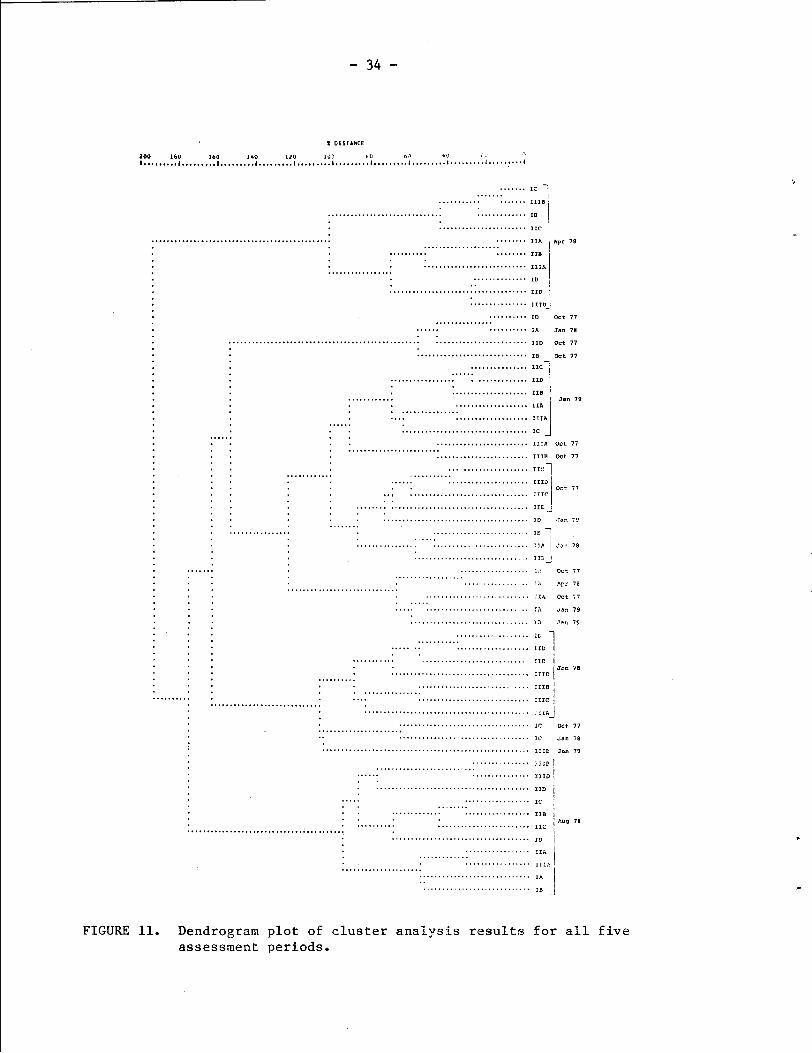
was run using the combined data from all visits (Fig. 11). The April
1978 samples were separated completely, with the exception of Station
IA, from the other assessment periods at the 194% distance level. It
is noteworthy that the April period exhibited the lowest diversity and
total abundances of all five visits (see above) and that one might
expect to find that these samples would be dissimilar from those ob-
tained during other visits. The August 1978 assessment also clustered
out separately (at the 176% distance level). The uniqueness of these
samples would appear to be related to the fact that the community
structure established by August was largely derived from larval settle-
ment into the depauperate community existing four months earlier. The
remaining samples fell into two large and one small cluster group.
The two January periods showed the greatest cluster integrity.
Seven of 12 samples from January 1978 clustered together, while 6 of
10 samples from January 1979 were grouped. It is noteworthy that the
October 1977 samples showed the weakest identity as a distinctive
sampling period. October samples appeared to have their highest
similarities with the January 1978 samples, which one would predict
since the community structure underwent a decrease in species densities
and diversity (richness) between October and January, yet retained
basic compositional features, particularly as regards the common
species that were not negatively impacted by the winter conditions.
By April, community structure was strongly altered, with the samples
a.............. IIC ...... . . . . . . . . . . . . . . . . . . . . . . . . . . . . . . . . IID
.................... IIB ......... .................a. IIA . . . . . . . . . . . . . . . . ..... .,.. ................... IIIA
........................................................... IIID
FIGURE 10. (a) Dendrogram p l o t of c l u s t e r a n a l y s i s r e s u l t s f o r t h e January 1979 assessment . (b) Overlay of c l u s t e r g roups on a map of t h e Upper Newport Ray, based on t h e dendrogram p l o t .
I D I S I I N C F
200 160 160 1+0 120 LOO 8 !I 0, ) * 0 < . ......... ......... ......... ......... ......... ......... ......... ......... .... ...... I 1 1 1 1 I 1 1 1 # . . . . I ...I
IC 1 ....... ....... ........... . . . . . . . . 1 1 1 ~ ; ............. .............................. IB
....................... ,IC I
........ ............................................... 11,. I
.................... .......... ........ IIB i Apr 78
........................... IIIA ................. .............. ID . I .................................... IID .
............... I IIIOJ
.......... 10 @t 77 ............... * . . . a . .......... Ip, Jan 78 . . .......................................................................... IID OSt 77
........................... Ia OCt 7 ,
............... IIC ...... ............................... IID .................... IIB ............ ................... KIA 1 ................
Jon 79
.... IIIA ................... ...... . . .................................. IC ...... . . . . . . ........................ IITP O C t 77 . . ......................... . . ........................ . . IIIB Oct 77
. . .................... . . ,I.] ............ ........... ...... ..................... . . . . 1110 . . . . .................................. IIIC . . . . . . ............................................. . . I wt 77
IIE, . . . . . . . . . . . . . . . . . . . . . . . . . . . . . . . . . . . . . . . . . . . . . . ........ ID .Tan 7 "
................. ......................... I n 7 ...... ................................... :....+ 11A 1 Jan 78 .......................... : ... I,, J
....... ..................... . . OCt 77 . . .................. . . ................. li Apr 78 ............................. . . . . .......................... ,IA O"t 77 . . . . . . . . . . ................................ 78 Jan 79 9 . . . ............................... I: Jar: 79
FIGURE 11.
................... 1E ........... ................... ....... IIC 1
IITa I IIIC
.:IAj
Dendrogram plot cluster analysis results f o r all f i v e assessment periods.
becoming structurally simpler and, thus, different from those ob-
tained during the other assessment periods.
Species Distributions and Abundances
Density data for the sampled species and taxa are given in
Appendices I-V as averaged and paired replicate values by tidal level
and station. The most numerically-important taxonomic group during
each of the five assessments was the polychaete worms. In October
1977, 49 species of polychaetes were.recorded (Appendix I) with a
total mean density (i.e., the sum of the mean densities of each
species at each station, averaged for all three stations) of 15,891
individuals per m2. Total mean polychaete density per station was
highest at Station I (28,750/m2), followed by Station I1 (16,908/m2)
and Station 111 (2,016/m2). At Station I, 97% of the specimens col-
lected were polychaetes, while at Stations I1 and 111 the polychaetes
were also the domlnant taxon, but were not as proportionately im-
portant, representing 70% and 44%, respectively, of the fauna. The
polychaete species with the highest mean densities (meraged over all
samples) were the sabellid Fabricia limnicola (7,402 jm2), the spinoid
Streblospiu benedicti (2 ,853/m2), and the capitellid Cap* - tel la - capitata (2, 139/rn2). Two oligochaetes, -- Peloscolex sp. A and Pelo-
scolex sp. B, contributed mean densities of 964/m2 and 666/m2, -- respectively. Although represented by 19 species, the molluscan densi-
ties were low, with the exceptions of Acteocina inculta (mean of
209/m2) and Tagelus spp, juveniles (mean of 304/m2). It is noteworthy
that the juvenile Tagelus had selectively settled in the upper portion
of the bay, as evidenced by the high mean density of 886/m2 at Sta-
tion 111 compared with 26/m2 at Station I1 and l/m2 at Station I.
Settlement of Tagelus spp. at Station 111 was essentially limited to
the +2.5 ft (2,481/m2) and 0.0 ft (1,054/m2) levels. Adult Tagelus
were represented at these intertidal levels only by a low density
(17.5/m2) of - T. californianus at +2.5 ft. However, Tagelus did not
survive the following winter period, as their densities were greatly
reduced by January (Appendix IT), and they were gone from Station I1
and I11 (except at IIA) by April (Appendix 111). In October 1977, the
crustaceans were represented by 28 taxa (Appendix I), of which 15 were
amphipods. Although the amphipods were not numerically important,
Mayerella acanthopoda averaged 159 individuals/m2 and was quite abun-
dant (1 ,138/m2) at Station IID. Among the remaining crustaceans,
only the cumacean Oxyurostylis pacifica was common, with a mean
density of 144/m2 and with individuals present at all tidal levels
and stations.
Between October 1977 and January 1978, substantial declines had
occurred (Appendix 11) in species richness (from 117 to 46 taxa) and
abundance (from a total mean density of 19,444/m2 to 3,620jm2)~ A s
in October, the polychaetes were the most numerous taxon Ln January,
representing an average of 55% (ranging from 85% at Station T to 37%
at Station 111) of the individuals sampled and 70 of the 47 tax2
recorded. The most abundant species, in terms of mean density, were
Fabricia limnicola (1 ,916/m2), Capitella capitata (368/m2), and
Streblospio benedicti (204/m2). Although these three species were
also the numerical dominants in October, their mean densities were
markedly lower, ranging from a 4-fold reduction of - F. limnicola to a
14-fold decline for - S. benedicti. Overall, decreases in abundance
by the polychaetes were most pronounced at Stations I1 (a 26-fold
decline, from a total mean density of 16,908/m2 in October to
661/m2 in January) and I11 (a 19-fold decrease, from a total mean
density of 2,016/m2 in October to 107/m2 in January). Both species
of oligochaetes that were abundant in October were present in January,
but in quite reduced numbers. Peloscolex sp. A had decreased from a
mean density of 964/m2 to 109/m2, while Peloscolex sp. B had declined
from 666/m2 to 169/m2. The mollusks decreased in numbers of taxa
from 19 in October to 11 in January, with only one species, Acteocina
inculta , showing moderate densities (mean of 235/m2). The crustaceans
underwent a dramatic decline in both numbers of taxa (from 28 to 6)
and abundance (from a total mean density of 645/m2 to 9/m2). The
crustaceans were only infrequently collected in January (occurring
in 6% of the samples), and their maximal density was only 12. 5/m2.
Between January and April 1978, during the heavy winter rainfall
period (Fig. 2), the total number of taxa decreased from 46 to 27
(Appendix 111). The total mean density, however, increased slightly
(from 3,620/m2 to 3,760/m2). As in October and January, most of
the faunal abundance was attributable to the polychaetes, which
accounted for 89, 82, 85% of the fauna (in terms of total mean density)
at Stations I, 11, and 111, respectively. While the total mean
polychaete density decreased at Station I (from 7,913/m2 to 5, 167/m2),
it increased at Stations I1 (from 661/m2 to 2,942/m2) and I11
(from 107/m2 to 1 ,618/m2). Interestingly, two of the three dominant
polychaete species during October and January were only abundant at
the +2.5 ft level at Station I in April. Streblospio benedicti had
a n average d e n s i t y a t t h i s s t a t i o n of 6 ,438 /a2 , w h i l e C a p i t e l l a
c a p i t a t a had a n average d e n s i t y h e r e The t h i r d s p e c i e s ,
F a b r i c i a l i m n i c o l a , had been wiped o u t e n t i r e l y , w i t h t h e e x c e p t i o n
of a s i n g l e i n d i v i d u a l c o l l e c t e d i n a midchannel sample a t S t a t i o n
111. These t h r e e s p e c i e s were r e p l a c e d n u m e r i c a l l y by t h e s p i o n i d
Polydora l i g n i , which had mean d e n s i t i e s a t S t a t i o n s I , 11, and I11
of 2 , 038/m2, 2 , 797/m2, and 1, 578/m2, r e s p e c t i v e l y . Another
s p i o n i d , Polydora n u c h a l i s was impor tan t a t t h e +2.5 f t l e v e l a t
S t a t i o n I , having a n average d e n s i t y .of 1 ,650/m2. The o l i g o c h a e t e
fauna changed i n a n i n t e r e s t i n g manner. P e l o s c o l e x sp. A d e c l i n e d
2 2 from a mean d e n s i t y of 109/m i n January t o 48/m i n A p r i l . Pelo-
s c o l e x sp. B decreased from a mean d e n s i t y of 169/m2 i n January t o
i ts absence from S t a t i o n s I and I1 and a mean d e n s i t y of 38/m2 a t
S t a t i o n 111 i n Apr i l . The u n i d e n t i f i e d o l i g o c h a e t e sp. A i n c r e a s e d
s l i g h t l y from a mean d e n s i t y of 41/m2 t o 53/m2, w h i l e t h e u n i d e n t i -
f i e d o b l i g o c h a e t e sp. B , which was n o t r ecorded d u r i n g October o r
January , had mean d e n s i t i e s of 200/m2 and 535/m2 a t S t a t i o n s I and
I T , r e s p e c t i v e l y , and was a b s e n t from S t a t i o n I11 i n A p r i l . The
number of mol luscan s p e c i e s decreased from 11 i n January t o 6 i n
A p r i l , w i t h on ly Acteocina i n c u l t a o c c u r r i n g i n noteworthy numbers
a t s t a t i o n I (mean of 285/m2). The c r u s t a c e a n s decreased from 6 t o
2 t a x a , w i t h t h e s e two t a x a o c c u r r i n g s p a r s e l y .
The absence of r a i n f a l l d u r i n g t h e f o u r month p e r i o d between
t h e A p r i l and August a ssessments was c o r r e l a t e d , a s no ted above,
w i t h t h e i n c r e a s e i n d i v e r s i t y and abundance of t h e b e n t h i c community.
The t o t a l mean d e n s i t y f o r t h e fauna i n August (Appendix IV) was
maximal f o r t h e e n t i r e s t u d y p e r i o d , and averaged 41,310/m2, w i t h a
range of 60,317/rn2 a t S t a t i o n I t o 20,041/m2 a t S t a t i o n 111. The
h i g h t o t a l d e n s i t i e s a t each s t a t i o n were l a r g e l y a t t r i b u t a b l e t o
t h e p o l y c h a e t e s (73 , 80 , and 847! of t h e t o t a l mean d e n s i t i e s a t
S t a t i o n s 1, 11, and 111, r e s p e c t i v e l y ) . F i v e s p e c i e s of p o l y c h a e t e s
comprised 90% of t h e t o t a l mean po lychae te d e n s i t y ; Polydora l i g n i
(8, 047/m2), C a p i t e l l a c a p i t a t a ( 7 , 906/m2), Pseudopolydora pauc i -
b r a n c h i a t a ( 5 , 783/m2), S t r e b l o s p i o b e n e d i c t i ( 5 ,106/m2) and S c o l e l e p i s
a c u t a (2,123/m2). The c l u s t e r a n a l y s i s r e s u l t s f o r a l l a s sessments
(Fig . 11) i n d i c a t e d t h e uniqueness of t h e August samples , and is
r e f l e c t e d h e r e i n t h e changed p a t t e r n of p o l y c h a e t e s p e c i e s dominance.
Comparisons w i t h t h e October 1377 d a t a (Appendix I ) i n d i c a t e a sub-
s t a n t i a l d e c l i n e by t h e s a b e l l i d F a b r i c i a l i m n i c o l s . It w a s t h e
2 most numerous s p e c i e s i n October (7,402/m ), b u t i n August 1978 i t
was o n l y p r e s e n t a t S t a t i o n I , a t a mean d e n s i t y of 1,522/m2, w i t h
most i n d i v i d u a l s o c c u r r i n g +2.5 f t . The most abundant s p e c i e s i n
August, Polydora l i g n i , had a mean d e n s i t y of 182/m2 i n Oc tober ,
which is 1/44 of i t s mean d e n s i t y i n August. S i m i l a r l y , S c o l e l e p i s
a c u t a had a mean d e n s i t y of 69/m2 i n October , which was 1 / 3 1 of
i t s August d e n s i t y . Among t h e o l i g o c h a e t e s , t h e two s p e c i e s of
P e l o s c o l e x (spp. A and B ) t h a t dominated i n October v e r e of secondary
importande i n August t o two s p e c i e s ( u n i d e n t i f i e d sp. B and P e l o s c o l e x
sp. C ) t h a t were not recorded i n October. The nematodes had a mean
d e n s i t y of 783/m2 i n August, but were a b s e n t i n October. Phoronis
p a l l i d a was i n low abundance a t deeper l e v e l s i n October ( t o t a l mean
2 d e n s i t y of 48/m ), w h i l e i n August i t s mean d e n s i t y was n e a r l y s i x
t imes g r e a t e r (269/m2), w i t h g r e a t e s t numbers a t t h e 0.0 f t l e v e l .
Acteocina i n c u l t a remained t h e on ly abundant mol lusk , a l t h o u g h i t s
densities were much higher (mean of 1,992/m2) than at any other time.
This density value represents a 19-fold increase over April, and is
nearly ten times the mean October value of 209/m2. The crustaceans
recovered dramatically from the April assessment period, when only two
species were recorded in low densities. In August, 14 crustacean taxa
occurred only at Stations I and 11, with 4 exceptions. The amphipod
Mayerella acanthopoda had the highest densities (means of 5,141, 2,135,
and 9/m2 at Stations I, 11, and 111). The cumacean, Oxyurostylis
pacifica, was next in abundance, with mean densities of 1,379, 157,
and 0/m2 at Stations I, 11, and 111. In overview, the April and
August data on the crustaceans suggest the hypothesis that this
group is highly sensitive to stressful winter conditions.
The rainfall pattern between August 1978 and January 1979 was
more typical of a normal year (Fig. 2) than that preceding Lhe Janaary
1978 assessment. Similarly, the decline in numbers oi species and
total mean density that occurred by the January 1979 assessment period
was not as pronounced (Fig. 5). The total mean density of the fauna
decreased by about four fold from 41 ,310/m2 in August to 9, 823/m2 In
January 1979 (Appendix V). A large proportion of this decrease i s
attributable to the polychaetes, which declined substantiaLly and
represented a lower percentage of the total feunal density chat1 I n
August, ranging from 55% at Station I to 61% at SLatioii I T , The im-
pact of freshwater runoff on density decreases by the polychaetes was
especially evident at Station 111, where total mean density dropped
from 23,397/m2 in August to 1 ,726/m2 in January. The polychaetes at
Station 111 belonged to 6 species, and all were collected at the +2.5
ft level (Appendix V). However, the only abundant species at this
tidal level were the spionids Streblospio benedicti (2,000/m2) and
Polydora nuchalis (1,275/m2). Total mean density of the polychaetes
was greatest at Station I (10,986/m2), with Station I1 (3,959/m2)
being closer to Station I11 (1,726/m2). In terms of mean density,
Streblospio benedicti was the most abundant species (2 ,024/m2),
followed by Capitella capitata (1, 052/m2), Fabricia limnicola (972/m2),
Polydora nuchalis (538/m2), - P. socialis (339/m2), and - P. ligni
(134/m2). The last species declined substantially, since it was
the most abundant species (8 ,047/m2). in August 1978. Fabricia
limnicola was particularly noteworthy because it occurred in high
numbers at the f2.5 ft and 0.0 ft levels at Station I (9,225/m2
and 2, 350/m2, respectively), but infrequently elsewhere. This
distribution pattern reflects recruitment at these levels at Station I
and sparsely elsewhere, since - F. limnicola occurred only at Station I
at the +2 5 ft (5,500/m2) and 0.0 ft (538/m2) levels in August 1978
(Appendix IV). Polydora socialis and - P. ligni were also maximally
abundant at the +2.5 ft level at Station I (2,500/m2 and 1,150/m2,
respectively), while a third species of Polydora, - P. nuchalis showed
high densities at the +2.5 level at all three stations. The nematodes
increased by 3 fold over August 1978 to a mean density of 2,361/m2,
with an extraordinarily high density of 15,863/m2 being recorded
at the +2.5 ft level at Station 1, Among the oligochaetes, Peloscolex
sp. C declined slightly from a mean density of 395/m2 in August to
266/m2 in January, while Peloscolex sp. A increased from 138/m2 to
382/m2. As before, the only abundant mollusk was Acteocina inculta,
but it had declined from a mean density of 1,992/m2 in August to
804/m2 in January. The crustaceans declined sharply (as in January,
1978) and were r e p r e s e n t e d by o n l y f o u r t a x a t h a t occur red s p a r s e l y ,
a l though t h e h a r p a c t i c o i d copepods had a mean d e n s i t y of 47. 5/m2, b u t
DISCUSSION
The 21 s u b t i d a l s t a t i o n s occupied by Barnard and Re ish (1959) i n
t h e Upper Bay provided taxonomic and abundance d a t a which can be com-
pared w i t h t h e p r e s e n t r e s u l t s . Of t h e 1 9 s u b t i d a l gammarid t a x a ,
which provided a combined mean d e n s i t y of 643.4/m2, o n l y one of t h e s e
2 s p e c i e s (Corophium acherusicum) was recorded i n low numbers (2. l /m )
dur ing January 1978 from t h e s u b t i d a l samples of t h e p r e s e n t s tudy .
Barnard and Re ish r e p o r t e d 1 3 s p e c i e s of i n t e r t i d a l gammarids o f un-
known d e n s i t i e s from December 1953. Of t h e s e s p e c i e s , none were re -
corded i n t h e p r e s e n t s t u d y , which might be r e l a t e d t o t h e f a c t t h a t
t h e i n t e r t i d a l c o l l e c t i o n s of Barnard and R e i s h were made j u s t t o t h e
n o r t h of t h e P a c i f i c Coast Highway Br idge , in a n a r e a of r a p i d , t i d a l -
induced c u r r e n t s (Wehner, 1978) and, presumably, c o a r s e sediments . By
c o n t r a s t , t h e n e a r e s t s t a t i o n i n t h e p r e s e n t s t u d y ( S t a t i o n I) was
l o c a t e d on Shel lmaker I s l a n d (Fig. I ) , where t i d a l c u r r e n t s are l e s s
(Wehner, 1978) and f i n e r sediments most l i k e l y occur . I n J a n u a r y
1954, a t o t a l of 43 s u b t i d a l po lychae te t a x a were i d e n t i f i e d by
Barnard and Re ish from t h e Upper Bay, which c o n t r i b u t e d a t o t a l mean
d e n s i t y of 1,055.8/m2 (Table 4) . I n t h e p r e s e n t s t u d y , t h e s u b t i d a l
po lychae te t a x a numbered o n l y 1 2 i n January 1978, w i t h a t o t a l mean
2 d e n s i t y of 519.0/m , and numbered 1 6 i n January 1979, w i t h a t o t a l
mean d e n s i t y of 2,265.7/m2 (Table 4). Of t h e 43 po lychae te t a x a
TABLE 4. Comparisons of mean densities of polychaete species collected from the Upper Bay in January 1954 by Barnard and Reish (1959) with subtidal samples from the present study in January of 1978 and 1979.
Mean Density (No. /m2)
Species Jan 1954 Jan 1978 Jan 1979
Capitella capitata - 68.8 Cossura candida 3.7. 343.8 Exogone uniformis Fabricia limnicola Ha~loscolo~los eloneatus 147.3 Lumbrineris minima Marphysa sp. Mediomastus ambiseta Mediomastus californiensis Neanthes arenaceodentata Notomastus (C.) tenuis Polvdora l i d
V
Polydora nuchalis Polydora socialis Polydora websteri Polydora sp. Pseudopolydora paucibranchiata
Schistomerinnos rudol~hi Scolelepis acuta Streblospio benedicti Tharyx monilaris Tharyx parvus Other taxa (35)
Total
identified by Barnard and Reish, only 8 species were recorded from the
subtidal samples of January 1978 and January 1979. In the present
study, 6 taxa (in January 1978) and 11 taxa (in January 1979) were
present that were not identified by Barnard and Reish.
The decrease in species richness of gammarid and polychaete
taxa discussed above was pronounced between the January samplings
in 1954 and in the present study. The urbanization and development
of the region surrounding the Upper Bay and its watershed have re-
sulted in water quality conditions heavily influenced by man's
activities. Agricultural, industrial, and urban sources all contri-
bute (Scherfig, 1979) to an inflow of waters that enter the Upper
Bay year round. These inputs must certainly all be of a much greater
magnitude than in 1954, and could reasonably be expected to contribute
to a decline in water quality and to the observed reduction in species
richness.
One approach that has been used to characterize environmental
quality has been the definition of indicator species of polychaete
worms (Reish, 1959). Based on a study of Los Angeles and Long Beach
Harbors, Reish considered three species to be characteristic of
healthy bottoms, of which two were recorded from the Upper Bay by
Barnard and Reish (1959) and in the present study (Table 5). He
considered three species to be characteristic of semi-healthy bottoms,
of which only one (Pseudopolydora paucibranchiata) was present in the
Upper Bay in January of 1954 and in the present study. One species,
Capitella capitata, was considered to be indicative of unhealthy or
polluted bottoms (Table 5). Using Reish's (1959) criteria, one can
characterize the Upper Bay in January 1954 as moderately healthy to
healthy, while in 1977-1979 it would have to be considered unhealthy
or semi-healthy based on the high densities of - C. capitata and P. - paucibranchiata, especially in August 1978. Although its densities
declined in the winter, - C. capitata remained an important component
of the benthic community throughout the present study. By contrast,
C. capitata was not recorded from the Upper Bay in January 1954. - Data from the suhtidal stations in January 1954 and in the present
study for two of the species considered by Reish (1959) to he indica-
tive of a healthy benthos are most interesting. In January 1954,
Cossura candida was recorded in low densities in the Upper Bay,
while in the present study it occurred in moderate numbers in October
1977 and January 1978, but plummeted to low numbers in April 1978.
It did not recruit into the community by August 1978, and was not
recorded subtidally in January 1979. Tharyx parvus also appears to
he sensitive to reduced salinities and/or sedimentary influx
associated with winter periods, as it declined from moderate densities
in October 1977 to low numbers in January 1975, after which it was
not recorded subtidally.
Recently, the broad application of Capitella capitata as a
indicator of polluted waters has come under attack (reviewed by
Daugherty, 1978a). Reish (1979) has stated that indicator species
should not he used to define the degree of pollution in estuarine
areas where stresses on benthic communities associated with winter
periods of fresh water influx would favor the establishment of
opportunistic species. Capitella capitata, which has a short life
history and is capable of reproducing throughout the year, would he
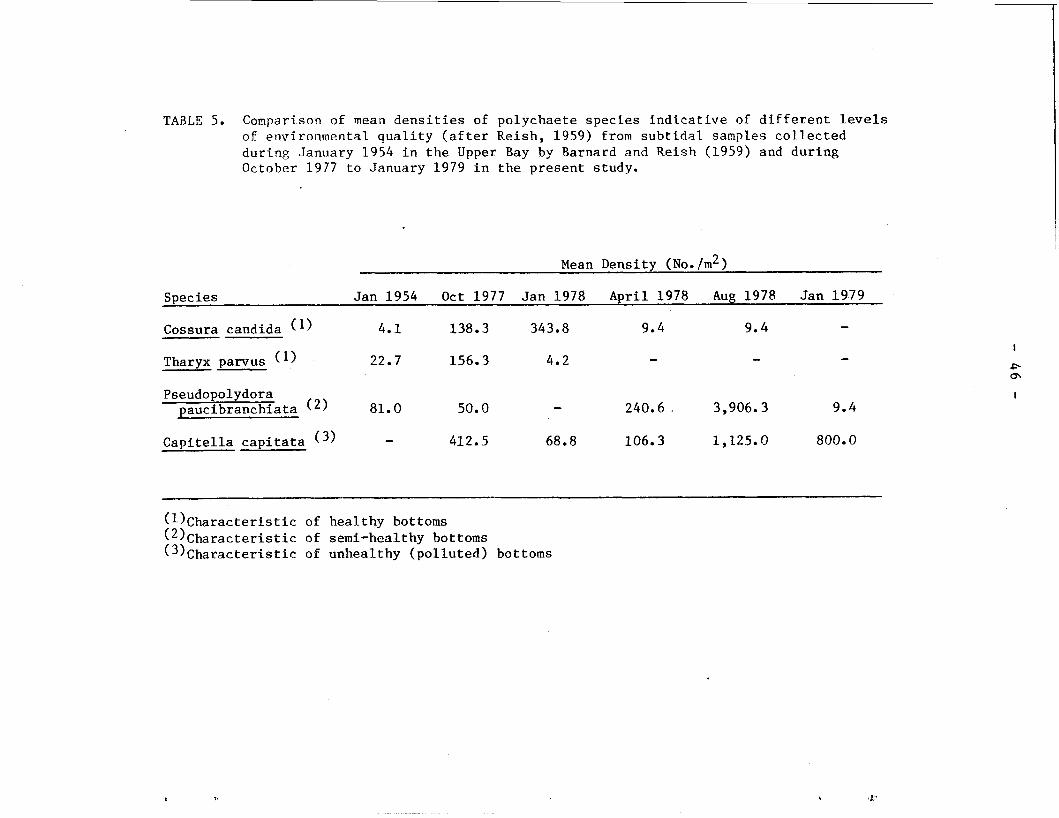
TAaLE 5. Comparison of mean densities of polychaete species indicative of different levels of environmental quality (after Reish, 1959) from subtidal samples collected during January 1954 in the Upper Bay by Barnard and Reish (1959) and during October 1977 to January 1979 in the present study.
Mean Density (No. /m2 )
Species Jan 1954 Oct 1977 Jan 1978 April 1978 Aug 1978 Jan 1979
Cossura candida (I) 4.1 138.3 343.8 9.4 9.4 - Tharyx parvus (I) 22.7 156.3 4.2 - - -
Pseudopolydora paucibranchiata (2) 81.0
Capitella capitata ( 3 ) - 412.5 68.8 106.3 1,225.0 800.0
(ll~haracteristic of healthy bottoms (2)~haracteristic of semi-healthy bottoms (3)~haracteristic of unhealthy (polluted) bottoms
expected to be an important community component in the estuarine
environment (Reish, 1979). The decline of Cossura candida and Tharyx
parvus, coupled with the persistence of C. capitata during the period -
of the present study conform with the analysis of Reish (1979).
Bottom samples collected by Daugherty (1978a) in the late summer
of 1975 and winter of 1976 from Newport Ray revealed substantial
seasonal decreases in abundance and diversity (Table 6). Seasonal
change was most dramatic at the Ski Zone station, where there were
sharp declines between September and.February in both the number of
taxa (from 57 to 14) and in total faunal density (from 24,313/m2 to
960/m2). By March-April, the number of taxa (28) and total density
(3,860/m2) increased, however. That this increase took place
during the month of March is peculiar. The Newport Bay area recelved
3.3 cm of rainfall this month, while the total rainfell from the
summer of 1975 to the end of February 1976 was only 6,7 cm (NOAA,
1975, 1976). If anything, one would have expected a further decline
over February values. Instead, 14 additional polychaete taxa appeared
between the samplings in February and March-April, and noteworthy
increases occurred in the mean densities of three species (Table 7);
Polydora ligni (from 33 to 1, 598/m2), Mayerella acanthopoda (from 0
to 280/m2), and Capitella capitata (from 47 to 2 4 0 / m 2 ) . Interestingly,
a similar pattern of winter decline, followed by a late winter in-
crease, is seen in the midchannel sample data from the Ski Zone
(Station ITID) in 1977-1978 (Table 6). Total density and number of
taxa were not nearly as high in October 1977 (3,391/m2 and 31 taxa)
as in September 1975 (24,313/m2 and 57 taxa), but there was still
a substantial. decrease (by 77%) in number of taxa and an 83% decline
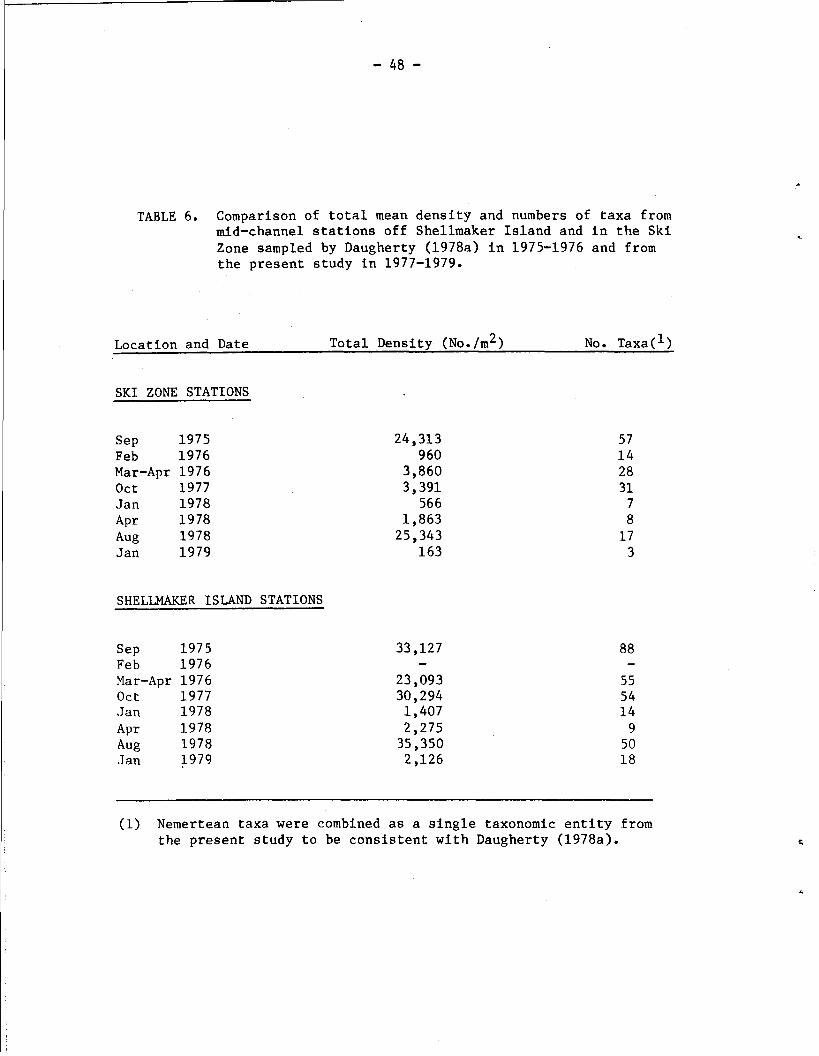
TABLE 6. Comparison of total mean density and numbers of taxa from mid-channel stations off Shellmaker Island and in the Ski Zone sampled by Daugherty (1978a) in 1975-1976 and from the present study in 1977-1979.
Location and Date Total Density (No. /m2) No. ~axa(l)
SKI ZONE STATIONS
S ~ P 1975 Feb 1976 Mar-Apr 1976 Oct 1977 .Jan 1978 A P ~ 1978 Aug 1978 Jan 1979
SHELLMAKER ISLAND STATIONS
S ~ P 1975 Feb 1976 Mar-Apr 1976 Oct 1977 Jan 1978 A P ~ 1978 Aug 1978 .Jan 1979
(1) Nemertean taxa were combined as a single taxonomic entity from the present study to be consistent with Daugherty (1978a).
in total density between October 1977 and January 1978. 'in' contrast
with the observed increase in number of taxa and density between
February and March-April in 1976 (Table 6),.the increase between
January and April of 1978 only represented an additi0n.d one taxon
and the establishment of one polychaete species (Polydora ligni at
1,463/m2), which was not recorded in the January sample (Table 7).
It is noteworthy that Capitella capitata, which had increased from 47
to 240/m2 between February and March-April 1976, declined from 250/m2
in January 1978 to 0/m2 in April 1978 (Table 7).
A comparison may also be made between the present August 1978
data and the September 1975 data of Daugherty (1978a) from the mid-
channel station in the Ski Zone (Table 6). Following the unusually
heavy rainfall of the 1977-1978 winter, the benthic community in April
1978 was depauperate, and was represented (if Polydora ligni is ex-
cluded) by a total density of only 375/m2 and 7 taxa. Community
recovery between April and August was characterized by a phenomenal
increase in total density to 25,343/m2; a value which is comparable
to the total density of 24,313/m2 recorded in ~eptember 1975. In
contrast with the September 1975 sampling, only 17 taxa were recorded
in August 1978 (Table 6), of which five polychaete species contributed
83% of the total density (Table 7). Four of these five species
(Scolelepis acuta, Streblospio benedicti, Polydora ligni, and
Capitella capitata) were also the numerical dominants in September
1975, comprising 78% of the total density. The major difference
between the two sampling periods, then, is the presence of a much
higher number of taxa in lower densities in September 1975 (Table 7).
This result could possihly be explained if there were a much lower
Table 7. Mean densities of selected species from midchannel samples in the Ski Zonc and off Shellmaker Island in 1975-1976 (Daugherty, 1978a) and 1977-1979 (this study).
Date Location and Mar- Species Sep 75 Feb 76 Apr 76 Ocy 77 Jan 78 Apr 78 Aug 78 Jan 79
SKI ZONE MIDCHANNEL STATION
Polychaeta: Capitella capitata 1,400 Euchone limnicola 53 Exogone lourei 220 ~abriciaxi'colp 6 Polydora ligni 4,180 Pseudopolydora paucibranchiata 0 Scolelepis acuta 8,993 Scoloplos acmeceps 0 Streblospio benedicti
Mollusca: Acteocina inculta 587 ~ r o t o t h a c a x n e a 0
acherusicum
acanthopoda Oxyurostylis pacif ica Rudilemboides stenopropodus
Phoronida: Phoronis pallida 193 0 7 2 5 0 0 188 25
SHELLMAKER ISLAND MIDCHANNEL STATION
Polychaeta:
paucibranchiata Scolelepis acuta Scoloplos acmeceps
Mollusca: Acteocina inculta Protothaca stamlnea
Arthropoda: Corophium acherusicum Leptochelia dubia Mayerella acanthopoda Oxyurostylis pacif ica
Rudilemboides stenopropodus
Phoronida: Phoronis pallida 0
rainfall in the winter period preceding the September 1975 sampling
and if a large-scale dieback of an existing diverse community did not
occur. The winter rainfall data for these two periods support this
scenario. During the 1974-1975 winter, a total of 32 cm of rainfall
was recorded (NOAA, 1974, 1975). This amount is somewhat above that
for a "normal" year (Fig. 2) when the winter rainfall totals 28 cm,
but is much lower than the total of 60.5 cm recorded for the winter
of 1977-1975. One final observation regarding the midchannel com-
munity in the Ski Zone is that the community characterized by low
species richness and high density which existed in August 1978 was
short lived. By January 1979, only 3 of the 17 taxa present in
August remained, and total density had dropped from 25 ,343/m2 to
163/m2 (Table 6). This decline can be correlated with an early
winter total of 18.8 cm that preceded the January sampling date.
The midchannel community off Shellmaker Island was shown by
Daugherty (1978a) to have a higher number of taxa and total density
than the Ski Zone Station (Table 6). This result agrees with data
from these two stations on all sampling dates in the present study
(Table 6). Declines in species richness (by 38%) and total density
(by 30%) between September 1975 and March-April 1976 were less pro-
nounced than at the Ski Zone Station. The differences discussed above
in winter rainfall between 1975-1976 and 1977-1978 are reflected in
the greater decreases in number of taxa (by 83%) and total density
(93%) between October 1977 and April 1978. The curious increase in
total density between January and April 1978 noted above in the Ski
Zone also occurred at the Shellmaker Island station. This increase
was also largely attributable to the polychaete Polydora ligni
(Table 7), which had densities of 0/rn2 in January and 1,525/m2 in
April. The Shellmaker Island station recovered dramatically by
August 1978 to a total density of 35,350/m2, contributed by 50 taxa.
Community structure at this station was similar to that at the Ski
Zone in August 1978, in that a high percentage of the total density
(68%) was contributed by only five species (Table 7). As in 1977-1978,
the community declined sharply by January 1979, although species rich-
ness did not decrease as drastically. Four of the five most abundant
species in August (Euchone limnicola, Leptochelia dubia, Mayerella
acanthopoda and Pseudopolydora paucibranchiata) were gone completely
in January. This result mirrors the disappearance of the five most
abundant species in the Ski Zone by January, as discussed above. It
is noteworthy that Fabricia limnicola, which was by far the most
abundant species in October 1977 at the midchannel station off Shell-
maker Island, was never recorded from that station after that date
(Table 7).
The seasonal declines in abundance and species richness recorded
in the present study and by Daugherty (1978a) have been correlated
above with differences in rainfall patterns between 1974 and 1979,
and, by inference, with the hypothetical yearly differences in the
degree and duration of salinity reduction. Sediment deposition surely
is also important, but has not been quantified. Further, biotic
factors have been essentially ignored in this discussion, as we have
no data to indicate their magnitudes. The impact of predation on the
benthic community must be a very important factor which varies both
seasonally and annually. A variety of fishes feed on the benthos in
the Upper Bay, and their predatory impact varies in magnitude as the
composition and abundance of the fish community changes (M. Horn,
personal communication). The role of shorebird predation on the inter-
tidal benthic community has been shown by M. Quammen (cited by Couffer
and Couffer, 1978) to be strongly seasonal and significant. Migratory
shorebirds usually arrive in the Upper Bay by October and feed
actively on the intertidal flats until about June. Using exclosure
cages, Quammen found that by late winter, shorebird feeding accounted
for a reduction in polychaete densities by about 50%. Spring recruit-
ment by the polychaetes, however, mote than made up for these winter I <
losses, and she recorded high polychaete densities both inside and
outside the exclosure cages by June.
SUMMARY
1. The benthic community at intertidal (+2.5 ft and MLLW) and sub-
tidal (-2.5 ft and midchannel) depths was sampled at three stations
(at Shellmaker Island, Big Canyon, and the'Ski Zone) in the Upper
Newport Bay during five assessment periods between October 1977 and
January 1979.
2 . Fresh water flow into the Upper Ray occurs year-round, and
results in reduced salinities, as evidenced by the depressed surface
salinities recorded in October '1377 And August 1978. During the
winter periods, salinities were further reduced, especially during the
winter season of 1977-1978, whfch was characterized by extremely high
rainfall during January to March 1978 and by low salinities, which
were documented during the late January and early April assessments.
3. Water temperatures in the Upper Bay were highest during the late
summer assessments (October 1977 and August 1978) and lowest during
the January 1978 and 1979 assessments, with thermal stratification
only occurring in August 1978.
4. Sediment transport and deposition in the Upper Bay was consider-
aSle during the 1977-1978 winter, particularly in the Ski Zone where
an estimated 3 ft of sediments aqcvmulated in the midchannel region
that raised the bottom depth from -2.5 Et to +0.5 ft. During the
course of the study, the mean grain size of the sediments changed from
fine and very fins sands in January 1978 to sifts by August 1978.
This temporal change was reflected in the increase in representation
by the silt-clay fraction from a mean of 19.3% in January 1978 to
81.1% in January 1979.
5. Organic carbon content of the sediments averaged 0.93% in October
1977 and 0.98% tn January 1978, with the highest values (to 1.70%)
occurring in the Ski Zone in October and the lowest values (0.24 and
0.26%) being obtained at f2.5 ft and MLLW at Shellmaker Island in
October.
6. Total density of the benthic community was highest at Shellmaker
Island and lowest qt the Ski Z ~ n e during each assessment period.
Lowest seasonal densities were recorded during the January and April
1978 assessments. These winter declines in total density were most
pronounced in the Ski Zgne. Heavy recruitment after April 1978 re-
sulted in total densities during August 1978 that were considerably
higher than in October 1977.
7. Total numbers of species (species richness) was highest (with one
exception) at Shellmaker Island and lowest at the Ski Zone during each
assessment. This relationship also held true for species diversity
(HI) after January 1978. During October 1977 and January 1978 species
evenness at Shellmaker Island was lower than at the other two sites,
resulting in lowered diversity ( H ' ) values. Species richness was
highest at each site in October 1977 and dropped off dramatically to
seasonal low values in April 1978. Both richness and species diver-
sity recovered substantially by August 1978, followed by a moderate
decline by January 1979.
8. Cluster analyses were used to reveal patterns of community struc-
ture. In October 1977 both horizontal and vertical groupings by
stations and depths were determined, with the Shellmaker Island and
Big Canyon stations being linked at midchannel depths and at +2.5 ft,
while the Rig Canyon and Ski Zone stations were linked at midchannel
and -2.5 ft depths. By January, the Ski Zone station was isolated
from the other stations except at midchannel, at which depth all three
stations were linked. The midchannel and -2.5 ft depths at Big Canyon
and Shellmaker Island were linked horizontally, as were the intertidal
levels, excepting +2.5 ft at Shellmaker Island. Further isolation of
the intertidal levels at the Ski Zone was not seen in April, however,
as horizontal linkages occurred between the depth levels at the three
stations, suggesting strong vertical separations resulting from veri-
cal differences in the impact of the fresh water influx into the Upper
Bay. By August, a pattern basically like that of October 1977 was
observed.
9. Cluster analysis using all stations and depths for all five assess-
ment periods revealed the unique character of samples from April when
the community exhibited very low total densities and species richness,
and August, when a new community had developed that was characterized
by high total densities and altered species dominances. The January
assessments exhibited fairly strong integrity, while the October samp-
ling showed the weakest identity as a distinctive assessment period.
10. The most numerically-important taxonomic group during each of
the assessments was the polychaete worms. In October 1977 highest
polychaete densities were determined for Fabricia limnicola,
Streblospio benedicti, and Capitella capitata. These same three
species also were most abundant in January 1978, although in much
reduced numbers. Further declines had occurred by April with - F.
limnicola almost disappearing completely, and with Polydora ligni
becoming the numerical dominant. By August the sample dominance
had changed markedly from October 1977, with - P. ligni, - C. capitata,
Pseudopolydora paucibranchiata, 2. benedicti, and Scolelepis acuta
being most abundant. The crustaceans, which occurred only sparsely
in January and April, recovered strongly by August with high abun-
dances of Mayerella acanthopoda and Oxyurostylis pacifica being
recorded at Shellmaker Island and Big Canyon. In January 1979,
dominance patterns shifted as total densities dropped off sharply,
with the most abundant species being - S. benedicti, - C. capitata, - F.
limnicola (in high numbers only in the intertidal zone at Shellmaker
Island), Polydora nuchalis, Polydora socialis, and P. - - ligni. As in
January 1978, the crustaceans declined sharply.
LITE'UTURE CITED
Barnard, J. L., and D. J. Reish. 1959. Ecology of Amphipoda and
Polychaeta of Newport Bay, California. Allan Hancock Foundation
Publ., Occ. Paper No. 21. 106p.
Clifford, H. T., and W. Stephenson. 1975. An introduction to numeri-
cal classification. Academic Press, New York. 229p.
Couffer, J., and M. Couffer. 1978. Saltmarsh summer. Putnam's
Sons, New York.
Daugherty, S. J. 1978a. Benthic ecology, p. 129-192. - In: Orange
County Human Services Agency, Water Quality Control Section.
Environmnental Studies in Newport Bay. Env. Health Div.
Rept., June 1978.
. 1978b. Annotated bibliography, p. 193-215. - In: Orange
County Human Services Agency, Water Quality Control Section.
Environmental studies in Newport Bay. Env. Health Div. Rept.,
June 1978.
Emery, K. O., 1938. A rapid method for the mechanical analysis of
sands. J. Sediment. Petrol. 8:105-111.
Frey, H. W., R. F. Hein, and J. L. Spruill. 1970. Report on the
natural resources of Upper Newport Bay and recommendations
concerning the bay's development. Calif. Dept. Fish and Game,
Coastal Wetland Ser. No. 1. 68 p.
Inman, D. L. 1952. Measures for describing the size distribution
of sediments. J. Sediment. Petrol. 22:125-145.
Kolpack, R. L., and S. A. Bell. 1968. Gasometric determination of
carbon in sediments by hydroxide absorber. J. Sediment.
Petrol. 38:617-620.
MacGinitie, G. E. 1939. Some effects of freshwater on the fauna of
a marine harbor, Amer. Midl. Nat. 21:681-686.
NOAA. 1974-1979. Climatological data. California. Environmental
Data and Information Service, National Oceanic and Atmospheric
Administration, TJ. S. Dept. Commerce. Vols. 78-83.
Pielou, E. C. 1969. An introduction.to mathematical ecology. Wiley-
Interscience, New York. 286 p.
Rohlf, F. J., and R. R. Sokal. 1969. Statistical Tables. Freeman
and Co., San Francisco. 253 p.
Scherfig, J. 1979. First annual report on Task 2-3 to the Newport
Irvine Wastewater Management Agency. Univ. Calif. Irvine
Water Resources Lab. 165 p.
Seapy, R. R., and C. L. Kitting. 1978. Spatial structure of an
intertidal assemblage on a s-heltered sandy beach. Mar. Biol.
46:137-145.
Shannon, C. E., and W. Weaver. 1962. The mathematical theory of
communication. Univ. Illinois Press, Urbana. 117p.
Wehner, M. P. 1978. Hydraulics, p. 7-19. - In: Orange County Human
Services Agency, Water Quality Control Section. Environmental
Studies in Newport Bay. Env. Health Div. Rept., June 1978.
Anpendla I. Densi t ies (numbers per square meter) of inver tebra tes from samples col lec ted from t h e Upper Newport Bay i n October 1977. Beneath each mean dens i ty value, the d e n s i t i e s f o r t h e two r e p l i c a t e s are given i n parenthes is .
-- Sta t ion
Species I A IB IC ID IIA IIB IIC IID IIIA IIIB IITC IIlU
0 POLKCHAETA
Armandl 3 b i u w l e t a -- 25 (5010)
Boccardia proboscidea -- 50 (OllOO)
Capi te l la c a p i t a t a 450 837.5 125 7800 575 675 925 312.5 437.5 312.5 437.5 (6001 (15001 (1501 (18001 (2001 (8501 (13251 (3001 (3751 (3251 (751800) 300) 175) 100) 13800 950) 500) 525) 325) 500) 300)
Cossura candid. -- 187.5 67.5 37.5 87.5 387.5 12.5 75 (975 (75/50) (0175) (100175) (4501325) (2510) (251125) GOO(
Domil lea s t l a n t i c a -- -
Evchone l i m i c o l a --
Eumida b i f o l i a t a -- 12.5 150 67.5 12.5 25 167.5 (0125) (2001 (75150) (0125) (25125) (1501
100) 175)
Emgone uniformta
sp .
Exogonella sp. --
Fabr ic ia l i m i c o l a -- 1175 39687.5 637.5 25262.5 6312.5 37.5 37.5 15612.5 25 (16001 (73,0001 (4751 (24,2501 (42751 (50125) (7510) (16.2001 (5010) 750) 6375) 800) 26,275) 8350) 15,025)
Haploscoloplos alongatus
Harmothoe lunula ta --
Lumbrineris minima --
Marphysa sanguinea 12.5 12.5 (0125) (0125)
&diornaatus acutus -- 12.5 50 (0125) (01100)
Hediornastus ambineta 187.5 63.5 50 12.5 112.5 137.5 (300175) (12510) (25175) (0125) (751150) (200175
llediomsstus c a l i f a r n i e n s i s 162.5 225 462.5 25 75 112.5 (300125) (375175) (5251 (0150) (100150) (1251
400) 100)
Neanthes arenaceodentata 12.5 2250 37.5 25 (2510) (35001 (7510) (5010) (Bfi:) t22970)
1000)
P i s t a a l t e -- 12.5 50 (0125) (25175)
Polydora 187.5 900 12.5 50 225 187.5 87.5 250 (1251 (14001 (2510) (50150) (55010) (751300) (751100) (751425) 250) 400)
Appendix I (continued) S t a t i o n
Species IA IB IC ID IIA IIB ' IIC IID IIIA IIIB IIIC IIID
Polydora nuchalia 300 200 12.5 87.5 2125 (4251 (01400) (2510) (100175) (22501
175) 2000)
Polydora webs ter i 12.5 (2510)
Polydora sp. 100 112.5 (01200) (751150)
Polyophthalmus pictlla 75 (100150)
Pseudamalacoceros s p . A 200 37.5 50 (01400) (7510) (75125)
Paeudomalacoceros sp. B 12.5 (2510)
Pseudapalydora paucibran- 150 25 chia ta (2001100) (0150) -
Prionospio c i r r i f e r a
Prionospio heterobranchia 25 25 12.5 newportensis (0150) (0150) (2510)
Rhynchospio arenincola 25 (25125)
Sabel l idae sp . A 12.5 (0!25)
Schistamerinpos rudulphi 12.5 (2510)
S t reblospio benedic t i 8225 475 225 A275 (144001 (900150) (375175) (14001 2050) 1150)
Terebel l idae sp .
Tharyx monilaris 12.5 (0125)
Tharyx parvus
175)
Tharyx s p .
Typosyl l i s a c i c u l a t a 37.5 (0175:
OLIGOCHAETA
Peloscolex sp. A 300 V C C 37.5 6 . ?75( 1200 $00 4862.5 50 500 800 (4001 (400010) (7510) (501 (2001 (3501 (14251 (25501 (0/100) 200)
(1501 (15751 275) 5300) 2050) 375) 7175) 850) 25)
Peloscolex s p . B
Unid. up. A 125 337.5 2462.5 (01250) (01675) (45001
425)
NEMEBTINA
Unid sp. A
Appendix I (continued)
-61-
Sta t ion
Species
-- -
U I 8 IC ID IIA IIB .IIC IID IIIA I I I B IIIC IIID
M i d . sp . B 25 25 12.5 37.5 (5010) (5010) (2510) (50125)
Unid. up. E
Unid. mu. P
TURllELLARlA
Unid. 'spp.
CNIDARIA: HYDEUZOA
Corymrpha palla 0.5 (011)
MIDARIA: ANTHOZM
- - Halcampa d e c e m t e n c -
a c u l a t a
A c t i n i a r i a s p . B
SIPUNCULIDA
Unid . s p . A
ECHINODERYATA: HOLOTRUBOIDEA
L e p t o s y n a p t a a l b i c a n s
U n i d . s p . A
Unid . s p . B
Unid . Apoda # p .
ECHINODERYATA: OPHIDROIDBA
Amphipho& s q u a n # r a
PHORONIDA
P h o r o n i s p a l l i d .
Caecum c a l i f o r n i c u
MLLUSCA: BIVALVIA
Adula diepensis - 3.5 (710)
Chime c a l i f o r n i e n s i s 10.5 (2110)
-62- t,ppendix I (continued)
S t a t i o n
Species I A IB IC ID IIA IIB IIC TI3 IIIA I IB I I l C IT L!
Chione f l u c t i f r a g a
Cryptomya c a l i f o r n i c a 3.5 (710)
Laevicardium sub- .. . -. ... . - .- s*- --
Macoma nasuta -- -
Mytilus e d u l i s
Protothaca staminea
Solen rosaceus --
Tagelus ca1ifornianu.e
Tagelus subteres
spil .(juv.)
Theora lubrlca 7 38.5 -- 3.5 (TI-) (49198) (017)
CRUSTACEA: ISOPODA
Dyaamnelie s h e a r e r i 12.5 37.5 12.5 (0125) (50125) (2510)
Dynsmenella sp . 12.5 75 12.5 12.5
(5010) (01150) (0125) (0125)
Sphaeromatidae sp. 12.5 (2510)
CRUSTACEA: TANAIDACEA
Leptochelia 25 25 12.5 62.5 (5010) (5010) (2510) (01125)
CRUSTACEA: UKSIDACEA
Unid. sp . 25 (0150)
CRUSTACEA: ANOMlRA
Callianasaa c s l i f a r n i e n s i s 7 35 (717) (28142)
CRUSTACEA: BRACHYURA
Hemigrapsus oregonensis 25 12.5 (0150) (0125)
Mysis la rva
CRUSTACEA: AMPHIPODA
Actminode utopus h e t e r u e -
Ampithae pollex 12.5 (2510)
Ampithoe sp . 12.5 (2510)
Caprella r q u i l i b r a
Corophium acherusicum
Corophium bacani
Corophium sp .
Mayerella ardnthopoda 12.5 (2510)
Microdeutopus s c h m i t t i
Appendix I (continued) Stat ion
Species 1.4 IB IC ID IIA IIB IIC IID 111.4 IIIB IIIC IIID
Monoculodes sp.
Pontogeneia sp.
Rudilemboides s teopropodus
T r i t e l l s p i l i -a
T r i t e l l a sp .
Unid. a p . A
PYCNOGONIDA
Anaplodactylus
CRUSTACEA: WlPEPOM
Calanaida spp.
Harpscticoida spp.
CRUSTACEA: CIM\CEA
Cumella sp .
Appendix 11. Dens i t ies (numbers per square meter) of i n v e r t e b r a t e s from samples co l lec ted from the Upper Newport Bay i n January 1978. Beneath each mean dens i ty va lue , the d e n s i t i e s of t h e two r e p l i c a t e s are given' i n parenthes is .
S t a t i o n
Species IA IB IC ID IIA I IB I IC IID I I IA I I I B I I I C I I ID
POLYCHAETA
C a p i t e l l a c a p i t a t a
Cossura candid= --
Exosone l o u r e i
Fabr ic ia l i m i c o l a --
Haplos~oloploS e longatus
Lumbrineris minima --
Marphysa sp .
Mediomastus ambiseta --
Hediomastus ca l i forn ienl l i s 12.5 87.5 50 (0125) (501125) (01100)
Neanthes a renaceodenta ta 25 12.5 (25125) (0125)
Notomastus (C.) t enuis 362.5 50 12.5 (1501 (01100) (2510) 575
Polydora 87.5 (100175)
Polydora nuchalis 387.5 (4001 375)
Polydara s o c i a l i s 200 (01400)
Polydora webs t e r i 275 (751475)
Pqlydora sp . 25 (0150)
Prionaspio he terobranchia 25 oevpar t e n s i s (0150)
Scole lepis acuca 12.5 (0125)
S t reblospio benedicc i 1962.5 150 37.5 200 50 25 25 (20251 (30010) (50125) (01400) (25175) (25125) (5010) 1900)
Tharyx parvus 25 12.5 12.5 (0150) (0125) (0125)
OLIGOCHAETA
Peloscolex sp. A 25 225 187.5 125 137.5 225 50 112.5 50 37.5 125 (25125) (3001 (1751 (1501 (501225) (3251 (50150) (501175) (75125) (25150) (1001
150) 200) 100) 125: 150)
Peloscolex sp. B 137.5 800 162.5 75 121 375 162.5 LC0 37.5 12.5 37.5 (251250) (14501 (250175) (100150) (01250) (4501 (1251 (251175) (50125) (0125) (7510)
150) 300) 200)
Pe losca lex sp . C 37.5 (0175)
Unid. s p . A 125 (1001 150)
NEMERTINA
Unid. Sp. A
Unid. s p . B
Appendix I1 (continued) Stat ion
Species I A IB IC ID IIA IIB ' IIC LID IIIA IIIB IIIC IIID
NWArnM
Unid. spp.
PHORONIM
Phoronia
A8uidnea c a l i f o r n i c a -- C..rlthidea - c a l i f o r n i c a
c a l i f o r n i m w
Tagelus subteres
2w.& .PP. (jw.)
CWSTACEA: COPEPOM
Calanoida sp .
Cyclopaida up.
CWSTACEA: C W C U
Oxyurostylis pac i f ic .
CRUSTACEA: MWIPOM
Corophiun achcruaicrp
T r i t e l l a ~ i l i u n ~
CRUSTACEA: BIUaiYLW
Hedgravaw ore8onensis
qppendi~ 111. ~ e n s i t i e s (numbers per square meter) of inver tebra tes from samples col lec ted from t h e Upper llewport Bay i n ~ ~ r i l 1978. ~ e n e a t h each mean densi ty value, the d e n s i t i e s of the two r e p l i c a t e s are given i n parenthes is .
S ta t ion
-- Species IA IB IC ID IIA IIB IIC IID IIIA 1 1 IIID
POLYCHAETA
Boccardia probascidea - 25 (0150)
Boccardia uncata -- 12.5 (2510)
Capi te l la c a p i t a t a 2437.5 50 175 100 175 (38001 (01100) (325125) (1001 (1751 1075) 100) 175)
Fabr ic ia l i tmicola -- 12.5 (0125)
Marphysa sp . 12.5 (0125)
Polydora
Polydora nuchal is 1650 (12501 2050)
Polvdora sp . 262.5 12.5 (1001425) (0125)
Pseudopolydora paucibranchiata
sJ& sp.
S t reblospio benedic t i 6437.5 50 (95001 (01100) 3375)
Peloscolex sp . A 50 61.5 12.5 37.5 25 12.5 100 62.5 112.5 (75125) (75150) (0125) (2510) (5010) (2510) (751125) (01125) (1001125)
Peloscolex sp . B 62.5 50 (50175) (75125)
Peloscolex sp . C 50 12.5 25 62.5 75 50 12.5 (25171) (2516) ~0150) (50175) (100150) (10010) (2510)
Unid. sp. A 25 75 25 75 75 12.5 12.5 125 125 (0150) (251125) (5010) (100150) (100150) (0125) (2510) (751175) (1251125)
Unid. sp. B
NEMERTINA
Unid. sp. B
PHORONIDA
HOUUSCA: GASTROPODA
Acteocina i n c u l t a --
A s a i d n e a c a l i f o r n i c a
Nudibranchia sp. A
Appendix 111 (continued) Station
Species I A IB IC ID IIA IIB IIC IID IIIA IIIB IIID
WLLUSCA: BIVALVIA
Cooperella subdiaphsna
Protothaca stadnea 7 -- (717)
Tagelus subteres 31.5 (7156)
Tsgelus ap. (juv.) 49 (70128)
CRUSTACEA: COPEPODA
Calanoida spu.
CRUSTACEA: AWHIPODA
Coro~hium acherusicum -- - .-
Appendix I V . Densities (numbers per square meter) of inver tebra tes from samples col lec ted from the Upper Newport B a y i n August 1978. Beneath each mean densi ty value, t h e d e n s i t i e s of t h e two r e p l i c a t e s are given i n parenthes is .
S ta t ion
Species I A I 0 I C I D I I A I I B I I C I I D I I I A I I I B I I I D
POLYCHAETA
Boccardia proboscidea 250 (2501 250)
Capi te l la c a p i t a t a 16.125 11,175 2712.5 (16,4001 (10,1251 (9001 15,850) 12.2?5) 4525)
Eumida b i f o l i a t a --
Glycera americana 12.5 (2510)
Haplascoloplos elongatus 25 37.5 (0150) (25150)
Harmthoe lunula ta -- 25 (5010)
Marphysa sanguinea
Marphysa sp. 25 150 50 (0150) (751225) (75125)
Mediomastua acutus --
Mediomastus c e l i f o m i e n s i s 12.5 (2510)
P i s t a a l t a -- 12.5 (0125)
Polydora
Polydora nuchalis 875 137.5 187.5 (9001 (225150) (1751 850) 200)
Appendix IV ( c o n t i n u e d ) S t a t z o n
S p e c i e s IA IB IC ID I I A I I B I I C I ID I I I A 1110 I I I D
Po lydora s o c i a l i s 2950 1412.5 50 12.5 37.5 187.5 1100 1 2 . 5
(12001 (12001 (75125) (2510) (50125) (2001 (2512175) (2510) 4700) 1625) 175)
Pseudopolydora 24 ,325 6712.5 9087.5 2712.5 11 ,500 9275 3787.5 37.5 525 1575 pauc ib ranch ia t a_ (60001 (54751 (61751 (39251 (13,6001 (73001 (32751 (7510) (5501 (7501
42 ,650) 7950) 12 ,000) 1500) 9400) 11 ,250) 4300) 500) 2400)
P r i o n o s p i o c i r r i f e r a 25 12.5 25 12.5 (5010) (2510) (25125) (2510)
P r i o n a s p i o h e t e r o b r a n c h i a 37 .5 37 .5 50 newpor tens i s (50125) (25150) (75125)
Rhynchospio a r e n i n c o l a 137 .5 67.5 225 12 .5 12.5 (01275) (75150) (3001 (0125) (2510)
150)
Sch i s tomer ingos 12 .5 25 12.5 r u d u l p h i (2510) (25123) (2510)
S c o l e l e p i s e t a 312.5 375 1712.5 662 .5 2350 3125 2800 1803 1812.5 2475 (1501 (5001 (7001 (9251 (17001 (37751 (31001 (5591 (14001 (7751
475) 250) 2725) 400) 650) 2475) 2500) 3050) 2225) 4175)
S c o l o p l o s acmeceps 12.5 12 .5 37.5 (0125 , (0125) (7510)
S c o l o p l o s nr. acmeceps 12.5 (2510)
Sp iophanes m i s s i o n e n s i s 25 62.5 (0150) (12510)
S t h e n e l a n e l l a u n i f o n n i s 12.5 (0125)
T h a r y r m o n i l a r i s 12 .5 (2510)
OLIGOCHAETA
P e l o s c o l e x s p . A 125 412.5 237.5 875 (25010) (82510) (251450) (175010)
P e l o s c o l e x sp . B
P e l o s c o l e x ap . C
Unid. s p . B
Unid. s p . C
NEMERTINA
Unid. s p . A
Unid. sp . B
Unid. s p . C
R , i d . s p . E
Unid. s p . P
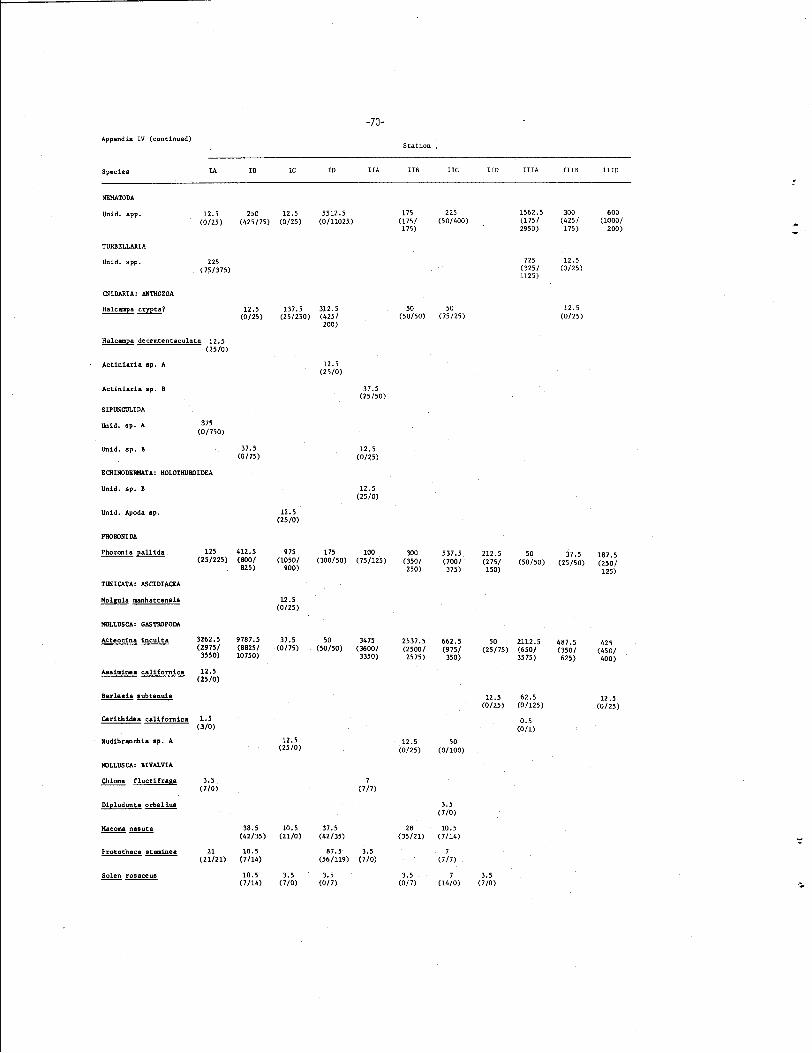
Appendtx IV (continued) Sta t ion
Species I A IB IC ID IIA IIB IIC IID 1 I I I B I I ID
Unid. spp. 12.5 250 12.5 5512.5 175 225 1562.5 300 600 (0125) (425175) (0125) (0/11025) (1751 (501400) (1751 (4251 (10001
175) 2950) 175) 200)
Unid. spp. 2 25 (751375)
(NIDARIA: ANTHOZOA
Halcampa -1
Act in iar ia ap. A
Act in lar ia sp . B
SIPVNCULIDA
Unid. ep. A 375 (017501
Vnid. sp . B 37.5 (0175)
EMINODERHATA: HOLOTWROIDEA
Unid. sp. B
Unid. Apoda up.
PHORONIM
Phoronis pallida 125 412.5 975 175 100 300 537.5 212.5 50 37.5 187.5 (251225) (8001 (10501 (300150) (751125) (3501 (7001 (2751 (50150) (25150) (2501
825) 900) 250) 375) 150) 1251
TUNIUTA: ASCIDIACEA
Holgula manhattenria
Diplodonta orbel lua
Macoma nasuta -- 38.5 10.5 37.5 28 10.5 (42135) (2110) (42135) (35121) (7114)
Protothaca staminea 21 10.5 87.5 3.5 7 -- (21121) (7114) (561119) (710) (717)
Solen rosaceus -- 10.5 3.5 3.5 3.5 7 3.5 (7114) (710) (017) (017) (1410) (710)
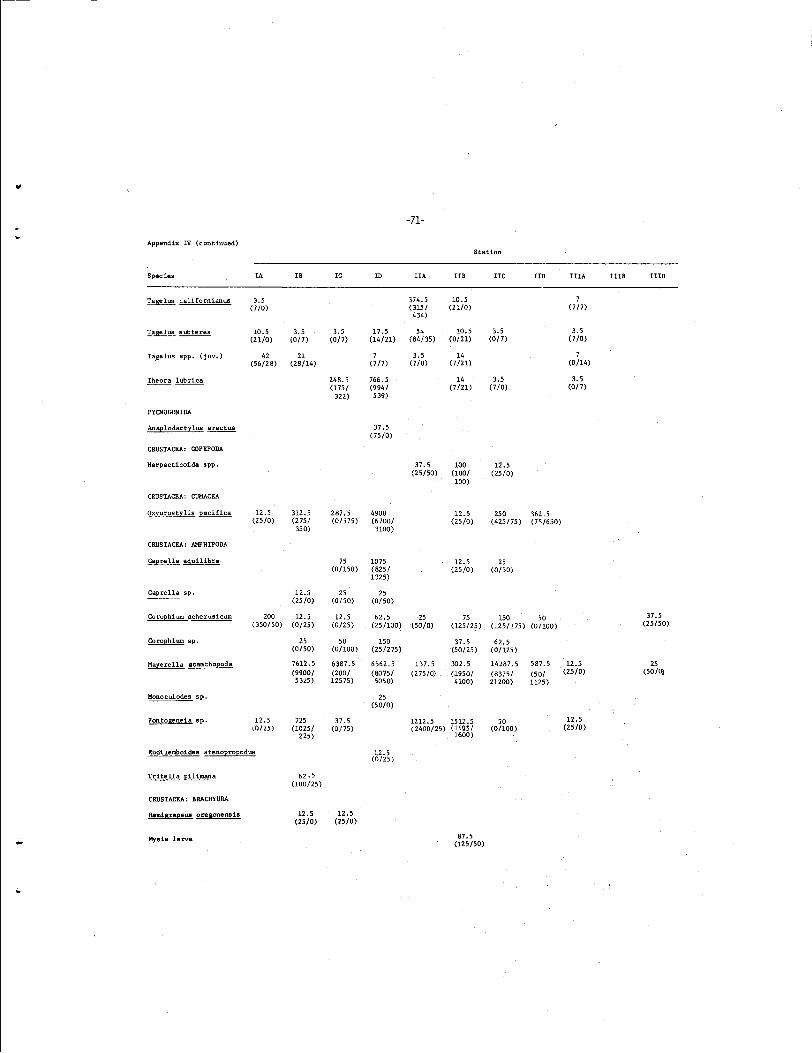
Appendix IV (continued) S t a t i o n
Species IA IB IC m IIA IIB IIC 11n IIIA IIIB IIID
Tagelus ca l i fornianus 3.5 374.5 10.5 7 (710) (3151 (2110) (717)
434)
Tagelus subteres 10.5 3.5 3.5 17.5 54 10.5 3.5 3.5 (2110) (017) (017) (14121) (84/35) (0121) (017) (710)
Tagelusspp. ( juv. ) 42 21 7 3.5 14 7 (56128) (28114) (717) (7/0) (7121) (0114)
Theora l u b r i c a --
CRUSTACEA: COPEPODA
Harpacticoida spp.
CRUSTACEA: CUWACEA
Oxyurostylis p a c i f i c a 12.5 312.5 287.5 4900 12.5 250 3 6 2 5 (2510) (275/ (01575) (67001 (2510) (425175) (751650)
350) 3100)
CRUSTACEA: AMPHIPODA
Caprella e q u i l i b r s 75 1075 12.5 25 (01150) (8251 (2510) (0150)
1325)
Caprella sp . 12.5 25 25 (2510) (0150) (0150)
Corophium acherusicum 200 12.5 12.5 62.5 25 75 150 50 (350/50) (0125) (0125) (251100) (5010) (125125) (1251175) (0/100)
Coraphium sp . 25 50 150 37.5 62.5 (0150) (01100) (251275) (50125) (01125)
Mayerella aoanthopoda
Monoculodes s p . 25 (5010)
Pmtopeneia ep . 12.5 725 37.5 1212.5 1512.5 50 12.5 (0125) (10251 (0175) (2400125) (14Q51 (01100) (2510)
225) 1600)
T r i t e l l a pilimana 62.5 (100125)
CRUSTACEA: BPACHYURA
Hemigrapstm a r e ~ m e n s i s 12.5 12.5 (2510) (2510)
Mysill l a r v a
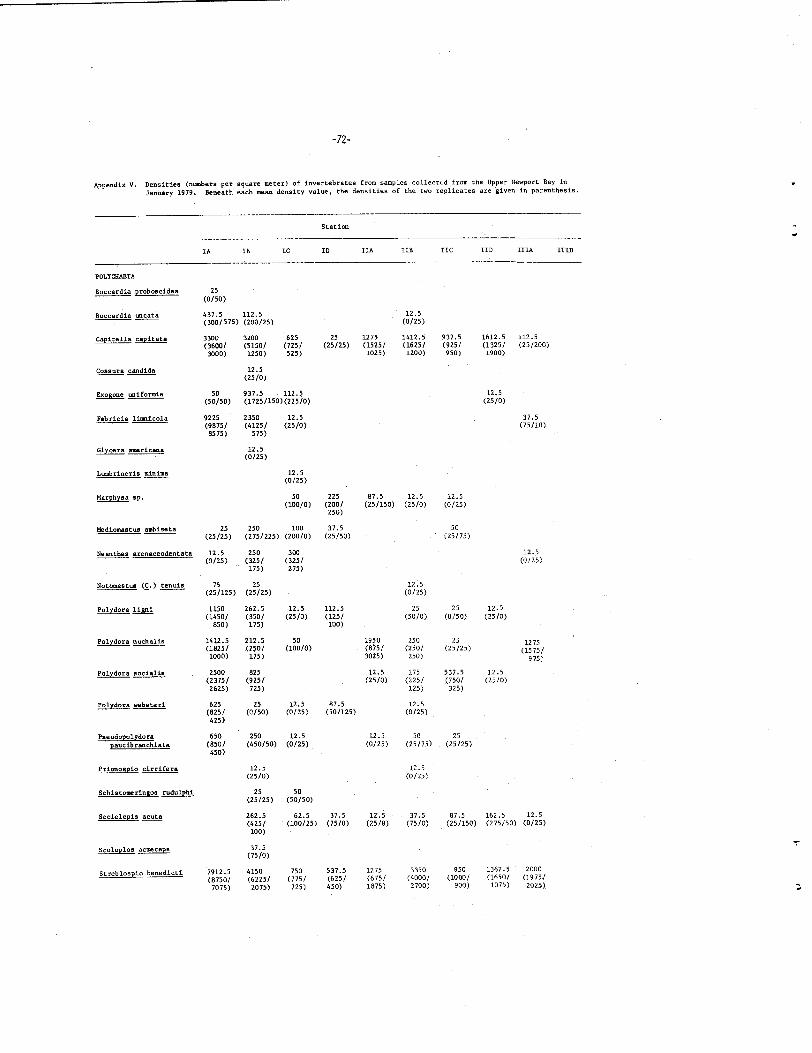
Appendix V. Densities (numbers per square meter) of inver tebra tes from samples c a l l e c t ~ d from the Upper Newport Bay i n January 1979. Beneath each mean dens i ty value, the d e n s i t i e s of t h e two r e p l i c a t e s a r e given i n parenthes is .
S ta t ion
1A lB IC ID IIA I IIC IID IIIA I I ID
Boccardia proboscidea
Boccardia uncata -- Capi te l la c a p i t a t a
Cossura candida --
ExoBone uniformis
Pabr ic ia l i m i c o l a --
Glycera americena
Lumbrineris minima --
Marphysa sp .
Medimastus ambiseta -- 25 250 100 37.5 50 (25125) (2751225) (20010) (25150) (25175)
Neanthes arenaceodentata 12.5 250 3W 12.5 (0125) (3251 (3251 (0125)
175) 275)
Notomestua (C.) 75 25 12.5 (251125) (25125) (0125)
Polydora 1150 262.5 12.5 112.5 25 55 12.5 (14501 (3501 (2510) (1251 (5010) (0/50) (2510)
850) 175) 100)
Polydora nuchal is 1412.5 212.5 50 1950 250 25 (18251 (2501 (10010) (8751 (2501 (25125)
1275
1000) 175) 3025) 250) (15751
975:
Polydora aocielim 2500 825 12.5 175 537.5 12.5 (23751 (9251 (2510) (2251 (i501 (2ZIO) 2625) 725) 125) 325)
Polydora rnebsteri 625 25 12.5 87.5 12.5 (8251 (0150) (0125) (501125) (0125) 425)
Pseudopolydora 650 250 12.5 12.5 50 75 paucibranchiata (8501 (450150) (0125) (0125) (25175) (25125)
450)
Schistomeringos rudulphi 25 50 (25125) (50150)
Scole lepis acuta 262.5 62.5 37.5 12.5 37.5 87.5 162.5 12.5 (4251 (100125) (7510) (2510) (7510) (251150) (275i50) (0125) 100)
St reblospio benedic t i 7912.5 4150 750 537.5 1275 3350 950 1362.5 2000 (87501 (62251 (7751 (6251 (6751 (40001 (1000/ (16501 (19751 7075) 2075) 725) 450) 1875) 2700) 900) 1075) 2025)
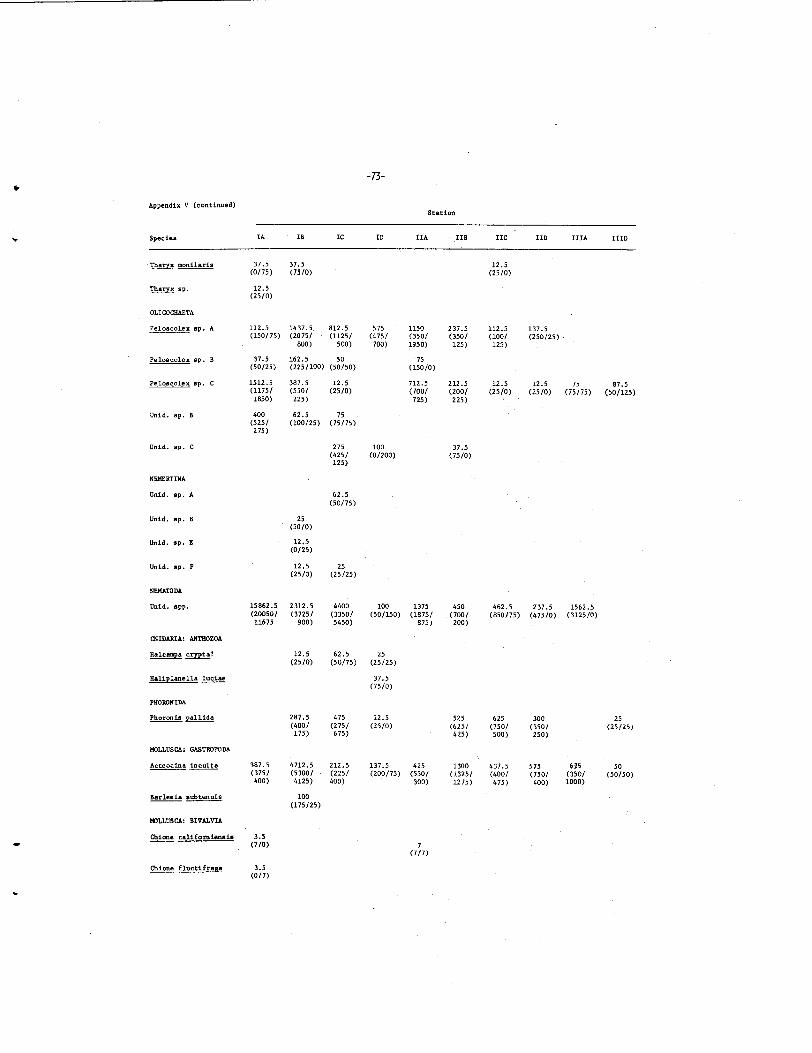
Appendix V (continued) S t a t i o n
Species I A IB IC ID IIA I IB IIC IID I I IA I I ID
Tharyx sp. 12.5 (2510)
OLI GOCHAETA
Peloscolex s p . A 112.5 1437.5 812.5 575 1150 237.5 112.5 137.5 (150175) (20751 (11251 (4751 (3501 (3501 (1001 (250125)
aoo) 500) 700) 1950) 125) 125)
' Peloscolex sp . B 37.5 162.5 50 75
(50125) (2251100) (50150) (15010)
Peloscolex s p . C 1512.5 387.5 12.5 (11751 (5501 (2510) 1850) 225)
Unid. sp. B 400 62.5 75 (5251 (100125) (75175) 275)
Unid. sp . C 275 100 37.5 (4251 (01200) (7510) 125)
Unid. sp . A 62.5 (50175)
Unid. sp . B 25 (5010)
Unid. sp. E 12.5 (0125)
Unid. sp. I
NEMATODA
Unid. spp. 15862.5 2312.5 4400 100 1375 450 662.5 237.5 1562.5 (200501 (37251 (33501 (501150) (18751 (7001 (850/75) (47510) (312510) 11675 900) 5450) 875) 200)
mIDARIA: ANTHOZOA
Haleampa crypes? 12.5 62.5 25 (2510) (50175) (25125)
PHORDNIDA
Pharonia p a l l i d a
Acteocina i n c u l t a -- 387.5 4712.5 212.5 137.5 425 1300 437.5 575 615 50 (3751 (53001 (2251 (200175) (5501 (13251 (4001 (7501 (3501 (50150) 400) 4125) 400) 300) 1275) 475) 400) 1000)
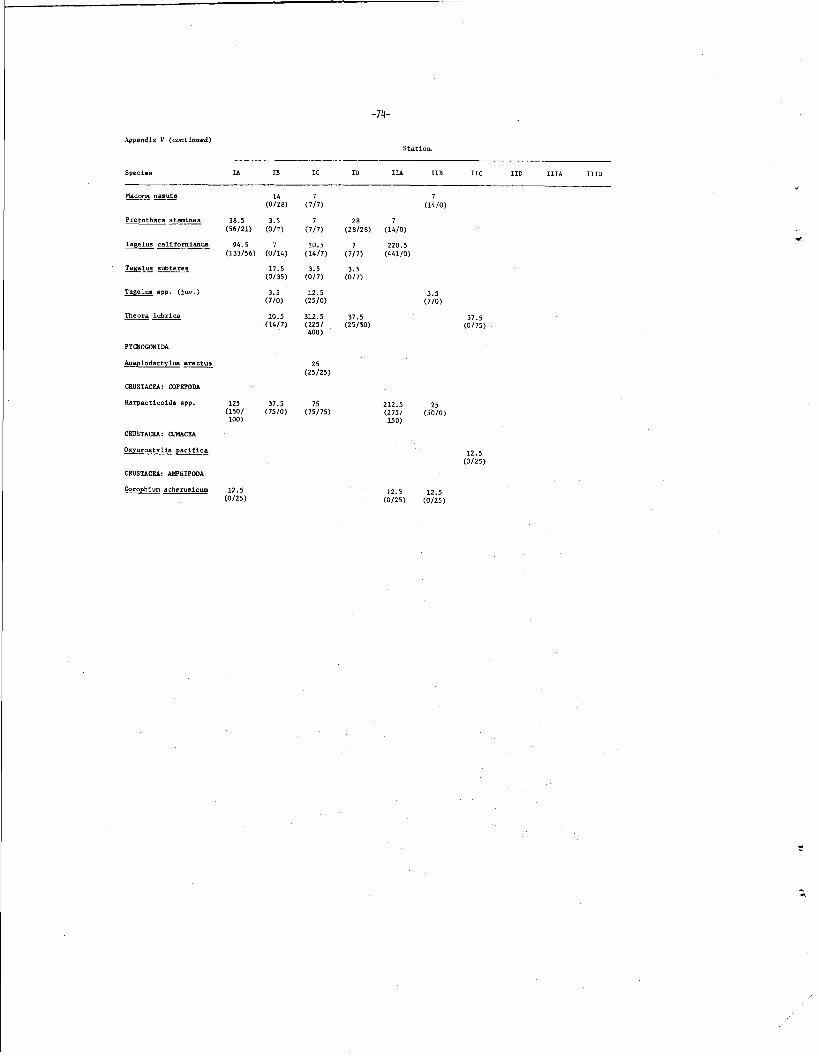
Appendix V (continued) S t a t i o n
Species IA IB IC ID IIA IIB IIC IID IIIA IIID
Macoma nasuta 14 7 7 (0128) (717) (1410)
Protothaea staminea 38.5 3.5 7 7 - -- 28 (56121) (01') (717) (28128) (1410)
Tagelus ca l i fornianua 94.5 7 10.5 7 220.5 (133156) (0114) (1417) (717) (44110)
Tagelus subteres 17.5 3.5 3.5 (0135) (017) (017)
T_agelus spp. (juv.)
Theora lubr ica --
Anaplodactylus erectus
CRUSTACEA: OPEPODA
Harpacticoida app. 125 37.5 75 (1501 (7510) (75175) 100)
CRUSTACEA: W C E A
CRUSTACEA: AWHIPODA
Corophium acherusicvm 12.5 (0125)
![TME-DC [ ] - Sew Many Parts, Inc. of Contents z TME-DC GENERAL VIEW z TME-DC FRAME … CD-1 z TME-DC TABLE … CD-2-1 z TME-DC AUTO SUB TABLE …](https://img.pdfslide.us/doc/110x75/5b1d28797f8b9add7f8b64eb/tme-dc-sew-many-parts-inc-of-contents-z-tme-dc-general-view-z-tme-dc-frame.jpg)