Embed Size (px)
Citation preview
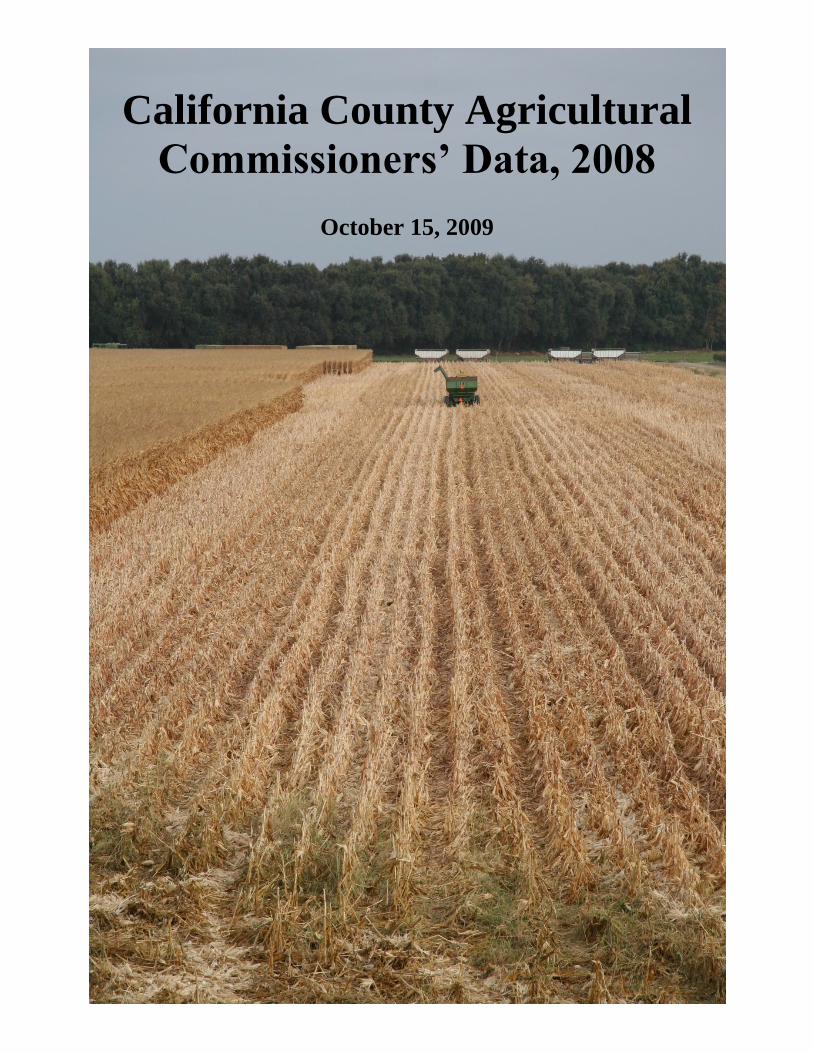
California County Agricultural
Commissioners’ Data, 2008
October 15, 2009
United States Department of Agriculture National Agricultural Statistics Service
California Field Office
P.O. Box 1258 ● Sacramento, CA 95812 ● Phone: (916) 498-5161 ● Fax: (916) 498-5186
E-mail: [email protected] ● Web: www.nass.usda.gov/ca
October 15, 2009
2008 COUNTY AGRICULTURAL COMMISSIONERS' DATA
This summary is based on the annual Crop Reports compiled by the California County Agricultural
Commissioners. These reports provide the most detailed annual data available on agricultural
production by county.
Basic data collected by the Agricultural Commissioners and their staffs are compiled from many
sources. Sources vary from county to county. Examples of data sources include grower surveys,
regulatory and inspection data, shipment data, industry assessments, etc.
The amount of detail varies by county. For instance, one county may list all grapes; another may show
grapes by raisin, table, and wine; another may list a further breakdown, such as canned, crushed, dried,
fresh, and juice. The data were coded at the detail level.
Users are reminded that price data reflect the average price received by growers, except for fresh market
fruits and vegetables, which are on a packed and ready to ship basis (F.O.B.= Free-On-Board).
The sum of other counties included only those counties that provide the California Department of Food
and Agriculture a listing of commodities that cannot be published at the county level due to disclosure of
confidential information. However, data can be published when combined with other counties. Please
be aware that the count is shown as one in all cases.
Reports were received from 56 of 58 counties for 2008. Two County Agricultural Commissioners’
Reports were not available at publication so 2003 data (last available report) was used for Trinity
County, while 2006 data was used for Humboldt County for this report.
Credit is due the County Agricultural Commissioners and their staffs for preparing the annual county
Crop Reports upon which this compilation is based.
USDA’s National Agricultural Statistics Service, California Field Office publications are available free-
of-charge on the Internet at: www.nass.usda.gov/ca
Cooperating with the California Department of Food and Agriculture
COMMODITIES SUMMARIZED
FROM AGRICULTURAL COMMISSIONER REPORTS, 2008
COMMODITIES PAGE
Almonds ...................................................................................................... 1
Anise ........................................................................................................... 1
Apiary Products ....................................................................................... 1-4 Apples.......................................................................................................... 4
Apricots ....................................................................................................... 5
Artichokes ................................................................................................... 5 Asparagus .................................................................................................... 5
Avocados ..................................................................................................... 5
Barley .......................................................................................................... 6 Beans, Dry & Green ................................................................................ 6-9
Beets, Garden .............................................................................................. 9
Berries ................................................................................................... 9-11 Biomass ..................................................................................................... 11
Broccoli ............................................................................................... 11-12
Brussels Sprouts ........................................................................................ 12
Cabbage ............................................................................................... 12-13
Carrots ....................................................................................................... 13
Cattle & Calves .................................................................................... 14-17 Cauliflower .......................................................................................... 17-18
Celery ........................................................................................................ 18 Cherimoyas ................................................................................................ 18
Cherries ..................................................................................................... 19
Chestnuts ................................................................................................... 19 Chickens .............................................................................................. 19-20
Christmas Trees & Cut Greens .................................................................. 20
Cilantro ...................................................................................................... 20 Citrus By-Products & Unspecified....................................................... 20-21
Collard Greens ........................................................................................... 21
Corn ..................................................................................................... 21-22 Cotton .................................................................................................. 22-23
Cucumbers ................................................................................................. 23
Dates .......................................................................................................... 24
Ducks ......................................................................................................... 24
Eggplant .................................................................................................... 24
Eggs ........................................................................................................... 24 Endive........................................................................................................ 25
Escarole ..................................................................................................... 25
Field Crop By-Products, Seed, & Unspecified ..................................... 25-26 Figs ............................................................................................................ 26
Fish ............................................................................................................ 26
Flowers ................................................................................................ 27-29 Forest Products, Firewood, & Unspecified ................................................ 30
Fruits & Nuts, Unspecified ........................................................................ 31
Game Birds, Unspecified ........................................................................... 31 Garlic ......................................................................................................... 32
Geese ......................................................................................................... 32
Goats & Products ....................................................................................... 32 Grapefruit .................................................................................................. 32
Grapes.................................................................................................. 33-34
Greens, Turnip & Mustard ......................................................................... 34
Guavas ....................................................................................................... 34
Hay & Green Chop .............................................................................. 35-38
Hogs & Pigs ............................................................................................... 38 Horseradish ................................................................................................ 38
Jojoba ........................................................................................................ 39
Kale ........................................................................................................... 39 Kiwifruit .................................................................................................... 39
Kohlrabi ..................................................................................................... 39
Kumquats................................................................................................... 39 Leeks ......................................................................................................... 39
Lemons ...................................................................................................... 40
Lettuce ................................................................................................. 40-41 Limes ......................................................................................................... 41
Livestock Products & Unspecified....................................................... 41-42
Macadamia Nuts ........................................................................................ 42
COMMODITIES PAGE
Manure ...................................................................................................... 43
Melons ................................................................................................. 43-44
Milk ..................................................................................................... 44-45 Mint ........................................................................................................... 45
Mushrooms ................................................................................................ 45
Nectarines .................................................................................................. 46 Nursery Products ................................................................................. 46-49
Oats ........................................................................................................... 50
Okra ........................................................................................................... 50 Olives ........................................................................................................ 50
Onions ....................................................................................................... 51
Oranges................................................................................................ 51-52 Ostrich & Emu ........................................................................................... 52
Parsley ....................................................................................................... 52
Parsnips ..................................................................................................... 52
Pasture ................................................................................................. 52-54
Peaches ...................................................................................................... 55
Pears .................................................................................................... 55-56 Peas ........................................................................................................... 56
Pecans ........................................................................................................ 57 Peppers ...................................................................................................... 57
Persimmons ............................................................................................... 57
Pheasants ................................................................................................... 58 Pigeons & Squabs ...................................................................................... 58
Pistachios ................................................................................................... 58
Plumcots .................................................................................................... 58 Plums, Fresh & Dried .......................................................................... 58-59
Pomegranates ............................................................................................. 59
Potatoes & Sweet Potatoes ........................................................................ 59 Poultry, Unspecified .................................................................................. 60
Pumpkins ................................................................................................... 60
Quince ....................................................................................................... 60
Rabbits ....................................................................................................... 60
Radicchio ................................................................................................... 61
Radishes .................................................................................................... 61 Rappini ...................................................................................................... 61
Rice ..................................................................................................... 61-62
Rutabagas .................................................................................................. 62 Rye ............................................................................................................ 62
Safflower ................................................................................................... 63
Salad Greens, Misc. ................................................................................... 63 Seed ..................................................................................................... 63-64
Sheep & Lambs ................................................................................... 64-66
Silage ......................................................................................................... 66 Sorghum, Grain & Silage........................................................................... 66
Spices & Herbs .......................................................................................... 67
Spinach ...................................................................................................... 67 Sprouts, Alfalfa & Bean ............................................................................ 67
Squash ....................................................................................................... 68
Straw ......................................................................................................... 68
Sugar Beets ................................................................................................ 68
Sunflower Seed .......................................................................................... 68
Swiss Chard ............................................................................................... 69 Tangelos .................................................................................................... 69
Tangerines & Mandarins ........................................................................... 69
Tomatillo ................................................................................................... 69 Tomatoes ............................................................................................. 69-70
Triticale ..................................................................................................... 71
Turkeys ...................................................................................................... 71 Turnips ...................................................................................................... 71
Vegetables, Oriental & Unspecified .................................................... 71-72
Walnuts, Black & English ................................................................... 72-73 Wheat ........................................................................................................ 74
Wool .......................................................................................................... 75
Organic Farming, 2008 ............................................................................................................................................................................................................. 76
Price Per
UnitTotal Value
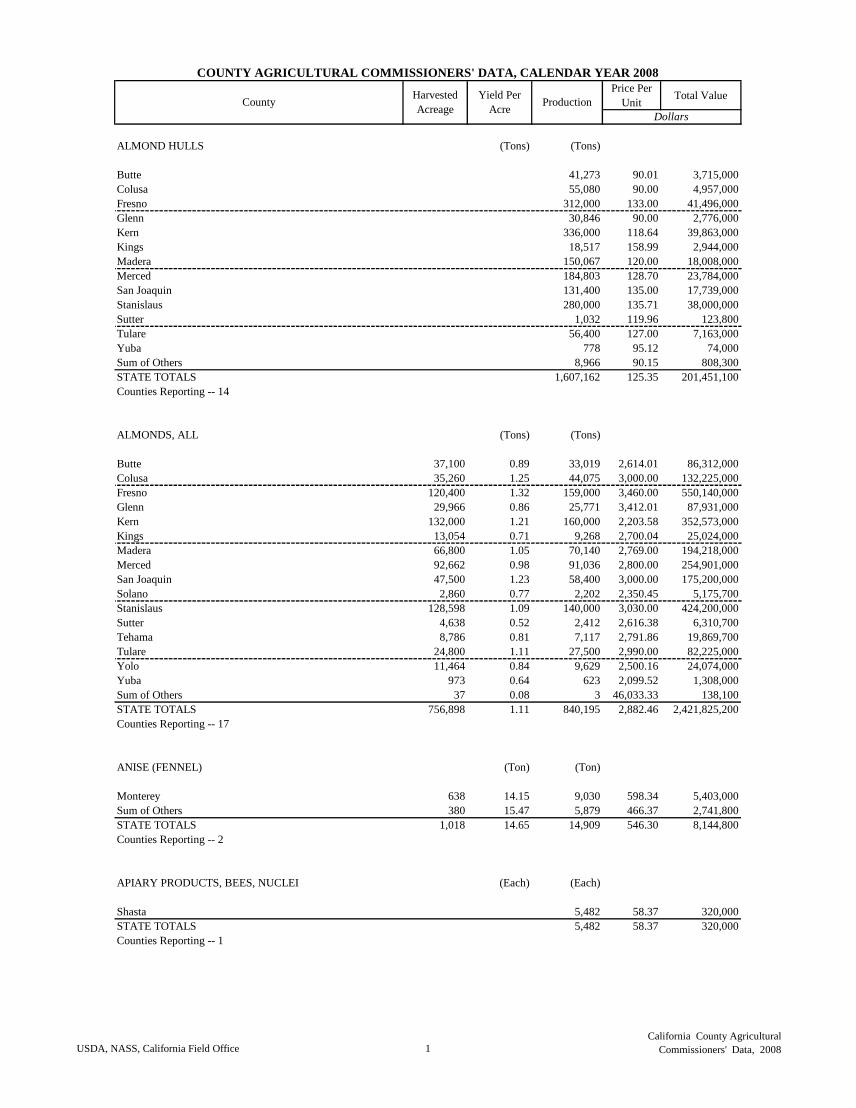
ALMOND HULLS (Tons) (Tons)
Butte 41,273 90.01 3,715,000
Colusa 55,080 90.00 4,957,000
Fresno 312,000 133.00 41,496,000
Glenn 30,846 90.00 2,776,000
Kern 336,000 118.64 39,863,000
Kings 18,517 158.99 2,944,000
Madera 150,067 120.00 18,008,000
Merced 184,803 128.70 23,784,000
San Joaquin 131,400 135.00 17,739,000
Stanislaus 280,000 135.71 38,000,000
Sutter 1,032 119.96 123,800
Tulare 56,400 127.00 7,163,000
Yuba 778 95.12 74,000
Sum of Others 8,966 90.15 808,300
STATE TOTALS 1,607,162 125.35 201,451,100
Counties Reporting -- 14
ALMONDS, ALL (Tons) (Tons)
Butte 37,100 0.89 33,019 2,614.01 86,312,000
Colusa 35,260 1.25 44,075 3,000.00 132,225,000
Fresno 120,400 1.32 159,000 3,460.00 550,140,000
Glenn 29,966 0.86 25,771 3,412.01 87,931,000
Kern 132,000 1.21 160,000 2,203.58 352,573,000
Kings 13,054 0.71 9,268 2,700.04 25,024,000
Madera 66,800 1.05 70,140 2,769.00 194,218,000
Merced 92,662 0.98 91,036 2,800.00 254,901,000
San Joaquin 47,500 1.23 58,400 3,000.00 175,200,000
Solano 2,860 0.77 2,202 2,350.45 5,175,700
Stanislaus 128,598 1.09 140,000 3,030.00 424,200,000
Sutter 4,638 0.52 2,412 2,616.38 6,310,700
Tehama 8,786 0.81 7,117 2,791.86 19,869,700
Tulare 24,800 1.11 27,500 2,990.00 82,225,000
Yolo 11,464 0.84 9,629 2,500.16 24,074,000
Yuba 973 0.64 623 2,099.52 1,308,000
Sum of Others 37 0.08 3 46,033.33 138,100
STATE TOTALS 756,898 1.11 840,195 2,882.46 2,421,825,200
Counties Reporting -- 17
ANISE (FENNEL) (Ton) (Ton)
Monterey 638 14.15 9,030 598.34 5,403,000
Sum of Others 380 15.47 5,879 466.37 2,741,800
STATE TOTALS 1,018 14.65 14,909 546.30 8,144,800
Counties Reporting -- 2
APIARY PRODUCTS, BEES, NUCLEI (Each) (Each)
Shasta 5,482 58.37 320,000
STATE TOTALS 5,482 58.37 320,000
Counties Reporting -- 1
COUNTY AGRICULTURAL COMMISSIONERS' DATA, CALENDAR YEAR 2008
CountyHarvested
Acreage
Yield Per
AcreProduction
Dollars
USDA, NASS, California Field Office 1
California County Agricultural
Commissioners' Data, 2008
Price Per
UnitTotal Value
COUNTY AGRICULTURAL COMMISSIONERS' DATA, CALENDAR YEAR 2008
CountyHarvested
Acreage
Yield Per
AcreProduction
Dollars
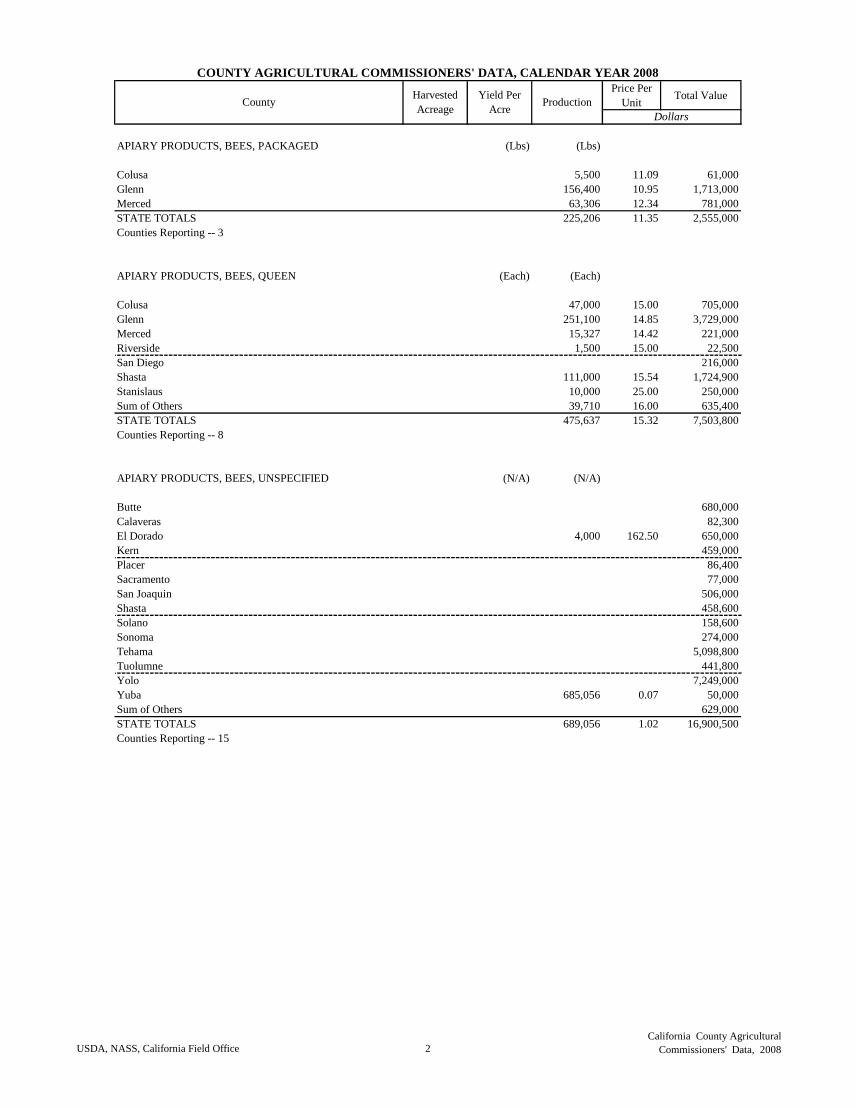
APIARY PRODUCTS, BEES, PACKAGED (Lbs) (Lbs)
Colusa 5,500 11.09 61,000
Glenn 156,400 10.95 1,713,000
Merced 63,306 12.34 781,000
STATE TOTALS 225,206 11.35 2,555,000
Counties Reporting -- 3
APIARY PRODUCTS, BEES, QUEEN (Each) (Each)
Colusa 47,000 15.00 705,000
Glenn 251,100 14.85 3,729,000
Merced 15,327 14.42 221,000
Riverside 1,500 15.00 22,500
San Diego 216,000
Shasta 111,000 15.54 1,724,900
Stanislaus 10,000 25.00 250,000
Sum of Others 39,710 16.00 635,400
STATE TOTALS 475,637 15.32 7,503,800
Counties Reporting -- 8
APIARY PRODUCTS, BEES, UNSPECIFIED (N/A) (N/A)
Butte 680,000
Calaveras 82,300
El Dorado 4,000 162.50 650,000
Kern 459,000
Placer 86,400
Sacramento 77,000
San Joaquin 506,000
Shasta 458,600
Solano 158,600
Sonoma 274,000
Tehama 5,098,800
Tuolumne 441,800
Yolo 7,249,000
Yuba 685,056 0.07 50,000
Sum of Others 629,000
STATE TOTALS 689,056 1.02 16,900,500
Counties Reporting -- 15
USDA, NASS, California Field Office 2
California County Agricultural
Commissioners' Data, 2008
Price Per
UnitTotal Value
COUNTY AGRICULTURAL COMMISSIONERS' DATA, CALENDAR YEAR 2008
CountyHarvested
Acreage
Yield Per
AcreProduction
Dollars
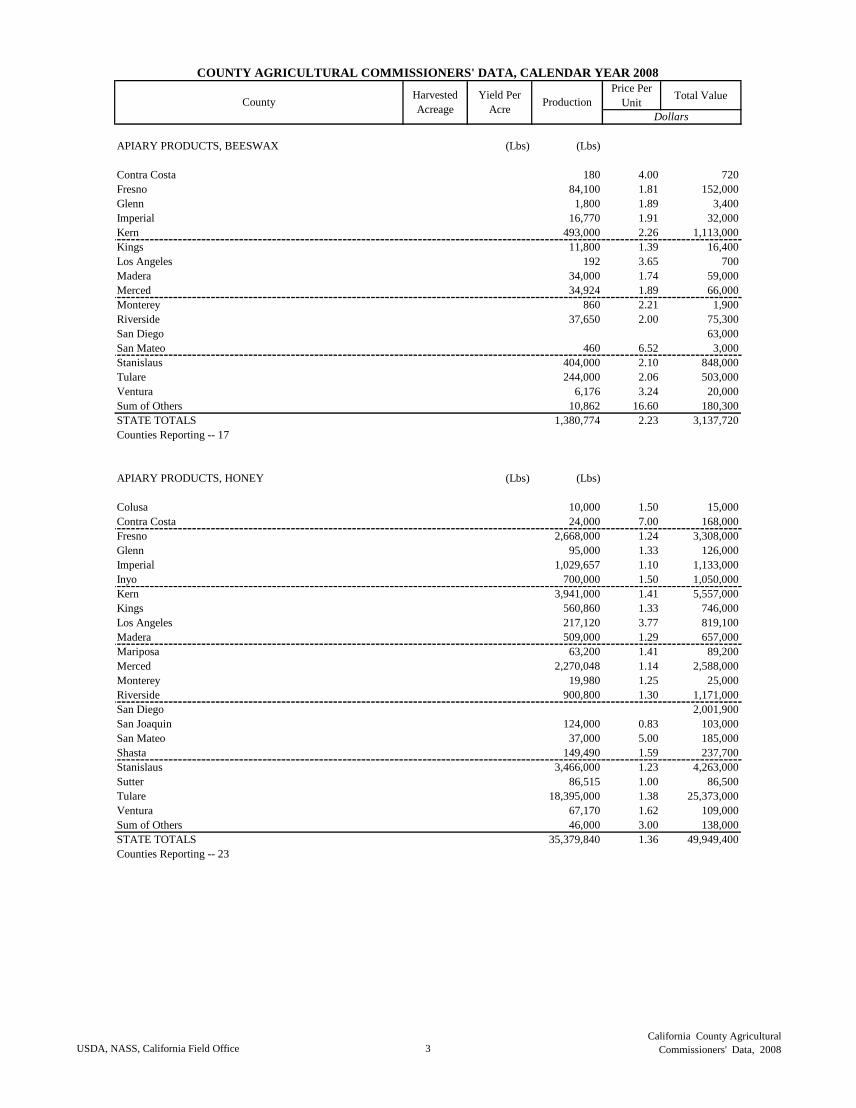
APIARY PRODUCTS, BEESWAX (Lbs) (Lbs)
Contra Costa 180 4.00 720
Fresno 84,100 1.81 152,000
Glenn 1,800 1.89 3,400
Imperial 16,770 1.91 32,000
Kern 493,000 2.26 1,113,000
Kings 11,800 1.39 16,400
Los Angeles 192 3.65 700
Madera 34,000 1.74 59,000
Merced 34,924 1.89 66,000
Monterey 860 2.21 1,900
Riverside 37,650 2.00 75,300
San Diego 63,000
San Mateo 460 6.52 3,000
Stanislaus 404,000 2.10 848,000
Tulare 244,000 2.06 503,000
Ventura 6,176 3.24 20,000
Sum of Others 10,862 16.60 180,300
STATE TOTALS 1,380,774 2.23 3,137,720
Counties Reporting -- 17
APIARY PRODUCTS, HONEY (Lbs) (Lbs)
Colusa 10,000 1.50 15,000
Contra Costa 24,000 7.00 168,000
Fresno 2,668,000 1.24 3,308,000
Glenn 95,000 1.33 126,000
Imperial 1,029,657 1.10 1,133,000
Inyo 700,000 1.50 1,050,000
Kern 3,941,000 1.41 5,557,000
Kings 560,860 1.33 746,000
Los Angeles 217,120 3.77 819,100
Madera 509,000 1.29 657,000
Mariposa 63,200 1.41 89,200
Merced 2,270,048 1.14 2,588,000
Monterey 19,980 1.25 25,000
Riverside 900,800 1.30 1,171,000
San Diego 2,001,900
San Joaquin 124,000 0.83 103,000
San Mateo 37,000 5.00 185,000
Shasta 149,490 1.59 237,700
Stanislaus 3,466,000 1.23 4,263,000
Sutter 86,515 1.00 86,500
Tulare 18,395,000 1.38 25,373,000
Ventura 67,170 1.62 109,000
Sum of Others 46,000 3.00 138,000
STATE TOTALS 35,379,840 1.36 49,949,400
Counties Reporting -- 23
USDA, NASS, California Field Office 3
California County Agricultural
Commissioners' Data, 2008
Price Per
UnitTotal Value
COUNTY AGRICULTURAL COMMISSIONERS' DATA, CALENDAR YEAR 2008
CountyHarvested
Acreage
Yield Per
AcreProduction
Dollars
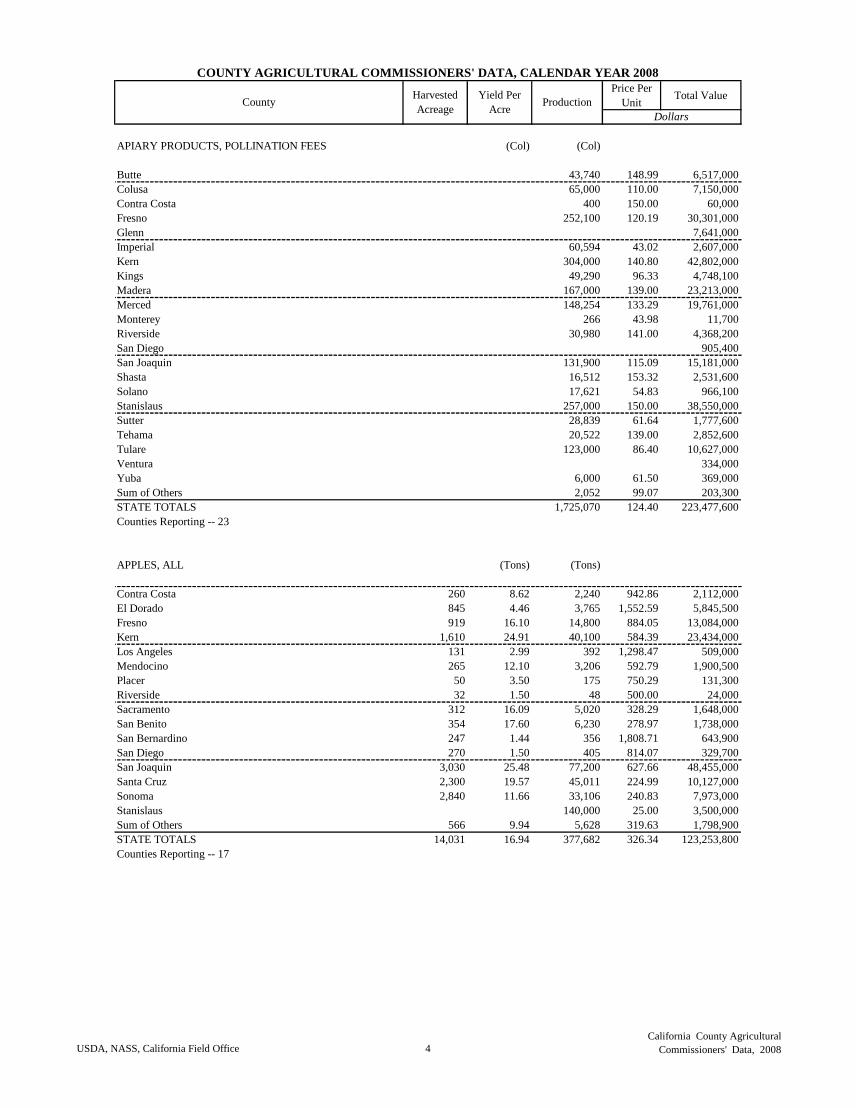
APIARY PRODUCTS, POLLINATION FEES (Col) (Col)
Butte 43,740 148.99 6,517,000
Colusa 65,000 110.00 7,150,000
Contra Costa 400 150.00 60,000
Fresno 252,100 120.19 30,301,000
Glenn 7,641,000
Imperial 60,594 43.02 2,607,000
Kern 304,000 140.80 42,802,000
Kings 49,290 96.33 4,748,100
Madera 167,000 139.00 23,213,000
Merced 148,254 133.29 19,761,000
Monterey 266 43.98 11,700
Riverside 30,980 141.00 4,368,200
San Diego 905,400
San Joaquin 131,900 115.09 15,181,000
Shasta 16,512 153.32 2,531,600
Solano 17,621 54.83 966,100
Stanislaus 257,000 150.00 38,550,000
Sutter 28,839 61.64 1,777,600
Tehama 20,522 139.00 2,852,600
Tulare 123,000 86.40 10,627,000
Ventura 334,000
Yuba 6,000 61.50 369,000
Sum of Others 2,052 99.07 203,300
STATE TOTALS 1,725,070 124.40 223,477,600
Counties Reporting -- 23
APPLES, ALL (Tons) (Tons)
Contra Costa 260 8.62 2,240 942.86 2,112,000
El Dorado 845 4.46 3,765 1,552.59 5,845,500
Fresno 919 16.10 14,800 884.05 13,084,000
Kern 1,610 24.91 40,100 584.39 23,434,000
Los Angeles 131 2.99 392 1,298.47 509,000
Mendocino 265 12.10 3,206 592.79 1,900,500
Placer 50 3.50 175 750.29 131,300
Riverside 32 1.50 48 500.00 24,000
Sacramento 312 16.09 5,020 328.29 1,648,000
San Benito 354 17.60 6,230 278.97 1,738,000
San Bernardino 247 1.44 356 1,808.71 643,900
San Diego 270 1.50 405 814.07 329,700
San Joaquin 3,030 25.48 77,200 627.66 48,455,000
Santa Cruz 2,300 19.57 45,011 224.99 10,127,000
Sonoma 2,840 11.66 33,106 240.83 7,973,000
Stanislaus 140,000 25.00 3,500,000
Sum of Others 566 9.94 5,628 319.63 1,798,900
STATE TOTALS 14,031 16.94 377,682 326.34 123,253,800
Counties Reporting -- 17
USDA, NASS, California Field Office 4
California County Agricultural
Commissioners' Data, 2008
Price Per
UnitTotal Value
COUNTY AGRICULTURAL COMMISSIONERS' DATA, CALENDAR YEAR 2008
CountyHarvested
Acreage
Yield Per
AcreProduction
Dollars
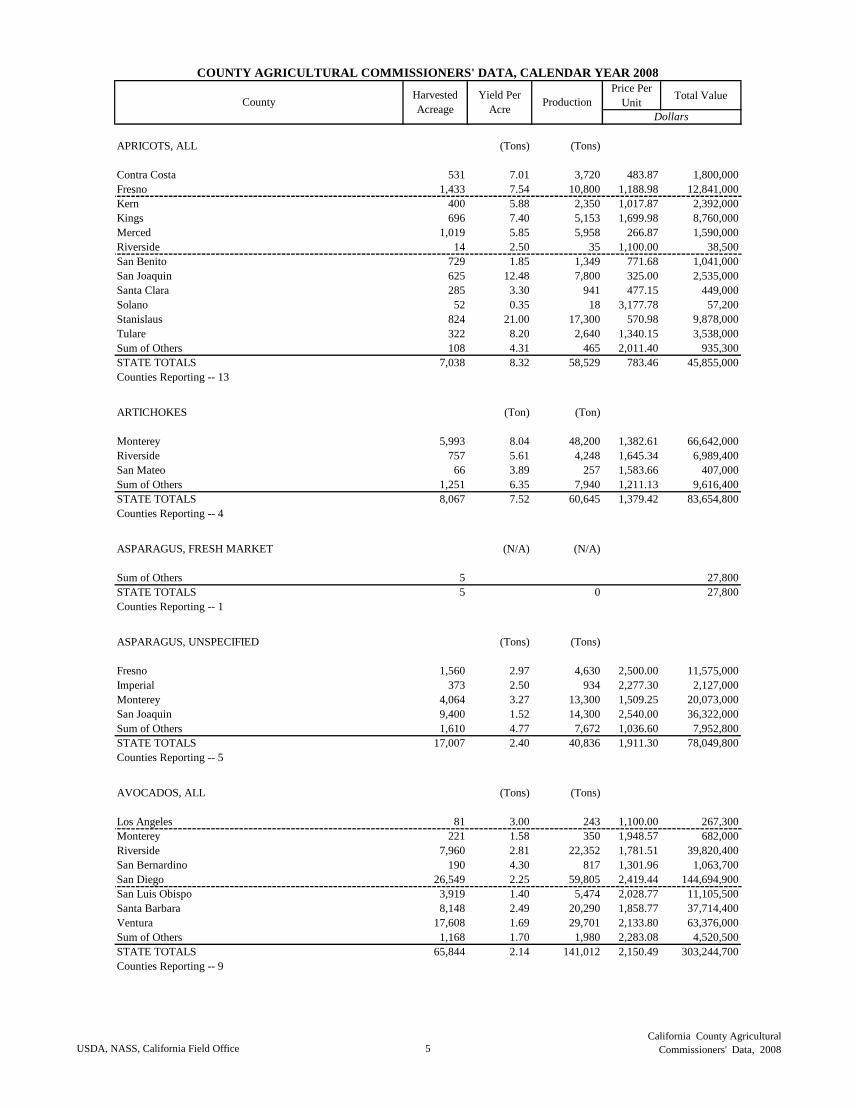
APRICOTS, ALL (Tons) (Tons)
Contra Costa 531 7.01 3,720 483.87 1,800,000
Fresno 1,433 7.54 10,800 1,188.98 12,841,000
Kern 400 5.88 2,350 1,017.87 2,392,000
Kings 696 7.40 5,153 1,699.98 8,760,000
Merced 1,019 5.85 5,958 266.87 1,590,000
Riverside 14 2.50 35 1,100.00 38,500
San Benito 729 1.85 1,349 771.68 1,041,000
San Joaquin 625 12.48 7,800 325.00 2,535,000
Santa Clara 285 3.30 941 477.15 449,000
Solano 52 0.35 18 3,177.78 57,200
Stanislaus 824 21.00 17,300 570.98 9,878,000
Tulare 322 8.20 2,640 1,340.15 3,538,000
Sum of Others 108 4.31 465 2,011.40 935,300
STATE TOTALS 7,038 8.32 58,529 783.46 45,855,000
Counties Reporting -- 13
ARTICHOKES (Ton) (Ton)
Monterey 5,993 8.04 48,200 1,382.61 66,642,000
Riverside 757 5.61 4,248 1,645.34 6,989,400
San Mateo 66 3.89 257 1,583.66 407,000
Sum of Others 1,251 6.35 7,940 1,211.13 9,616,400
STATE TOTALS 8,067 7.52 60,645 1,379.42 83,654,800
Counties Reporting -- 4
ASPARAGUS, FRESH MARKET (N/A) (N/A)
Sum of Others 5 27,800
STATE TOTALS 5 0 27,800
Counties Reporting -- 1
ASPARAGUS, UNSPECIFIED (Tons) (Tons)
Fresno 1,560 2.97 4,630 2,500.00 11,575,000
Imperial 373 2.50 934 2,277.30 2,127,000
Monterey 4,064 3.27 13,300 1,509.25 20,073,000
San Joaquin 9,400 1.52 14,300 2,540.00 36,322,000
Sum of Others 1,610 4.77 7,672 1,036.60 7,952,800
STATE TOTALS 17,007 2.40 40,836 1,911.30 78,049,800
Counties Reporting -- 5
AVOCADOS, ALL (Tons) (Tons)
Los Angeles 81 3.00 243 1,100.00 267,300
Monterey 221 1.58 350 1,948.57 682,000
Riverside 7,960 2.81 22,352 1,781.51 39,820,400
San Bernardino 190 4.30 817 1,301.96 1,063,700
San Diego 26,549 2.25 59,805 2,419.44 144,694,900
San Luis Obispo 3,919 1.40 5,474 2,028.77 11,105,500
Santa Barbara 8,148 2.49 20,290 1,858.77 37,714,400
Ventura 17,608 1.69 29,701 2,133.80 63,376,000
Sum of Others 1,168 1.70 1,980 2,283.08 4,520,500
STATE TOTALS 65,844 2.14 141,012 2,150.49 303,244,700
Counties Reporting -- 9
USDA, NASS, California Field Office 5
California County Agricultural
Commissioners' Data, 2008
Price Per
UnitTotal Value
COUNTY AGRICULTURAL COMMISSIONERS' DATA, CALENDAR YEAR 2008
CountyHarvested
Acreage
Yield Per
AcreProduction
Dollars
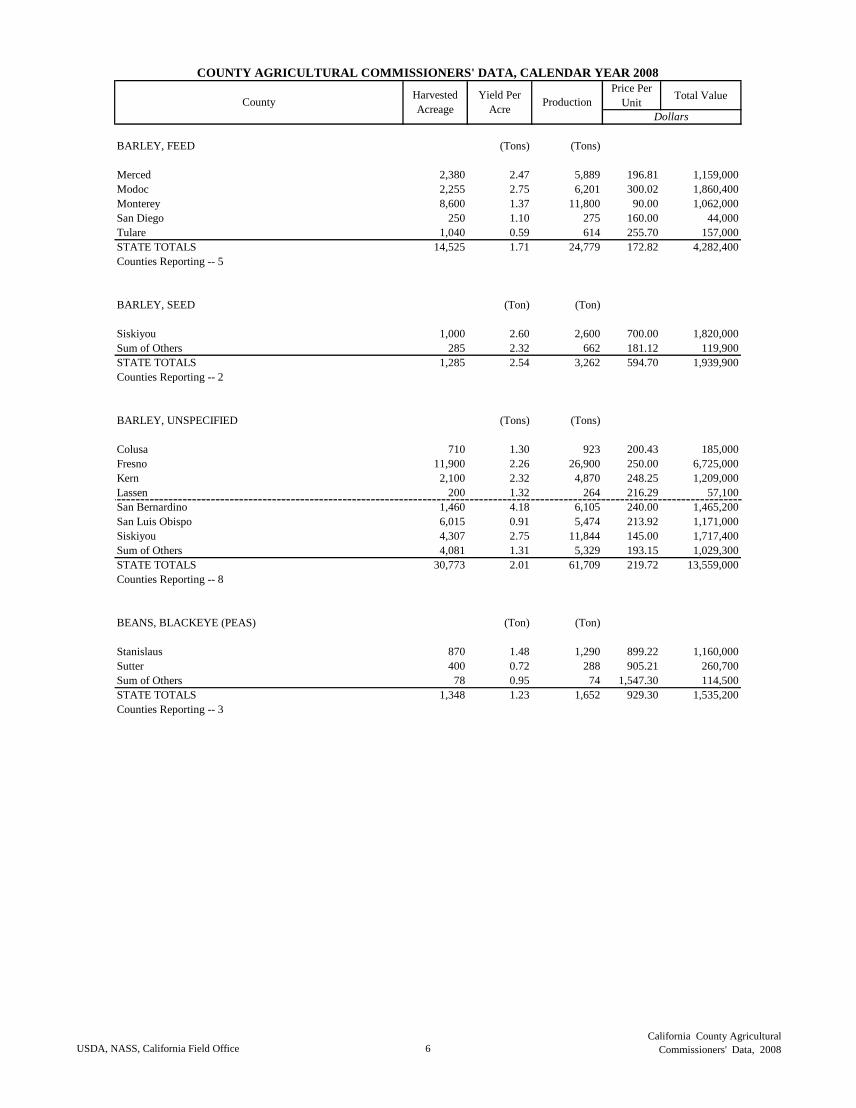
BARLEY, FEED (Tons) (Tons)
Merced 2,380 2.47 5,889 196.81 1,159,000
Modoc 2,255 2.75 6,201 300.02 1,860,400
Monterey 8,600 1.37 11,800 90.00 1,062,000
San Diego 250 1.10 275 160.00 44,000
Tulare 1,040 0.59 614 255.70 157,000
STATE TOTALS 14,525 1.71 24,779 172.82 4,282,400
Counties Reporting -- 5
BARLEY, SEED (Ton) (Ton)
Siskiyou 1,000 2.60 2,600 700.00 1,820,000
Sum of Others 285 2.32 662 181.12 119,900
STATE TOTALS 1,285 2.54 3,262 594.70 1,939,900
Counties Reporting -- 2
BARLEY, UNSPECIFIED (Tons) (Tons)
Colusa 710 1.30 923 200.43 185,000
Fresno 11,900 2.26 26,900 250.00 6,725,000
Kern 2,100 2.32 4,870 248.25 1,209,000
Lassen 200 1.32 264 216.29 57,100
San Bernardino 1,460 4.18 6,105 240.00 1,465,200
San Luis Obispo 6,015 0.91 5,474 213.92 1,171,000
Siskiyou 4,307 2.75 11,844 145.00 1,717,400
Sum of Others 4,081 1.31 5,329 193.15 1,029,300
STATE TOTALS 30,773 2.01 61,709 219.72 13,559,000
Counties Reporting -- 8
BEANS, BLACKEYE (PEAS) (Ton) (Ton)
Stanislaus 870 1.48 1,290 899.22 1,160,000
Sutter 400 0.72 288 905.21 260,700
Sum of Others 78 0.95 74 1,547.30 114,500
STATE TOTALS 1,348 1.23 1,652 929.30 1,535,200
Counties Reporting -- 3
USDA, NASS, California Field Office 6
California County Agricultural
Commissioners' Data, 2008

Price Per
UnitTotal Value
COUNTY AGRICULTURAL COMMISSIONERS' DATA, CALENDAR YEAR 2008
CountyHarvested
Acreage
Yield Per
AcreProduction
Dollars
BEANS, DRY EDIBLE, UNSPECIFIED (Tons) (Tons)
Butte 930 1.15 1,070 1,049.53 1,123,000
Colusa 4,390 0.90 3,951 1,010.12 3,991,000
Fresno 5,830 1.25 7,290 841.98 6,138,000
Glenn 1,713 1.10 1,884 1,000.00 1,884,000
Kern 1,896 1.50 2,840 901.41 2,560,000
Monterey 583 1.23 717 1,393.31 999,000
San Joaquin 1,980 1.37 2,710 962.36 2,608,000
San Mateo 51 0.96 49 3,755.10 184,000
Santa Barbara 4,005 0.77 3,078 1,157.54 3,562,900
Solano 2,968 0.73 2,166 1,024.65 2,219,400
Stanislaus 580 1.00 580 900.00 522,000
Tulare 1,930 1.36 2,620 866.03 2,269,000
Sum of Others 985 4.24 4,177 315.82 1,319,200
STATE TOTALS 27,841 1.19 33,132 886.74 29,379,500
Counties Reporting -- 13
BEANS, FAVA (Tons) (Tons)
Sum of Others 2 1.00 2 5,350.00 10,700
STATE TOTALS 2 1.00 2 5,350.00 10,700
Counties Reporting -- 1
BEANS, FRESH, UNSPECIFIED (Tons) (Tons)
Contra Costa 326 3.93 1,280 1,089.84 1,395,000
Riverside 1,055 6.16 6,504 1,155.35 7,514,400
San Bernardino 11 2.00 22 1,154.55 25,400
Stanislaus 1,759 1.97 3,470 600.00 2,082,000
Sum of Others 312 4.77 1,488 971.64 1,445,800
STATE TOTALS 3,463 3.69 12,764 976.39 12,462,600
Counties Reporting -- 5
BEANS, GARBANZO (Tons) (Tons)
Sum of Others 3,814 1.03 3,930 729.95 2,868,700
STATE TOTALS 3,814 1.03 3,930 729.95 2,868,700
Counties Reporting -- 1
BEANS, LIMA, BABY DRY (Ton) (Ton)
Stanislaus 1,550 1.41 2,190 1,030.14 2,256,000
Sutter 2,667 1.25 3,334 1,152.82 3,843,500
STATE TOTALS 4,217 1.31 5,524 1,104.18 6,099,500
Counties Reporting -- 2
USDA, NASS, California Field Office 7
California County Agricultural
Commissioners' Data, 2008
Price Per
UnitTotal Value
COUNTY AGRICULTURAL COMMISSIONERS' DATA, CALENDAR YEAR 2008
CountyHarvested
Acreage
Yield Per
AcreProduction
Dollars
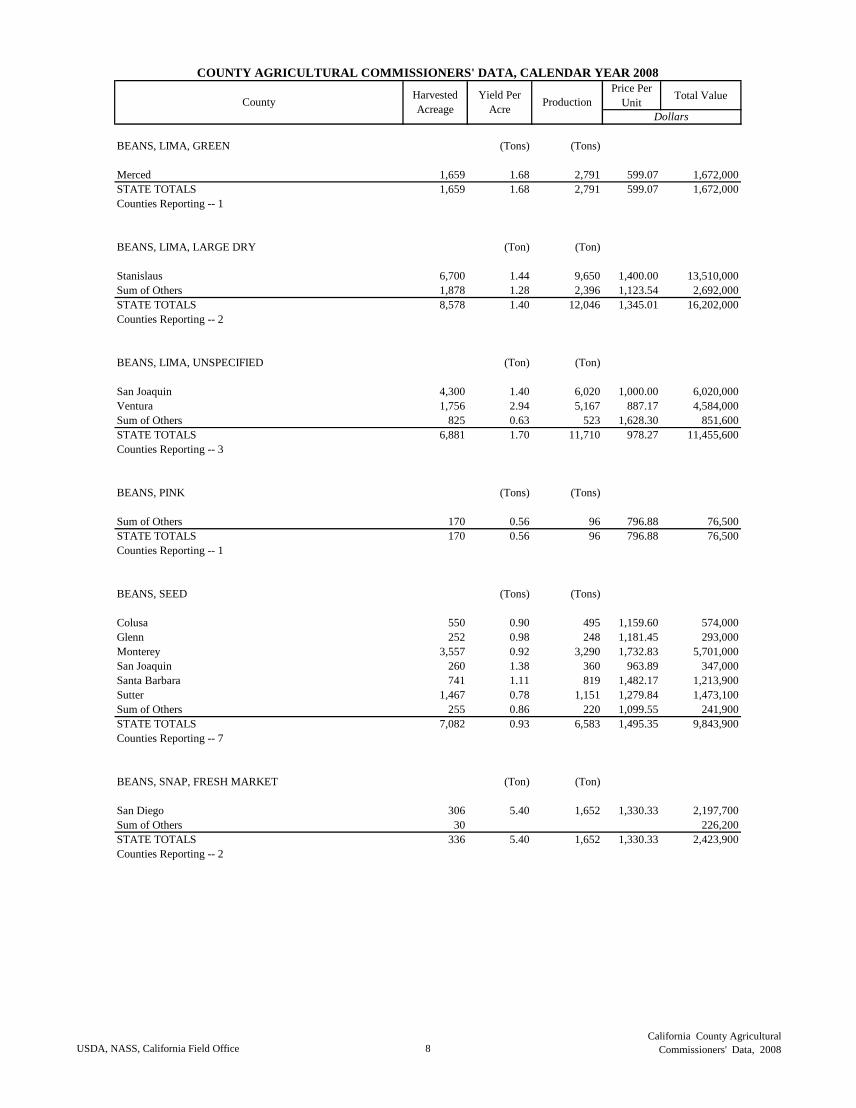
BEANS, LIMA, GREEN (Tons) (Tons)
Merced 1,659 1.68 2,791 599.07 1,672,000
STATE TOTALS 1,659 1.68 2,791 599.07 1,672,000
Counties Reporting -- 1
BEANS, LIMA, LARGE DRY (Ton) (Ton)
Stanislaus 6,700 1.44 9,650 1,400.00 13,510,000
Sum of Others 1,878 1.28 2,396 1,123.54 2,692,000
STATE TOTALS 8,578 1.40 12,046 1,345.01 16,202,000
Counties Reporting -- 2
BEANS, LIMA, UNSPECIFIED (Ton) (Ton)
San Joaquin 4,300 1.40 6,020 1,000.00 6,020,000
Ventura 1,756 2.94 5,167 887.17 4,584,000
Sum of Others 825 0.63 523 1,628.30 851,600
STATE TOTALS 6,881 1.70 11,710 978.27 11,455,600
Counties Reporting -- 3
BEANS, PINK (Tons) (Tons)
Sum of Others 170 0.56 96 796.88 76,500
STATE TOTALS 170 0.56 96 796.88 76,500
Counties Reporting -- 1
BEANS, SEED (Tons) (Tons)
Colusa 550 0.90 495 1,159.60 574,000
Glenn 252 0.98 248 1,181.45 293,000
Monterey 3,557 0.92 3,290 1,732.83 5,701,000
San Joaquin 260 1.38 360 963.89 347,000
Santa Barbara 741 1.11 819 1,482.17 1,213,900
Sutter 1,467 0.78 1,151 1,279.84 1,473,100
Sum of Others 255 0.86 220 1,099.55 241,900
STATE TOTALS 7,082 0.93 6,583 1,495.35 9,843,900
Counties Reporting -- 7
BEANS, SNAP, FRESH MARKET (Ton) (Ton)
San Diego 306 5.40 1,652 1,330.33 2,197,700
Sum of Others 30 226,200
STATE TOTALS 336 5.40 1,652 1,330.33 2,423,900
Counties Reporting -- 2
USDA, NASS, California Field Office 8
California County Agricultural
Commissioners' Data, 2008
Price Per
UnitTotal Value
COUNTY AGRICULTURAL COMMISSIONERS' DATA, CALENDAR YEAR 2008
CountyHarvested
Acreage
Yield Per
AcreProduction
Dollars
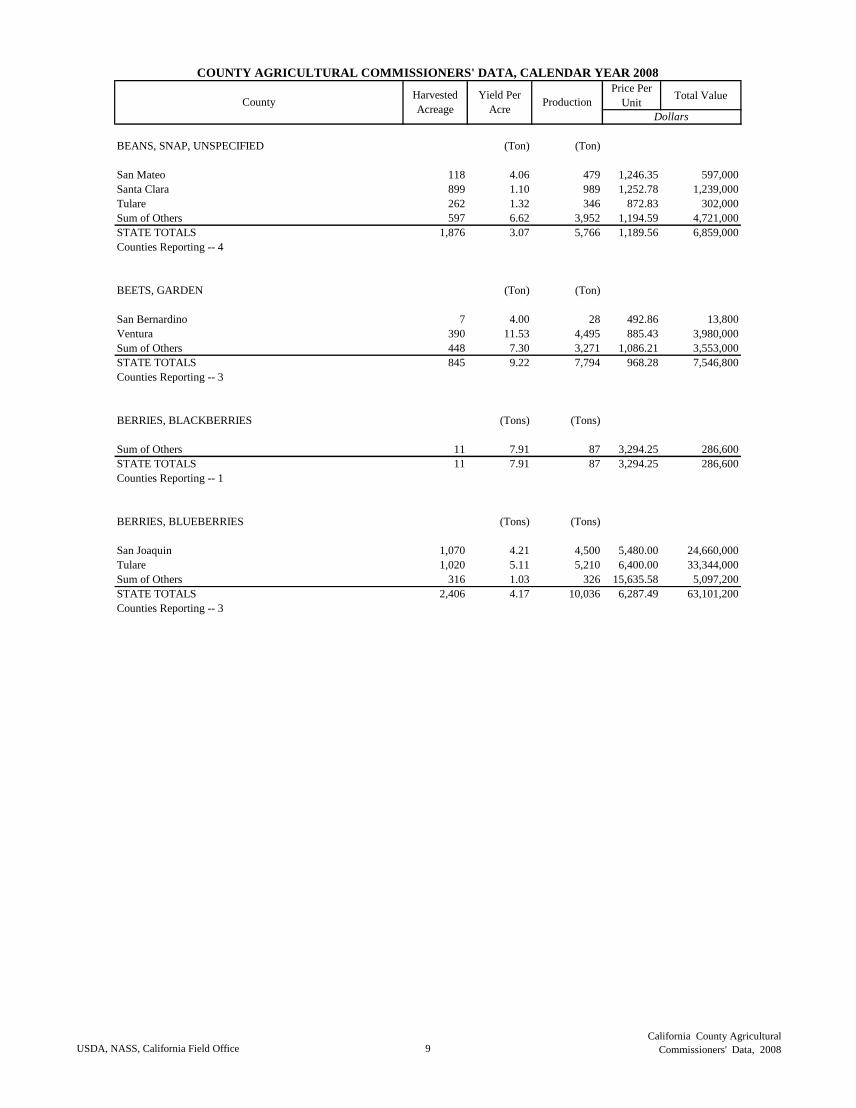
BEANS, SNAP, UNSPECIFIED (Ton) (Ton)
San Mateo 118 4.06 479 1,246.35 597,000
Santa Clara 899 1.10 989 1,252.78 1,239,000
Tulare 262 1.32 346 872.83 302,000
Sum of Others 597 6.62 3,952 1,194.59 4,721,000
STATE TOTALS 1,876 3.07 5,766 1,189.56 6,859,000
Counties Reporting -- 4
BEETS, GARDEN (Ton) (Ton)
San Bernardino 7 4.00 28 492.86 13,800
Ventura 390 11.53 4,495 885.43 3,980,000
Sum of Others 448 7.30 3,271 1,086.21 3,553,000
STATE TOTALS 845 9.22 7,794 968.28 7,546,800
Counties Reporting -- 3
BERRIES, BLACKBERRIES (Tons) (Tons)
Sum of Others 11 7.91 87 3,294.25 286,600
STATE TOTALS 11 7.91 87 3,294.25 286,600
Counties Reporting -- 1
BERRIES, BLUEBERRIES (Tons) (Tons)
San Joaquin 1,070 4.21 4,500 5,480.00 24,660,000
Tulare 1,020 5.11 5,210 6,400.00 33,344,000
Sum of Others 316 1.03 326 15,635.58 5,097,200
STATE TOTALS 2,406 4.17 10,036 6,287.49 63,101,200
Counties Reporting -- 3
USDA, NASS, California Field Office 9
California County Agricultural
Commissioners' Data, 2008
Price Per
UnitTotal Value
COUNTY AGRICULTURAL COMMISSIONERS' DATA, CALENDAR YEAR 2008
CountyHarvested
Acreage
Yield Per
AcreProduction
Dollars
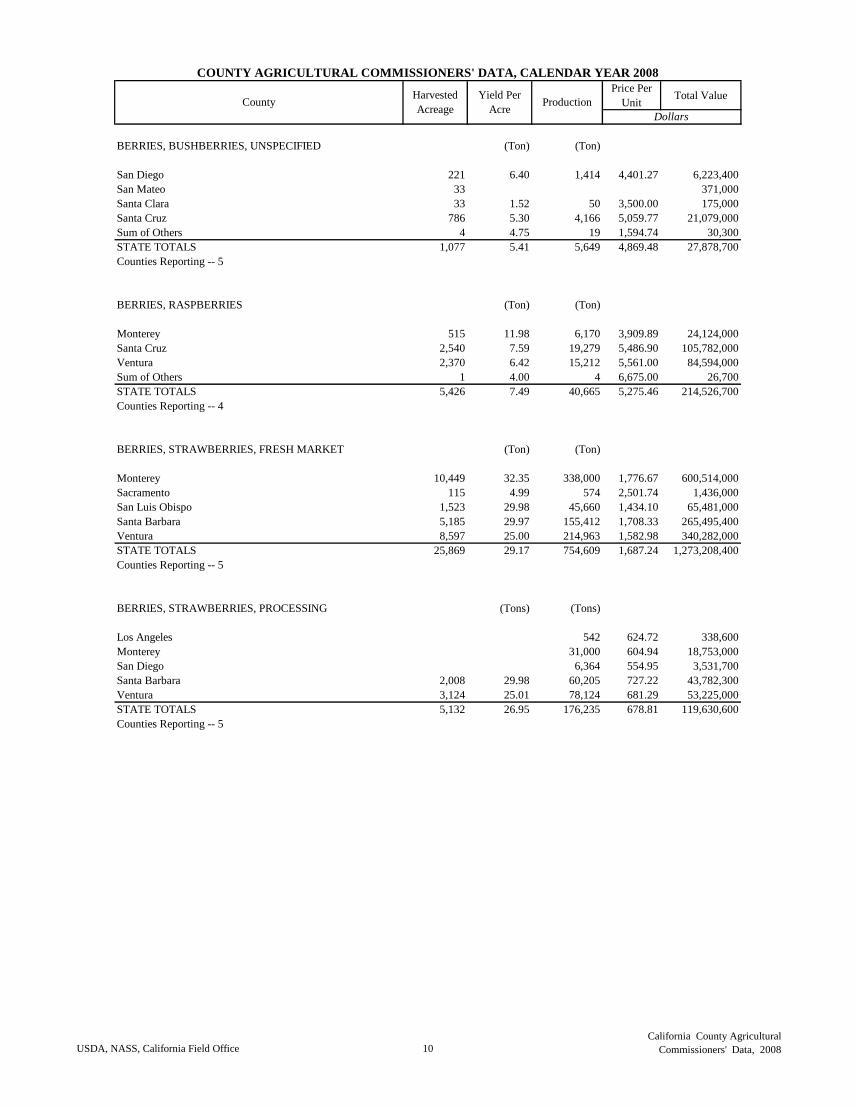
BERRIES, BUSHBERRIES, UNSPECIFIED (Ton) (Ton)
San Diego 221 6.40 1,414 4,401.27 6,223,400
San Mateo 33 371,000
Santa Clara 33 1.52 50 3,500.00 175,000
Santa Cruz 786 5.30 4,166 5,059.77 21,079,000
Sum of Others 4 4.75 19 1,594.74 30,300
STATE TOTALS 1,077 5.41 5,649 4,869.48 27,878,700
Counties Reporting -- 5
BERRIES, RASPBERRIES (Ton) (Ton)
Monterey 515 11.98 6,170 3,909.89 24,124,000
Santa Cruz 2,540 7.59 19,279 5,486.90 105,782,000
Ventura 2,370 6.42 15,212 5,561.00 84,594,000
Sum of Others 1 4.00 4 6,675.00 26,700
STATE TOTALS 5,426 7.49 40,665 5,275.46 214,526,700
Counties Reporting -- 4
BERRIES, STRAWBERRIES, FRESH MARKET (Ton) (Ton)
Monterey 10,449 32.35 338,000 1,776.67 600,514,000
Sacramento 115 4.99 574 2,501.74 1,436,000
San Luis Obispo 1,523 29.98 45,660 1,434.10 65,481,000
Santa Barbara 5,185 29.97 155,412 1,708.33 265,495,400
Ventura 8,597 25.00 214,963 1,582.98 340,282,000
STATE TOTALS 25,869 29.17 754,609 1,687.24 1,273,208,400
Counties Reporting -- 5
BERRIES, STRAWBERRIES, PROCESSING (Tons) (Tons)
Los Angeles 542 624.72 338,600
Monterey 31,000 604.94 18,753,000
San Diego 6,364 554.95 3,531,700
Santa Barbara 2,008 29.98 60,205 727.22 43,782,300
Ventura 3,124 25.01 78,124 681.29 53,225,000
STATE TOTALS 5,132 26.95 176,235 678.81 119,630,600
Counties Reporting -- 5
USDA, NASS, California Field Office 10
California County Agricultural
Commissioners' Data, 2008
Price Per
UnitTotal Value
COUNTY AGRICULTURAL COMMISSIONERS' DATA, CALENDAR YEAR 2008
CountyHarvested
Acreage
Yield Per
AcreProduction
Dollars
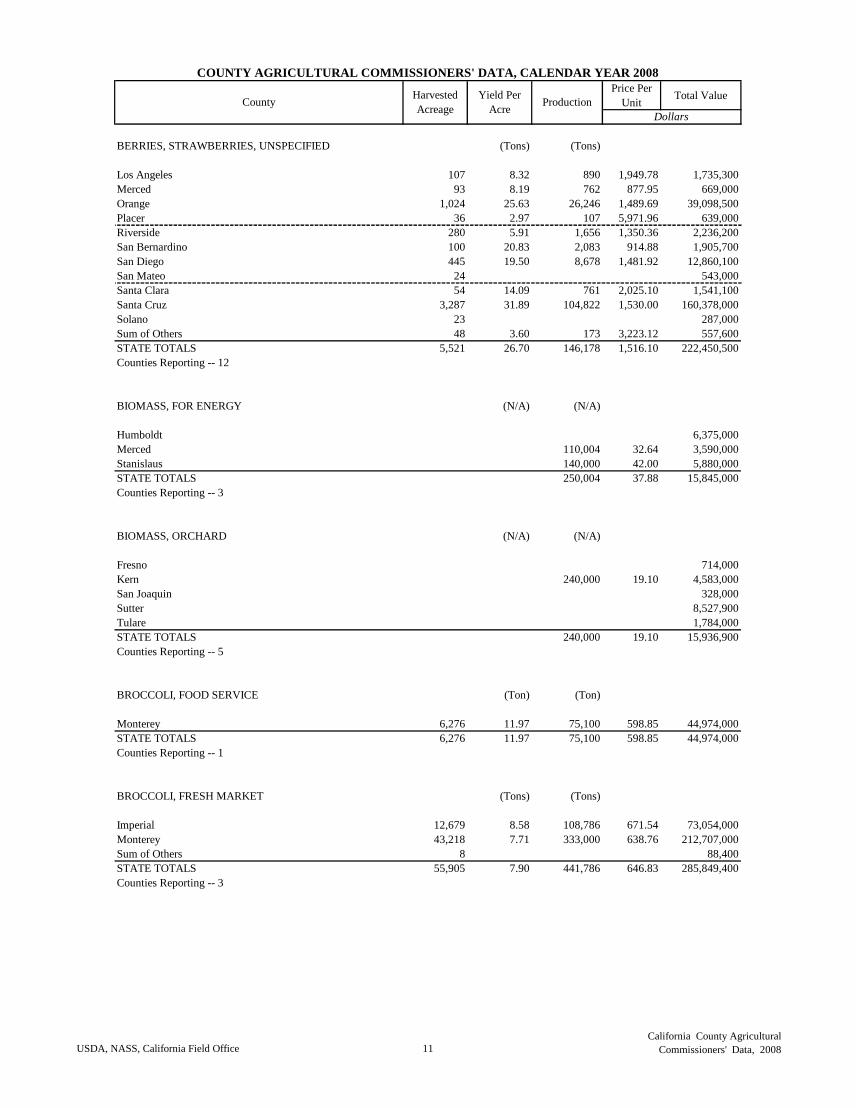
BERRIES, STRAWBERRIES, UNSPECIFIED (Tons) (Tons)
Los Angeles 107 8.32 890 1,949.78 1,735,300
Merced 93 8.19 762 877.95 669,000
Orange 1,024 25.63 26,246 1,489.69 39,098,500
Placer 36 2.97 107 5,971.96 639,000
Riverside 280 5.91 1,656 1,350.36 2,236,200
San Bernardino 100 20.83 2,083 914.88 1,905,700
San Diego 445 19.50 8,678 1,481.92 12,860,100
San Mateo 24 543,000
Santa Clara 54 14.09 761 2,025.10 1,541,100
Santa Cruz 3,287 31.89 104,822 1,530.00 160,378,000
Solano 23 287,000
Sum of Others 48 3.60 173 3,223.12 557,600
STATE TOTALS 5,521 26.70 146,178 1,516.10 222,450,500
Counties Reporting -- 12
BIOMASS, FOR ENERGY (N/A) (N/A)
Humboldt 6,375,000
Merced 110,004 32.64 3,590,000
Stanislaus 140,000 42.00 5,880,000
STATE TOTALS 250,004 37.88 15,845,000
Counties Reporting -- 3
BIOMASS, ORCHARD (N/A) (N/A)
Fresno 714,000
Kern 240,000 19.10 4,583,000
San Joaquin 328,000
Sutter 8,527,900
Tulare 1,784,000
STATE TOTALS 240,000 19.10 15,936,900
Counties Reporting -- 5
BROCCOLI, FOOD SERVICE (Ton) (Ton)
Monterey 6,276 11.97 75,100 598.85 44,974,000
STATE TOTALS 6,276 11.97 75,100 598.85 44,974,000
Counties Reporting -- 1
BROCCOLI, FRESH MARKET (Tons) (Tons)
Imperial 12,679 8.58 108,786 671.54 73,054,000
Monterey 43,218 7.71 333,000 638.76 212,707,000
Sum of Others 8 88,400
STATE TOTALS 55,905 7.90 441,786 646.83 285,849,400
Counties Reporting -- 3
USDA, NASS, California Field Office 11
California County Agricultural
Commissioners' Data, 2008
Price Per
UnitTotal Value
COUNTY AGRICULTURAL COMMISSIONERS' DATA, CALENDAR YEAR 2008
CountyHarvested
Acreage
Yield Per
AcreProduction
Dollars
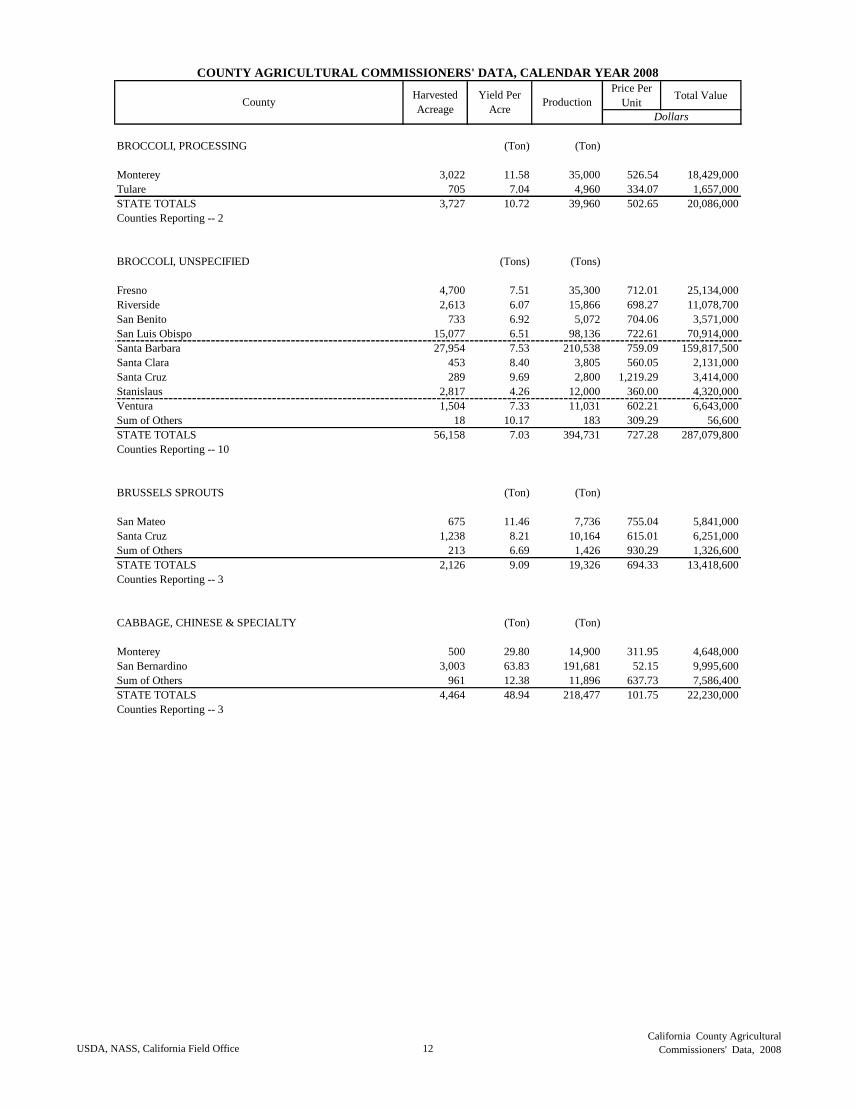
BROCCOLI, PROCESSING (Ton) (Ton)
Monterey 3,022 11.58 35,000 526.54 18,429,000
Tulare 705 7.04 4,960 334.07 1,657,000
STATE TOTALS 3,727 10.72 39,960 502.65 20,086,000
Counties Reporting -- 2
BROCCOLI, UNSPECIFIED (Tons) (Tons)
Fresno 4,700 7.51 35,300 712.01 25,134,000
Riverside 2,613 6.07 15,866 698.27 11,078,700
San Benito 733 6.92 5,072 704.06 3,571,000
San Luis Obispo 15,077 6.51 98,136 722.61 70,914,000
Santa Barbara 27,954 7.53 210,538 759.09 159,817,500
Santa Clara 453 8.40 3,805 560.05 2,131,000
Santa Cruz 289 9.69 2,800 1,219.29 3,414,000
Stanislaus 2,817 4.26 12,000 360.00 4,320,000
Ventura 1,504 7.33 11,031 602.21 6,643,000
Sum of Others 18 10.17 183 309.29 56,600
STATE TOTALS 56,158 7.03 394,731 727.28 287,079,800
Counties Reporting -- 10
BRUSSELS SPROUTS (Ton) (Ton)
San Mateo 675 11.46 7,736 755.04 5,841,000
Santa Cruz 1,238 8.21 10,164 615.01 6,251,000
Sum of Others 213 6.69 1,426 930.29 1,326,600
STATE TOTALS 2,126 9.09 19,326 694.33 13,418,600
Counties Reporting -- 3
CABBAGE, CHINESE & SPECIALTY (Ton) (Ton)
Monterey 500 29.80 14,900 311.95 4,648,000
San Bernardino 3,003 63.83 191,681 52.15 9,995,600
Sum of Others 961 12.38 11,896 637.73 7,586,400
STATE TOTALS 4,464 48.94 218,477 101.75 22,230,000
Counties Reporting -- 3
USDA, NASS, California Field Office 12
California County Agricultural
Commissioners' Data, 2008
Price Per
UnitTotal Value
COUNTY AGRICULTURAL COMMISSIONERS' DATA, CALENDAR YEAR 2008
CountyHarvested
Acreage
Yield Per
AcreProduction
Dollars
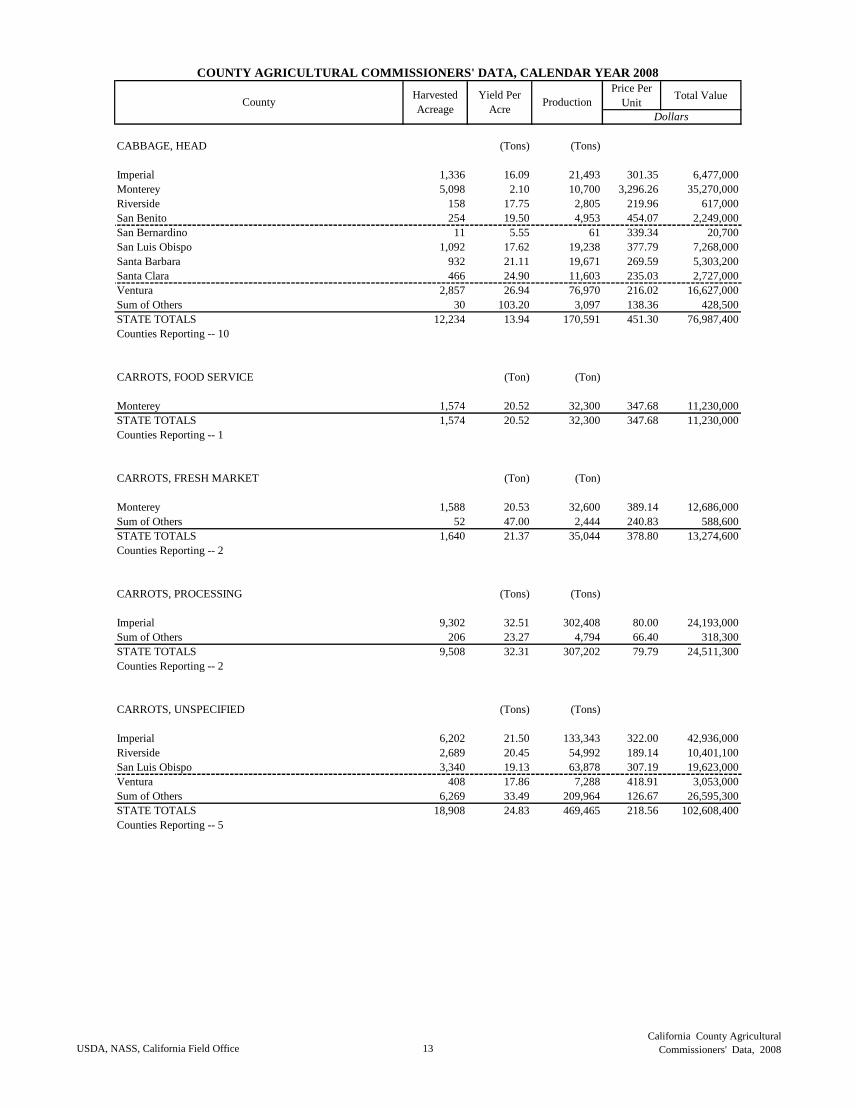
CABBAGE, HEAD (Tons) (Tons)
Imperial 1,336 16.09 21,493 301.35 6,477,000
Monterey 5,098 2.10 10,700 3,296.26 35,270,000
Riverside 158 17.75 2,805 219.96 617,000
San Benito 254 19.50 4,953 454.07 2,249,000
San Bernardino 11 5.55 61 339.34 20,700
San Luis Obispo 1,092 17.62 19,238 377.79 7,268,000
Santa Barbara 932 21.11 19,671 269.59 5,303,200
Santa Clara 466 24.90 11,603 235.03 2,727,000
Ventura 2,857 26.94 76,970 216.02 16,627,000
Sum of Others 30 103.20 3,097 138.36 428,500
STATE TOTALS 12,234 13.94 170,591 451.30 76,987,400
Counties Reporting -- 10
CARROTS, FOOD SERVICE (Ton) (Ton)
Monterey 1,574 20.52 32,300 347.68 11,230,000
STATE TOTALS 1,574 20.52 32,300 347.68 11,230,000
Counties Reporting -- 1
CARROTS, FRESH MARKET (Ton) (Ton)
Monterey 1,588 20.53 32,600 389.14 12,686,000
Sum of Others 52 47.00 2,444 240.83 588,600
STATE TOTALS 1,640 21.37 35,044 378.80 13,274,600
Counties Reporting -- 2
CARROTS, PROCESSING (Tons) (Tons)
Imperial 9,302 32.51 302,408 80.00 24,193,000
Sum of Others 206 23.27 4,794 66.40 318,300
STATE TOTALS 9,508 32.31 307,202 79.79 24,511,300
Counties Reporting -- 2
CARROTS, UNSPECIFIED (Tons) (Tons)
Imperial 6,202 21.50 133,343 322.00 42,936,000
Riverside 2,689 20.45 54,992 189.14 10,401,100
San Luis Obispo 3,340 19.13 63,878 307.19 19,623,000
Ventura 408 17.86 7,288 418.91 3,053,000
Sum of Others 6,269 33.49 209,964 126.67 26,595,300
STATE TOTALS 18,908 24.83 469,465 218.56 102,608,400
Counties Reporting -- 5
USDA, NASS, California Field Office 13
California County Agricultural
Commissioners' Data, 2008
Price Per
UnitTotal Value
COUNTY AGRICULTURAL COMMISSIONERS' DATA, CALENDAR YEAR 2008
CountyHarvested
Acreage
Yield Per
AcreProduction
Dollars
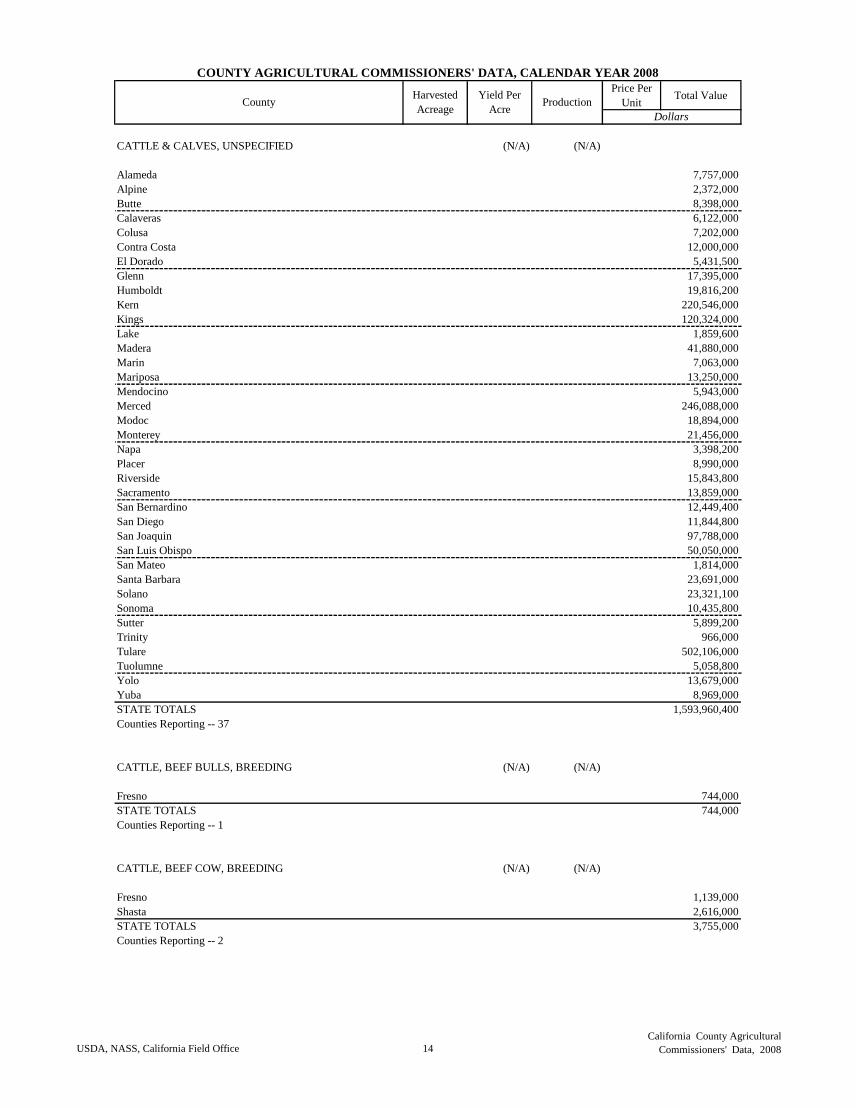
CATTLE & CALVES, UNSPECIFIED (N/A) (N/A)
Alameda 7,757,000
Alpine 2,372,000
Butte 8,398,000
Calaveras 6,122,000
Colusa 7,202,000
Contra Costa 12,000,000
El Dorado 5,431,500
Glenn 17,395,000
Humboldt 19,816,200
Kern 220,546,000
Kings 120,324,000
Lake 1,859,600
Madera 41,880,000
Marin 7,063,000
Mariposa 13,250,000
Mendocino 5,943,000
Merced 246,088,000
Modoc 18,894,000
Monterey 21,456,000
Napa 3,398,200
Placer 8,990,000
Riverside 15,843,800
Sacramento 13,859,000
San Bernardino 12,449,400
San Diego 11,844,800
San Joaquin 97,788,000
San Luis Obispo 50,050,000
San Mateo 1,814,000
Santa Barbara 23,691,000
Solano 23,321,100
Sonoma 10,435,800
Sutter 5,899,200
Trinity 966,000
Tulare 502,106,000
Tuolumne 5,058,800
Yolo 13,679,000
Yuba 8,969,000
STATE TOTALS 1,593,960,400
Counties Reporting -- 37
CATTLE, BEEF BULLS, BREEDING (N/A) (N/A)
Fresno 744,000
STATE TOTALS 744,000
Counties Reporting -- 1
CATTLE, BEEF COW, BREEDING (N/A) (N/A)
Fresno 1,139,000
Shasta 2,616,000
STATE TOTALS 3,755,000
Counties Reporting -- 2
USDA, NASS, California Field Office 14
California County Agricultural
Commissioners' Data, 2008
Price Per
UnitTotal Value
COUNTY AGRICULTURAL COMMISSIONERS' DATA, CALENDAR YEAR 2008
CountyHarvested
Acreage
Yield Per
AcreProduction
Dollars
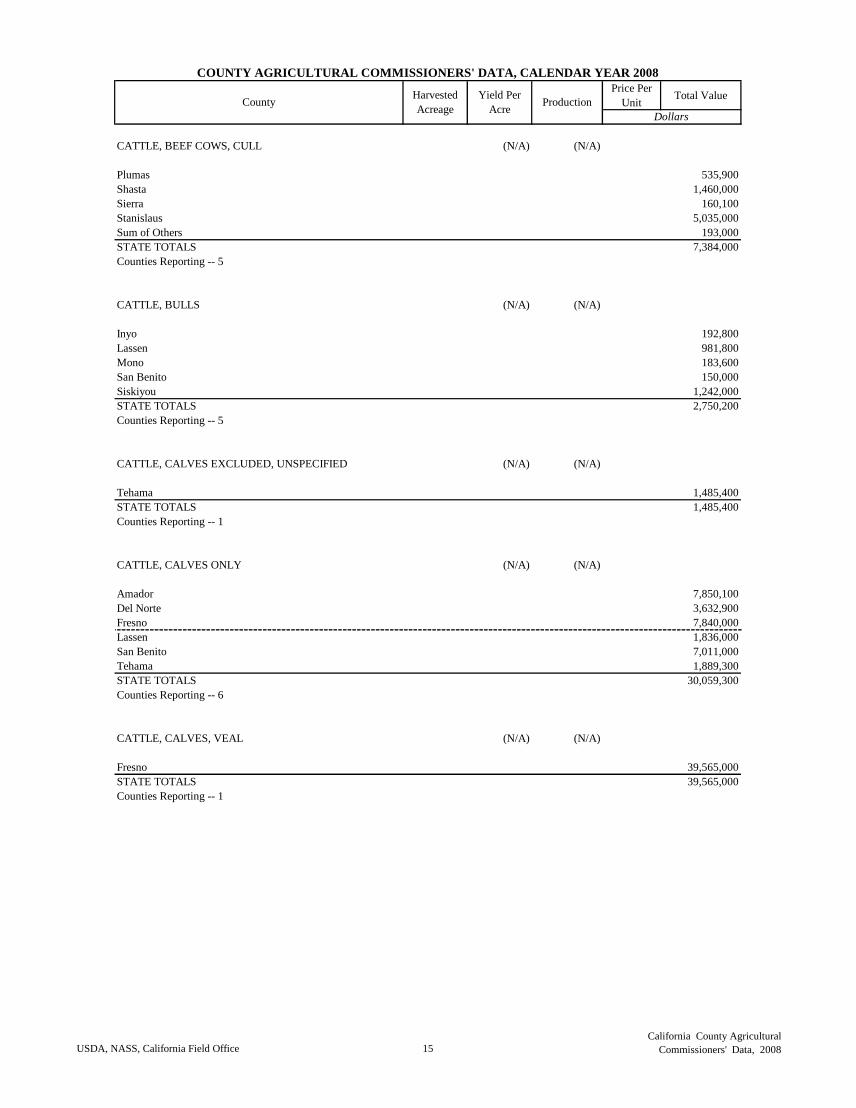
CATTLE, BEEF COWS, CULL (N/A) (N/A)
Plumas 535,900
Shasta 1,460,000
Sierra 160,100
Stanislaus 5,035,000
Sum of Others 193,000
STATE TOTALS 7,384,000
Counties Reporting -- 5
CATTLE, BULLS (N/A) (N/A)
Inyo 192,800
Lassen 981,800
Mono 183,600
San Benito 150,000
Siskiyou 1,242,000
STATE TOTALS 2,750,200
Counties Reporting -- 5
CATTLE, CALVES EXCLUDED, UNSPECIFIED (N/A) (N/A)
Tehama 1,485,400
STATE TOTALS 1,485,400
Counties Reporting -- 1
CATTLE, CALVES ONLY (N/A) (N/A)
Amador 7,850,100
Del Norte 3,632,900
Fresno 7,840,000
Lassen 1,836,000
San Benito 7,011,000
Tehama 1,889,300
STATE TOTALS 30,059,300
Counties Reporting -- 6
CATTLE, CALVES, VEAL (N/A) (N/A)
Fresno 39,565,000
STATE TOTALS 39,565,000
Counties Reporting -- 1
USDA, NASS, California Field Office 15
California County Agricultural
Commissioners' Data, 2008
Price Per
UnitTotal Value
COUNTY AGRICULTURAL COMMISSIONERS' DATA, CALENDAR YEAR 2008
CountyHarvested
Acreage
Yield Per
AcreProduction
Dollars
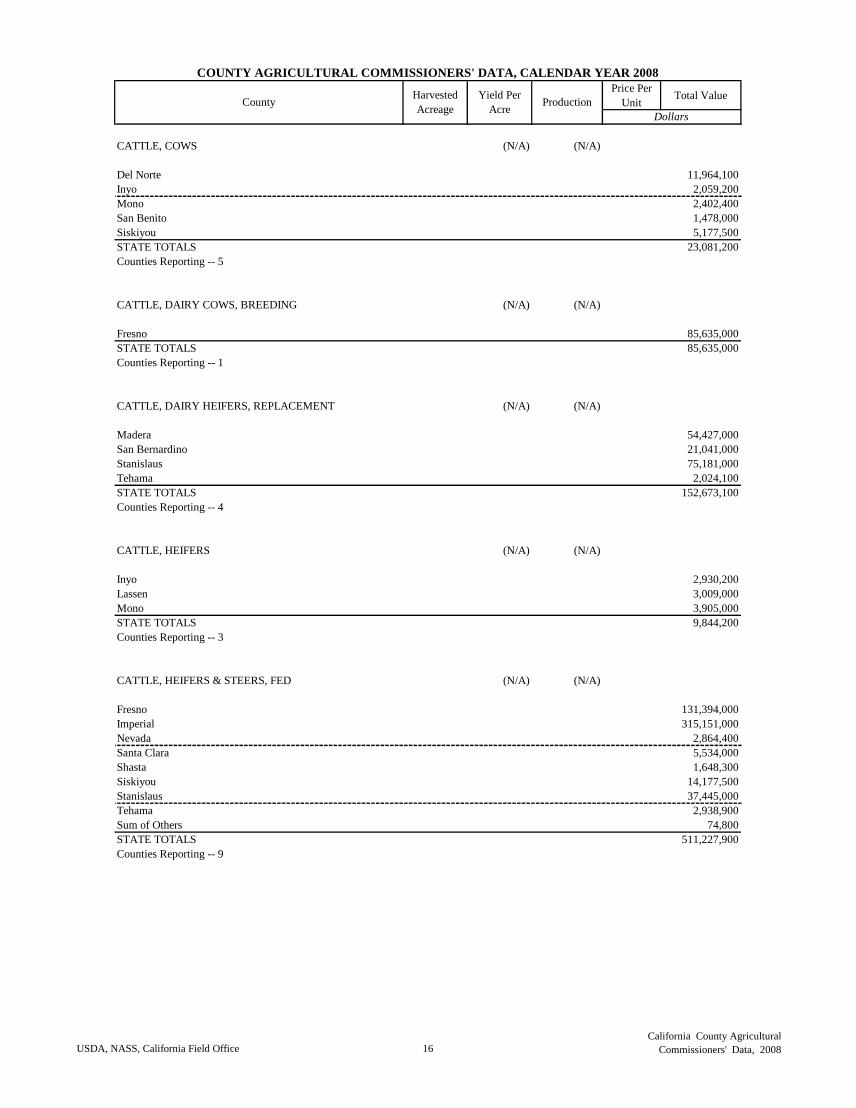
CATTLE, COWS (N/A) (N/A)
Del Norte 11,964,100
Inyo 2,059,200
Mono 2,402,400
San Benito 1,478,000
Siskiyou 5,177,500
STATE TOTALS 23,081,200
Counties Reporting -- 5
CATTLE, DAIRY COWS, BREEDING (N/A) (N/A)
Fresno 85,635,000
STATE TOTALS 85,635,000
Counties Reporting -- 1
CATTLE, DAIRY HEIFERS, REPLACEMENT (N/A) (N/A)
Madera 54,427,000
San Bernardino 21,041,000
Stanislaus 75,181,000
Tehama 2,024,100
STATE TOTALS 152,673,100
Counties Reporting -- 4
CATTLE, HEIFERS (N/A) (N/A)
Inyo 2,930,200
Lassen 3,009,000
Mono 3,905,000
STATE TOTALS 9,844,200
Counties Reporting -- 3
CATTLE, HEIFERS & STEERS, FED (N/A) (N/A)
Fresno 131,394,000
Imperial 315,151,000
Nevada 2,864,400
Santa Clara 5,534,000
Shasta 1,648,300
Siskiyou 14,177,500
Stanislaus 37,445,000
Tehama 2,938,900
Sum of Others 74,800
STATE TOTALS 511,227,900
Counties Reporting -- 9
USDA, NASS, California Field Office 16
California County Agricultural
Commissioners' Data, 2008
Price Per
UnitTotal Value
COUNTY AGRICULTURAL COMMISSIONERS' DATA, CALENDAR YEAR 2008
CountyHarvested
Acreage
Yield Per
AcreProduction
Dollars
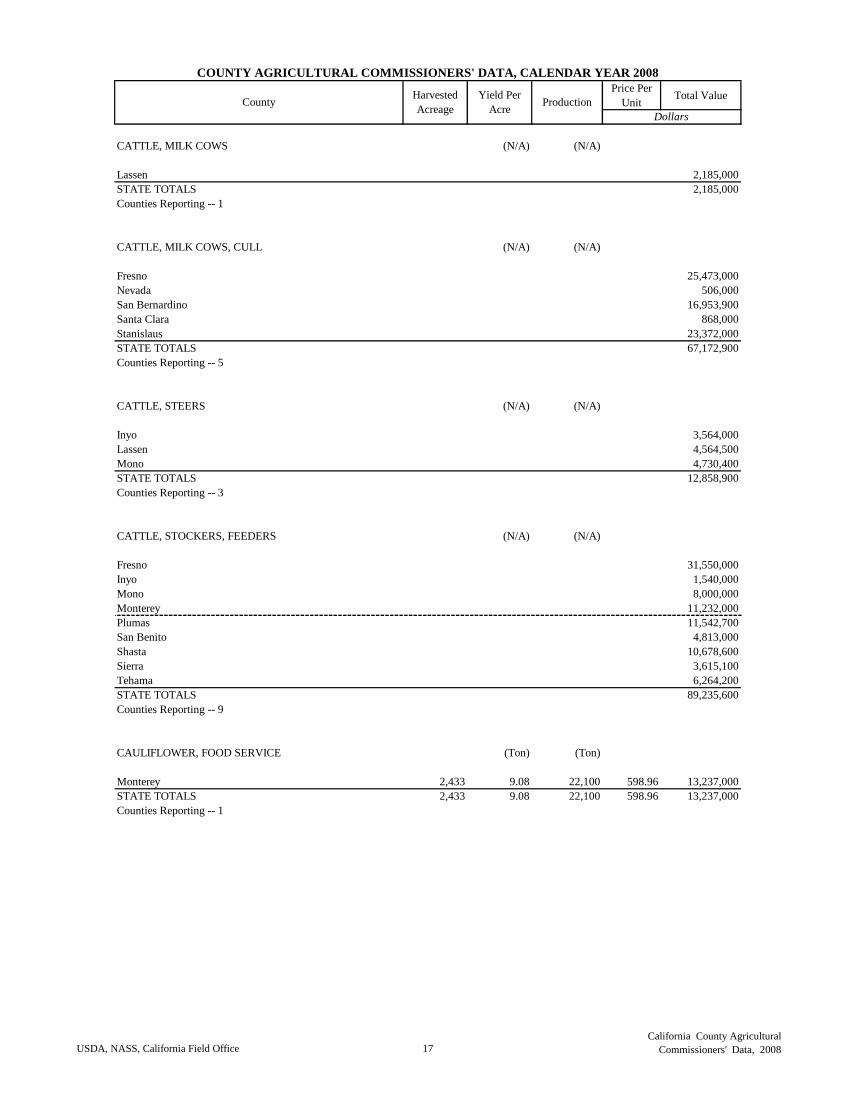
CATTLE, MILK COWS (N/A) (N/A)
Lassen 2,185,000
STATE TOTALS 2,185,000
Counties Reporting -- 1
CATTLE, MILK COWS, CULL (N/A) (N/A)
Fresno 25,473,000
Nevada 506,000
San Bernardino 16,953,900
Santa Clara 868,000
Stanislaus 23,372,000
STATE TOTALS 67,172,900
Counties Reporting -- 5
CATTLE, STEERS (N/A) (N/A)
Inyo 3,564,000
Lassen 4,564,500
Mono 4,730,400
STATE TOTALS 12,858,900
Counties Reporting -- 3
CATTLE, STOCKERS, FEEDERS (N/A) (N/A)
Fresno 31,550,000
Inyo 1,540,000
Mono 8,000,000
Monterey 11,232,000
Plumas 11,542,700
San Benito 4,813,000
Shasta 10,678,600
Sierra 3,615,100
Tehama 6,264,200
STATE TOTALS 89,235,600
Counties Reporting -- 9
CAULIFLOWER, FOOD SERVICE (Ton) (Ton)
Monterey 2,433 9.08 22,100 598.96 13,237,000
STATE TOTALS 2,433 9.08 22,100 598.96 13,237,000
Counties Reporting -- 1
USDA, NASS, California Field Office 17
California County Agricultural
Commissioners' Data, 2008
Price Per
UnitTotal Value
COUNTY AGRICULTURAL COMMISSIONERS' DATA, CALENDAR YEAR 2008
CountyHarvested
Acreage
Yield Per
AcreProduction
Dollars
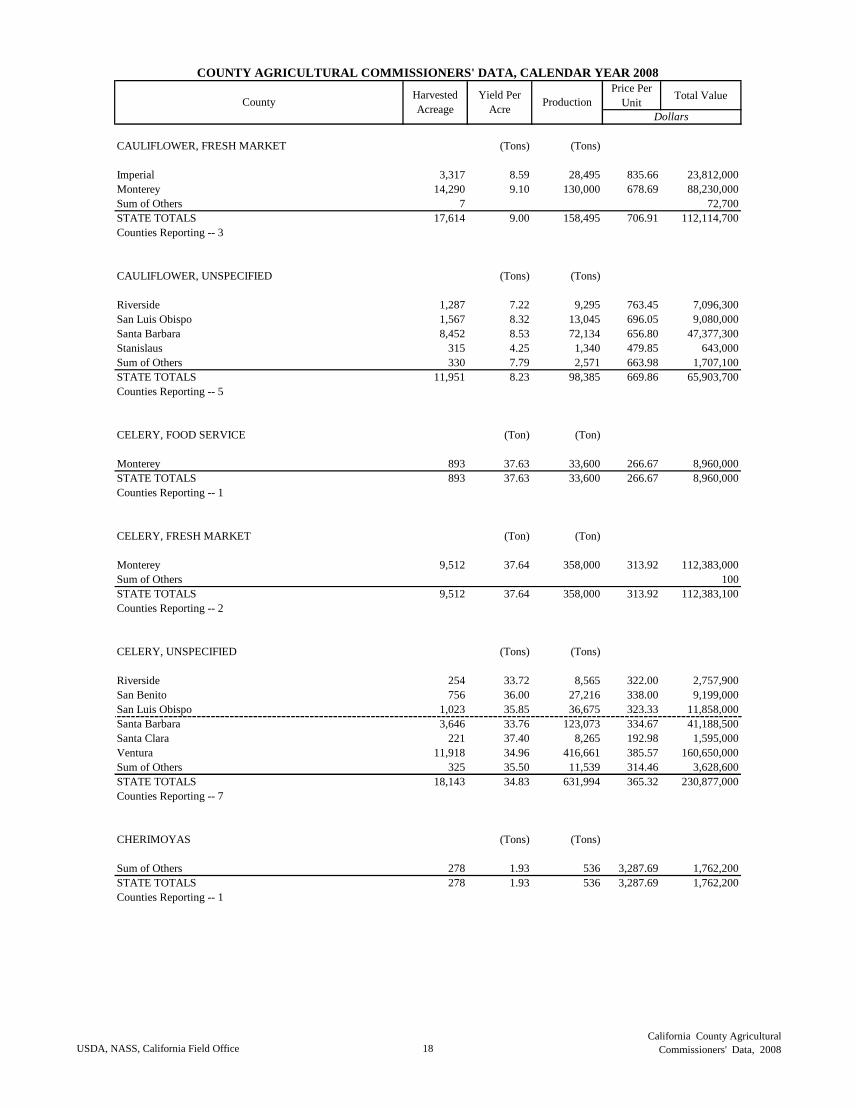
CAULIFLOWER, FRESH MARKET (Tons) (Tons)
Imperial 3,317 8.59 28,495 835.66 23,812,000
Monterey 14,290 9.10 130,000 678.69 88,230,000
Sum of Others 7 72,700
STATE TOTALS 17,614 9.00 158,495 706.91 112,114,700
Counties Reporting -- 3
CAULIFLOWER, UNSPECIFIED (Tons) (Tons)
Riverside 1,287 7.22 9,295 763.45 7,096,300
San Luis Obispo 1,567 8.32 13,045 696.05 9,080,000
Santa Barbara 8,452 8.53 72,134 656.80 47,377,300
Stanislaus 315 4.25 1,340 479.85 643,000
Sum of Others 330 7.79 2,571 663.98 1,707,100
STATE TOTALS 11,951 8.23 98,385 669.86 65,903,700
Counties Reporting -- 5
CELERY, FOOD SERVICE (Ton) (Ton)
Monterey 893 37.63 33,600 266.67 8,960,000
STATE TOTALS 893 37.63 33,600 266.67 8,960,000
Counties Reporting -- 1
CELERY, FRESH MARKET (Ton) (Ton)
Monterey 9,512 37.64 358,000 313.92 112,383,000
Sum of Others 100
STATE TOTALS 9,512 37.64 358,000 313.92 112,383,100
Counties Reporting -- 2
CELERY, UNSPECIFIED (Tons) (Tons)
Riverside 254 33.72 8,565 322.00 2,757,900
San Benito 756 36.00 27,216 338.00 9,199,000
San Luis Obispo 1,023 35.85 36,675 323.33 11,858,000
Santa Barbara 3,646 33.76 123,073 334.67 41,188,500
Santa Clara 221 37.40 8,265 192.98 1,595,000
Ventura 11,918 34.96 416,661 385.57 160,650,000
Sum of Others 325 35.50 11,539 314.46 3,628,600
STATE TOTALS 18,143 34.83 631,994 365.32 230,877,000
Counties Reporting -- 7
CHERIMOYAS (Tons) (Tons)
Sum of Others 278 1.93 536 3,287.69 1,762,200
STATE TOTALS 278 1.93 536 3,287.69 1,762,200
Counties Reporting -- 1
USDA, NASS, California Field Office 18
California County Agricultural
Commissioners' Data, 2008
Price Per
UnitTotal Value
COUNTY AGRICULTURAL COMMISSIONERS' DATA, CALENDAR YEAR 2008
CountyHarvested
Acreage
Yield Per
AcreProduction
Dollars
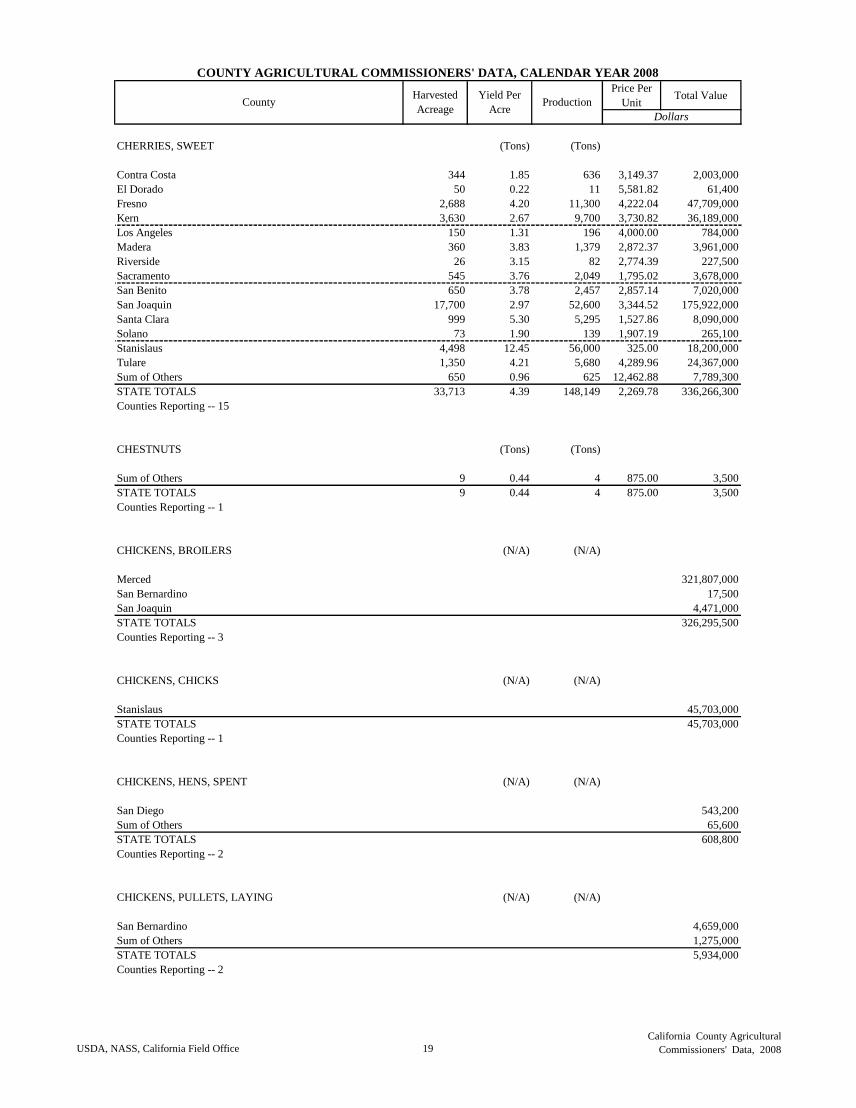
CHERRIES, SWEET (Tons) (Tons)
Contra Costa 344 1.85 636 3,149.37 2,003,000
El Dorado 50 0.22 11 5,581.82 61,400
Fresno 2,688 4.20 11,300 4,222.04 47,709,000
Kern 3,630 2.67 9,700 3,730.82 36,189,000
Los Angeles 150 1.31 196 4,000.00 784,000
Madera 360 3.83 1,379 2,872.37 3,961,000
Riverside 26 3.15 82 2,774.39 227,500
Sacramento 545 3.76 2,049 1,795.02 3,678,000
San Benito 650 3.78 2,457 2,857.14 7,020,000
San Joaquin 17,700 2.97 52,600 3,344.52 175,922,000
Santa Clara 999 5.30 5,295 1,527.86 8,090,000
Solano 73 1.90 139 1,907.19 265,100
Stanislaus 4,498 12.45 56,000 325.00 18,200,000
Tulare 1,350 4.21 5,680 4,289.96 24,367,000
Sum of Others 650 0.96 625 12,462.88 7,789,300
STATE TOTALS 33,713 4.39 148,149 2,269.78 336,266,300
Counties Reporting -- 15
CHESTNUTS (Tons) (Tons)
Sum of Others 9 0.44 4 875.00 3,500
STATE TOTALS 9 0.44 4 875.00 3,500
Counties Reporting -- 1
CHICKENS, BROILERS (N/A) (N/A)
Merced 321,807,000
San Bernardino 17,500
San Joaquin 4,471,000
STATE TOTALS 326,295,500
Counties Reporting -- 3
CHICKENS, CHICKS (N/A) (N/A)
Stanislaus 45,703,000
STATE TOTALS 45,703,000
Counties Reporting -- 1
CHICKENS, HENS, SPENT (N/A) (N/A)
San Diego 543,200
Sum of Others 65,600
STATE TOTALS 608,800
Counties Reporting -- 2
CHICKENS, PULLETS, LAYING (N/A) (N/A)
San Bernardino 4,659,000
Sum of Others 1,275,000
STATE TOTALS 5,934,000
Counties Reporting -- 2
USDA, NASS, California Field Office 19
California County Agricultural
Commissioners' Data, 2008
Price Per
UnitTotal Value
COUNTY AGRICULTURAL COMMISSIONERS' DATA, CALENDAR YEAR 2008
CountyHarvested
Acreage
Yield Per
AcreProduction
Dollars
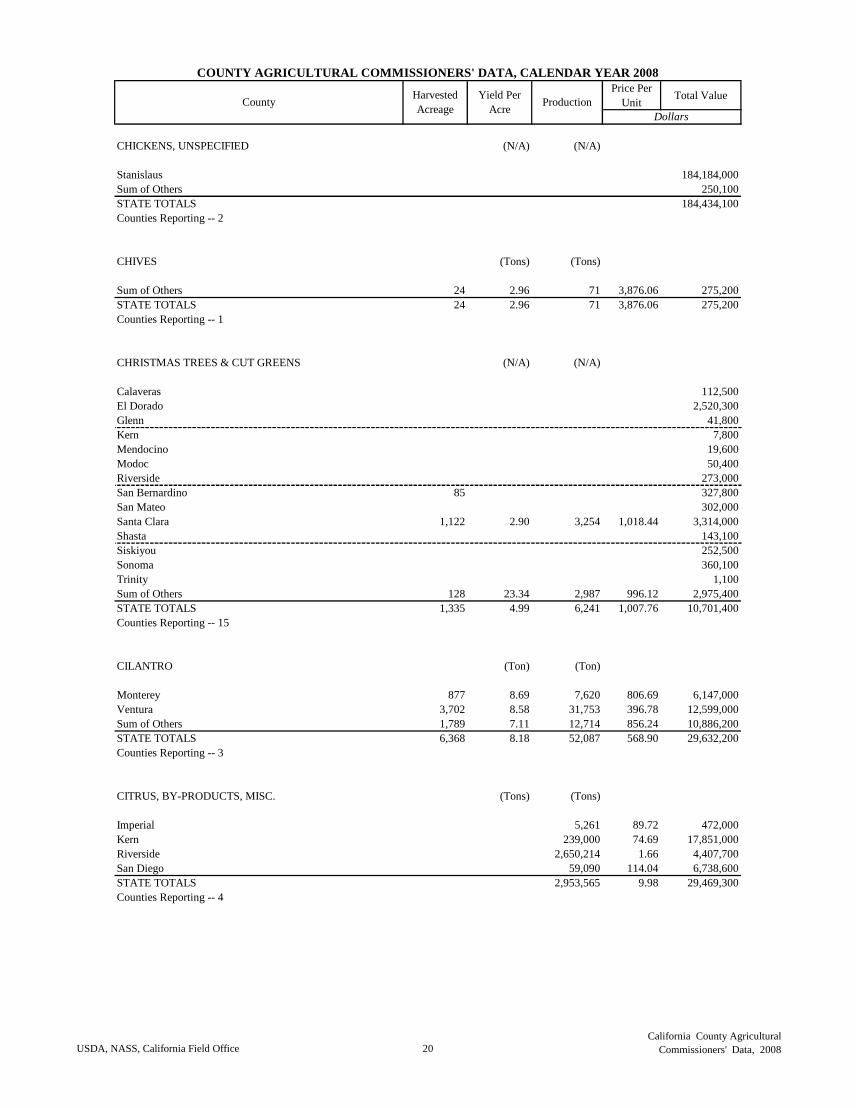
CHICKENS, UNSPECIFIED (N/A) (N/A)
Stanislaus 184,184,000
Sum of Others 250,100
STATE TOTALS 184,434,100
Counties Reporting -- 2
CHIVES (Tons) (Tons)
Sum of Others 24 2.96 71 3,876.06 275,200
STATE TOTALS 24 2.96 71 3,876.06 275,200
Counties Reporting -- 1
CHRISTMAS TREES & CUT GREENS (N/A) (N/A)
Calaveras 112,500
El Dorado 2,520,300
Glenn 41,800
Kern 7,800
Mendocino 19,600
Modoc 50,400
Riverside 273,000
San Bernardino 85 327,800
San Mateo 302,000
Santa Clara 1,122 2.90 3,254 1,018.44 3,314,000
Shasta 143,100
Siskiyou 252,500
Sonoma 360,100
Trinity 1,100
Sum of Others 128 23.34 2,987 996.12 2,975,400
STATE TOTALS 1,335 4.99 6,241 1,007.76 10,701,400
Counties Reporting -- 15
CILANTRO (Ton) (Ton)
Monterey 877 8.69 7,620 806.69 6,147,000
Ventura 3,702 8.58 31,753 396.78 12,599,000
Sum of Others 1,789 7.11 12,714 856.24 10,886,200
STATE TOTALS 6,368 8.18 52,087 568.90 29,632,200
Counties Reporting -- 3
CITRUS, BY-PRODUCTS, MISC. (Tons) (Tons)
Imperial 5,261 89.72 472,000
Kern 239,000 74.69 17,851,000
Riverside 2,650,214 1.66 4,407,700
San Diego 59,090 114.04 6,738,600
STATE TOTALS 2,953,565 9.98 29,469,300
Counties Reporting -- 4
USDA, NASS, California Field Office 20
California County Agricultural
Commissioners' Data, 2008
Price Per
UnitTotal Value
COUNTY AGRICULTURAL COMMISSIONERS' DATA, CALENDAR YEAR 2008
CountyHarvested
Acreage
Yield Per
AcreProduction
Dollars
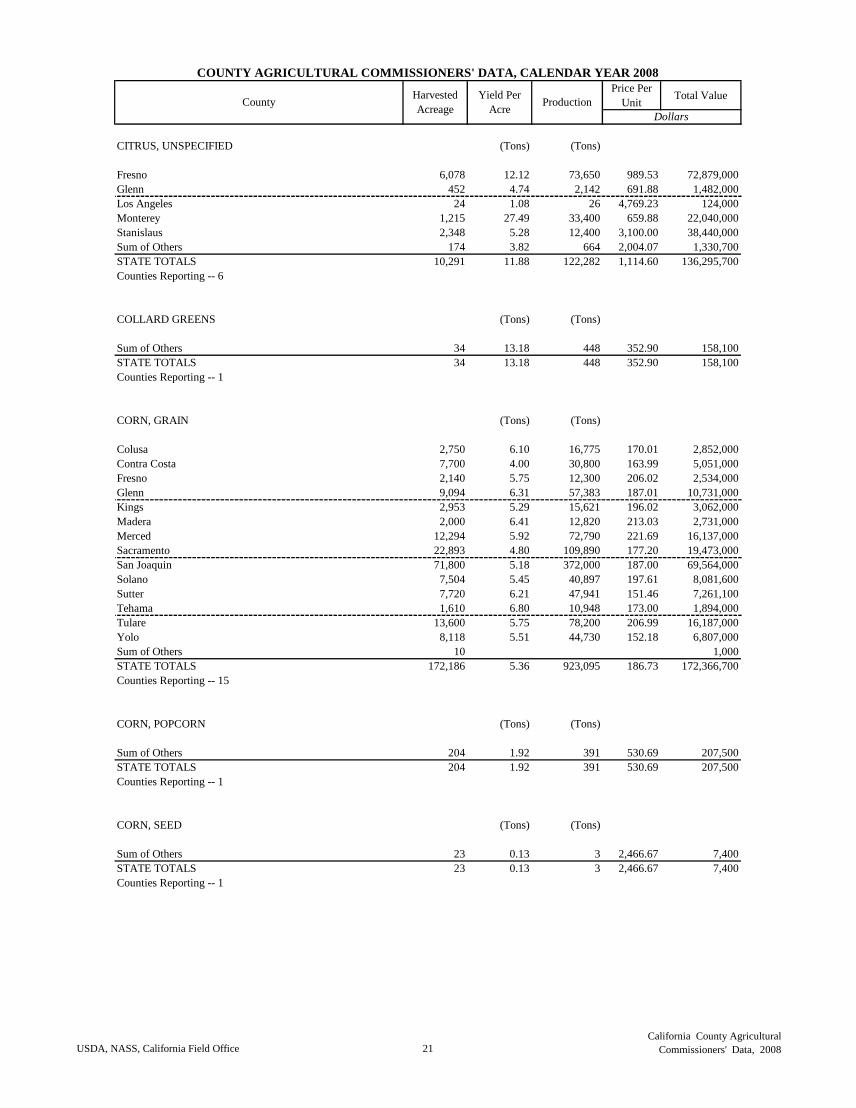
CITRUS, UNSPECIFIED (Tons) (Tons)
Fresno 6,078 12.12 73,650 989.53 72,879,000
Glenn 452 4.74 2,142 691.88 1,482,000
Los Angeles 24 1.08 26 4,769.23 124,000
Monterey 1,215 27.49 33,400 659.88 22,040,000
Stanislaus 2,348 5.28 12,400 3,100.00 38,440,000
Sum of Others 174 3.82 664 2,004.07 1,330,700
STATE TOTALS 10,291 11.88 122,282 1,114.60 136,295,700
Counties Reporting -- 6
COLLARD GREENS (Tons) (Tons)
Sum of Others 34 13.18 448 352.90 158,100
STATE TOTALS 34 13.18 448 352.90 158,100
Counties Reporting -- 1
CORN, GRAIN (Tons) (Tons)
Colusa 2,750 6.10 16,775 170.01 2,852,000
Contra Costa 7,700 4.00 30,800 163.99 5,051,000
Fresno 2,140 5.75 12,300 206.02 2,534,000
Glenn 9,094 6.31 57,383 187.01 10,731,000
Kings 2,953 5.29 15,621 196.02 3,062,000
Madera 2,000 6.41 12,820 213.03 2,731,000
Merced 12,294 5.92 72,790 221.69 16,137,000
Sacramento 22,893 4.80 109,890 177.20 19,473,000
San Joaquin 71,800 5.18 372,000 187.00 69,564,000
Solano 7,504 5.45 40,897 197.61 8,081,600
Sutter 7,720 6.21 47,941 151.46 7,261,100
Tehama 1,610 6.80 10,948 173.00 1,894,000
Tulare 13,600 5.75 78,200 206.99 16,187,000
Yolo 8,118 5.51 44,730 152.18 6,807,000
Sum of Others 10 1,000
STATE TOTALS 172,186 5.36 923,095 186.73 172,366,700
Counties Reporting -- 15
CORN, POPCORN (Tons) (Tons)
Sum of Others 204 1.92 391 530.69 207,500
STATE TOTALS 204 1.92 391 530.69 207,500
Counties Reporting -- 1
CORN, SEED (Tons) (Tons)
Sum of Others 23 0.13 3 2,466.67 7,400
STATE TOTALS 23 0.13 3 2,466.67 7,400
Counties Reporting -- 1
USDA, NASS, California Field Office 21
California County Agricultural
Commissioners' Data, 2008
Price Per
UnitTotal Value
COUNTY AGRICULTURAL COMMISSIONERS' DATA, CALENDAR YEAR 2008
CountyHarvested
Acreage
Yield Per
AcreProduction
Dollars
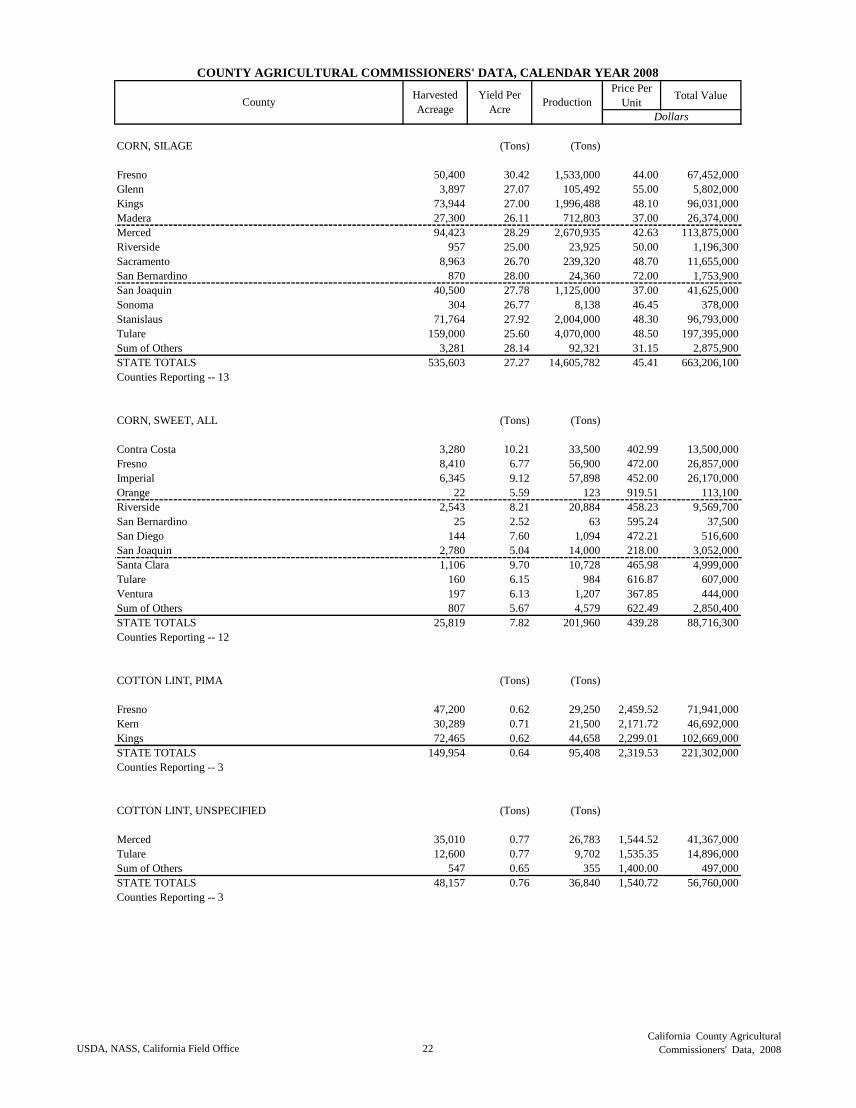
CORN, SILAGE (Tons) (Tons)
Fresno 50,400 30.42 1,533,000 44.00 67,452,000
Glenn 3,897 27.07 105,492 55.00 5,802,000
Kings 73,944 27.00 1,996,488 48.10 96,031,000
Madera 27,300 26.11 712,803 37.00 26,374,000
Merced 94,423 28.29 2,670,935 42.63 113,875,000
Riverside 957 25.00 23,925 50.00 1,196,300
Sacramento 8,963 26.70 239,320 48.70 11,655,000
San Bernardino 870 28.00 24,360 72.00 1,753,900
San Joaquin 40,500 27.78 1,125,000 37.00 41,625,000
Sonoma 304 26.77 8,138 46.45 378,000
Stanislaus 71,764 27.92 2,004,000 48.30 96,793,000
Tulare 159,000 25.60 4,070,000 48.50 197,395,000
Sum of Others 3,281 28.14 92,321 31.15 2,875,900
STATE TOTALS 535,603 27.27 14,605,782 45.41 663,206,100
Counties Reporting -- 13
CORN, SWEET, ALL (Tons) (Tons)
Contra Costa 3,280 10.21 33,500 402.99 13,500,000
Fresno 8,410 6.77 56,900 472.00 26,857,000
Imperial 6,345 9.12 57,898 452.00 26,170,000
Orange 22 5.59 123 919.51 113,100
Riverside 2,543 8.21 20,884 458.23 9,569,700
San Bernardino 25 2.52 63 595.24 37,500
San Diego 144 7.60 1,094 472.21 516,600
San Joaquin 2,780 5.04 14,000 218.00 3,052,000
Santa Clara 1,106 9.70 10,728 465.98 4,999,000
Tulare 160 6.15 984 616.87 607,000
Ventura 197 6.13 1,207 367.85 444,000
Sum of Others 807 5.67 4,579 622.49 2,850,400
STATE TOTALS 25,819 7.82 201,960 439.28 88,716,300
Counties Reporting -- 12
COTTON LINT, PIMA (Tons) (Tons)
Fresno 47,200 0.62 29,250 2,459.52 71,941,000
Kern 30,289 0.71 21,500 2,171.72 46,692,000
Kings 72,465 0.62 44,658 2,299.01 102,669,000
STATE TOTALS 149,954 0.64 95,408 2,319.53 221,302,000
Counties Reporting -- 3
COTTON LINT, UNSPECIFIED (Tons) (Tons)
Merced 35,010 0.77 26,783 1,544.52 41,367,000
Tulare 12,600 0.77 9,702 1,535.35 14,896,000
Sum of Others 547 0.65 355 1,400.00 497,000
STATE TOTALS 48,157 0.76 36,840 1,540.72 56,760,000
Counties Reporting -- 3
USDA, NASS, California Field Office 22
California County Agricultural
Commissioners' Data, 2008
Price Per
UnitTotal Value
COUNTY AGRICULTURAL COMMISSIONERS' DATA, CALENDAR YEAR 2008
CountyHarvested
Acreage
Yield Per
AcreProduction
Dollars
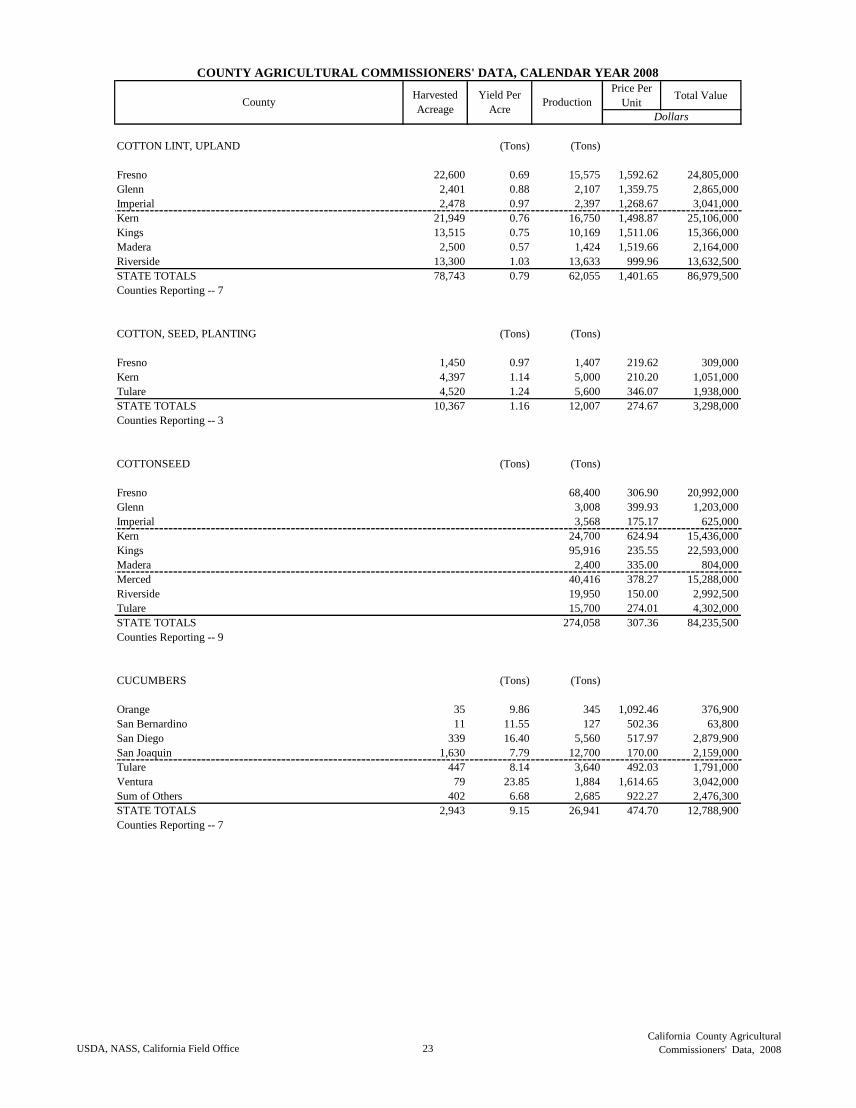
COTTON LINT, UPLAND (Tons) (Tons)
Fresno 22,600 0.69 15,575 1,592.62 24,805,000
Glenn 2,401 0.88 2,107 1,359.75 2,865,000
Imperial 2,478 0.97 2,397 1,268.67 3,041,000
Kern 21,949 0.76 16,750 1,498.87 25,106,000
Kings 13,515 0.75 10,169 1,511.06 15,366,000
Madera 2,500 0.57 1,424 1,519.66 2,164,000
Riverside 13,300 1.03 13,633 999.96 13,632,500
STATE TOTALS 78,743 0.79 62,055 1,401.65 86,979,500
Counties Reporting -- 7
COTTON, SEED, PLANTING (Tons) (Tons)
Fresno 1,450 0.97 1,407 219.62 309,000
Kern 4,397 1.14 5,000 210.20 1,051,000
Tulare 4,520 1.24 5,600 346.07 1,938,000
STATE TOTALS 10,367 1.16 12,007 274.67 3,298,000
Counties Reporting -- 3
COTTONSEED (Tons) (Tons)
Fresno 68,400 306.90 20,992,000
Glenn 3,008 399.93 1,203,000
Imperial 3,568 175.17 625,000
Kern 24,700 624.94 15,436,000
Kings 95,916 235.55 22,593,000
Madera 2,400 335.00 804,000
Merced 40,416 378.27 15,288,000
Riverside 19,950 150.00 2,992,500
Tulare 15,700 274.01 4,302,000
STATE TOTALS 274,058 307.36 84,235,500
Counties Reporting -- 9
CUCUMBERS (Tons) (Tons)
Orange 35 9.86 345 1,092.46 376,900
San Bernardino 11 11.55 127 502.36 63,800
San Diego 339 16.40 5,560 517.97 2,879,900
San Joaquin 1,630 7.79 12,700 170.00 2,159,000
Tulare 447 8.14 3,640 492.03 1,791,000
Ventura 79 23.85 1,884 1,614.65 3,042,000
Sum of Others 402 6.68 2,685 922.27 2,476,300
STATE TOTALS 2,943 9.15 26,941 474.70 12,788,900
Counties Reporting -- 7
USDA, NASS, California Field Office 23
California County Agricultural
Commissioners' Data, 2008
Price Per
UnitTotal Value
COUNTY AGRICULTURAL COMMISSIONERS' DATA, CALENDAR YEAR 2008
CountyHarvested
Acreage
Yield Per
AcreProduction
Dollars
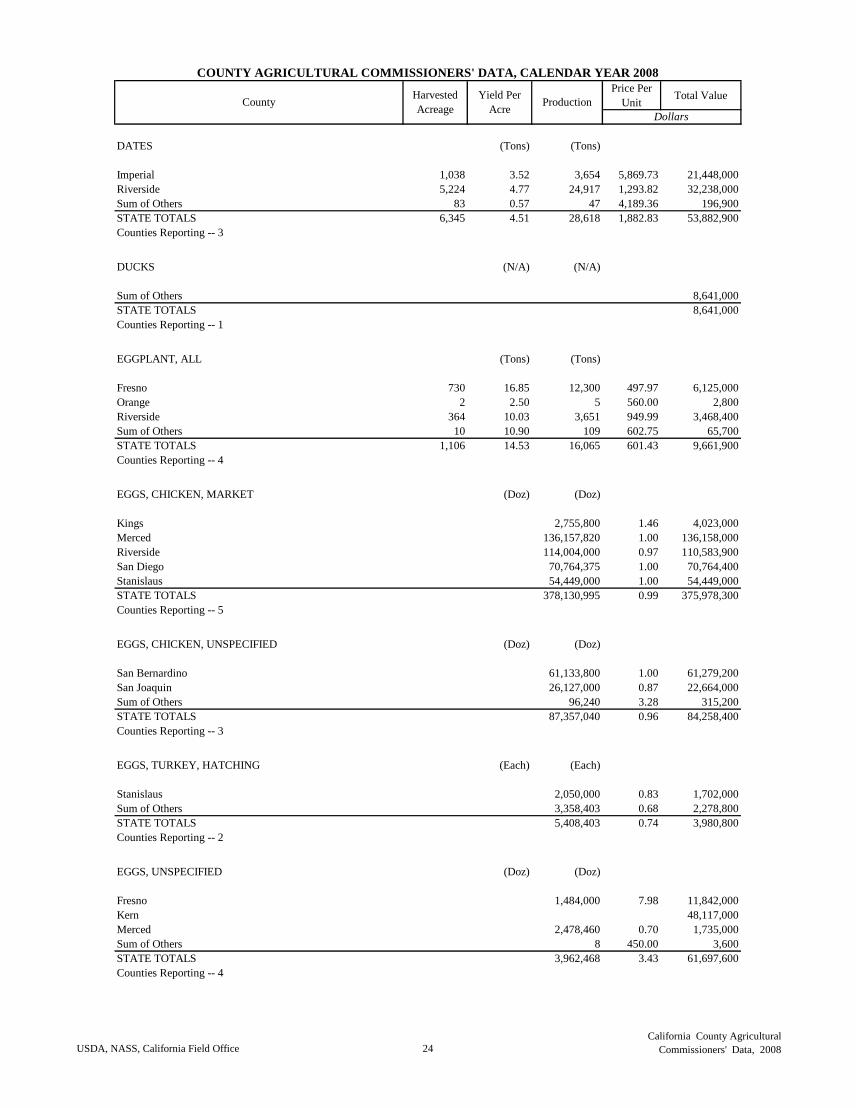
DATES (Tons) (Tons)
Imperial 1,038 3.52 3,654 5,869.73 21,448,000
Riverside 5,224 4.77 24,917 1,293.82 32,238,000
Sum of Others 83 0.57 47 4,189.36 196,900
STATE TOTALS 6,345 4.51 28,618 1,882.83 53,882,900
Counties Reporting -- 3
DUCKS (N/A) (N/A)
Sum of Others 8,641,000
STATE TOTALS 8,641,000
Counties Reporting -- 1
EGGPLANT, ALL (Tons) (Tons)
Fresno 730 16.85 12,300 497.97 6,125,000
Orange 2 2.50 5 560.00 2,800
Riverside 364 10.03 3,651 949.99 3,468,400
Sum of Others 10 10.90 109 602.75 65,700
STATE TOTALS 1,106 14.53 16,065 601.43 9,661,900
Counties Reporting -- 4
EGGS, CHICKEN, MARKET (Doz) (Doz)
Kings 2,755,800 1.46 4,023,000
Merced 136,157,820 1.00 136,158,000
Riverside 114,004,000 0.97 110,583,900
San Diego 70,764,375 1.00 70,764,400
Stanislaus 54,449,000 1.00 54,449,000
STATE TOTALS 378,130,995 0.99 375,978,300
Counties Reporting -- 5
EGGS, CHICKEN, UNSPECIFIED (Doz) (Doz)
San Bernardino 61,133,800 1.00 61,279,200
San Joaquin 26,127,000 0.87 22,664,000
Sum of Others 96,240 3.28 315,200
STATE TOTALS 87,357,040 0.96 84,258,400
Counties Reporting -- 3
EGGS, TURKEY, HATCHING (Each) (Each)
Stanislaus 2,050,000 0.83 1,702,000
Sum of Others 3,358,403 0.68 2,278,800
STATE TOTALS 5,408,403 0.74 3,980,800
Counties Reporting -- 2
EGGS, UNSPECIFIED (Doz) (Doz)
Fresno 1,484,000 7.98 11,842,000
Kern 48,117,000
Merced 2,478,460 0.70 1,735,000
Sum of Others 8 450.00 3,600
STATE TOTALS 3,962,468 3.43 61,697,600
Counties Reporting -- 4
USDA, NASS, California Field Office 24
California County Agricultural
Commissioners' Data, 2008
Price Per
UnitTotal Value
COUNTY AGRICULTURAL COMMISSIONERS' DATA, CALENDAR YEAR 2008
CountyHarvested
Acreage
Yield Per
AcreProduction
Dollars
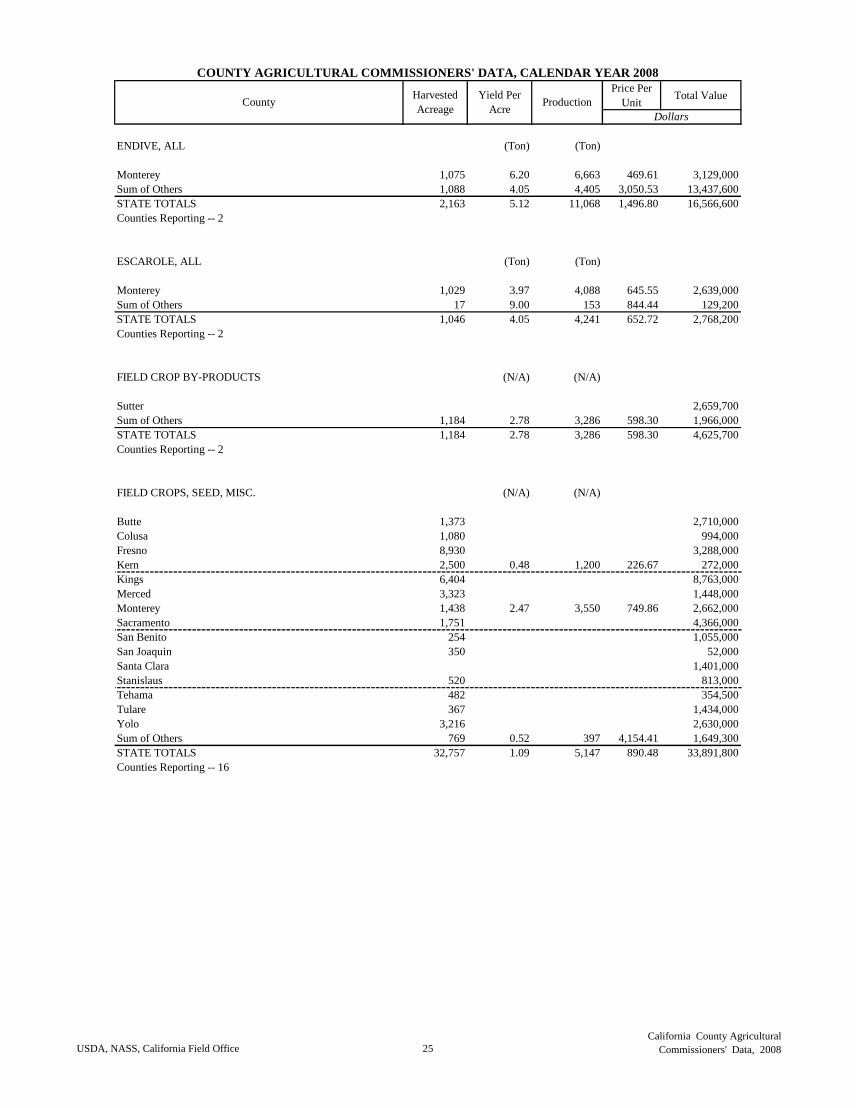
ENDIVE, ALL (Ton) (Ton)
Monterey 1,075 6.20 6,663 469.61 3,129,000
Sum of Others 1,088 4.05 4,405 3,050.53 13,437,600
STATE TOTALS 2,163 5.12 11,068 1,496.80 16,566,600
Counties Reporting -- 2
ESCAROLE, ALL (Ton) (Ton)
Monterey 1,029 3.97 4,088 645.55 2,639,000
Sum of Others 17 9.00 153 844.44 129,200
STATE TOTALS 1,046 4.05 4,241 652.72 2,768,200
Counties Reporting -- 2
FIELD CROP BY-PRODUCTS (N/A) (N/A)
Sutter 2,659,700
Sum of Others 1,184 2.78 3,286 598.30 1,966,000
STATE TOTALS 1,184 2.78 3,286 598.30 4,625,700
Counties Reporting -- 2
FIELD CROPS, SEED, MISC. (N/A) (N/A)
Butte 1,373 2,710,000
Colusa 1,080 994,000
Fresno 8,930 3,288,000
Kern 2,500 0.48 1,200 226.67 272,000
Kings 6,404 8,763,000
Merced 3,323 1,448,000
Monterey 1,438 2.47 3,550 749.86 2,662,000
Sacramento 1,751 4,366,000
San Benito 254 1,055,000
San Joaquin 350 52,000
Santa Clara 1,401,000
Stanislaus 520 813,000
Tehama 482 354,500
Tulare 367 1,434,000
Yolo 3,216 2,630,000
Sum of Others 769 0.52 397 4,154.41 1,649,300
STATE TOTALS 32,757 1.09 5,147 890.48 33,891,800
Counties Reporting -- 16
USDA, NASS, California Field Office 25
California County Agricultural
Commissioners' Data, 2008
Price Per
UnitTotal Value
COUNTY AGRICULTURAL COMMISSIONERS' DATA, CALENDAR YEAR 2008
CountyHarvested
Acreage
Yield Per
AcreProduction
Dollars
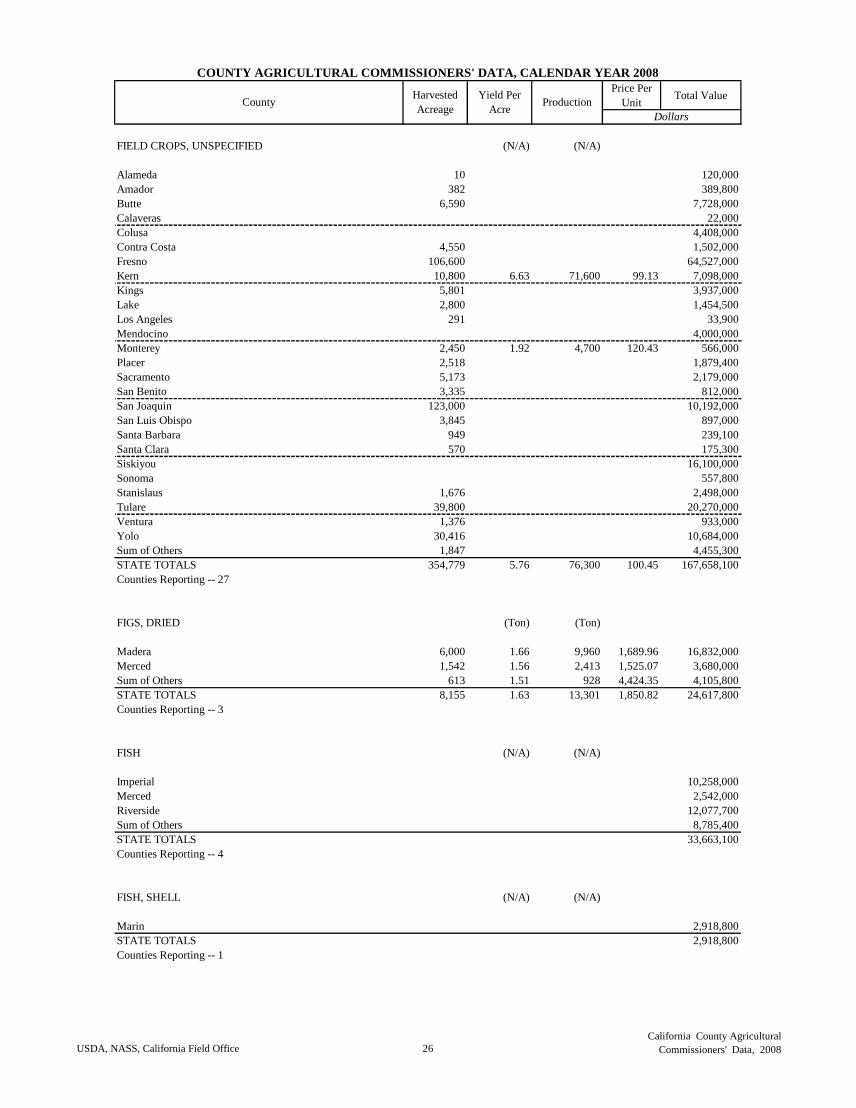
FIELD CROPS, UNSPECIFIED (N/A) (N/A)
Alameda 10 120,000
Amador 382 389,800
Butte 6,590 7,728,000
Calaveras 22,000
Colusa 4,408,000
Contra Costa 4,550 1,502,000
Fresno 106,600 64,527,000
Kern 10,800 6.63 71,600 99.13 7,098,000
Kings 5,801 3,937,000
Lake 2,800 1,454,500
Los Angeles 291 33,900
Mendocino 4,000,000
Monterey 2,450 1.92 4,700 120.43 566,000
Placer 2,518 1,879,400
Sacramento 5,173 2,179,000
San Benito 3,335 812,000
San Joaquin 123,000 10,192,000
San Luis Obispo 3,845 897,000
Santa Barbara 949 239,100
Santa Clara 570 175,300
Siskiyou 16,100,000
Sonoma 557,800
Stanislaus 1,676 2,498,000
Tulare 39,800 20,270,000
Ventura 1,376 933,000
Yolo 30,416 10,684,000
Sum of Others 1,847 4,455,300
STATE TOTALS 354,779 5.76 76,300 100.45 167,658,100
Counties Reporting -- 27
FIGS, DRIED (Ton) (Ton)
Madera 6,000 1.66 9,960 1,689.96 16,832,000
Merced 1,542 1.56 2,413 1,525.07 3,680,000
Sum of Others 613 1.51 928 4,424.35 4,105,800
STATE TOTALS 8,155 1.63 13,301 1,850.82 24,617,800
Counties Reporting -- 3
FISH (N/A) (N/A)
Imperial 10,258,000
Merced 2,542,000
Riverside 12,077,700
Sum of Others 8,785,400
STATE TOTALS 33,663,100
Counties Reporting -- 4
FISH, SHELL (N/A) (N/A)
Marin 2,918,800
STATE TOTALS 2,918,800
Counties Reporting -- 1
USDA, NASS, California Field Office 26
California County Agricultural
Commissioners' Data, 2008
Price Per
UnitTotal Value
COUNTY AGRICULTURAL COMMISSIONERS' DATA, CALENDAR YEAR 2008
CountyHarvested
Acreage
Yield Per
AcreProduction
Dollars
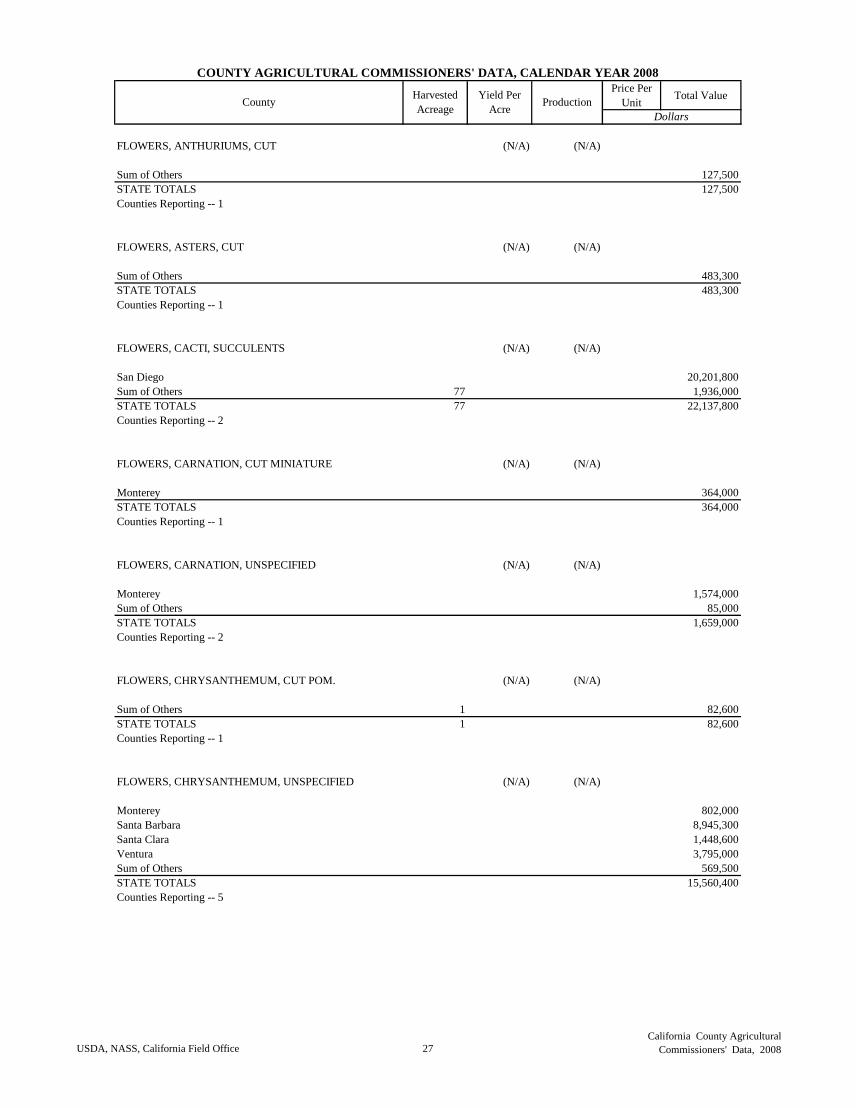
FLOWERS, ANTHURIUMS, CUT (N/A) (N/A)
Sum of Others 127,500
STATE TOTALS 127,500
Counties Reporting -- 1
FLOWERS, ASTERS, CUT (N/A) (N/A)
Sum of Others 483,300
STATE TOTALS 483,300
Counties Reporting -- 1
FLOWERS, CACTI, SUCCULENTS (N/A) (N/A)
San Diego 20,201,800
Sum of Others 77 1,936,000
STATE TOTALS 77 22,137,800
Counties Reporting -- 2
FLOWERS, CARNATION, CUT MINIATURE (N/A) (N/A)
Monterey 364,000
STATE TOTALS 364,000
Counties Reporting -- 1
FLOWERS, CARNATION, UNSPECIFIED (N/A) (N/A)
Monterey 1,574,000
Sum of Others 85,000
STATE TOTALS 1,659,000
Counties Reporting -- 2
FLOWERS, CHRYSANTHEMUM, CUT POM. (N/A) (N/A)
Sum of Others 1 82,600
STATE TOTALS 1 82,600
Counties Reporting -- 1
FLOWERS, CHRYSANTHEMUM, UNSPECIFIED (N/A) (N/A)
Monterey 802,000
Santa Barbara 8,945,300
Santa Clara 1,448,600
Ventura 3,795,000
Sum of Others 569,500
STATE TOTALS 15,560,400
Counties Reporting -- 5
USDA, NASS, California Field Office 27
California County Agricultural
Commissioners' Data, 2008
Price Per
UnitTotal Value
COUNTY AGRICULTURAL COMMISSIONERS' DATA, CALENDAR YEAR 2008
CountyHarvested
Acreage
Yield Per
AcreProduction
Dollars
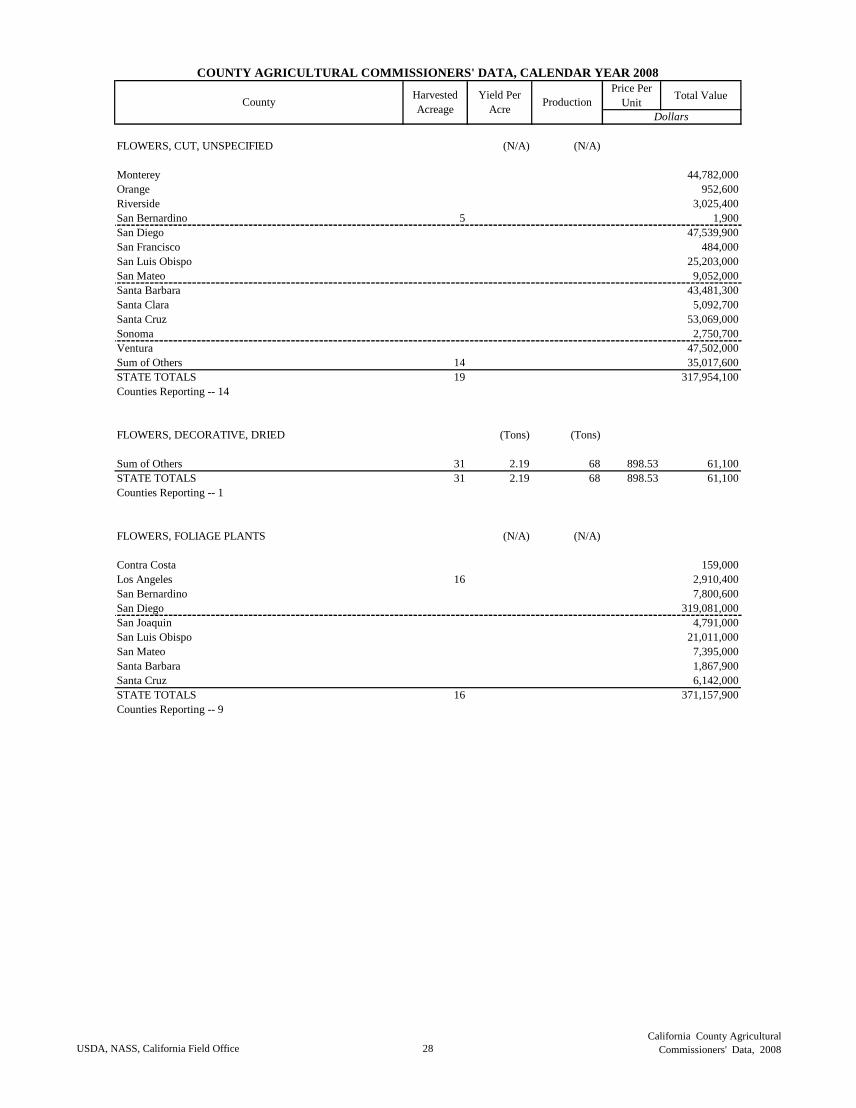
FLOWERS, CUT, UNSPECIFIED (N/A) (N/A)
Monterey 44,782,000
Orange 952,600
Riverside 3,025,400
San Bernardino 5 1,900
San Diego 47,539,900
San Francisco 484,000
San Luis Obispo 25,203,000
San Mateo 9,052,000
Santa Barbara 43,481,300
Santa Clara 5,092,700
Santa Cruz 53,069,000
Sonoma 2,750,700
Ventura 47,502,000
Sum of Others 14 35,017,600
STATE TOTALS 19 317,954,100
Counties Reporting -- 14
FLOWERS, DECORATIVE, DRIED (Tons) (Tons)
Sum of Others 31 2.19 68 898.53 61,100
STATE TOTALS 31 2.19 68 898.53 61,100
Counties Reporting -- 1
FLOWERS, FOLIAGE PLANTS (N/A) (N/A)
Contra Costa 159,000
Los Angeles 16 2,910,400
San Bernardino 7,800,600
San Diego 319,081,000
San Joaquin 4,791,000
San Luis Obispo 21,011,000
San Mateo 7,395,000
Santa Barbara 1,867,900
Santa Cruz 6,142,000
STATE TOTALS 16 371,157,900
Counties Reporting -- 9
USDA, NASS, California Field Office 28
California County Agricultural
Commissioners' Data, 2008
Price Per
UnitTotal Value
COUNTY AGRICULTURAL COMMISSIONERS' DATA, CALENDAR YEAR 2008
CountyHarvested
Acreage
Yield Per
AcreProduction
Dollars
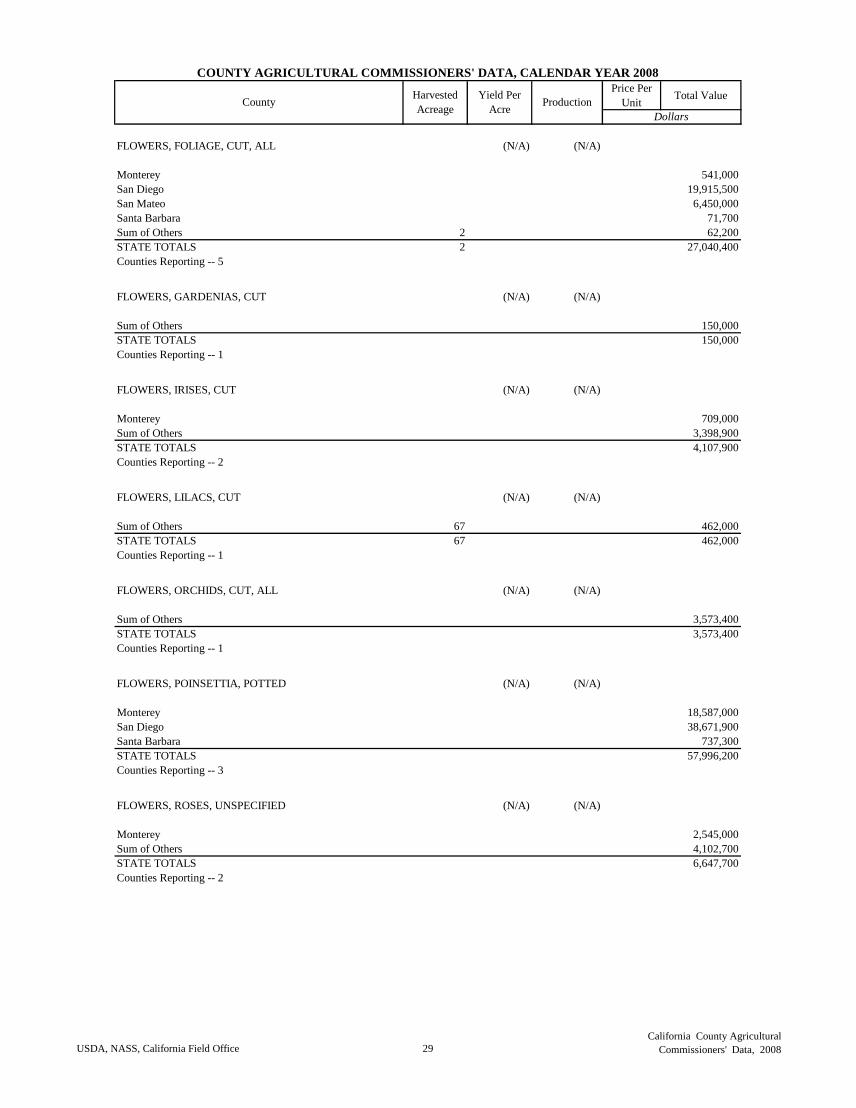
FLOWERS, FOLIAGE, CUT, ALL (N/A) (N/A)
Monterey 541,000
San Diego 19,915,500
San Mateo 6,450,000
Santa Barbara 71,700
Sum of Others 2 62,200
STATE TOTALS 2 27,040,400
Counties Reporting -- 5
FLOWERS, GARDENIAS, CUT (N/A) (N/A)
Sum of Others 150,000
STATE TOTALS 150,000
Counties Reporting -- 1
FLOWERS, IRISES, CUT (N/A) (N/A)
Monterey 709,000
Sum of Others 3,398,900
STATE TOTALS 4,107,900
Counties Reporting -- 2
FLOWERS, LILACS, CUT (N/A) (N/A)
Sum of Others 67 462,000
STATE TOTALS 67 462,000
Counties Reporting -- 1
FLOWERS, ORCHIDS, CUT, ALL (N/A) (N/A)
Sum of Others 3,573,400
STATE TOTALS 3,573,400
Counties Reporting -- 1
FLOWERS, POINSETTIA, POTTED (N/A) (N/A)
Monterey 18,587,000
San Diego 38,671,900
Santa Barbara 737,300
STATE TOTALS 57,996,200
Counties Reporting -- 3
FLOWERS, ROSES, UNSPECIFIED (N/A) (N/A)
Monterey 2,545,000
Sum of Others 4,102,700
STATE TOTALS 6,647,700
Counties Reporting -- 2
USDA, NASS, California Field Office 29
California County Agricultural
Commissioners' Data, 2008
Price Per
UnitTotal Value
COUNTY AGRICULTURAL COMMISSIONERS' DATA, CALENDAR YEAR 2008
CountyHarvested
Acreage
Yield Per
AcreProduction
Dollars
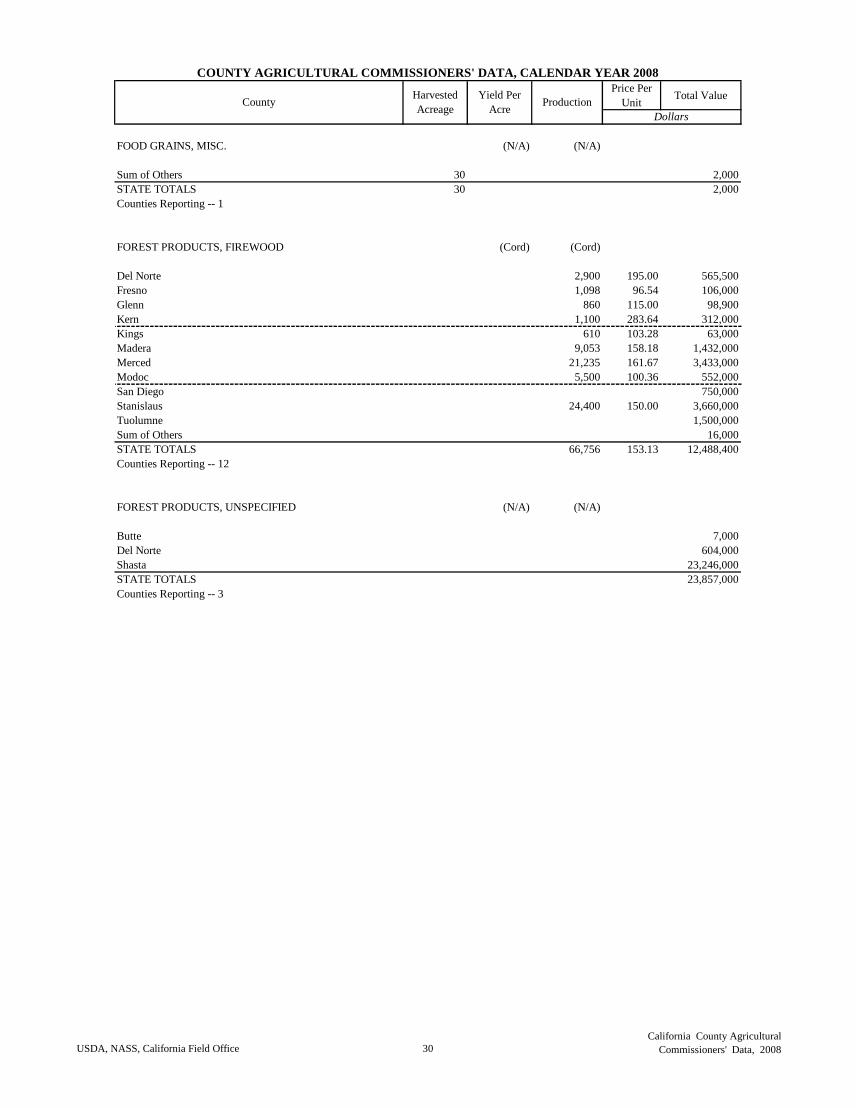
FOOD GRAINS, MISC. (N/A) (N/A)
Sum of Others 30 2,000
STATE TOTALS 30 2,000
Counties Reporting -- 1
FOREST PRODUCTS, FIREWOOD (Cord) (Cord)
Del Norte 2,900 195.00 565,500
Fresno 1,098 96.54 106,000
Glenn 860 115.00 98,900
Kern 1,100 283.64 312,000
Kings 610 103.28 63,000
Madera 9,053 158.18 1,432,000
Merced 21,235 161.67 3,433,000
Modoc 5,500 100.36 552,000
San Diego 750,000
Stanislaus 24,400 150.00 3,660,000
Tuolumne 1,500,000
Sum of Others 16,000
STATE TOTALS 66,756 153.13 12,488,400
Counties Reporting -- 12
FOREST PRODUCTS, UNSPECIFIED (N/A) (N/A)
Butte 7,000
Del Norte 604,000
Shasta 23,246,000
STATE TOTALS 23,857,000
Counties Reporting -- 3
USDA, NASS, California Field Office 30
California County Agricultural
Commissioners' Data, 2008
Price Per
UnitTotal Value
COUNTY AGRICULTURAL COMMISSIONERS' DATA, CALENDAR YEAR 2008
CountyHarvested
Acreage
Yield Per
AcreProduction
Dollars
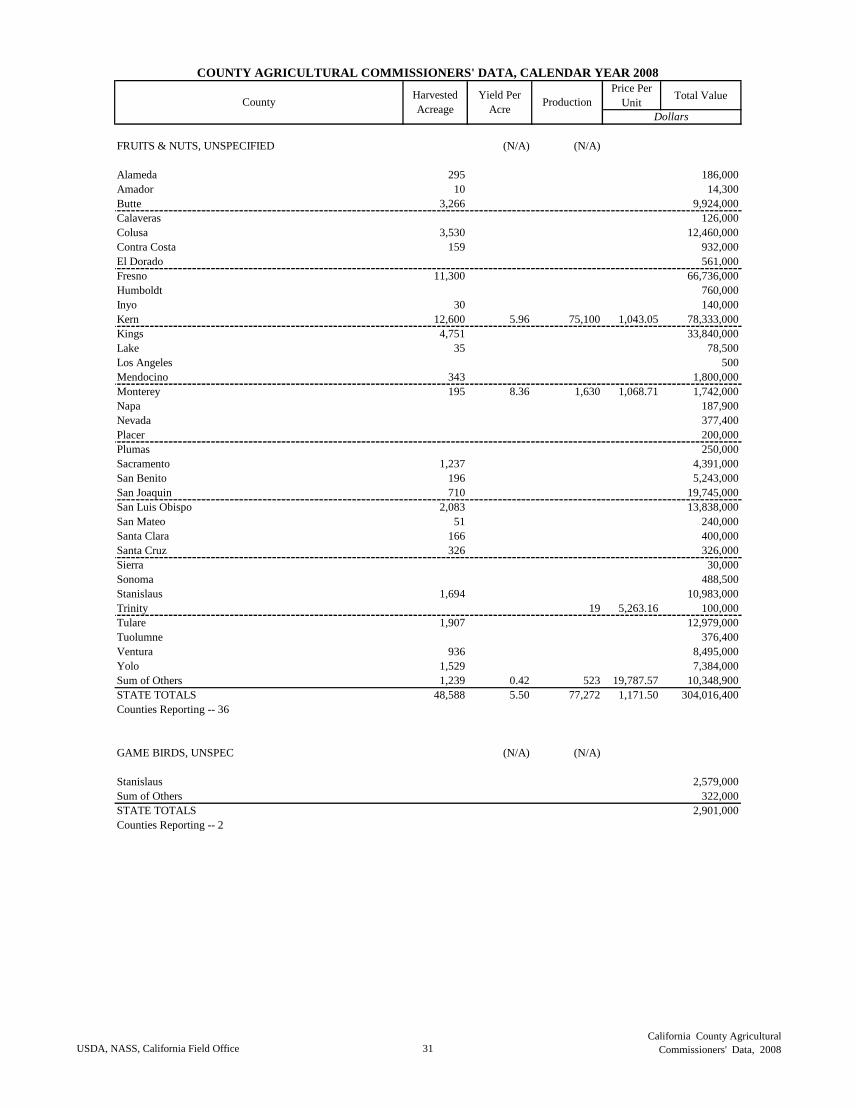
FRUITS & NUTS, UNSPECIFIED (N/A) (N/A)
Alameda 295 186,000
Amador 10 14,300
Butte 3,266 9,924,000
Calaveras 126,000
Colusa 3,530 12,460,000
Contra Costa 159 932,000
El Dorado 561,000
Fresno 11,300 66,736,000
Humboldt 760,000
Inyo 30 140,000
Kern 12,600 5.96 75,100 1,043.05 78,333,000
Kings 4,751 33,840,000
Lake 35 78,500
Los Angeles 500
Mendocino 343 1,800,000
Monterey 195 8.36 1,630 1,068.71 1,742,000
Napa 187,900
Nevada 377,400
Placer 200,000
Plumas 250,000
Sacramento 1,237 4,391,000
San Benito 196 5,243,000
San Joaquin 710 19,745,000
San Luis Obispo 2,083 13,838,000
San Mateo 51 240,000
Santa Clara 166 400,000
Santa Cruz 326 326,000
Sierra 30,000
Sonoma 488,500
Stanislaus 1,694 10,983,000
Trinity 19 5,263.16 100,000
Tulare 1,907 12,979,000
Tuolumne 376,400
Ventura 936 8,495,000
Yolo 1,529 7,384,000
Sum of Others 1,239 0.42 523 19,787.57 10,348,900
STATE TOTALS 48,588 5.50 77,272 1,171.50 304,016,400
Counties Reporting -- 36
GAME BIRDS, UNSPEC (N/A) (N/A)
Stanislaus 2,579,000
Sum of Others 322,000
STATE TOTALS 2,901,000
Counties Reporting -- 2
USDA, NASS, California Field Office 31
California County Agricultural
Commissioners' Data, 2008
Price Per
UnitTotal Value
COUNTY AGRICULTURAL COMMISSIONERS' DATA, CALENDAR YEAR 2008
CountyHarvested
Acreage
Yield Per
AcreProduction
Dollars
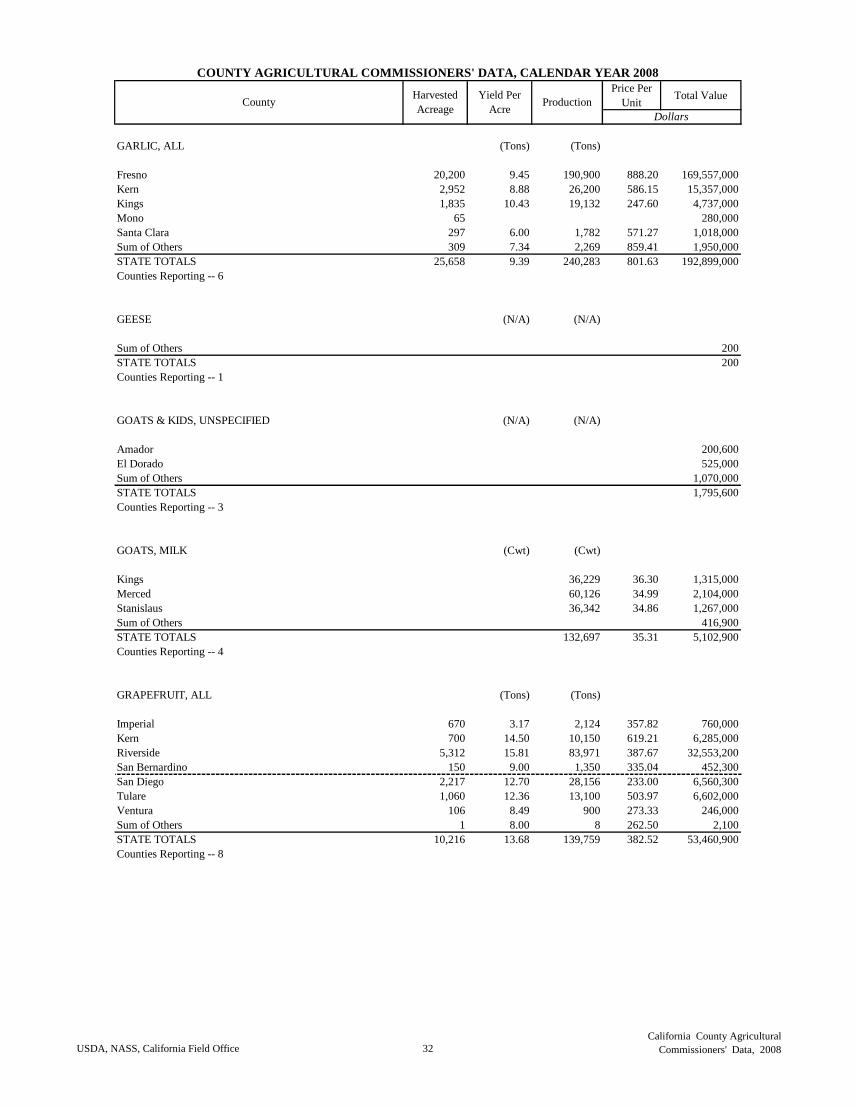
GARLIC, ALL (Tons) (Tons)
Fresno 20,200 9.45 190,900 888.20 169,557,000
Kern 2,952 8.88 26,200 586.15 15,357,000
Kings 1,835 10.43 19,132 247.60 4,737,000
Mono 65 280,000
Santa Clara 297 6.00 1,782 571.27 1,018,000
Sum of Others 309 7.34 2,269 859.41 1,950,000
STATE TOTALS 25,658 9.39 240,283 801.63 192,899,000
Counties Reporting -- 6
GEESE (N/A) (N/A)
Sum of Others 200
STATE TOTALS 200
Counties Reporting -- 1
GOATS & KIDS, UNSPECIFIED (N/A) (N/A)
Amador 200,600
El Dorado 525,000
Sum of Others 1,070,000
STATE TOTALS 1,795,600
Counties Reporting -- 3
GOATS, MILK (Cwt) (Cwt)
Kings 36,229 36.30 1,315,000
Merced 60,126 34.99 2,104,000
Stanislaus 36,342 34.86 1,267,000
Sum of Others 416,900
STATE TOTALS 132,697 35.31 5,102,900
Counties Reporting -- 4
GRAPEFRUIT, ALL (Tons) (Tons)
Imperial 670 3.17 2,124 357.82 760,000
Kern 700 14.50 10,150 619.21 6,285,000
Riverside 5,312 15.81 83,971 387.67 32,553,200
San Bernardino 150 9.00 1,350 335.04 452,300
San Diego 2,217 12.70 28,156 233.00 6,560,300
Tulare 1,060 12.36 13,100 503.97 6,602,000
Ventura 106 8.49 900 273.33 246,000
Sum of Others 1 8.00 8 262.50 2,100
STATE TOTALS 10,216 13.68 139,759 382.52 53,460,900
Counties Reporting -- 8
USDA, NASS, California Field Office 32
California County Agricultural
Commissioners' Data, 2008
Price Per
UnitTotal Value
COUNTY AGRICULTURAL COMMISSIONERS' DATA, CALENDAR YEAR 2008
CountyHarvested
Acreage
Yield Per
AcreProduction
Dollars
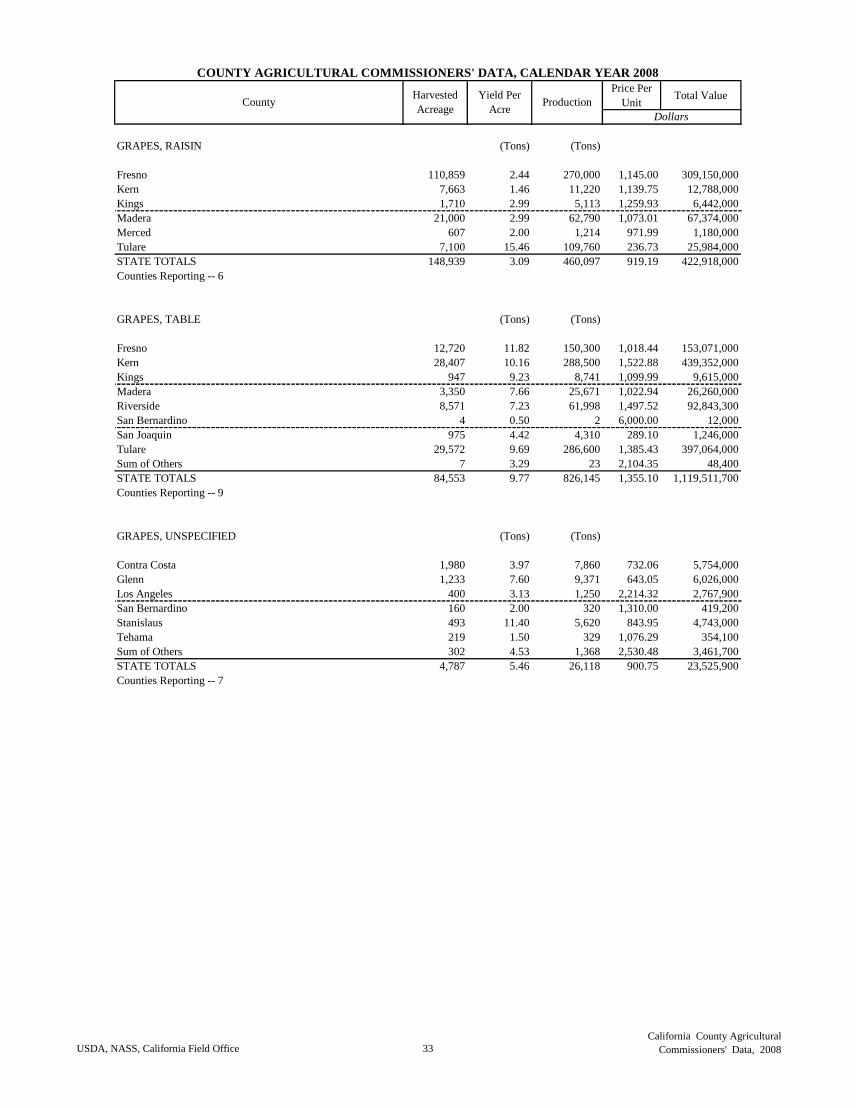
GRAPES, RAISIN (Tons) (Tons)
Fresno 110,859 2.44 270,000 1,145.00 309,150,000
Kern 7,663 1.46 11,220 1,139.75 12,788,000
Kings 1,710 2.99 5,113 1,259.93 6,442,000
Madera 21,000 2.99 62,790 1,073.01 67,374,000
Merced 607 2.00 1,214 971.99 1,180,000
Tulare 7,100 15.46 109,760 236.73 25,984,000
STATE TOTALS 148,939 3.09 460,097 919.19 422,918,000
Counties Reporting -- 6
GRAPES, TABLE (Tons) (Tons)
Fresno 12,720 11.82 150,300 1,018.44 153,071,000
Kern 28,407 10.16 288,500 1,522.88 439,352,000
Kings 947 9.23 8,741 1,099.99 9,615,000
Madera 3,350 7.66 25,671 1,022.94 26,260,000
Riverside 8,571 7.23 61,998 1,497.52 92,843,300
San Bernardino 4 0.50 2 6,000.00 12,000
San Joaquin 975 4.42 4,310 289.10 1,246,000
Tulare 29,572 9.69 286,600 1,385.43 397,064,000
Sum of Others 7 3.29 23 2,104.35 48,400
STATE TOTALS 84,553 9.77 826,145 1,355.10 1,119,511,700
Counties Reporting -- 9
GRAPES, UNSPECIFIED (Tons) (Tons)
Contra Costa 1,980 3.97 7,860 732.06 5,754,000
Glenn 1,233 7.60 9,371 643.05 6,026,000
Los Angeles 400 3.13 1,250 2,214.32 2,767,900
San Bernardino 160 2.00 320 1,310.00 419,200
Stanislaus 493 11.40 5,620 843.95 4,743,000
Tehama 219 1.50 329 1,076.29 354,100
Sum of Others 302 4.53 1,368 2,530.48 3,461,700
STATE TOTALS 4,787 5.46 26,118 900.75 23,525,900
Counties Reporting -- 7
USDA, NASS, California Field Office 33
California County Agricultural
Commissioners' Data, 2008
Price Per
UnitTotal Value
COUNTY AGRICULTURAL COMMISSIONERS' DATA, CALENDAR YEAR 2008
CountyHarvested
Acreage
Yield Per
AcreProduction
Dollars
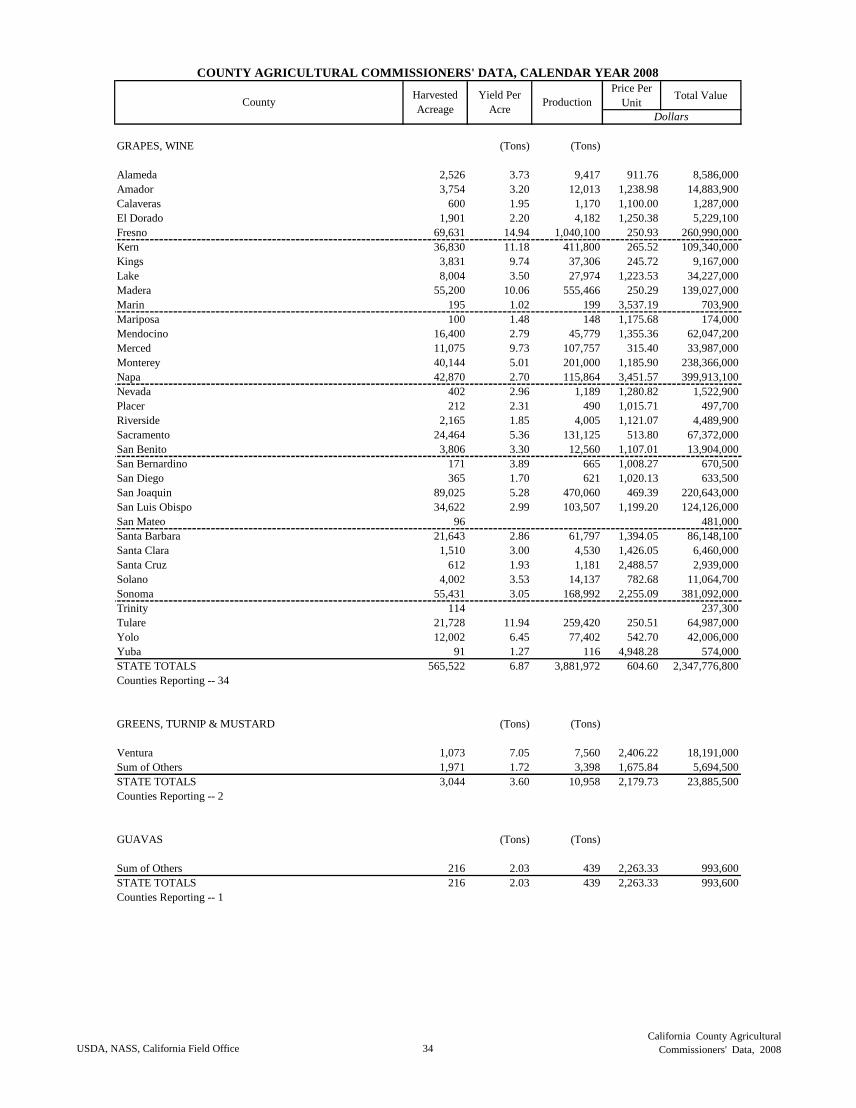
GRAPES, WINE (Tons) (Tons)
Alameda 2,526 3.73 9,417 911.76 8,586,000
Amador 3,754 3.20 12,013 1,238.98 14,883,900
Calaveras 600 1.95 1,170 1,100.00 1,287,000
El Dorado 1,901 2.20 4,182 1,250.38 5,229,100
Fresno 69,631 14.94 1,040,100 250.93 260,990,000
Kern 36,830 11.18 411,800 265.52 109,340,000
Kings 3,831 9.74 37,306 245.72 9,167,000
Lake 8,004 3.50 27,974 1,223.53 34,227,000
Madera 55,200 10.06 555,466 250.29 139,027,000
Marin 195 1.02 199 3,537.19 703,900
Mariposa 100 1.48 148 1,175.68 174,000
Mendocino 16,400 2.79 45,779 1,355.36 62,047,200
Merced 11,075 9.73 107,757 315.40 33,987,000
Monterey 40,144 5.01 201,000 1,185.90 238,366,000
Napa 42,870 2.70 115,864 3,451.57 399,913,100
Nevada 402 2.96 1,189 1,280.82 1,522,900
Placer 212 2.31 490 1,015.71 497,700
Riverside 2,165 1.85 4,005 1,121.07 4,489,900
Sacramento 24,464 5.36 131,125 513.80 67,372,000
San Benito 3,806 3.30 12,560 1,107.01 13,904,000
San Bernardino 171 3.89 665 1,008.27 670,500
San Diego 365 1.70 621 1,020.13 633,500
San Joaquin 89,025 5.28 470,060 469.39 220,643,000
San Luis Obispo 34,622 2.99 103,507 1,199.20 124,126,000
San Mateo 96 481,000
Santa Barbara 21,643 2.86 61,797 1,394.05 86,148,100
Santa Clara 1,510 3.00 4,530 1,426.05 6,460,000
Santa Cruz 612 1.93 1,181 2,488.57 2,939,000
Solano 4,002 3.53 14,137 782.68 11,064,700
Sonoma 55,431 3.05 168,992 2,255.09 381,092,000
Trinity 114 237,300
Tulare 21,728 11.94 259,420 250.51 64,987,000
Yolo 12,002 6.45 77,402 542.70 42,006,000
Yuba 91 1.27 116 4,948.28 574,000
STATE TOTALS 565,522 6.87 3,881,972 604.60 2,347,776,800
Counties Reporting -- 34
GREENS, TURNIP & MUSTARD (Tons) (Tons)
Ventura 1,073 7.05 7,560 2,406.22 18,191,000
Sum of Others 1,971 1.72 3,398 1,675.84 5,694,500
STATE TOTALS 3,044 3.60 10,958 2,179.73 23,885,500
Counties Reporting -- 2
GUAVAS (Tons) (Tons)
Sum of Others 216 2.03 439 2,263.33 993,600
STATE TOTALS 216 2.03 439 2,263.33 993,600
Counties Reporting -- 1
USDA, NASS, California Field Office 34
California County Agricultural
Commissioners' Data, 2008
Price Per
UnitTotal Value
COUNTY AGRICULTURAL COMMISSIONERS' DATA, CALENDAR YEAR 2008
CountyHarvested
Acreage
Yield Per
AcreProduction
Dollars
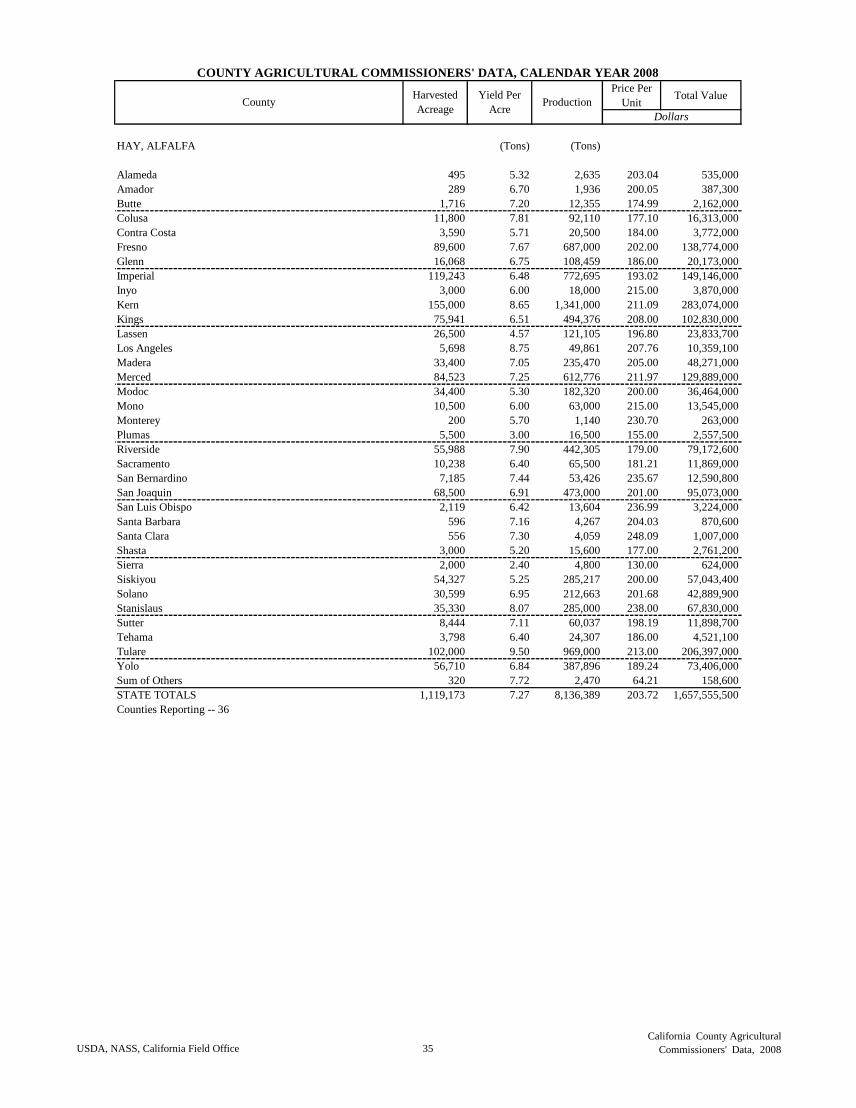
HAY, ALFALFA (Tons) (Tons)
Alameda 495 5.32 2,635 203.04 535,000
Amador 289 6.70 1,936 200.05 387,300
Butte 1,716 7.20 12,355 174.99 2,162,000
Colusa 11,800 7.81 92,110 177.10 16,313,000
Contra Costa 3,590 5.71 20,500 184.00 3,772,000
Fresno 89,600 7.67 687,000 202.00 138,774,000
Glenn 16,068 6.75 108,459 186.00 20,173,000
Imperial 119,243 6.48 772,695 193.02 149,146,000
Inyo 3,000 6.00 18,000 215.00 3,870,000
Kern 155,000 8.65 1,341,000 211.09 283,074,000
Kings 75,941 6.51 494,376 208.00 102,830,000
Lassen 26,500 4.57 121,105 196.80 23,833,700
Los Angeles 5,698 8.75 49,861 207.76 10,359,100
Madera 33,400 7.05 235,470 205.00 48,271,000
Merced 84,523 7.25 612,776 211.97 129,889,000
Modoc 34,400 5.30 182,320 200.00 36,464,000
Mono 10,500 6.00 63,000 215.00 13,545,000
Monterey 200 5.70 1,140 230.70 263,000
Plumas 5,500 3.00 16,500 155.00 2,557,500
Riverside 55,988 7.90 442,305 179.00 79,172,600
Sacramento 10,238 6.40 65,500 181.21 11,869,000
San Bernardino 7,185 7.44 53,426 235.67 12,590,800
San Joaquin 68,500 6.91 473,000 201.00 95,073,000
San Luis Obispo 2,119 6.42 13,604 236.99 3,224,000
Santa Barbara 596 7.16 4,267 204.03 870,600
Santa Clara 556 7.30 4,059 248.09 1,007,000
Shasta 3,000 5.20 15,600 177.00 2,761,200
Sierra 2,000 2.40 4,800 130.00 624,000
Siskiyou 54,327 5.25 285,217 200.00 57,043,400
Solano 30,599 6.95 212,663 201.68 42,889,900
Stanislaus 35,330 8.07 285,000 238.00 67,830,000
Sutter 8,444 7.11 60,037 198.19 11,898,700
Tehama 3,798 6.40 24,307 186.00 4,521,100
Tulare 102,000 9.50 969,000 213.00 206,397,000
Yolo 56,710 6.84 387,896 189.24 73,406,000
Sum of Others 320 7.72 2,470 64.21 158,600
STATE TOTALS 1,119,173 7.27 8,136,389 203.72 1,657,555,500
Counties Reporting -- 36
USDA, NASS, California Field Office 35
California County Agricultural
Commissioners' Data, 2008
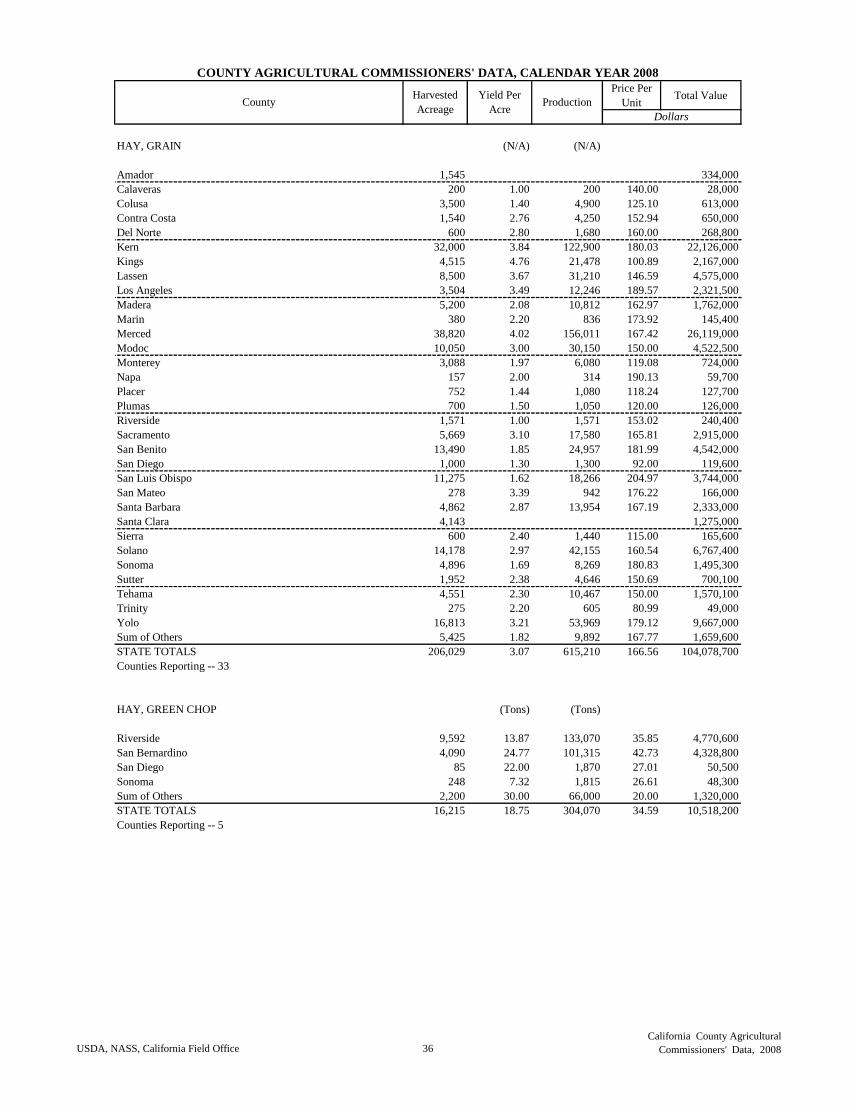
Price Per
UnitTotal Value
COUNTY AGRICULTURAL COMMISSIONERS' DATA, CALENDAR YEAR 2008
CountyHarvested
Acreage
Yield Per
AcreProduction
Dollars
HAY, GRAIN (N/A) (N/A)
Amador 1,545 334,000
Calaveras 200 1.00 200 140.00 28,000
Colusa 3,500 1.40 4,900 125.10 613,000
Contra Costa 1,540 2.76 4,250 152.94 650,000
Del Norte 600 2.80 1,680 160.00 268,800
Kern 32,000 3.84 122,900 180.03 22,126,000
Kings 4,515 4.76 21,478 100.89 2,167,000
Lassen 8,500 3.67 31,210 146.59 4,575,000
Los Angeles 3,504 3.49 12,246 189.57 2,321,500
Madera 5,200 2.08 10,812 162.97 1,762,000
Marin 380 2.20 836 173.92 145,400
Merced 38,820 4.02 156,011 167.42 26,119,000
Modoc 10,050 3.00 30,150 150.00 4,522,500
Monterey 3,088 1.97 6,080 119.08 724,000
Napa 157 2.00 314 190.13 59,700
Placer 752 1.44 1,080 118.24 127,700
Plumas 700 1.50 1,050 120.00 126,000
Riverside 1,571 1.00 1,571 153.02 240,400
Sacramento 5,669 3.10 17,580 165.81 2,915,000
San Benito 13,490 1.85 24,957 181.99 4,542,000
San Diego 1,000 1.30 1,300 92.00 119,600
San Luis Obispo 11,275 1.62 18,266 204.97 3,744,000
San Mateo 278 3.39 942 176.22 166,000
Santa Barbara 4,862 2.87 13,954 167.19 2,333,000
Santa Clara 4,143 1,275,000
Sierra 600 2.40 1,440 115.00 165,600
Solano 14,178 2.97 42,155 160.54 6,767,400
Sonoma 4,896 1.69 8,269 180.83 1,495,300
Sutter 1,952 2.38 4,646 150.69 700,100
Tehama 4,551 2.30 10,467 150.00 1,570,100
Trinity 275 2.20 605 80.99 49,000
Yolo 16,813 3.21 53,969 179.12 9,667,000
Sum of Others 5,425 1.82 9,892 167.77 1,659,600
STATE TOTALS 206,029 3.07 615,210 166.56 104,078,700
Counties Reporting -- 33
HAY, GREEN CHOP (Tons) (Tons)
Riverside 9,592 13.87 133,070 35.85 4,770,600
San Bernardino 4,090 24.77 101,315 42.73 4,328,800
San Diego 85 22.00 1,870 27.01 50,500
Sonoma 248 7.32 1,815 26.61 48,300
Sum of Others 2,200 30.00 66,000 20.00 1,320,000
STATE TOTALS 16,215 18.75 304,070 34.59 10,518,200
Counties Reporting -- 5
USDA, NASS, California Field Office 36
California County Agricultural
Commissioners' Data, 2008
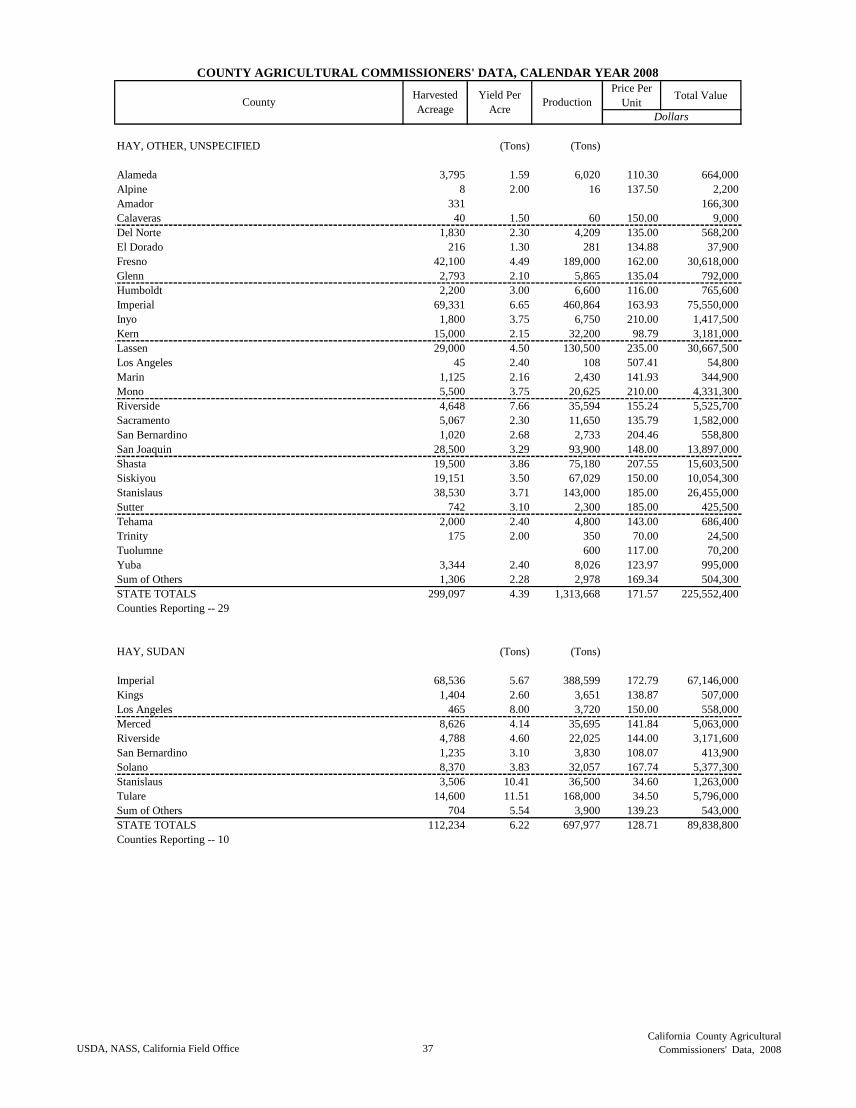
Price Per
UnitTotal Value
COUNTY AGRICULTURAL COMMISSIONERS' DATA, CALENDAR YEAR 2008
CountyHarvested
Acreage
Yield Per
AcreProduction
Dollars
HAY, OTHER, UNSPECIFIED (Tons) (Tons)
Alameda 3,795 1.59 6,020 110.30 664,000
Alpine 8 2.00 16 137.50 2,200
Amador 331 166,300
Calaveras 40 1.50 60 150.00 9,000
Del Norte 1,830 2.30 4,209 135.00 568,200
El Dorado 216 1.30 281 134.88 37,900
Fresno 42,100 4.49 189,000 162.00 30,618,000
Glenn 2,793 2.10 5,865 135.04 792,000
Humboldt 2,200 3.00 6,600 116.00 765,600
Imperial 69,331 6.65 460,864 163.93 75,550,000
Inyo 1,800 3.75 6,750 210.00 1,417,500
Kern 15,000 2.15 32,200 98.79 3,181,000
Lassen 29,000 4.50 130,500 235.00 30,667,500
Los Angeles 45 2.40 108 507.41 54,800
Marin 1,125 2.16 2,430 141.93 344,900
Mono 5,500 3.75 20,625 210.00 4,331,300
Riverside 4,648 7.66 35,594 155.24 5,525,700
Sacramento 5,067 2.30 11,650 135.79 1,582,000
San Bernardino 1,020 2.68 2,733 204.46 558,800
San Joaquin 28,500 3.29 93,900 148.00 13,897,000
Shasta 19,500 3.86 75,180 207.55 15,603,500
Siskiyou 19,151 3.50 67,029 150.00 10,054,300
Stanislaus 38,530 3.71 143,000 185.00 26,455,000
Sutter 742 3.10 2,300 185.00 425,500
Tehama 2,000 2.40 4,800 143.00 686,400
Trinity 175 2.00 350 70.00 24,500
Tuolumne 600 117.00 70,200
Yuba 3,344 2.40 8,026 123.97 995,000
Sum of Others 1,306 2.28 2,978 169.34 504,300
STATE TOTALS 299,097 4.39 1,313,668 171.57 225,552,400
Counties Reporting -- 29
HAY, SUDAN (Tons) (Tons)
Imperial 68,536 5.67 388,599 172.79 67,146,000
Kings 1,404 2.60 3,651 138.87 507,000
Los Angeles 465 8.00 3,720 150.00 558,000
Merced 8,626 4.14 35,695 141.84 5,063,000
Riverside 4,788 4.60 22,025 144.00 3,171,600
San Bernardino 1,235 3.10 3,830 108.07 413,900
Solano 8,370 3.83 32,057 167.74 5,377,300
Stanislaus 3,506 10.41 36,500 34.60 1,263,000
Tulare 14,600 11.51 168,000 34.50 5,796,000
Sum of Others 704 5.54 3,900 139.23 543,000
STATE TOTALS 112,234 6.22 697,977 128.71 89,838,800
Counties Reporting -- 10
USDA, NASS, California Field Office 37
California County Agricultural
Commissioners' Data, 2008
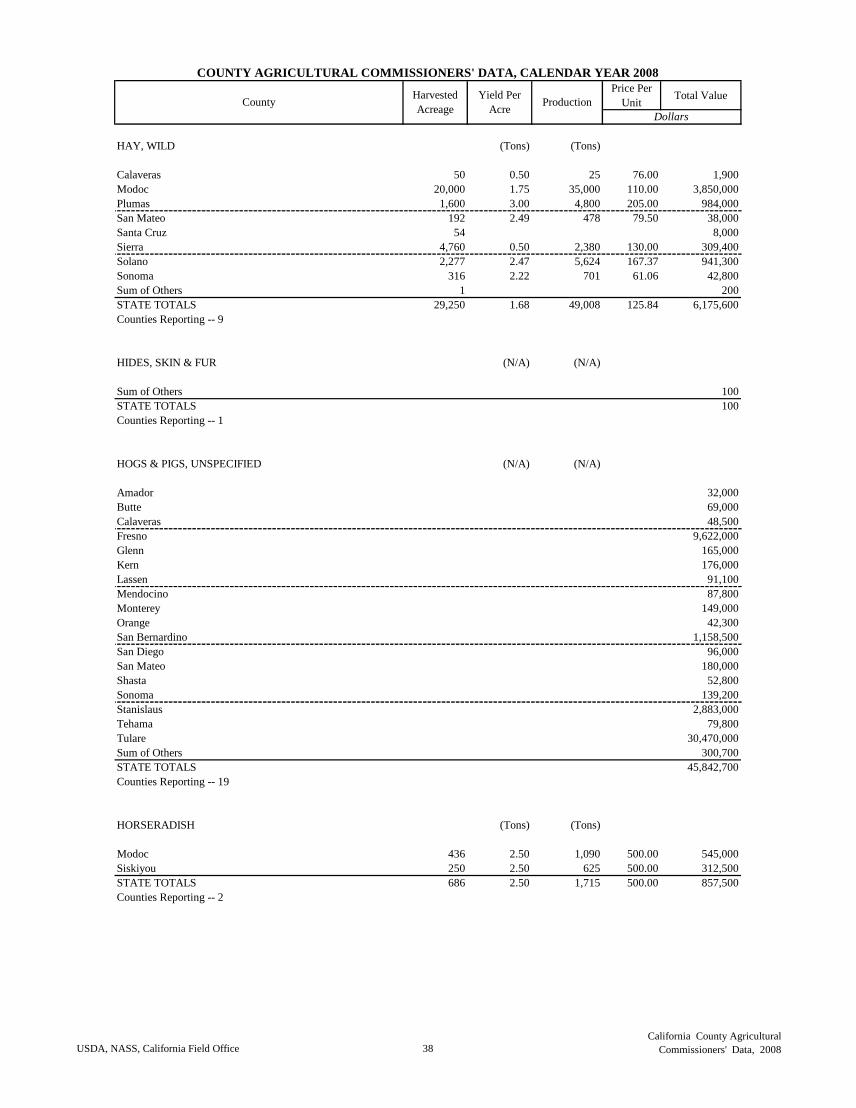
Price Per
UnitTotal Value
COUNTY AGRICULTURAL COMMISSIONERS' DATA, CALENDAR YEAR 2008
CountyHarvested
Acreage
Yield Per
AcreProduction
Dollars
HAY, WILD (Tons) (Tons)
Calaveras 50 0.50 25 76.00 1,900
Modoc 20,000 1.75 35,000 110.00 3,850,000
Plumas 1,600 3.00 4,800 205.00 984,000
San Mateo 192 2.49 478 79.50 38,000
Santa Cruz 54 8,000
Sierra 4,760 0.50 2,380 130.00 309,400
Solano 2,277 2.47 5,624 167.37 941,300
Sonoma 316 2.22 701 61.06 42,800
Sum of Others 1 200
STATE TOTALS 29,250 1.68 49,008 125.84 6,175,600
Counties Reporting -- 9
HIDES, SKIN & FUR (N/A) (N/A)
Sum of Others 100
STATE TOTALS 100
Counties Reporting -- 1
HOGS & PIGS, UNSPECIFIED (N/A) (N/A)
Amador 32,000
Butte 69,000
Calaveras 48,500
Fresno 9,622,000
Glenn 165,000
Kern 176,000
Lassen 91,100
Mendocino 87,800
Monterey 149,000
Orange 42,300
San Bernardino 1,158,500
San Diego 96,000
San Mateo 180,000
Shasta 52,800
Sonoma 139,200
Stanislaus 2,883,000
Tehama 79,800
Tulare 30,470,000
Sum of Others 300,700
STATE TOTALS 45,842,700
Counties Reporting -- 19
HORSERADISH (Tons) (Tons)
Modoc 436 2.50 1,090 500.00 545,000
Siskiyou 250 2.50 625 500.00 312,500
STATE TOTALS 686 2.50 1,715 500.00 857,500
Counties Reporting -- 2
USDA, NASS, California Field Office 38
California County Agricultural
Commissioners' Data, 2008
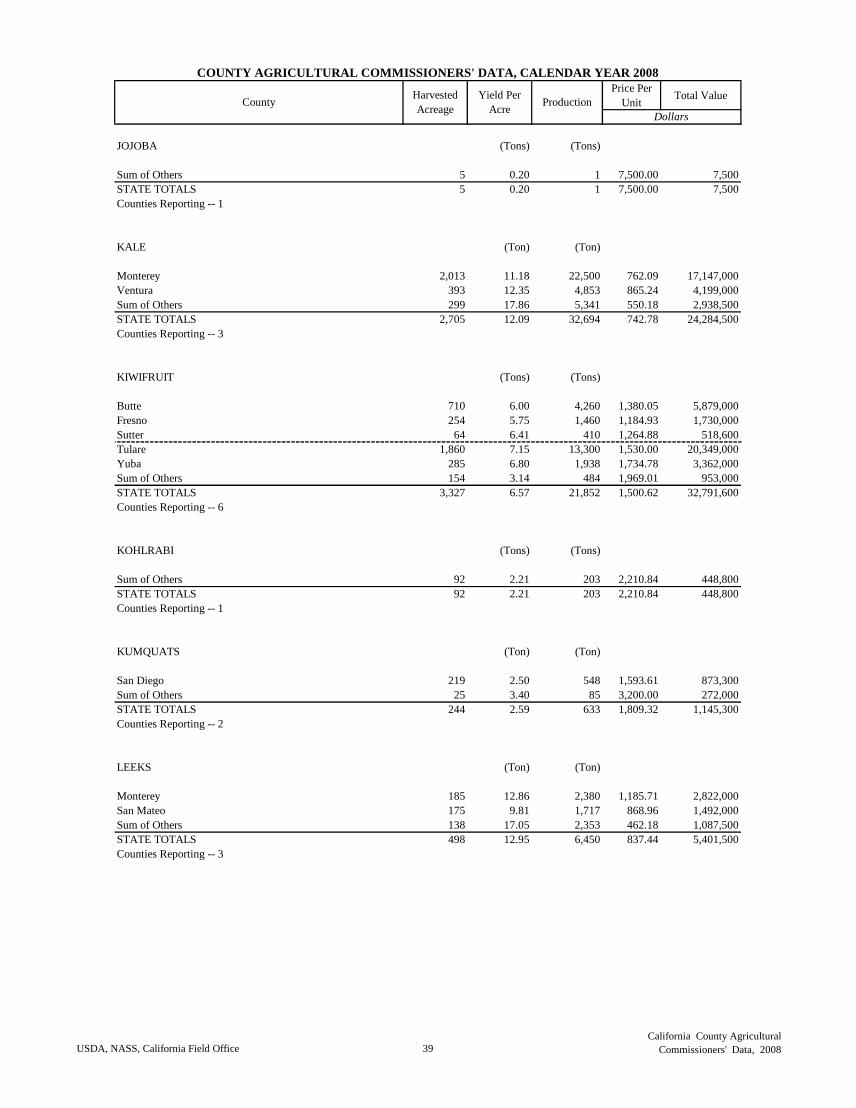
Price Per
UnitTotal Value
COUNTY AGRICULTURAL COMMISSIONERS' DATA, CALENDAR YEAR 2008
CountyHarvested
Acreage
Yield Per
AcreProduction
Dollars
JOJOBA (Tons) (Tons)
Sum of Others 5 0.20 1 7,500.00 7,500
STATE TOTALS 5 0.20 1 7,500.00 7,500
Counties Reporting -- 1
KALE (Ton) (Ton)
Monterey 2,013 11.18 22,500 762.09 17,147,000
Ventura 393 12.35 4,853 865.24 4,199,000
Sum of Others 299 17.86 5,341 550.18 2,938,500
STATE TOTALS 2,705 12.09 32,694 742.78 24,284,500
Counties Reporting -- 3
KIWIFRUIT (Tons) (Tons)
Butte 710 6.00 4,260 1,380.05 5,879,000
Fresno 254 5.75 1,460 1,184.93 1,730,000
Sutter 64 6.41 410 1,264.88 518,600
Tulare 1,860 7.15 13,300 1,530.00 20,349,000
Yuba 285 6.80 1,938 1,734.78 3,362,000
Sum of Others 154 3.14 484 1,969.01 953,000
STATE TOTALS 3,327 6.57 21,852 1,500.62 32,791,600
Counties Reporting -- 6
KOHLRABI (Tons) (Tons)
Sum of Others 92 2.21 203 2,210.84 448,800
STATE TOTALS 92 2.21 203 2,210.84 448,800
Counties Reporting -- 1
KUMQUATS (Ton) (Ton)
San Diego 219 2.50 548 1,593.61 873,300
Sum of Others 25 3.40 85 3,200.00 272,000
STATE TOTALS 244 2.59 633 1,809.32 1,145,300
Counties Reporting -- 2
LEEKS (Ton) (Ton)
Monterey 185 12.86 2,380 1,185.71 2,822,000
San Mateo 175 9.81 1,717 868.96 1,492,000
Sum of Others 138 17.05 2,353 462.18 1,087,500
STATE TOTALS 498 12.95 6,450 837.44 5,401,500
Counties Reporting -- 3
USDA, NASS, California Field Office 39
California County Agricultural
Commissioners' Data, 2008
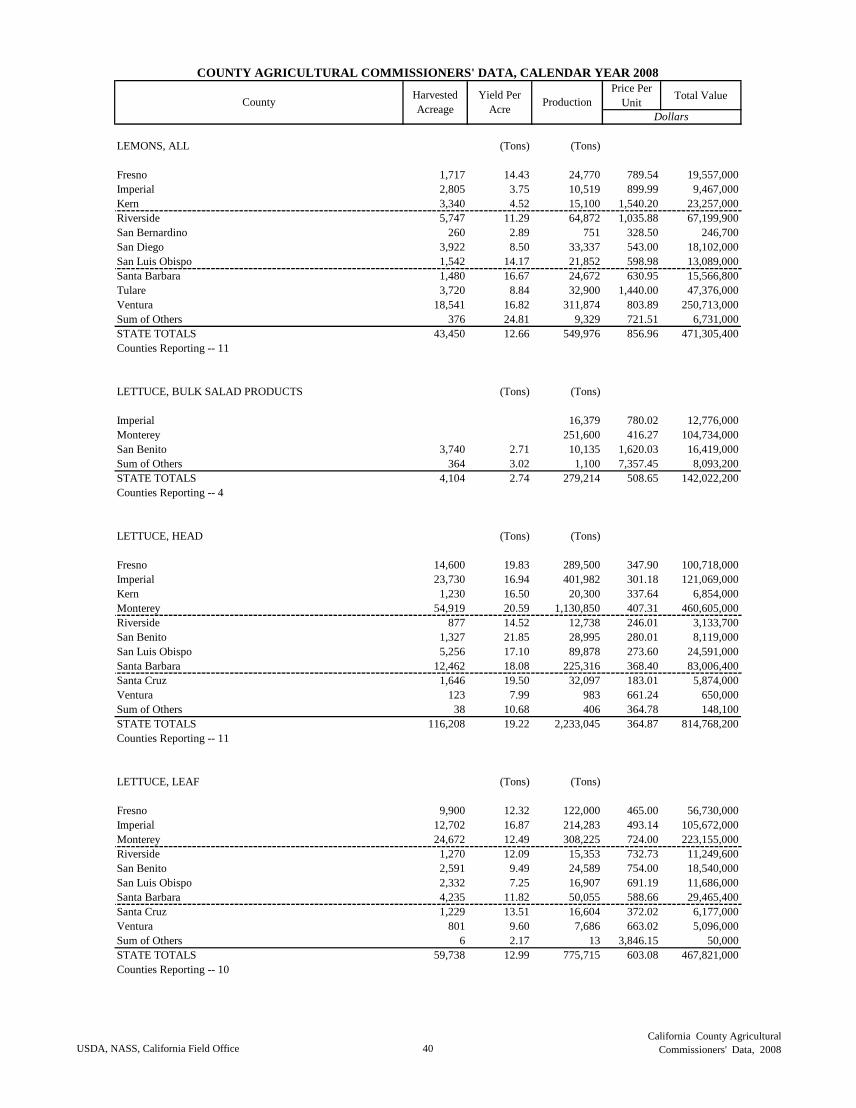
Price Per
UnitTotal Value
COUNTY AGRICULTURAL COMMISSIONERS' DATA, CALENDAR YEAR 2008
CountyHarvested
Acreage
Yield Per
AcreProduction
Dollars
LEMONS, ALL (Tons) (Tons)
Fresno 1,717 14.43 24,770 789.54 19,557,000
Imperial 2,805 3.75 10,519 899.99 9,467,000
Kern 3,340 4.52 15,100 1,540.20 23,257,000
Riverside 5,747 11.29 64,872 1,035.88 67,199,900
San Bernardino 260 2.89 751 328.50 246,700
San Diego 3,922 8.50 33,337 543.00 18,102,000
San Luis Obispo 1,542 14.17 21,852 598.98 13,089,000
Santa Barbara 1,480 16.67 24,672 630.95 15,566,800
Tulare 3,720 8.84 32,900 1,440.00 47,376,000
Ventura 18,541 16.82 311,874 803.89 250,713,000
Sum of Others 376 24.81 9,329 721.51 6,731,000
STATE TOTALS 43,450 12.66 549,976 856.96 471,305,400
Counties Reporting -- 11
LETTUCE, BULK SALAD PRODUCTS (Tons) (Tons)
Imperial 16,379 780.02 12,776,000
Monterey 251,600 416.27 104,734,000
San Benito 3,740 2.71 10,135 1,620.03 16,419,000
Sum of Others 364 3.02 1,100 7,357.45 8,093,200
STATE TOTALS 4,104 2.74 279,214 508.65 142,022,200
Counties Reporting -- 4
LETTUCE, HEAD (Tons) (Tons)
Fresno 14,600 19.83 289,500 347.90 100,718,000
Imperial 23,730 16.94 401,982 301.18 121,069,000
Kern 1,230 16.50 20,300 337.64 6,854,000
Monterey 54,919 20.59 1,130,850 407.31 460,605,000
Riverside 877 14.52 12,738 246.01 3,133,700
San Benito 1,327 21.85 28,995 280.01 8,119,000
San Luis Obispo 5,256 17.10 89,878 273.60 24,591,000
Santa Barbara 12,462 18.08 225,316 368.40 83,006,400
Santa Cruz 1,646 19.50 32,097 183.01 5,874,000
Ventura 123 7.99 983 661.24 650,000
Sum of Others 38 10.68 406 364.78 148,100
STATE TOTALS 116,208 19.22 2,233,045 364.87 814,768,200
Counties Reporting -- 11
LETTUCE, LEAF (Tons) (Tons)
Fresno 9,900 12.32 122,000 465.00 56,730,000
Imperial 12,702 16.87 214,283 493.14 105,672,000
Monterey 24,672 12.49 308,225 724.00 223,155,000
Riverside 1,270 12.09 15,353 732.73 11,249,600
San Benito 2,591 9.49 24,589 754.00 18,540,000
San Luis Obispo 2,332 7.25 16,907 691.19 11,686,000
Santa Barbara 4,235 11.82 50,055 588.66 29,465,400
Santa Cruz 1,229 13.51 16,604 372.02 6,177,000
Ventura 801 9.60 7,686 663.02 5,096,000
Sum of Others 6 2.17 13 3,846.15 50,000
STATE TOTALS 59,738 12.99 775,715 603.08 467,821,000
Counties Reporting -- 10
USDA, NASS, California Field Office 40
California County Agricultural
Commissioners' Data, 2008
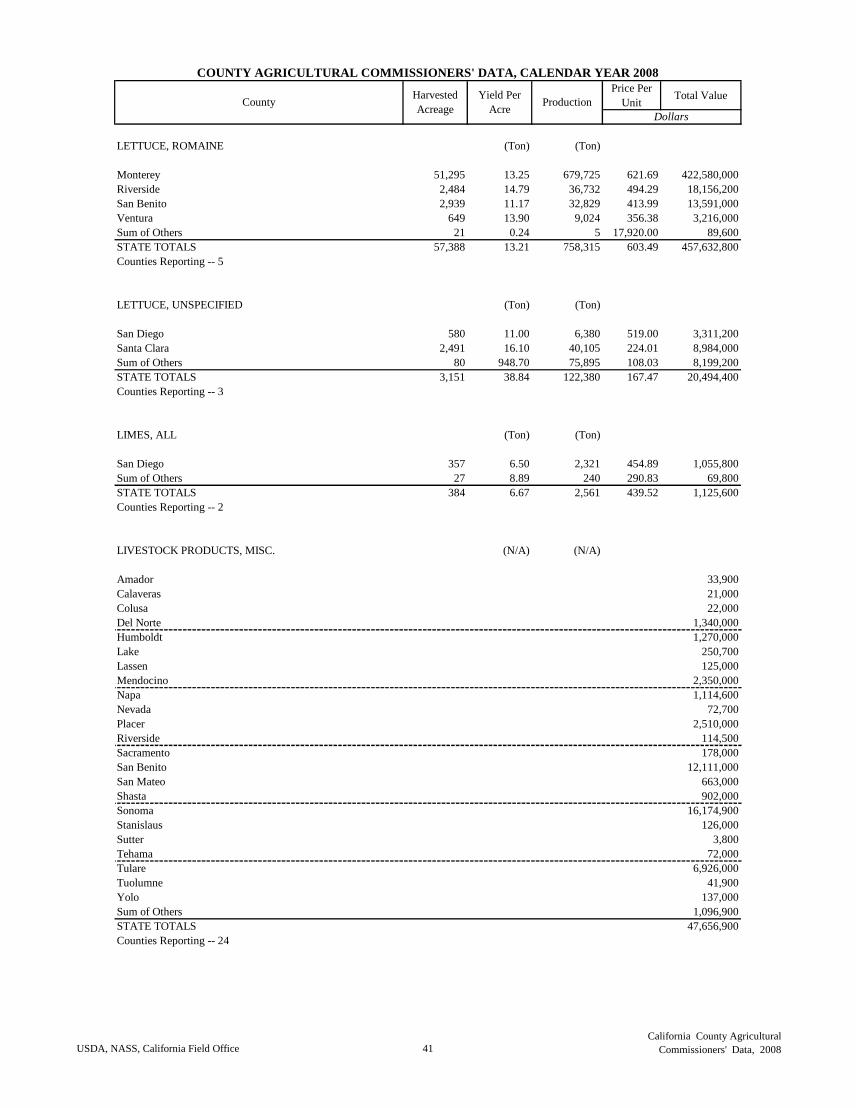
Price Per
UnitTotal Value
COUNTY AGRICULTURAL COMMISSIONERS' DATA, CALENDAR YEAR 2008
CountyHarvested
Acreage
Yield Per
AcreProduction
Dollars
LETTUCE, ROMAINE (Ton) (Ton)
Monterey 51,295 13.25 679,725 621.69 422,580,000
Riverside 2,484 14.79 36,732 494.29 18,156,200
San Benito 2,939 11.17 32,829 413.99 13,591,000
Ventura 649 13.90 9,024 356.38 3,216,000
Sum of Others 21 0.24 5 17,920.00 89,600
STATE TOTALS 57,388 13.21 758,315 603.49 457,632,800
Counties Reporting -- 5
LETTUCE, UNSPECIFIED (Ton) (Ton)
San Diego 580 11.00 6,380 519.00 3,311,200
Santa Clara 2,491 16.10 40,105 224.01 8,984,000
Sum of Others 80 948.70 75,895 108.03 8,199,200
STATE TOTALS 3,151 38.84 122,380 167.47 20,494,400
Counties Reporting -- 3
LIMES, ALL (Ton) (Ton)
San Diego 357 6.50 2,321 454.89 1,055,800
Sum of Others 27 8.89 240 290.83 69,800
STATE TOTALS 384 6.67 2,561 439.52 1,125,600
Counties Reporting -- 2
LIVESTOCK PRODUCTS, MISC. (N/A) (N/A)
Amador 33,900
Calaveras 21,000
Colusa 22,000
Del Norte 1,340,000
Humboldt 1,270,000
Lake 250,700
Lassen 125,000
Mendocino 2,350,000
Napa 1,114,600
Nevada 72,700
Placer 2,510,000
Riverside 114,500
Sacramento 178,000
San Benito 12,111,000
San Mateo 663,000
Shasta 902,000
Sonoma 16,174,900
Stanislaus 126,000
Sutter 3,800
Tehama 72,000
Tulare 6,926,000
Tuolumne 41,900
Yolo 137,000
Sum of Others 1,096,900
STATE TOTALS 47,656,900
Counties Reporting -- 24
USDA, NASS, California Field Office 41
California County Agricultural
Commissioners' Data, 2008
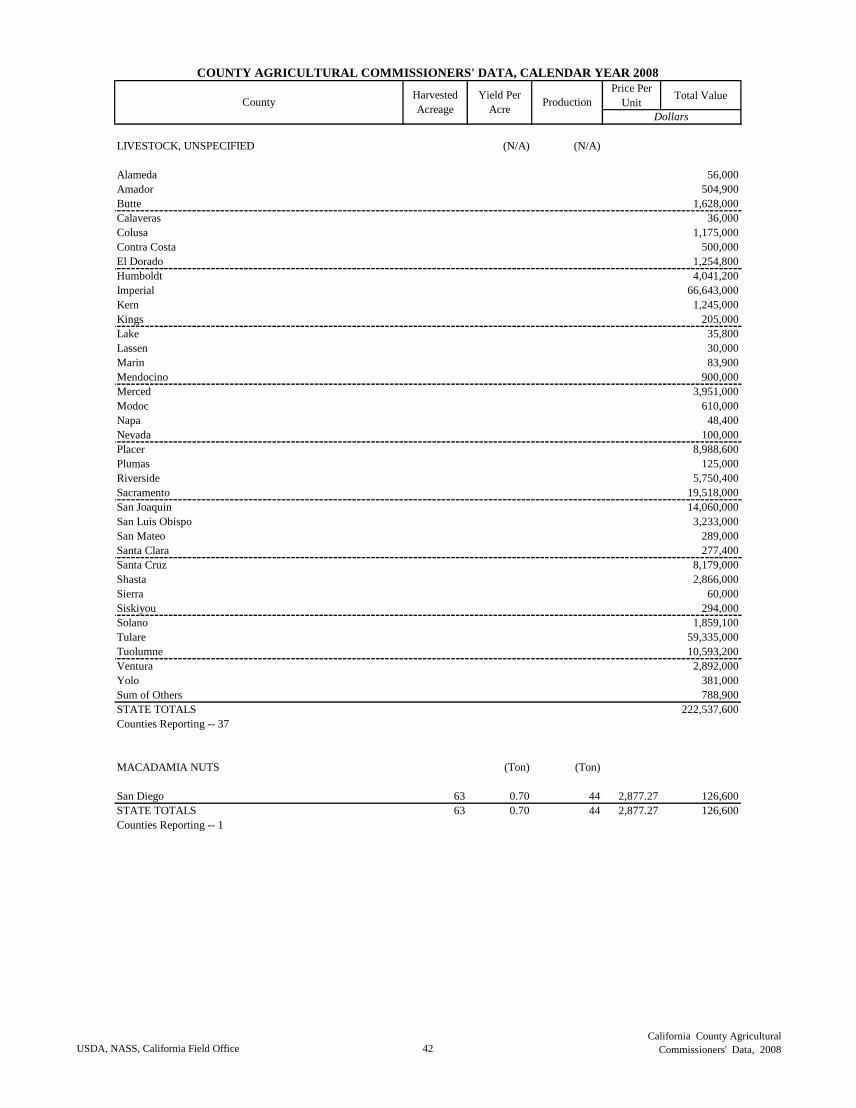
Price Per
UnitTotal Value
COUNTY AGRICULTURAL COMMISSIONERS' DATA, CALENDAR YEAR 2008
CountyHarvested
Acreage
Yield Per
AcreProduction
Dollars
LIVESTOCK, UNSPECIFIED (N/A) (N/A)
Alameda 56,000
Amador 504,900
Butte 1,628,000
Calaveras 36,000
Colusa 1,175,000
Contra Costa 500,000
El Dorado 1,254,800
Humboldt 4,041,200
Imperial 66,643,000
Kern 1,245,000
Kings 205,000
Lake 35,800
Lassen 30,000
Marin 83,900
Mendocino 900,000
Merced 3,951,000
Modoc 610,000
Napa 48,400
Nevada 100,000
Placer 8,988,600
Plumas 125,000
Riverside 5,750,400
Sacramento 19,518,000
San Joaquin 14,060,000
San Luis Obispo 3,233,000
San Mateo 289,000
Santa Clara 277,400
Santa Cruz 8,179,000
Shasta 2,866,000
Sierra 60,000
Siskiyou 294,000
Solano 1,859,100
Tulare 59,335,000
Tuolumne 10,593,200
Ventura 2,892,000
Yolo 381,000
Sum of Others 788,900
STATE TOTALS 222,537,600
Counties Reporting -- 37
MACADAMIA NUTS (Ton) (Ton)
San Diego 63 0.70 44 2,877.27 126,600
STATE TOTALS 63 0.70 44 2,877.27 126,600
Counties Reporting -- 1
USDA, NASS, California Field Office 42
California County Agricultural
Commissioners' Data, 2008
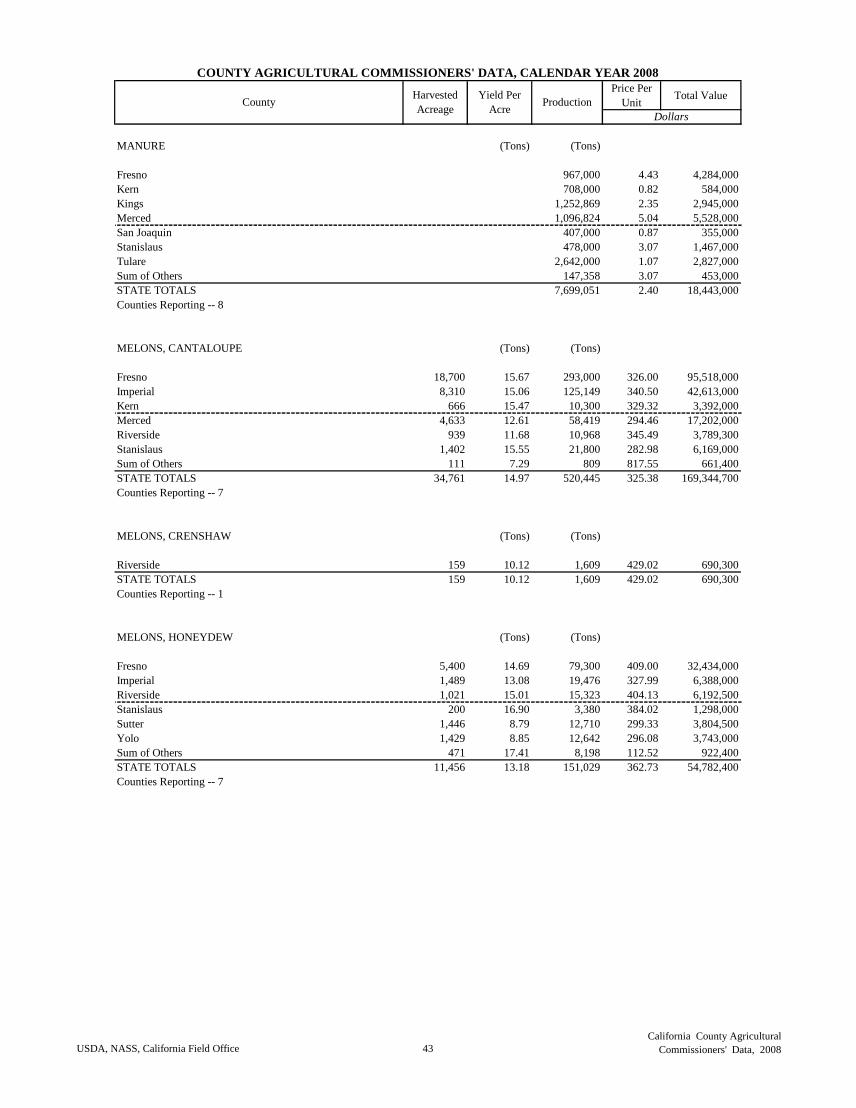
Price Per
UnitTotal Value
COUNTY AGRICULTURAL COMMISSIONERS' DATA, CALENDAR YEAR 2008
CountyHarvested
Acreage
Yield Per
AcreProduction
Dollars
MANURE (Tons) (Tons)
Fresno 967,000 4.43 4,284,000
Kern 708,000 0.82 584,000
Kings 1,252,869 2.35 2,945,000
Merced 1,096,824 5.04 5,528,000
San Joaquin 407,000 0.87 355,000
Stanislaus 478,000 3.07 1,467,000
Tulare 2,642,000 1.07 2,827,000
Sum of Others 147,358 3.07 453,000
STATE TOTALS 7,699,051 2.40 18,443,000
Counties Reporting -- 8
MELONS, CANTALOUPE (Tons) (Tons)
Fresno 18,700 15.67 293,000 326.00 95,518,000
Imperial 8,310 15.06 125,149 340.50 42,613,000
Kern 666 15.47 10,300 329.32 3,392,000
Merced 4,633 12.61 58,419 294.46 17,202,000
Riverside 939 11.68 10,968 345.49 3,789,300
Stanislaus 1,402 15.55 21,800 282.98 6,169,000
Sum of Others 111 7.29 809 817.55 661,400
STATE TOTALS 34,761 14.97 520,445 325.38 169,344,700
Counties Reporting -- 7
MELONS, CRENSHAW (Tons) (Tons)
Riverside 159 10.12 1,609 429.02 690,300
STATE TOTALS 159 10.12 1,609 429.02 690,300
Counties Reporting -- 1
MELONS, HONEYDEW (Tons) (Tons)
Fresno 5,400 14.69 79,300 409.00 32,434,000
Imperial 1,489 13.08 19,476 327.99 6,388,000
Riverside 1,021 15.01 15,323 404.13 6,192,500
Stanislaus 200 16.90 3,380 384.02 1,298,000
Sutter 1,446 8.79 12,710 299.33 3,804,500
Yolo 1,429 8.85 12,642 296.08 3,743,000
Sum of Others 471 17.41 8,198 112.52 922,400
STATE TOTALS 11,456 13.18 151,029 362.73 54,782,400
Counties Reporting -- 7
USDA, NASS, California Field Office 43
California County Agricultural
Commissioners' Data, 2008
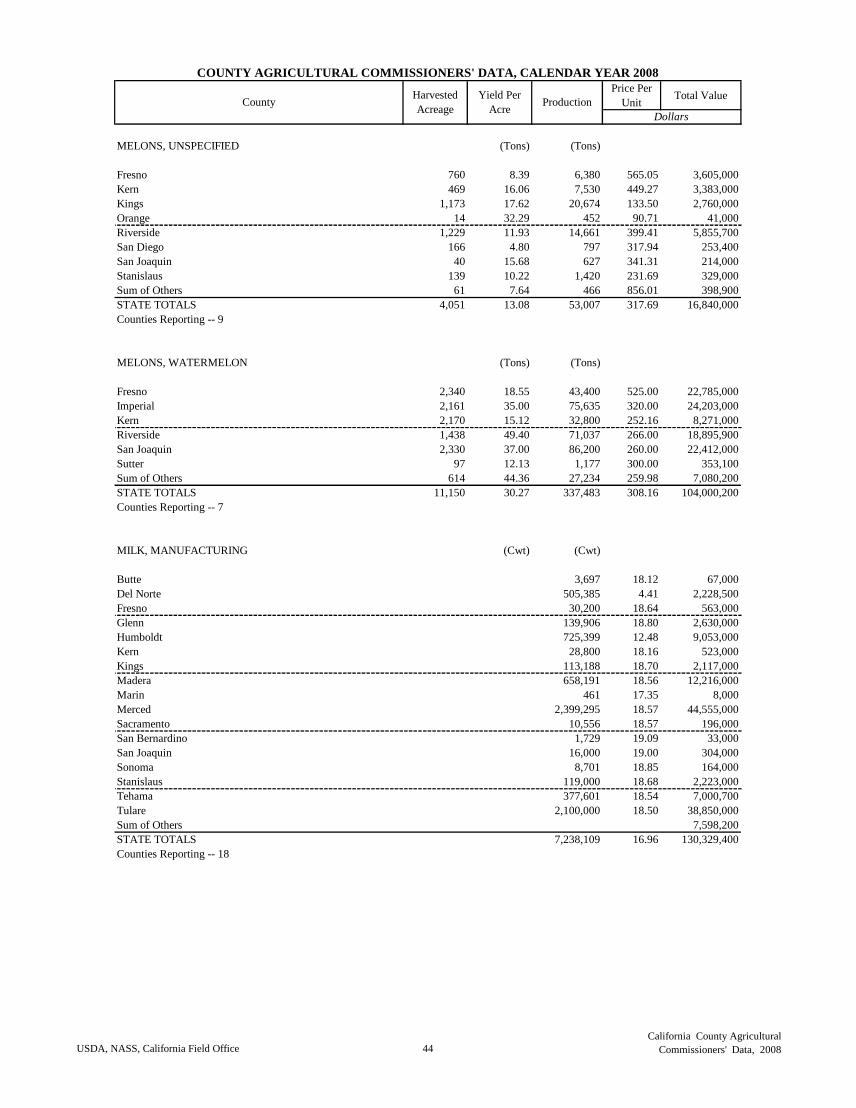
Price Per
UnitTotal Value
COUNTY AGRICULTURAL COMMISSIONERS' DATA, CALENDAR YEAR 2008
CountyHarvested
Acreage
Yield Per
AcreProduction
Dollars
MELONS, UNSPECIFIED (Tons) (Tons)
Fresno 760 8.39 6,380 565.05 3,605,000
Kern 469 16.06 7,530 449.27 3,383,000
Kings 1,173 17.62 20,674 133.50 2,760,000
Orange 14 32.29 452 90.71 41,000
Riverside 1,229 11.93 14,661 399.41 5,855,700
San Diego 166 4.80 797 317.94 253,400
San Joaquin 40 15.68 627 341.31 214,000
Stanislaus 139 10.22 1,420 231.69 329,000
Sum of Others 61 7.64 466 856.01 398,900
STATE TOTALS 4,051 13.08 53,007 317.69 16,840,000
Counties Reporting -- 9
MELONS, WATERMELON (Tons) (Tons)
Fresno 2,340 18.55 43,400 525.00 22,785,000
Imperial 2,161 35.00 75,635 320.00 24,203,000
Kern 2,170 15.12 32,800 252.16 8,271,000
Riverside 1,438 49.40 71,037 266.00 18,895,900
San Joaquin 2,330 37.00 86,200 260.00 22,412,000
Sutter 97 12.13 1,177 300.00 353,100
Sum of Others 614 44.36 27,234 259.98 7,080,200
STATE TOTALS 11,150 30.27 337,483 308.16 104,000,200
Counties Reporting -- 7
MILK, MANUFACTURING (Cwt) (Cwt)
Butte 3,697 18.12 67,000
Del Norte 505,385 4.41 2,228,500
Fresno 30,200 18.64 563,000
Glenn 139,906 18.80 2,630,000
Humboldt 725,399 12.48 9,053,000
Kern 28,800 18.16 523,000
Kings 113,188 18.70 2,117,000
Madera 658,191 18.56 12,216,000
Marin 461 17.35 8,000
Merced 2,399,295 18.57 44,555,000
Sacramento 10,556 18.57 196,000
San Bernardino 1,729 19.09 33,000
San Joaquin 16,000 19.00 304,000
Sonoma 8,701 18.85 164,000
Stanislaus 119,000 18.68 2,223,000
Tehama 377,601 18.54 7,000,700
Tulare 2,100,000 18.50 38,850,000
Sum of Others 7,598,200
STATE TOTALS 7,238,109 16.96 130,329,400
Counties Reporting -- 18
USDA, NASS, California Field Office 44
California County Agricultural
Commissioners' Data, 2008
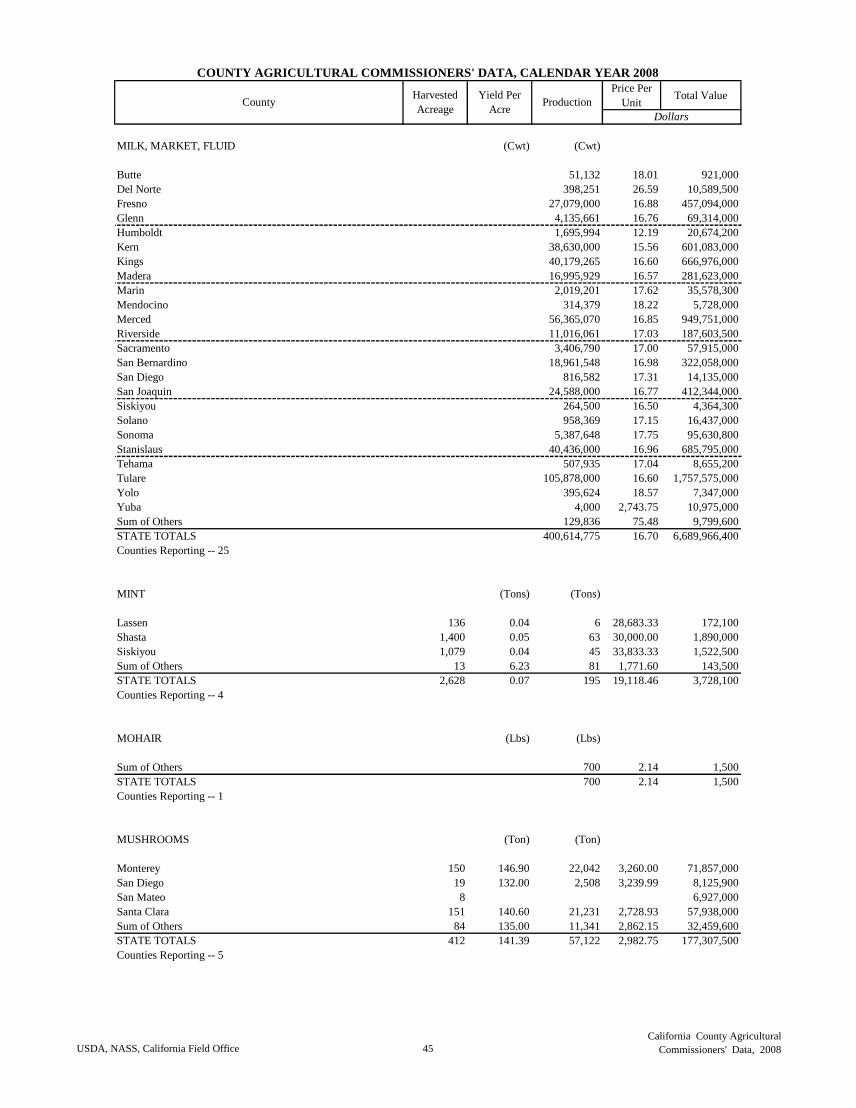
Price Per
UnitTotal Value
COUNTY AGRICULTURAL COMMISSIONERS' DATA, CALENDAR YEAR 2008
CountyHarvested
Acreage
Yield Per
AcreProduction
Dollars
MILK, MARKET, FLUID (Cwt) (Cwt)
Butte 51,132 18.01 921,000
Del Norte 398,251 26.59 10,589,500
Fresno 27,079,000 16.88 457,094,000
Glenn 4,135,661 16.76 69,314,000
Humboldt 1,695,994 12.19 20,674,200
Kern 38,630,000 15.56 601,083,000
Kings 40,179,265 16.60 666,976,000
Madera 16,995,929 16.57 281,623,000
Marin 2,019,201 17.62 35,578,300
Mendocino 314,379 18.22 5,728,000
Merced 56,365,070 16.85 949,751,000
Riverside 11,016,061 17.03 187,603,500
Sacramento 3,406,790 17.00 57,915,000
San Bernardino 18,961,548 16.98 322,058,000
San Diego 816,582 17.31 14,135,000
San Joaquin 24,588,000 16.77 412,344,000
Siskiyou 264,500 16.50 4,364,300
Solano 958,369 17.15 16,437,000
Sonoma 5,387,648 17.75 95,630,800
Stanislaus 40,436,000 16.96 685,795,000
Tehama 507,935 17.04 8,655,200
Tulare 105,878,000 16.60 1,757,575,000
Yolo 395,624 18.57 7,347,000
Yuba 4,000 2,743.75 10,975,000
Sum of Others 129,836 75.48 9,799,600
STATE TOTALS 400,614,775 16.70 6,689,966,400
Counties Reporting -- 25
MINT (Tons) (Tons)
Lassen 136 0.04 6 28,683.33 172,100
Shasta 1,400 0.05 63 30,000.00 1,890,000
Siskiyou 1,079 0.04 45 33,833.33 1,522,500
Sum of Others 13 6.23 81 1,771.60 143,500
STATE TOTALS 2,628 0.07 195 19,118.46 3,728,100
Counties Reporting -- 4
MOHAIR (Lbs) (Lbs)
Sum of Others 700 2.14 1,500
STATE TOTALS 700 2.14 1,500
Counties Reporting -- 1
MUSHROOMS (Ton) (Ton)
Monterey 150 146.90 22,042 3,260.00 71,857,000
San Diego 19 132.00 2,508 3,239.99 8,125,900
San Mateo 8 6,927,000
Santa Clara 151 140.60 21,231 2,728.93 57,938,000
Sum of Others 84 135.00 11,341 2,862.15 32,459,600
STATE TOTALS 412 141.39 57,122 2,982.75 177,307,500
Counties Reporting -- 5
USDA, NASS, California Field Office 45
California County Agricultural
Commissioners' Data, 2008
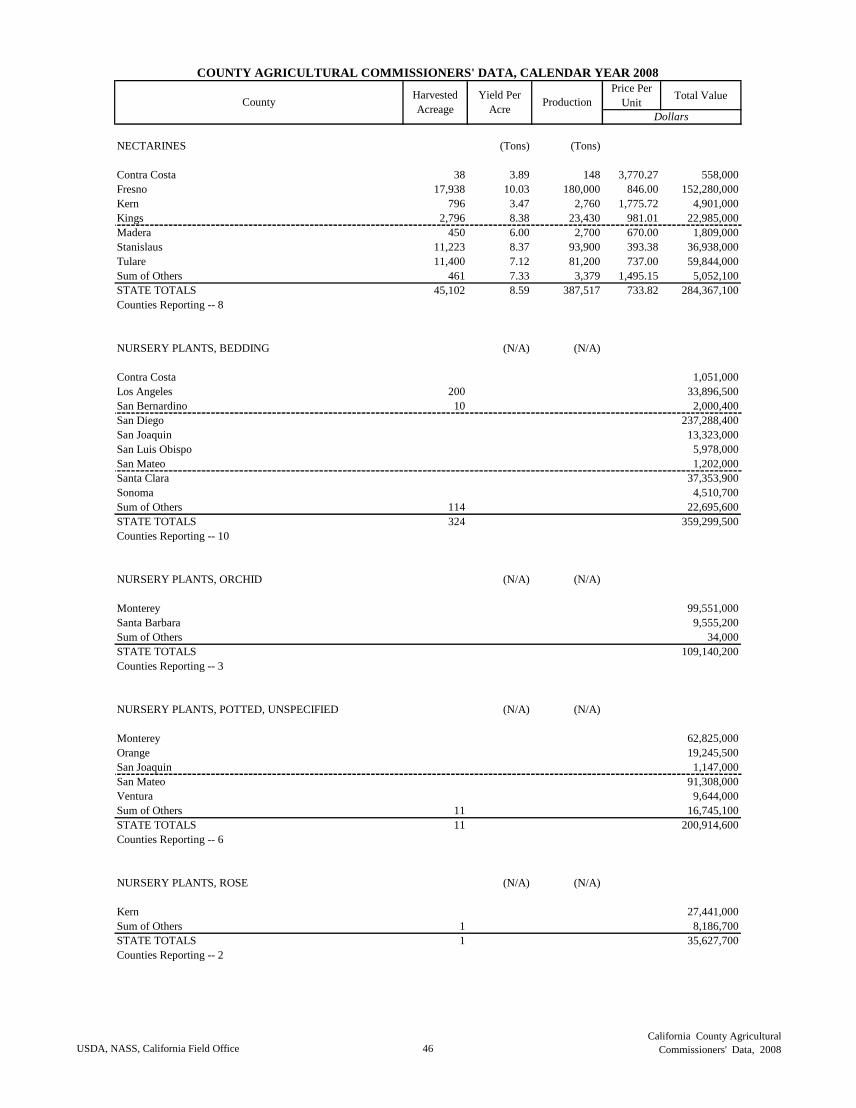
Price Per
UnitTotal Value
COUNTY AGRICULTURAL COMMISSIONERS' DATA, CALENDAR YEAR 2008
CountyHarvested
Acreage
Yield Per
AcreProduction
Dollars
NECTARINES (Tons) (Tons)
Contra Costa 38 3.89 148 3,770.27 558,000
Fresno 17,938 10.03 180,000 846.00 152,280,000
Kern 796 3.47 2,760 1,775.72 4,901,000
Kings 2,796 8.38 23,430 981.01 22,985,000
Madera 450 6.00 2,700 670.00 1,809,000
Stanislaus 11,223 8.37 93,900 393.38 36,938,000
Tulare 11,400 7.12 81,200 737.00 59,844,000
Sum of Others 461 7.33 3,379 1,495.15 5,052,100
STATE TOTALS 45,102 8.59 387,517 733.82 284,367,100
Counties Reporting -- 8
NURSERY PLANTS, BEDDING (N/A) (N/A)
Contra Costa 1,051,000
Los Angeles 200 33,896,500
San Bernardino 10 2,000,400
San Diego 237,288,400
San Joaquin 13,323,000
San Luis Obispo 5,978,000
San Mateo 1,202,000
Santa Clara 37,353,900
Sonoma 4,510,700
Sum of Others 114 22,695,600
STATE TOTALS 324 359,299,500
Counties Reporting -- 10
NURSERY PLANTS, ORCHID (N/A) (N/A)
Monterey 99,551,000
Santa Barbara 9,555,200
Sum of Others 34,000
STATE TOTALS 109,140,200
Counties Reporting -- 3
NURSERY PLANTS, POTTED, UNSPECIFIED (N/A) (N/A)
Monterey 62,825,000
Orange 19,245,500
San Joaquin 1,147,000
San Mateo 91,308,000
Ventura 9,644,000
Sum of Others 11 16,745,100
STATE TOTALS 11 200,914,600
Counties Reporting -- 6
NURSERY PLANTS, ROSE (N/A) (N/A)
Kern 27,441,000
Sum of Others 1 8,186,700
STATE TOTALS 1 35,627,700
Counties Reporting -- 2
USDA, NASS, California Field Office 46
California County Agricultural
Commissioners' Data, 2008
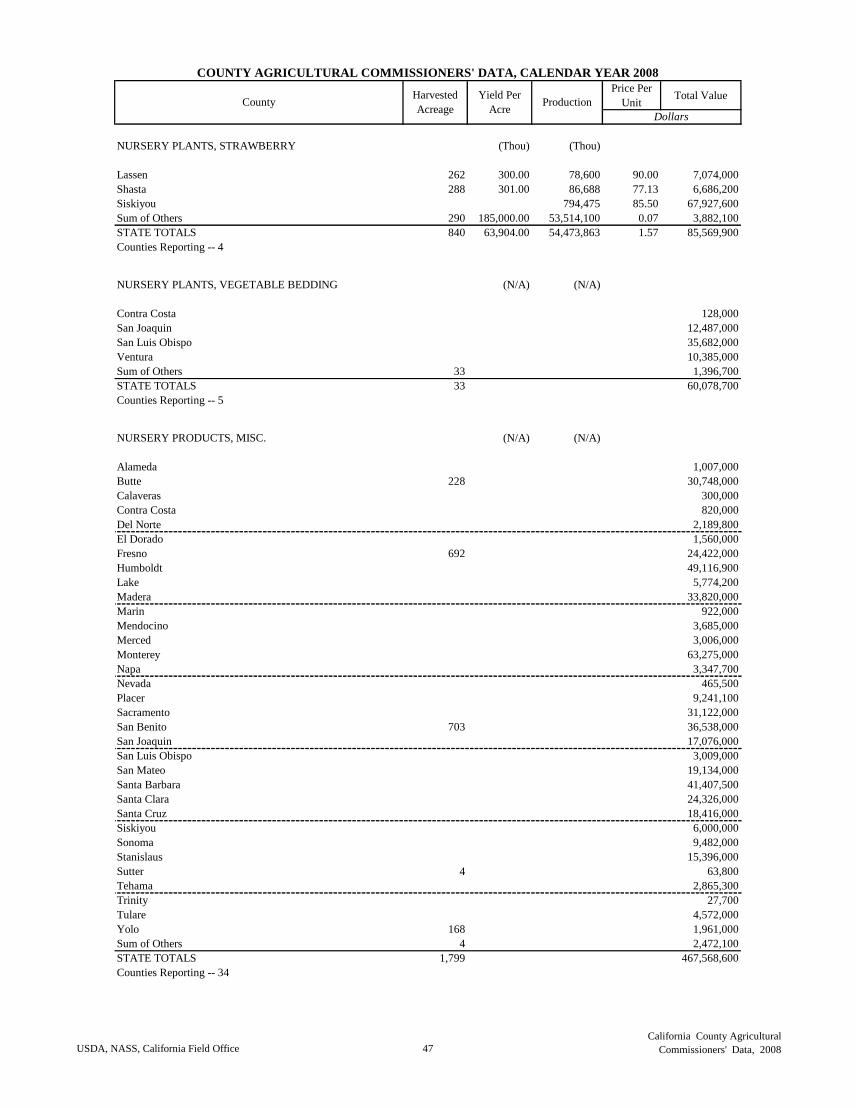
Price Per
UnitTotal Value
COUNTY AGRICULTURAL COMMISSIONERS' DATA, CALENDAR YEAR 2008
CountyHarvested
Acreage
Yield Per
AcreProduction
Dollars
NURSERY PLANTS, STRAWBERRY (Thou) (Thou)
Lassen 262 300.00 78,600 90.00 7,074,000
Shasta 288 301.00 86,688 77.13 6,686,200
Siskiyou 794,475 85.50 67,927,600
Sum of Others 290 185,000.00 53,514,100 0.07 3,882,100
STATE TOTALS 840 63,904.00 54,473,863 1.57 85,569,900
Counties Reporting -- 4
NURSERY PLANTS, VEGETABLE BEDDING (N/A) (N/A)
Contra Costa 128,000
San Joaquin 12,487,000
San Luis Obispo 35,682,000
Ventura 10,385,000
Sum of Others 33 1,396,700
STATE TOTALS 33 60,078,700
Counties Reporting -- 5
NURSERY PRODUCTS, MISC. (N/A) (N/A)
Alameda 1,007,000
Butte 228 30,748,000
Calaveras 300,000
Contra Costa 820,000
Del Norte 2,189,800
El Dorado 1,560,000
Fresno 692 24,422,000
Humboldt 49,116,900
Lake 5,774,200
Madera 33,820,000
Marin 922,000
Mendocino 3,685,000
Merced 3,006,000
Monterey 63,275,000
Napa 3,347,700
Nevada 465,500
Placer 9,241,100
Sacramento 31,122,000
San Benito 703 36,538,000
San Joaquin 17,076,000
San Luis Obispo 3,009,000
San Mateo 19,134,000
Santa Barbara 41,407,500
Santa Clara 24,326,000
Santa Cruz 18,416,000
Siskiyou 6,000,000
Sonoma 9,482,000
Stanislaus 15,396,000
Sutter 4 63,800
Tehama 2,865,300
Trinity 27,700
Tulare 4,572,000
Yolo 168 1,961,000
Sum of Others 4 2,472,100
STATE TOTALS 1,799 467,568,600
Counties Reporting -- 34
USDA, NASS, California Field Office 47
California County Agricultural
Commissioners' Data, 2008
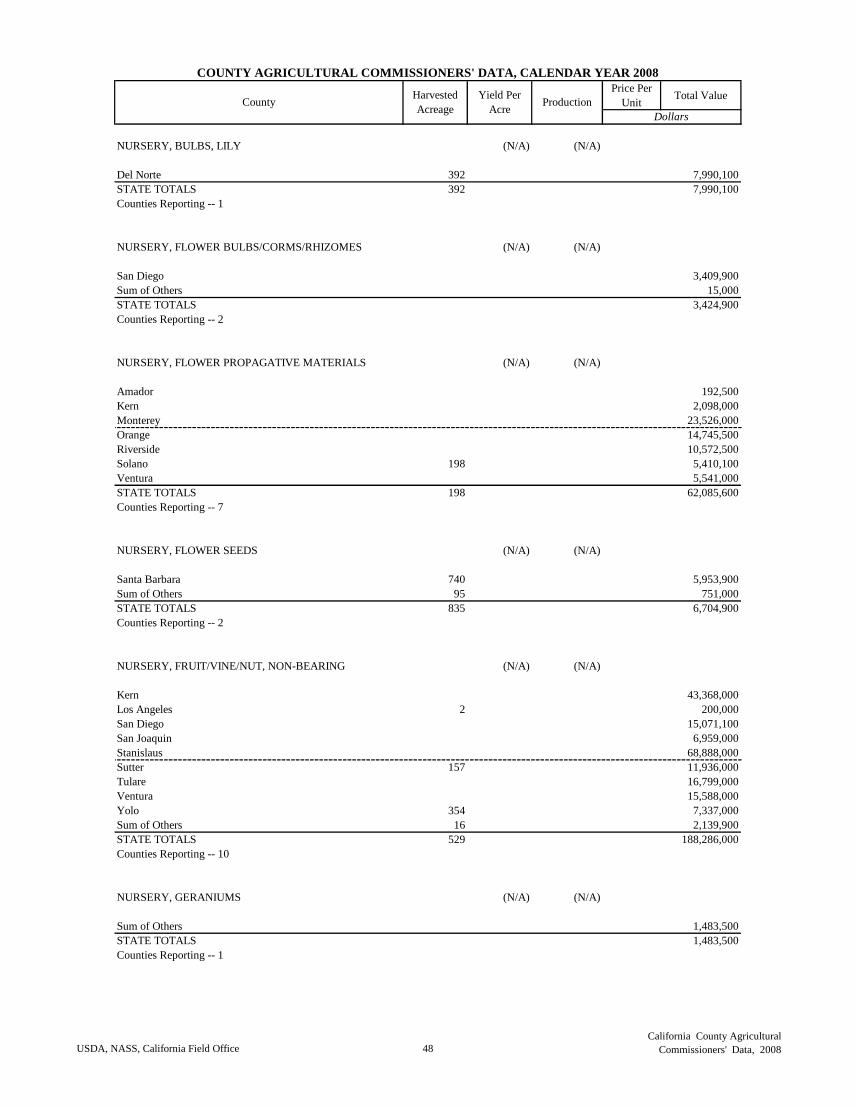
Price Per
UnitTotal Value
COUNTY AGRICULTURAL COMMISSIONERS' DATA, CALENDAR YEAR 2008
CountyHarvested
Acreage
Yield Per
AcreProduction
Dollars
NURSERY, BULBS, LILY (N/A) (N/A)
Del Norte 392 7,990,100
STATE TOTALS 392 7,990,100
Counties Reporting -- 1
NURSERY, FLOWER BULBS/CORMS/RHIZOMES (N/A) (N/A)
San Diego 3,409,900
Sum of Others 15,000
STATE TOTALS 3,424,900
Counties Reporting -- 2
NURSERY, FLOWER PROPAGATIVE MATERIALS (N/A) (N/A)
Amador 192,500
Kern 2,098,000
Monterey 23,526,000
Orange 14,745,500
Riverside 10,572,500
Solano 198 5,410,100
Ventura 5,541,000
STATE TOTALS 198 62,085,600
Counties Reporting -- 7
NURSERY, FLOWER SEEDS (N/A) (N/A)
Santa Barbara 740 5,953,900
Sum of Others 95 751,000
STATE TOTALS 835 6,704,900
Counties Reporting -- 2
NURSERY, FRUIT/VINE/NUT, NON-BEARING (N/A) (N/A)
Kern 43,368,000
Los Angeles 2 200,000
San Diego 15,071,100
San Joaquin 6,959,000
Stanislaus 68,888,000
Sutter 157 11,936,000
Tulare 16,799,000
Ventura 15,588,000
Yolo 354 7,337,000
Sum of Others 16 2,139,900
STATE TOTALS 529 188,286,000
Counties Reporting -- 10
NURSERY, GERANIUMS (N/A) (N/A)
Sum of Others 1,483,500
STATE TOTALS 1,483,500
Counties Reporting -- 1
USDA, NASS, California Field Office 48
California County Agricultural
Commissioners' Data, 2008
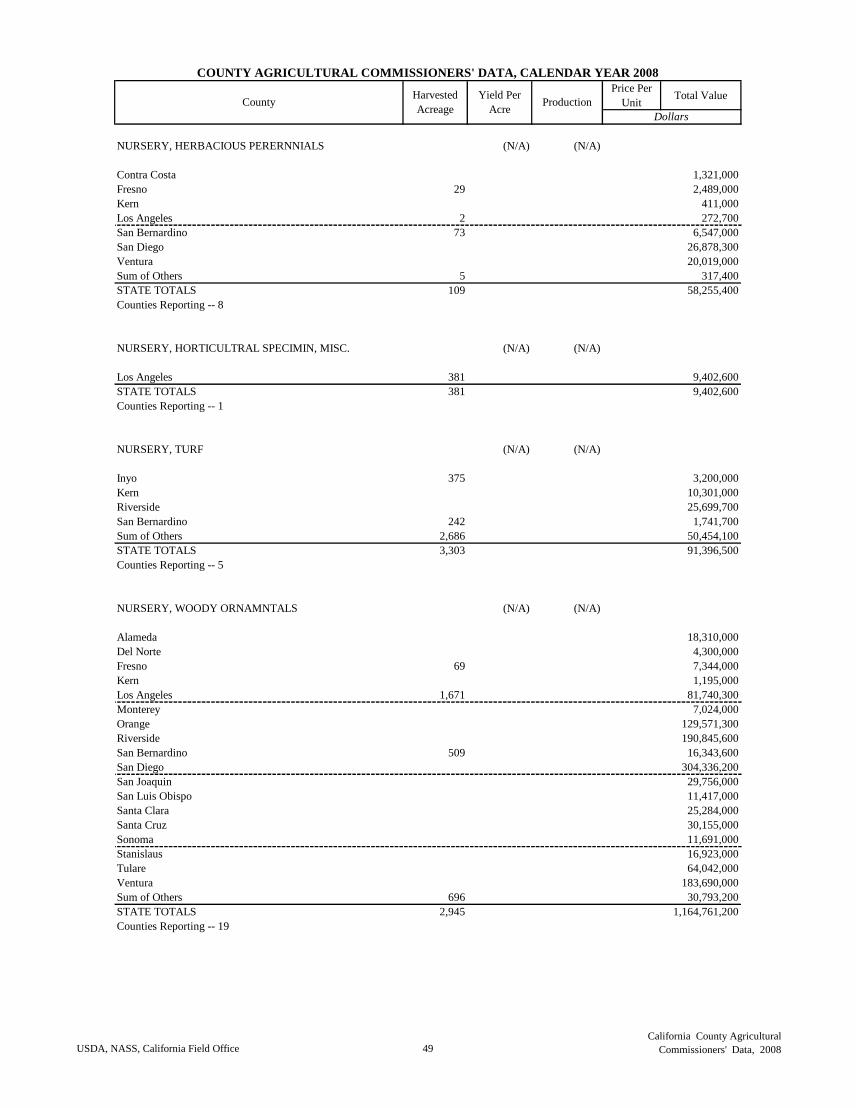
Price Per
UnitTotal Value
COUNTY AGRICULTURAL COMMISSIONERS' DATA, CALENDAR YEAR 2008
CountyHarvested
Acreage
Yield Per
AcreProduction
Dollars
NURSERY, HERBACIOUS PERERNNIALS (N/A) (N/A)
Contra Costa 1,321,000
Fresno 29 2,489,000
Kern 411,000
Los Angeles 2 272,700
San Bernardino 73 6,547,000
San Diego 26,878,300
Ventura 20,019,000
Sum of Others 5 317,400
STATE TOTALS 109 58,255,400
Counties Reporting -- 8
NURSERY, HORTICULTRAL SPECIMIN, MISC. (N/A) (N/A)
Los Angeles 381 9,402,600
STATE TOTALS 381 9,402,600
Counties Reporting -- 1
NURSERY, TURF (N/A) (N/A)
Inyo 375 3,200,000
Kern 10,301,000
Riverside 25,699,700
San Bernardino 242 1,741,700
Sum of Others 2,686 50,454,100
STATE TOTALS 3,303 91,396,500
Counties Reporting -- 5
NURSERY, WOODY ORNAMNTALS (N/A) (N/A)
Alameda 18,310,000
Del Norte 4,300,000
Fresno 69 7,344,000
Kern 1,195,000
Los Angeles 1,671 81,740,300
Monterey 7,024,000
Orange 129,571,300
Riverside 190,845,600
San Bernardino 509 16,343,600
San Diego 304,336,200
San Joaquin 29,756,000
San Luis Obispo 11,417,000
Santa Clara 25,284,000
Santa Cruz 30,155,000
Sonoma 11,691,000
Stanislaus 16,923,000
Tulare 64,042,000
Ventura 183,690,000
Sum of Others 696 30,793,200
STATE TOTALS 2,945 1,164,761,200
Counties Reporting -- 19
USDA, NASS, California Field Office 49
California County Agricultural
Commissioners' Data, 2008
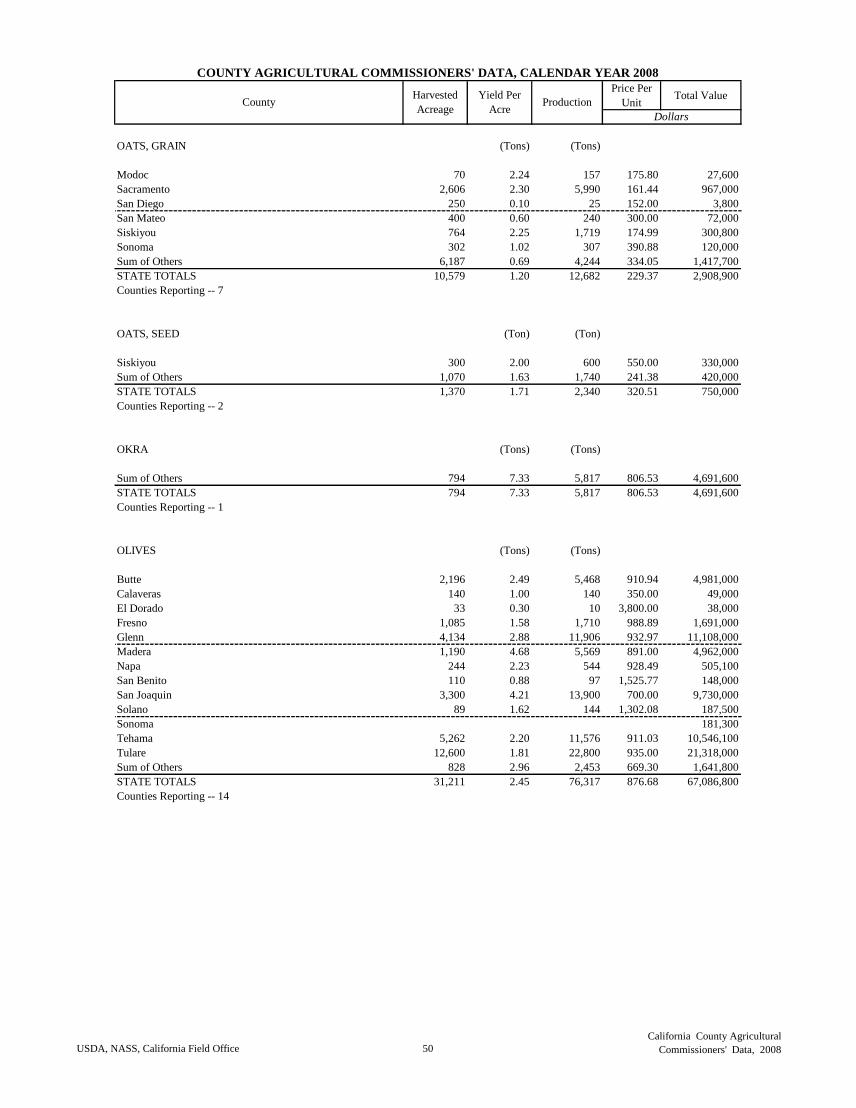
Price Per
UnitTotal Value
COUNTY AGRICULTURAL COMMISSIONERS' DATA, CALENDAR YEAR 2008
CountyHarvested
Acreage
Yield Per
AcreProduction
Dollars
OATS, GRAIN (Tons) (Tons)
Modoc 70 2.24 157 175.80 27,600
Sacramento 2,606 2.30 5,990 161.44 967,000
San Diego 250 0.10 25 152.00 3,800
San Mateo 400 0.60 240 300.00 72,000
Siskiyou 764 2.25 1,719 174.99 300,800
Sonoma 302 1.02 307 390.88 120,000
Sum of Others 6,187 0.69 4,244 334.05 1,417,700
STATE TOTALS 10,579 1.20 12,682 229.37 2,908,900
Counties Reporting -- 7
OATS, SEED (Ton) (Ton)
Siskiyou 300 2.00 600 550.00 330,000
Sum of Others 1,070 1.63 1,740 241.38 420,000
STATE TOTALS 1,370 1.71 2,340 320.51 750,000
Counties Reporting -- 2
OKRA (Tons) (Tons)
Sum of Others 794 7.33 5,817 806.53 4,691,600
STATE TOTALS 794 7.33 5,817 806.53 4,691,600
Counties Reporting -- 1
OLIVES (Tons) (Tons)
Butte 2,196 2.49 5,468 910.94 4,981,000
Calaveras 140 1.00 140 350.00 49,000
El Dorado 33 0.30 10 3,800.00 38,000
Fresno 1,085 1.58 1,710 988.89 1,691,000
Glenn 4,134 2.88 11,906 932.97 11,108,000
Madera 1,190 4.68 5,569 891.00 4,962,000
Napa 244 2.23 544 928.49 505,100
San Benito 110 0.88 97 1,525.77 148,000
San Joaquin 3,300 4.21 13,900 700.00 9,730,000
Solano 89 1.62 144 1,302.08 187,500
Sonoma 181,300
Tehama 5,262 2.20 11,576 911.03 10,546,100
Tulare 12,600 1.81 22,800 935.00 21,318,000
Sum of Others 828 2.96 2,453 669.30 1,641,800
STATE TOTALS 31,211 2.45 76,317 876.68 67,086,800
Counties Reporting -- 14
USDA, NASS, California Field Office 50
California County Agricultural
Commissioners' Data, 2008
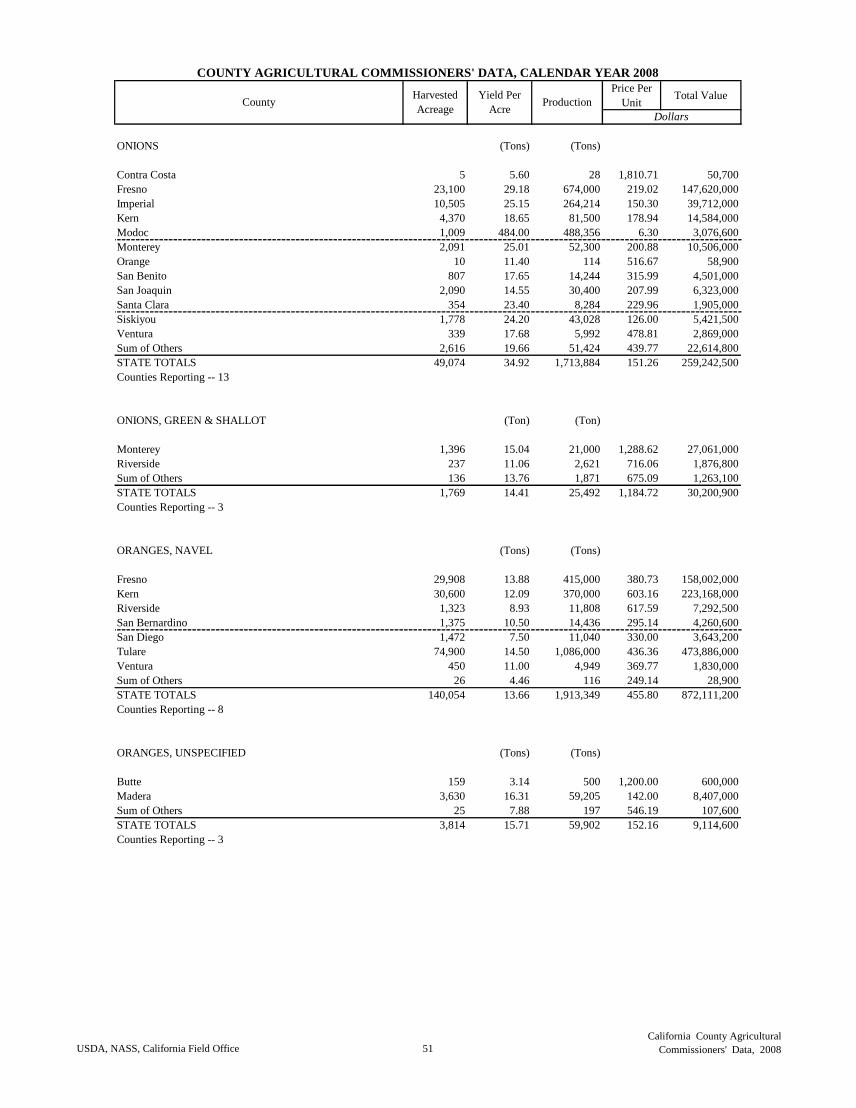
Price Per
UnitTotal Value
COUNTY AGRICULTURAL COMMISSIONERS' DATA, CALENDAR YEAR 2008
CountyHarvested
Acreage
Yield Per
AcreProduction
Dollars
ONIONS (Tons) (Tons)
Contra Costa 5 5.60 28 1,810.71 50,700
Fresno 23,100 29.18 674,000 219.02 147,620,000
Imperial 10,505 25.15 264,214 150.30 39,712,000
Kern 4,370 18.65 81,500 178.94 14,584,000
Modoc 1,009 484.00 488,356 6.30 3,076,600
Monterey 2,091 25.01 52,300 200.88 10,506,000
Orange 10 11.40 114 516.67 58,900
San Benito 807 17.65 14,244 315.99 4,501,000
San Joaquin 2,090 14.55 30,400 207.99 6,323,000
Santa Clara 354 23.40 8,284 229.96 1,905,000
Siskiyou 1,778 24.20 43,028 126.00 5,421,500
Ventura 339 17.68 5,992 478.81 2,869,000
Sum of Others 2,616 19.66 51,424 439.77 22,614,800
STATE TOTALS 49,074 34.92 1,713,884 151.26 259,242,500
Counties Reporting -- 13
ONIONS, GREEN & SHALLOT (Ton) (Ton)
Monterey 1,396 15.04 21,000 1,288.62 27,061,000
Riverside 237 11.06 2,621 716.06 1,876,800
Sum of Others 136 13.76 1,871 675.09 1,263,100
STATE TOTALS 1,769 14.41 25,492 1,184.72 30,200,900
Counties Reporting -- 3
ORANGES, NAVEL (Tons) (Tons)
Fresno 29,908 13.88 415,000 380.73 158,002,000
Kern 30,600 12.09 370,000 603.16 223,168,000
Riverside 1,323 8.93 11,808 617.59 7,292,500
San Bernardino 1,375 10.50 14,436 295.14 4,260,600
San Diego 1,472 7.50 11,040 330.00 3,643,200
Tulare 74,900 14.50 1,086,000 436.36 473,886,000
Ventura 450 11.00 4,949 369.77 1,830,000
Sum of Others 26 4.46 116 249.14 28,900
STATE TOTALS 140,054 13.66 1,913,349 455.80 872,111,200
Counties Reporting -- 8
ORANGES, UNSPECIFIED (Tons) (Tons)
Butte 159 3.14 500 1,200.00 600,000
Madera 3,630 16.31 59,205 142.00 8,407,000
Sum of Others 25 7.88 197 546.19 107,600
STATE TOTALS 3,814 15.71 59,902 152.16 9,114,600
Counties Reporting -- 3
USDA, NASS, California Field Office 51
California County Agricultural
Commissioners' Data, 2008
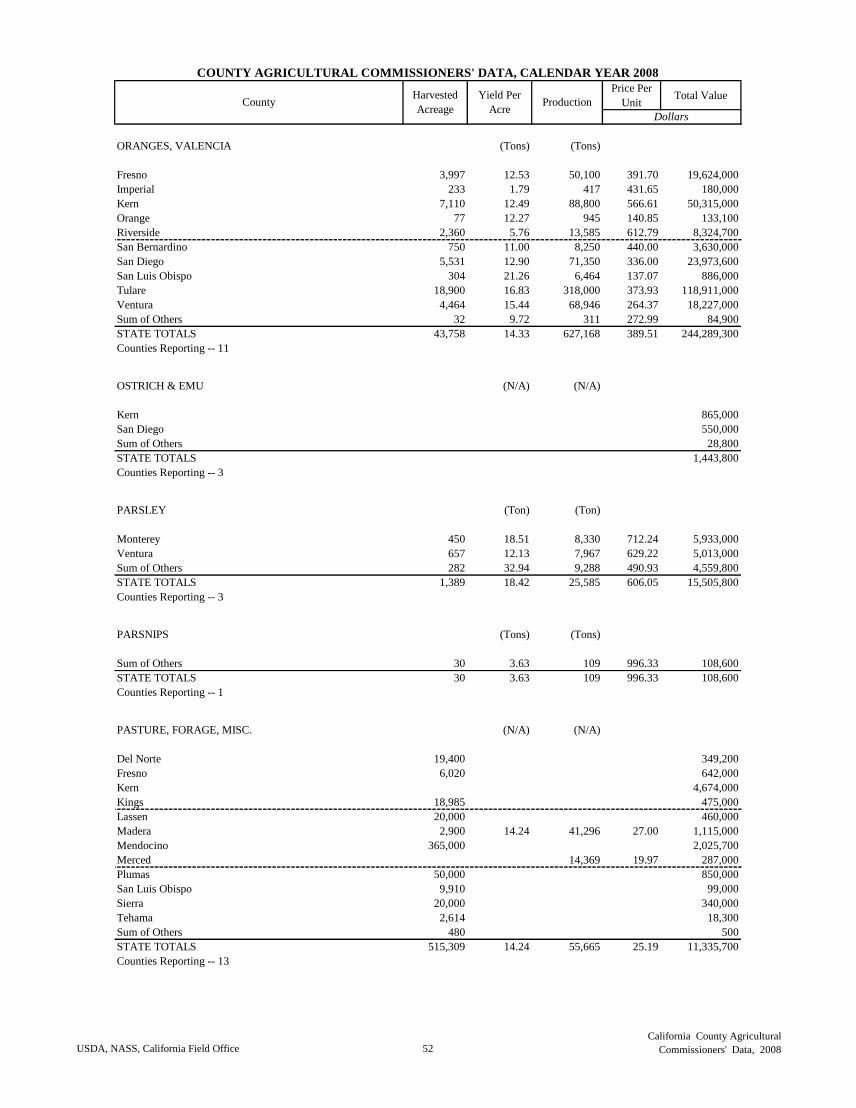
Price Per
UnitTotal Value
COUNTY AGRICULTURAL COMMISSIONERS' DATA, CALENDAR YEAR 2008
CountyHarvested
Acreage
Yield Per
AcreProduction
Dollars
ORANGES, VALENCIA (Tons) (Tons)
Fresno 3,997 12.53 50,100 391.70 19,624,000
Imperial 233 1.79 417 431.65 180,000
Kern 7,110 12.49 88,800 566.61 50,315,000
Orange 77 12.27 945 140.85 133,100
Riverside 2,360 5.76 13,585 612.79 8,324,700
San Bernardino 750 11.00 8,250 440.00 3,630,000
San Diego 5,531 12.90 71,350 336.00 23,973,600
San Luis Obispo 304 21.26 6,464 137.07 886,000
Tulare 18,900 16.83 318,000 373.93 118,911,000
Ventura 4,464 15.44 68,946 264.37 18,227,000
Sum of Others 32 9.72 311 272.99 84,900
STATE TOTALS 43,758 14.33 627,168 389.51 244,289,300
Counties Reporting -- 11
OSTRICH & EMU (N/A) (N/A)
Kern 865,000
San Diego 550,000
Sum of Others 28,800
STATE TOTALS 1,443,800
Counties Reporting -- 3
PARSLEY (Ton) (Ton)
Monterey 450 18.51 8,330 712.24 5,933,000
Ventura 657 12.13 7,967 629.22 5,013,000
Sum of Others 282 32.94 9,288 490.93 4,559,800
STATE TOTALS 1,389 18.42 25,585 606.05 15,505,800
Counties Reporting -- 3
PARSNIPS (Tons) (Tons)
Sum of Others 30 3.63 109 996.33 108,600
STATE TOTALS 30 3.63 109 996.33 108,600
Counties Reporting -- 1
PASTURE, FORAGE, MISC. (N/A) (N/A)
Del Norte 19,400 349,200
Fresno 6,020 642,000
Kern 4,674,000
Kings 18,985 475,000
Lassen 20,000 460,000
Madera 2,900 14.24 41,296 27.00 1,115,000
Mendocino 365,000 2,025,700
Merced 14,369 19.97 287,000
Plumas 50,000 850,000
San Luis Obispo 9,910 99,000
Sierra 20,000 340,000
Tehama 2,614 18,300
Sum of Others 480 500
STATE TOTALS 515,309 14.24 55,665 25.19 11,335,700
Counties Reporting -- 13
USDA, NASS, California Field Office 52
California County Agricultural
Commissioners' Data, 2008
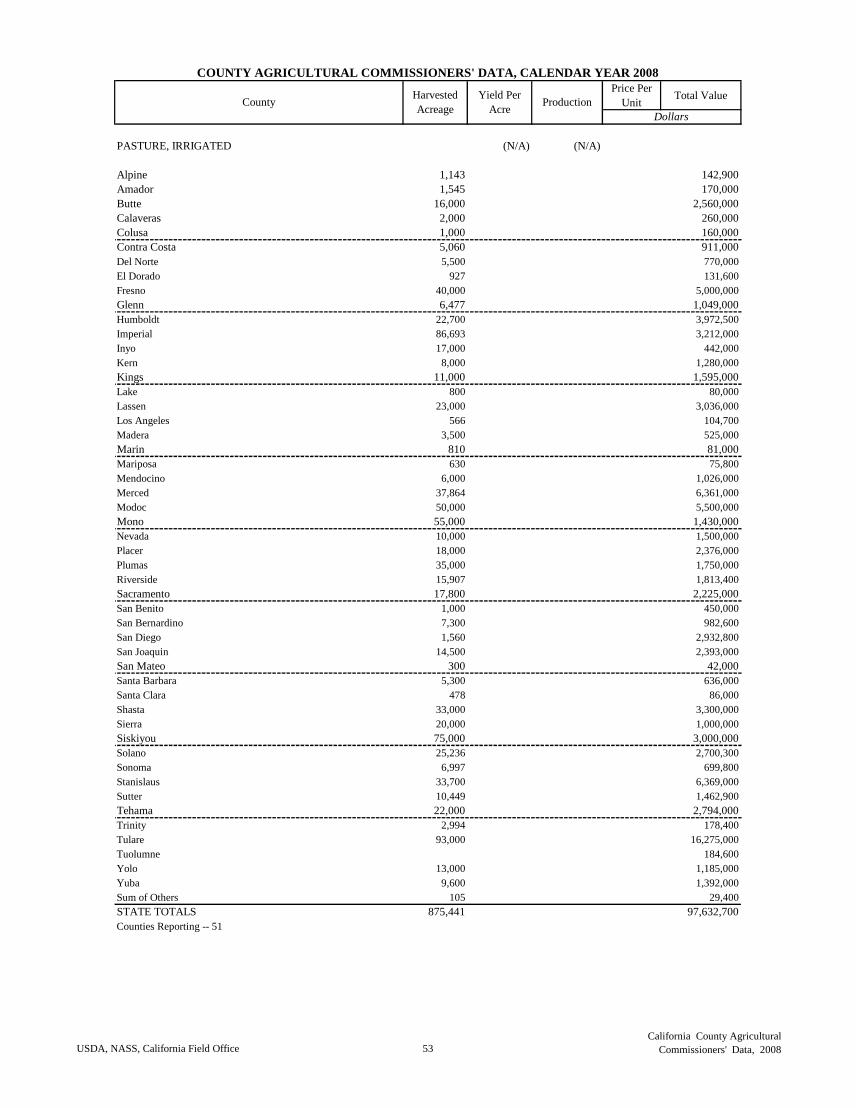
Price Per
UnitTotal Value
COUNTY AGRICULTURAL COMMISSIONERS' DATA, CALENDAR YEAR 2008
CountyHarvested
Acreage
Yield Per
AcreProduction
Dollars
PASTURE, IRRIGATED (N/A) (N/A)
Alpine 1,143 142,900
Amador 1,545 170,000
Butte 16,000 2,560,000
Calaveras 2,000 260,000
Colusa 1,000 160,000
Contra Costa 5,060 911,000
Del Norte 5,500 770,000
El Dorado 927 131,600
Fresno 40,000 5,000,000
Glenn 6,477 1,049,000
Humboldt 22,700 3,972,500
Imperial 86,693 3,212,000
Inyo 17,000 442,000
Kern 8,000 1,280,000
Kings 11,000 1,595,000
Lake 800 80,000
Lassen 23,000 3,036,000
Los Angeles 566 104,700
Madera 3,500 525,000
Marin 810 81,000
Mariposa 630 75,800
Mendocino 6,000 1,026,000
Merced 37,864 6,361,000
Modoc 50,000 5,500,000
Mono 55,000 1,430,000
Nevada 10,000 1,500,000
Placer 18,000 2,376,000
Plumas 35,000 1,750,000
Riverside 15,907 1,813,400
Sacramento 17,800 2,225,000
San Benito 1,000 450,000
San Bernardino 7,300 982,600
San Diego 1,560 2,932,800
San Joaquin 14,500 2,393,000
San Mateo 300 42,000
Santa Barbara 5,300 636,000
Santa Clara 478 86,000
Shasta 33,000 3,300,000
Sierra 20,000 1,000,000
Siskiyou 75,000 3,000,000
Solano 25,236 2,700,300
Sonoma 6,997 699,800
Stanislaus 33,700 6,369,000
Sutter 10,449 1,462,900
Tehama 22,000 2,794,000
Trinity 2,994 178,400
Tulare 93,000 16,275,000
Tuolumne 184,600
Yolo 13,000 1,185,000
Yuba 9,600 1,392,000
Sum of Others 105 29,400
STATE TOTALS 875,441 97,632,700
Counties Reporting -- 51
USDA, NASS, California Field Office 53
California County Agricultural
Commissioners' Data, 2008
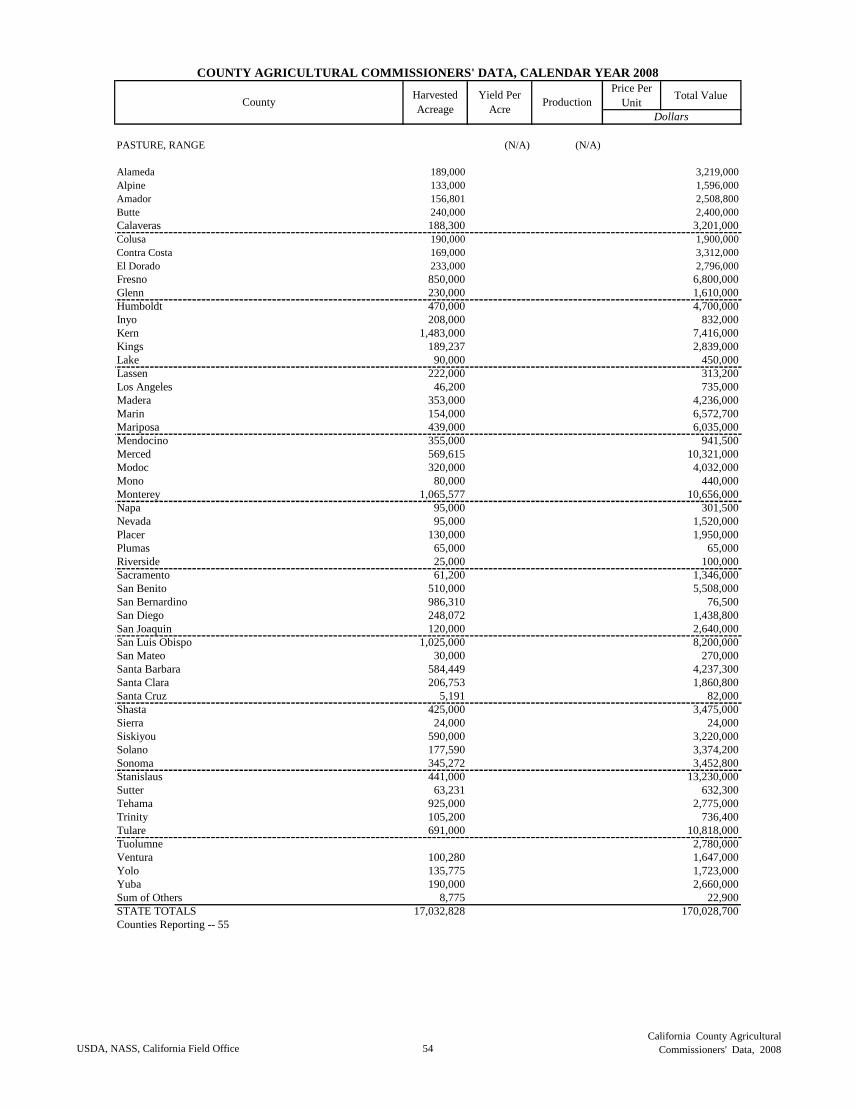
Price Per
UnitTotal Value
COUNTY AGRICULTURAL COMMISSIONERS' DATA, CALENDAR YEAR 2008
CountyHarvested
Acreage
Yield Per
AcreProduction
Dollars
PASTURE, RANGE (N/A) (N/A)
Alameda 189,000 3,219,000
Alpine 133,000 1,596,000
Amador 156,801 2,508,800
Butte 240,000 2,400,000
Calaveras 188,300 3,201,000
Colusa 190,000 1,900,000
Contra Costa 169,000 3,312,000
El Dorado 233,000 2,796,000
Fresno 850,000 6,800,000
Glenn 230,000 1,610,000
Humboldt 470,000 4,700,000
Inyo 208,000 832,000
Kern 1,483,000 7,416,000
Kings 189,237 2,839,000
Lake 90,000 450,000
Lassen 222,000 313,200
Los Angeles 46,200 735,000
Madera 353,000 4,236,000
Marin 154,000 6,572,700
Mariposa 439,000 6,035,000
Mendocino 355,000 941,500
Merced 569,615 10,321,000
Modoc 320,000 4,032,000
Mono 80,000 440,000
Monterey 1,065,577 10,656,000
Napa 95,000 301,500
Nevada 95,000 1,520,000
Placer 130,000 1,950,000
Plumas 65,000 65,000
Riverside 25,000 100,000
Sacramento 61,200 1,346,000
San Benito 510,000 5,508,000
San Bernardino 986,310 76,500
San Diego 248,072 1,438,800
San Joaquin 120,000 2,640,000
San Luis Obispo 1,025,000 8,200,000
San Mateo 30,000 270,000
Santa Barbara 584,449 4,237,300
Santa Clara 206,753 1,860,800
Santa Cruz 5,191 82,000
Shasta 425,000 3,475,000
Sierra 24,000 24,000
Siskiyou 590,000 3,220,000
Solano 177,590 3,374,200
Sonoma 345,272 3,452,800
Stanislaus 441,000 13,230,000
Sutter 63,231 632,300
Tehama 925,000 2,775,000
Trinity 105,200 736,400
Tulare 691,000 10,818,000
Tuolumne 2,780,000
Ventura 100,280 1,647,000
Yolo 135,775 1,723,000
Yuba 190,000 2,660,000
Sum of Others 8,775 22,900
STATE TOTALS 17,032,828 170,028,700
Counties Reporting -- 55
USDA, NASS, California Field Office 54
California County Agricultural
Commissioners' Data, 2008
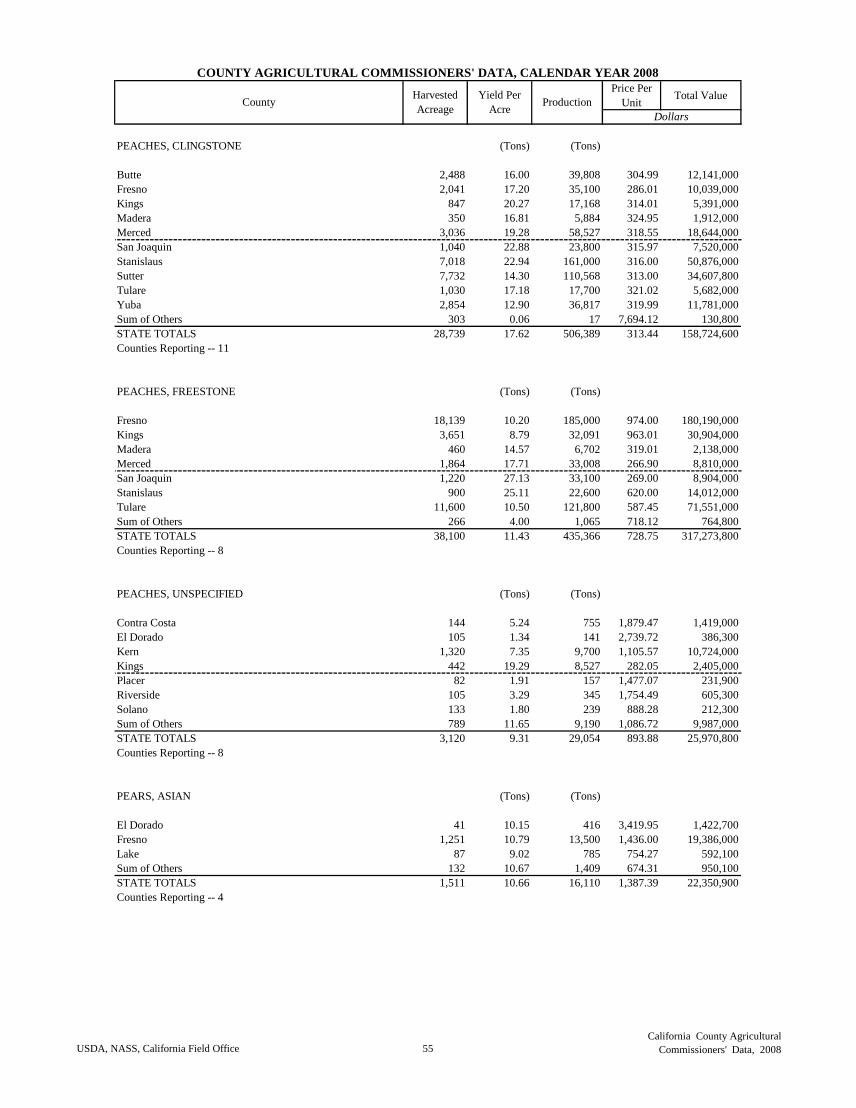
Price Per
UnitTotal Value
COUNTY AGRICULTURAL COMMISSIONERS' DATA, CALENDAR YEAR 2008
CountyHarvested
Acreage
Yield Per
AcreProduction
Dollars
PEACHES, CLINGSTONE (Tons) (Tons)
Butte 2,488 16.00 39,808 304.99 12,141,000
Fresno 2,041 17.20 35,100 286.01 10,039,000
Kings 847 20.27 17,168 314.01 5,391,000
Madera 350 16.81 5,884 324.95 1,912,000
Merced 3,036 19.28 58,527 318.55 18,644,000
San Joaquin 1,040 22.88 23,800 315.97 7,520,000
Stanislaus 7,018 22.94 161,000 316.00 50,876,000
Sutter 7,732 14.30 110,568 313.00 34,607,800
Tulare 1,030 17.18 17,700 321.02 5,682,000
Yuba 2,854 12.90 36,817 319.99 11,781,000
Sum of Others 303 0.06 17 7,694.12 130,800
STATE TOTALS 28,739 17.62 506,389 313.44 158,724,600
Counties Reporting -- 11
PEACHES, FREESTONE (Tons) (Tons)
Fresno 18,139 10.20 185,000 974.00 180,190,000
Kings 3,651 8.79 32,091 963.01 30,904,000
Madera 460 14.57 6,702 319.01 2,138,000
Merced 1,864 17.71 33,008 266.90 8,810,000
San Joaquin 1,220 27.13 33,100 269.00 8,904,000
Stanislaus 900 25.11 22,600 620.00 14,012,000
Tulare 11,600 10.50 121,800 587.45 71,551,000
Sum of Others 266 4.00 1,065 718.12 764,800
STATE TOTALS 38,100 11.43 435,366 728.75 317,273,800
Counties Reporting -- 8
PEACHES, UNSPECIFIED (Tons) (Tons)
Contra Costa 144 5.24 755 1,879.47 1,419,000
El Dorado 105 1.34 141 2,739.72 386,300
Kern 1,320 7.35 9,700 1,105.57 10,724,000
Kings 442 19.29 8,527 282.05 2,405,000
Placer 82 1.91 157 1,477.07 231,900
Riverside 105 3.29 345 1,754.49 605,300
Solano 133 1.80 239 888.28 212,300
Sum of Others 789 11.65 9,190 1,086.72 9,987,000
STATE TOTALS 3,120 9.31 29,054 893.88 25,970,800
Counties Reporting -- 8
PEARS, ASIAN (Tons) (Tons)
El Dorado 41 10.15 416 3,419.95 1,422,700
Fresno 1,251 10.79 13,500 1,436.00 19,386,000
Lake 87 9.02 785 754.27 592,100
Sum of Others 132 10.67 1,409 674.31 950,100
STATE TOTALS 1,511 10.66 16,110 1,387.39 22,350,900
Counties Reporting -- 4
USDA, NASS, California Field Office 55
California County Agricultural
Commissioners' Data, 2008
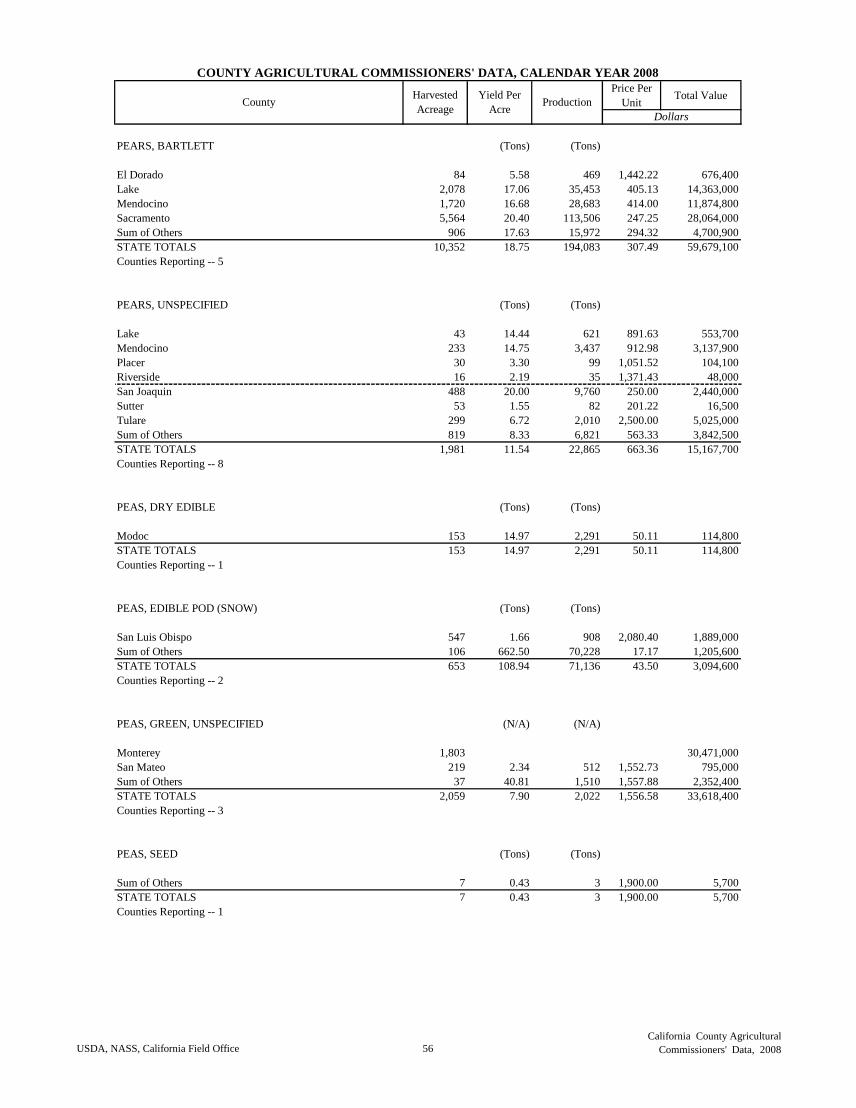
Price Per
UnitTotal Value
COUNTY AGRICULTURAL COMMISSIONERS' DATA, CALENDAR YEAR 2008
CountyHarvested
Acreage
Yield Per
AcreProduction
Dollars
PEARS, BARTLETT (Tons) (Tons)
El Dorado 84 5.58 469 1,442.22 676,400
Lake 2,078 17.06 35,453 405.13 14,363,000
Mendocino 1,720 16.68 28,683 414.00 11,874,800
Sacramento 5,564 20.40 113,506 247.25 28,064,000
Sum of Others 906 17.63 15,972 294.32 4,700,900
STATE TOTALS 10,352 18.75 194,083 307.49 59,679,100
Counties Reporting -- 5
PEARS, UNSPECIFIED (Tons) (Tons)
Lake 43 14.44 621 891.63 553,700
Mendocino 233 14.75 3,437 912.98 3,137,900
Placer 30 3.30 99 1,051.52 104,100
Riverside 16 2.19 35 1,371.43 48,000
San Joaquin 488 20.00 9,760 250.00 2,440,000
Sutter 53 1.55 82 201.22 16,500
Tulare 299 6.72 2,010 2,500.00 5,025,000
Sum of Others 819 8.33 6,821 563.33 3,842,500
STATE TOTALS 1,981 11.54 22,865 663.36 15,167,700
Counties Reporting -- 8
PEAS, DRY EDIBLE (Tons) (Tons)
Modoc 153 14.97 2,291 50.11 114,800
STATE TOTALS 153 14.97 2,291 50.11 114,800
Counties Reporting -- 1
PEAS, EDIBLE POD (SNOW) (Tons) (Tons)
San Luis Obispo 547 1.66 908 2,080.40 1,889,000
Sum of Others 106 662.50 70,228 17.17 1,205,600
STATE TOTALS 653 108.94 71,136 43.50 3,094,600
Counties Reporting -- 2
PEAS, GREEN, UNSPECIFIED (N/A) (N/A)
Monterey 1,803 30,471,000
San Mateo 219 2.34 512 1,552.73 795,000
Sum of Others 37 40.81 1,510 1,557.88 2,352,400
STATE TOTALS 2,059 7.90 2,022 1,556.58 33,618,400
Counties Reporting -- 3
PEAS, SEED (Tons) (Tons)
Sum of Others 7 0.43 3 1,900.00 5,700
STATE TOTALS 7 0.43 3 1,900.00 5,700
Counties Reporting -- 1
USDA, NASS, California Field Office 56
California County Agricultural
Commissioners' Data, 2008
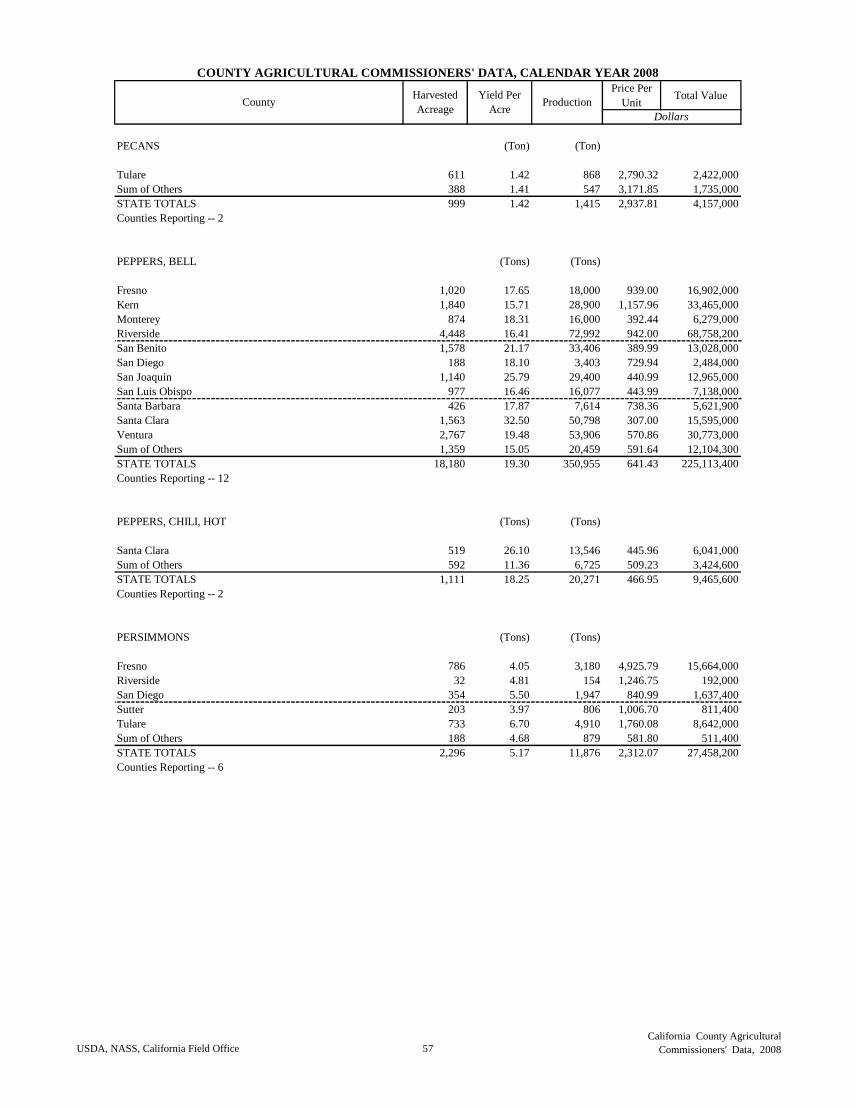
Price Per
UnitTotal Value
COUNTY AGRICULTURAL COMMISSIONERS' DATA, CALENDAR YEAR 2008
CountyHarvested
Acreage
Yield Per
AcreProduction
Dollars
PECANS (Ton) (Ton)
Tulare 611 1.42 868 2,790.32 2,422,000
Sum of Others 388 1.41 547 3,171.85 1,735,000
STATE TOTALS 999 1.42 1,415 2,937.81 4,157,000
Counties Reporting -- 2
PEPPERS, BELL (Tons) (Tons)
Fresno 1,020 17.65 18,000 939.00 16,902,000
Kern 1,840 15.71 28,900 1,157.96 33,465,000
Monterey 874 18.31 16,000 392.44 6,279,000
Riverside 4,448 16.41 72,992 942.00 68,758,200
San Benito 1,578 21.17 33,406 389.99 13,028,000
San Diego 188 18.10 3,403 729.94 2,484,000
San Joaquin 1,140 25.79 29,400 440.99 12,965,000
San Luis Obispo 977 16.46 16,077 443.99 7,138,000
Santa Barbara 426 17.87 7,614 738.36 5,621,900
Santa Clara 1,563 32.50 50,798 307.00 15,595,000
Ventura 2,767 19.48 53,906 570.86 30,773,000
Sum of Others 1,359 15.05 20,459 591.64 12,104,300
STATE TOTALS 18,180 19.30 350,955 641.43 225,113,400
Counties Reporting -- 12
PEPPERS, CHILI, HOT (Tons) (Tons)
Santa Clara 519 26.10 13,546 445.96 6,041,000
Sum of Others 592 11.36 6,725 509.23 3,424,600
STATE TOTALS 1,111 18.25 20,271 466.95 9,465,600
Counties Reporting -- 2
PERSIMMONS (Tons) (Tons)
Fresno 786 4.05 3,180 4,925.79 15,664,000
Riverside 32 4.81 154 1,246.75 192,000
San Diego 354 5.50 1,947 840.99 1,637,400
Sutter 203 3.97 806 1,006.70 811,400
Tulare 733 6.70 4,910 1,760.08 8,642,000
Sum of Others 188 4.68 879 581.80 511,400
STATE TOTALS 2,296 5.17 11,876 2,312.07 27,458,200
Counties Reporting -- 6
USDA, NASS, California Field Office 57
California County Agricultural
Commissioners' Data, 2008
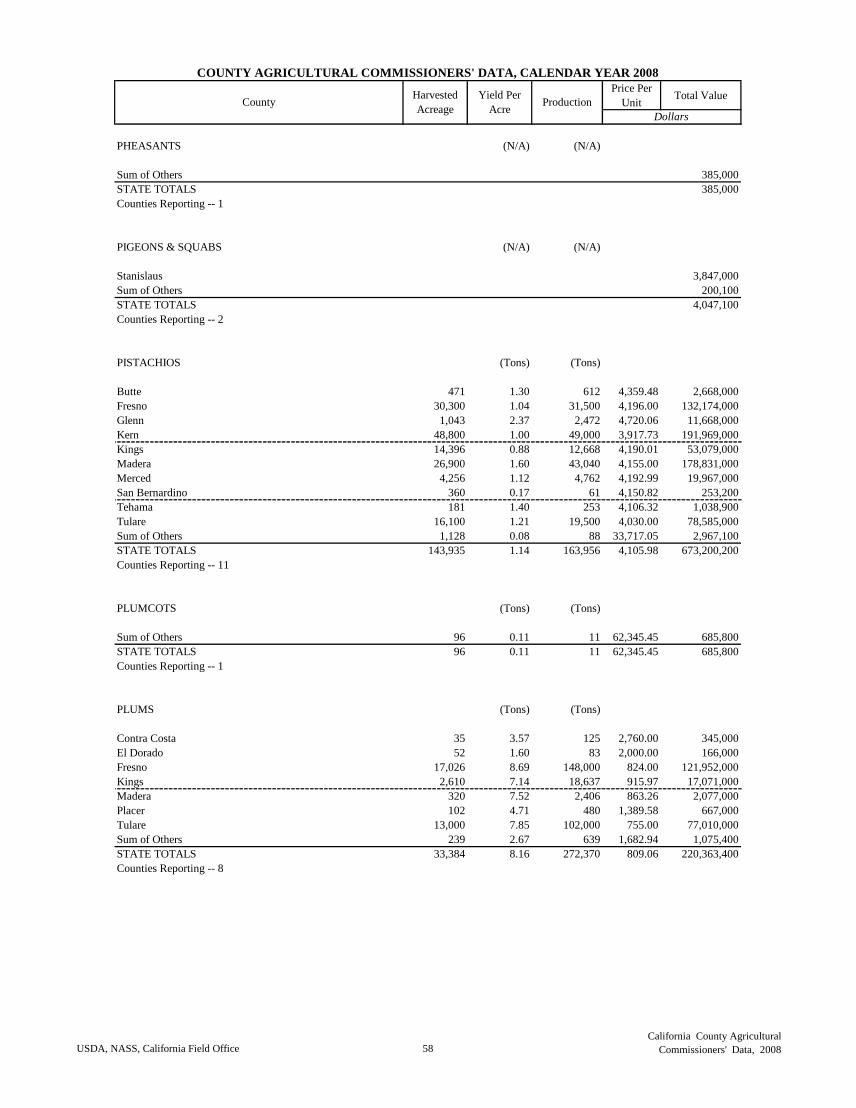
Price Per
UnitTotal Value
COUNTY AGRICULTURAL COMMISSIONERS' DATA, CALENDAR YEAR 2008
CountyHarvested
Acreage
Yield Per
AcreProduction
Dollars
PHEASANTS (N/A) (N/A)
Sum of Others 385,000
STATE TOTALS 385,000
Counties Reporting -- 1
PIGEONS & SQUABS (N/A) (N/A)
Stanislaus 3,847,000
Sum of Others 200,100
STATE TOTALS 4,047,100
Counties Reporting -- 2
PISTACHIOS (Tons) (Tons)
Butte 471 1.30 612 4,359.48 2,668,000
Fresno 30,300 1.04 31,500 4,196.00 132,174,000
Glenn 1,043 2.37 2,472 4,720.06 11,668,000
Kern 48,800 1.00 49,000 3,917.73 191,969,000
Kings 14,396 0.88 12,668 4,190.01 53,079,000
Madera 26,900 1.60 43,040 4,155.00 178,831,000
Merced 4,256 1.12 4,762 4,192.99 19,967,000
San Bernardino 360 0.17 61 4,150.82 253,200
Tehama 181 1.40 253 4,106.32 1,038,900
Tulare 16,100 1.21 19,500 4,030.00 78,585,000
Sum of Others 1,128 0.08 88 33,717.05 2,967,100
STATE TOTALS 143,935 1.14 163,956 4,105.98 673,200,200
Counties Reporting -- 11
PLUMCOTS (Tons) (Tons)
Sum of Others 96 0.11 11 62,345.45 685,800
STATE TOTALS 96 0.11 11 62,345.45 685,800
Counties Reporting -- 1
PLUMS (Tons) (Tons)
Contra Costa 35 3.57 125 2,760.00 345,000
El Dorado 52 1.60 83 2,000.00 166,000
Fresno 17,026 8.69 148,000 824.00 121,952,000
Kings 2,610 7.14 18,637 915.97 17,071,000
Madera 320 7.52 2,406 863.26 2,077,000
Placer 102 4.71 480 1,389.58 667,000
Tulare 13,000 7.85 102,000 755.00 77,010,000
Sum of Others 239 2.67 639 1,682.94 1,075,400
STATE TOTALS 33,384 8.16 272,370 809.06 220,363,400
Counties Reporting -- 8
USDA, NASS, California Field Office 58
California County Agricultural
Commissioners' Data, 2008
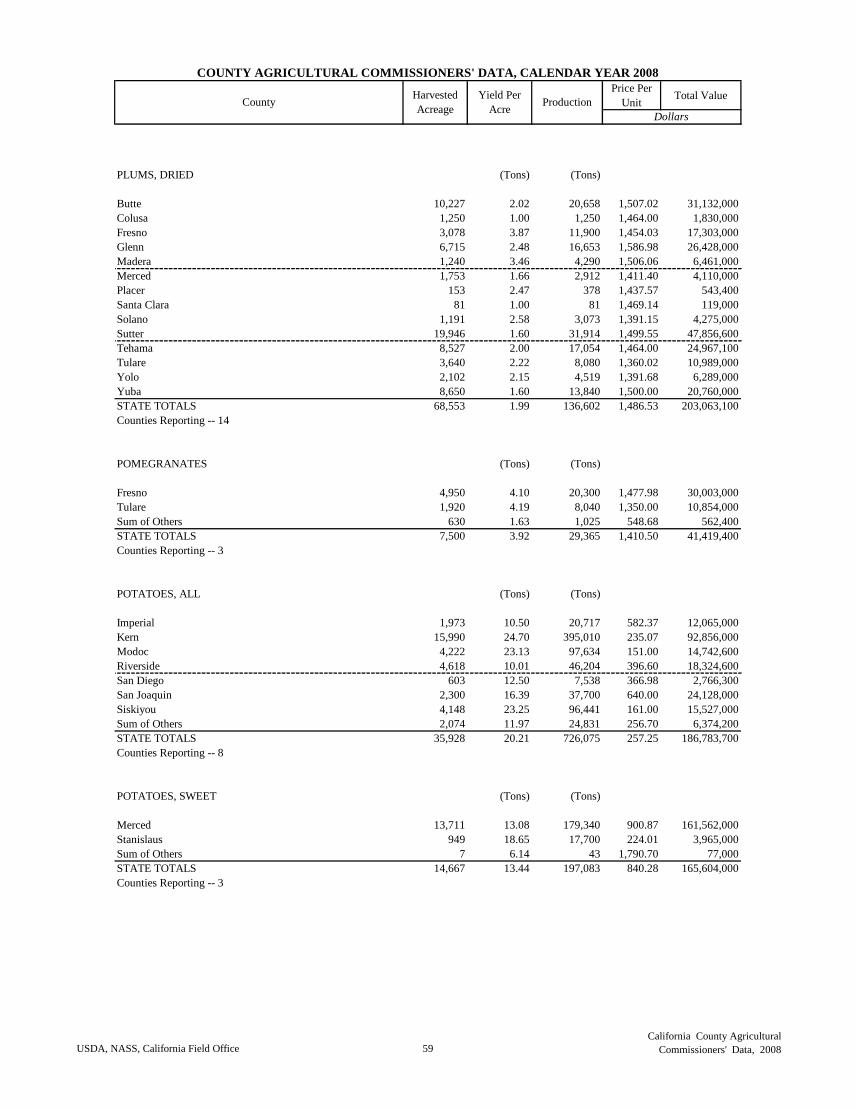
Price Per
UnitTotal Value
COUNTY AGRICULTURAL COMMISSIONERS' DATA, CALENDAR YEAR 2008
CountyHarvested
Acreage
Yield Per
AcreProduction
Dollars
PLUMS, DRIED (Tons) (Tons)
Butte 10,227 2.02 20,658 1,507.02 31,132,000
Colusa 1,250 1.00 1,250 1,464.00 1,830,000
Fresno 3,078 3.87 11,900 1,454.03 17,303,000
Glenn 6,715 2.48 16,653 1,586.98 26,428,000
Madera 1,240 3.46 4,290 1,506.06 6,461,000
Merced 1,753 1.66 2,912 1,411.40 4,110,000
Placer 153 2.47 378 1,437.57 543,400
Santa Clara 81 1.00 81 1,469.14 119,000
Solano 1,191 2.58 3,073 1,391.15 4,275,000
Sutter 19,946 1.60 31,914 1,499.55 47,856,600
Tehama 8,527 2.00 17,054 1,464.00 24,967,100
Tulare 3,640 2.22 8,080 1,360.02 10,989,000
Yolo 2,102 2.15 4,519 1,391.68 6,289,000
Yuba 8,650 1.60 13,840 1,500.00 20,760,000
STATE TOTALS 68,553 1.99 136,602 1,486.53 203,063,100
Counties Reporting -- 14
POMEGRANATES (Tons) (Tons)
Fresno 4,950 4.10 20,300 1,477.98 30,003,000
Tulare 1,920 4.19 8,040 1,350.00 10,854,000
Sum of Others 630 1.63 1,025 548.68 562,400
STATE TOTALS 7,500 3.92 29,365 1,410.50 41,419,400
Counties Reporting -- 3
POTATOES, ALL (Tons) (Tons)
Imperial 1,973 10.50 20,717 582.37 12,065,000
Kern 15,990 24.70 395,010 235.07 92,856,000
Modoc 4,222 23.13 97,634 151.00 14,742,600
Riverside 4,618 10.01 46,204 396.60 18,324,600
San Diego 603 12.50 7,538 366.98 2,766,300
San Joaquin 2,300 16.39 37,700 640.00 24,128,000
Siskiyou 4,148 23.25 96,441 161.00 15,527,000
Sum of Others 2,074 11.97 24,831 256.70 6,374,200
STATE TOTALS 35,928 20.21 726,075 257.25 186,783,700
Counties Reporting -- 8
POTATOES, SWEET (Tons) (Tons)
Merced 13,711 13.08 179,340 900.87 161,562,000
Stanislaus 949 18.65 17,700 224.01 3,965,000
Sum of Others 7 6.14 43 1,790.70 77,000
STATE TOTALS 14,667 13.44 197,083 840.28 165,604,000
Counties Reporting -- 3
USDA, NASS, California Field Office 59
California County Agricultural
Commissioners' Data, 2008
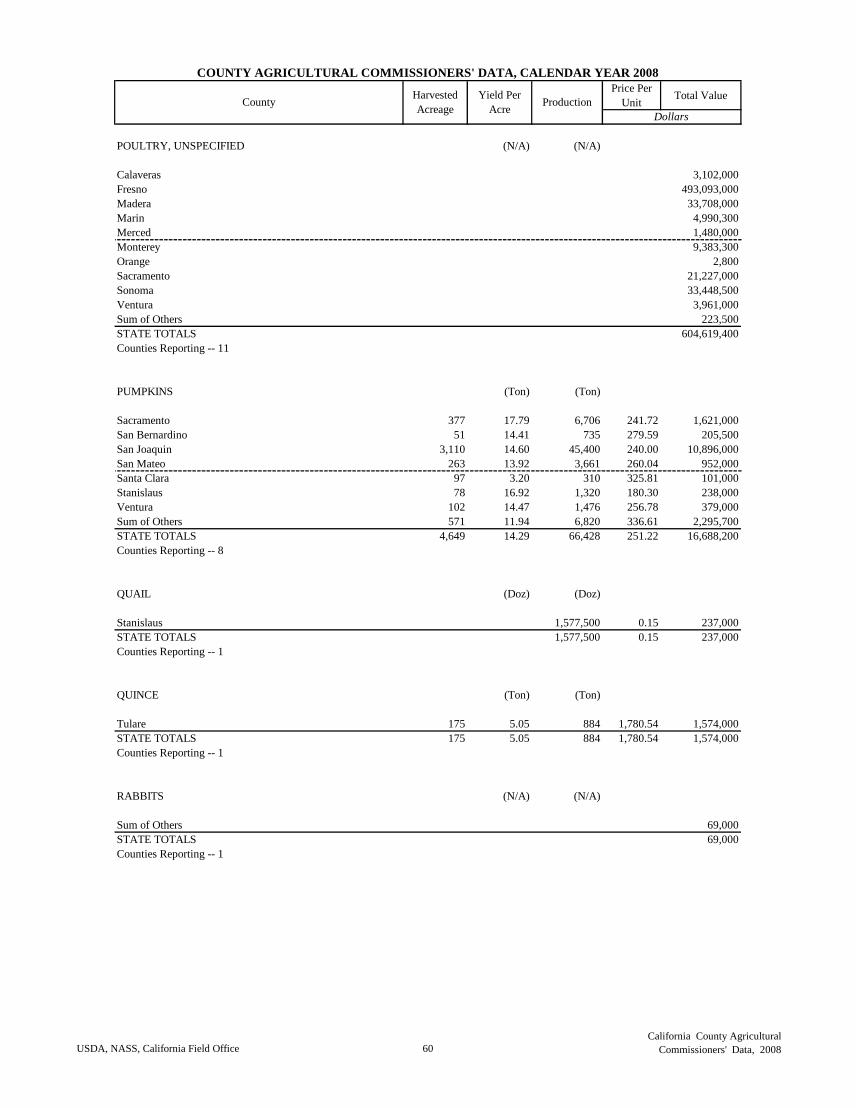
Price Per
UnitTotal Value
COUNTY AGRICULTURAL COMMISSIONERS' DATA, CALENDAR YEAR 2008
CountyHarvested
Acreage
Yield Per
AcreProduction
Dollars
POULTRY, UNSPECIFIED (N/A) (N/A)
Calaveras 3,102,000
Fresno 493,093,000
Madera 33,708,000
Marin 4,990,300
Merced 1,480,000
Monterey 9,383,300
Orange 2,800
Sacramento 21,227,000
Sonoma 33,448,500
Ventura 3,961,000
Sum of Others 223,500
STATE TOTALS 604,619,400
Counties Reporting -- 11
PUMPKINS (Ton) (Ton)
Sacramento 377 17.79 6,706 241.72 1,621,000
San Bernardino 51 14.41 735 279.59 205,500
San Joaquin 3,110 14.60 45,400 240.00 10,896,000
San Mateo 263 13.92 3,661 260.04 952,000
Santa Clara 97 3.20 310 325.81 101,000
Stanislaus 78 16.92 1,320 180.30 238,000
Ventura 102 14.47 1,476 256.78 379,000
Sum of Others 571 11.94 6,820 336.61 2,295,700
STATE TOTALS 4,649 14.29 66,428 251.22 16,688,200
Counties Reporting -- 8
QUAIL (Doz) (Doz)
Stanislaus 1,577,500 0.15 237,000
STATE TOTALS 1,577,500 0.15 237,000
Counties Reporting -- 1
QUINCE (Ton) (Ton)
Tulare 175 5.05 884 1,780.54 1,574,000
STATE TOTALS 175 5.05 884 1,780.54 1,574,000
Counties Reporting -- 1
RABBITS (N/A) (N/A)
Sum of Others 69,000
STATE TOTALS 69,000
Counties Reporting -- 1
USDA, NASS, California Field Office 60
California County Agricultural
Commissioners' Data, 2008
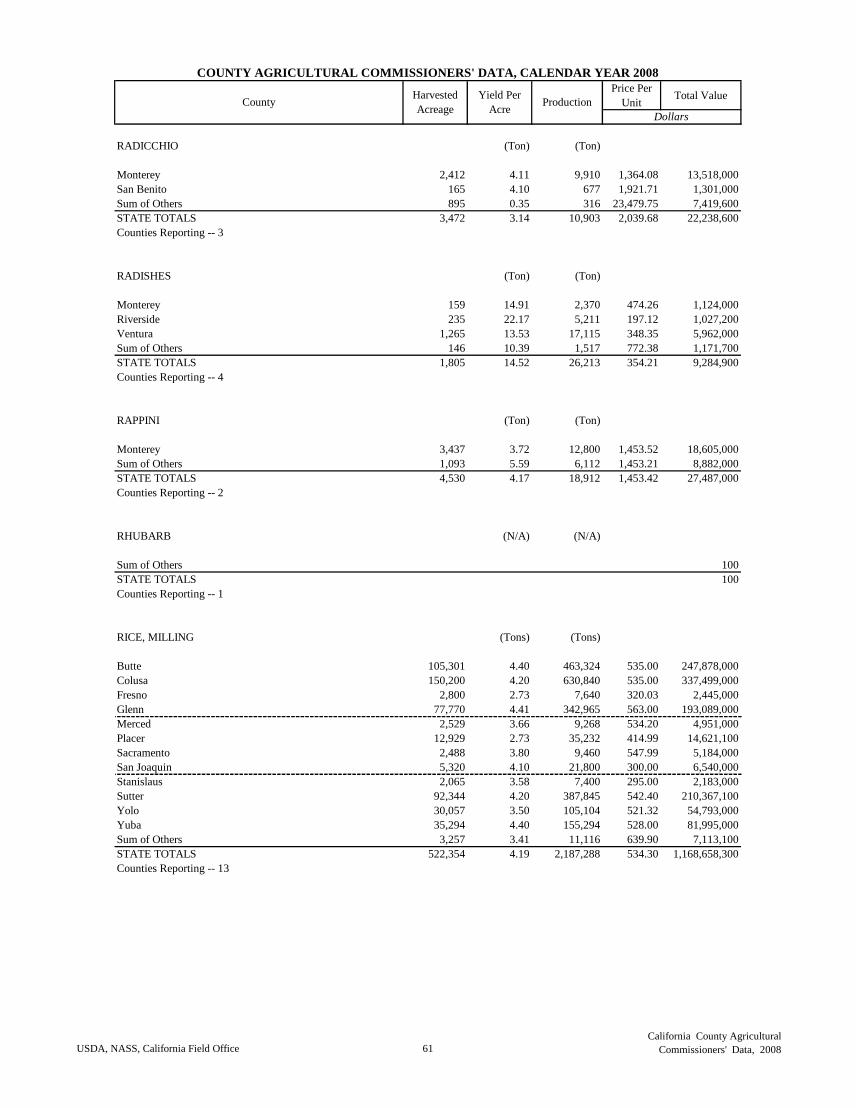
Price Per
UnitTotal Value
COUNTY AGRICULTURAL COMMISSIONERS' DATA, CALENDAR YEAR 2008
CountyHarvested
Acreage
Yield Per
AcreProduction
Dollars
RADICCHIO (Ton) (Ton)
Monterey 2,412 4.11 9,910 1,364.08 13,518,000
San Benito 165 4.10 677 1,921.71 1,301,000
Sum of Others 895 0.35 316 23,479.75 7,419,600
STATE TOTALS 3,472 3.14 10,903 2,039.68 22,238,600
Counties Reporting -- 3
RADISHES (Ton) (Ton)
Monterey 159 14.91 2,370 474.26 1,124,000
Riverside 235 22.17 5,211 197.12 1,027,200
Ventura 1,265 13.53 17,115 348.35 5,962,000
Sum of Others 146 10.39 1,517 772.38 1,171,700
STATE TOTALS 1,805 14.52 26,213 354.21 9,284,900
Counties Reporting -- 4
RAPPINI (Ton) (Ton)
Monterey 3,437 3.72 12,800 1,453.52 18,605,000
Sum of Others 1,093 5.59 6,112 1,453.21 8,882,000
STATE TOTALS 4,530 4.17 18,912 1,453.42 27,487,000
Counties Reporting -- 2
RHUBARB (N/A) (N/A)
Sum of Others 100
STATE TOTALS 100
Counties Reporting -- 1
RICE, MILLING (Tons) (Tons)
Butte 105,301 4.40 463,324 535.00 247,878,000
Colusa 150,200 4.20 630,840 535.00 337,499,000
Fresno 2,800 2.73 7,640 320.03 2,445,000
Glenn 77,770 4.41 342,965 563.00 193,089,000
Merced 2,529 3.66 9,268 534.20 4,951,000
Placer 12,929 2.73 35,232 414.99 14,621,100
Sacramento 2,488 3.80 9,460 547.99 5,184,000
San Joaquin 5,320 4.10 21,800 300.00 6,540,000
Stanislaus 2,065 3.58 7,400 295.00 2,183,000
Sutter 92,344 4.20 387,845 542.40 210,367,100
Yolo 30,057 3.50 105,104 521.32 54,793,000
Yuba 35,294 4.40 155,294 528.00 81,995,000
Sum of Others 3,257 3.41 11,116 639.90 7,113,100
STATE TOTALS 522,354 4.19 2,187,288 534.30 1,168,658,300
Counties Reporting -- 13
USDA, NASS, California Field Office 61
California County Agricultural
Commissioners' Data, 2008
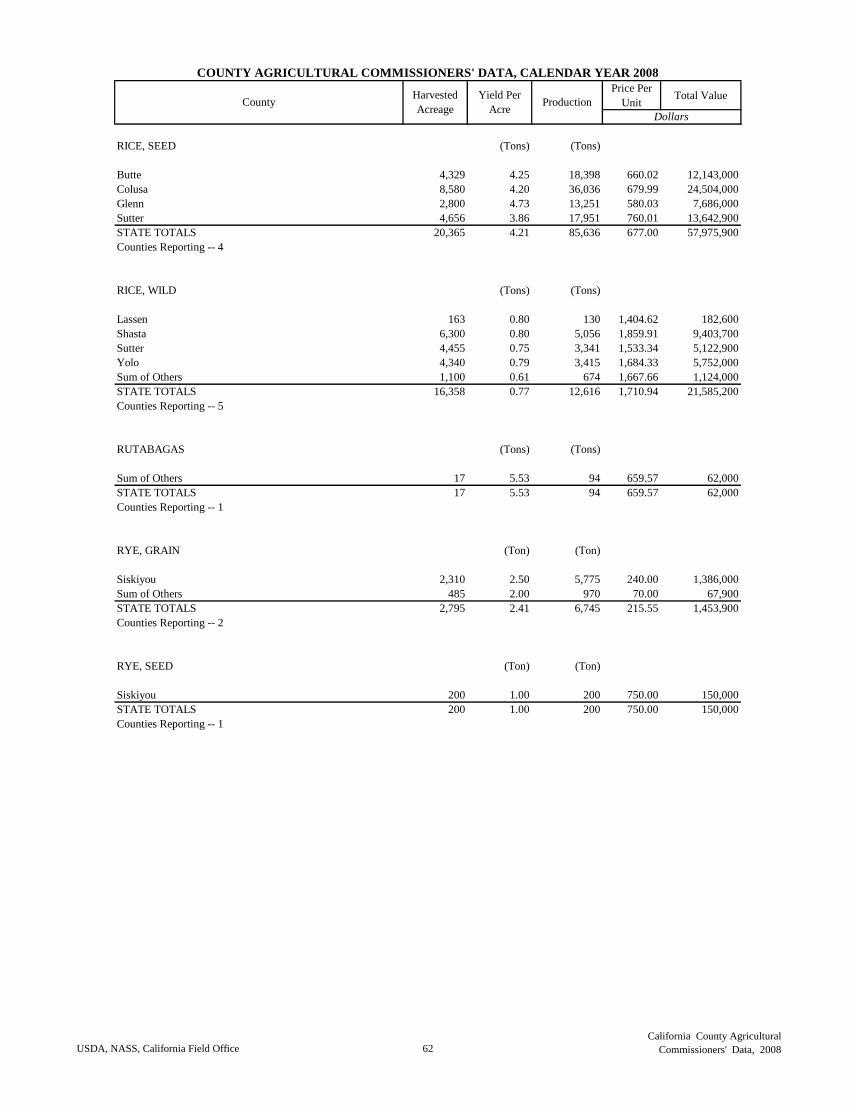
Price Per
UnitTotal Value
COUNTY AGRICULTURAL COMMISSIONERS' DATA, CALENDAR YEAR 2008
CountyHarvested
Acreage
Yield Per
AcreProduction
Dollars
RICE, SEED (Tons) (Tons)
Butte 4,329 4.25 18,398 660.02 12,143,000
Colusa 8,580 4.20 36,036 679.99 24,504,000
Glenn 2,800 4.73 13,251 580.03 7,686,000
Sutter 4,656 3.86 17,951 760.01 13,642,900
STATE TOTALS 20,365 4.21 85,636 677.00 57,975,900
Counties Reporting -- 4
RICE, WILD (Tons) (Tons)
Lassen 163 0.80 130 1,404.62 182,600
Shasta 6,300 0.80 5,056 1,859.91 9,403,700
Sutter 4,455 0.75 3,341 1,533.34 5,122,900
Yolo 4,340 0.79 3,415 1,684.33 5,752,000
Sum of Others 1,100 0.61 674 1,667.66 1,124,000
STATE TOTALS 16,358 0.77 12,616 1,710.94 21,585,200
Counties Reporting -- 5
RUTABAGAS (Tons) (Tons)
Sum of Others 17 5.53 94 659.57 62,000
STATE TOTALS 17 5.53 94 659.57 62,000
Counties Reporting -- 1
RYE, GRAIN (Ton) (Ton)
Siskiyou 2,310 2.50 5,775 240.00 1,386,000
Sum of Others 485 2.00 970 70.00 67,900
STATE TOTALS 2,795 2.41 6,745 215.55 1,453,900
Counties Reporting -- 2
RYE, SEED (Ton) (Ton)
Siskiyou 200 1.00 200 750.00 150,000
STATE TOTALS 200 1.00 200 750.00 150,000
Counties Reporting -- 1
USDA, NASS, California Field Office 62
California County Agricultural
Commissioners' Data, 2008
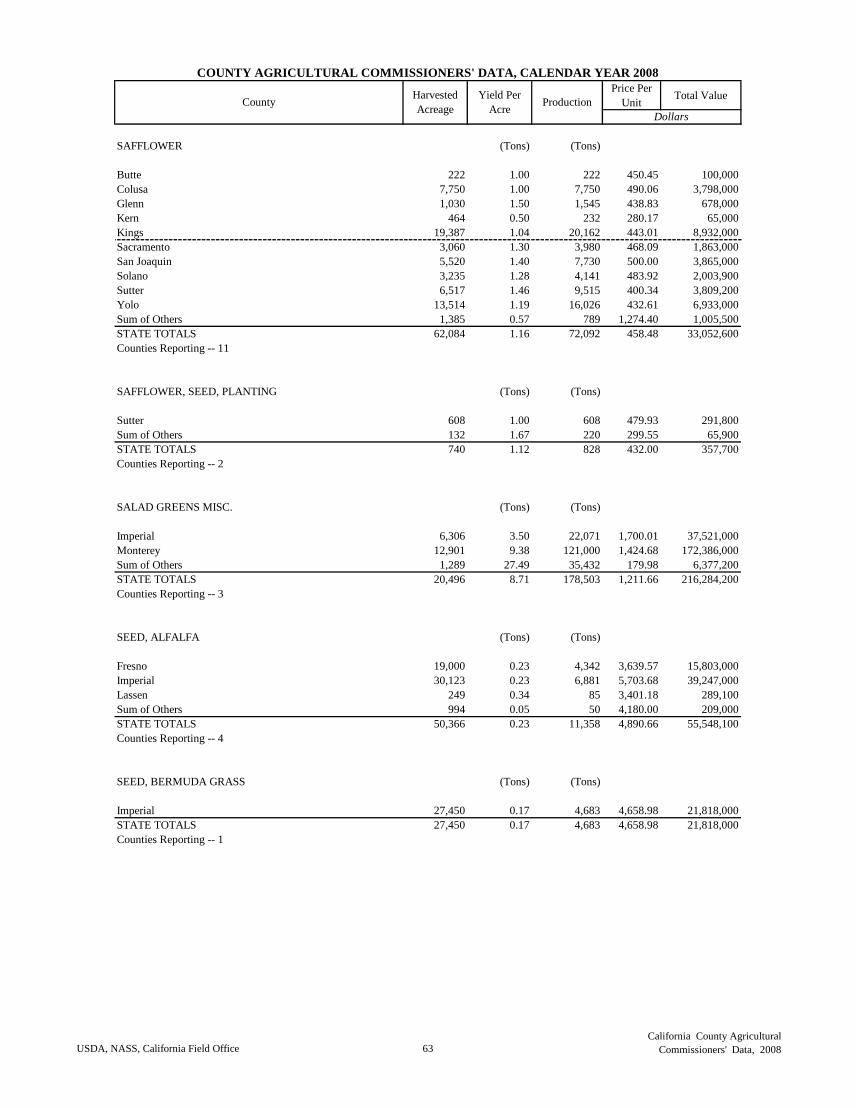
Price Per
UnitTotal Value
COUNTY AGRICULTURAL COMMISSIONERS' DATA, CALENDAR YEAR 2008
CountyHarvested
Acreage
Yield Per
AcreProduction
Dollars
SAFFLOWER (Tons) (Tons)
Butte 222 1.00 222 450.45 100,000
Colusa 7,750 1.00 7,750 490.06 3,798,000
Glenn 1,030 1.50 1,545 438.83 678,000
Kern 464 0.50 232 280.17 65,000
Kings 19,387 1.04 20,162 443.01 8,932,000
Sacramento 3,060 1.30 3,980 468.09 1,863,000
San Joaquin 5,520 1.40 7,730 500.00 3,865,000
Solano 3,235 1.28 4,141 483.92 2,003,900
Sutter 6,517 1.46 9,515 400.34 3,809,200
Yolo 13,514 1.19 16,026 432.61 6,933,000
Sum of Others 1,385 0.57 789 1,274.40 1,005,500
STATE TOTALS 62,084 1.16 72,092 458.48 33,052,600
Counties Reporting -- 11
SAFFLOWER, SEED, PLANTING (Tons) (Tons)
Sutter 608 1.00 608 479.93 291,800
Sum of Others 132 1.67 220 299.55 65,900
STATE TOTALS 740 1.12 828 432.00 357,700
Counties Reporting -- 2
SALAD GREENS MISC. (Tons) (Tons)
Imperial 6,306 3.50 22,071 1,700.01 37,521,000
Monterey 12,901 9.38 121,000 1,424.68 172,386,000
Sum of Others 1,289 27.49 35,432 179.98 6,377,200
STATE TOTALS 20,496 8.71 178,503 1,211.66 216,284,200
Counties Reporting -- 3
SEED, ALFALFA (Tons) (Tons)
Fresno 19,000 0.23 4,342 3,639.57 15,803,000
Imperial 30,123 0.23 6,881 5,703.68 39,247,000
Lassen 249 0.34 85 3,401.18 289,100
Sum of Others 994 0.05 50 4,180.00 209,000
STATE TOTALS 50,366 0.23 11,358 4,890.66 55,548,100
Counties Reporting -- 4
SEED, BERMUDA GRASS (Tons) (Tons)
Imperial 27,450 0.17 4,683 4,658.98 21,818,000
STATE TOTALS 27,450 0.17 4,683 4,658.98 21,818,000
Counties Reporting -- 1
USDA, NASS, California Field Office 63
California County Agricultural
Commissioners' Data, 2008
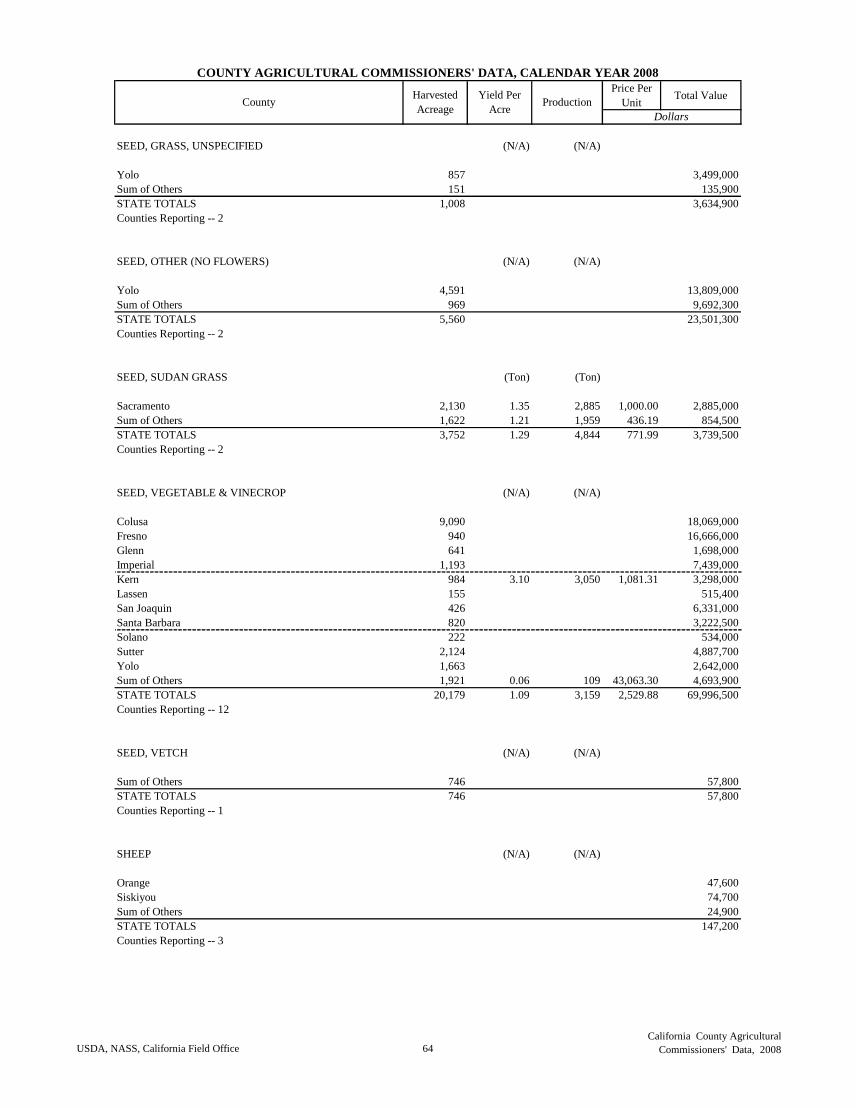
Price Per
UnitTotal Value
COUNTY AGRICULTURAL COMMISSIONERS' DATA, CALENDAR YEAR 2008
CountyHarvested
Acreage
Yield Per
AcreProduction
Dollars
SEED, GRASS, UNSPECIFIED (N/A) (N/A)
Yolo 857 3,499,000
Sum of Others 151 135,900
STATE TOTALS 1,008 3,634,900
Counties Reporting -- 2
SEED, OTHER (NO FLOWERS) (N/A) (N/A)
Yolo 4,591 13,809,000
Sum of Others 969 9,692,300
STATE TOTALS 5,560 23,501,300
Counties Reporting -- 2
SEED, SUDAN GRASS (Ton) (Ton)
Sacramento 2,130 1.35 2,885 1,000.00 2,885,000
Sum of Others 1,622 1.21 1,959 436.19 854,500
STATE TOTALS 3,752 1.29 4,844 771.99 3,739,500
Counties Reporting -- 2
SEED, VEGETABLE & VINECROP (N/A) (N/A)
Colusa 9,090 18,069,000
Fresno 940 16,666,000
Glenn 641 1,698,000
Imperial 1,193 7,439,000
Kern 984 3.10 3,050 1,081.31 3,298,000
Lassen 155 515,400
San Joaquin 426 6,331,000
Santa Barbara 820 3,222,500
Solano 222 534,000
Sutter 2,124 4,887,700
Yolo 1,663 2,642,000
Sum of Others 1,921 0.06 109 43,063.30 4,693,900
STATE TOTALS 20,179 1.09 3,159 2,529.88 69,996,500
Counties Reporting -- 12
SEED, VETCH (N/A) (N/A)
Sum of Others 746 57,800
STATE TOTALS 746 57,800
Counties Reporting -- 1
SHEEP (N/A) (N/A)
Orange 47,600
Siskiyou 74,700
Sum of Others 24,900
STATE TOTALS 147,200
Counties Reporting -- 3
USDA, NASS, California Field Office 64
California County Agricultural
Commissioners' Data, 2008
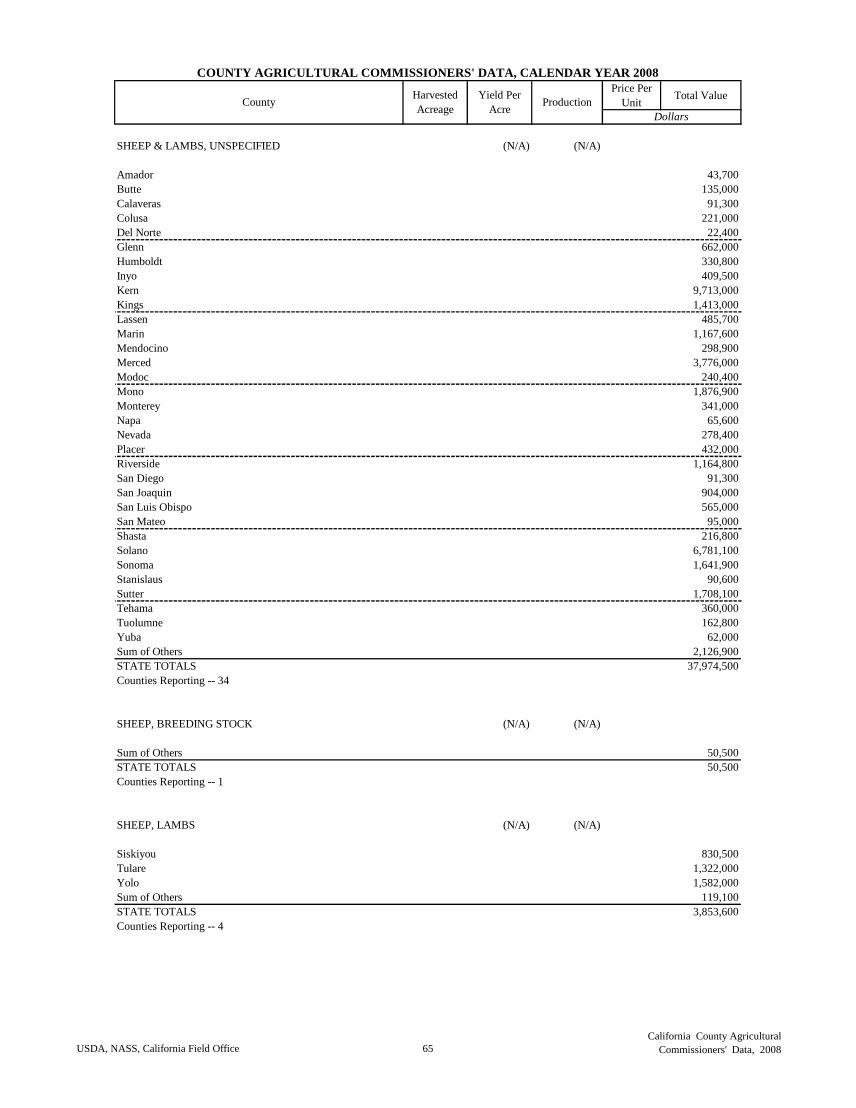
Price Per
UnitTotal Value
COUNTY AGRICULTURAL COMMISSIONERS' DATA, CALENDAR YEAR 2008
CountyHarvested
Acreage
Yield Per
AcreProduction
Dollars
SHEEP & LAMBS, UNSPECIFIED (N/A) (N/A)
Amador 43,700
Butte 135,000
Calaveras 91,300
Colusa 221,000
Del Norte 22,400
Glenn 662,000
Humboldt 330,800
Inyo 409,500
Kern 9,713,000
Kings 1,413,000
Lassen 485,700
Marin 1,167,600
Mendocino 298,900
Merced 3,776,000
Modoc 240,400
Mono 1,876,900
Monterey 341,000
Napa 65,600
Nevada 278,400
Placer 432,000
Riverside 1,164,800
San Diego 91,300
San Joaquin 904,000
San Luis Obispo 565,000
San Mateo 95,000
Shasta 216,800
Solano 6,781,100
Sonoma 1,641,900
Stanislaus 90,600
Sutter 1,708,100
Tehama 360,000
Tuolumne 162,800
Yuba 62,000
Sum of Others 2,126,900
STATE TOTALS 37,974,500
Counties Reporting -- 34
SHEEP, BREEDING STOCK (N/A) (N/A)
Sum of Others 50,500
STATE TOTALS 50,500
Counties Reporting -- 1
SHEEP, LAMBS (N/A) (N/A)
Siskiyou 830,500
Tulare 1,322,000
Yolo 1,582,000
Sum of Others 119,100
STATE TOTALS 3,853,600
Counties Reporting -- 4
USDA, NASS, California Field Office 65
California County Agricultural
Commissioners' Data, 2008
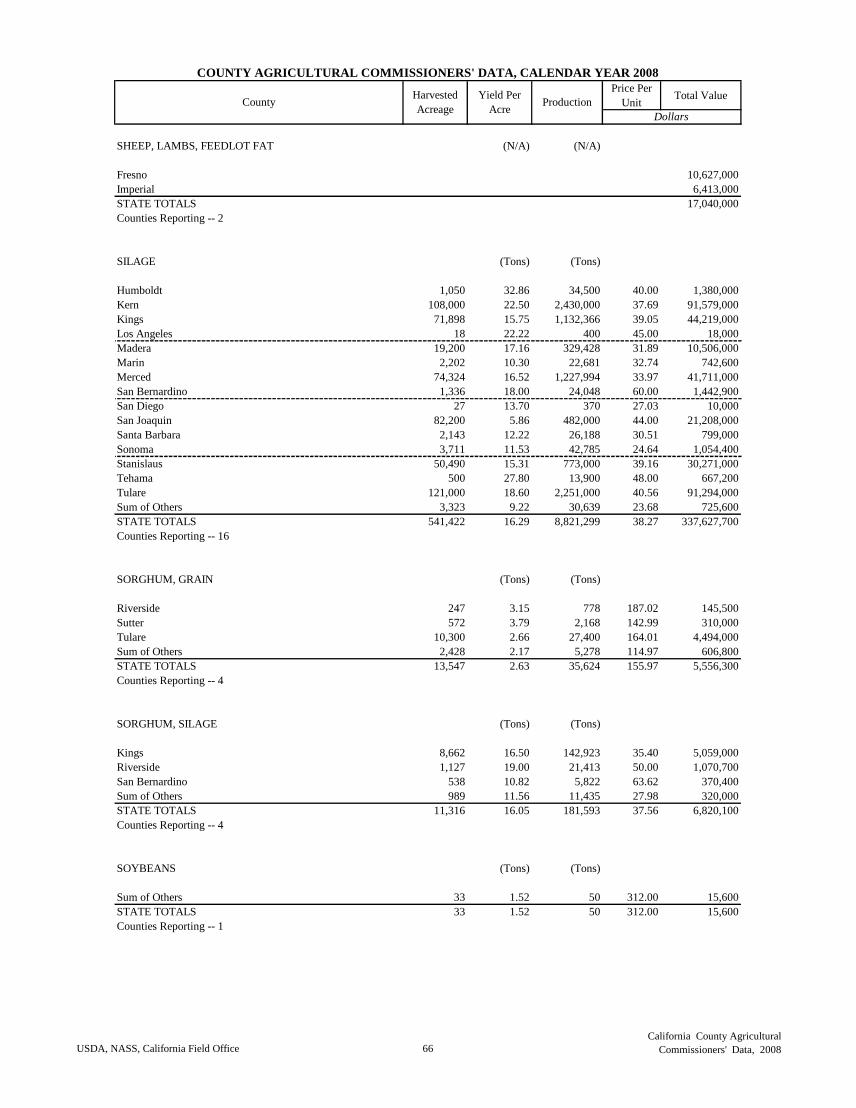
Price Per
UnitTotal Value
COUNTY AGRICULTURAL COMMISSIONERS' DATA, CALENDAR YEAR 2008
CountyHarvested
Acreage
Yield Per
AcreProduction
Dollars
SHEEP, LAMBS, FEEDLOT FAT (N/A) (N/A)
Fresno 10,627,000
Imperial 6,413,000
STATE TOTALS 17,040,000
Counties Reporting -- 2
SILAGE (Tons) (Tons)
Humboldt 1,050 32.86 34,500 40.00 1,380,000
Kern 108,000 22.50 2,430,000 37.69 91,579,000
Kings 71,898 15.75 1,132,366 39.05 44,219,000
Los Angeles 18 22.22 400 45.00 18,000
Madera 19,200 17.16 329,428 31.89 10,506,000
Marin 2,202 10.30 22,681 32.74 742,600
Merced 74,324 16.52 1,227,994 33.97 41,711,000
San Bernardino 1,336 18.00 24,048 60.00 1,442,900
San Diego 27 13.70 370 27.03 10,000
San Joaquin 82,200 5.86 482,000 44.00 21,208,000
Santa Barbara 2,143 12.22 26,188 30.51 799,000
Sonoma 3,711 11.53 42,785 24.64 1,054,400
Stanislaus 50,490 15.31 773,000 39.16 30,271,000
Tehama 500 27.80 13,900 48.00 667,200
Tulare 121,000 18.60 2,251,000 40.56 91,294,000
Sum of Others 3,323 9.22 30,639 23.68 725,600
STATE TOTALS 541,422 16.29 8,821,299 38.27 337,627,700
Counties Reporting -- 16
SORGHUM, GRAIN (Tons) (Tons)
Riverside 247 3.15 778 187.02 145,500
Sutter 572 3.79 2,168 142.99 310,000
Tulare 10,300 2.66 27,400 164.01 4,494,000
Sum of Others 2,428 2.17 5,278 114.97 606,800
STATE TOTALS 13,547 2.63 35,624 155.97 5,556,300
Counties Reporting -- 4
SORGHUM, SILAGE (Tons) (Tons)
Kings 8,662 16.50 142,923 35.40 5,059,000
Riverside 1,127 19.00 21,413 50.00 1,070,700
San Bernardino 538 10.82 5,822 63.62 370,400
Sum of Others 989 11.56 11,435 27.98 320,000
STATE TOTALS 11,316 16.05 181,593 37.56 6,820,100
Counties Reporting -- 4
SOYBEANS (Tons) (Tons)
Sum of Others 33 1.52 50 312.00 15,600
STATE TOTALS 33 1.52 50 312.00 15,600
Counties Reporting -- 1
USDA, NASS, California Field Office 66
California County Agricultural
Commissioners' Data, 2008
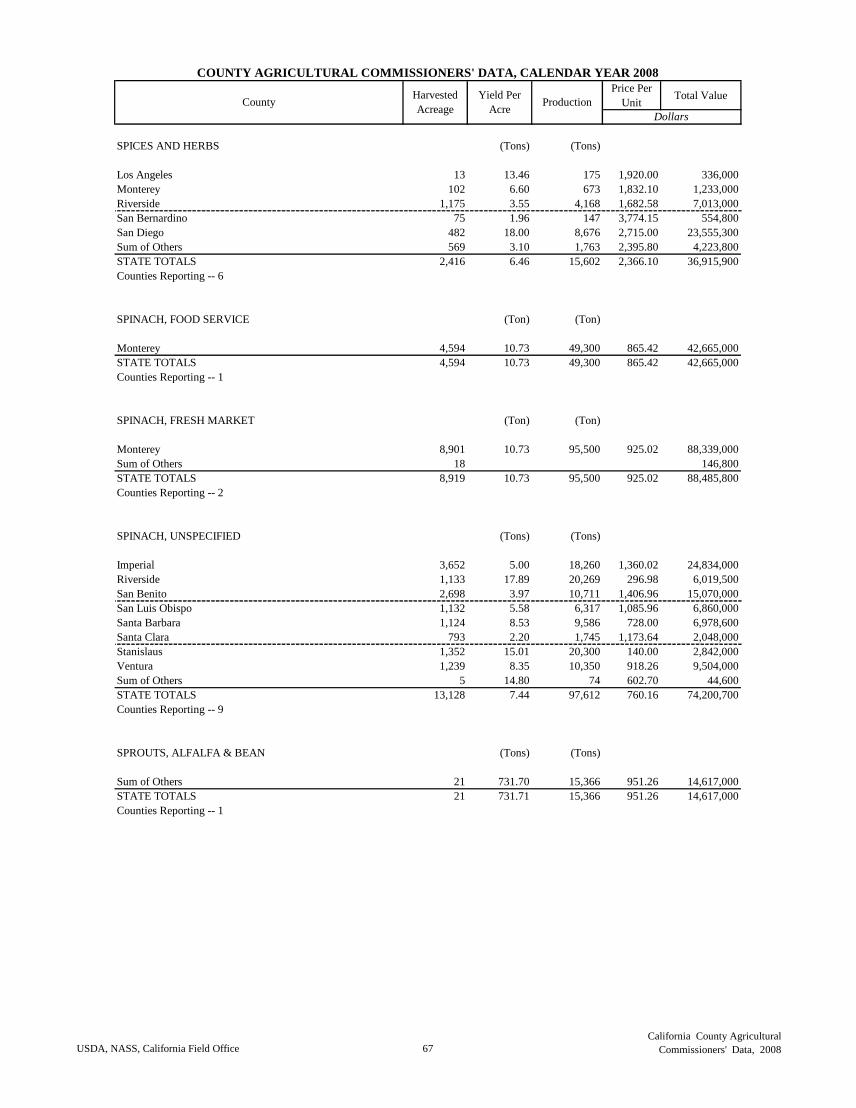
Price Per
UnitTotal Value
COUNTY AGRICULTURAL COMMISSIONERS' DATA, CALENDAR YEAR 2008
CountyHarvested
Acreage
Yield Per
AcreProduction
Dollars
SPICES AND HERBS (Tons) (Tons)
Los Angeles 13 13.46 175 1,920.00 336,000
Monterey 102 6.60 673 1,832.10 1,233,000
Riverside 1,175 3.55 4,168 1,682.58 7,013,000
San Bernardino 75 1.96 147 3,774.15 554,800
San Diego 482 18.00 8,676 2,715.00 23,555,300
Sum of Others 569 3.10 1,763 2,395.80 4,223,800
STATE TOTALS 2,416 6.46 15,602 2,366.10 36,915,900
Counties Reporting -- 6
SPINACH, FOOD SERVICE (Ton) (Ton)
Monterey 4,594 10.73 49,300 865.42 42,665,000
STATE TOTALS 4,594 10.73 49,300 865.42 42,665,000
Counties Reporting -- 1
SPINACH, FRESH MARKET (Ton) (Ton)
Monterey 8,901 10.73 95,500 925.02 88,339,000
Sum of Others 18 146,800
STATE TOTALS 8,919 10.73 95,500 925.02 88,485,800
Counties Reporting -- 2
SPINACH, UNSPECIFIED (Tons) (Tons)
Imperial 3,652 5.00 18,260 1,360.02 24,834,000
Riverside 1,133 17.89 20,269 296.98 6,019,500
San Benito 2,698 3.97 10,711 1,406.96 15,070,000
San Luis Obispo 1,132 5.58 6,317 1,085.96 6,860,000
Santa Barbara 1,124 8.53 9,586 728.00 6,978,600
Santa Clara 793 2.20 1,745 1,173.64 2,048,000
Stanislaus 1,352 15.01 20,300 140.00 2,842,000
Ventura 1,239 8.35 10,350 918.26 9,504,000
Sum of Others 5 14.80 74 602.70 44,600
STATE TOTALS 13,128 7.44 97,612 760.16 74,200,700
Counties Reporting -- 9
SPROUTS, ALFALFA & BEAN (Tons) (Tons)
Sum of Others 21 731.70 15,366 951.26 14,617,000
STATE TOTALS 21 731.71 15,366 951.26 14,617,000
Counties Reporting -- 1
USDA, NASS, California Field Office 67
California County Agricultural
Commissioners' Data, 2008
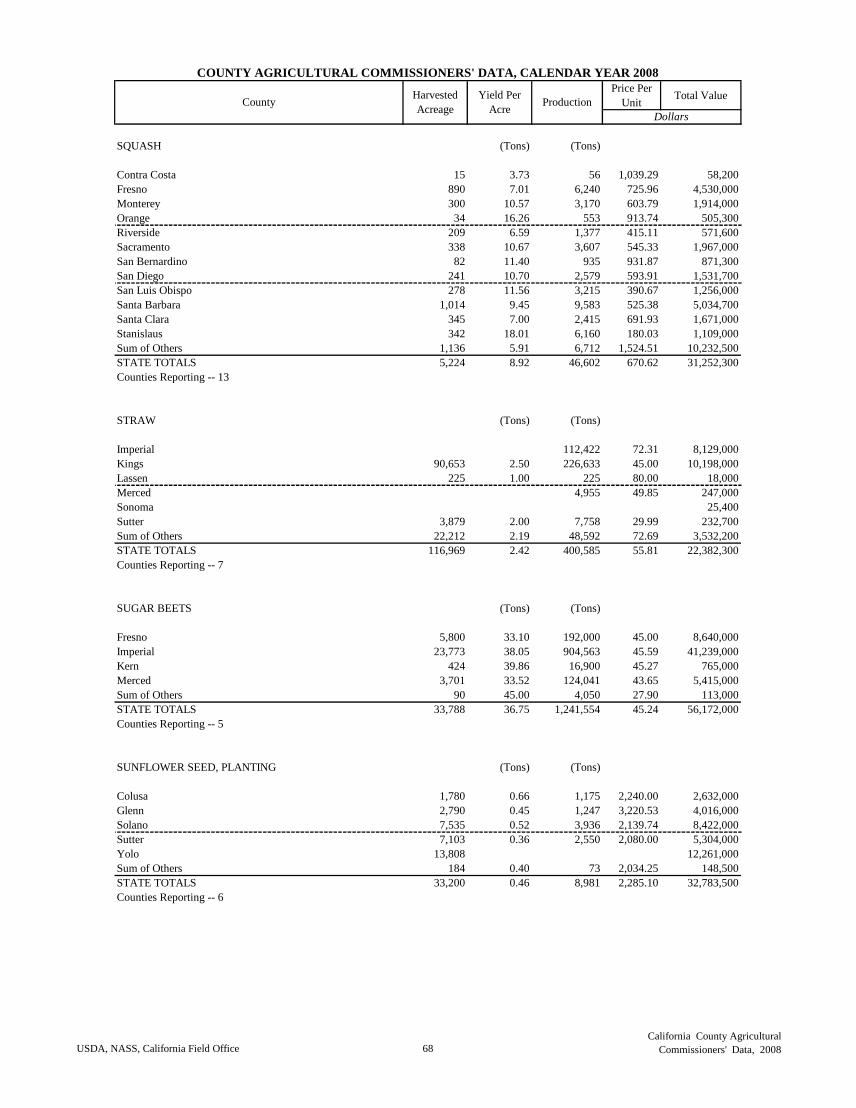
Price Per
UnitTotal Value
COUNTY AGRICULTURAL COMMISSIONERS' DATA, CALENDAR YEAR 2008
CountyHarvested
Acreage
Yield Per
AcreProduction
Dollars
SQUASH (Tons) (Tons)
Contra Costa 15 3.73 56 1,039.29 58,200
Fresno 890 7.01 6,240 725.96 4,530,000
Monterey 300 10.57 3,170 603.79 1,914,000
Orange 34 16.26 553 913.74 505,300
Riverside 209 6.59 1,377 415.11 571,600
Sacramento 338 10.67 3,607 545.33 1,967,000
San Bernardino 82 11.40 935 931.87 871,300
San Diego 241 10.70 2,579 593.91 1,531,700
San Luis Obispo 278 11.56 3,215 390.67 1,256,000
Santa Barbara 1,014 9.45 9,583 525.38 5,034,700
Santa Clara 345 7.00 2,415 691.93 1,671,000
Stanislaus 342 18.01 6,160 180.03 1,109,000
Sum of Others 1,136 5.91 6,712 1,524.51 10,232,500
STATE TOTALS 5,224 8.92 46,602 670.62 31,252,300
Counties Reporting -- 13
STRAW (Tons) (Tons)
Imperial 112,422 72.31 8,129,000
Kings 90,653 2.50 226,633 45.00 10,198,000
Lassen 225 1.00 225 80.00 18,000
Merced 4,955 49.85 247,000
Sonoma 25,400
Sutter 3,879 2.00 7,758 29.99 232,700
Sum of Others 22,212 2.19 48,592 72.69 3,532,200
STATE TOTALS 116,969 2.42 400,585 55.81 22,382,300
Counties Reporting -- 7
SUGAR BEETS (Tons) (Tons)
Fresno 5,800 33.10 192,000 45.00 8,640,000
Imperial 23,773 38.05 904,563 45.59 41,239,000
Kern 424 39.86 16,900 45.27 765,000
Merced 3,701 33.52 124,041 43.65 5,415,000
Sum of Others 90 45.00 4,050 27.90 113,000
STATE TOTALS 33,788 36.75 1,241,554 45.24 56,172,000
Counties Reporting -- 5
SUNFLOWER SEED, PLANTING (Tons) (Tons)
Colusa 1,780 0.66 1,175 2,240.00 2,632,000
Glenn 2,790 0.45 1,247 3,220.53 4,016,000
Solano 7,535 0.52 3,936 2,139.74 8,422,000
Sutter 7,103 0.36 2,550 2,080.00 5,304,000
Yolo 13,808 12,261,000
Sum of Others 184 0.40 73 2,034.25 148,500
STATE TOTALS 33,200 0.46 8,981 2,285.10 32,783,500
Counties Reporting -- 6
USDA, NASS, California Field Office 68
California County Agricultural
Commissioners' Data, 2008
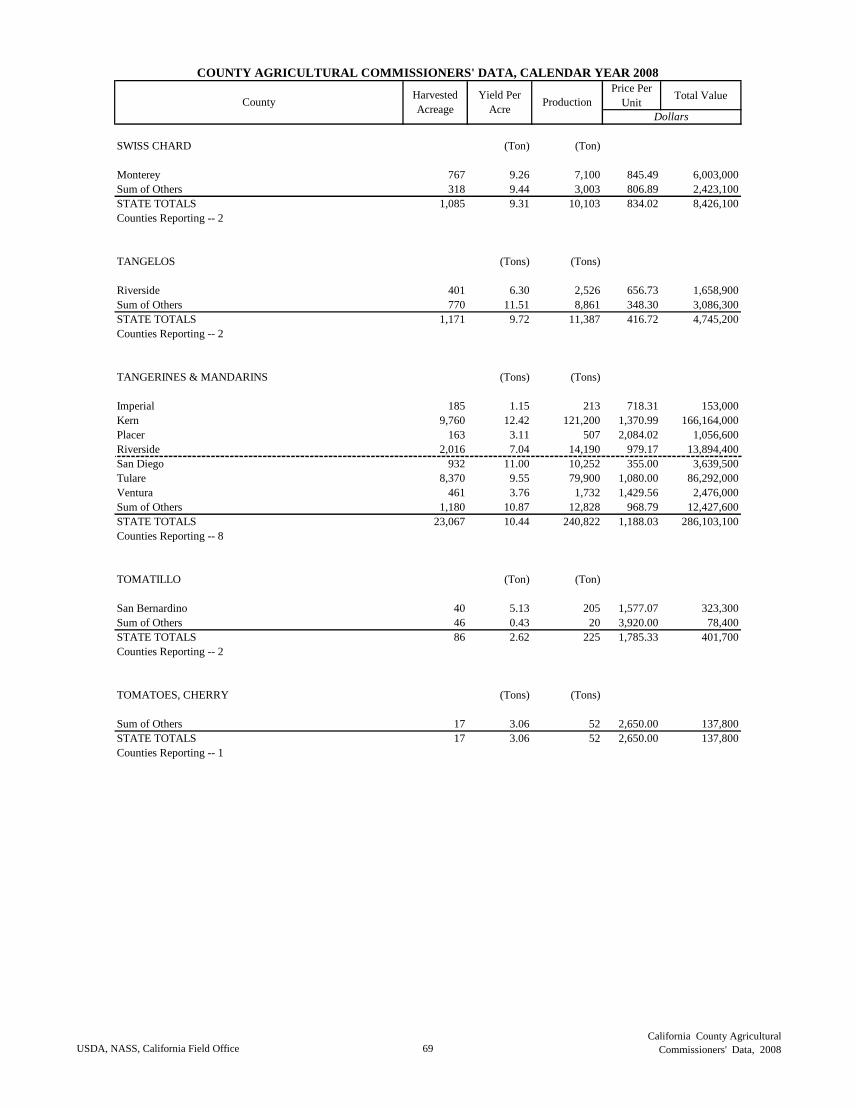
Price Per
UnitTotal Value
COUNTY AGRICULTURAL COMMISSIONERS' DATA, CALENDAR YEAR 2008
CountyHarvested
Acreage
Yield Per
AcreProduction
Dollars
SWISS CHARD (Ton) (Ton)
Monterey 767 9.26 7,100 845.49 6,003,000
Sum of Others 318 9.44 3,003 806.89 2,423,100
STATE TOTALS 1,085 9.31 10,103 834.02 8,426,100
Counties Reporting -- 2
TANGELOS (Tons) (Tons)
Riverside 401 6.30 2,526 656.73 1,658,900
Sum of Others 770 11.51 8,861 348.30 3,086,300
STATE TOTALS 1,171 9.72 11,387 416.72 4,745,200
Counties Reporting -- 2
TANGERINES & MANDARINS (Tons) (Tons)
Imperial 185 1.15 213 718.31 153,000
Kern 9,760 12.42 121,200 1,370.99 166,164,000
Placer 163 3.11 507 2,084.02 1,056,600
Riverside 2,016 7.04 14,190 979.17 13,894,400
San Diego 932 11.00 10,252 355.00 3,639,500
Tulare 8,370 9.55 79,900 1,080.00 86,292,000
Ventura 461 3.76 1,732 1,429.56 2,476,000
Sum of Others 1,180 10.87 12,828 968.79 12,427,600
STATE TOTALS 23,067 10.44 240,822 1,188.03 286,103,100
Counties Reporting -- 8
TOMATILLO (Ton) (Ton)
San Bernardino 40 5.13 205 1,577.07 323,300
Sum of Others 46 0.43 20 3,920.00 78,400
STATE TOTALS 86 2.62 225 1,785.33 401,700
Counties Reporting -- 2
TOMATOES, CHERRY (Tons) (Tons)
Sum of Others 17 3.06 52 2,650.00 137,800
STATE TOTALS 17 3.06 52 2,650.00 137,800
Counties Reporting -- 1
USDA, NASS, California Field Office 69
California County Agricultural
Commissioners' Data, 2008
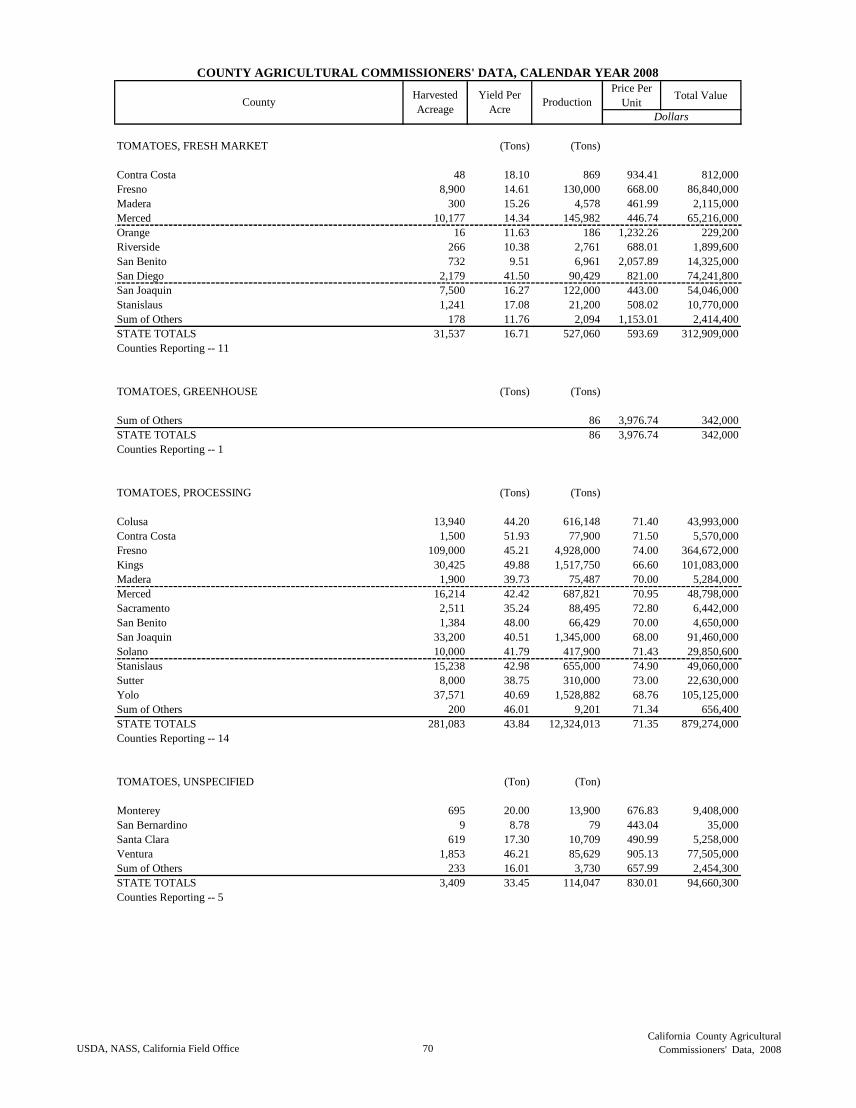
Price Per
UnitTotal Value
COUNTY AGRICULTURAL COMMISSIONERS' DATA, CALENDAR YEAR 2008
CountyHarvested
Acreage
Yield Per
AcreProduction
Dollars
TOMATOES, FRESH MARKET (Tons) (Tons)
Contra Costa 48 18.10 869 934.41 812,000
Fresno 8,900 14.61 130,000 668.00 86,840,000
Madera 300 15.26 4,578 461.99 2,115,000
Merced 10,177 14.34 145,982 446.74 65,216,000
Orange 16 11.63 186 1,232.26 229,200
Riverside 266 10.38 2,761 688.01 1,899,600
San Benito 732 9.51 6,961 2,057.89 14,325,000
San Diego 2,179 41.50 90,429 821.00 74,241,800
San Joaquin 7,500 16.27 122,000 443.00 54,046,000
Stanislaus 1,241 17.08 21,200 508.02 10,770,000
Sum of Others 178 11.76 2,094 1,153.01 2,414,400
STATE TOTALS 31,537 16.71 527,060 593.69 312,909,000
Counties Reporting -- 11
TOMATOES, GREENHOUSE (Tons) (Tons)
Sum of Others 86 3,976.74 342,000
STATE TOTALS 86 3,976.74 342,000
Counties Reporting -- 1
TOMATOES, PROCESSING (Tons) (Tons)
Colusa 13,940 44.20 616,148 71.40 43,993,000
Contra Costa 1,500 51.93 77,900 71.50 5,570,000
Fresno 109,000 45.21 4,928,000 74.00 364,672,000
Kings 30,425 49.88 1,517,750 66.60 101,083,000
Madera 1,900 39.73 75,487 70.00 5,284,000
Merced 16,214 42.42 687,821 70.95 48,798,000
Sacramento 2,511 35.24 88,495 72.80 6,442,000
San Benito 1,384 48.00 66,429 70.00 4,650,000
San Joaquin 33,200 40.51 1,345,000 68.00 91,460,000
Solano 10,000 41.79 417,900 71.43 29,850,600
Stanislaus 15,238 42.98 655,000 74.90 49,060,000
Sutter 8,000 38.75 310,000 73.00 22,630,000
Yolo 37,571 40.69 1,528,882 68.76 105,125,000
Sum of Others 200 46.01 9,201 71.34 656,400
STATE TOTALS 281,083 43.84 12,324,013 71.35 879,274,000
Counties Reporting -- 14
TOMATOES, UNSPECIFIED (Ton) (Ton)
Monterey 695 20.00 13,900 676.83 9,408,000
San Bernardino 9 8.78 79 443.04 35,000
Santa Clara 619 17.30 10,709 490.99 5,258,000
Ventura 1,853 46.21 85,629 905.13 77,505,000
Sum of Others 233 16.01 3,730 657.99 2,454,300
STATE TOTALS 3,409 33.45 114,047 830.01 94,660,300
Counties Reporting -- 5
USDA, NASS, California Field Office 70
California County Agricultural
Commissioners' Data, 2008
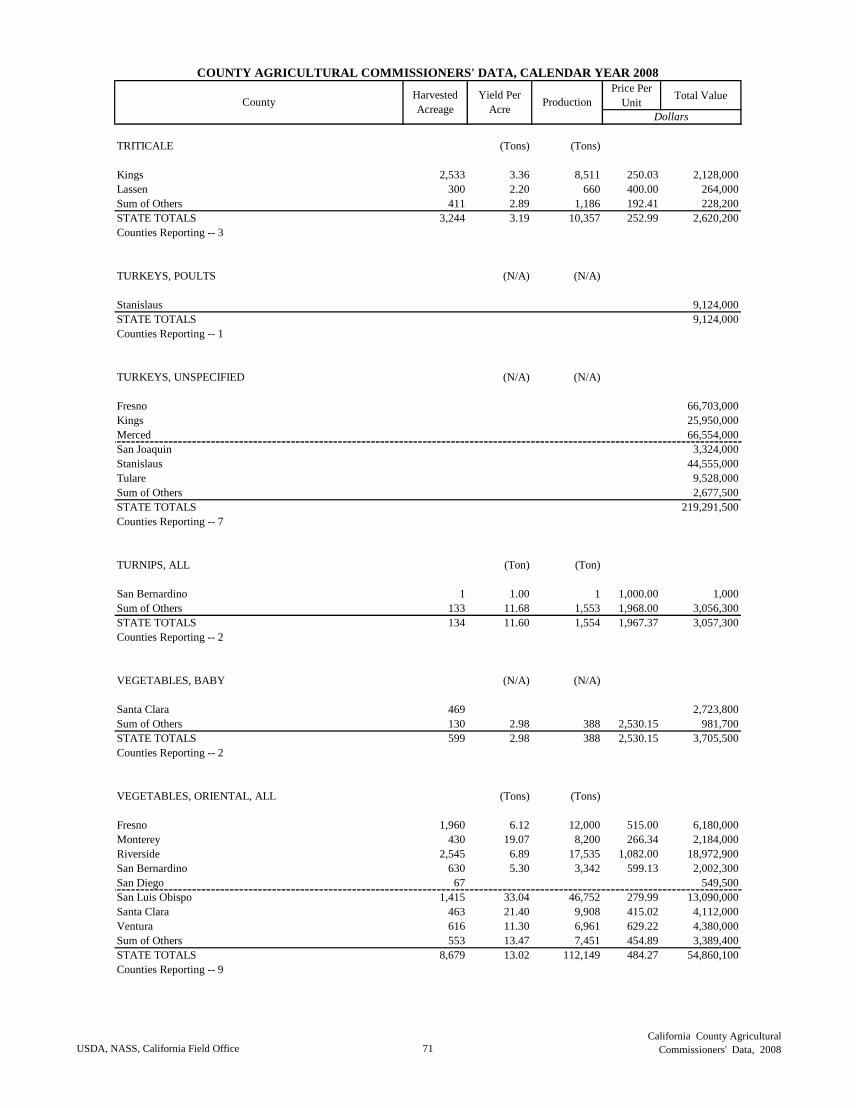
Price Per
UnitTotal Value
COUNTY AGRICULTURAL COMMISSIONERS' DATA, CALENDAR YEAR 2008
CountyHarvested
Acreage
Yield Per
AcreProduction
Dollars
TRITICALE (Tons) (Tons)
Kings 2,533 3.36 8,511 250.03 2,128,000
Lassen 300 2.20 660 400.00 264,000
Sum of Others 411 2.89 1,186 192.41 228,200
STATE TOTALS 3,244 3.19 10,357 252.99 2,620,200
Counties Reporting -- 3
TURKEYS, POULTS (N/A) (N/A)
Stanislaus 9,124,000
STATE TOTALS 9,124,000
Counties Reporting -- 1
TURKEYS, UNSPECIFIED (N/A) (N/A)
Fresno 66,703,000
Kings 25,950,000
Merced 66,554,000
San Joaquin 3,324,000
Stanislaus 44,555,000
Tulare 9,528,000
Sum of Others 2,677,500
STATE TOTALS 219,291,500
Counties Reporting -- 7
TURNIPS, ALL (Ton) (Ton)
San Bernardino 1 1.00 1 1,000.00 1,000
Sum of Others 133 11.68 1,553 1,968.00 3,056,300
STATE TOTALS 134 11.60 1,554 1,967.37 3,057,300
Counties Reporting -- 2
VEGETABLES, BABY (N/A) (N/A)
Santa Clara 469 2,723,800
Sum of Others 130 2.98 388 2,530.15 981,700
STATE TOTALS 599 2.98 388 2,530.15 3,705,500
Counties Reporting -- 2
VEGETABLES, ORIENTAL, ALL (Tons) (Tons)
Fresno 1,960 6.12 12,000 515.00 6,180,000
Monterey 430 19.07 8,200 266.34 2,184,000
Riverside 2,545 6.89 17,535 1,082.00 18,972,900
San Bernardino 630 5.30 3,342 599.13 2,002,300
San Diego 67 549,500
San Luis Obispo 1,415 33.04 46,752 279.99 13,090,000
Santa Clara 463 21.40 9,908 415.02 4,112,000
Ventura 616 11.30 6,961 629.22 4,380,000
Sum of Others 553 13.47 7,451 454.89 3,389,400
STATE TOTALS 8,679 13.02 112,149 484.27 54,860,100
Counties Reporting -- 9
USDA, NASS, California Field Office 71
California County Agricultural
Commissioners' Data, 2008
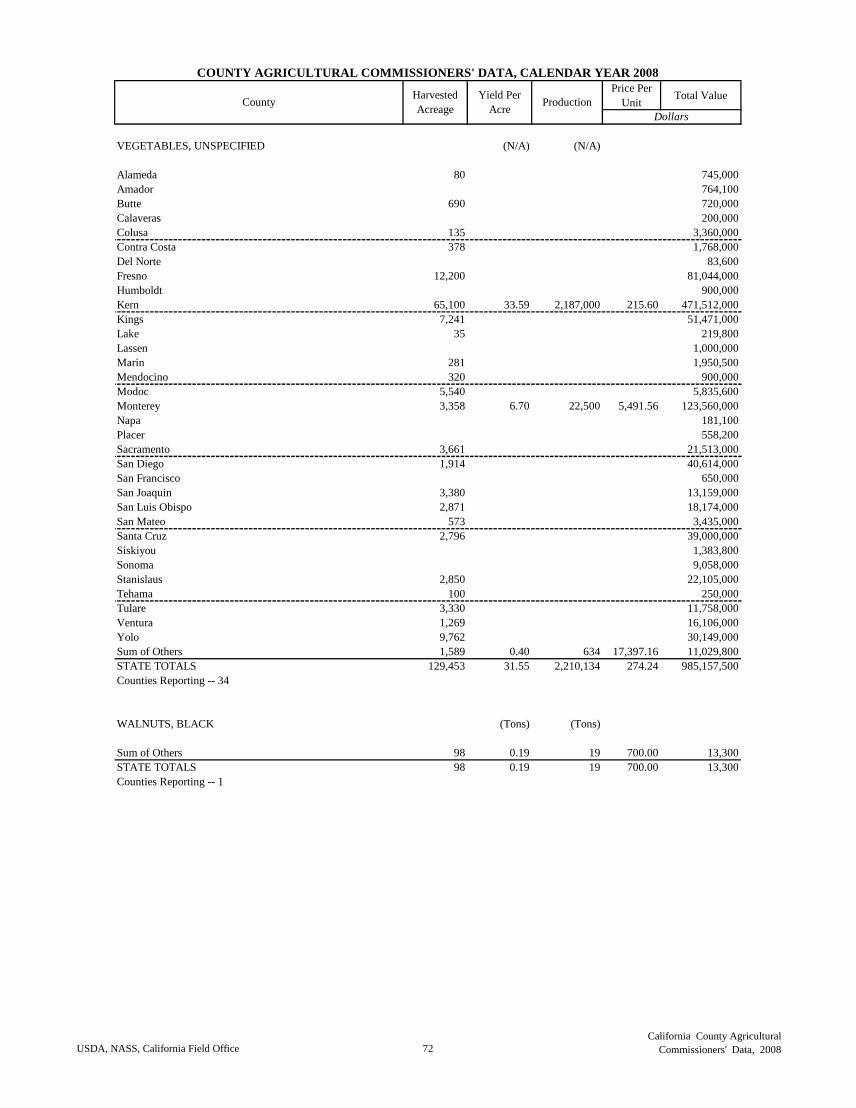
Price Per
UnitTotal Value
COUNTY AGRICULTURAL COMMISSIONERS' DATA, CALENDAR YEAR 2008
CountyHarvested
Acreage
Yield Per
AcreProduction
Dollars
VEGETABLES, UNSPECIFIED (N/A) (N/A)
Alameda 80 745,000
Amador 764,100
Butte 690 720,000
Calaveras 200,000
Colusa 135 3,360,000
Contra Costa 378 1,768,000
Del Norte 83,600
Fresno 12,200 81,044,000
Humboldt 900,000
Kern 65,100 33.59 2,187,000 215.60 471,512,000
Kings 7,241 51,471,000
Lake 35 219,800
Lassen 1,000,000
Marin 281 1,950,500
Mendocino 320 900,000
Modoc 5,540 5,835,600
Monterey 3,358 6.70 22,500 5,491.56 123,560,000
Napa 181,100
Placer 558,200
Sacramento 3,661 21,513,000
San Diego 1,914 40,614,000
San Francisco 650,000
San Joaquin 3,380 13,159,000
San Luis Obispo 2,871 18,174,000
San Mateo 573 3,435,000
Santa Cruz 2,796 39,000,000
Siskiyou 1,383,800
Sonoma 9,058,000
Stanislaus 2,850 22,105,000
Tehama 100 250,000
Tulare 3,330 11,758,000
Ventura 1,269 16,106,000
Yolo 9,762 30,149,000
Sum of Others 1,589 0.40 634 17,397.16 11,029,800
STATE TOTALS 129,453 31.55 2,210,134 274.24 985,157,500
Counties Reporting -- 34
WALNUTS, BLACK (Tons) (Tons)
Sum of Others 98 0.19 19 700.00 13,300
STATE TOTALS 98 0.19 19 700.00 13,300
Counties Reporting -- 1
USDA, NASS, California Field Office 72
California County Agricultural
Commissioners' Data, 2008
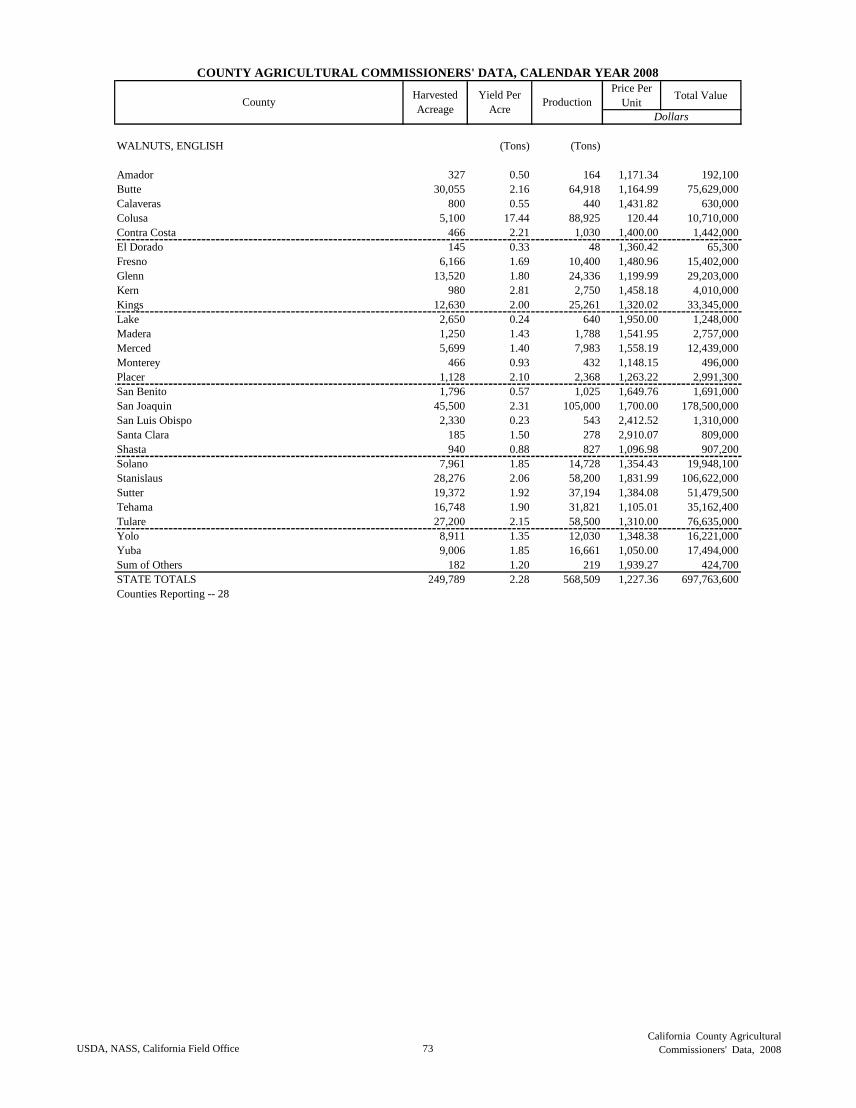
Price Per
UnitTotal Value
COUNTY AGRICULTURAL COMMISSIONERS' DATA, CALENDAR YEAR 2008
CountyHarvested
Acreage
Yield Per
AcreProduction
Dollars
WALNUTS, ENGLISH (Tons) (Tons)
Amador 327 0.50 164 1,171.34 192,100
Butte 30,055 2.16 64,918 1,164.99 75,629,000
Calaveras 800 0.55 440 1,431.82 630,000
Colusa 5,100 17.44 88,925 120.44 10,710,000
Contra Costa 466 2.21 1,030 1,400.00 1,442,000
El Dorado 145 0.33 48 1,360.42 65,300
Fresno 6,166 1.69 10,400 1,480.96 15,402,000
Glenn 13,520 1.80 24,336 1,199.99 29,203,000
Kern 980 2.81 2,750 1,458.18 4,010,000
Kings 12,630 2.00 25,261 1,320.02 33,345,000
Lake 2,650 0.24 640 1,950.00 1,248,000
Madera 1,250 1.43 1,788 1,541.95 2,757,000
Merced 5,699 1.40 7,983 1,558.19 12,439,000
Monterey 466 0.93 432 1,148.15 496,000
Placer 1,128 2.10 2,368 1,263.22 2,991,300
San Benito 1,796 0.57 1,025 1,649.76 1,691,000
San Joaquin 45,500 2.31 105,000 1,700.00 178,500,000
San Luis Obispo 2,330 0.23 543 2,412.52 1,310,000
Santa Clara 185 1.50 278 2,910.07 809,000
Shasta 940 0.88 827 1,096.98 907,200
Solano 7,961 1.85 14,728 1,354.43 19,948,100
Stanislaus 28,276 2.06 58,200 1,831.99 106,622,000
Sutter 19,372 1.92 37,194 1,384.08 51,479,500
Tehama 16,748 1.90 31,821 1,105.01 35,162,400
Tulare 27,200 2.15 58,500 1,310.00 76,635,000
Yolo 8,911 1.35 12,030 1,348.38 16,221,000
Yuba 9,006 1.85 16,661 1,050.00 17,494,000
Sum of Others 182 1.20 219 1,939.27 424,700
STATE TOTALS 249,789 2.28 568,509 1,227.36 697,763,600
Counties Reporting -- 28
USDA, NASS, California Field Office 73
California County Agricultural
Commissioners' Data, 2008
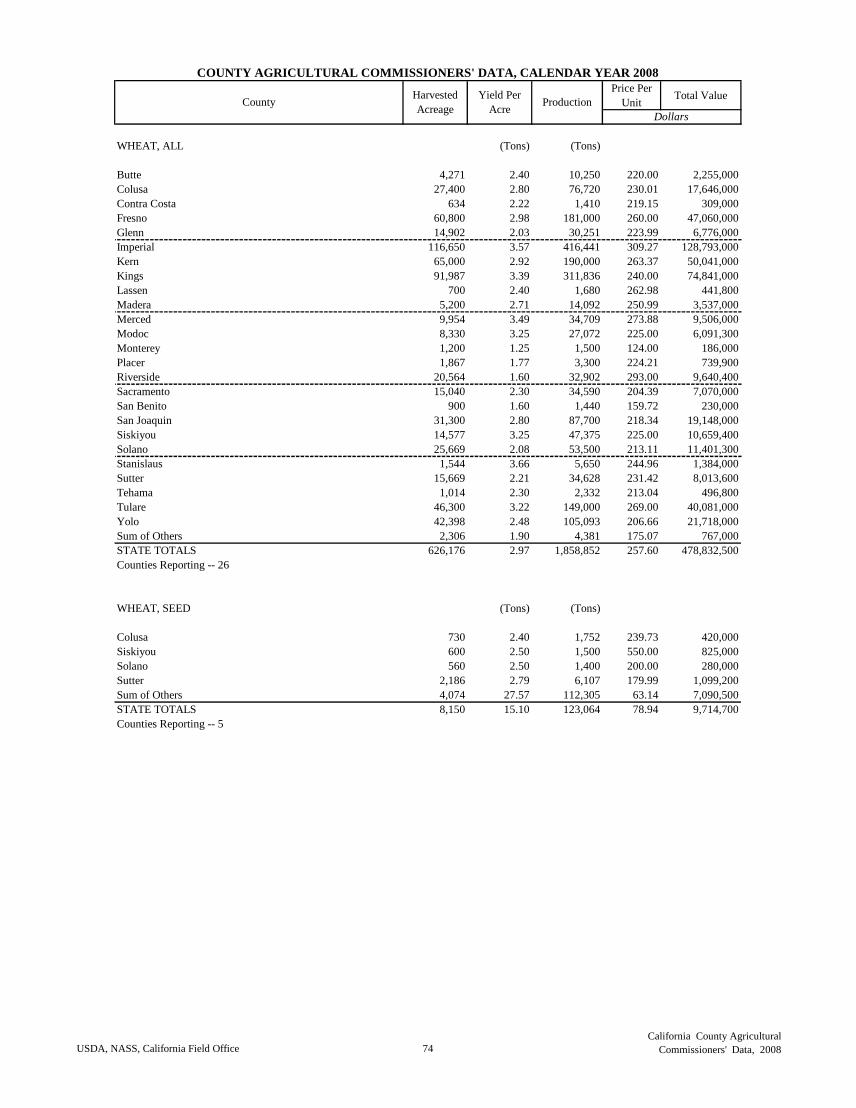
Price Per
UnitTotal Value
COUNTY AGRICULTURAL COMMISSIONERS' DATA, CALENDAR YEAR 2008
CountyHarvested
Acreage
Yield Per
AcreProduction
Dollars
WHEAT, ALL (Tons) (Tons)
Butte 4,271 2.40 10,250 220.00 2,255,000
Colusa 27,400 2.80 76,720 230.01 17,646,000
Contra Costa 634 2.22 1,410 219.15 309,000
Fresno 60,800 2.98 181,000 260.00 47,060,000
Glenn 14,902 2.03 30,251 223.99 6,776,000
Imperial 116,650 3.57 416,441 309.27 128,793,000
Kern 65,000 2.92 190,000 263.37 50,041,000
Kings 91,987 3.39 311,836 240.00 74,841,000
Lassen 700 2.40 1,680 262.98 441,800
Madera 5,200 2.71 14,092 250.99 3,537,000
Merced 9,954 3.49 34,709 273.88 9,506,000
Modoc 8,330 3.25 27,072 225.00 6,091,300
Monterey 1,200 1.25 1,500 124.00 186,000
Placer 1,867 1.77 3,300 224.21 739,900
Riverside 20,564 1.60 32,902 293.00 9,640,400
Sacramento 15,040 2.30 34,590 204.39 7,070,000
San Benito 900 1.60 1,440 159.72 230,000
San Joaquin 31,300 2.80 87,700 218.34 19,148,000
Siskiyou 14,577 3.25 47,375 225.00 10,659,400
Solano 25,669 2.08 53,500 213.11 11,401,300
Stanislaus 1,544 3.66 5,650 244.96 1,384,000
Sutter 15,669 2.21 34,628 231.42 8,013,600
Tehama 1,014 2.30 2,332 213.04 496,800
Tulare 46,300 3.22 149,000 269.00 40,081,000
Yolo 42,398 2.48 105,093 206.66 21,718,000
Sum of Others 2,306 1.90 4,381 175.07 767,000
STATE TOTALS 626,176 2.97 1,858,852 257.60 478,832,500
Counties Reporting -- 26
WHEAT, SEED (Tons) (Tons)
Colusa 730 2.40 1,752 239.73 420,000
Siskiyou 600 2.50 1,500 550.00 825,000
Solano 560 2.50 1,400 200.00 280,000
Sutter 2,186 2.79 6,107 179.99 1,099,200
Sum of Others 4,074 27.57 112,305 63.14 7,090,500
STATE TOTALS 8,150 15.10 123,064 78.94 9,714,700
Counties Reporting -- 5
USDA, NASS, California Field Office 74
California County Agricultural
Commissioners' Data, 2008
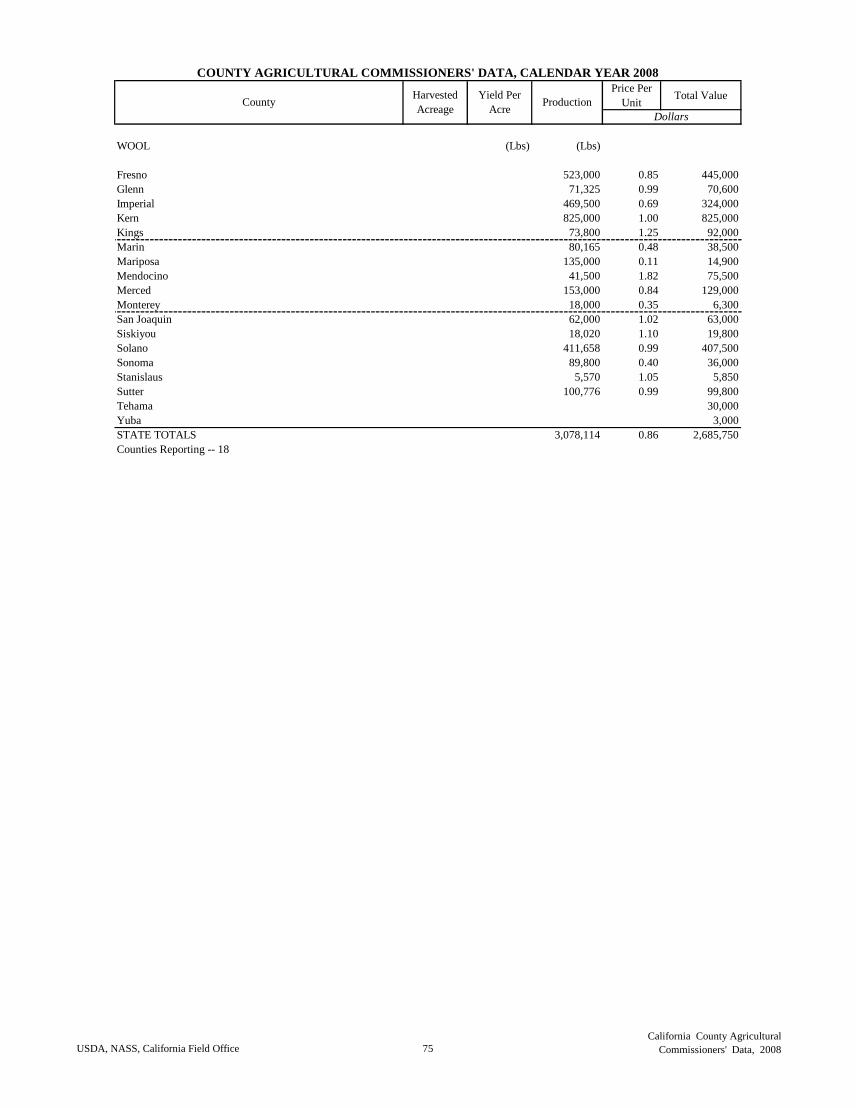
Price Per
UnitTotal Value
COUNTY AGRICULTURAL COMMISSIONERS' DATA, CALENDAR YEAR 2008
CountyHarvested
Acreage
Yield Per
AcreProduction
Dollars
WOOL (Lbs) (Lbs)
Fresno 523,000 0.85 445,000
Glenn 71,325 0.99 70,600
Imperial 469,500 0.69 324,000
Kern 825,000 1.00 825,000
Kings 73,800 1.25 92,000
Marin 80,165 0.48 38,500
Mariposa 135,000 0.11 14,900
Mendocino 41,500 1.82 75,500
Merced 153,000 0.84 129,000
Monterey 18,000 0.35 6,300
San Joaquin 62,000 1.02 63,000
Siskiyou 18,020 1.10 19,800
Solano 411,658 0.99 407,500
Sonoma 89,800 0.40 36,000
Stanislaus 5,570 1.05 5,850
Sutter 100,776 0.99 99,800
Tehama 30,000
Yuba 3,000
STATE TOTALS 3,078,114 0.86 2,685,750
Counties Reporting -- 18
USDA, NASS, California Field Office 75
California County Agricultural
Commissioners' Data, 2008
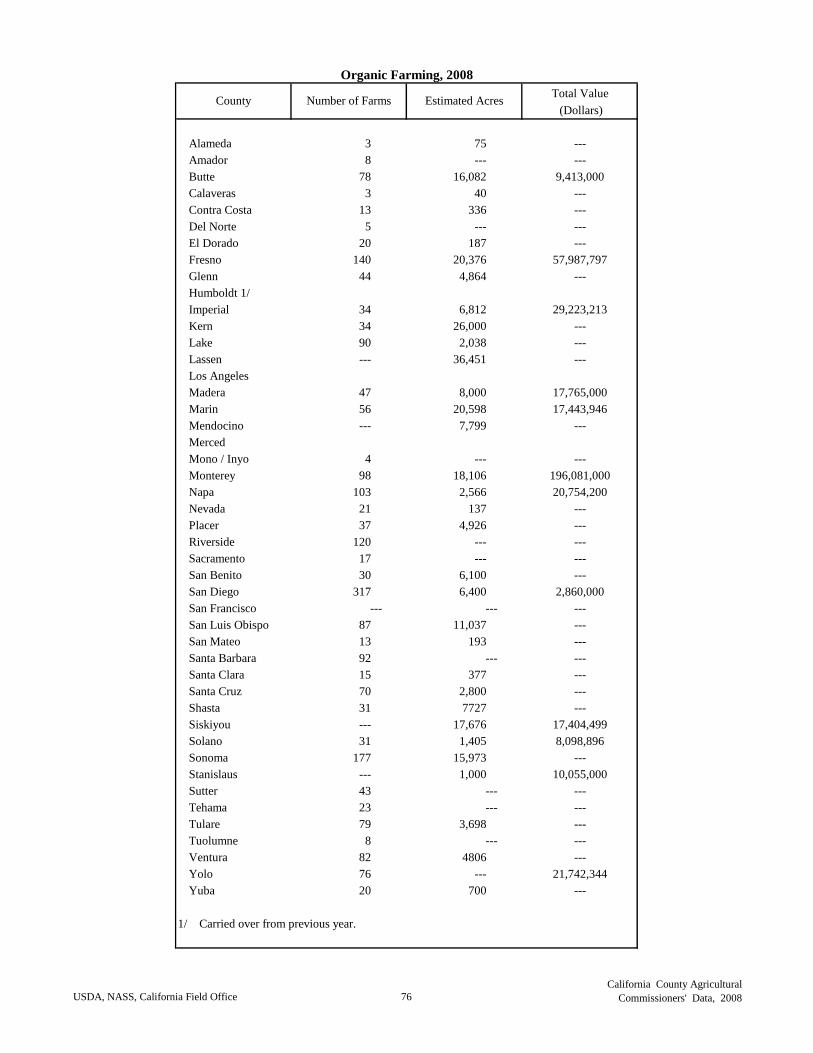
Total Value
(Dollars)
Alameda 3 75 ---
Amador 8 --- ---
Butte 78 16,082 9,413,000
Calaveras 3 40 ---
Contra Costa 13 336 ---
Del Norte 5 --- ---
El Dorado 20 187 ---
Fresno 140 20,376 57,987,797
Glenn 44 4,864 ---
Humboldt 1/
Imperial 34 6,812 29,223,213
Kern 34 26,000 ---
Lake 90 2,038 ---
Lassen --- 36,451 ---
Los Angeles
Madera 47 8,000 17,765,000
Marin 56 20,598 17,443,946
Mendocino --- 7,799 ---
Merced
Mono / Inyo 4 --- ---
Monterey 98 18,106 196,081,000
Napa 103 2,566 20,754,200
Nevada 21 137 ---
Placer 37 4,926 ---
Riverside 120 --- ---
Sacramento 17 --- ---
San Benito 30 6,100 ---
San Diego 317 6,400 2,860,000
San Francisco --- --- ---
San Luis Obispo 87 11,037 ---
San Mateo 13 193 ---
Santa Barbara 92 --- ---
Santa Clara 15 377 ---
Santa Cruz 70 2,800 ---
Shasta 31 7727 ---
Siskiyou --- 17,676 17,404,499
Solano 31 1,405 8,098,896
Sonoma 177 15,973 ---
Stanislaus --- 1,000 10,055,000
Sutter 43 --- ---
Tehama 23 --- ---
Tulare 79 3,698 ---
Tuolumne 8 --- ---
Ventura 82 4806 ---
Yolo 76 --- 21,742,344
Yuba 20 700 ---
1/ Carried over from previous year.
Organic Farming, 2008
County Number of Farms Estimated Acres
USDA, NASS, California Field Office 76
California County Agricultural
Commissioners' Data, 2008