Embed Size (px)
Citation preview

DOCKETED
Docket Number:
17-IEPR-08
Project Title: Barriers Study Implementation
TN #: 217611
Document Title:
California Clean Energy Equity Framework and Indicators
Description: DRAFT STAFF REPORT: Clean Energy Equity Framework and Indicators: An Approach for Tracking Progress of Energy Efficiency and Renewables for Low-Income Customers and Small Business Contracting Opportunities in Disadvantaged Communities
Filer: Raquel Kravitz
Organization: California Energy Commission
Submitter Role:
Commission Staff
Submission Date:
5/15/2017 3:49:17 PM
Docketed Date:
5/15/2017
California Energy Commission
DRAFT STAFF REPORT
California Clean Energy Equity Framework and Indicators An Approach for Tracking Progress of Energy Efficiency and Renewables for Low-Income Customers and Small Business Contracting Opportunities in Disadvantaged Communities
California Energy Commission Edmund G. Brown Jr., Governor
May 2017 | CEC-300-2017-051-SD

California Energy Commission
Pamela Doughman
Michael J. Sokol
Primary Authors
Heather Raitt
Project Manager
Robert P. Oglesby
Executive Director
DISCLAIMER
Staff members of the California Energy Commission prepared this report. As such,
it does not necessarily represent the views of the Energy Commission, its
employees, or the State of California. The Energy Commission, the State of
California, its employees, contractors and subcontractors make no warrant, express
or implied, and assume no legal liability for the information in this report; nor does
any party represent that the uses of this information will not infringe upon
privately owned rights. This report has not been approved or disapproved by the
Energy Commission nor has the Commission passed upon the accuracy or
adequacy of the information in this report.

i
ACKNOWLEDGEMENTS
Energy Commission staff would like to thank the following organizations, including but
not limited to the individuals identified, for their invaluable assistance with this report:
California Energy Commission
Kevin Barker
Rhetta DeMesa
Bryan Early
Alana Mathews
Bill Pennington
Courtney Smith
California Environmental Protection
Agency
Ashley Conrad-Saydah
California Workforce Development
Board
Sarah White
Center for Labor Research and
Education, U.C. Berkeley
Carol Zabin
Greenlining Institute
Sekita Grant
Stephanie Chen
Joel Espino
Sona Mohnot
Los Angeles Department of Water and
Power
Nancy Sutley
John Chen
U.S. Department of Energy
Monica Neukomm
Krystal Laymon
Seungwook Ma
Deborah Ogunshakin (contractor)

ii
ABSTRACT
This paper presents a framework and indicators to measure low-income customers’
access to energy efficiency, weatherization, and renewable energy investments in
California. It also recommends indicators related to contracting with small businesses
located in disadvantaged communities. Leveraging existing data and indicators, the
framework and indicators were developed to track progress toward implementing
recommendations in the California Energy Commission’s December 2016 study
mandated by Senate Bill 350 (De León, Chapter 547, Statutes of 2015): Low-Income
Barriers Study, Part A: Overcoming Barriers to Energy Efficiency and Renewables for Low-
Income customers and Small Business Contracting Opportunities in Disadvantaged
Communities. Also, the indicators can help identify opportunities to improve benefits
for low-income customers and disadvantaged communities from California clean energy
programs.
Keywords: Equity, indicators, energy efficiency, weatherization, photovoltaic, solar,
renewables, low-income, disadvantaged communities, small business, SB 350
Please use the following citation for this report:
Doughman, Pamela, Michael J. Sokol. 2017. California Clean Energy Equity Framework
and Indicators: An Approach for Tracking Progress of Energy Efficiency and
Renewables for Low-Income Customers and Small Business Contracting
Opportunities in Disadvantaged Communities. California Energy Commission.
Publication Number: CEC-300-2017-051-SD.

iii
TABLE OF CONTENTS Page
Acknowledgements ............................................................................................................................ i
Abstract ................................................................................................................................................ ii
Table of Contents ............................................................................................................................. iii
List of Figures .................................................................................................................................... iii
List of Tables ...................................................................................................................................... iv
Executive Summary .......................................................................................................................... 1A Framework for Clean Energy Equity .................................................................................................... 1California Clean Energy Equity Indicators .............................................................................................. 1Next Steps ..................................................................................................................................................... 2
CHAPTER 1: Energy Challenges and Opportunities ..................................................................... 5
Changing Times ............................................................................................................................... 5
Barriers .............................................................................................................................................. 6
Addressing Barriers ........................................................................................................................ 6
Leveraging Existing Indicators and Best Practices ................................................................... 7
CHAPTER 2: A Framework for Clean Energy Equity .................................................................... 8
Improve Access to Clean Energy .................................................................................................. 8
Expand Clean Energy Investment ................................................................................................ 9
Increase Resilience ....................................................................................................................... 10
Local Conditions and Priorities ................................................................................................. 12
CHAPTER 3: Tracking Progress With Energy Equity Performance Indicators ..................... 13
Proposed Performance Indicators and Data Sources ........................................................... 13
Input Needed: Lead and Supporting Agencies for Geospatial Indicators and
Performance Indicators ............................................................................................................... 27
LIST OF FIGURES Page
Figure 1: California ISO: Total Hourly Electricity Production by Resource Type for
Saturday, April 22, 2017 ................................................................................................................. 16
Figure 2: California ISO Net Load Curve ..................................................................................... 16
Figure 3: 2014 Energy Burden (Avg. Expend./Avg. Income, $/yr.) for Fresno County ...... 23

iv
LIST OF TABLES Page
Table 1: Objectives Addressed by SB 350 Low-Income Recommendations ........................ 11
Table 2: Indicators Address SB 350 Low-Income Recommendations ................................... 26

1
EXECUTIVE SUMMARY
In December 2016, the California Energy Commission adopted the Low-Income Barriers
Study, Part A: Overcoming Barriers to Energy Efficiency and Renewables for Low-income
customers and Small Business Contracting Opportunities in Disadvantaged Communities.
The study, mandated by Senate Bill 350 (De León, Chapter 547, Statutes of 2015),
included 12 recommendations to address barriers to clean energy investment in
California’s low-income and disadvantaged communities. The 2016 Low-Income Barriers
Study included a recommendation to:
Develop standardized energy equity indicators as metrics to ensure low-income
customers are being served. The purpose of metrics is to set a statewide
baseline, advance energy savings, and track performance.
Building on the 2016 Low-Income Barriers Study, this study recommends a framework
and indicators for the Energy Commission and other state agencies to use to track
progress of clean energy equity in California.
A Framework for Clean Energy Equity
The California clean energy equity framework proposed in this report identifies
objectives and a set of indicators to measure progress to achieve the objectives, taking
local considerations into account.
The three objectives are to:
Advance access to clean energy, including actions to increase product selection
options, access to good jobs, expand small business contracting opportunities,
and improve access to nondebt financing, such as tariffed on-bill financing.
Increase clean energy investment in low-income and disadvantaged communities,
including research demonstrations, infrastructure investments, emergency
preparedness, and capacity building. Capacity building includes workforce
development, small business development, outreach, and education for clean
energy.
Improve local energy-related resilience, defined as energy services to support the
ability of local communities to recover from grid outages. Local energy resilience
includes energy reliability, energy affordability, health, and safety.
California Clean Energy Equity Indicators
The framework includes two types of indicators. The first type is geospatial indicators
to measure local considerations related to the local economy, geography, demography,
social engagement, public health, and environmental quality. These factors interact to
affect local challenges and opportunities:
G1. Regional economic dynamics (local economic drivers, income inequality)

2
G2. Climate zones (physical stressors and risks related to climate change)
G3. Population density (multifamily housing, urban versus rural)
G4. Local resources, including engagement (local government resources,
community based organizations), utility programs, and energy infrastructure
characteristics
G5. Public health indicators (air quality, water quality, and so forth)
G6. CalEnviroScreen score (disadvantaged communities)
This framework also includes the following performance indicators. In selecting these
indicators, Energy Commission staff leveraged existing data collection and indicator
development efforts. Staff reviewed reports and consulted with staff at state agencies,
the U.S. Department of Energy, and the Los Angeles Department of Water and Power.
Energy Commission staff proposes the following set of clean energy equity indicators:
P1. Energy savings (megawatt-hours [MWh] or therms saved)
P2. Number of households and small businesses served
P3. Renewable energy MWh generated/MW installed
P4. Proportion of low-income communities and disadvantaged communities with
clean energy small business contracts by utility
P5. Amount invested
P6. Workforce and small business development
P7. Number and quality of jobs
P8. Access to jobs
P9. System Average Interruption Duration Index (SAIDI)
P10. Electricity bill as a proportion of income
P11. Number of household health and safety issues abated
P12. Proportion of critical facilities with resilient on-site generation and storage
Next Steps
Staff will present this draft framework and proposed indicators at a public workshop on
May 16, 2017. At the workshop, staff will seek input to improve the draft, including
responses to the following questions:
1. How should these indicators be revised to improve measurement of clean energy
access, investment, and resilience for California’s low-income communities and
disadvantaged communities?
2. How can these indicators best leverage existing equity indicators and data?
3. Which agency, organization, or program administrator(s) should take the lead for
each indicator?
4. How can local priorities be most effectively integrated into these indicators?

3
Comments from the workshop will inform further development of this framework and
indicators and preparation of a Tracking Progress summary of implementation of
recommendations in the SB 350 Low-Income Barriers Study. In late 2017, staff expects to
make the summary available online at
http://www.energy.ca.gov/renewables/tracking_progress/.

4

5
CHAPTER 1: Energy Challenges and Opportunities
Changing Times California is leading by example to reduce greenhouse gas emissions to slow the rate
and scale of climate change while preparing for climate change impacts that have
already been set in motion. In 2012, California generated 1 percent of global greenhouse
gas emissions.1 By working together with other states, provinces, and communities,
California can amplify the benefits of its climate change mitigation efforts. As of May
2017, 170 subnational governments, representing more than one-third of the global
economy, have joined the Subnational Global Climate Leadership Memorandum of
Understanding, or the Under 2 MOU, launched by Governor Edmund G. Brown Jr. in
2015. Members of the Under 2 MOU commit to reduce 2050 greenhouse gas emissions
within their jurisdiction to 80 to 95 percent below 1990 levels, or 2 annual metric tons
of carbon dioxide-equivalent per capita.
Climate change is projected to have the largest impact on low-income, people of color
because they have fewer resources to avoid, withstand, or recover from extreme
weather, sea level rise, and related challenges.2
Efforts to increase low-income customers’ access to clean energy alternatives and
expand investment in disadvantaged communities can provide new opportunities for
economic growth and strengthen resilience in California.
Senate Bill 350 (De León, Chapter 547, Statutes of 2015) included ambitious goals to
help California reduce greenhouse gas emissions, including doubling energy efficiency
savings and procuring at least 50 percent renewable energy by 2030. SB 350 also
mandated studies be conducted to improve understanding of barriers for low-income
customers to access energy efficiency, weatherization, renewable energy, and zero-
emission transportation options, as well as barriers to contracting opportunities for
local small businesses in disadvantaged communities. The California Air Resources
Board prepared and published a draft study on barriers to zero-emission transportation
options and plans to publish a final guidance document later in 2017.3 The Energy
1 California Energy Commission. December 20, 2016. Tracking Progress: Greenhouse Gas Emission Reductions. http://energy.ca.gov/renewables/tracking_progress/documents/Greenhouse_Gas_Emissions_Reductions.pdf.
2 Morello-Frosch, Rachel, Manuel Pastor, Jim Sadd, and Seth B. Shonkoff. May 2009. The Climate Gap: Inequalities in How Climate Change Hurts Americans and How to Close the Gap. Program for Environmental and Regional Equity (PERE) Publications. University of Southern California. https://dornsife.usc.edu/pere/climategap/
3 California Air Resources Board. April 12, 2017. Low-Income Barriers Study, Part B: Overcoming barriers to Clean Transportation Access for Low-Income Residents. Draft Guidance Document.
6
Commission prepared and published a study of barriers to expand low-income
communities’ access to energy efficiency, weatherization, and renewable energy
investments, and small businesses located in disadvantaged communities.4
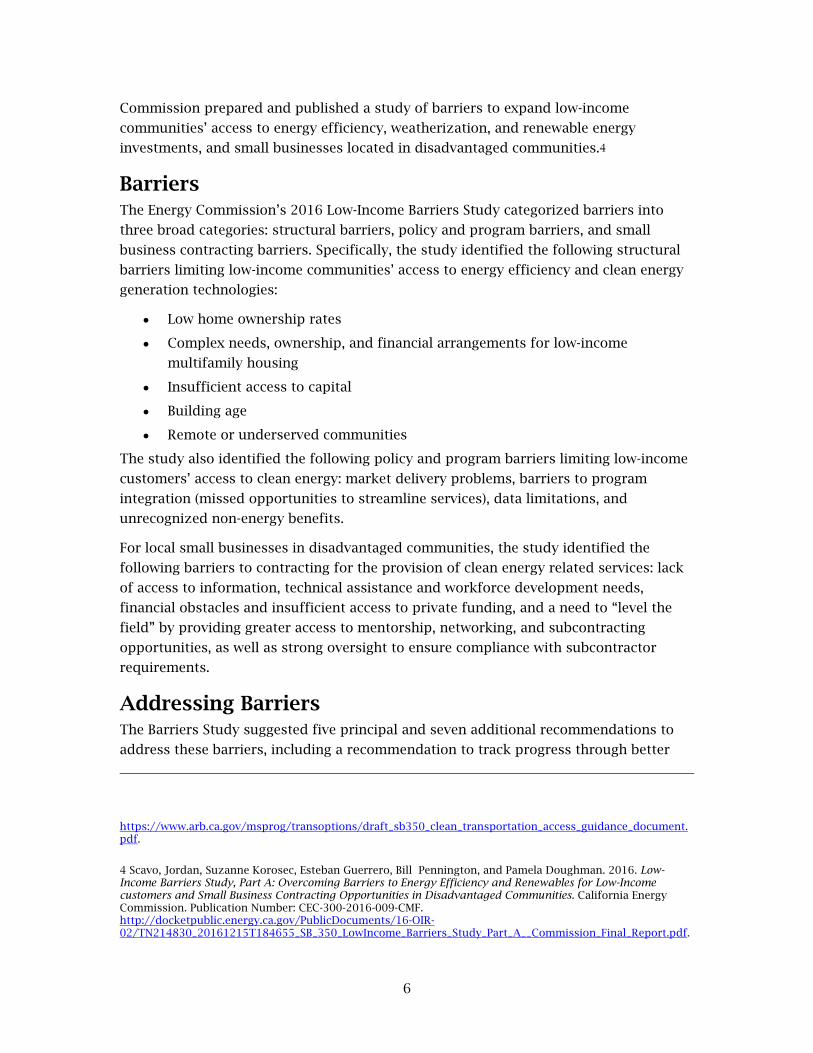
Barriers The Energy Commission’s 2016 Low-Income Barriers Study categorized barriers into
three broad categories: structural barriers, policy and program barriers, and small
business contracting barriers. Specifically, the study identified the following structural
barriers limiting low-income communities’ access to energy efficiency and clean energy
generation technologies:
Low home ownership rates
Complex needs, ownership, and financial arrangements for low-income
multifamily housing
Insufficient access to capital
Building age
Remote or underserved communities
The study also identified the following policy and program barriers limiting low-income
customers’ access to clean energy: market delivery problems, barriers to program
integration (missed opportunities to streamline services), data limitations, and
unrecognized non-energy benefits.
For local small businesses in disadvantaged communities, the study identified the
following barriers to contracting for the provision of clean energy related services: lack
of access to information, technical assistance and workforce development needs,
financial obstacles and insufficient access to private funding, and a need to “level the
field” by providing greater access to mentorship, networking, and subcontracting
opportunities, as well as strong oversight to ensure compliance with subcontractor
requirements.
Addressing Barriers The Barriers Study suggested five principal and seven additional recommendations to
address these barriers, including a recommendation to track progress through better
https://www.arb.ca.gov/msprog/transoptions/draft_sb350_clean_transportation_access_guidance_document.pdf.
4 Scavo, Jordan, Suzanne Korosec, Esteban Guerrero, Bill Pennington, and Pamela Doughman. 2016. Low-Income Barriers Study, Part A: Overcoming Barriers to Energy Efficiency and Renewables for Low-Income customers and Small Business Contracting Opportunities in Disadvantaged Communities. California Energy Commission. Publication Number: CEC-300-2016-009-CMF. http://docketpublic.energy.ca.gov/PublicDocuments/16-OIR-02/TN214830_20161215T184655_SB_350_LowIncome_Barriers_Study_Part_A__Commission_Final_Report.pdf.

7
use of data-driven performance indicators. Each recommendation addresses a number
of the barriers identified in the study.
Led by Commissioner Janea Scott, Energy Commission staff is working closely with
other state agencies to implement the recommendations in Part A and Part B of the
Barriers Study. The Governor’s Office has organized a joint agency task force, with the
support of the Energy Commission and Air Resources Board staff, to identify and
prioritize near term actions state agencies should take to support implementation of the
Barriers Study recommendations.
Leveraging Existing Indicators and Best Practices This report provides a draft framework and set of proposed indicators to ensure low-
income customers and disadvantaged communities have equitable levels of clean energy
access, investment, and resilience. These indicators will be used to set a statewide
baseline, advance energy savings, and track performance. To inform further
development of indicators proposed in this report, staff seeks input on available data,
existing indicators, and best practices. Specifically,
1. How should these indicators be revised to improve measurement of clean energy
access, investment, and resilience for California’s low-income communities and
disadvantaged communities?
2. How can these indicators best leverage existing equity indicators and data?
3. Which agency, organization, or program administrator(s) should take the lead for
each indicator?
4. How can local priorities be most effectively integrated into these indicators?

8
CHAPTER 2: A Framework for Clean Energy Equity
As stated in the Energy Commission’s Barriers Study, standardized energy equity
indicators should be developed to “ensure low-income customers are being served. The
purpose of metrics is to set a statewide baseline, advance energy savings, and track
performance.”
Energy Commission staff has identified three objectives to ensure low-income
customers are being served: improve access, expand investment, and increase
community resilience. Staff has also selected draft indicators of local conditions and
priorities.
Improve Access to Clean Energy The first objective is to improve low-income customers’ access to clean energy
technologies. This includes access to product selection options, access to good jobs,
small-business contracting opportunities, and nondebt financing opportunities available
for low-income customers and disadvantaged communities.
Indicators for product selection, small-business contracting opportunities, and nondebt
financing will focus on the outcomes expected from improved product selection, such
as households served (to track participation in available programs) and MWh saved (to
track program effectiveness in saving energy).
In general, traditional, debt-based financing will be of limited assistance to multifamily
building owners or single-family homeowners in low-income or disadvantaged
communities.5 There is an unmet need for expansion of other, innovative, inclusive
nondebt financing opportunities for energy efficiency upgrades in rental housing in California.6, 7
5 Stamas, Maria. September 29, 2016, Comments of the GREEN-Energy Efficiency for All Coalition, including NRDC, CHPC, AEA, Greenlining Institute, and Build It Green. http://docketpublic.energy.ca.gov/PublicDocuments/16-OIR-02/TN213843_20160929T152126_Maria_Stamas_Comments_Comments_of_the_GREENEnergy_Efficiency_fo.pdf.
6 Scavo, Jordan, Suzanne Korosec, Esteban Guerrero, Bill Pennington, and Pamela Doughman. 2016. Low-Income Barriers Study, Part A: Overcoming Barriers to Energy Efficiency and Renewables for Low-Income Customers and Small Business Contracting Opportunities in Disadvantaged Communities. California Energy Commission. Publication Number: CEC-300-2016-009-CMF. http://docketpublic.energy.ca.gov/PublicDocuments/16-OIR-02/TN214830_20161215T184655_SB_350_LowIncome_Barriers_Study_Part_A__Commission_Final_Report.pdf.
7 Schwartz, Matt, Blanca de la Cruz, Caroline McCormack, Stephanie Wang. March 2017. Financing Energy Savings Through On-Bill Repayment: Testing a New Financing Strategy for Affordable Rental Homes in Santa Monica. California Housing Partnership Corporation. Available online from http://chpc.net/resources-library/.

9
For example, in December 2016 comments on the SB 350 Low-Income Barriers Study,
Clean Energy Works described successes achieved through tariffed on-bill programs in
other states:
In particular, state energy offices in Arkansas and Tennessee have played an
active role in supporting implementation of best practices, offering technical
assistance, and convening stakeholders for voluntary participation in workshops
designed to support program planning and implementation. In each case, only
those utilities that are interested in offering an inclusive financing solution are
receiving the benefits of that assistance, and the authority to decide whether to
offer a tariffed on-bill program remains with the governing bodies of those utilities.8
Local conditions and priorities will affect the baseline, energy savings, and effect of
actions to improve performance of these indicators. For example, a disadvantaged
community in coastal San Diego County may have a large proportion of homes built in
the 1960s without air conditioning or wall insulation. Historically, the weather was mild,
but climate change projections indicate average temperatures will rise in coming
decades, making it increasingly difficult to remain comfortable in such housing.
Residents, especially renters, are likely to seek low-cost air conditioning options in
greater numbers over time, although they may not be able to afford to operate the units
as frequently as needed to maintain comfort. Access to programs or business models to
provide incentives to homeowners to bring homes up to current Title 24 building
efficiency standards at no or low cost to renters would provide energy savings
important to the renter and avoid potential load growth in local energy use.
Indicators should include data to track changes over time within a disadvantaged
community in comparison to neighboring communities and other disadvantaged
communities in California.
Expand Clean Energy Investment The second objective is to expand investment in disadvantaged communities in
California. This includes investments in building-owner investments, research
demonstrations, infrastructure, emergency preparedness, and capacity building,
including investments in local small businesses.
Motivating building owners to invest is the most critical step to make a sea change in
low-income programs. The framework is clear about the importance of building owner
engagement, and focusing on identifying and removing the barriers that cause building
8 Hummel, Holmes. December 8, 2016. Clean Energy Works Comments: On Revised Draft of the SB 350 Barriers Study. http://docketpublic.energy.ca.gov/PublicDocuments/16-OIR-02/TN214717_20161208T200842_Holmes_Hummel_Comments_Comments_on_Revised_Draft_of_the_SB350_B.pdf.

10
owners not to invest. The framework includes explicit indicators regarding the extent
that this is happening and the success of removing barriers to building owner
investment.
Increase Resilience The third objective is to improve resilience, defined as the ability to recover from
extreme weather, fires, flooding, electricity outages, and other disasters. This includes
energy reliability, energy affordability (energy burden), health, and safety.
In comments informing development of the SB 350 Low-Income Barriers report, GREEN-
Energy Efficiency for All Coalition (GREEN-EEFA) highlighted the importance of
addressing the energy burden through energy efficiency programs and metrics.
Specifically, it recommended “low-income programs contain overall energy savings and
energy burden reduction goals. Setting a high-level goal will ensure programs are
optimized to achieve it. The Energy Commission further recommends these metrics be
tracked over time to assess program success at reducing bills and achieving savings.
Refocusing on energy burden reductions will also require low-income efficiency
programs to provide funding for measures with significant bill and energy usage
reduction potential.”9
Table 1 shows how each recommendation in the SB 350 Low-Income Barriers report will
contribute to the three objectives: access, investment, and resilience. However, the
primary effect of each recommendation is indicated by the table cells highlighted in
green.
9 Stamas, Maria. September 29, 2016, Comments of the GREEN-Energy Efficiency for All Coalition, including NRDC, CHPC, AEA, Greenlining Institute, and Build It Green. http://docketpublic.energy.ca.gov/PublicDocuments/16-OIR-02/TN213843_20160929T152126_Maria_Stamas_Comments_Comments_of_the_GREENEnergy_Efficiency_fo.pdf.

11
Table 1: Objectives Addressed by SB 350 Low-Income Recommendations
SB 350 Low-Income Recommendation
Access Investment Resilience
1. Task force Product selection Nondebt financing Small business opps
Infrastructure Emergency prep Capacity building
Energy reliability Energy affordability Health Safety
2. Community solar Product selection Nondebt financing Small business opps
Infrastructure Emergency prep Capacity building
Energy reliability Energy affordability
3. Workforce development Nondebt financing Small business opps
Capacity building Health Safety
4. Clean energy financing pilot programs
Product selection Nondebt financing Small business opps
Invest. by owner Infrastructure Emergency prep Capacity building
Energy affordability Health Safety
5. Common performance metrics and data
Product selection Nondebt financing Small business opps
Invest. by owner Research demo Infrastructure Emergency prep Capacity building
Energy reliability Energy affordability Health Safety
6. Access to solar energy technologies
Product selection Nondebt financing Small business opps
Infrastructure Emergency prep Capacity building
Energy reliability Energy affordability
7. Affordable housing tax credits
Product selection Nondebt financing Small business opps
Invest. by owner Infrastructure Emergency prep Capacity building
Energy affordability Health Safety
8. Regional one-stop pilots Product selection Nondebt financing Small business opps
Capacity building Energy reliability Energy affordability Health Safety
9. Investigate the need for heightened clean energy consumer protection
Product selection Small business opps
Capacity building Safety
10. Collaboration with community-based organizations
Product selection Nondebt financing Small business opps
Capacity building Energy affordability Health Safety
11. R&D to benefit disadvantaged communities
Product Selection Nondebt financing Small business opps
Research demo Energy reliability Energy affordability Health Safety
12. Study on small-business contracting opportunities
Product selection Nondebt financing Small business opps
Capacity building Energy affordability Health Safety
Source: California Energy Commission staff, based on Scavo, Jordan, Suzanne Korosec, Esteban Guerrero,
Bill Pennington, and Pamela Doughman. 2016. Low-Income Barriers Study, Part A: Overcoming Barriers to
Energy Efficiency and Renewables for Low-Income Customers and Small Business Contracting Opportunities in
Disadvantaged Communities. California Energy Commission. Publication Number: CEC-300-2016-009-CMF.

12
Local Conditions and Priorities Local conditions help identify opportunities to improve clean energy access, investment,
and resilience. For example, access to affordable air conditioning in one part of the state
may be a large factor for public health; in another location, it may be less essential.
Place-based considerations related to the local economy, geography, demography, social
engagement, public health, and environmental quality interact to affect local energy-
related challenges and opportunities. This framework includes the following geospatial
indicators of local conditions and priorities. Where data are available, staff plans to
apply these indicators at the census tract level:
G1. Regional economic dynamics (local economic drivers, income inequality)
G2. Climate zones (physical stressors and risks related to climate change)
G3. Population density (multifamily housing, urban versus rural)
G4. Local resources, including local engagement (local government resources,
community-based organizations), utility programs, and energy infrastructure
characteristics (ability to absorb additional local energy resources)
G5. Public health indicators (air quality, water quality, and so forth)
G6. CalEnviroScreen score (disadvantaged communities)
For example, Los Angeles Department of Water and Power used its equity indicators to
identify census tracts with fewer rooftop solar systems installed than other census
tracts in their service territory. LADWP used this information to target development of
its community solar program to increase clean energy investment where most needed.
13
CHAPTER 3: Tracking Progress With Energy Equity Performance Indicators
This framework includes geospatial and performance indicators. The geospatial
indicators are widely available. The performance indicators need further input to clarify
existing data sources and applicable lead agencies.
In selecting proposed clean energy equity performance indicators, Energy Commission
staff leveraged existing data collection and indicator development efforts. Staff reviewed
published reports and consulted with relevant experts, including staff at state agencies,
the U.S. Department of Energy and the Los Angeles Department of Water and Power.
Staff seeks input on data sources and lead agencies for the following indicators.
Staff proposes the following set of clean energy equity performance indicators to
measure progress toward expanding clean energy access, investment, and resilience in
California’s low-income and disadvantaged communities. Where feasible, each
performance indicator will be measured by census tract (or zip code, if necessary) to
facilitate comparison of performance across geospatial indicators. Criteria for selection
included data availability and relevancy. All indicators are relevant to the following
cross-cutting Barriers Study recommendations: Recommendation 1 (Task Force) and
Recommendation 5 (Metrics and Data). Relevance of indicators to other
recommendations is described below and summarized in Table 2.
Proposed Performance Indicators and Data Sources Each proposed performance indicator is described below along with potential data
sources.
P1. Energy savings (MWh or therms saved). This indicator measures energy saved
from energy efficiency measures installed through implementing
recommendations in the SB 350 Low-Income Barriers report. This indicator
applies to all three objectives: access (outcome of product selection, nondebt
financing, and small business opportunities); investment (outcome of research
and demonstration, emergency preparedness); and resilience (component of
energy affordability). Place-based considerations to be taken into account when
using this indicator include climate zone and expected increase in extreme heat
events due to climate change and local resources (achieved proportion of
willingness to participate in direct install programs). This indicator is most
applicable to the following Low-Income Barrier report recommendations:
a. Energy efficiency financing pilots (Recommendation 4)
b. Affordable housing credits (Recommendation 7)
14
c. State-local collaboration (Recommendation 10)
d. Research and development (Recommendation 11)
Data sources for this indicator will be the evaluation, measurement, and
verification reports required for each program. Key resources include:
a. Energy efficiency program tracking data and evaluation studies, and cost-
effectiveness tools available from the California Energy Efficiency
Statistics. http://eestats.cpuc.ca.gov/Default.aspx.
b. Publicly owned utility energy efficiency and performance metrics that are
available from the California Energy Commission at
http://www.energy.ca.gov/pou_reporting/background/metrics.html.
c. The definition by the American Council for an Energy-Efficient Economy
(ACEEE) of industry performance metrics used by California publicly
owned electric utilities, including energy savings. For more information,
see http://aceee.org/ee-metrics.
d. The U.S. DOE State and Local Energy Efficiency Action Network (SEE
Action) Evaluation, Measurement, and Verification (EM&V) Resource
Portal at https://www4.eere.energy.gov/seeaction/evaluation-
measurement-and-verification-resource-portal.
P2. Number of households and small businesses served. This indicator measures
the number of households and small businesses served in low-income and
disadvantaged communities. This indicator measures progress toward expanding
access to energy efficiency and renewable energy, including product selection,
nondebt financing, and small business opportunities. Place-based considerations
related to this indicator include regional economic dynamics (technologies most
relevant to local economic conditions, income inequality), climate zones
(technologies most relevant to local climate-related stressors and risks),
population density (multifamily housing, urban versus rural), and local
engagement (participation of local government and community-based
organizations). This indicator applies to the following recommendations:
a. Solar access (Recommendation 6)
b. One-stop shop (Recommendation 8)
c. Investigating the need for heightened energy consumer protection
(Recommendation 9)
d. Small business opportunities (Recommendation 12)
Data for this indicator will be the number of households and small businesses
participating in programs to expand access to energy efficiency and renewable
energy product selection, nondebt financing, and small business opportunities.
Data should be collected from program administrators. For example, one-stop

15
shops could survey communities within their region to assess local availability of
services and products from energy service companies accredited by the National
Association of Energy Service Companies. The survey could include feedback
from customers, small businesses, and service providers on lessons learned,
success stories, and remaining needs. Data should include the census tract of the
participant and the service provider to simplify targeting resources to
underserved low-income and disadvantaged communities, taking the following
local conditions into account: regional economic dynamics (technologies most
relevant to local economic conditions), climate zones (technologies most relevant
to local climate-related stressors and risks), population density (government and
private-sector energy-related services and programs available for urban versus
rural locations), and local engagement (resources available to local communities
from local government and community-based organizations).
P3. Renewable energy MWh generated per year/MW installed.
This indicator will measure the amount of renewable energy generated per year
per megawatt installed where data are available. Where data are not available,
estimates of generation will be used based on net load or other applicable data.
This indicator measures how well renewable energy systems perform, reflecting
on the quality of the site and workmanship of installation/operation. The
objectives addressed by this indicator include access (product selection),
investment (research demonstration, infrastructure, emergency preparedness,
and capacity building), and resilience (reliability and affordability). Place-based
considerations for this indicator include climate zone (insolation), and
population density (multifamily housing, distributed versus utility-scale
renewable energy), and energy infrastructure characteristics (ability to absorb
additional local energy resources). This indicator applies to the following
recommendations:
a. Community solar (Recommendation 2)
b. Workforce development (Recommendation 3)
c. Access to solar technologies (Recommendation 6)
d. Research and development (Recommendation 11)
These data should be collected by energy service companies, system operators,
utilities, or California ISO, as applicable, annually to assess the performance of
installed systems relative to the installed capacity. For example, the California
ISO provides the hourly average breakdown of total production by resource type
(Figure 1). For wind and solar, the California ISO summarizes this information on
annual basis to indicate the amount and timing of afternoon ramp needed from
other resources (Figure 2). Where data are available, actual energy generation,
installed capacity, and the ratio should be reported by census tract, zip code, or
climate zone, depending on the level of aggregation, or collection, needed to

16
protect private information. Locational information is needed to target
additional resources to underserved communities, taking into account climate
zone (insolation) and population density (available locations for rooftop versus
ground-mounted systems).
Figure 1: California ISO: Total Hourly Electricity Production by Resource Type for Saturday, April 22, 2017
Source: California ISO, Renewables Watch. Saturday, April 22, 2017.
Figure 2: California ISO Net Load Curve
Source: California ISO, 2016, Fast Facts: What the duck curve tells us about managing a green grid.

17
P4. Proportion of low-income and disadvantaged communities with clean energy
small business contracts.
This indictor will measure the number of low-income and disadvantaged
communities with clean energy small business contracts divided by the total
number of low-income and disadvantaged communities. This will identify
specific communities in need of additional assistance to improve the success of
local small businesses in bidding for utility and government contracting
opportunities. The objectives addressed by this indicator include access (small
business opportunities) and investment (capacity building, research and
development). Place-based considerations include regional economic dynamics
(number of small businesses by zip code), population density (urban versus
rural, proximity to distributed versus utility-scale renewable energy), local
resources (availability/proximity of services from the electric utility, local
chamber of commerce, business incubators, and federal small-business support
agencies), and CalEnviroScreen score (disadvantaged communities). This
indicator applies to the following recommendations:
a. Community solar (Recommendation 2)
b. Workforce development (Recommendation 3)
c. Energy efficiency financing pilots (Recommendation 4)
d. Access to solar technologies (Recommendation 6)
e. Research and development (Recommendation 11)
f. Small business opportunities (Recommendation 12)
For state contracts, the California Department of General Services Office of Small
Business and Disabled Veteran Business Enterprise Services provides annual consolidated reports.10 Staff seeks input on publicly available data regarding
utility contracts with small businesses. In addition, data are needed for this
indicator on how much state and utility funding is allocated to small businesses
in disadvantaged and low-income communities. The data should include the
number of employees in each small business.
P5. Amount invested.
This indicator will measure the amount of energy-related state, utility, and
private-sector funding invested in low-income and disadvantaged communities
by targeted sectors and statewide. Targeted sectors include market-rate rental
housing (single and multifamily), affordable housing (single and multifamily),
tenant-occupied commercial buildings, energy infrastructure (distribution
10 For example, the report for FY 2015-2016 is available online at https://www.documents.dgs.ca.gov/pd/smallbus/ReportsPage/FY2015-16/FY2015-16AnnualReport.pdf.

18
system upgrades), and local community and critical facilities (food banks,
community centers, churches, fueling stations, fire stations, police stations,
hospitals, and evacuation centers). This indicator addresses the objective of
increasing energy-related investment in low-income and disadvantaged
communities through research and development, infrastructure, and emergency
preparation. Place-based considerations include regional economic dynamics
(agriculture, local industry), climate zones (physical stressors and risks related to
climate change), population density (urban versus rural), local engagement
(availability of local government resources, community-based organizations),
public health indicators (air quality, water quality, and so forth), and
CalEnviroScreen score (disadvantaged communities). This indicator applies to the
following recommendations:
a. Community solar (Recommendation 2)
b. Energy efficiency financing pilots (Recommendation 4)
c. Access to solar technologies (Recommendation 6)
d. Affordable housing credits (Recommendation 7)
e. Research and development (Recommendation 11)
Data on the amount of energy-related state funding should be available from
program administrators. Data on the amount of greenhouse gas reduction fund
investments is available from the California Air Resources Board.11 Data on the
amount of utility funds invested in energy efficiency and renewable energy are
available from http://eestats.cpuc.ca.gov/. Data for utility investments in other
energy-related facilities should be available from the CPUC or utilities in general
rate cases. Staff seeks recommendations for data on the amount of private- or
nonprofit-sector funding for energy efficiency and renewable energy. In
particular, staff seeks input on data sources, surveys, and responsible entities to
identify the extent that building owners are investing in energy efficiency and
renewable energy and the success of removing barriers to building-owner
investment.
P6. Workforce and small business development. Staff seeks input on existing
equity indicators and best practices for tracking workforce and small business
development and placement. This purpose of this indicator is to address the
following objectives: to expand access (small business opportunities) and
increase investment (capacity building).12 Local considerations include regional
11 For example, see California Climate Investments. March 2017. 2017 Annual Report: California Climate Investments Using Cap-and-Trade Auction Proceeds. Greenhouse Gas Reduction Fund Monies. https://www.arb.ca.gov/cc/capandtrade/auctionproceeds/cci_annual_report_2017.pdf.
12 For example, the Union of Concerned Scientists and Greenlining published a report noting the importance of access to training to expand access to clean energy jobs. See Chandler, Sara, Joel Espino, and Jimmy O’Dea. October 2016. Delivering Opportunity: How Electric Buses and Trucks Can Create Jobs and Improve Public
19
economic dynamics (income inequality),13 climate zones (physical stressors and
risks related to climate change), population density (urban versus rural), local
resources (availability of local government resources, community-based
organizations), public health indicators (air quality, water quality, and so forth),
and CalEnviroScreen score (disadvantaged communities). This indicator is
applicable to the following recommendation:
Workforce development (Recommendation 3)
To match workforce and small business development with anticipated job
availability, potential sources of data for this indicator include:
e. Data from training providers on the number of people completing
applicable training programs for energy efficiency, photovoltaic, energy
storage, and other clean energy jobs. Data should include the census tract
or zip code of the training facility and trainees to identify underserved
communities.
f. Data from training providers on the number of small businesses sending
employees to energy efficiency or clean energy training. Data should
include the census tract or zip code of the training facility and small
businesses represented among trainees to identify underserved
communities.
g. Publicly available data clean energy industry trends and anticipated job
growth. These data can help identify unmet needs and expected clean
energy private-sector job growth in or near low-income and
disadvantaged communities.
P7. Number and quality of jobs.
This indicator measures the number and quality (wages and working conditions)
of jobs created to provide energy-related services by targeted sector. This
indicator will be used to identify adjustments needed to job training services and
energy-related investment to match workforce and small business development
with anticipated job availability by targeted sector. Targeted sectors focus on
energy-related services with unmet need and expected job growth in or near low-
income and disadvantaged communities. This indicator addresses the following
Health in California. http://www.ucsusa.org/sites/default/files/attach/2016/10/UCS-Electric-Buses-Report.pdf.
13 For example, what are the local trends in low-wage, middle-wage, and high-wage jobs? For a discussion of trends in the San Francisco Bay Area Region, see PolicyLink and the Program for Environmental and Regional Equity (PERE) at the University of Southern California, April 2015. An Equity Profile of the San Francisco Bay Area Region. Summary. http://dornsife.usc.edu/assets/sites/242/docs/Bay_Area_Summary_21April2015_Final.pdf.
20
objectives: to expand access (access to good jobs and small business
opportunities) and increase investment (capacity building). Place-based
considerations include regional economic dynamics (agriculture, local industry),
climate zones and climate change (physical stressors and risks related to climate
change), population density (urban versus rural), local engagement (availability
of local government resources, community-based organizations), public health
indicators (air quality, water quality, and so forth), and CalEnviroScreen score
(disadvantaged communities). This indicator applies to:
a. Task force (Recommendation 1)
b. Community solar (Recommendation 2)
c. Workforce development (Recommendation 3)
d. Energy upgrade financing pilot programs (Recommendation 4)
e. Access to solar (Recommendation 6)
f. Affordable housing credits (Recommendation 7)
g. One-stop shops (Recommendation 8)
h. Small business opportunities (Recommendation 12)
The California Employment Development Department provides official monthly
estimates of job creation. Data are available statewide, by county, and by metropolitan area. Data are also available by industry classification.14
P8. Job Access. This indicator measures whether people living in disadvantaged
communities are getting jobs in clean energy. Targeted sectors focus on energy-
related services with unmet need and expected job growth in or near low-income
and disadvantaged communities. This indicator addresses the following
objectives: to expand access (access to good jobs and small business
opportunities) and increase investment (capacity building). Local considerations
include regional economic dynamics (agriculture, local industry), climate zones
and climate change (physical stressors and risks related to climate change),
population density (urban versus rural), local engagement (availability of local
government resources, community-based organizations), public health indicators
(air quality, water quality, and so forth), and CalEnviroScreen score
(disadvantaged communities). This indicator applies to:
a. Task force (Recommendation 1)
b. Community solar (Recommendation 2)
c. Workforce development (Recommendation 3)
14 http://www.labormarketinfo.edd.ca.gov/.

21
d. Energy upgrade financing pilot programs (Recommendation 4)
e. Access to solar (Recommendation 6)
f. Affordable housing credits (Recommendation 7)
g. One-stop shops (Recommendation 8)
h. Small business opportunities (Recommendation 12)
Staff seeks input on the best data available for this indicator.
P9. System Average Interruption Duration Index (SAIDI). This indicates the
duration (measured in minutes) of outages per customer per year using the adopted CPUC method.15 This indicator addresses the objective to improve
community resilience. Within the indicator framework described in Chapter 2,
this indicator represents the energy reliability category. Together, California’s
three largest investor-owned utilities – Pacific Gas and Electric, Southern
California Edison, and San Diego Gas & Electric – measure this indicator for 60
subregions. Leveraging these data, this indicator will use the following place-
based considerations to identify locations in need of additional improvement
from an equity perspective: climate zones and climate change (physical stressors
and risks related to climate change), population density (urban versus rural), and
CalEnviroScreen score (disadvantaged communities). This indicator applies to the
following recommendations:
a. Community solar (Recommendation 2)
b. Access to solar technologies (Recommendation 6)
c. One-stop shop (Recommendation 8)
d. Research and development (Recommendation 11)
For this indicator, staff proposes to use the CPUC method, which includes “all
generation, transmission, and distribution outages, excluding planned and CAISO outages.”16 Under California Public Utilities Code Section 2774.1, this is
one of the indicators reported annually and used to determine areas that require
15 For more information on this indicator, see Kurtovich, Martin and Marzia Zafar. May 9, 2016. California Electric Reliability Investor-Owned Utilities Performance Review 2006-2015. California Public Utilities Commission. Available online at http://www.cpuc.ca.gov/uploadedFiles/CPUC_Public_Website/Content/About_Us/Organization/Divisions/Policy_and_Planning/PPD_Work/PPD_Work_Products_(2014_forward)/PPD%20Reliability%20Review.pdf.
16 For more information on this indicator, see Kurtovich, Martin and Marzia Zafar. May 9, 2016. California Electric Reliability Investor-Owned Utilities Performance Review 2006-2015. California Public Utilities Commission. Available online at http://www.cpuc.ca.gov/uploadedFiles/CPUC_Public_Website/Content/About_Us/Organization/Divisions/Policy_and_Planning/PPD_Work/PPD_Work_Products_(2014_forward)/PPD%20Reliability%20Review.pdf.
22
investment to improve reliability deficiencies. The CPUC method calculates SAIDI
as the total minutes customers were without power due to sustained outages
divided by the total number of customers.
P10. Electricity bill as a proportion of income. This indicator will measure the
average expenditure as a proportion of average income per year by county for
owners and renters. This indicator addresses the objective to increase resilience
(energy affordability). Place-based considerations include climate zones and
public health indicators (air quality). This indicator applies to the following
recommendations:
a. Task force (Recommendation 1)
b. Community solar (Recommendation 2)
c. Energy upgrade financing pilot programs (Recommendation 4)
d. Access to solar technologies (Recommendation 6)
e. Affordable housing credits (Recommendation 7)
f. One-stop shops (Recommendation 8)
g. State-local program collaboration (Recommendation 10)
h. Research and development (Recommendation 11)
i. Small business opportunities study (Recommendation 12)
For this indicator, staff suggests two potential data sources. The first is the
energy burden methodology used in the 2013 Low-Income Needs Assessment,
which measured energy costs as a percentage of household income through a
telephone survey, utility billing data, and self-reported income.17 The second is
the U.S. DOE energy burden indicator, which is based on average
expenditures/average income, $/year for owners and renters by county. Figure 3
shows an example of these preliminary data for Fresno County for 2014.
17 Evergreen Economics. December 15, 2016. Needs Assessment for the Energy Savings Assistance and the California Alternate Rates for Energy Programs. Final Report. Volume 1 and Volume 2. Prepared for the California Public Utilities Commission, Southern California Edison, Pacific Gas and Electric Company, San Diego Gas & Electric, and Southern California Gas Company. CALMAC ID: SCE0396.01 and SCE0396.02.

23
Figure 3: 2014 Energy Burden (Avg. Expend./Avg. Income, $/yr.) for Fresno County
Source: U.S. Department of Energy, Clean Energy for Low Income Communities Accelerator
P11. Number of household health and safety issues abated. This indicator will
measure the number of reported household health and safety issues abated as
non-energy cobenefits for energy-related investments. This indicator addresses
the objective to increase resilience of low-income and disadvantaged
communities. Local considerations for this indicator include climate zones and
climate change (physical stressors and risks related to climate change),
population density (urban versus rural), and public health indicators (air quality,
water quality, and so forth). This indicator applies to the following
recommendations:
a. Investigating the need for heightened energy consumer protection
(Recommendation 9)
b. Research and development (Recommendation 11)
c. Small business opportunities study (Recommendation 12)
Staff seeks input on sources of data and responsible agencies for this indicator.
Here are some existing resources staff aims to leverage for this indicator:
a. Data from existing health and safety funds for issues that require
abatement before energy efficiency retrofits can begin, such as lead,
asbestos, mold remediation, deferred maintenance, and other issues.

24
Examples include the Brace and Bolt program and Clean Energy Works.18
b. Lisa Skumatz, Non-Energy Benefits/Non-Energy Impacts and Their Role & Values in Cost-Effectiveness Tests: State of Maryland. (2014).19
c. The California Environmental Health Tracking Program has data on
healthy housing for California, including lead, asthma, and other information.20
d. The California Department of Health Building Resilience Against
Climate Effects (CalBRACE) Project produced climate change and
health indicators for California communities, including an indicator
of vulnerability to extreme heat and population density living near
areas vulnerable to sea level rise. These indicators are available
through Cal-Adapt and can be used to when assessing place-based
climate risk considerations and health-related vulnerabilities.
e. The Healthy Communities Data and Indicators project provides a
range of statistical measures and tools for evaluating the effect of programs and policies on community health.21 Examples include:22
Annual average number of unhealthy days of ozone air pollution.
Average ambient PM2.5 concentration.
Unsafe drinking water.
f. Bay Area LISC and Build It Green identify indoor air quality concerns
to address when rehabilitating multifamily buildings, including
testing for lead and asbestos, installing ENERGY STAR® fans that vent
to the outside, avoiding interior products with urea formaldehyde
18 Stamas, Maria. September 29, 2016, Comments of the GREEN-Energy Efficiency for All Coalition, including NRDC, CHPC, AEA, Greenlining Institute, and Build It Green. http://docketpublic.energy.ca.gov/PublicDocuments/16-OIR-02/TN213843_20160929T152126_Maria_Stamas_Comments_Comments_of_the_GREENEnergy_Efficiency_fo.pdf.
19 http://energyefficiencyforall.org/resources/non-energy-benefitsnon-energy-impacts-nebsneis-and-their-role-values-cost-effectiveness.
20 For more information, see http://cehtp.org/page/healthyhousing/healthy_housing_data.
21 California Department of Human Health, Healthy Communities Data and Indicators Project, Summary and link, docketed in the Energy Commission’s SB 350 Barriers Report docket 16-OIR-02. http://docketpublic.energy.ca.gov/PublicDocuments/16-OIR-02/TN211062_20160414T130314_Healthy_Communities_Data_and_Indicators_Project.pdf.
22 For more information, see http://www.cdph.ca.gov/programs/Pages/HealthyCommunityIndicators.aspx.

25
(such as pressed wood), and using no- or low-volatile organic compound paint, adhesives, and related products.23
g. Local community-based data and feedback on safety concerns and
solutions related to access to clean energy resources.
P12. Proportion of critical facilities with resilient on-site generation and storage.
This indicator will measure the number of critical facilities with on-site
renewable backup generation and storage with the capability to provide on-site
electricity in the event of an outage. Local community and critical facilities
targeted by this measure include food banks, community centers, churches,
fueling stations, fire stations, police stations, hospitals, and evacuation centers.
Place-based considerations include climate zones and climate change (physical
stressors and risks related to climate change), population density (urban versus
rural), local engagement (availability of local government resources, community-
based organizations), and public health indicators (air quality, water quality, and
so forth). This indicator applies to the following recommendations
a. Community solar (Recommendation 2)
b. Access to solar technologies (Recommendation 6)
c. One-stop shops (Recommendation 8)
d. Investigating the need for heightened energy consumer protection
(Recommendation 9)
e. Research and development (Recommendation 11)
This indicator will require data from periodic surveys of local permitting
agencies and utilities to identify the proportion of critical facilities with on-site
renewable backup generation and storage capable of providing on-site
generation in the event of an electricity outage.
Table 2 summarizes the clean energy equity indicators by SB 350 Low-Income Barriers
Study recommendations.
23 http://docketpublic.energy.ca.gov/PublicDocuments/16-OIR-02/TN211063_20160414T130313_Green_Rehabilitation_of_Multifamily_Rental_Properties.pdf.

26
Table 2: Indicators Address SB 350 Low-Income Recommendations
Recommendation Indicators
1. Task force [All 12 indicators]
2. Community solar Renewable energy MWh-yr./MW Households/small businesses served
$ invested Electricity bill as a proportion of income $/yr.
Small business contracts SAIDI
Critical facilities with renewable backup/storage 3. Workforce development Renewable energy MWh-yr./MW
Small business contracts Number of workers trained
Number of jobs Reported job quality impacts
4. Clean energy financing pilot programs
Energy savings (MWh saved) $ invested
Electricity bill as a proportion of income $/yr. Small business contracts
5. Common perf. metrics and data [All 12 indicators]
6. Access to solar energy technologies
Households/small businesses served Renewable energy MWh-yr./MW
$ invested Electricity bill as a proportion of income $/yr.
SAIDI Small business contracts
Critical facilities with renewable backup/storage 7. Affordable housing tax credits Energy savings (MWh saved)
$ invested Electricity bill as a proportion of income $/yr.
8. Regional one-stop pilots Households/small businesses served Electricity bill as a proportion of income $/yr.
SAIDI Critical facilities with renewable backup/storage
9. Investigate the need for heightened clean energy consumer protection
Households/small businesses served Households health/safety issues abated
Critical facilities with renewable backup/storage 10. Collaboration with community-based organizations
Energy savings (MWh saved) Electricity bill as a proportion of income $/yr.
11. R&D to benefit disadvantaged communities
Energy savings (MWh saved) Renewable energy MWh-yr./MW
Small business contracts $ invested
Electricity bill as a proportion of income $/yr. SAIDI
Household health/safety issues abated Critical facilities with renewable backup/storage
12. Study on small-business contracting opportunities
Households/small businesses served Small business contracts
Electricity bill as a proportion of income $/yr. Household health/safety issues abated
Source: California Energy Commission staff, based on Scavo, Jordan, Suzanne Korosec, Esteban Guerrero,
Bill Pennington, and Pamela Doughman. 2016. Low-Income Barriers Study, Part A: Overcoming Barriers to
Energy Efficiency and Renewables for Low-Income Customers and Small Business Contracting Opportunities in
Disadvantaged Communities. California Energy Commission. Publication Number: CEC-300-2016-009-CMF.

27
Input Needed: Lead and Supporting Agencies for Geospatial Indicators and Performance Indicators Staff seeks input on identifying potential lead and supporting agencies for each
performance indicator, leveraging existing data collection efforts.