Embed Size (px)
Citation preview

California Beverage Container Recycling and Litter Reduction Study
Peter Berck and George Goldman, Principal Investigatorswith the assistance ofTim Beattie, Jeffrey LaFrance, Anna Gueorguieva, AyaOgishi,Bruce McWilliams, and Peter Ho
Comparison with Other States
Chapter 2. Anna Gueorguieva and Peter Berck
Outline
1) Distinctive Features of CA2) Lessons from Canada3) Good examples from the European Union
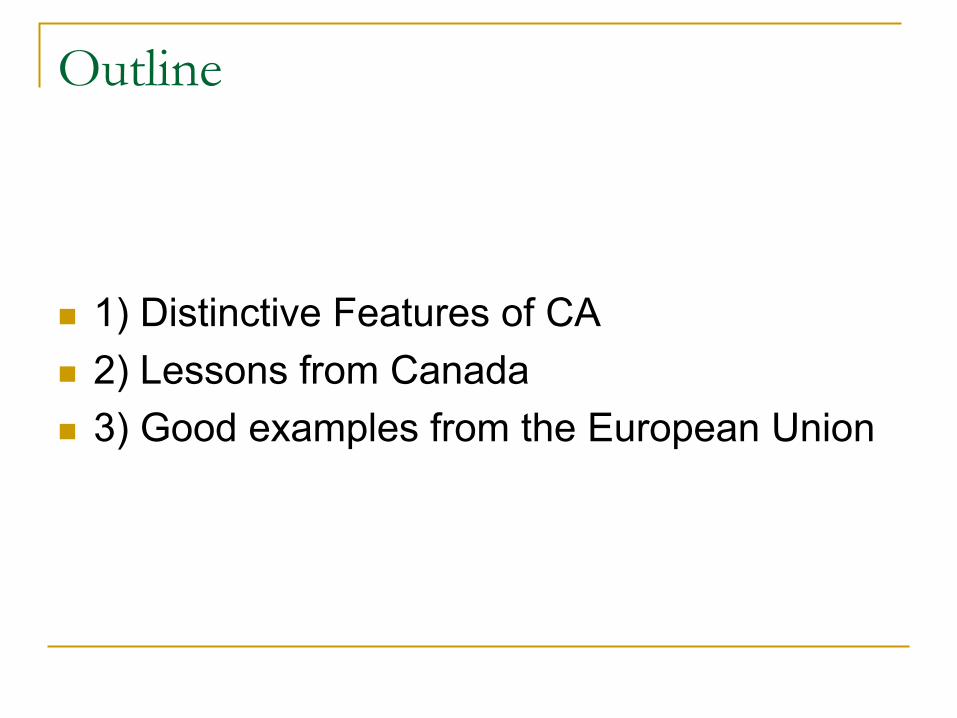
CRV
CRV is California Redemption ValueDistributors pay 5c under 24 oz and 10c for larger bottles into a government fund for each container sent to a retailer.When consumers return containers, they are paid a refund by weight that approximates the 5 and 10 centsAluminum, Glass, and Plastic beverage containers are covered.
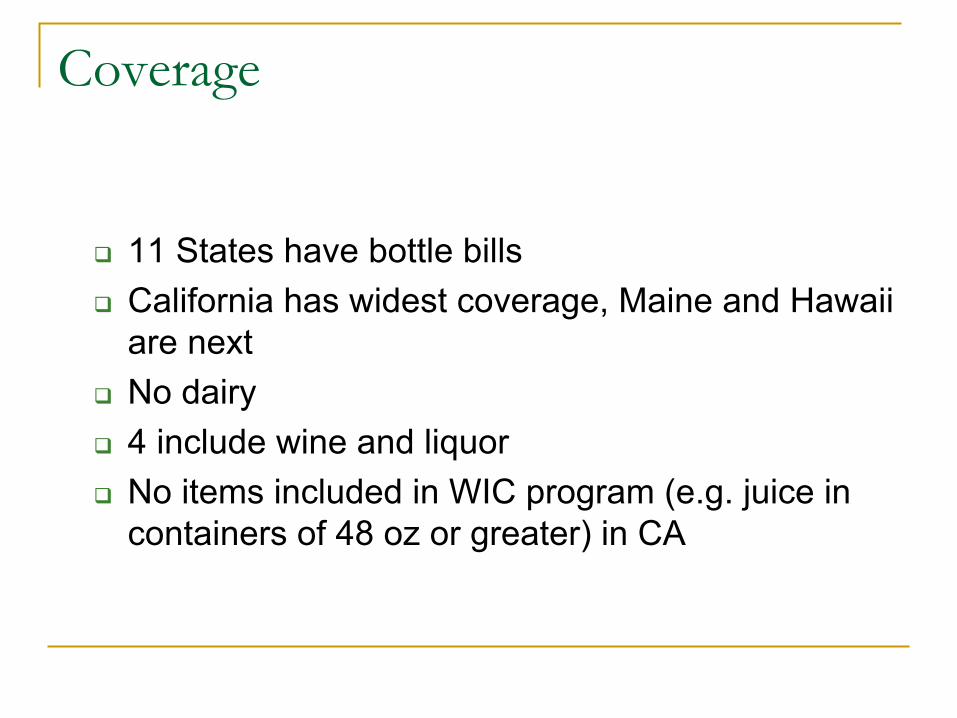
Coverage
11 States have bottle billsCalifornia has widest coverage, Maine and Hawaii are nextNo dairy4 include wine and liquorNo items included in WIC program (e.g. juice in containers of 48 oz or greater) in CA
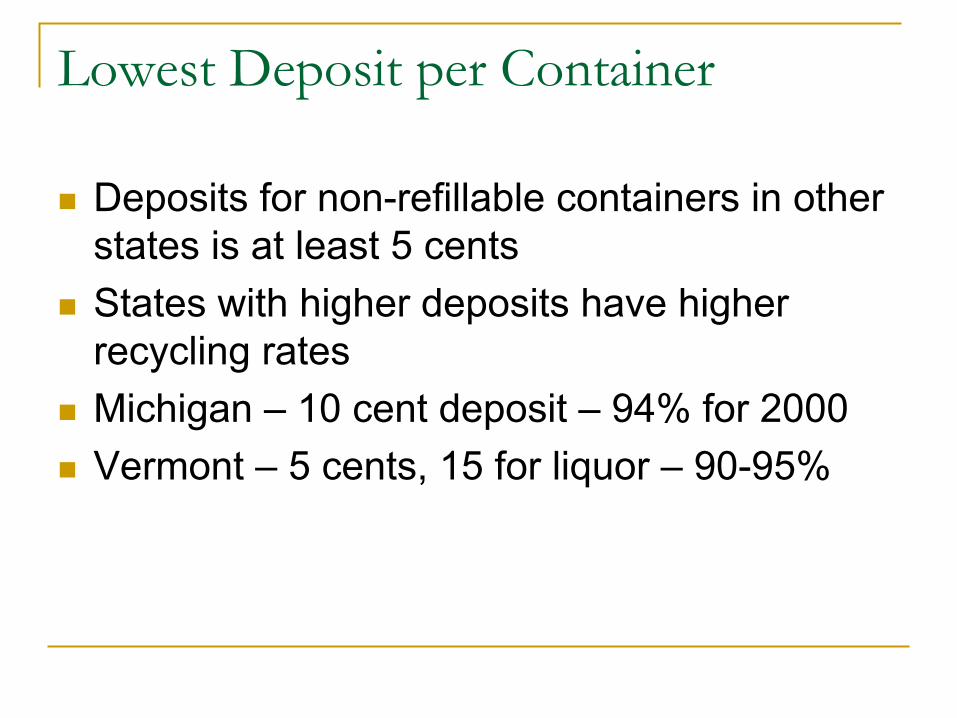
Lowest Deposit per Container
Deposits for non-refillable containers in other states is at least 5 centsStates with higher deposits have higher recycling ratesMichigan – 10 cent deposit – 94% for 2000Vermont – 5 cents, 15 for liquor – 90-95%
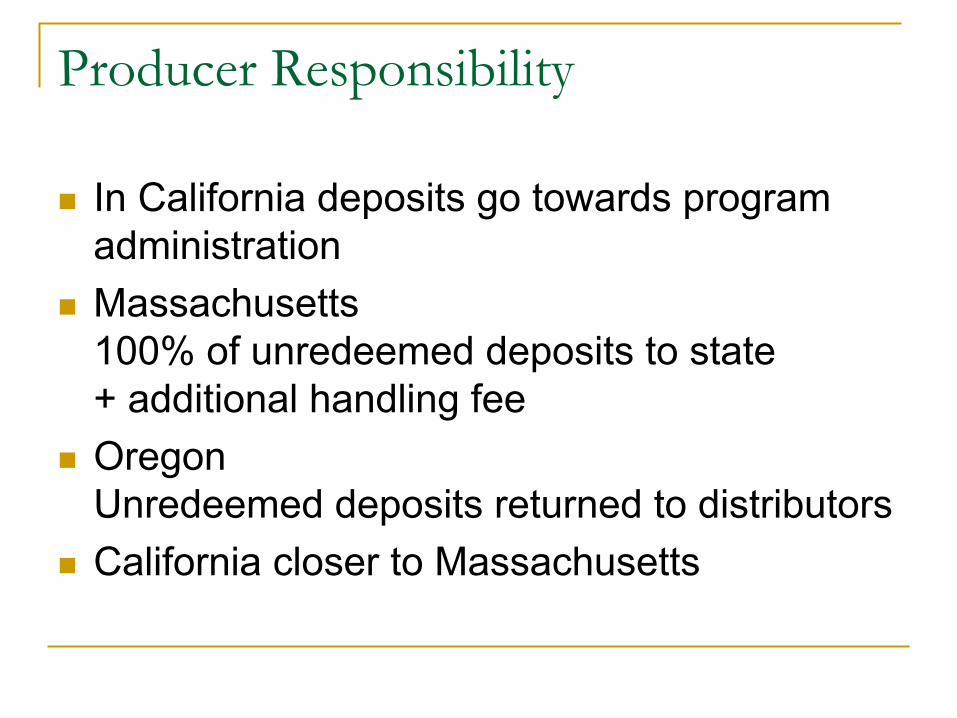
Producer Responsibility
In California deposits go towards program administrationMassachusetts 100% of unredeemed deposits to state + additional handling feeOregon Unredeemed deposits returned to distributorsCalifornia closer to Massachusetts
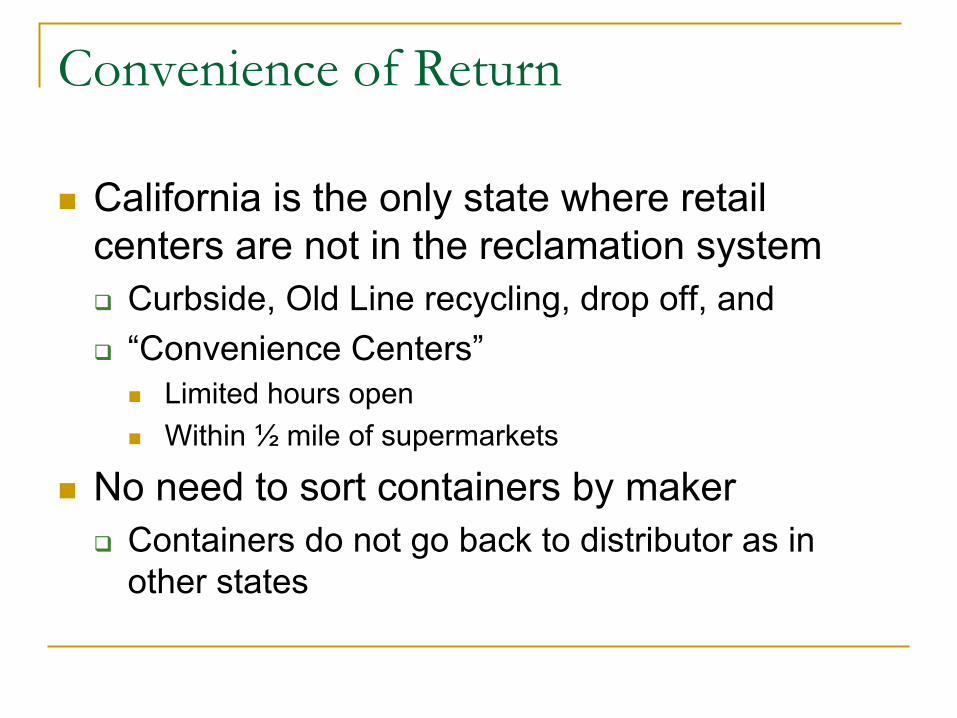
Convenience of Return
California is the only state where retail centers are not in the reclamation system
Curbside, Old Line recycling, drop off, and“Convenience Centers”
Limited hours openWithin ½ mile of supermarkets
No need to sort containers by makerContainers do not go back to distributor as in other states
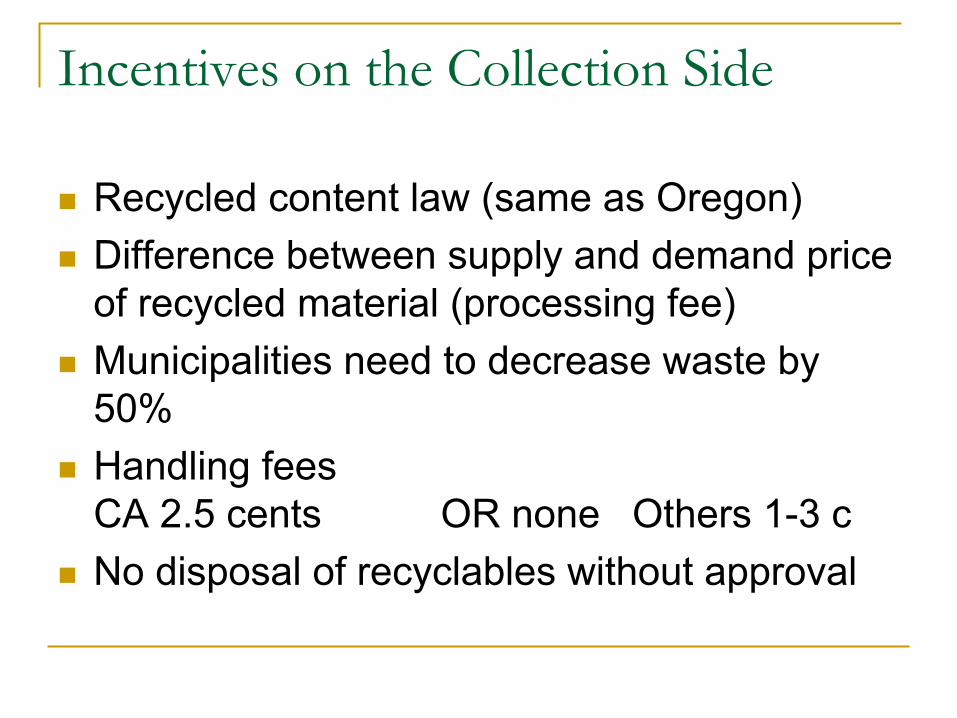
Incentives on the Collection Side
Recycled content law (same as Oregon)Difference between supply and demand price of recycled material (processing fee)Municipalities need to decrease waste by 50%Handling fees CA 2.5 cents OR none Others 1-3 cNo disposal of recyclables without approval
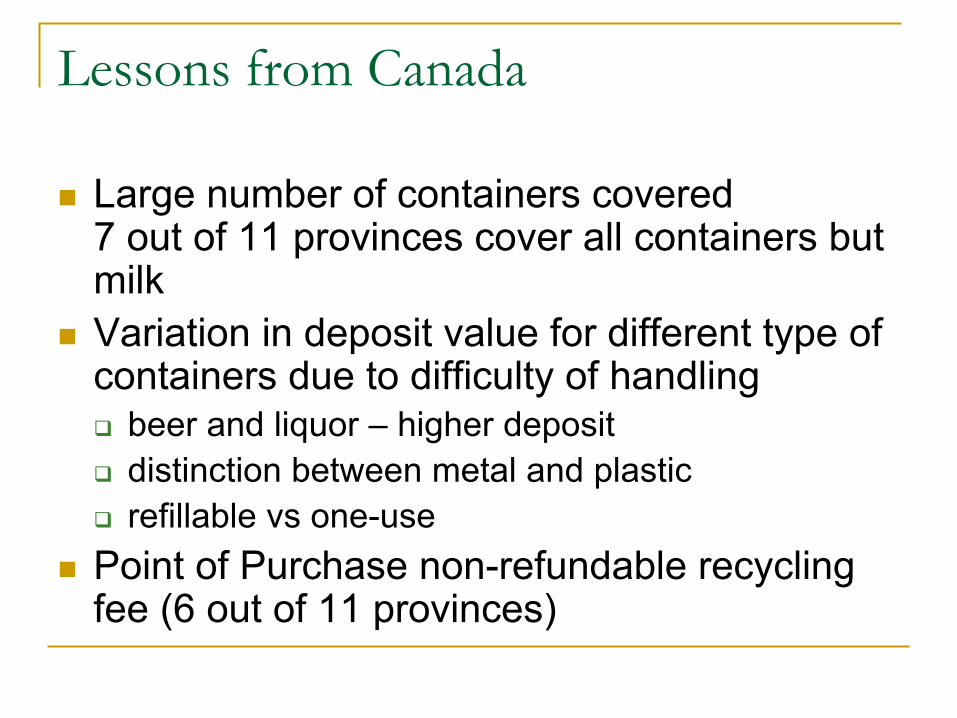
Lessons from Canada
Large number of containers covered7 out of 11 provinces cover all containers but milkVariation in deposit value for different type of containers due to difficulty of handling
beer and liquor – higher depositdistinction between metal and plasticrefillable vs one-use
Point of Purchase non-refundable recycling fee (6 out of 11 provinces)
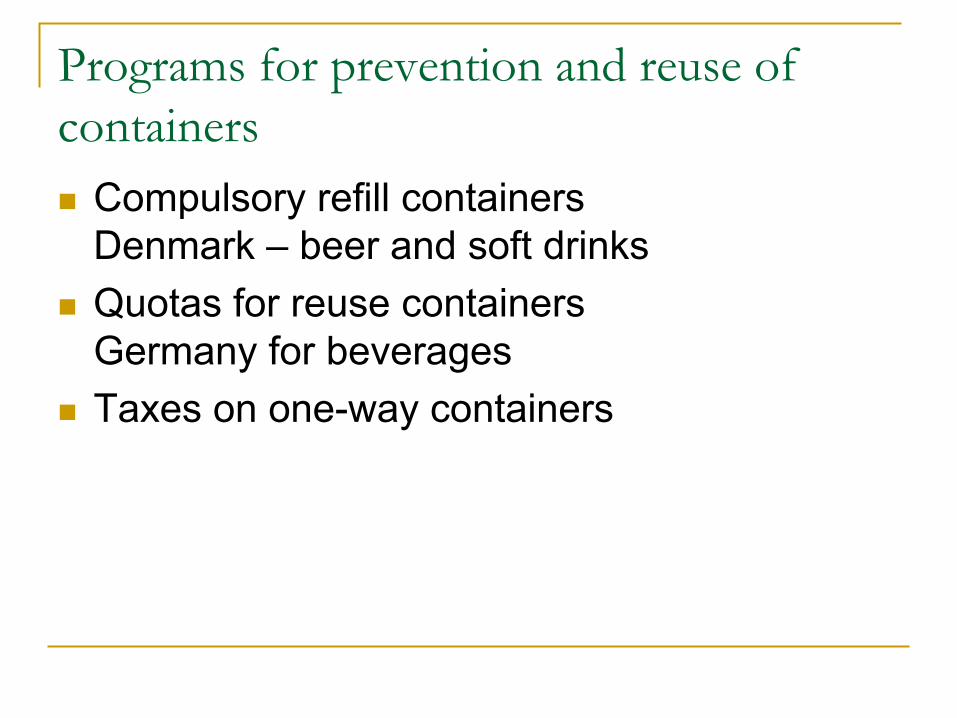
Programs for prevention and reuse of containers
Compulsory refill containers Denmark – beer and soft drinksQuotas for reuse containers Germany for beveragesTaxes on one-way containers

Container Recycling and Costs
Chapter 3Goldman and Ogishi
Average California Household Disposal Cost,1999
$140/ton
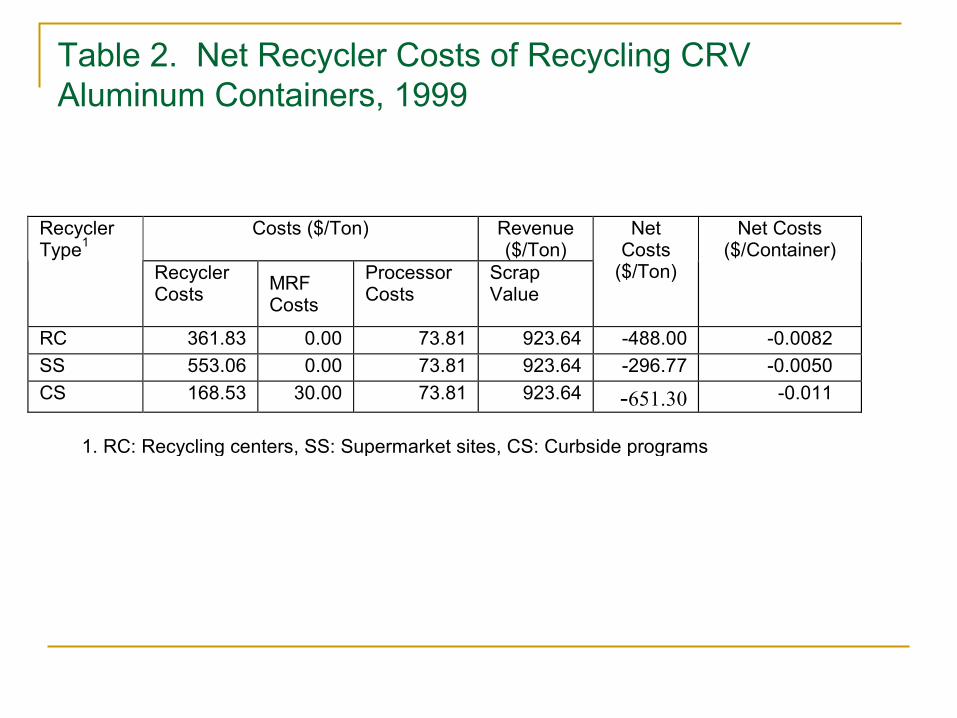
Table 2. Net Recycler Costs of Recycling CRV Aluminum Containers, 1999
Costs ($/Ton) Revenue ($/Ton)
Recycler Type1
Recycler Costs MRF
Costs
Processor Costs
Scrap Value
Net Costs
($/Ton)
Net Costs ($/Container)
RC 361.83 0.00 73.81 923.64 -488.00 -0.0082 SS 553.06 0.00 73.81 923.64 -296.77 -0.0050 CS 168.53 30.00 73.81 923.64 -651.30 -0.011
1. RC: Recycling centers, SS: Supermarket sites, CS: Curbside programs
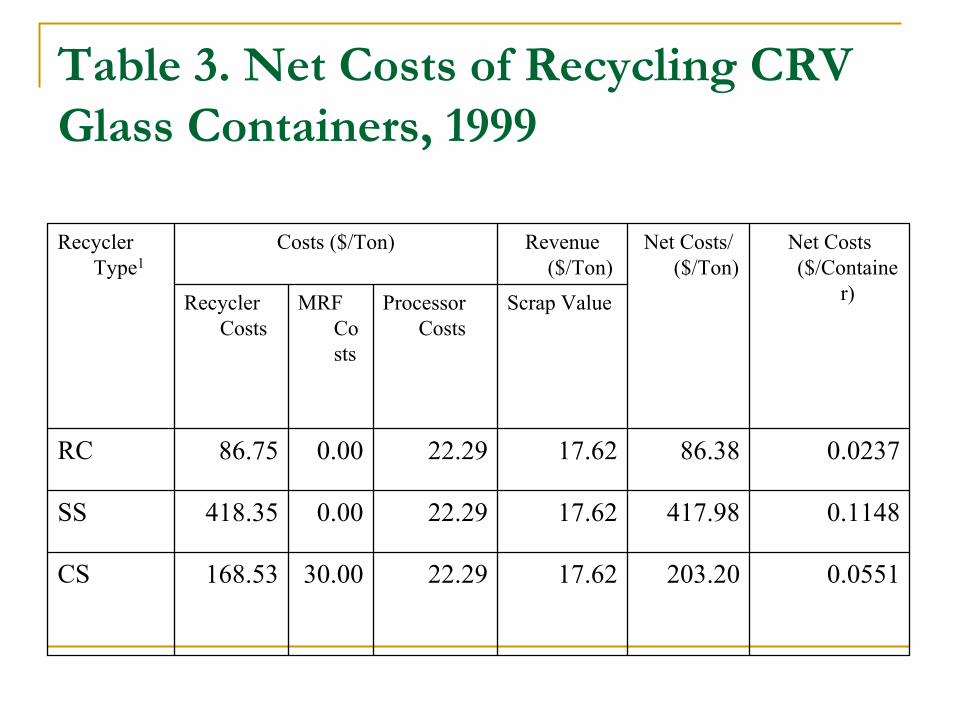
Table 3. Net Costs of Recycling CRV Glass Containers, 1999
0.0551203.2017.6222.2930.00168.53CS
0.1148417.9817.6222.290.00418.35SS
0.023786.3817.6222.290.0086.75RC
Scrap ValueProcessor Costs
MRF Costs
Recycler Costs
Net Costs ($/Containe
r)
Net Costs/ ($/Ton)
Revenue ($/Ton)
Costs ($/Ton)Recycler Type1
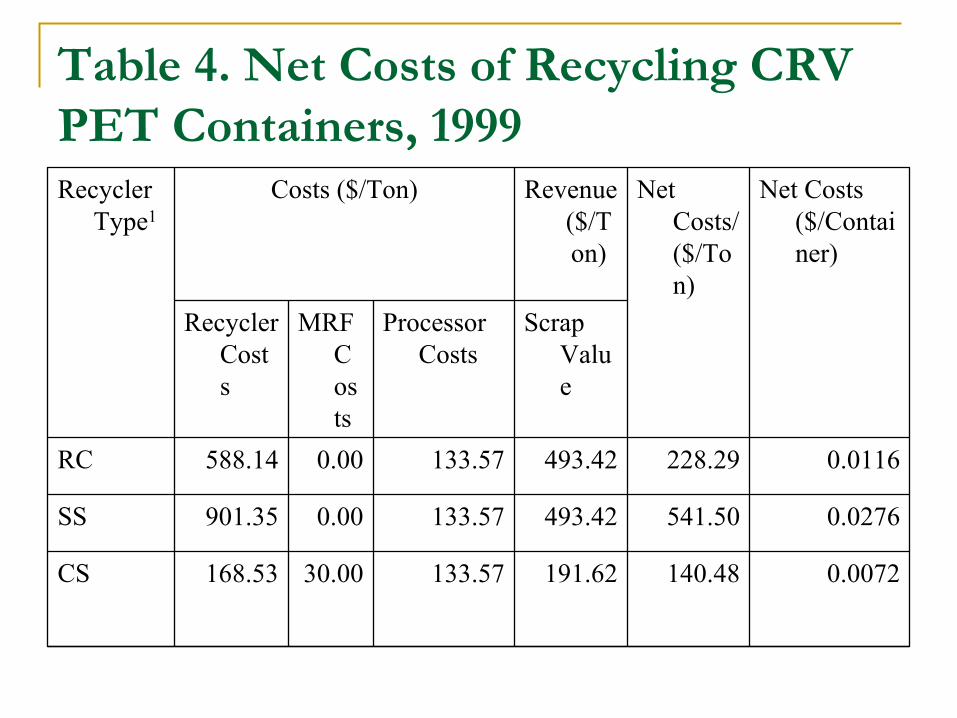
Table 4. Net Costs of Recycling CRV PET Containers, 1999
0.0072140.48191.62133.5730.00168.53CS
0.0276541.50493.42133.570.00901.35SS
0.0116228.29493.42133.570.00588.14RC
Scrap Value
Processor Costs
MRF Costs
Recycler Costs
Net Costs ($/Container)
Net Costs/ ($/Ton)
Revenue ($/Ton)
Costs ($/Ton)Recycler Type1
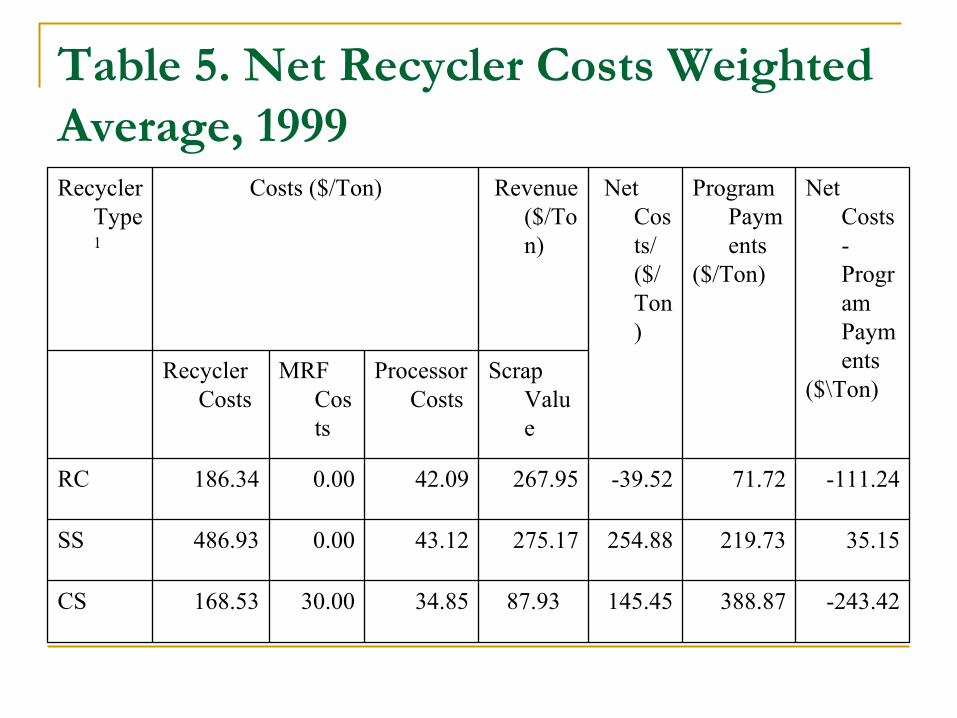
Table 5. Net Recycler Costs Weighted Average, 1999
-243.42388.87145.4587.9334.8530.00168.53CS
35.15 219.73 254.88275.1743.120.00486.93SS
-111.24 71.72 -39.52267.9542.090.00186.34RC
Scrap Value
Processor Costs
MRF Costs
Recycler Costs
Net Costs-Program Payments
($\Ton)
Program Payments
($/Ton)
Net Costs/ ($/Ton)
Revenue ($/Ton)
Costs ($/Ton)Recycler Type1
Conclusions
We have estimated the net costs of recycling at recycling centers, curbside programs, and supermarket sites.Of the three, recycling centers have the lowest costs. Supermarket sites and curbside programs are usually more convenient, but have higher costs.

Statistical Estimates
Chapter 4.Peter Berck, Tim Beattie, Jeffrey Lafrance, and Anna Gueorguieva
Plan
Use county by year by program returns and statewide salesEstimate returns as function of income and CRVFind out how increasing CRV affects program
County Recycling Model
Demand for beverages is a function of consumer income, prices for beverages (including disposal costs), prices of other goods, population, and environmental variables (temperature)
Higher beverage consumption when weather is hotter, income is higher, and/or prices are lower
California Department of Finance, Demographics Research Unit City/County Population and Housing Estimates, 1991-2000, with 1990 Census Counts.Sacramento, California, May 2000.
http://www.dof.ca.gov/HTML/DEMOGRAP/drupubs.htmReport E-5
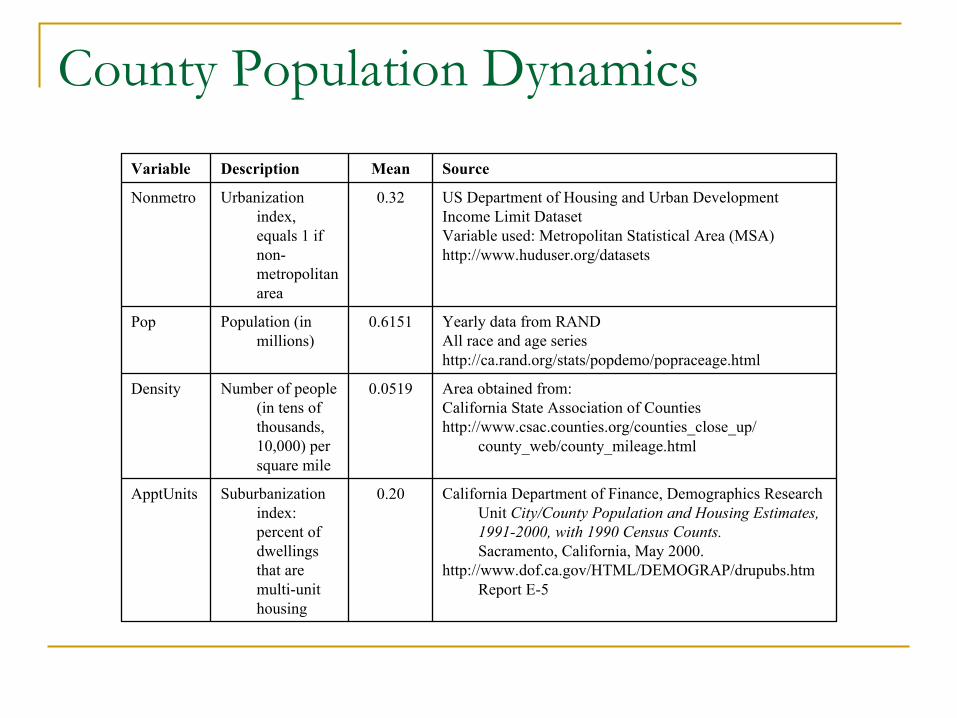
0.20Suburbanization index: percent of dwellings that are multi-unit housing
ApptUnits
Area obtained from:California State Association of Countieshttp://www.csac.counties.org/counties_close_up/
county_web/county_mileage.html
0.0519Number of people (in tens of thousands, 10,000) per square mile
Density
Yearly data from RANDAll race and age serieshttp://ca.rand.org/stats/popdemo/popraceage.html
0.6151Population (in millions)
Pop
US Department of Housing and Urban Development Income Limit Dataset Variable used: Metropolitan Statistical Area (MSA) http://www.huduser.org/datasets
0.32Urbanization index, equals 1 if non-metropolitan area
Nonmetro
Source MeanDescriptionVariable
County Population Dynamics
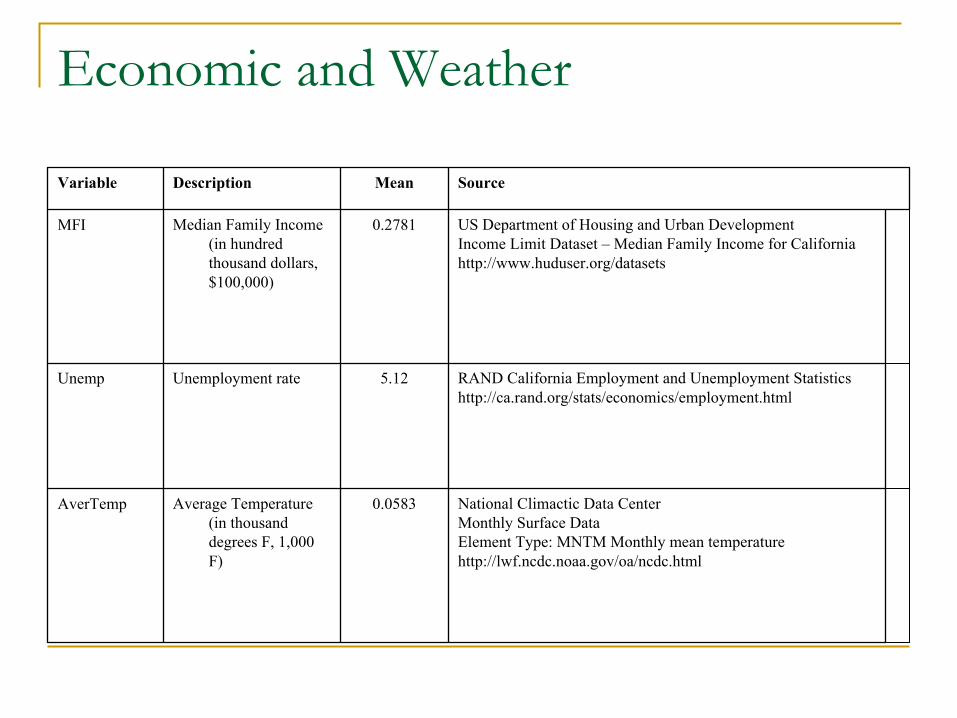
Economic and Weather
National Climactic Data Center Monthly Surface DataElement Type: MNTM Monthly mean temperaturehttp://lwf.ncdc.noaa.gov/oa/ncdc.html
0.0583Average Temperature (in thousand degrees F, 1,000 F)
AverTemp
RAND California Employment and Unemployment Statisticshttp://ca.rand.org/stats/economics/employment.html
5.12Unemployment rateUnemp
US Department of Housing and Urban DevelopmentIncome Limit Dataset – Median Family Income for Californiahttp://www.huduser.org/datasets
0.2781Median Family Income (in hundred thousand dollars, $100,000)
MFI
Source MeanDescriptionVariable
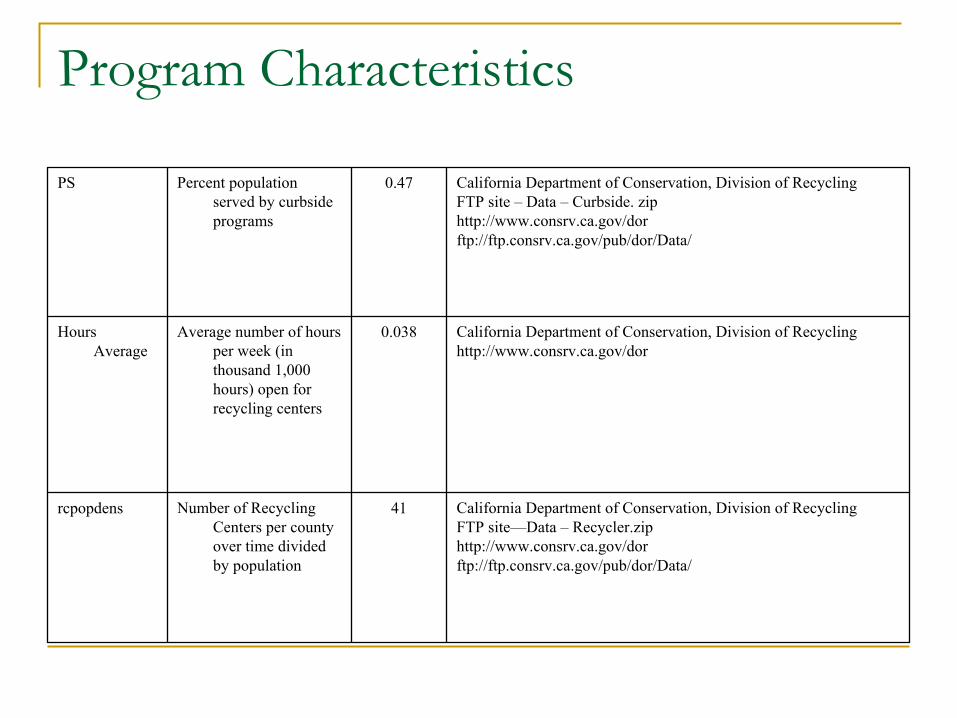
Program Characteristics
California Department of Conservation, Division of RecyclingFTP site—Data – Recycler.ziphttp://www.consrv.ca.gov/dorftp://ftp.consrv.ca.gov/pub/dor/Data/
41Number of Recycling Centers per county over time divided by population
rcpopdens
California Department of Conservation, Division of Recyclinghttp://www.consrv.ca.gov/dor
0.038Average number of hours per week (in thousand 1,000 hours) open for recycling centers
HoursAverage
California Department of Conservation, Division of RecyclingFTP site – Data – Curbside. ziphttp://www.consrv.ca.gov/dorftp://ftp.consrv.ca.gov/pub/dor/Data/
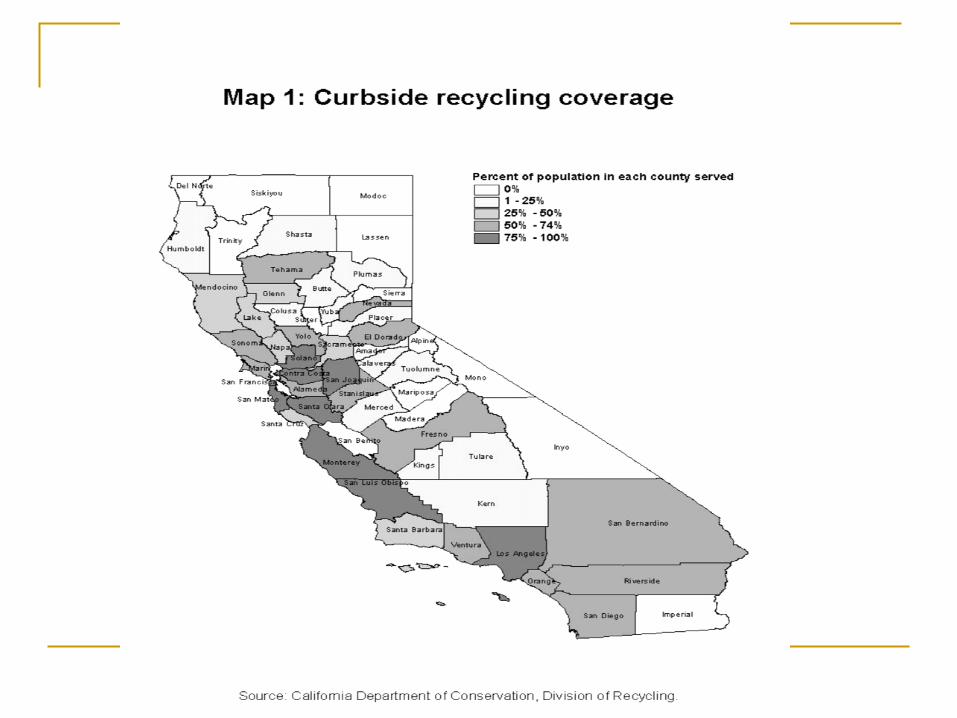
0.47Percent population served by curbside programs
PS
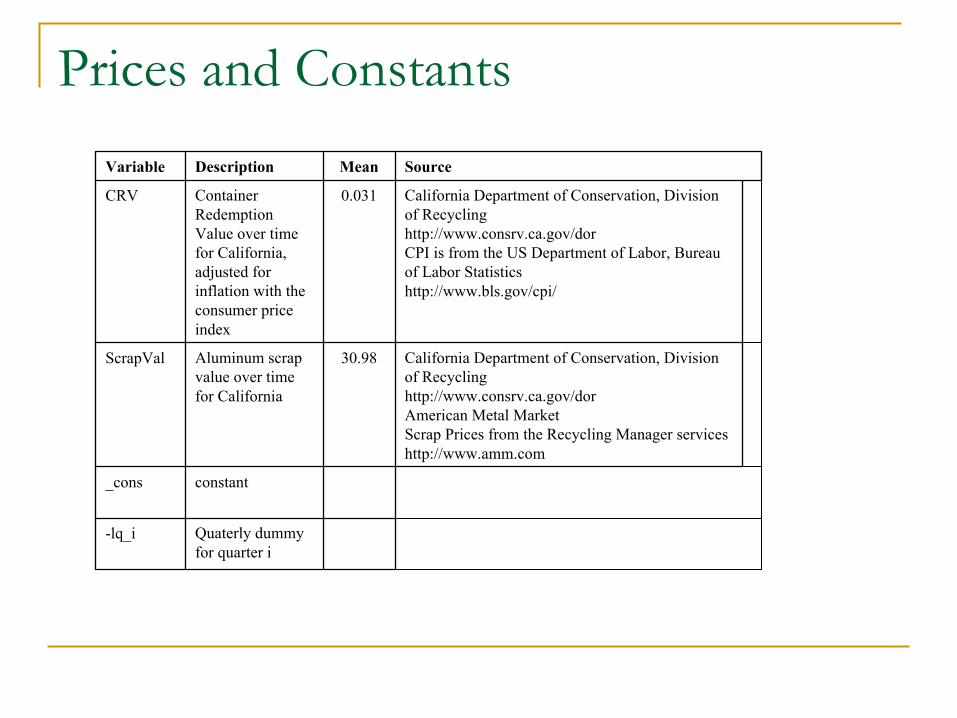
Prices and Constants
Quaterly dummy for quarter i
-lq_i
constant_cons
California Department of Conservation, Division of Recyclinghttp://www.consrv.ca.gov/dorAmerican Metal Market Scrap Prices from the Recycling Manager serviceshttp://www.amm.com
30.98Aluminum scrap value over time for California
ScrapVal
California Department of Conservation, Division of Recyclinghttp://www.consrv.ca.gov/dorCPI is from the US Department of Labor, Bureau of Labor Statisticshttp://www.bls.gov/cpi/
0.031Container Redemption Value over time for California, adjusted for inflation with the consumer price index
CRV
Source MeanDescriptionVariable
Consumers choose 4 disposal methods
Return for Deposit at Recycling CentersReturn not for Deposit at Drop offCurbside PickupAll Other Means
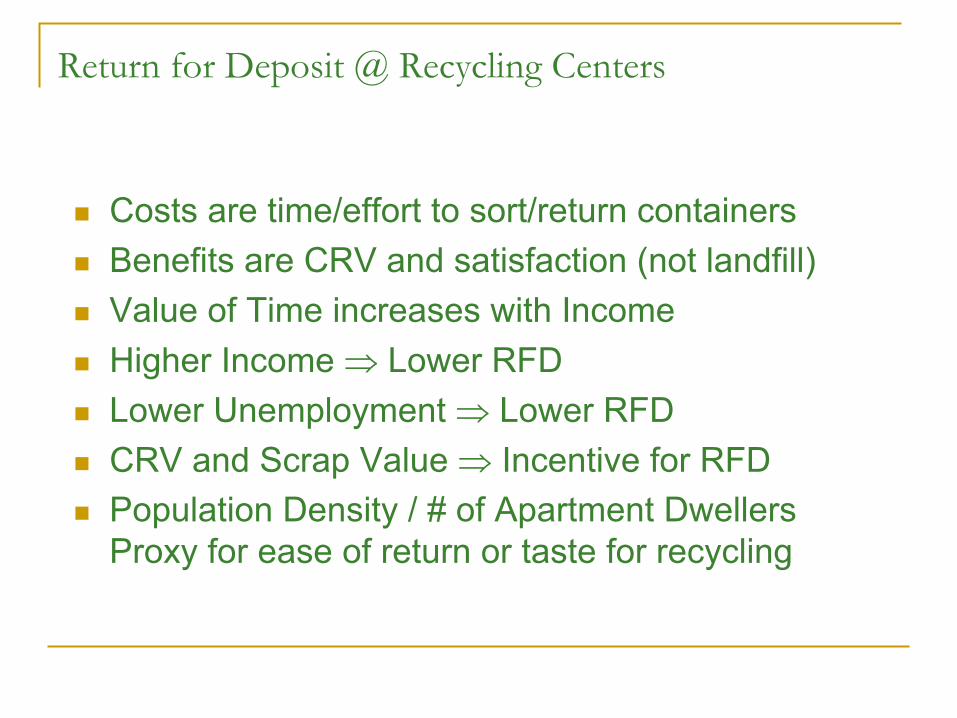
Return for Deposit @ Recycling Centers
Costs are time/effort to sort/return containersBenefits are CRV and satisfaction (not landfill)Value of Time increases with IncomeHigher Income ⇒ Lower RFDLower Unemployment ⇒ Lower RFDCRV and Scrap Value ⇒ Incentive for RFDPopulation Density / # of Apartment Dwellers Proxy for ease of return or taste for recycling
Return not for Deposit @ Drop off
Convenient. Will accept all types of recycling quickly.

Curbside Pickup
Not initially widespreadIncreased substantially over the sample period⇒ Percent of households served by curbside is an important variable
All Other Means
This mode of disposal is not directly measuredIt is containers either landfilled or disposed improperlyIt makes up the difference between the container sales by material and the total containers recycled through all programs

CRC
Fig. 1. Flow Chart of Continuous Disposal
Distribution
Store
Consumer
Scavenger
Store
Consumer
Scavenger
AlamedaCounty
ContraCosta
County
CS CRC CS
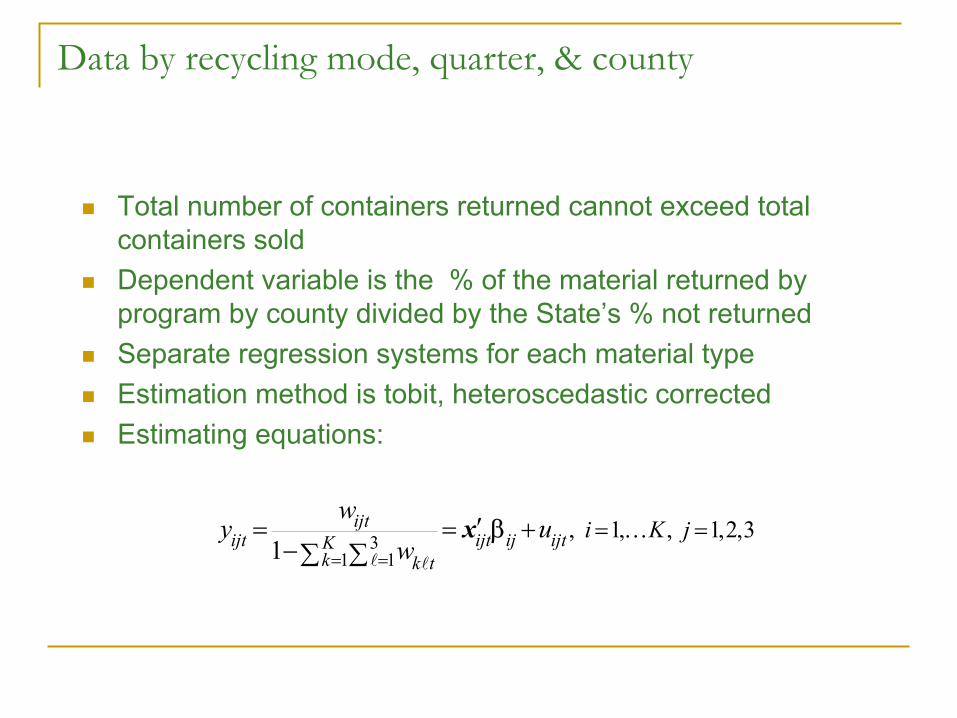
Data by recycling mode, quarter, & county
Total number of containers returned cannot exceed total containers soldDependent variable is the % of the material returned by program by county divided by the State’s % not returnedSeparate regression systems for each material typeEstimation method is tobit, heteroscedastic correctedEstimating equations:
31 1
, 1, , 1,2,31
ijtijt ijt ij ijtK
k k t
i K jw
y uw= =
= =′= = +−∑ ∑
x βl l
K

0.00 0.01 0.02 0.03 0.04 0.05 0.06 0.07 0.08 0.09 0.10crv
0.0
0.1
0.2
0.3
0.4
0.5
0.6
0.7
0.8
0.9
1.0
Rec
yclin
g R
ate
Predicted 2000 Quarterly Average Recycling Rates
AluminumGlassPlastic

Regression with Robust Standard Errors
-0.1506-0.35930.000-4.790.0532-0.2550_cons
-0.0166-0.11960.010-2.590.0263-0.0681ApptUnits
0.0040-0.00010.0681.830.00110.0019Unemp
0.03610.00980.0013.420.00670.0230PS
16.03953.87090.0013.213.10199.9552rcpopdens
0.3730-1.44430.248-1.160.4633-0.5357Hours Average
0.00410.00060.0082.640.00090.0023ScrapVal
11.68464.84450.0004.741.74368.2645CRV
-0.1300-0.22700.000-7.200.0248-0.1790Density
1.3720-0.16200.1221.550.39100.6050AverTemp
0.0144-0.17400.097-1.660.0481-0.0799MFI
0.15700.11100.00011.530.01160.1340Pop
0.0039-0.03350.121-1.550.0095-0.0148_Iq_4
-0.0219-0.07070.000-3.730.0124-0.0463_Iq_3
-0.0556-0.09680.000-7.250.0105-0.0762_Iq_2
-0.0512-0.07380.000-10.870.0058-0.0625Nonmetro
[95% Conf. Interval]p>|t|tRobust Std. Err.Coef.y_al_crc
Table 2. Regression for Aluminum in Recycling Centers
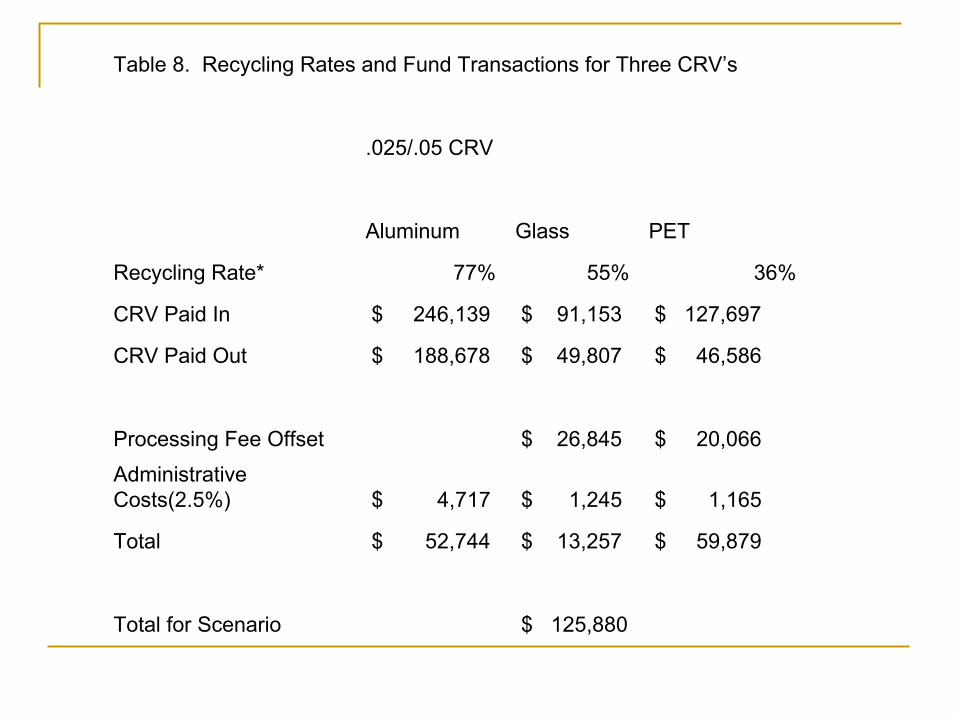
$ 125,880 Total for Scenario
$ 59,879 $ 13,257 $ 52,744 Total
$ 1,165 $ 1,245 $ 4,717 Administrative Costs(2.5%)
$ 20,066 $ 26,845 Processing Fee Offset
$ 46,586 $ 49,807 $ 188,678 CRV Paid Out
$ 127,697 $ 91,153 $ 246,139 CRV Paid In
36%55%77%Recycling Rate*
PETGlassAluminum
.025/.05 CRV
Table 8. Recycling Rates and Fund Transactions for Three CRV’s
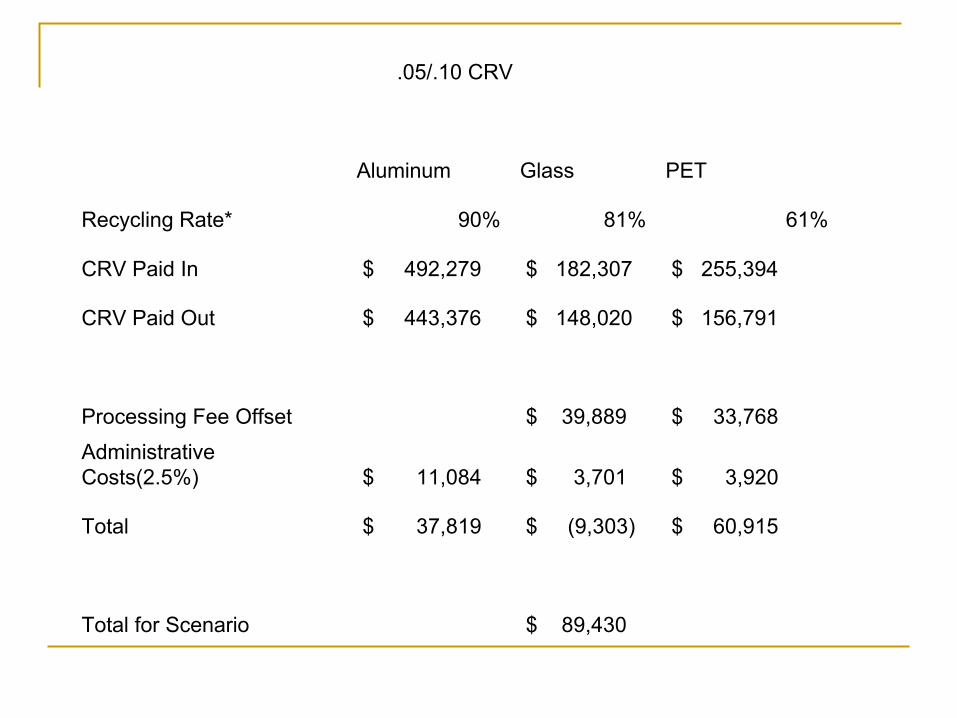
$ 89,430 Total for Scenario
$ 60,915 $ (9,303)$ 37,819 Total
$ 3,920 $ 3,701 $ 11,084 Administrative Costs(2.5%)
$ 33,768 $ 39,889 Processing Fee Offset
$ 156,791 $ 148,020 $ 443,376 CRV Paid Out
$ 255,394 $ 182,307 $ 492,279 CRV Paid In
61%81%90%Recycling Rate*
PETGlassAluminum
.05/.10 CRV

$ 71,999 Total for Scenario
$ 43,804 $ (9,492)$ 37,686 Total
$ 2,696 $ 3,443 $ 10,726 Administrative Costs(2.5%)
$ 31,856 $ 39,523 Processing Fee Offset
$ 107,831 $ 137,722 $ 429,020 CRV Paid Out
$ 186,187 $ 171,196 $ 477,432 CRV Paid In
58%80%90%Recycling Rate*
.05/.05 CRV
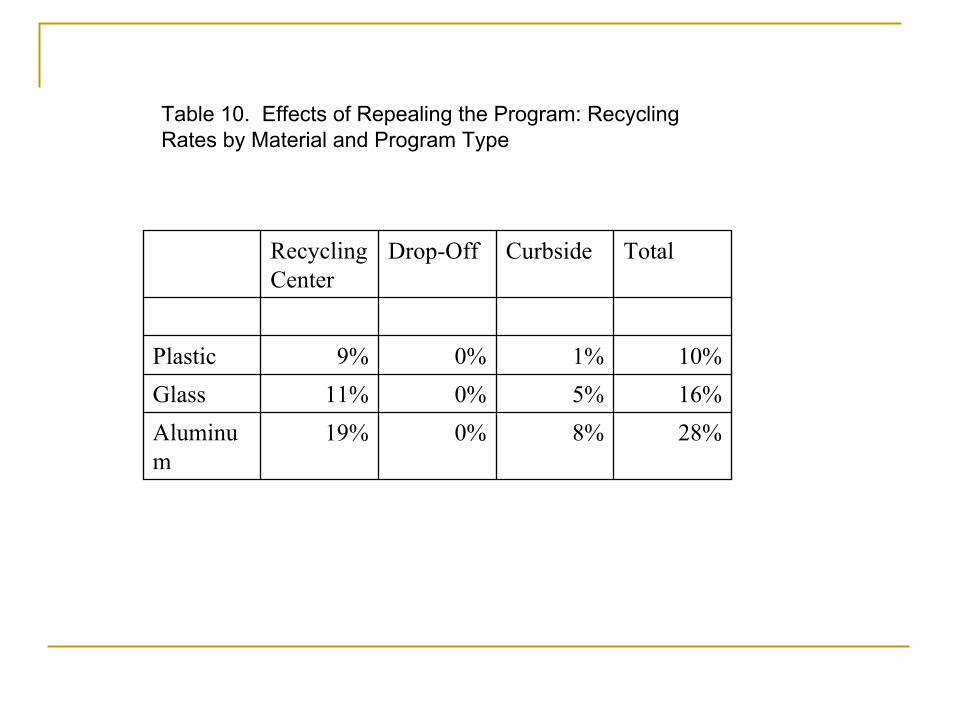
Table 10. Effects of Repealing the Program: Recycling Rates by Material and Program Type
28%8%0%19%Aluminum
16%5%0%11%Glass10%1%0%9%Plastic
TotalCurbsideDrop-OffRecycling Center
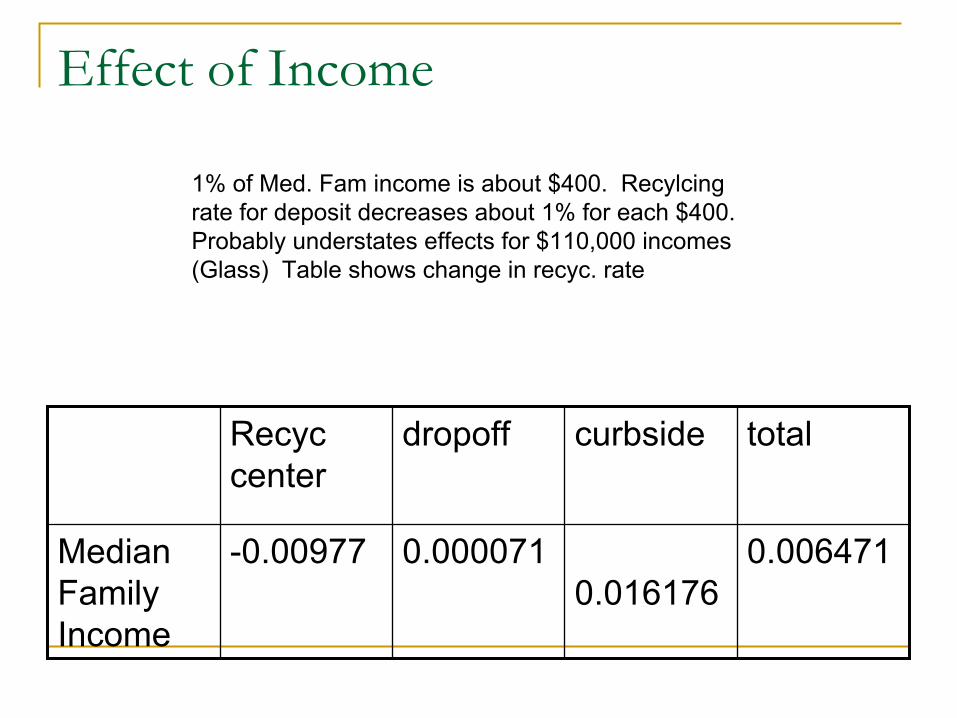
1% of Med. Fam income is about $400. Recylcingrate for deposit decreases about 1% for each $400. Probably understates effects for $110,000 incomes(Glass) Table shows change in recyc. rate
Effect of Income
0.0064710.016176
0.000071-0.00977Median Family Income
totalcurbsidedropoffRecyccenter
Effect of Income
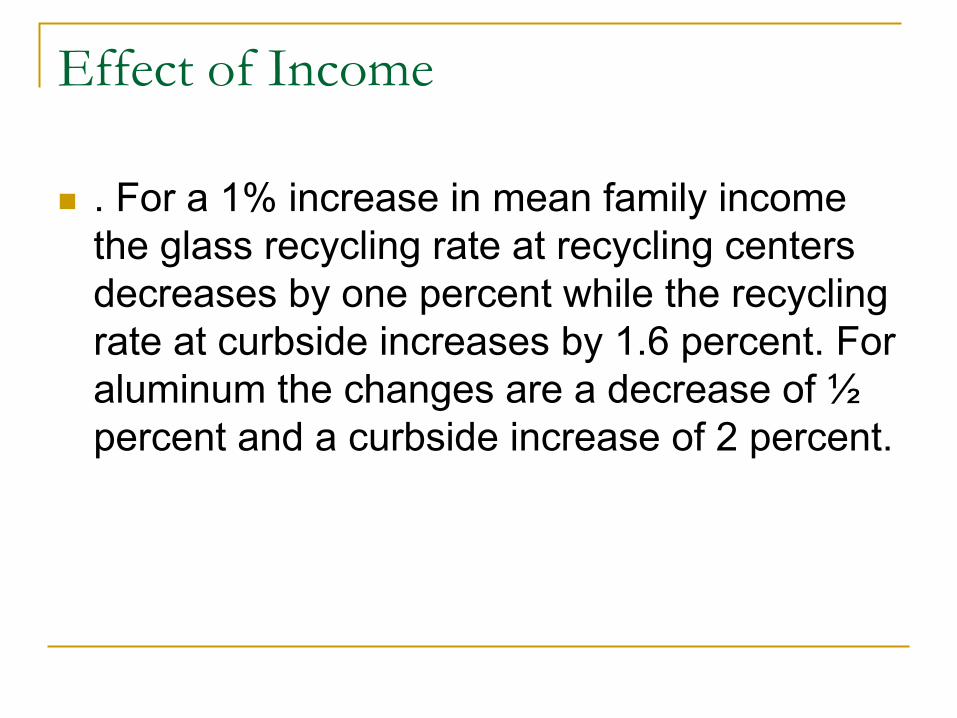
. For a 1% increase in mean family income the glass recycling rate at recycling centers decreases by one percent while the recycling rate at curbside increases by 1.6 percent. For aluminum the changes are a decrease of ½ percent and a curbside increase of 2 percent.

7. Makeup of Container Stream and Recycling Rate In and Out of the ProgramA few Words on Expanding the Program
Sales Data
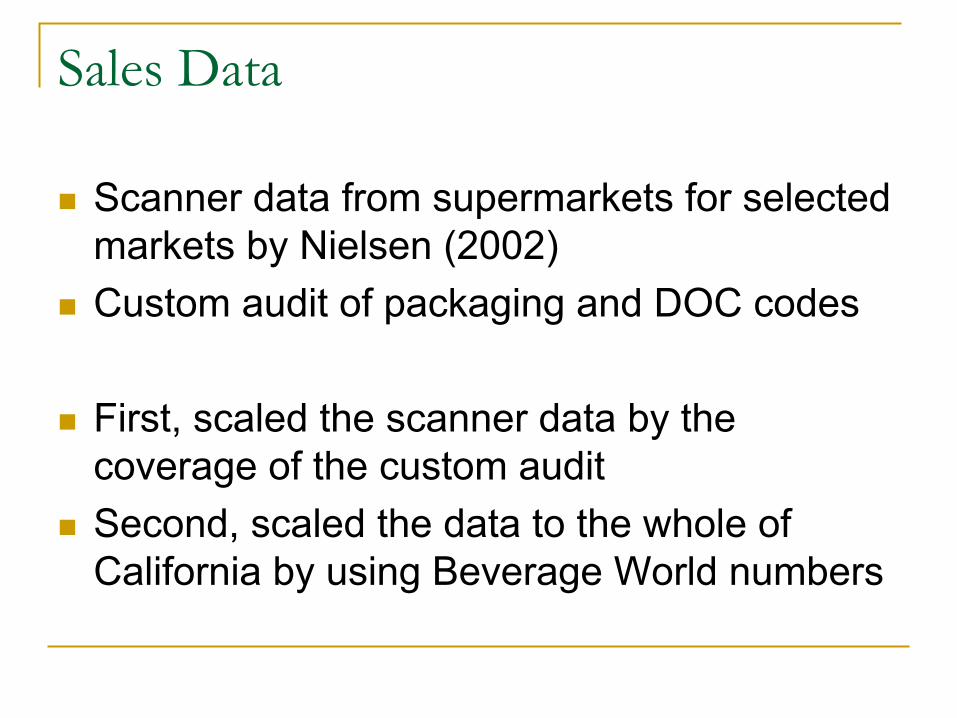
Scanner data from supermarkets for selected markets by Nielsen (2002)Custom audit of packaging and DOC codes
First, scaled the scanner data by the coverage of the custom auditSecond, scaled the data to the whole of California by using Beverage World numbers
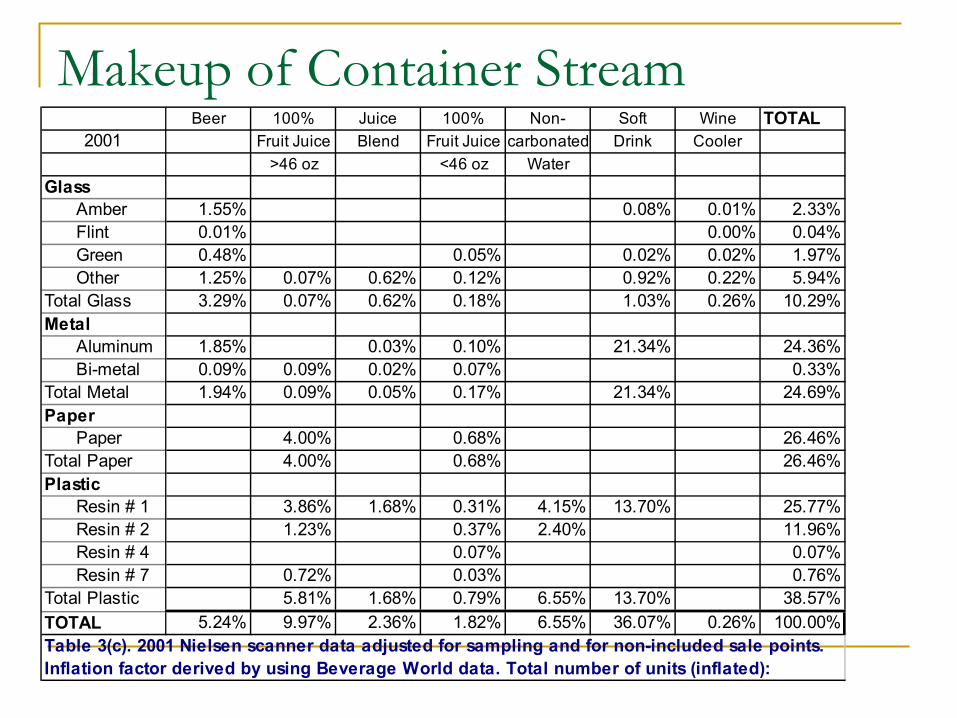
Makeup of Container StreamBeer 100% Juice 100% Non- Soft Wine TOTAL
2001 Fruit Juice Blend Fruit Juice carbonated Drink Cooler>46 oz <46 oz Water
GlassAmber 1.55% 0.08% 0.01% 2.33%Flint 0.01% 0.00% 0.04%Green 0.48% 0.05% 0.02% 0.02% 1.97%Other 1.25% 0.07% 0.62% 0.12% 0.92% 0.22% 5.94%
Total Glass 3.29% 0.07% 0.62% 0.18% 1.03% 0.26% 10.29%Metal
Aluminum 1.85% 0.03% 0.10% 21.34% 24.36%Bi-metal 0.09% 0.09% 0.02% 0.07% 0.33%
Total Metal 1.94% 0.09% 0.05% 0.17% 21.34% 24.69%Paper
Paper 4.00% 0.68% 26.46%Total Paper 4.00% 0.68% 26.46%Plastic
Resin # 1 3.86% 1.68% 0.31% 4.15% 13.70% 25.77%Resin # 2 1.23% 0.37% 2.40% 11.96%Resin # 4 0.07% 0.07%Resin # 7 0.72% 0.03% 0.76%
Total Plastic 5.81% 1.68% 0.79% 6.55% 13.70% 38.57%TOTAL 5.24% 9.97% 2.36% 1.82% 6.55% 36.07% 0.26% 100.00%Table 3(c). 2001 Nielsen scanner data adjusted for sampling and for non-included sale points. Inflation factor derived by using Beverage World data. Total number of units (inflated):
Containers in and out
Comparison of recycling rates of materials added to the program in 2000.New additions: coffee and tea based drinks, juice blends, 100% fruit juice in <36 oz, non-carbonated water, non-carbonated soft drinks, sport drinks53% of all 2000 introductions were in PET, lion share to non-carbonated water

Methodology
Apparent recycling rate of the 2000 additions in 1999 (recycling rate “out” of the program)
2000ret = % juice out *(Total Returns –Redeemed – Other non-program PET)
2000
2000
retprogretprogretRate salesprogsalesprogsales
=

Result
1999 recycling rate of 2000 additions = 12%
When these 1.3 billion containers were added to the program, the overall recycling rate fell from 62 to 32 percent
2000 recycling rate of 2000 additions = 15 % if we assume constant recycling rate of program materialIf we assume decreasing (= aluminum), then 17%