Embed Size (px)
Citation preview

David Hochschild Commissioner
California Energy Commission
CALIFORNIA AND THE DAWN OF THE
CLEAN ENERGY ERA

iPhone was first released in 2007

3
0
5
10
15
20
25
30
35
40
2007 2008 2009 2010 2011 2012 2013 2014 2015 2016
Ge
ne
rati
on
(TW
h)
Year
US Solar PV Generation: Prediction vs Reality
AEO 2012
Actual
Source: EIA Annual Energy Outlook 2004-2017, EIA Electric Power Monthly July 25, 2017

Most of the New Generation Added to the Grid is Renewable Energy
Renewables = 65% of New US Electric Generation Capacity in 2015
4
Renewables
Fossil Fuels
11,298 MW
5,974 MW
Source: FERC Energy Infrastructure Update, January-December 2015

Most of the Retirements are Fossil Energy Fossil fuels = 92% of Retired US Electric Generation Capacity in 2016*
5
Fossil- 7,382MW,
92%
Nuclear, Hydro-
588MW, 8%
Renewable- 28MW, 0%
Source: EIA Electric Power Monthly, November 29, 2016. MW represent summer capacity.
*Data represents January 1, 2016 to
November 29, 2016

1920 1930 1940 1950 1960 1970 1980 1990 2000 2010 2020 2030 2040 2050
Federal Energy Subsidies
PRODUCTION TAX
CREDIT (PTC)
INVESTMENT TAX
CREDIT (ITC)
OIL DEPLETION
ALLOWANCE (ODA)
1926: OIL DEPLETION ALLOWANCE ENACTED
2006: INVESTMENT TAX CREDIT ENACTED
ONGOING
1992: PRODUCTION TAX CREDIT ENACTED
SET TO EXPIRE 2022
SET TO
EXPIRE 2020
*PTC Expired 6 times and Extended 7 times

2013 2020 2030
California Moves to 50% Renewables
20% 33%
50%
7

Source: Graphics based on data from the American Council On Renewable Energy (ACORE) Renewable Energy in the 50 States (2013/2014 Editions) http://www.acore.org/publications/50states/ 8
(MW capacity)
California Leads the US in Renewables Installed. What lessons have been learned?
California Advancing Energy Efficiency
Savings in Industrial Sector
Source: EIA, SEDS database (2017)
Savings in Residential Sector
Source: EIA, SEDS database (2017)
Savings in Commercial Sector
Source: EIA, SEDS database (2017)
0.00
0.25
0.50
0.75
1.00
1.25
1.50
1.75
19
60
19
65
19
70
19
75
19
80
19
85
19
90
19
95
20
00
20
05
20
10
20
15
Per
Cap
ita
Elec
tric
ity
Use
(In
dex
ed t
o 1
97
5)
Source: EIA, SEDS database (2017)

California Advancing Energy Efficiency

11
The Falling Cost of Clean Energy Technologies
Source: DOE Report, Revolution Now, The Future Arrives for Five Clean Energy Technologies, 2015
0%
20%
40%
60%
80%
100%
120%
2008 2009 2010 2011 2012 2013 2014
Pe
rce
nta
ge o
f C
ost
Year
Indexed Cost Reductions Since 2008

0%
5%
10%
15%
20%
25%
30%
2001 2002 2006 2008 2011 2014 2015 2016
SMALL HYDRO
GEOTHERMAL
BIOMASS
WIND
SOLAR
California Making Rapid Progress on Renewable Energy
12 Source: California Energy Commission, Tracking Progress Report

13
The World’s Largest Thin Film Solar PV Project
Desert Sunlight Solar Project 550 MW Riverside County, CA

The World’s Largest Solar Thermal Power Plant (Tower)
Ivanpah Solar Thermal Project 393 MW San Bernardino County, CA
14

The World’s Largest Solar Thermal Power Plant (Trough)
Solar Energy Generating System (SEGS) 354 MW San Bernardino County, CA
15

Geysers Geothermal Power Plant 955 MW Lake County, CA
The World’s Largest Geothermal Power Plant
16

The World’s Largest Wind Project
Alta Wind Energy Center 1550 MW Kern County, CA
17

World’s Largest Lithium-Ion Battery Storage Project
18
Escondido Storage Project 120 MWh San Diego, CA

The Future of Energy Storage: 1.3 GW by 2020
19
$5 B Tesla Battery Factory under construction

California Leads the Nation in Biomass Energy Generation
20
Honey Lake Biomass Plant Lassen County, CA

21
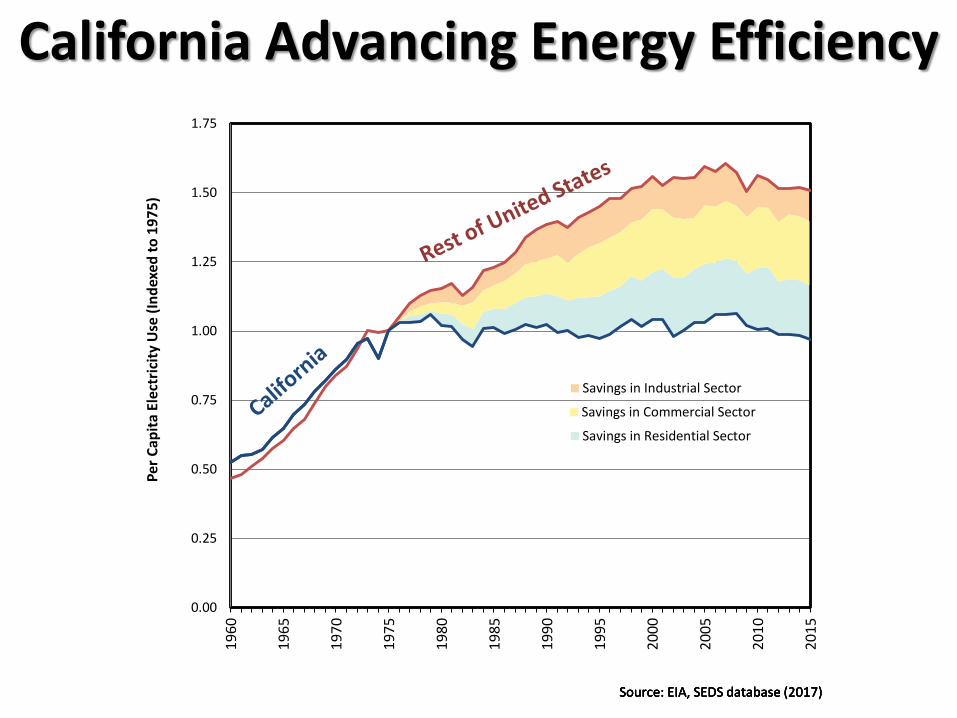
Offshore Wind: CA’s New Renewable Resource?
Rhode Island’s 30MW Deepwater Wind Project is the first offshore wind project completed in the US.
New technology now enables deep water installations
22

Largest Manufacturing Plant in CA Produces Electric Vehicles
Tesla employs 33,000 people
Tesla Factory Fremont, CA
334,000 ELECTRIC VEHICLES
IN CALIFORNIA TODAY
23

New Solar Home Construction Growing Rapidly
Zero Energy Community Rocklin, CA
27% of new homes in Southern CA
built with solar
24

More Californians Work in the Solar Industry Than for All Utilities Combined
Sources:
Solar Foundation, 2016 Solar Jobs Census
U.S. Securities and Exchange Commission, Form 10-K, 2014 http://www.sec.gov/edgar/searchedgar/companysearch.html
0
20,000
40,000
60,000
80,000
100,000
120,000
Solar Jobs IOU/POU Jobs
SDG&E PG&E SCE POU
56,800
100,500

STATES LEADING THE WAY: California’s “Under 2 MOU”: 166 signatories
representing 35% of global GDP
26

Toward the Electrification of Almost Everything and 100% Renewables
27

28
14,000 Electric Vehicle Charging Stations in CA
Map of Level 2 charging stations (not including privately owned
chargers)
Source: PlugShare.com, US Department of Energy Alternative Fuels Data Center
Map Source: PlugShare (June 2016)

Stanford University Converts Space and Water Heating from
Natural Gas to Electricity
29
Reduces water use and GHG emissions by 2/3 and annual energy bills by 1/3
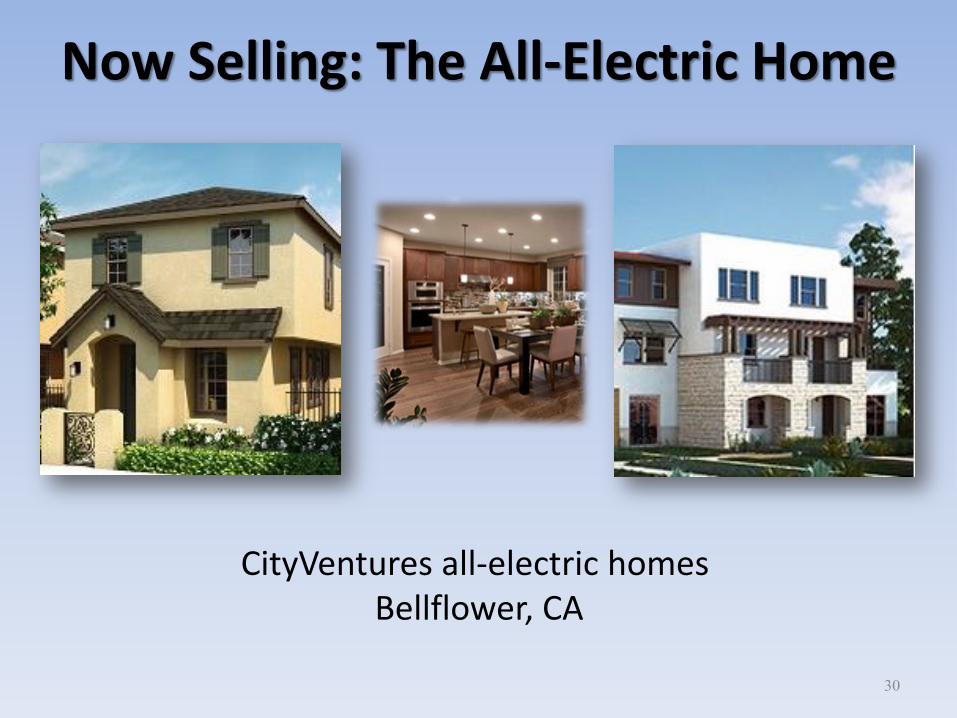
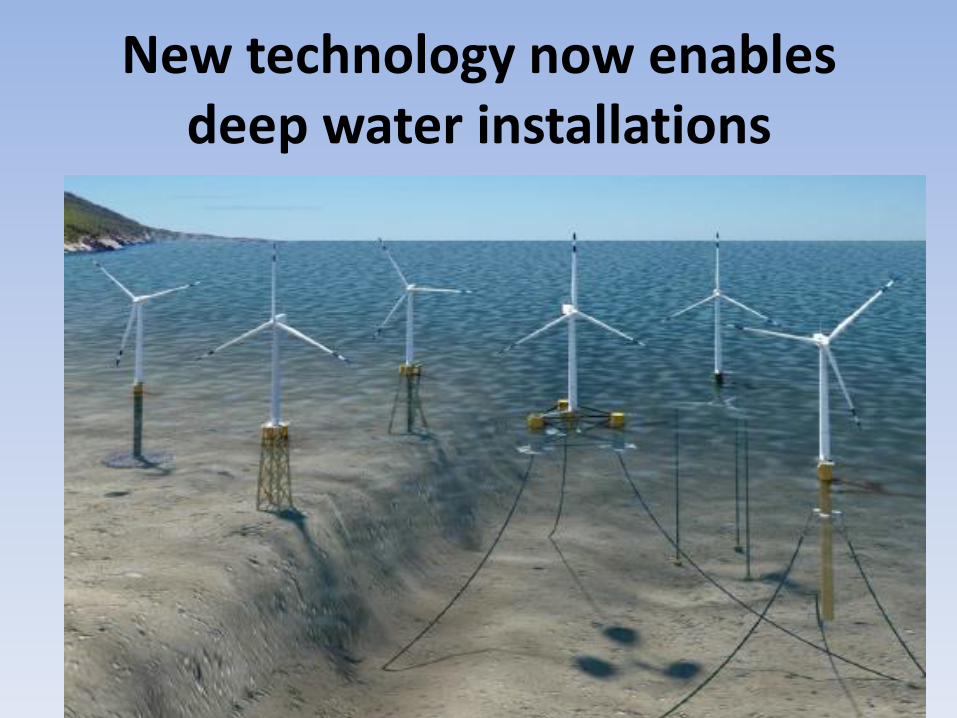
Now Selling: The All-Electric Home
30
CityVentures all-electric homes Bellflower, CA

31
New Private Sector Leadership to Move Beyond Fossil Fuels

Companies Committing to 100% Renewable Energy
32

Divestment of Fossil Fuels Reaches $5 Trillion
33 Source: Arabella Advisors, The Global Fossil Fuel Divestment and Clean Energy Investment Movement 2016
$5T
$4T
$3T
$2T
$1T
2011 2012 2013 2014 2015 2016

Personal air filtration system (Yes, this is a real product in China now)
34

Over 30 US military bases in CA Representing approximately $130B annually to the California Economy
35 Source: California Energy Commission, 2014 Geographic Information Systems Data
Navy: 50% Renewables by 2020
Marines: Zero Fossil
Fuels on Bases by 2025

High Speed Rail is Coming to California and it will be 100% Powered by
Renewables…
36

Drawing Lessons From Successful Campaigns: The Story of Acid Rain
37

Reduction in Acid Rain
Source: National Atmospheric Deposition Program, 2014 http://nadp.sws.uiuc.edu/ntn/annualmapsByYear.aspx
38
1985 2012

The Ozone Hole
Source: NASA Ozone Hole Watch, 2014 http://ozonewatch.gsfc.nasa.gov/monthly/SH.html
39
1979 2013 2050 (expected)
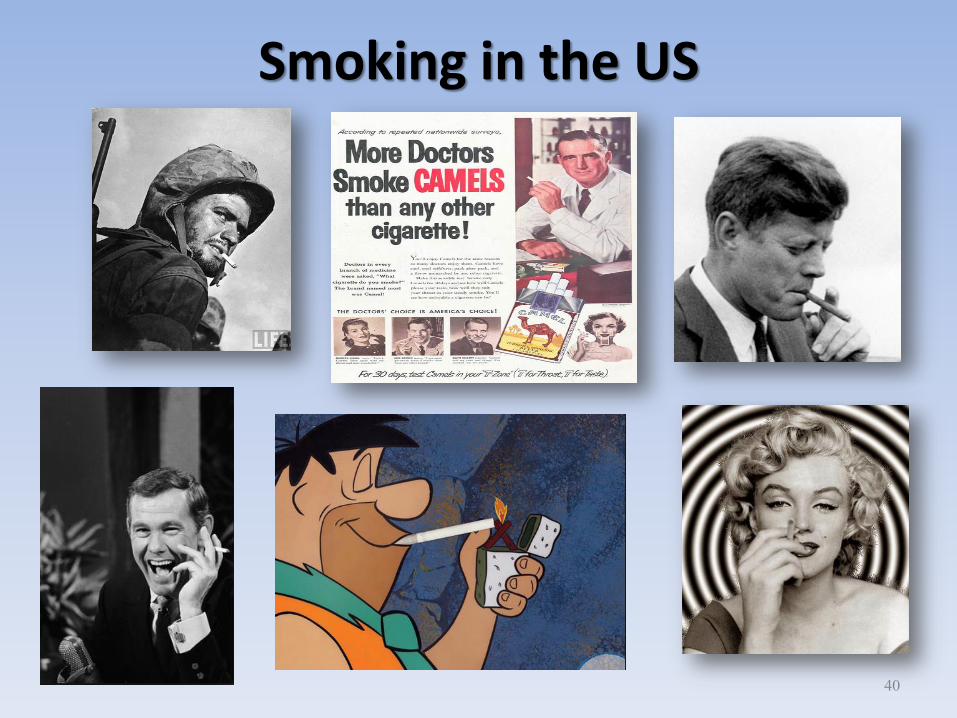
Smoking in the US
40

0
10
20
30
40
50
60
70
1960 1965 1970 1975 1980 1985 1990 1995 2000 2005 2010 2015 2020Source: Centers for Disease Control and Prevention (CDC), 2014
http://www.cdc.gov/tobacco/data_statistics/tables/trends/cig_smoking/index.htm
1965: Health warnings required on packaging
1983: Cigarette tax doubles
1988: U.S. Bans Smoking on Airplanes
Smoking Rate Falls to
15%
1970: Advertisements banned from TV
1998: CA Bans Smoking in Bars
2014: CVS Stops cigarette sales at 7,600
retail pharmacies
1992: U.S. Bans Sale to Minors
% of Americans Who Smoke