Embed Size (px)
Citation preview

NOAA Technical Memorandum OAR PMEL
Calibration Procedures and Instrumental Accuracy
Estimates of ATLAS Air Temperature and Relative
Humidity Measurements
Brian J. Lake1, Sonya M. Noor2, H. Paul Freitag1, and Michael J. McPhaden1
1Pacific Marine Environmental Laboratory7600 Sand Point Way NESeattle, WA 98115-6349
2Joint Institute for the Study of the Atmosphere and Ocean (JISAO)University of WashingtonBox 354235Seattle, WA 98195-4235
April 2003
Contribution 2569 from NOAA/Pacific Marine Environmental Laboratory

NOTICE
Mention of a commercial company or product does not constitute an endorsement byNOAA/OAR. Use of information from this publication concerning proprietary productsor the tests of such products for publicity or advertising purposes is not authorized.
Contribution No. 2569 from NOAA/Pacific Marine Environmental LaboratoryContribution No. 981 from Joint Institute for the Study of the Atmosphere and Ocean
For sale by the National Technical Information Service, 5285 Port Royal RoadSpringfield, VA 22161
ii

Contents iii
Contents
1. Introduction . . . . . . . . . . . . . . . . . . . . . . . . . . . . 12. Instrumentation . . . . . . . . . . . . . . . . . . . . . . . . . . 23. Humidity Calibration Procedures . . . . . . . . . . . . . . . 44. Air Temperature Calibration Procedures . . . . . . . . . . . 65. I/O Board Calibration Procedures . . . . . . . . . . . . . . . 66. Relative Humidity Equilibration . . . . . . . . . . . . . . . . 77. Humidity Calibration Repeatability . . . . . . . . . . . . . . 108. Individual Sensor and I/O Board Calibrations . . . . . . . 13
8.1 Relative Humidity Sensor . . . . . . . . . . . . . . . . . . . . 138.2 Relative Humidity I/O Board . . . . . . . . . . . . . . . . . . 158.3 Air Temperature Sensor . . . . . . . . . . . . . . . . . . . . . 168.4 Air Temperature I/O Board . . . . . . . . . . . . . . . . . . . 16
9. Sensor and I/O Board Drift . . . . . . . . . . . . . . . . . . . 169.1 Relative Humidity Sensor . . . . . . . . . . . . . . . . . . . . 179.2 Relative Humidity I/O Board . . . . . . . . . . . . . . . . . . 189.3 Air Temperature Sensor . . . . . . . . . . . . . . . . . . . . . 189.4 Air Temperature I/O Board . . . . . . . . . . . . . . . . . . . 18
10. Combined Instrument Error . . . . . . . . . . . . . . . . . . 1911. Summary . . . . . . . . . . . . . . . . . . . . . . . . . . . . . . 1912. References . . . . . . . . . . . . . . . . . . . . . . . . . . . . . 21Appendix: Specifications and Calibration of the Humidity Gen-
erator . . . . . . . . . . . . . . . . . . . . . . . . . . . . . . . . 22
List of Figures
1 Sample RH sensor output during pre-deployment and post-recoverycalibration at the 55 %RH calibration set point. . . . . . . . . . . . . 8
2 Ensemble distributions from 183 calibrations (915 set points). . . . . 93 Residual error for five sensors calibrated nine times. . . . . . . . . . 114 Sensor output (in %RH) computed using individual calibration coef-
ficients from each of nine calibrations. . . . . . . . . . . . . . . . . . 125 Standard deviation (in %RH) of calibrated sensor output computed
over nine calibrations for each of five sensors. . . . . . . . . . . . . . 146 Mean and RMS differences between pre-deployment and post-recovery
calibration of humidity sensors plotted versus the number of dayseach sensor was deployed at sea. . . . . . . . . . . . . . . . . . . . . 18
List of Tables
1 Manufacturer’s specifications for Rotronic Instrument Corp. modelMP101A air temperature (AT) and relative humidity (RH) sensorsused on NextGeneration ATLAS moorings. . . . . . . . . . . . . . . 3
2 Statistics for NextGeneration ATLAS air temperature (AT) and rel-ative humidity (RH) sensor calibrations. . . . . . . . . . . . . . . . . 15
3 Statistics for NextGeneration ATLAS I/O board calibrations. . . . . 154 Differences between pre- and post-deployment sensor calibrations. . . 175 Differences between pre- and post-deployment I/O board calibrations. 17

iv Contents
6 Combined (sensor and I/O board) instrument error for NextGener-ation ATLAS air temperature and relative humidity measurementsbased on unnormalized data in tables 4 and 5. . . . . . . . . . . . . . 19
A1 Test equipment accuracy standards. . . . . . . . . . . . . . . . . . . 23
Calibration Procedures and Instrumental Accuracy Estimates ofATLAS Air Temperature and Relative Humidity Measurements
Brian J. Lake1, Sonya M. Noor2, H. Paul Freitag1, and Michael J. McPhaden1
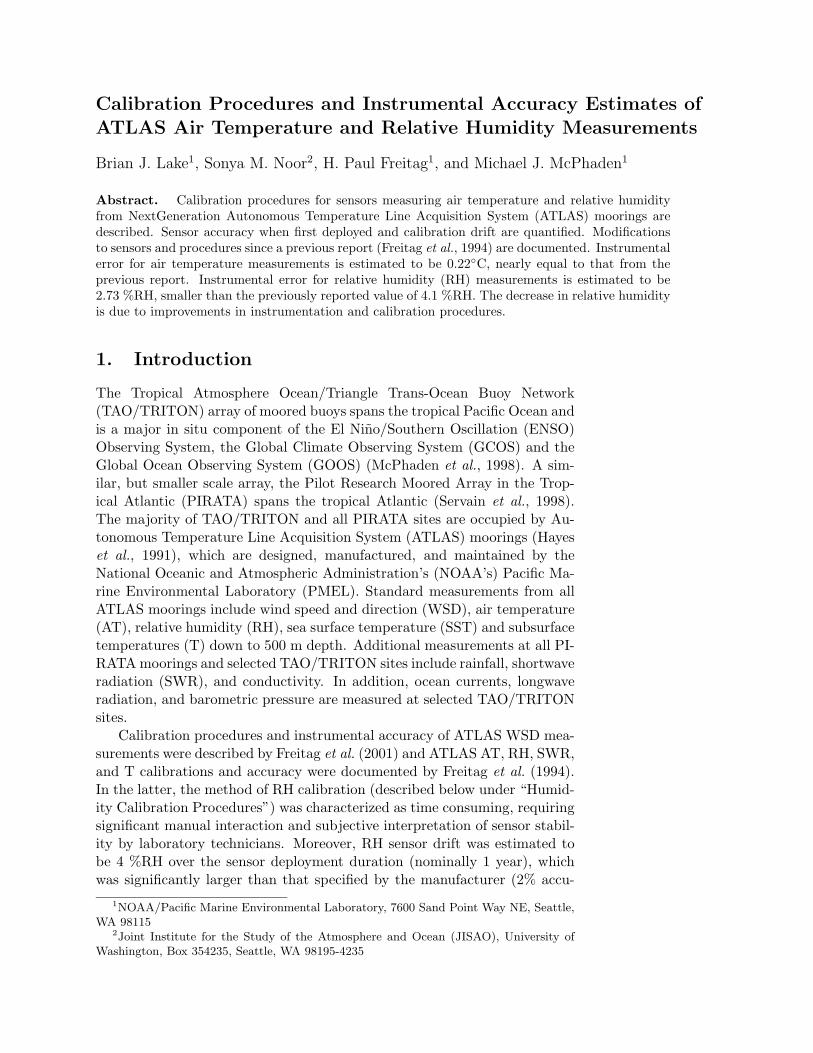
Abstract. Calibration procedures for sensors measuring air temperature and relative humidityfrom NextGeneration Autonomous Temperature Line Acquisition System (ATLAS) moorings aredescribed. Sensor accuracy when first deployed and calibration drift are quantified. Modificationsto sensors and procedures since a previous report (Freitag et al., 1994) are documented. Instrumentalerror for air temperature measurements is estimated to be 0.22◦C, nearly equal to that from theprevious report. Instrumental error for relative humidity (RH) measurements is estimated to be2.73 %RH, smaller than the previously reported value of 4.1 %RH. The decrease in relative humidityis due to improvements in instrumentation and calibration procedures.
1. Introduction
The Tropical Atmosphere Ocean/Triangle Trans-Ocean Buoy Network(TAO/TRITON) array of moored buoys spans the tropical Pacific Ocean andis a major in situ component of the El Nino/Southern Oscillation (ENSO)Observing System, the Global Climate Observing System (GCOS) and theGlobal Ocean Observing System (GOOS) (McPhaden et al., 1998). A sim-ilar, but smaller scale array, the Pilot Research Moored Array in the Trop-ical Atlantic (PIRATA) spans the tropical Atlantic (Servain et al., 1998).The majority of TAO/TRITON and all PIRATA sites are occupied by Au-tonomous Temperature Line Acquisition System (ATLAS) moorings (Hayeset al., 1991), which are designed, manufactured, and maintained by theNational Oceanic and Atmospheric Administration’s (NOAA’s) Pacific Ma-rine Environmental Laboratory (PMEL). Standard measurements from allATLAS moorings include wind speed and direction (WSD), air temperature(AT), relative humidity (RH), sea surface temperature (SST) and subsurfacetemperatures (T) down to 500 m depth. Additional measurements at all PI-RATA moorings and selected TAO/TRITON sites include rainfall, shortwaveradiation (SWR), and conductivity. In addition, ocean currents, longwaveradiation, and barometric pressure are measured at selected TAO/TRITONsites.
Calibration procedures and instrumental accuracy of ATLAS WSD mea-surements were described by Freitag et al. (2001) and ATLAS AT, RH, SWR,and T calibrations and accuracy were documented by Freitag et al. (1994).In the latter, the method of RH calibration (described below under “Humid-ity Calibration Procedures”) was characterized as time consuming, requiringsignificant manual interaction and subjective interpretation of sensor stabil-ity by laboratory technicians. Moreover, RH sensor drift was estimated tobe 4 %RH over the sensor deployment duration (nominally 1 year), whichwas significantly larger than that specified by the manufacturer (2% accu-
1NOAA/Pacific Marine Environmental Laboratory, 7600 Sand Point Way NE, Seattle,WA 98115
2Joint Institute for the Study of the Atmosphere and Ocean (JISAO), University ofWashington, Box 354235, Seattle, WA 98195-4235

2 B.J. Lake et al.
racy and 1% drift per year, for the Rotronic MP100 model deployed at thetime). It was speculated that some of the difference between expected andestimated sensor drift could be the result of inaccuracy in the calibrationprocedure. As a result, PMEL has developed an automated, computer con-trolled RH calibration procedure, to improve upon RH sensor calibrationefficiency and accuracy.
This memorandum documents the new RH calibration procedure andprovides a revised estimate of instrumental accuracy for ATLAS RH mea-surements that reflect improvements in the calibration method at PMEL andimprovements in the sensors by the manufacturer. Calibration and accuracyof AT, which is measured by the same sensor as RH, are also revisited. AT-LAS mooring electronics were updated over the period 1996 to 2001, duringwhich an evolution toward use of the NextGeneration ATLAS system oc-curred in the Pacific. PIRATA moorings have been NextGeneration ATLASsystems since the inception of the array in 1997. Differences in circuitry andsampling from the earlier Standard ATLAS system are described.
2. Instrumentation
Relative humidity and air temperature are presently measured on ATLASmoorings by model MP101A combined humidity and air temperature probesmanufactured by Rotronic Instrument Corporation of Huntington, NY. With-in the probe, relative humidity is measured by a Rotronic Hygromer C94 thinfilm capacitive sensor that is protected beneath a Teflon foam filter cap, whiletemperature is measured by a Pt100 RTD (Resistance Temperature Detec-tor). Manufacturer specifications regarding the accuracy of the MP101A arelisted in Table 1. Sensor output is an analog DC voltage that is a linearfunction of either RH or AT expressed in engineering units. RH sensor out-put in the range 0 V to 1 V represents values of 0 %RH to 100 %RH. ATsensor voltage in the range from −0.4 V to +0.6 V represents temperaturefrom −40◦C to 60◦C. The nominal calibration equations for the sensors arethus
RH(%) = BrhVrh
AT(◦C) = BatVat
where Vrh and Vat are the output in volts for the RH and AT sensors, re-spectively, and Brh and Bat are calibration coefficients with nominal valuesof 100 each.
ATLAS RH and AT measurements described in Freitag et al. (1994),were made with a Rotronic model MP100 sensor. The manufacturer up-dated this sensor to the MP101A, which included modifications to the cir-cuitry, the humidity sensor, and its protective filter. Modifications listedbelow are based upon comparison of the manufacturer’s published specifica-tions and/or personal communications with representatives of the company.Surface-mount technology (the method of attaching components withoutleads in feed through holes) was applied to the circuitry. The electronics-imposed operating temperature limits were increased from [−20 – +55◦C] to

ATLAS Calibration Procedures and Instrumental Accuracy Estimates 3
Table 1: Manufacturer’s specifications for Rotron-ic Instrument Corp. model MP101A air temperature(AT) and relative humidity (RH) sensors used onNextGeneration ATLAS moorings.
Sensor Specifications
AT ±0.2◦C accuracy0.2◦C drift/year
±0.1◦C repeatability
RH ±1.0 %RH accuracy*<1.0 %RH drift/year±0.3 %RH repeatability
*RH accuracy when calibrated with a high qualitystandard.
[−40−60◦C]. The Pt100 RTD thermistor’s linearity was improved and thetemperature accuracy improved from 0.5◦C to 0.2◦C. The humidity sensorwas upgraded from a C80 to a C94, which improved the nominal accuracyfrom 2 %RH to 1.5 %RH and halved the %RH repeatability specificationsfrom 0.6 %RH to 0.3 %RH. The specified nominal accuracy is applicableto factory or field calibrations. When calibrated with a high quality stan-dard, such as the Thunder Scientific chamber, Rotronic specifies accuracy ofthe MP101A as 1 %RH. Modifications to the electronics improved the lin-earity and temperature compensation of the sensor. The humidity sensor’selectrodes were also improved to better resist contaminants. PMEL foundthat some cases enclosing the MP100 and MP101A sensors leaked in theocean environment. Sensors purchased by PMEL now use watertight enclo-sures which are designed and provided by PMEL to Rotronic for instrumentassembly. One of the most substantial modifications by the manufacturerwas an improvement in the current drain, a specification vital to PMEL’sbattery-operated, low-power moorings. The current drain was reduced dur-ing several successive versions of the MP101A model. The current drains ofMP100 and early MP101A versions exceeded 10 mA, while the newer ver-sions of MP101A are typically 4 mA. All NextGeneration ATLAS mooringsuse the newer, lower-current MP101A sensors.
Digitization of the analog voltages is performed by electronic circuitrydesigned and built at PMEL. The present NextGeneration ATLAS systememploys a 12-bit analog-to-digital (A/D) converter with RH resolution of0.024 %RH over a range of 0 %RH to 100 %RH and AT resolution of 0.01◦Cover a range of 0◦C to 40◦C. For real-time telemetry and during calibration,RH data are reduced to 8 bits or 0.39 %RH resolution, for compatibilitywith telemetry buffers and data processing of the older ATLAS systems.After mooring recovery, the full 12-bit resolution is obtained from internalmemory. The earlier Standard ATLAS systems used 10-bit A/D converters,which gave 0.04◦C resolution for AT. RH data in the older system weretruncated to 8 bits (0.39 %RH resolution) for both real-time and delayedmodes.

4 B.J. Lake et al.
In the course of this investigation it was found that the reduction of RHdata from 12 to 8 bits during calibration was done via truncation, ratherthan the more accurate method of rounding, which is used during real-timetelemetry of data. Assuming an even distribution of data, truncation wouldbias the data by about 1/2 the reduced resolution or about 0.2 %RH. Thisbias is not reflected in drift estimates presented below as it is present inboth pre-deployment and post-recovery calibrations. Modifications to thenext version of NextGeneration ATLAS firmware will eliminate this smallbias.
Temporal resolution has also increased in the present NextGenerationATLAS system. AT and RH sensors are sampled at 2 Hz for 2 min every 10min. Two-minute means are computed at each 10-min interval and storedin internal memory. Daily means and the 2-min mean at the most recenthour are telemetered in real time. The earlier Standard ATLAS systemscomputed and stored hourly average data, based on spot samples measuredat 10-min intervals.
When deployed on a buoy the MP101A sensor is shielded from directsunlight by a naturally aspirated, multi-plate radiation shield (supplied bythe R.M. Young Co., Traverse City, Michigan), the effectiveness of whichincreases with wind speed. The manufacturer specifies that at a radiationlevel of 1080 W m−2, temperature bias is 0.4◦C at 3 m s−1 wind speed, 0.7◦Cat 2 m s−1, and 1.5◦C at 1 m s−1. The present study focuses on instrumentalcalibration errors and does not address errors associated with factors suchas radiant heating. Typical (mode) wind speeds measured within the TAOArray are about 6 m s−1 and values below 3 m s−1 compose about 12% ofthe data. Wind speed statistics are similar in the PIRATA Array. Thus biasdue to radiant heating of air temperature measured in TAO or PIRATA ispresumably limited to a small portion of the data.
3. Humidity Calibration Procedures
Rotronic recommends that RH calibration be verified on a 6- to 12-monthbasis for maximum accuracy. ATLAS moorings are typically deployed for 1year. Calibrations of sensors are performed before and after every mooringdeployment, thus the calibration frequency recommended by the manufac-turer is roughly met.
The manufacturer-specified calibration procedure involves connectingeach probe to a calibration receptacle containing a humidity standard (non-aqueous salt solution). The method includes measuring sensor output afterthe recommended 1-hour equilibrium period, followed by adjustment to thecorrect value by use of a potentiometer in the sensor circuitry. Rotronicrecommends this procedure be performed at 35 %RH and 80 %RH, pluseither 0 %RH or 10 %RH. After this procedure, the RH sensor is assumedto follow the nominal calibration equation given above, within the nominalaccuracy. The low-humidity calibration point is not performed at PMEL,since tropical ocean humidity is rarely less than 50 %RH. This procedure to

ATLAS Calibration Procedures and Instrumental Accuracy Estimates 5
bring the sensors into nominal performance is performed routinely by PMELtechnicians before sensors are deployed in the field.
In an additional procedure developed at PMEL, the sensor linearity andcalibration accuracy is confirmed, and individual sensor calibration coeffi-cients are computed by measuring the sensor output at additional levels, asdescribed below. Individual sensor coefficients are computed from a linearleast square fit to the equation
RH(%RH) = Arh + BrhVrh
which allows for individual bias (Arh) and gain (Brh) calibration coefficientsfor each sensor. This process is performed and coefficients computed beforedeployment and again after recovery in an “as is” state. Before subsequentdeployment, the sensor filter cap is cleaned or replaced, the sensor broughtback into nominal accuracy (using the procedure recommended by Rotronicdescribed above) and a new calibration performed and coefficients computed.Thus for each deployment a sensor has unique pre-deployment and post-recovery calibration coefficients.
As described in Freitag et al. (1994), the previous method of checkingsensor output for accuracy and linearity employed standard salt solutionsbetween 50 %RH and 95 %RH at 15 %RH intervals. This procedure wasrelatively labor intensive and time consuming. In addition, our experiencewas that the 1-hour equilibration time recommended by the manufacturerwas often not sufficient, and determining when the sensor had equilibratedwas subjective and thus could vary between calibrations. Therefore, a moreautomated and less subjective procedure was designed at PMEL to improveboth the efficiency and accuracy of calibrations. In the new calibrationprocedure a Model 2500 Benchtop Two-Pressure Humidity Generator (man-ufactured by Thunder Scientific of Albuquerque, New Mexico) provides ahumidity source while under the direction of a PC computer program. Upto 10 Rotronic probes are connected via a multimeter and monitored simul-taneously by the computer. Temperature stability, vital to the accuracy ofcalibrations, is maintained in the chamber to within 0.1◦C. The humiditygenerator itself is calibrated on a yearly basis, according to manufacturer rec-ommendations. Specifications of the humidity generator and its calibrationare given in the Appendix.
Sensor output is recorded at set points of 55 %RH, 65 %RH, 75 %RH,85 %RH, and 95 %RH, with measurements taken after allowing for sensorsto come to equilibrium within the chamber. The length of the equilibriumperiod is a function of the humidity set point. Based upon past experience,the following equilibrium periods (Teq) are used for all calibrations: 1.5 hoursat 55 %RH, 65 %RH, and 75 %RH levels, 2.5 hours at 85 %RH, and 3.5 hoursat 95 %RH. Subsequent analysis of calibration data (described below) hasconfirmed that these times are sufficient for equilibration in most cases.
In a typical calibration, 6 to 10 sensors are placed into the humiditygenerator’s chamber, taking care to avoid blocking the chamber’s ventila-tion. From that point, the calibration is completely under computer control.Temperature in the chamber is held at 21◦C and the humidity initially set at

6 B.J. Lake et al.
45 %RH. After a half-hour period for temperature equilibration, the cham-ber is brought to the first set point (55 %RH). The sensor output (volts) ismonitored during the equilibrium period at 1-min increments. After equi-librium a mean of the next ten 1-minute samples is computed and archivedfor use in the computation of calibration coefficients. The humidity levelis then increased to the 65 %RH set point, and the process continued untilfinished with the 95 %RH set point. The computer program then computesthe calibration coefficients (Brh and Arh) using a linear least-square fit tothe five mean sensor voltages and chamber humidities. Calibration residu-als (differences between humidity computed from the calibration coefficientsand the chamber reading) are computed and displayed. For pre-deploymentcalibrations, if any residual exceeds 1.0 %RH, sensors are set aside for ad-justment or repair and recalibration. The maximum acceptable residual wasinitially set at 2 %RH, based on the manufacturer’s original accuracy esti-mate for the MP100 sensor. Experience with the improved MP101 sensorsand automated calibration procedure indicated that this criterion could belowered to 1 %RH with only a small number of sensors failing predeploymentcalibration.
4. Air Temperature Calibration Procedures
The ATLAS air temperature (AT) sensor calibration procedure as describedin Freitag et al. (1994), has remained unchanged. Sensors are calibratedbefore deployment and again after recovery. Adjustment or repair of thetemperature circuitry is rarely necessary, thus in most cases a post-recoverycalibration for one deployment serves as the pre-deployment calibration forthe next. Calibrations are performed in a computer controlled water bath,with a model SBE 03 temperature sensor from Sea-Bird Electronics, Inc.(calibrated on a yearly basis by the manufacturer) used as a standard. TheRotronic sensors are placed in protective rubber gloves before immersion inthe bath. The output of the Rotronic sensors and the calibration standardare measured at set points ranging from 14◦C to 32◦C at 3◦C intervals. Anequilibration period of 1.5 hours is used for all set points, which has beenconfirmed to be adequate for sensor and bath equilibrium. After the equili-bration period, the sensors and standard are sampled for ten minutes, withone reading per minute, and a mean value for each computed. Calibrationcoefficients are produced from a linear least-square fit between the Sea-Birdstandard temperature and Rotronic voltages
AT(◦C) = Aat + BatVat,
where Aat and Bat are unique bias and gain calibration coefficients, respec-tively, for each sensor.
5. I/O Board Calibration Procedures
In the NextGeneration ATLAS system electronics, AT and RH sensor out-puts first pass through individual signal-conditioning hardware interface cir-

ATLAS Calibration Procedures and Instrumental Accuracy Estimates 7
cuitry. Digitization of humidity and air temperature sensor outputs is thenperformed by a common 12-bit A/D converter. The Input/Output (I/O)board calibration procedure is nearly unchanged from that described byFreitag et al. (1994). Each board is calibrated twice, once over the range ofvoltage output by the humidity sensor, then again over the range of volt-age for temperature. For humidity the voltage range is 0.4 V to 0.99 V, atroughly 0.1 V increments. For temperature the voltage range is 0.1 V to0.4 V, at 0.05 V increments. Previously, the calibration range for air tem-perature I/O boards was 0.0 V to 0.4 V and for relative humidity boards itwas 0.0 V to 0.9 V. It was noted in the 1994 report that maximum residualsoccurred predominantly at the 0.0 V set point, presumably due to error inthe voltage source at this level, and/or a zero bias in the I/O circuitry. Be-cause tropical air temperatures and relative humidity never reach these levels(0◦C, 0 %RH) the 0.0 V calibration point was dropped from the calibrationprocedure.
I/O board calibration coefficients are produced from a linear least squarefit between voltages and output counts
Vrh = Crh + DrhNrh
Vat = Cat + DatNat
where N is the I/O board output in counts and C and D are the calibrationcoefficients.
6. Relative Humidity Equilibration
Freitag et al. (1994) noted that an equilibrium period of 1-hour during hu-midity calibrations (as suggested by the manufacturer) did not appear to besufficient to insure stability of the sensor output. It was proposed that alack of stability could be responsible for a portion of the measured residualerror and/or sensor drift. The automated humidity calibration proceduredescribed above presented an opportunity to determine appropriate equili-bration periods.
To quantify equilibrium times, 183 sensor calibrations (both pre-deploy-ment and post-recovery) performed in 2001 were analyzed. For each of fivecalibration set points, sensor output voltage (Vdata) measured at 1-minuteintervals throughout the equilibration period (Teq) was fit to the exponentialequation
Vt = Veq + ∆V e−kt
Where Vt is the predicted voltage at time t, Veq the predicted voltage atequilibrium, ∆V the difference between Veq and Vt=0, and k−1 the sensortime constant. An example of the exponential fit for a calibration set pointis shown in the upper part of Fig. 1. In this and most other cases, theexponential fit was reasonably representative of the data. For the 915 cali-bration set points, 97% of the maximum residuals from the fits (Vdata − Vt)fell within ±0.005 V, or 0.5 %RH, the accuracy of the humidity chamber

8 B.J. Lake et al.
0.53
0.54
0 25 50 75 1000.41
0.42
0.43
0.44
0.45
0.46
0.47
0.48
0.49
0.5
0.51
0.52
Time (minutes)
Vol
ts
Vcal = 0.5324
Veq = 0.5332
Vcal = 0.4806
Veq = 0.4839 Post-recovery
Pre-deployment
Figure 1: Sample RH sensor output (dots) during pre-deployment (upper) andpost-recovery (lower) calibration at the 55 %RH calibration set point. Solid linesare exponential fits to the data. Units are volts. Vcal is the mean of the last 10points in the time series. Veq is the equilibrium value predicted by the exponentialfit.
(Fig. 2a). With the exception of a limited number of outliers, computedtime constants ranged from 5 to 180 minutes, with typical (median) val-ues of about 30 minutes for the three lowest set points, 60 minutes for the85 %RH set point, and 90 minutes for the 95 %RH set point. A scaledequilibrium time, Teq/(k−1), was calculated for each fit, which provided acomparison of the chosen equilibrium period to the actual sensor equilibriumcharacteristics. The median scaled equilibrium time was greater than 3 forthe 55 %RH, 65 %RH, and 85 %RH set points, 2.7 for the 75 %RH set point,and 2.5 for the 95 %RH set point. Thus, 2.5 or more sensor time constantswere encompassed by the chosen equilibration times for typical calibrations.

ATLAS Calibration Procedures and Instrumental Accuracy Estimates 9
–2 –1 0 1 2 3 4 50
5
10
15
20
25
30
35
Veq – Vcal (V * 100)
Per
cent
age
of T
otal
–1 –0.5 0 0.5 1 1.5 2 2.5 30
5
10
15
20
25
Rate of Change (%RH/hr)
Per
cent
age
of T
otal
–2 –1.5 –1 –0.5 0 0.5 10
5
10
15
20
25
Per
cent
age
of T
otal
Vt – Vdata (V * 100)
(a)
(b)
(c)
Figure 2: Ensemble distributions from 183 calibrations (915 set points). (a) Maximum difference betweenmeasured calibration data and exponential fit (as in Fig. 1). Units are nominally %RH (Volts*100). (b)Difference between the sensor output at equilibrium as predicted by the exponential fit, Veq, and the mean ofthe last 10 points in the time series, Vcal. Units are nominally %RH (Volts*100). (c) Rate of change of sensoroutput computed from a linear least-squares fit to last 10 points of the time series. Units are nominally %RH(Volts*100) per hour.

10 B.J. Lake et al.
In 87% of cases, the 10-minute mean sensor outputs used for computingthe calibration coefficients, Vcal, fell within 0.5 %RH (the specified accuracyof the humidity chamber) of the equilibrium value, Veq, predicted by theexponential fit (Fig. 2b). As another measure of the degree to which thesensors equilibrate during calibration, the rate of change over the 10-minuteaveraging period (estimated by the trend of a linear least-squares fit) wasless than 0.5 %RH hr−1 in 71% of cases (Fig. 2c). Thus, changes in sensoroutput would generally be small compared to the accuracy of the humiditygenerator, even if equilibrium times were lengthened by as much as an hour.
The analysis above was for the combined set of 535 pre-deployment and380 post-recovery calibration set points. When the analysis was separatedby calibration type, there was strong indication that some post-deploymentsensors took longer to equilibrate. The data shown in the upper part ofFig. 1 was from a pre-deployment calibration. When the same sensor wascalibrated after recovery, the rate of change of the sensor output after theequilibration period was an order of magnitude larger than that for thepre-deployment calibration (Fig. 1, lower part). In addition, the sensor out-put during post-recovery calibration did not fit the exponential equation aswell. Most significantly, the mean of the final 10 samples (Vcal) was 0.05 V(5 %RH) lower for the post-deployment calibration. Presumably some sensordrift occurred between calibrations, but the estimated drift would have beensmaller had the sensor equilibrated during the post-deployment calibration.Comparisons of ensemble statistics for pre-deployment vs. post-recovery cal-ibrations indicate that a significant portion of post-recovery sensors exhib-ited slower time response. The percentage of cases in which Veq − Vcal waswithin ±0.5 %RH was 95% for pre-deployment calibrations, but 76% forpost-recovery calibrations; and the rate of change over the 10-min averagingperiod was less than 0.5 %RH hr−1 in 91% of pre-deployment calibrations,but this statistic was only 43% for post-recovery calibrations.
7. Humidity Calibration Repeatability
To quantify the repeatability of PMEL RH calibrations, five sensors werecalibrated nine times over the course of a month and the resultant calibra-tion coefficients compared. Prior to the study, the multimeter had beencalibrated according to manufacturer specifications and all sensors had beenpre-calibrated and adjusted. The sensors’ locations within the chamber re-mained unchanged, and normal calibration procedures were used consistentlythroughout the study. Calibration residuals (%RHchamber − %RHcalculated)were typically in the range ±0.3 %RH (Fig. 3). Residuals tended to benegative at the 55 %RH, 65 %RH and 95 %RH set points, and positive atthe 75 %RH and 85 %RH set points, indicating a small (0.1 to 0.2 %RH)non-linearity in the sensor output.
Resultant calibration coefficients were applied at nominal set point volt-ages (i.e., .55 V, .65 V, .75 V, .85 V, .95 V) to calculate sensor %RH val-ues for each calibration (Fig. 4). Computed in such a manner, differencesin %RH values reflect the combined stability of sensor output and calibra-

ATLAS Calibration Procedures and Instrumental Accuracy Estimates 11
50 60 70 80 90 100–0.3
–0.2
–0.1
0
0.1
0.2
0.3
0.4
Humidity Chamber (%RH)
Res
idua
ls (
%R
H)
Figure 3: Residual error (in %RH) for five sensors calibrated nine times. Each color represents one of thenine calibrations. The mean (diamond) and standard deviation (vertical lines) of the residuals computedover the five sensors is shown vs. the humidity chamber setting.

12 B.J. Lake et al.
1 2 3 4 5 6 7 8 951
53
55
57
%R
H
1 2 3 4 5 6 7 8 961
63
65
67
%R
H
1 2 3 4 5 6 7 8 971
73
75
77
%R
H
1 2 3 4 5 6 7 8 981
83
85
87
%R
H
1 2 3 4 5 6 7 8 992
94
96
98
%R
H
Calibration Number
Figure 4: Sensor output (in %RH) computed using individual calibration coefficients from each of ninecalibrations. Each color represents one of five sensors. Computations were made at each of the five calibrationset points from 55 %RH to 95 %RH.

ATLAS Calibration Procedures and Instrumental Accuracy Estimates 13
tion uncertainty, while accounting for small (∼0.03 %RH) humidity chambervariability during the nine calibrations. The maximum deviation in relativehumidity was about ±1 %RH for a given sensor and calibration set point.
The standard deviation of calibrated sensor output computed over thenine calibrations for a given sensor ranged from 0.25 %RH to 0.75 %RH(Fig. 5). Variations in the deviations reflected both differences between sen-sors (deviations for two sensors were larger than for the other three sensors)and general stability characteristics of the sensors and/or calibration system(deviations were generally lower at the 65 %RH and 75 %RH set points rela-tive to the other set points). The RMS of standard deviations computed overall set points and sensors was 0.42 %RH. These deviations were a measureof both the repeatability of the sensors, and of the calibration system itself,including the humidity chamber and associated instrumentation. As such,the RMS value of 0.42 %RH compares favorably with the manufacturer’sspecified sensor repeatability of 0.3 %RH.
8. Individual Sensor and I/O Board Calibrations
A large number of calibrations (1111 RH sensors, 848 AT sensors, and394 I/O boards) were analyzed to determine the instrumental accuracy ofNextGeneration air temperature and relative humidity measurements. Pre-vious ATLAS analysis (Freitag et al., 1994) considered a much smaller en-semble (200 or fewer sensor and I/O board calibrations). As in the previousstudy, the root-mean-square (RMS) of the maximum residuals (the largestdifference between the calibration standard and the sensor or I/O board out-put, as calculated using the calibration coefficients) was used as an estimateof sensor or board accuracy at the time of calibration.
8.1 Relative Humidity Sensor
A total of 1111 RH sensors were calibrated during the study period (1996–2002). The RMS maximum residual (expressed in humidity units) of0.56 %RH (Table 2) is roughly half the manufacturer’s specified accuracyof 1 %RH (Table 1). Freitag et al. (1994) reported a RMS maximum resid-ual of 2.6 %RH for ATLAS RH sensors. Thus the new, automated RH sensorcalibration procedure (along with the RH sensor’s improved electronics) hasled to improved calibration results. Sensor gain (coefficient B in Table 2)remained about the same as in the previous study at 6% above the nominalvalue of 100. The difference in nominal vs. measured gain is compensatedby the measured offset (A = −3.8) and is due in part to the fact that PMELcalibrations are limited to the range 55 %RH to 95 %RH.
The RH sensor and filter can become fouled during deployment, whichcan affect sensor performance. Therefore, the RH sensors are calibrated inboth pre-deployment (pre-cal) and post-recovery (post-cal) conditions. TheRMS maximum residual for 693 pre-deployment calibrations was 0.37 %RH(Table 2). For 418 post-recovery calibrations, the value was roughly double(0.78 %RH), but remained less than the manufacturer’s specified accuracy.Pre-deployment calibration sensor gain was 4% higher than the nominal

14 B.J. Lake et al.
1 2 3 4 50.25
0.3
0.35
0.4
0.45
0.5
0.55
0.6
0.65
0.7
0.75
Sensor Number
Sta
ndar
d D
evia
tion
(%R
H)
Figure 5: Standard deviation (in %RH) of calibrated sensor output computed over nine calibrations foreach of five sensors. Colors represent chamber set points from 55 %RH to 95 %RH.

ATLAS Calibration Procedures and Instrumental Accuracy Estimates 15
Table 2: Statistics for NextGeneration ATLAS air temperature (AT) and relativehumidity (RH) sensor calibrations. M is the number of sensors calibrated.
RMS Max Coef. A Coef. B
Sensor M Residual Mean Std. Dev. Mean Std. Dev.
AT (all) 848 0.022◦C 0.024 0.482 100.12 1.34RH (all) 1111 0.56 %RH −3.803 9.70 105.65 7.24
RH (pre-cal) 693 0.37 %RH −2.110 3.02 103.51 4.28RH (post-cal) 418 0.78 %RH −6.608 14.94 109.20 9.42
Table 3: Statistics for NextGeneration ATLAS I/O board calibrations. M is thenumber of sensors calibrated. Residuals have been scaled to the same units assensors, by application of the nominal sensor gain of 100. The resolution listed forRH is for internally recorded data. Data telemetered in real time and calibrationdata have a resolution of 0.39 %RH.
1-bit RMS Max Coef. C Coef. D
Board Resolution M Residual Mean Std. Dev. Mean Std. Dev.
AT 0.01◦C 394 0.082◦C 0.006 0.057 0.0230 0.012RH 0.024%RH 394 0.18%RH 0.00206 0.00198 1.003 0.006
value of 100 whereas the post-cal gain was 9% higher than the nominalvalue. Differences between pre- and post-cal statistics are presumably dueto fouling of the filter, sensor drift, and electronic drift during deployment.Sensor and electronic drift are examined in more detail below.
8.2 Relative Humidity I/O Board
As noted above, RH calibration data are reduced to 8-bit resolution, toproduce coefficients for use with real-time telemetered data which also have8-bit resolution. This procedure decreases the precision of RH I/O boardcalibrations and induces a small (∼0.2 %RH) positive bias, but does not havea significant effect on overall accuracy as the truncation bias and measureddrift of the I/O boards are an order of magnitude smaller than the RH sensorcalibration drift (see below). Field data stored in internal memory have thefull 12-bit resolution.
The RMS maximum residual for 394 RH I/O board calibrations was0.18 %RH, about half the resolution of RH calibration data (0.39 %RH,Table 3). This value is also about half that for pre-cal RH sensors (Table 2).It is somewhat less than the value reported previously (Freitag et al., 1994)of 0.26 %RH for ATLAS RH I/O boards. The improvement may be due tothe reduction in calibration range (now 40 %RH to 99 %RH compared to0 %RH to 95 %RH previously). RH board gain values were consistent withthe previous study.

16 B.J. Lake et al.
8.3 Air Temperature Sensor
Statistics from the calibration of 848 air temperature sensors (Table 2) weresimilar to those reported in Freitag et al. (1994). The RMS of the maximumresidual was 0.022◦C, an order of magnitude smaller than the manufacturer’sstated accuracy of 0.2◦C. Sensor gain, 100.12, and offset, 0.024, were nearlyidentical to the manufacturer’s nominal values of 100 and 0, respectively.
8.4 Air Temperature I/O Board
The RMS maximum residual for 394 air temperature I/O boards was 0.082◦C(Table 3), about half that reported previously (Freitag et al., 1994). Theimprovement is presumably due to the reduction in calibration range (now10◦C to 40◦C compared to 0◦C to 40◦C previously).
9. Sensor and I/O Board Drift
Instrumentation recovered in working condition is returned to PMEL forpost-recovery calibration before being reused on future deployments. Afterpost-recovery calibrations are completed, the resultant coefficients are com-pared to the pre-deployment coefficients. First, a set of output values iscomputed by application of the calibration equation using pre-deploymentcoefficients to a set of nominal input values. Input values are chosen sothat the output values span the standard calibration range. A second set ofoutput values is generated by application of the calibration equation usingpost-recovery coefficients to the same set of input values. Sensor drift iscalculated by subtracting the first set of output values from the second setof output values. This method of calculating sensor drift is identical to thatemployed by Freitag et al. (1994). Mean and RMS differences for sensorcalibration pairs are given in Table 4. Mean and RMS differences for I/Oboard pairs are given in Table 5.
ATLAS moorings are nominally deployed for 1 year, but due to the re-placement of failed, damaged, or questionable sensors the actual mean de-ployment length was about 9 months. The mean time between calibrationswas about 16 months. RMS drift normalized to 1 year (by the ratio of365 over the mean number of days between calibrations), appear in paren-theses in Tables 4 and 5. Normalization in this manner assumes that thedrift occurred linearly throughout the time between calibrations and de-creases unnormalized drift estimates. Normalization by the mean time be-tween mooring deployment and recovery (assuming that sensor drift occursprimarily while in the field) would increase drift estimates. Freitag et al.(1994) suggested a correlation between the magnitude of calibration driftand the length of the deployment at sea. The data used in this study in-dicate very little correlation between the size of calibration drift and eitherthe time between calibrations or the time deployed at sea (Fig. 6). Otherfactors, such as environmental conditions while deployed, or handling andconditions before or after deployment, may be important in some cases. Be-cause the factors affecting drift rates are not well known, we have opted to

ATLAS Calibration Procedures and Instrumental Accuracy Estimates 17
Table 4: Differences between pre- and post-deployment sensor calibrations. RMS differences in parenthesesare normalized to 1 year based on days between calibrations assuming linear drift with time.
Number of Mean MeanCalibration Days Between Deployment Mean RMS
Sensor Pairs Calib. Days Range Difference Difference
AT 225 506 272 14–32◦C 0.025◦C 0.157◦C(0.113)RH 201 476 262 55–95 %RH 1.04 %RH 2.72 %RH(2.09)
Table 5: Differences between pre- and post-deployment I/O board calibrations. RMS differences in paren-theses are normalized to 1 year based on days between calibrations assuming linear drift with time.
Number of Mean MeanCalibration Days Between Deployment Mean RMS
Board Pairs Calib. Days Range Difference Difference
AT 211 461 274 5–35◦C −0.057◦C 0.146◦C(0.115)RH 223 462 272 40–100 %RH −0.02 %RH 0.21 %RH(0.16)
use non-normalized drift values as our primary estimate of sensor and I/Oboard accuracy.
9.1 Relative Humidity Sensor
In computing the sensor drift estimate, 21 calibration pairs (9 percent of thetotal) with RMS drifts ranging from 6 %RH to 13 %RH were rejected asoutliers. Two criteria were considered in rejecting these data. In some casesthe sensor did not reach equilibrium during the post-deployment calibration,but would have reached values closer to those of the pre-deployment cali-bration if the equilibration time were increased substantially (Fig. 1, lowerpart). The longer response time of these sensors was probably due to foulingof the sensor or filter cap while at sea. If these sensors exhibited similar per-formance while at sea, then their data would not necessarily be biased, butwould lag fluctuations by periods of up to several hours. A second criteriaused to reject some large drift estimates was to apply post-recovery cali-brations to the data at the time of recovery and compare these to the datafrom the next sensor deployed at that site. In many cases the applicationof the post-deployment calibrations resulted in large discontinuities betweendeployments, or values that were unreasonably high or low. Under thesecircumstances it was concluded that the post-recovery calibrations did notaccurately reflect the condition of the sensors while deployed. The majorityof cases with RMS drift between 6 %RH to 13 %RH were rejected becausethey met one or both of these criteria. A few cases with large drift did notclearly meet these criteria and remain in the ensemble over which the driftestimate was computed.
RMS difference between 201 RH sensor calibration pairs (Table 4) was2.72 %RH, about seven times greater than the RMS of sensor pre-cal residu-als. Thus, significant sensor drift had occurred between calibrations. Mean

18 B.J. Lake et al.
Figure 6: Mean (left panel) and RMS (right panel) differences between pre-deployment and post-recoverycalibration of humidity sensors plotted versus the number of days each sensor was deployed at sea. Thedashed lines represent a linear, least-squares fit to the data. R is the correlation coefficient.
differences were about 1/3 of RMS differences and positive, indicating thaton average the sensors were reading about 1.0 %RH low when recovered.Based on a much smaller number of calibrations, Freitag et al. (1994) es-timated relative humidity sensor RMS drift to be 4 %RH. Modificationsto the sensors combined with improved sensor calibration techniques havedecreased the error estimate by more than 1 %RH.
9.2 Relative Humidity I/O Board
The mean difference between 223 RH I/O calibration pairs was −0.02 %RHand the RMS difference was 0.21 %RH (Table 5). The mean difference beingnear zero indicated that there was no preferred direction of drift. The RMSwas about one half the resolution of the calibration data. This indicates thatthere was little or no measurable drift in RH boards between calibrations.
9.3 Air Temperature Sensor
RMS difference between 225 AT sensor calibration pairs was 0.157◦C (Ta-ble 4), nearly an order of magnitude larger than the RMS maximum residualfor AT sensors (Table 2), indicating that measurable drift had taken place.The observed RMS difference is comparable to the manufacturer’s nominaldrift rate of 0.2◦C (Table 1). Mean AT difference was 0.025◦C, indicatinglittle or no preferred direction to the drift.
9.4 Air Temperature I/O Board
In computing drift statistics, a small number of calibration pairs (10 or about5% of the total) were omitted as outliers. The pre-deployment calibrations

ATLAS Calibration Procedures and Instrumental Accuracy Estimates 19
Table 6: Combined (sensor and I/O board) in-strument error for NextGeneration ATLAS airtemperature and relative humidity measurementsbased on unnormalized data in tables 4 and 5.
Sensor Instrument Error
AT 0.22◦CRH 2.73 %RH
for all these cases were performed between January 1998 and January 1999,and had drifts between 0.5◦C and 1.1◦C, larger than any observed before orafter. The majority of boards with pre-deployment calibrations during 1998had drifts comparable to the overall ensemble. Beginning in 1998 and con-tinuing throughout 1999, NextGeneration ATLAS electronics were upgradedby replacement of boards which included the sensor IO A/D components.It was intended that post-deployment calibrations would be performed be-fore board replacement, but in several of the outlier cases it was found thatthe calibration pairs were not performed on identical electronics. In othercases the date of electronic upgrades was not documented. It was concludedthat the large drifts in these cases were not representative of the true elec-tronic performance and were not included in the computation of ensemblestatistics.
RMS difference between 211 AT I/O board calibration pairs was 0.146◦C(Table 5), less than twice the RMS maximum residual for individual AT I/Oboards (Table 3), indicating that the drift in AT boards between calibrationswas measureable and comparable to the sensor drift. The mean drift was–0.057◦C, indicating little or no preferred direction to the drift.
10. Combined Instrument Error
The combined effect of I/O board and sensor drifts (i.e., instrument error)was computed as (RMS2
board drift + RMS2sensor drift)
1/2, which assumes thatsensor and I/O board drifts were independent of one another. Using unnor-malized data, instrumental error estimates for the RH sensor improved from4.07 %RH in 1994 to 2.73 %RH in the present investigation (Table 6). Weconclude that the lower instrument error estimate is due to the improvedRH calibration procedure at PMEL and modifications to the sensor by themanufacturer.
AT instrument error estimates remained virtually unchanged from theprevious study—0.20◦C in 1994 compared to 0.22◦C for the present study.
11. Summary
TAO air temperature and relative humidity sensor calibrations have beenanalyzed to estimate both their instrumental accuracy when first deployed

20 B.J. Lake et al.
and the calibration drift over time. Both air temperature and relative humid-ity are measured by the same sensor package, presently the model MP101Afrom Rotronic Instrument Corp. This study updates Freitag et al. (1994),which was repeated because the previous work was based on a fairly limitednumber of calibrations. In addition, since the publication of Freitag et al.,the sensors were upgraded by the manufacturer, the electronics were modi-fied by PMEL, the calibration method for relative humidity was automated,and a new calibration standard was used.
The manufacturer’s modifications to the air temperature sensor includedimproved nominal accuracy (from 0.5◦C to 0.2◦C) and lower power consump-tion. The PMEL circuitry was modified to increase resolution from 0.04◦C to0.01◦C. The present PMEL estimate of combined (sensor and circuitry) in-strumental error for TAO air temperature measurement is 0.22◦C, virtuallyunchanged from the previous value. The fact that the previous PMEL esti-mate (0.20◦C) was better than the manufacturer’s nominal sensor accuracyat that time was because the manufacturer’s estimate was based on nominalcalibration coefficients and applicable to a wider temperature range, whereasPMEL sensors are individually calibrated over a reduced temperature range.
The changes to the relative humidity portion of the sensor included im-proved linearity and temperature compensation which lead to an improvednominal accuracy of 1% (when individually calibrated with a high accuracystandard). The PMEL circuitry was modified to increase resolution from0.39 %RH to 0.02 %RH (for internally recorded data). A major modifica-tion to the PMEL calibration method was the replacement of saturated saltsolutions for the calibration standard by a humidity chamber, plus automa-tion of the procedure which standardized and increased sensor equilibrationtimes. The combined (sensor and circuitry) error estimate for TAO rela-tive humidity measurements is 2.73 %RH, which is an improvement of over1 %RH from the 1994 estimate.
This PMEL error estimate is larger than the manufacturer’s nominalvalue because the latter does not reflect environmental issues such as con-tamination of the sensor or its filter by salt. Analysis of calibration datahas confirmed that after deployment at sea the time constant of these sen-sors can increase significantly, which results in overestimation of calibrationdrift estimates. Moreover, in some cases the post-recovery calibrations werefound to not accurately reflect the sensor condition when recovered. Thiscould be due to changes between recovery and calibration, e.g., drying andprecipitation of salts on the sensor or filter.
A small (about 0.2 %RH) error due to the PMEL circuitry calibrationfirmware was discovered during the course of this study. This error will beeliminated in future versions of the firmware.
Acknowledgments. We thank Nuria Ruiz for her support in the design anddevelopment of the TAO calibration data base, which was essential for the analysis ofthese data. This work was supported by NOAA’s Office of Oceanic and AtmosphericResearch, and by the Joint Institute for the Study of the Atmosphere and Ocean(JISAO) under NOAA Cooperative Agreement No. NA178RG1232.

ATLAS Calibration Procedures and Instrumental Accuracy Estimates 21
12. References
Freitag, H.P., Y. Feng, L.J. Mangum, M.P. McPhaden, J. Neander, and L.D. Strat-ton (1994): Calibration procedures and instrumental accuracy estimates ofTAO temperature, relative humidity and radiation measurements. NOAA Tech.Memo. ERL PMEL-104, Pacific Marine Environmental Laboratory, Seattle,Washington, 32 pp.
Freitag, H.P., M. O’Haleck, G.C. Thomas, and M.J. McPhaden (2001): Calibrationprocedures and instrumental accuracies for ATLAS wind measurements. NOAATech. Memo. OAR PMEL-119, Pacific Marine Environmental Laboratory, Seat-tle, Washington, 20 pp.
Hayes, S.P., L.J. Mangum, J. Picaut, A. Sumi, and K. Takeuchi (1991): TOGA-TAO: A moored array for real-time measurements in the tropical Pacific Ocean.Bull. Am. Meteorol. Soc., 72, 339–347.
McPhaden, M.J., A.J. Busalacchi, R. Cheney, J.R. Donguy, K.S. Gage, D. Halpern,M. Ji, P. Julian, G. Meyers, G.T. Mitchum, P.P. Niiler, J. Picaut, R.W.Reynolds, N. Smith, and K. Takeuchi (1998): The Tropical Ocean-Global At-mosphere (TOGA) observing system: A decade of progress. J. Geophys. Res.,103, 14,169–14,240.
Servain, J., A.J. Busalacchi, M.J. McPhaden, A.D. Moura, G. Reverdin, M. Vianna,and S.E. Zebiak (1998): A Pilot Research Moored Array in the Tropical Atlantic(PIRATA). Bull. Am. Meteorol. Soc., 79, 2019–2031.

22 B.J. Lake et al.
Appendix: Specifications and Calibration of theHumidity Generator
The Thunder Scientific Humidity Generator uses a “two-pressure” methodto humidify its chamber. It first saturates an air stream with water va-por at a set pressure and temperature, and then isothermally expands thestream into the chamber. The resulting chamber humidity is equivalent tothe ratio of final to initial pressures. Corrections are applied both for mi-nor temperature differences between the air stream and chamber, and foran “enhancement factor ratio” that takes into account the dependence ofthe effective saturation vapor pressure upon the absolute pressure as well astemperature (Thunder Scientific Humidity Generator manual).
The humidity generator is calibrated annually, alternately by the man-ufacturer or by PMEL. Calibrations at PMEL follow a procedure recom-mended by the manufacturer. The humidity generator’s thermistors arecalibrated by immersion in a water bath at three temperature set pointsthat encompass the range of operating temperatures used at PMEL duringRH sensor calibrations. Typical set points of 11◦C, 26◦C, and 40◦C arecontrolled by a model 5010 Programmable Fluid Bath by Guildline Instru-ments, Ltd. A model SBE-03 temperature sensor from Sea-Bird Electronics,Inc. (calibrated annually by the manufacturer) is used as a temperaturestandard, and its frequency output is counted by an HP3457A Multimeter,manufactured by Hewlett-Packard Company. Depending on the range ofoperating pressure, calibration of the humidity generator’s pressure gaugesis performed by the application of either a high (0–150 psi) or low (0–50psi) static pressure source of nitrogen gas. Three set points per source arechosen which span the full range of operating pressures. Typical set pointsare 15 psi, 30 psi, and 50 psi for the low-pressure source, and 30 psi, 100 psi,and 150 psi for the high-pressure source. A 0 to 1000 psi, model 6010-1660CDirect Reading Pressure Gauge and 6005 Pressure Controller, from RuskaInstrument Corp., are used as the pressure standard and source controller.A Digiquartz Barometer, model MET1-2, from Paroscientific, Inc. measuresatmospheric pressure, for conversion of the Ruska standard’s psi readings topsia. The Ruska standard is calibrated bi-yearly by the manufacturer. Theaccuracies of the temperature standard, the pressure standard/controller,the temperature bath and other associated test equipment (tabulated be-low) are comparable to or exceed those required by Thunder Scientific forhumidity generator calibrations. For each transducer, the generator’s cir-cuitry produces three raw counts and solves three quadratic equations, in-ternally making any needed adjustments to the transducer and iterating theprocess until the desired tolerances are attained. Following this calibrationprocedure, the generator is specified to have an accuracy of ±0.5 %RH overthe operating range 10–95 %RH.

ATLAS Calibration Procedures and Instrumental Accuracy Estimates 23
Table A1: Test equipment accuracy standards.
Instrument: Specifications:
Thunder Scientific 2500 Two-Pressure RH Range = 10% to 95%Humidity Generator RH Resolution = 0.02%
RH Accuracy = ±0.5% at the chamber pressure and temperatureTemperature Range = 0 to +70◦CTemperature Resolution = ±0.02◦CTemperature Uniformity = ±0.1◦CTemperature Accuracy = ±0.06◦C
HP3457A Multimeter Voltage Accuracy = ±0.00254% of reading, from 0 to 1 VFrequency Accuracy = ±0.01% of reading, from 400 Hz to 1.5 MHzFrequency Resolution = 0.1 Hz, from 2000 HZ to 19000 Hz
Sea-Bird SBE-03 Thermometer Range = −5.0 to +35◦CAccuracy = ±0.001◦CStability = 0.002◦C per year, typical
SBE-03 Thermometer & HP3457A Temperature Accuracy* = ±0.005◦CMultimeter System Temperature Resolution* = 0.0005◦C
Guildline Model 5010 Programmable Range = −9.90 to +65.00◦CFluid Bath Resolution = 0.01◦C
Stability = ±0.002◦C
Ruska 6010-1660C Pressure Gauge and Range = 0 to 1000 psig6005 Pressure Controller Resolution = 0.01 psia
Accuracy* = ±0.027 psia from 0 to 136 psi (14 to 150 psia)Stability (control mode noise) = 0.01 psiaRepeatability ≤ ±0.02 psia
Paroscientific Digiquartz Barometer, Range = 11.5 to 16 psiaModel MET 1-2 Accuracy = ±0.01% of reading
Stability (drift) <0.00145 psia per yearRepeatability = ±0.003% of reading
*When combining specifications from two instruments, manufacturer specifications listed as % reading values wereconverted to physical units using the scales and readings appropriate for the calibrations. The Ruska Pressure Gaugespecifications were calculated using the typical 11 ppm error in the standard that was used to calibrate the gauge inyear 2001.